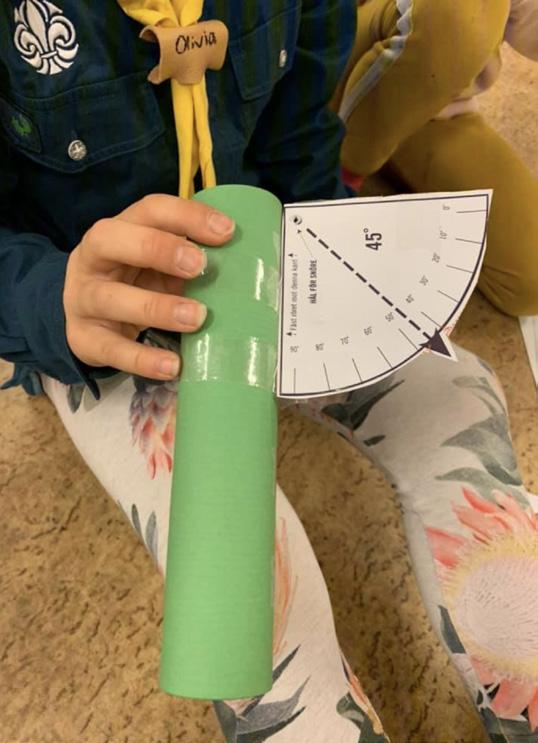
DISCUSSION & CONCLUSIONS HOW RELIABLE IS THE METHOD? The results from the Star-Spotting Experiment show that the method we used, whereby you use a cardboard tube to count the stars you can see with your naked eye, worked very well. When we compare our data on light pollution with data based on images taken from satellites, we see that they are pretty much similar to each other. In the Star-Spotting Experiment, our results show a limiting magnitude of 4.5 in Sweden. This largely matches the results of other studies. One difference from other methods is also that the Star-Spotting Experiment’s data is more localised. While with satellite images, for example, you can get a good appreciation of the light pollution over a large urban area11, with the Star-Spotting Experiment method we can see variations within urban areas and get a more detailed picture of how light pollution varies in a specific area (see images 26 and 27).
Image 27. Two different maps over Santa Cruz de Tenerife show what light pollution looks like measured using a satellite (on the left) compared with our method (on the right). Satellite observations are used to create an average value over a region, but our observations show the level of light pollution at a very local level. Illustrations: Left: lightpollutionmap.info, Right: Hanna Mellin/VA with GoogleMyMaps.
We have also compared the results with data from other smaller projects, where light pollution has been measured from the ground, e.g. Globe at Night12 and the International Dark Sky Association13. The results obtained in the Star-Spotting Experiment are comparable with results from these initiatives, even though the number of observations made in Sweden within these projects is relatively low.
www.lightpollutionmap.info www.globeatnight.org 13 www.darksky.org 11 12
25


