


meetings
Global
Industry day

BRETT OETTING

 President and CEO
Visit corpus Christi


meetings
Global
Industry day

Executive Vice President Tourism Economics


ERIK EVJEN


The Outlook for Travel as Challenges Mount
Erik Evjen Executive VP Tourism Economics eevjen@tourismeconomics.com
Forecast storyline
Travel showed signs of resilience and recovery in 2023
The industry enters 2024 facing two key challenges
1. Slowing economy
2. Weakening finances

Forecast storyline
Travel showed signs of resilience and recovery in 2023
The industry enters 2024 facing two key challenges
1. Slowing economy
2. Weakening finances

After months of slowdown, was February the turning point?
National Travel Indicators
February 2024


8
TX continue to outperform the national average
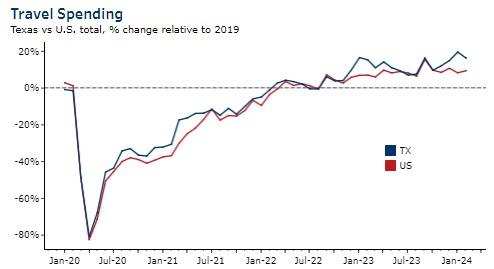
Source: Tourism Economics


9
16% 9%
US hotel demand nearly fully recovered in 2023


US Hotel Room Demand (Annual) % of 2019 level
64% 88% 97% 98% 2020 2021 2022 2023
Source: STR
US Air Travel
TSA PAX counts, % recovered vs same period in in 2019 (index, 2019=100)
Source: TSA


5 11220 40 60 80 100 120 Jan-20 Feb-20 Mar-20 Apr-20 May-20 Jun-20 Jul-20 Aug-20 Sep-20 Oct-20 Nov-20 Dec-20 Jan-21 Feb-21 Mar-21 Apr-21 May-21 Jun-21 Jul-21 Aug-21 Sep-21 Oct-21 Nov-21 Dec-21 Jan-22 Feb-22 Mar-22 Apr-22 May-22 Jun-22 Jul-22 Aug-22 Sep-22 Oct-22 Nov-22 Dec-22 Jan-23 Feb-23 Mar-23 Apr-23 May-23 Jun-23 Jul-23 Aug-23 Sep-23 Oct-23 Nov-23 Dec-23 Jan-24 Feb-24
US air travel has fully recovered
Forecast storyline
Travel showed signs of resilience and recovery in 2023
The industry enters 2024 facing two key challenges
1. Slowing economy
2. Weakening finances


A slowing economy


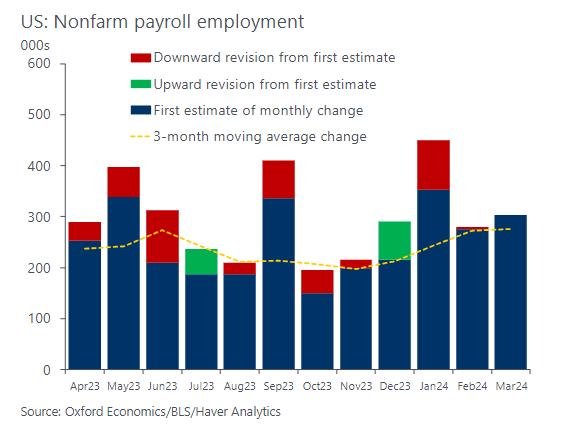
Labor market remains positive

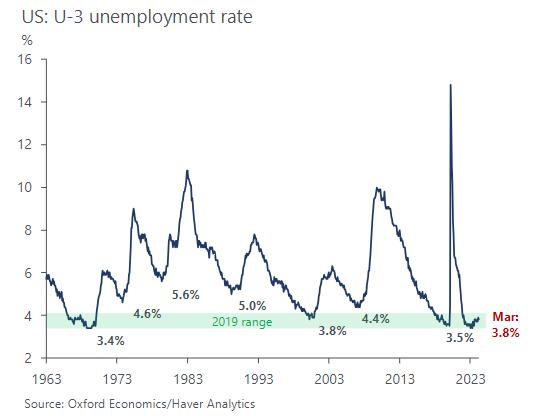
Unemployment: historically low but ticking up

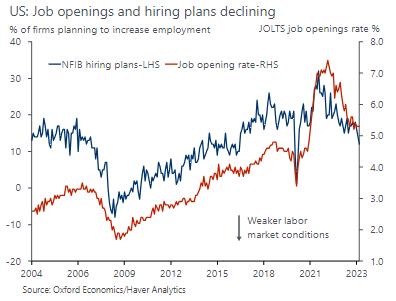
Forward signals: market is normalizing

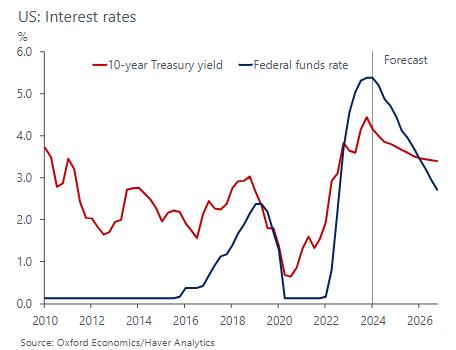
Higher interest rates continue to leave their mark

The benefit of excess savings will diminish in 2024
US : Estimated excess savings
Source : Oxford Economics /Haver Analytics $,bns
Upward revision to excess savings (LHS)
Excess savings (pre -revisions, LHS)
• Excess savings are more concentrated among the wealthiest households.

0 500 1000 1500 2000 2500 3000 Jun20 Dec 20 Jun21 Dec21 Jun22 Dec 22 Jun23
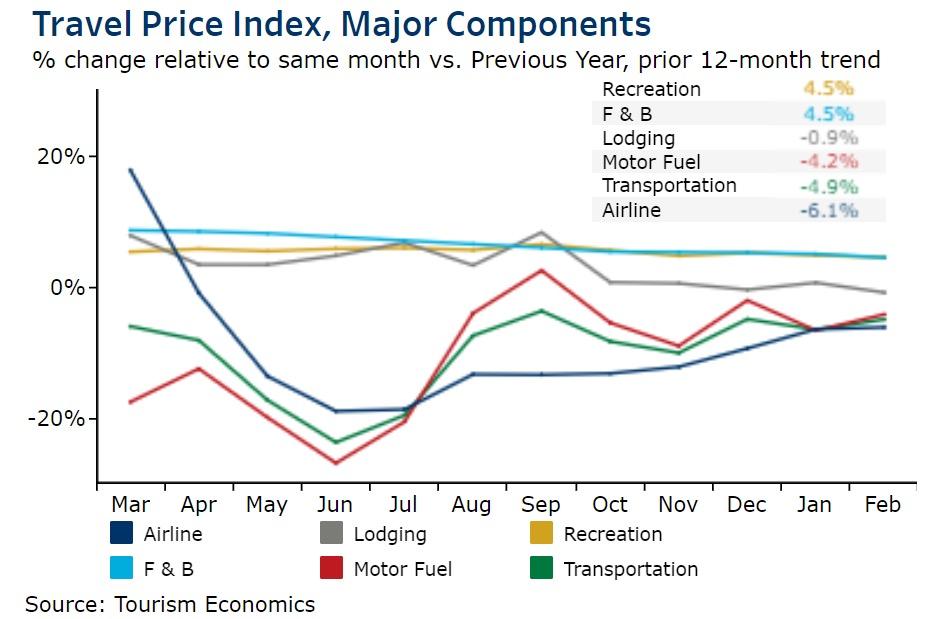
Travel costs are contracting

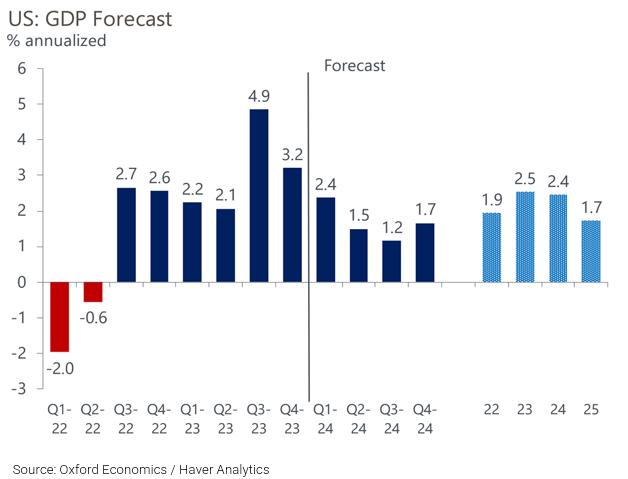
GDP set to slow as we move through 2024


Leisure Travel

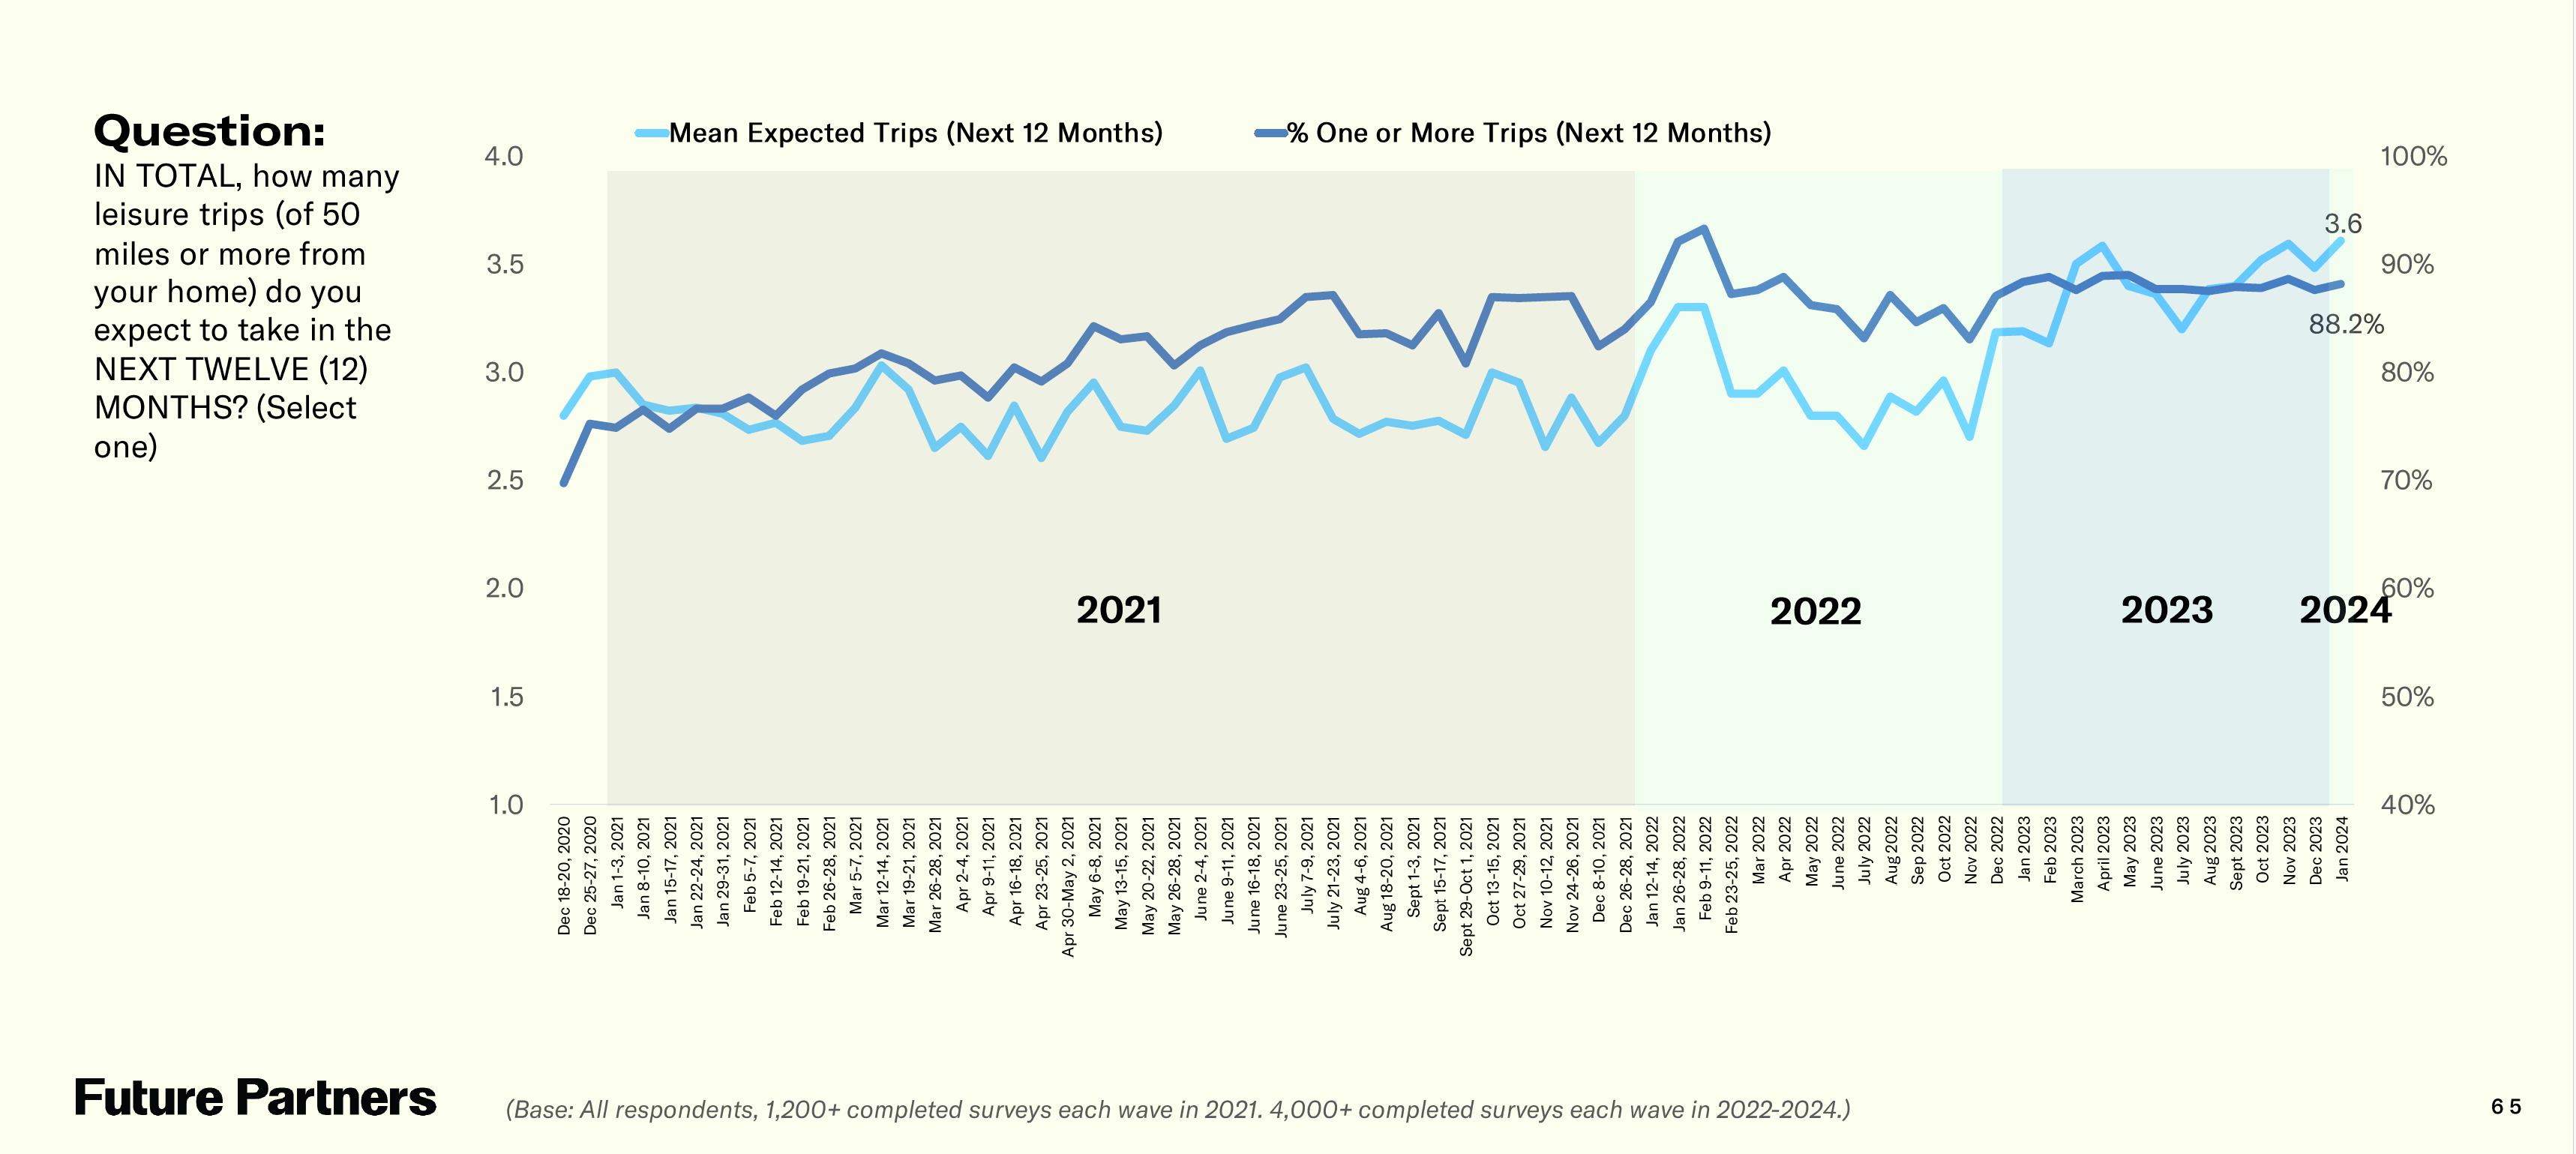
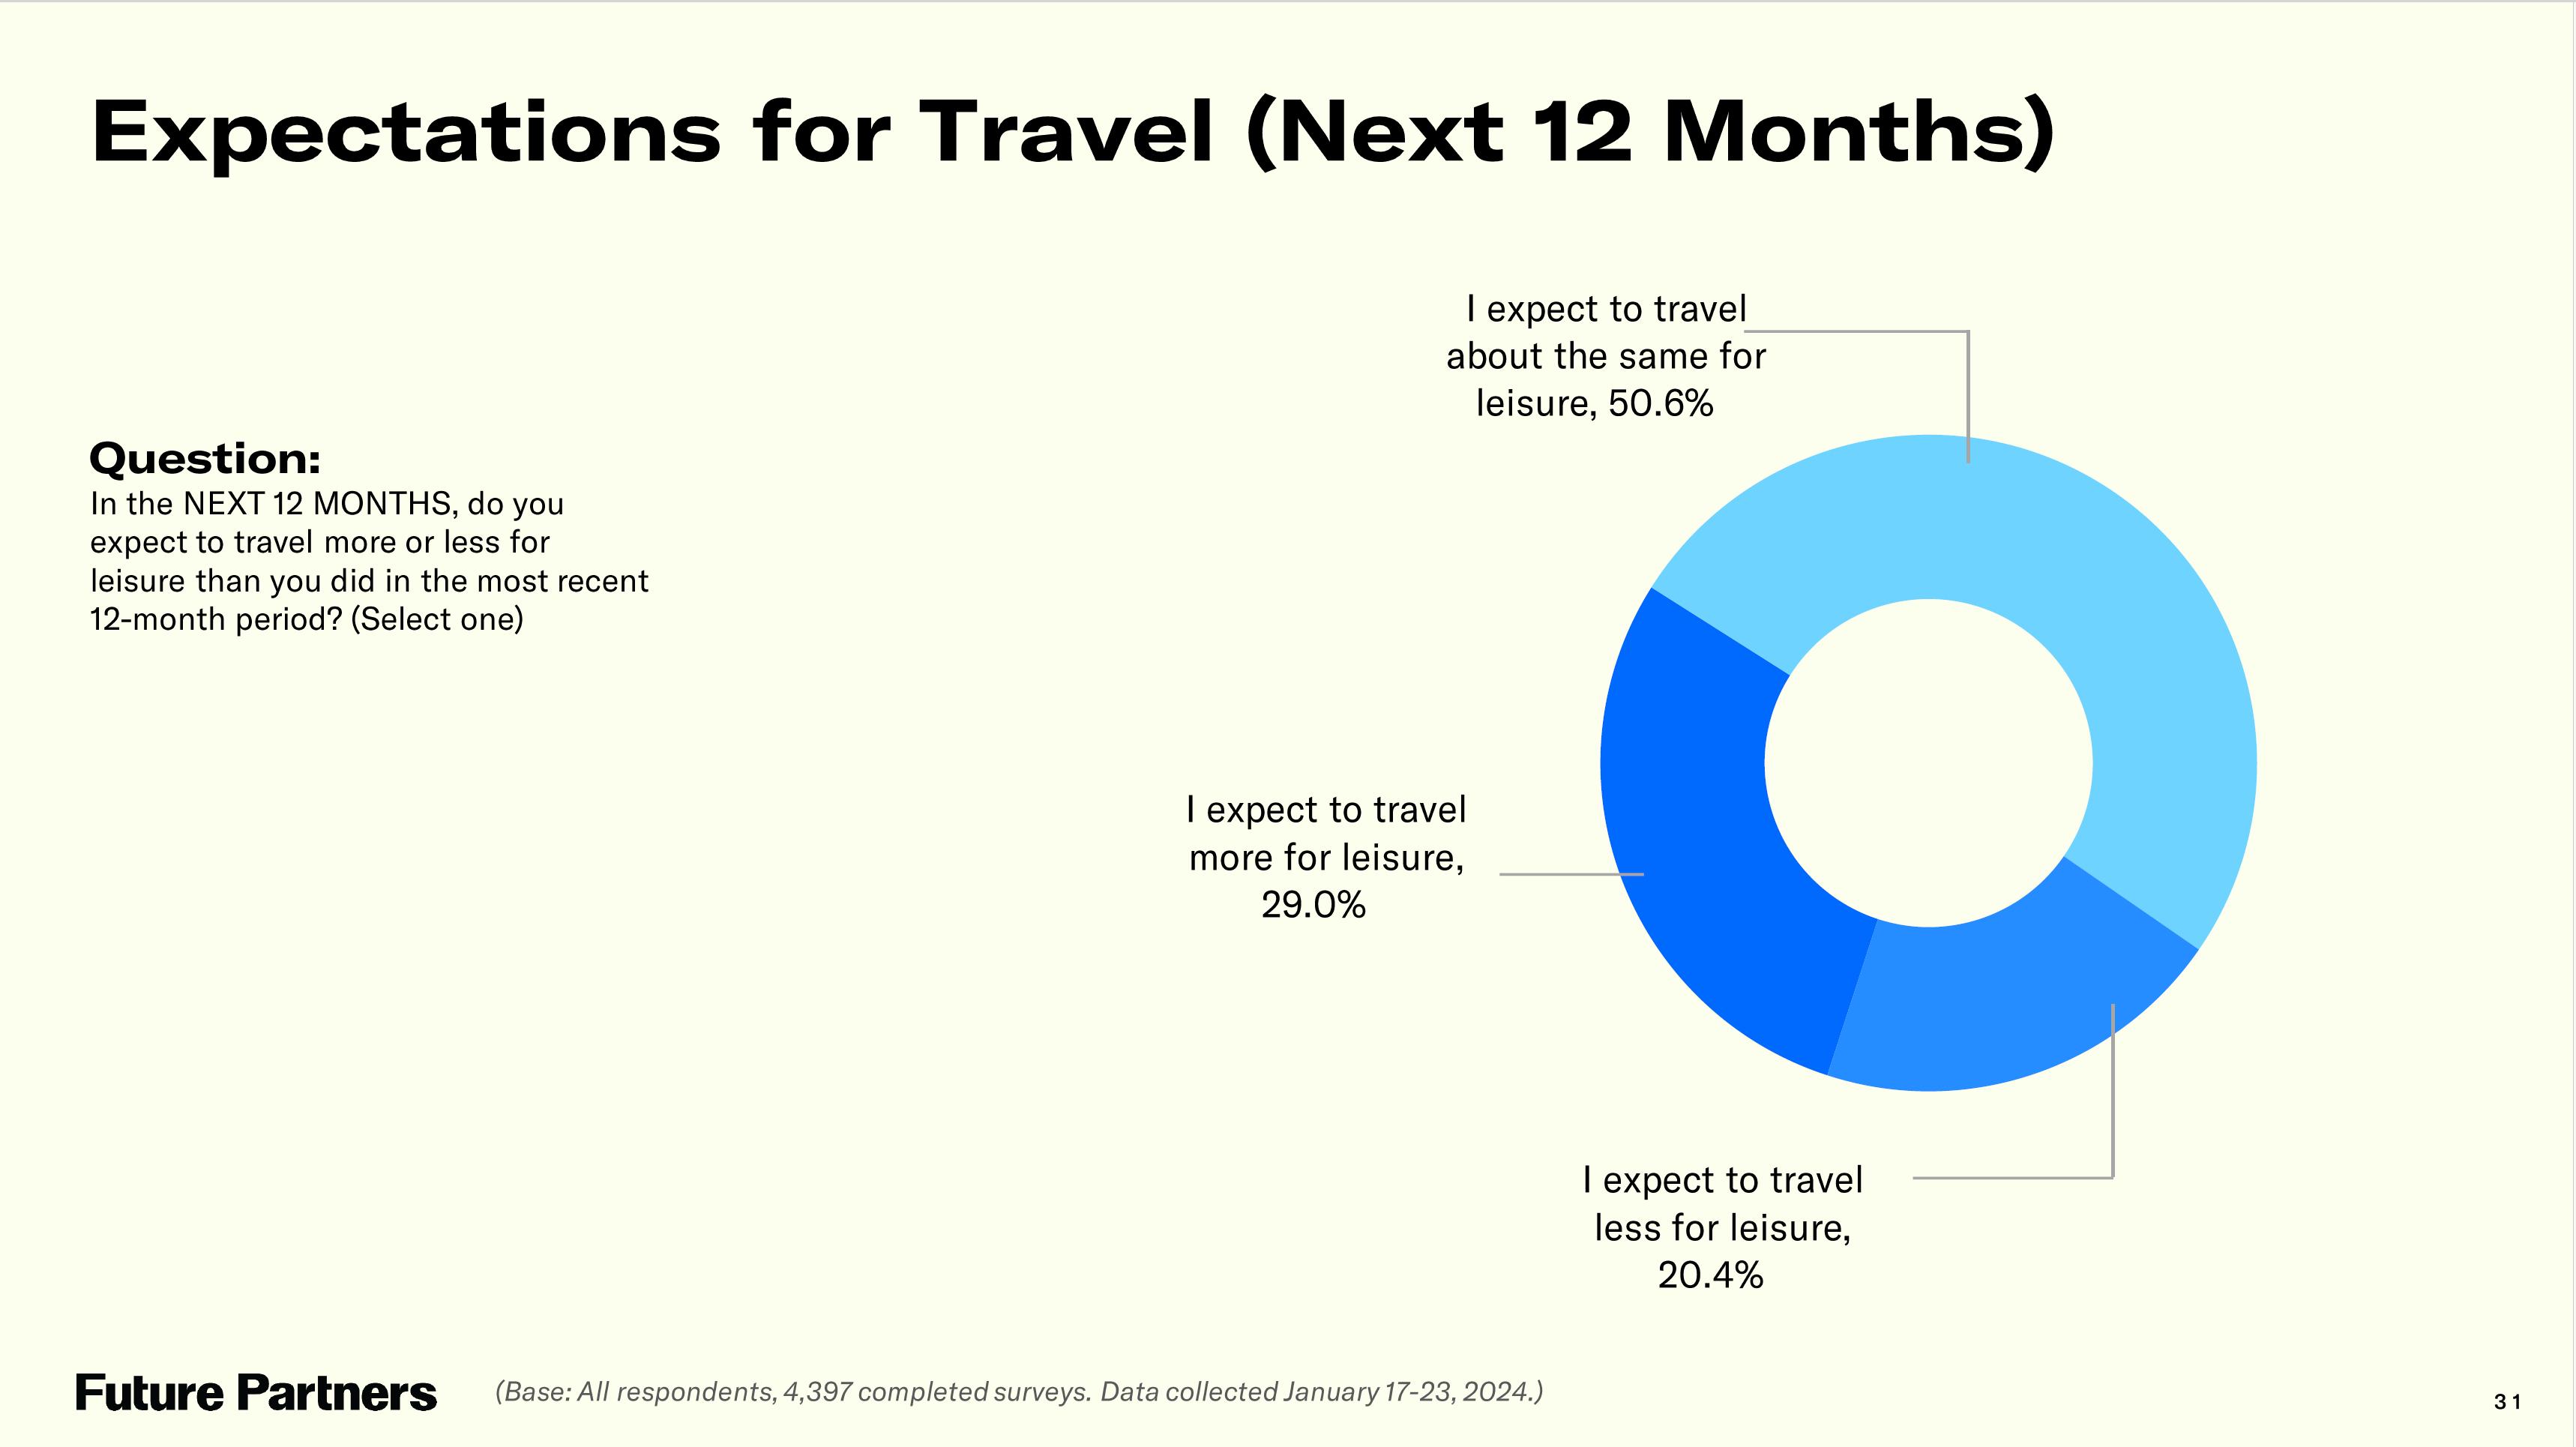
Travel planning remains stable
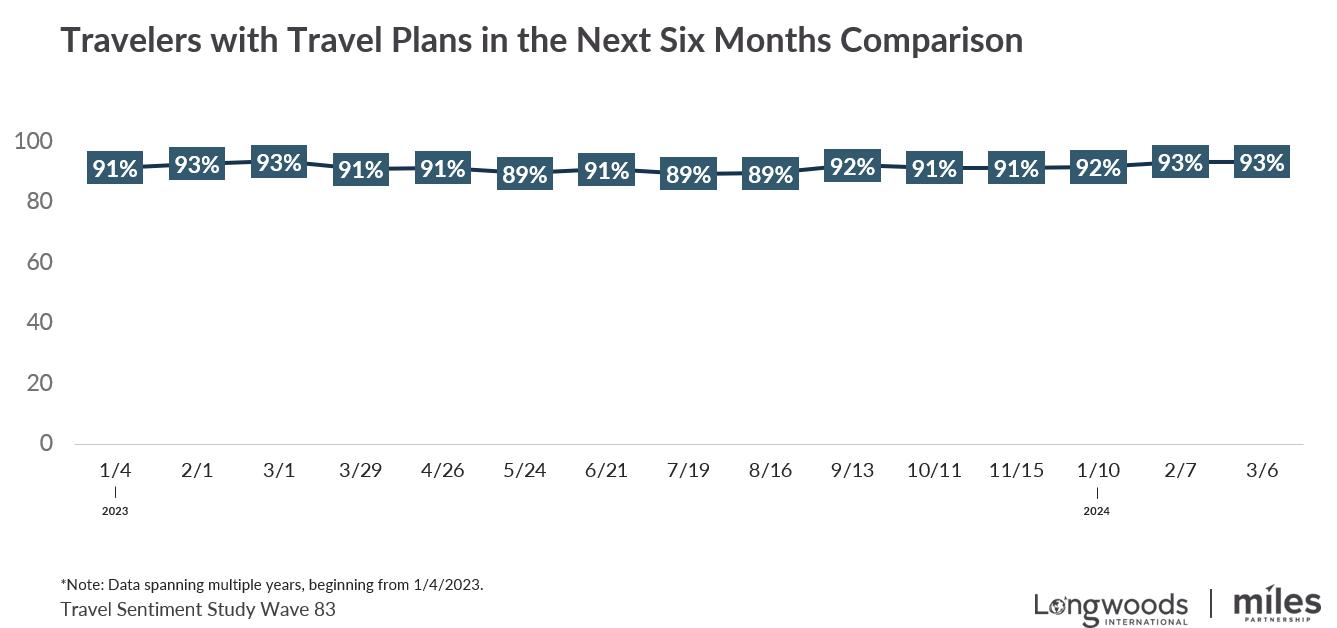

Leisure trip expectations hit a new high


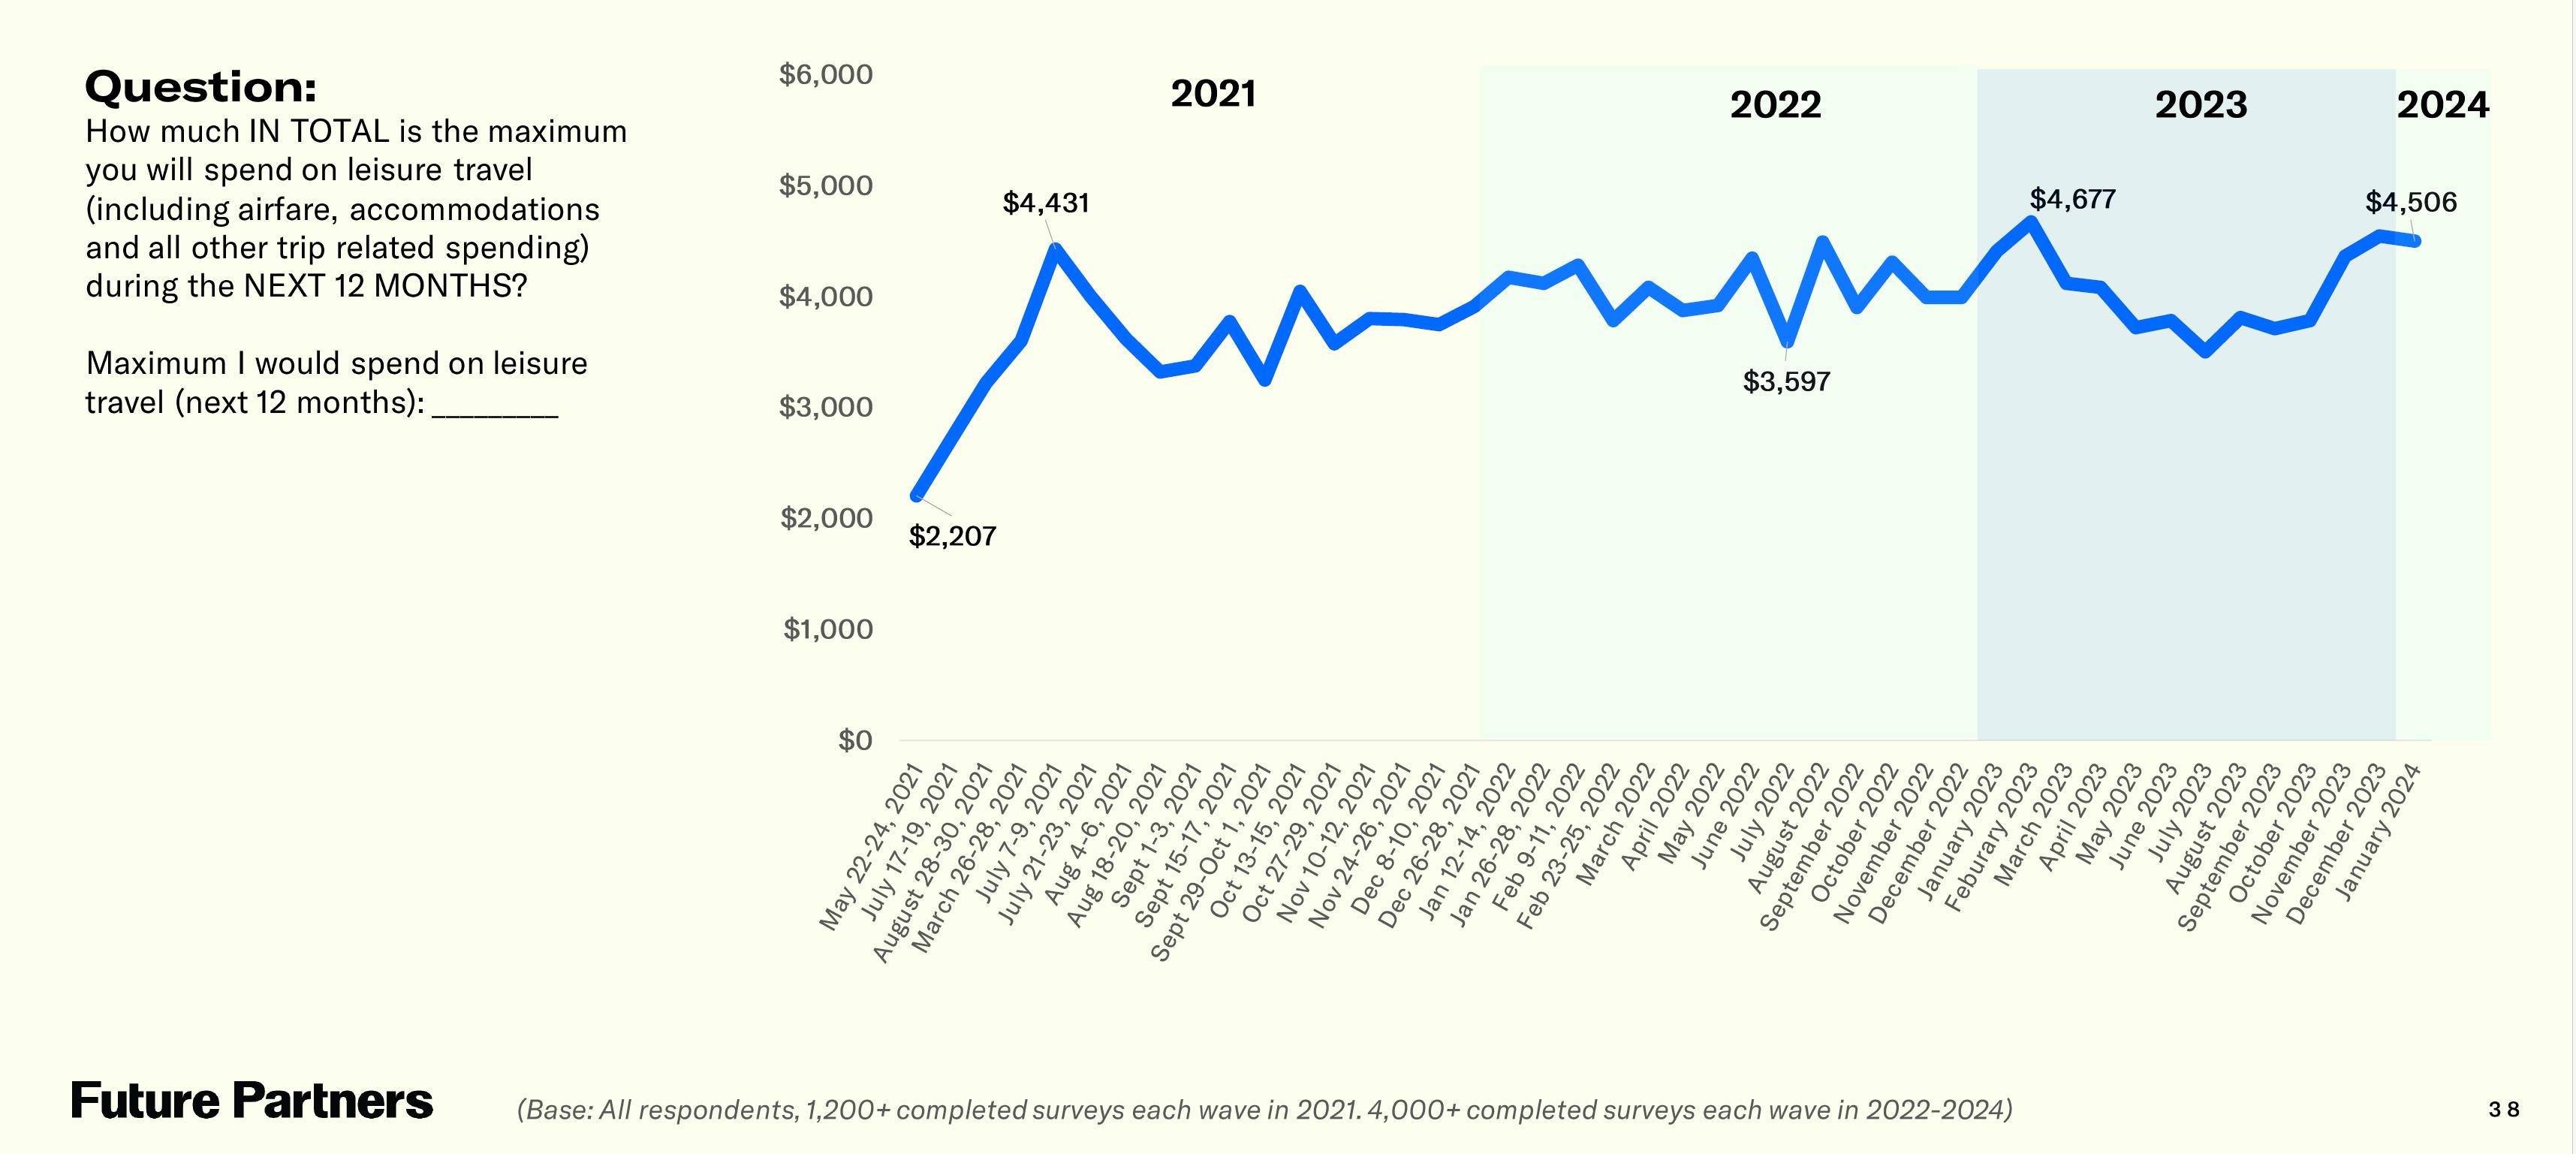
Travel budgets have recovered

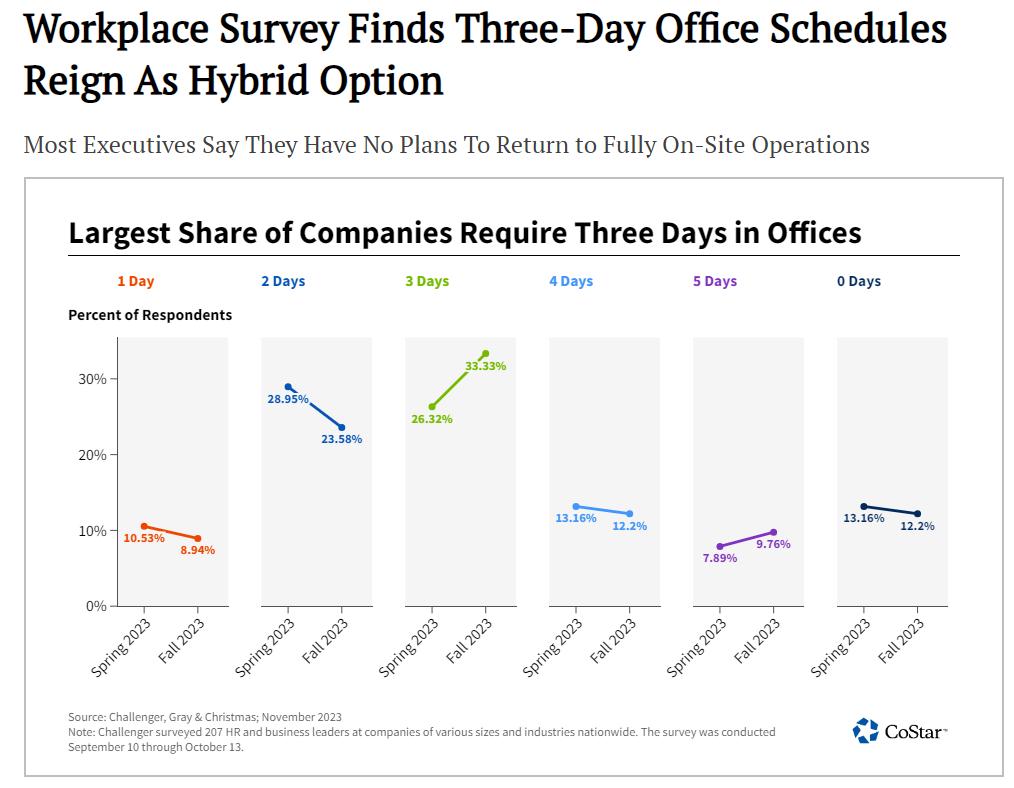


Remote work is a driver of leisure travel
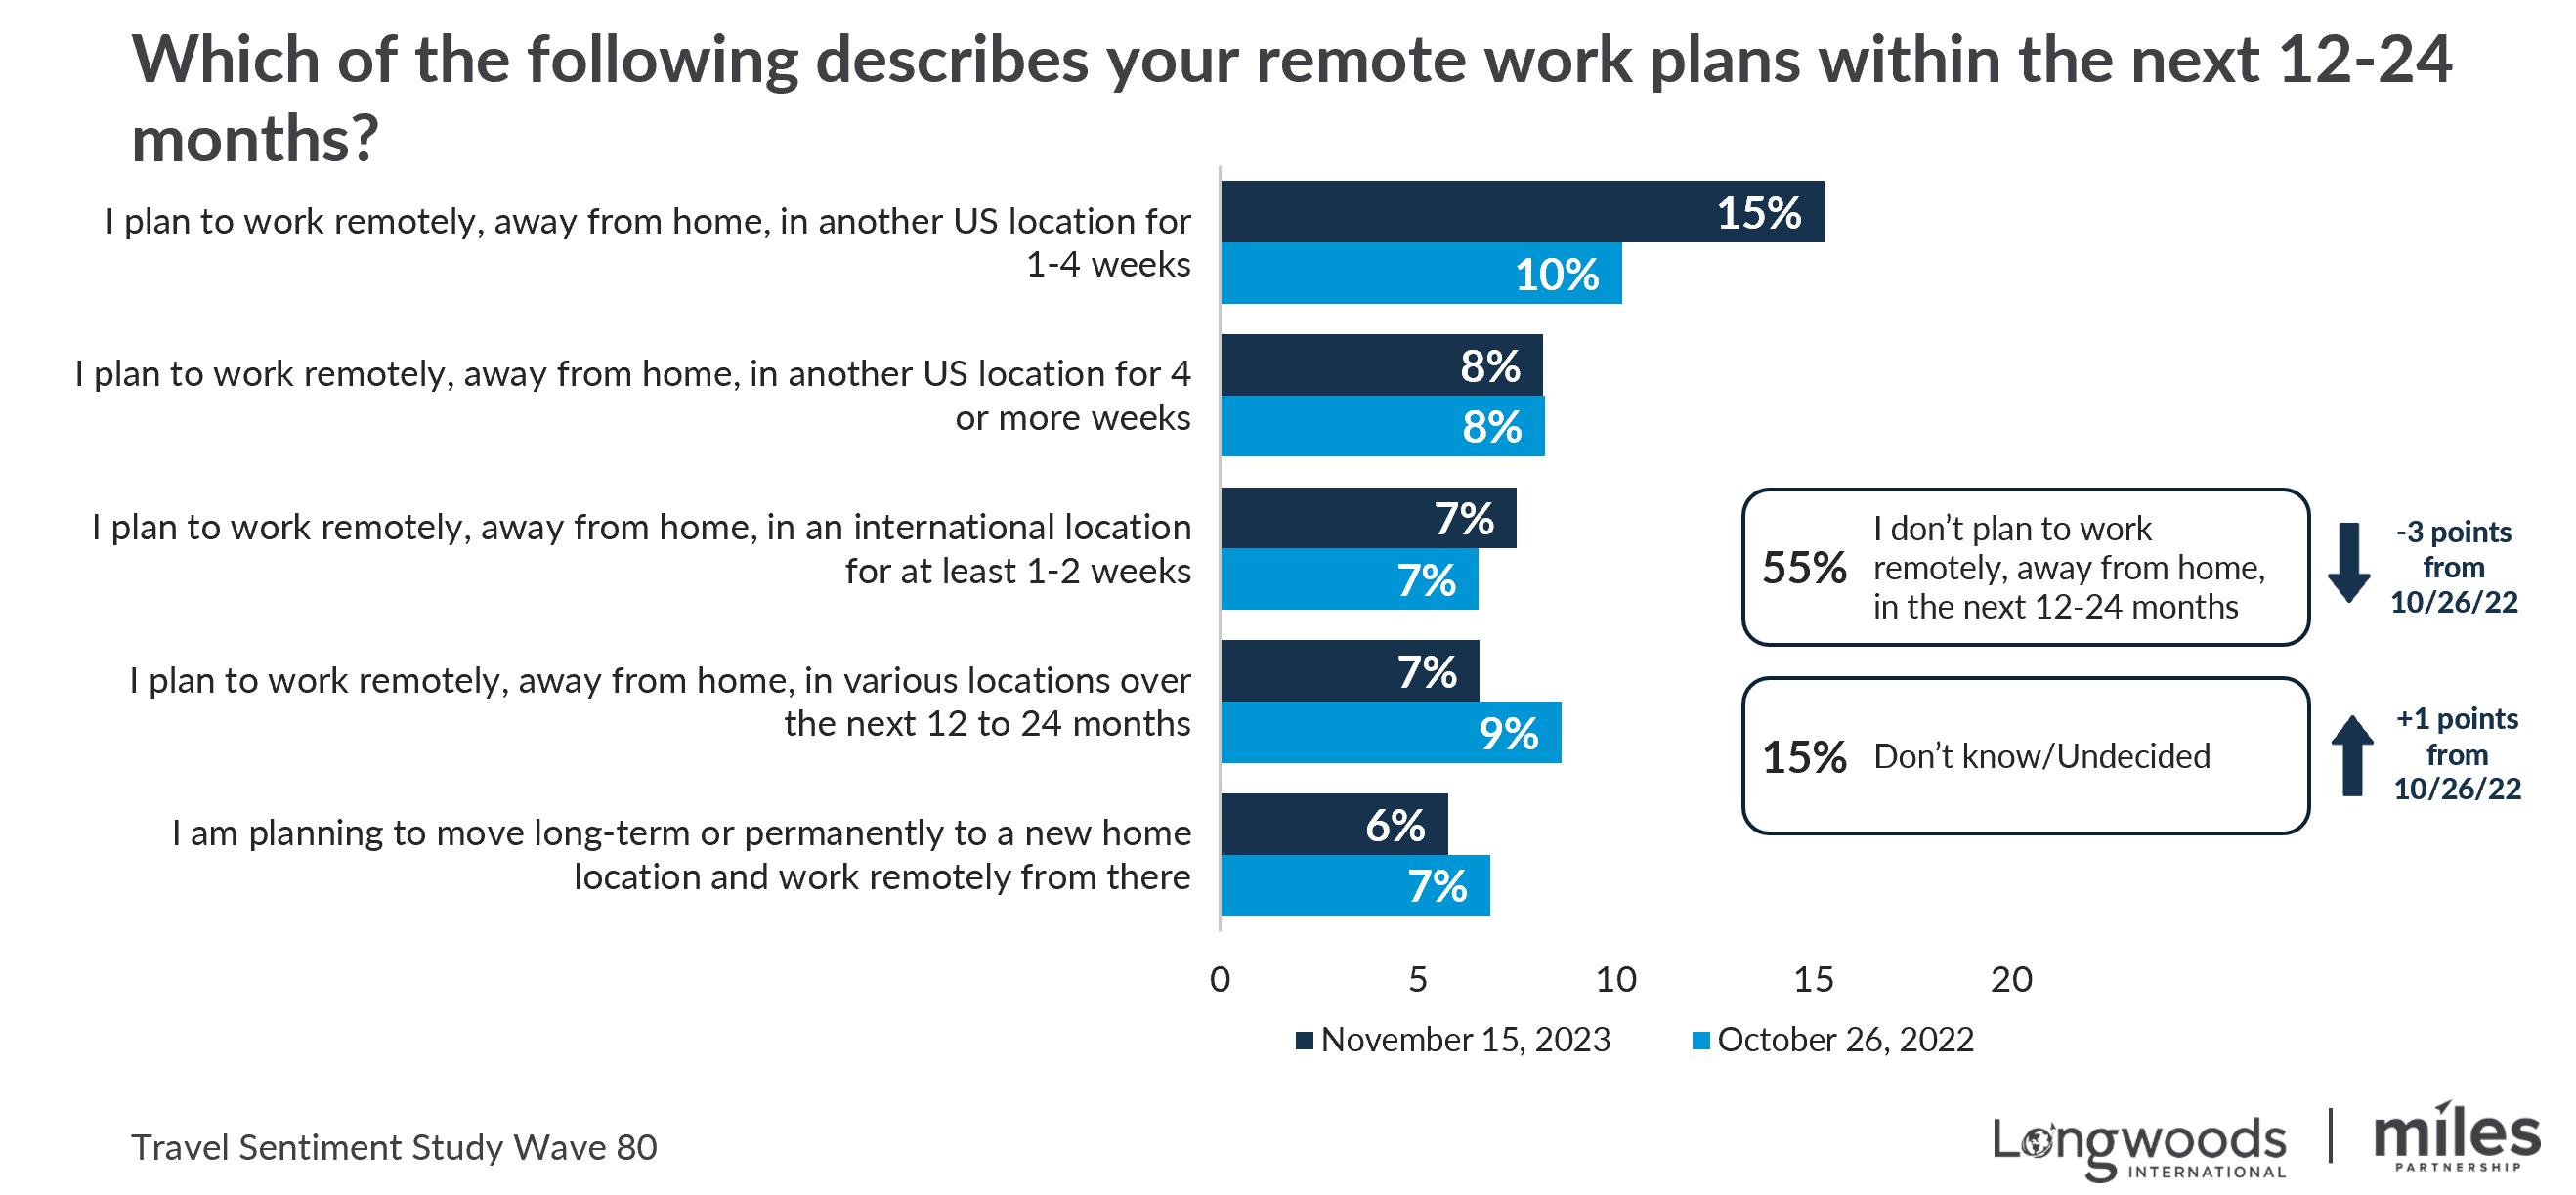
37% intend to travel while working (an increase from 34% in fall 2022)

Intentions resilient among high income earners
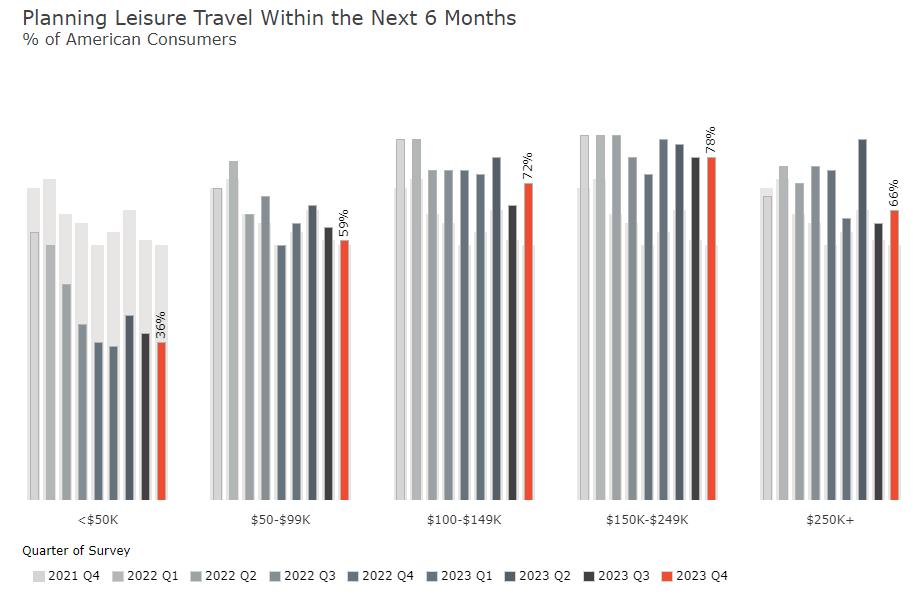


28
Upside for spending on travel, experiences, and other services
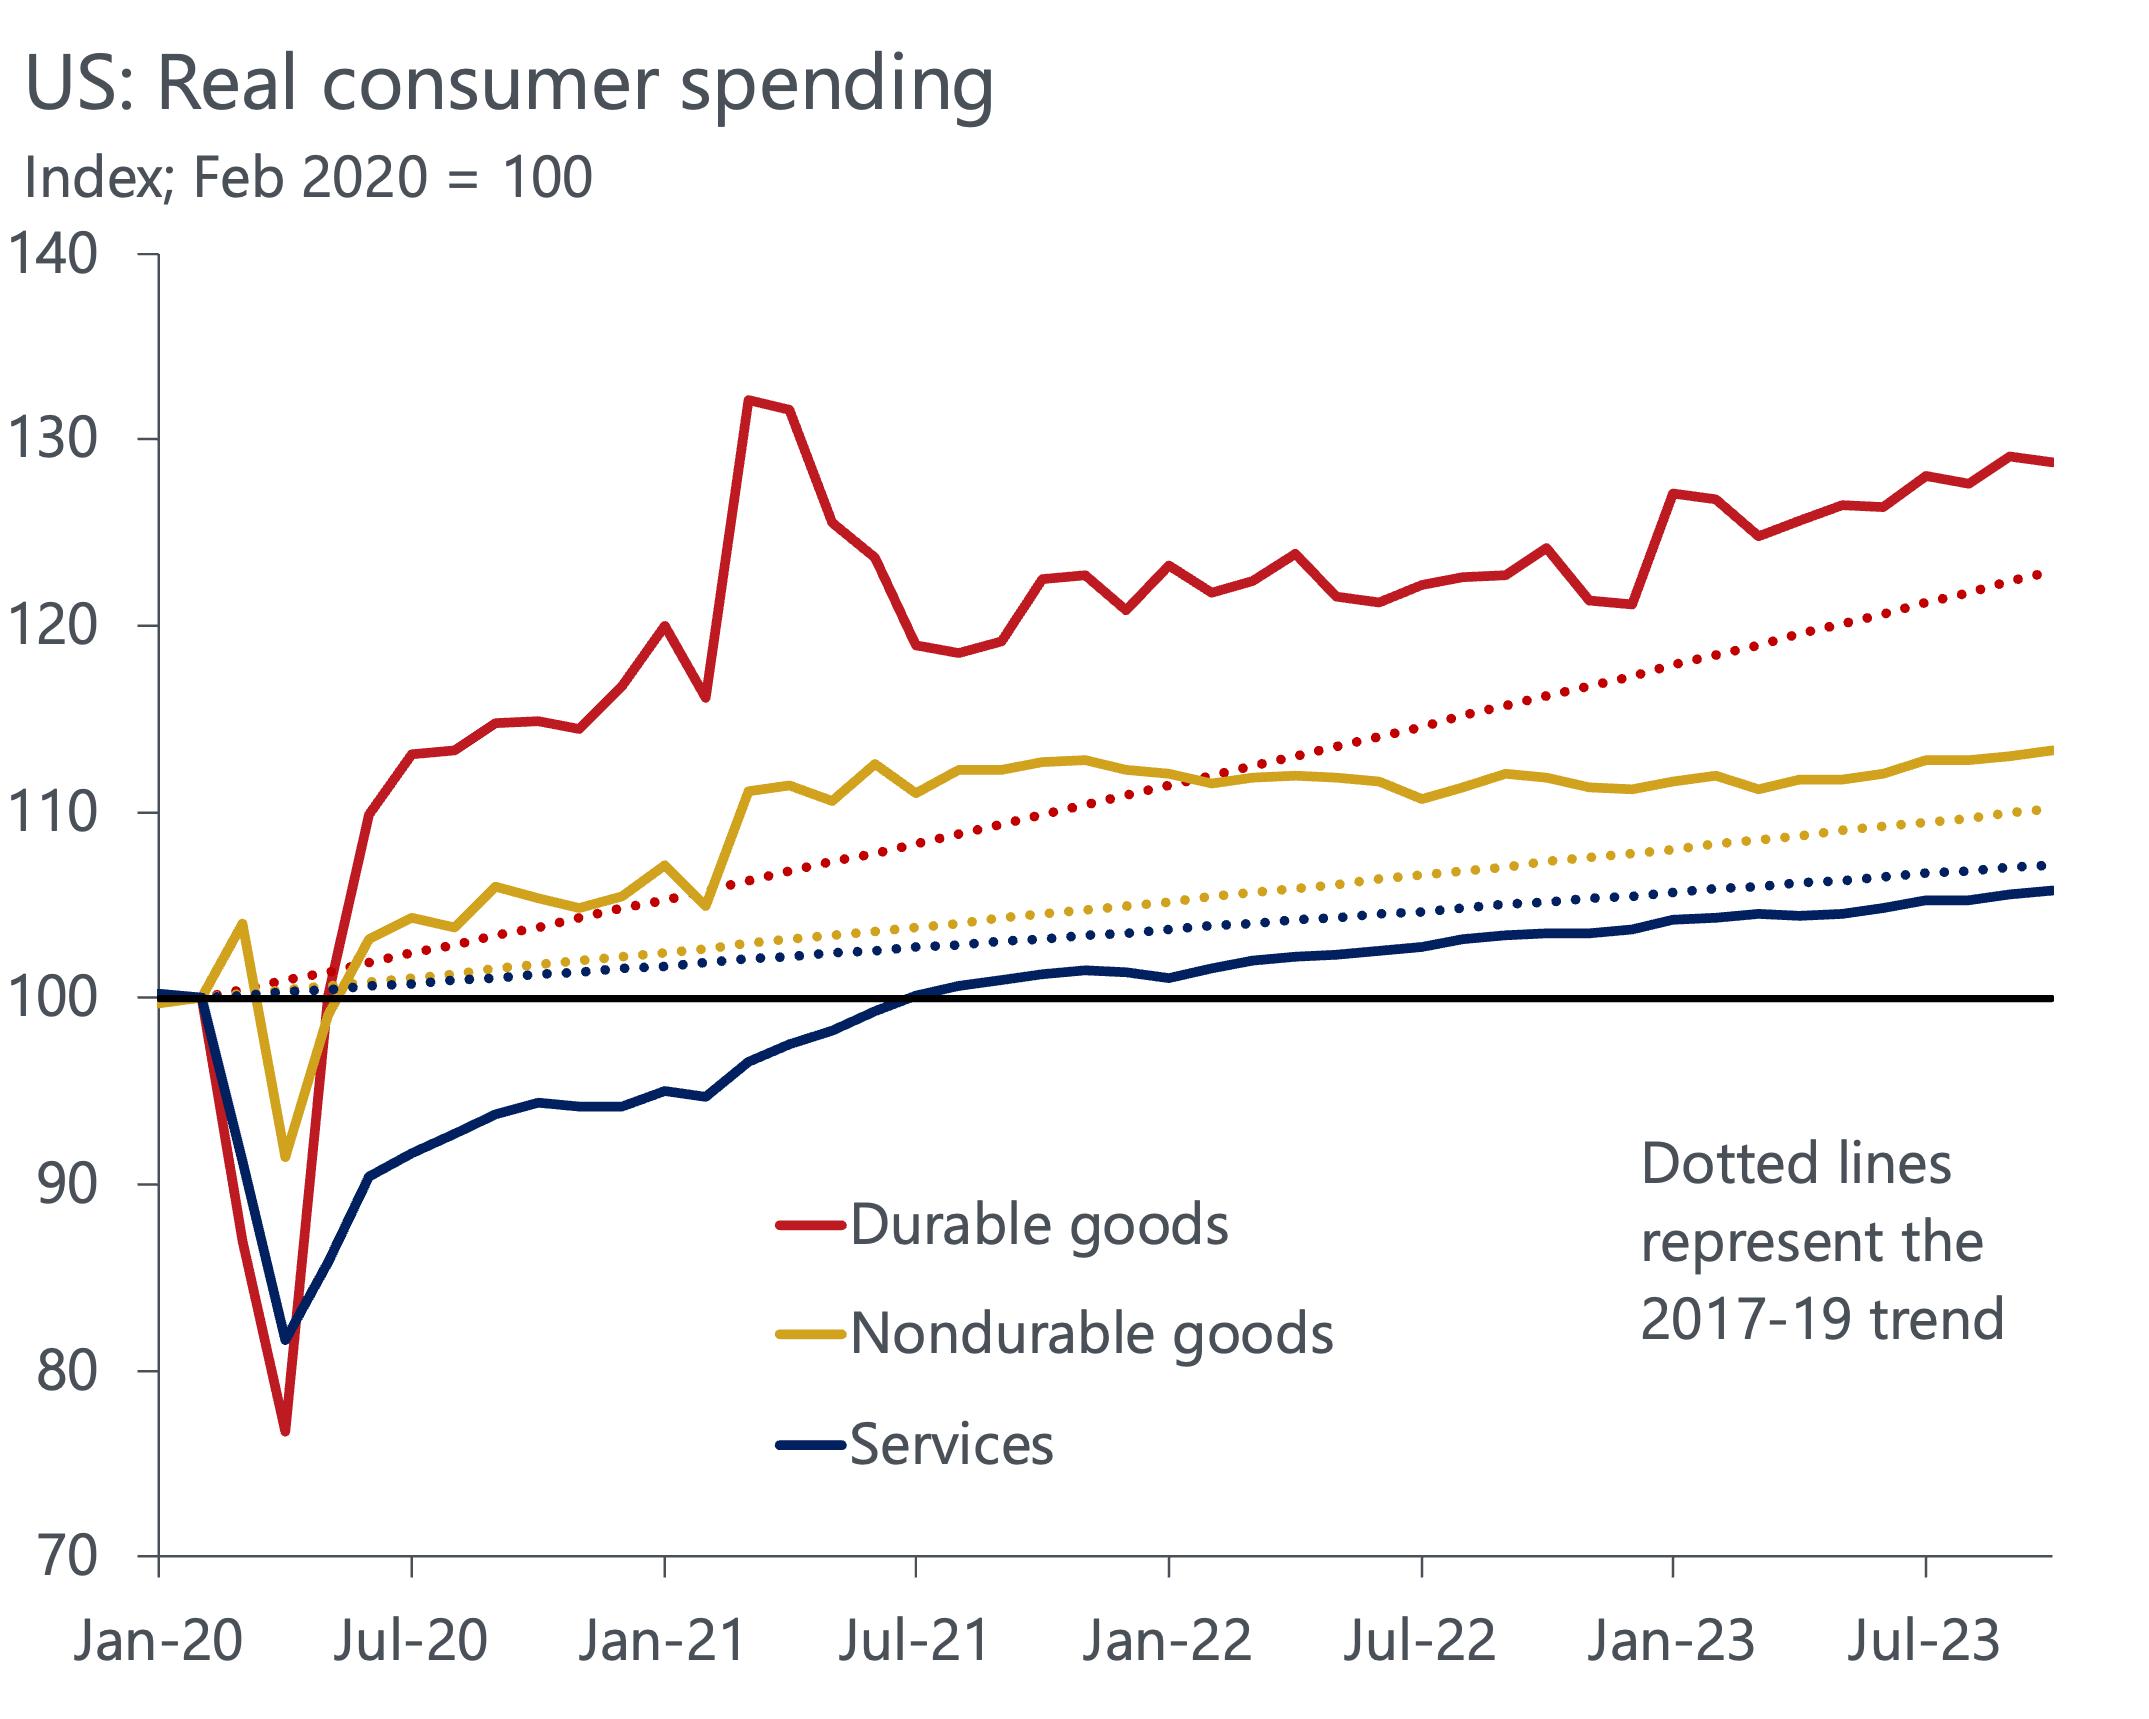

Domestic leisure travel slows to just 1.9% growth in 2024
U.S. DOMESTIC TRIPS
The continuing return of business travel will lead to 89% of prepandemic levels in 2023, and 95% in 2024.
Business and leisure trips
Note: Domestic trips only
Source: Tourism Economics
30
39 54 80 89 95 99 102 104 76 96 101 102 104 107 109 112 0 20 40 60 80 100 120 2020 2021 2022 2023 2024 2025 2026 2027
Business Leisure
Index (2019=100) Forecast
A correction in distribution of demand was inevitable
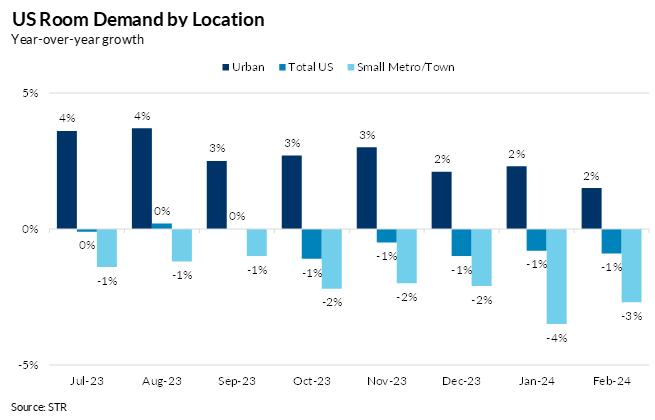


Business & Group Travel

Fall in profits would usually pull down business travel
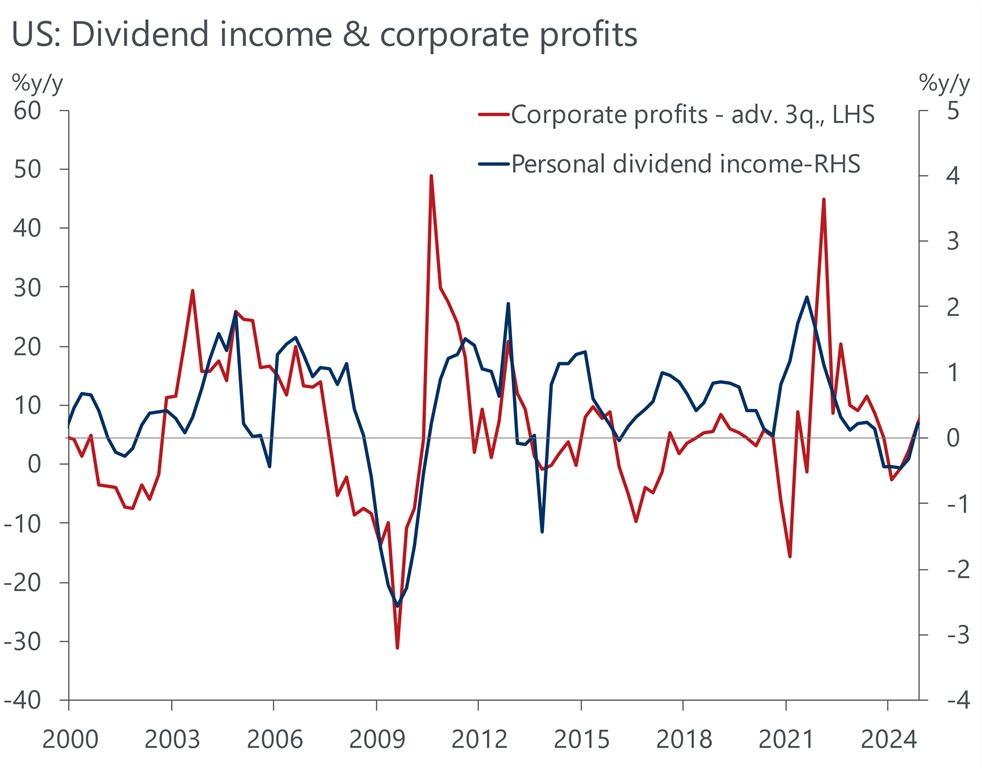

Business travel plans are strengthening
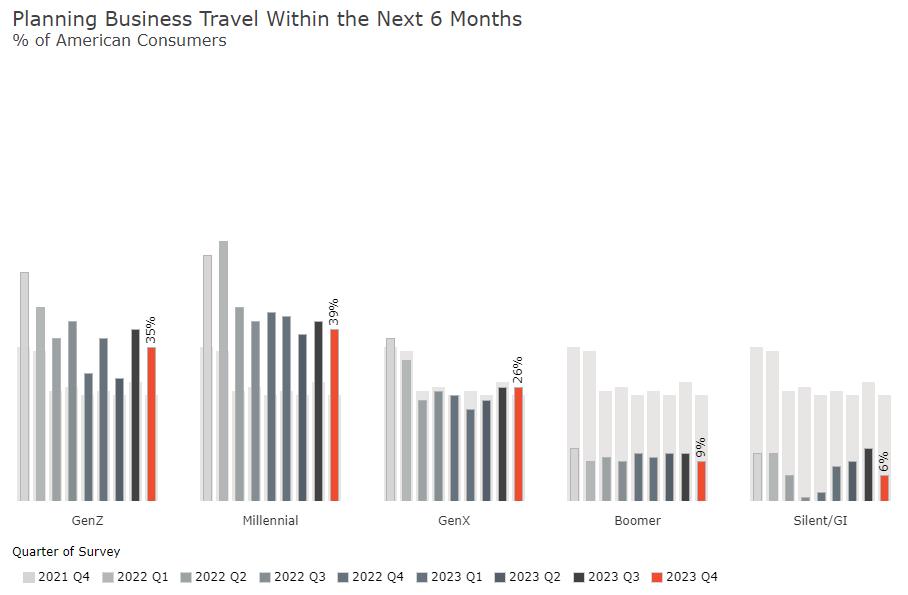
“Group is shaping up to have another solid year in 2024. …revenues pacing up nearly 13% globally and 11% in the U.S. and Canada on a year-over-year basis, driven by robust increases in both room nights and ADR.”
Marriott, Q4 Earnings Call

Light gray bars represent average of all respondents

Groups have made up a lot of ground
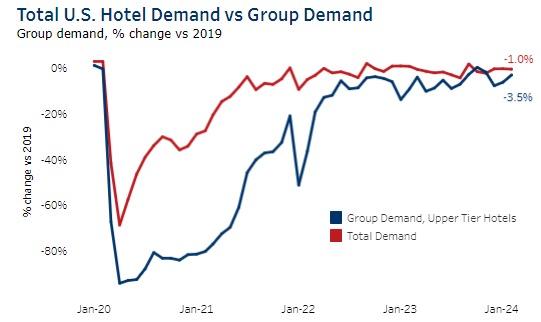
Source: STR

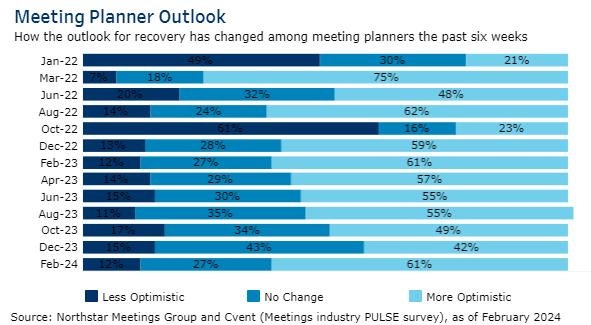
Optimism is building among meeting planners

Upside remains for travel to catch-up to economic growth
Note: Real GDP, seasonally adjusted.
Source: BEA; STR; Oxford Economics

and hotel room demand Index (2019 = 100)
GDP
60 70 80 90 100 110 120 00 01 02 03 04 05 06 07 08 09 10 11 12 13 14 15 16 17 18 19 20 21 22 23 24 2023 Q2 GDP Room demand

 Corpus Christi
Demand off to a strong start in 2024
Hotel Room Demand
Corpus Christi, % recovered vs same period in in 2019 (index, 2019=100)
Source: STR


38 11720 40 60 80 100 120 140 Jan-20 Feb-20 Mar-20 Apr-20 May-20 Jun-20 Jul-20 Aug-20 Sep-20 Oct-20 Nov-20 Dec-20 Jan-21 Feb-21 Mar-21 Apr-21 May-21 Jun-21 Jul-21 Aug-21 Sep-21 Oct-21 Nov-21 Dec-21 Jan-22 Feb-22 Mar-22 Apr-22 May-22 Jun-22 Jul-22 Aug-22 Sep-22 Oct-22 Nov-22 Dec-22 Jan-23 Feb-23 Mar-23 Apr-23 May-23 Jun-23 Jul-23 Aug-23 Sep-23 Oct-23 Nov-23 Dec-23 Jan-24 Feb-24
Hotel Average Daily Rate (ADR)
Corpus Christi, % recovered vs same period in in 2019 (index, 2019=100)
ADR fell 0.3% YOY in but remained above 2019 levels (9.3%).
Source: STR


11020 40 60 80 100 120 140 Jan-20 Feb-20 Mar-20 Apr-20 May-20 Jun-20 Jul-20 Aug-20 Sep-20 Oct-20 Nov-20 Dec-20 Jan-21 Feb-21
Apr-21 May-21 Jun-21 Jul-21 Aug-21 Sep-21
Nov-21 Dec-21 Jan-22 Feb-22 Mar-22 Apr-22 May-22 Jun-22 Jul-22 Aug-22 Sep-22 Oct-22 Nov-22 Dec-22 Jan-23 Feb-23 Mar-23 Apr-23 May-23 Jun-23 Jul-23 Aug-23 Sep-23 Oct-23 Nov-23 Dec-23 Jan-24 Feb-24
ADR remains strong
Mar-21
Oct-21
Room revenue outpacing inflation
Hotel Room Revenue
Corpus Christi, % recovered vs same period in in 2019 (index, 2019=100)
Room revenue decreased 2.3%
YOY in 2023, but ended 3.1% above 2019 levels
Source: STR


12920 40 60 80 100 120 140 Jan-20 Feb-20 Mar-20 Apr-20 May-20 Jun-20 Jul-20 Aug-20 Sep-20 Oct-20 Nov-20 Dec-20 Jan-21 Feb-21 Mar-21 Apr-21 May-21 Jun-21 Jul-21 Aug-21 Sep-21 Oct-21 Nov-21 Dec-21 Jan-22 Feb-22 Mar-22 Apr-22 May-22 Jun-22 Jul-22 Aug-22 Sep-22 Oct-22 Nov-22 Dec-22 Jan-23 Feb-23 Mar-23 Apr-23 May-23 Jun-23 Jul-23 Aug-23 Sep-23 Oct-23 Nov-23 Dec-23 Jan-24 Feb-24
Air travel outperforming 2019
Corpus Christi Air Travel
TSA PAX counts, % recovered vs same period in in 2019 (index, 2019=100)
Source: TSA


8 11820 40 60 80 100 120 140 Jan-20 Feb-20 Mar-20 Apr-20 May-20 Jun-20 Jul-20 Aug-20 Sep-20 Oct-20 Nov-20 Dec-20 Jan-21 Feb-21 Mar-21 Apr-21 May-21 Jun-21 Jul-21 Aug-21 Sep-21 Oct-21 Nov-21 Dec-21 Jan-22 Feb-22 Mar-22 Apr-22 May-22 Jun-22 Jul-22 Aug-22 Sep-22 Oct-22 Nov-22 Dec-22 Jan-23 Feb-23 Mar-23 Apr-23 May-23 Jun-23 Jul-23 Aug-23 Sep-23 Oct-23 Nov-23 Dec-23 Jan-24 Feb-24
Corpus Christi to bounce back in 2024
Corpus Christi Hotel Forecast
Calendar year
Source: STR (history); Tourism Economics (forecast as of April 2024)
Indicator 2022 2023 % Chg YOY % Chg vs 2019 Occupancy 56.7% 55.9% -1.4% -10,4% ADR $107.09 $106.82 -0.3% 9.3% RevPAR $60.72 $59.73 -1.6% -2.0% Supply 3.3M 3.3M -0.7% 5.3% Demand 1.9M 1.8M -2.1% -5.6% Room Revenue $200M $196M -2.3% 3.1% 2024* % Chg YOY % Chg vs 2019 57.7% 3.3% -7.4% $107.07 1.1% 10.5% $62.34 4.4% 2.3% 3.2M -0.9% 4.3% 1.9M 2.4% -3.4% $202M 3.5% 6.7%
ADR to drive RevPAR growth
Corpus Christi Hotel Forecast
Calendar year % recovered relative to 2019, Index (prior year=100)
Source: STR (history); Tourism Economics (forecast as of April 2024)
78 94 91 90 93 92 92 89 102 110 109 111 113 114 70 97 100 98 102 103 105 0 20 40 60 80 100 120 2020 2021 2022 2023 2024 2025 2026
OCC ADR RevPAR forecast
Occupancy expected to improve in 2024 vs 2023
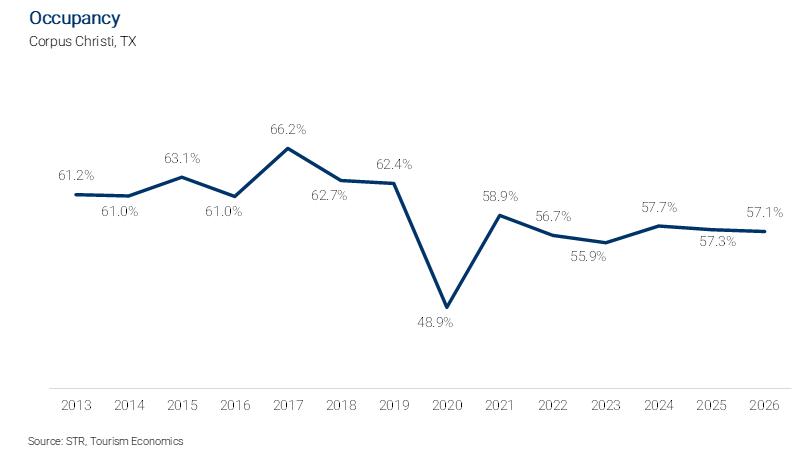
Room revenue fully recovered. Demand will take time
Corpus Christi Hotel Forecast
Calendar year % recovered relative to 2019, Index (prior year=100)
Source: STR (history); Tourism Economics (forecast as of April 2024)
79 96 96 94 97 98 100 71 98 106 103 107 111 114 0 20 40 60 80 100 120 2020 2021 2022 2023 2024 2025 2026
Demand Room Revenue forecast
Room revenue to continue to grow the next three years


Thank You!


meetings
Global
Industry day


 SUZZANNE RAVITZ
Director of Customer Success 2Synergize, a Simpleview Consulting Agency


Visit Corpus Christi | 2024 Meetings & Events

Agenda Simpleview Sales Quarterly Year-End 2024
Aggregate and Region
Corpus Christi Competitive Set

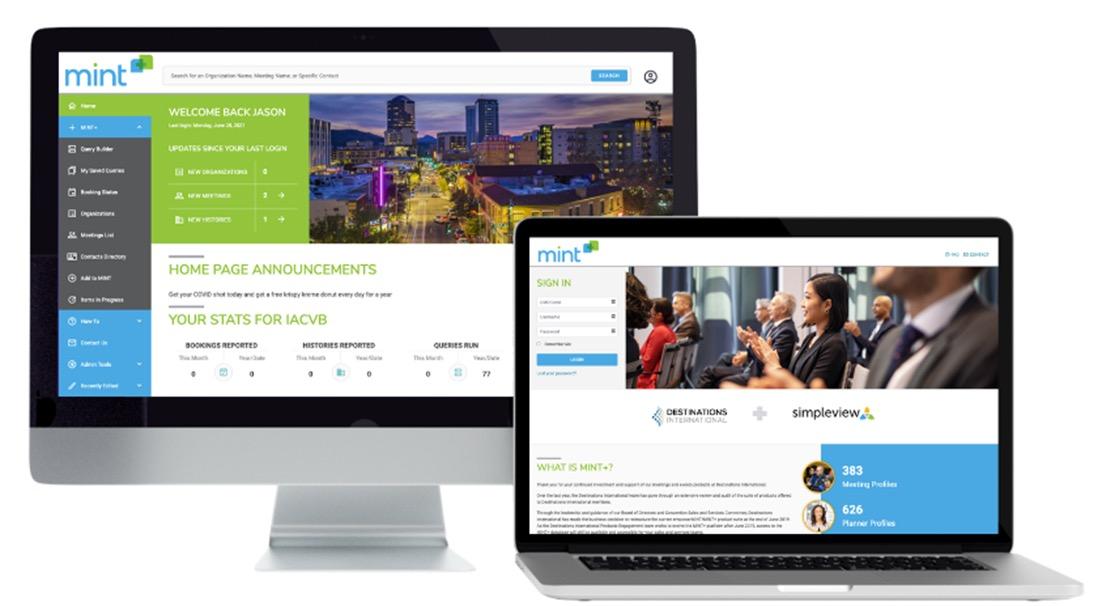
About our data…


53
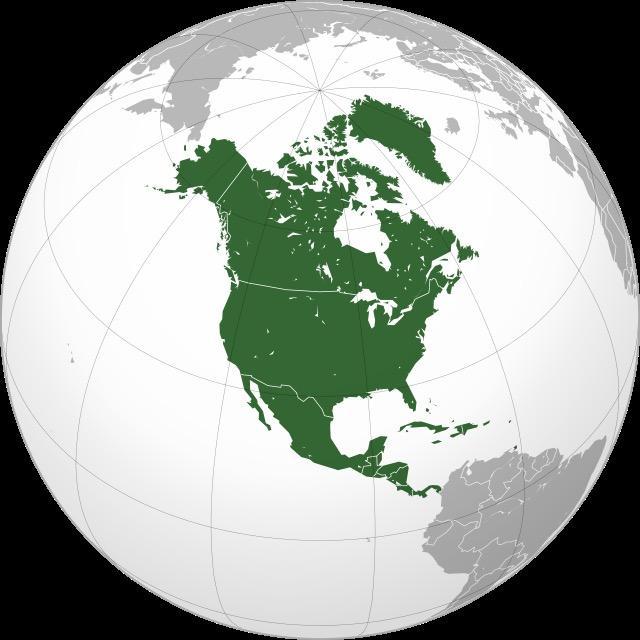

US, Canada, Caribbean
Sales Production
54
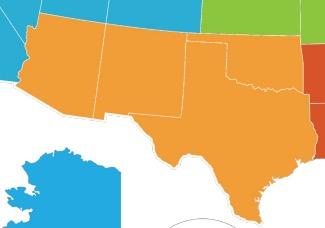
Corpus Christi Southwest

US, Canada, Caribbean
55
Lead Generation Up Over 2019
Lead Generation Compared to 2019
56 -9.5% -1.4% 0.9% -1.1% 20.1% 12.0% 6.9% 1.4% 18.9% Q1 Q2 Q3 Q4
2022 2023 2024
2023: +10.2%
Lead Pipeline
Net number of convention center leads in the pipeline through December 2023 to 2019
57
7,920 7,993 1,250 -755 Current Year Next Year 2 Years Out 3 Years Out
Number of Hotel Meeting Leads in the Pipeline through December 2023 compared to 2019 150 913 607 354 22 -145 -134 Current Year Next Year 2 Years Out 3 Years Out 4 Years Out 5 Years Out 6 Years Out
Net
Bookings Compared to 2019
58
Definite Bookings Remain Below 2019 2023: -9.1%
-25.5% -27.0% -16.7% -23.0% -6.4% -8.1% -7.3% -14.6% -3.2% Q1 Q2 Q3 Q4
2023
2022
2024
Definite Room Nights Surpass
in Q1
Booked Room Nights Compared to 2019
59
2019
2024 2023 YTD: -7.2%
-9.5% -26.1% -21.3% -18.4% -3.7% -12.4% -5.9% -5.8% 13.0% Q1 Q2 Q3 Q4
2023
2022
2024
60
+4.7%
Attendance Compared to 2019 -3.3% -33.0% -19.2% -14.9% 32.1% 3.5% -11.7% -2.4% 20.3% Q1 Q2 Q3 Q4
2023 2024
Booked Attendance Shows Growth 2023 YTD:
Booked
2022
Lead and Booking Summary
2023 2024 YTD
61
10.2% -9.1% -7.2% 4.7% 18.9% -3.2% 13.0% 20.3% Lead Volume Definite Bookings Definite Room Nights Definite Attendance

Southwest
Southwest
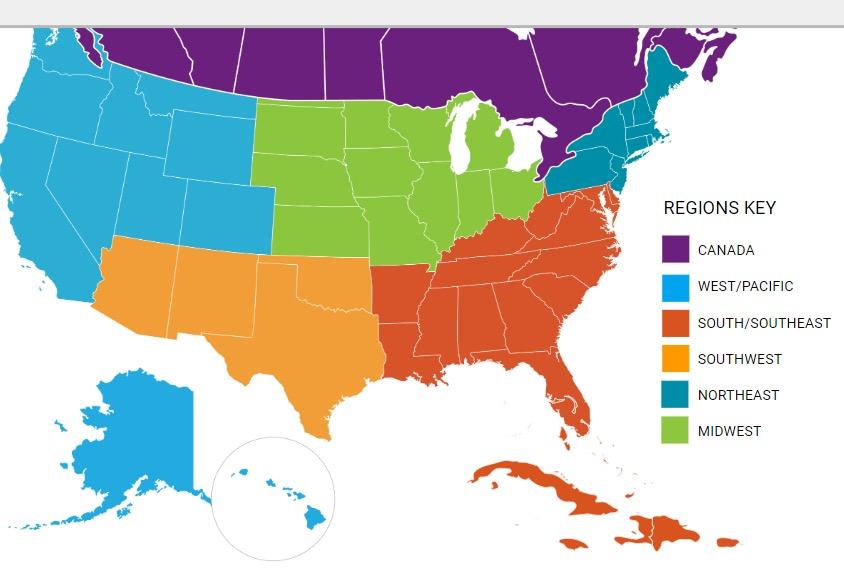
Southwest– 26 Destinations
Leads are Up for Most Regions
Number of leads by region through December 2023 compared to 2019
-10% 1% 9% 27% 31% 19% Canada Midwest Northeast South/Southeast Southwest West/Pacific
Hotel Meeting Market Segment Changes
Top 10 Southwest market segments: number of hotel meeting leads percentage variance through December 2023 compared to 2019
20.8% 16.2% 33.7% 11.3% 64.9% 31.1% 27.0% 12.0% Job Related
Administration, Public Affairs, and Govt Education Finance & Insurance
Sports & Athletics
Science & Engineering
Tourism Industry
&
Public
Recreation,
Technology,
Meetings, Conventions,
Health
Medical, Pharmaceutical
Convention Center Event Market Segment Changes
Top 10 Southwest market segments: number of convention center event leads percentage variance through December 2023 compared to 2019
14.5% 8.3% 55.8% 0.0% 24.7% 27.4% 1.8% 21.7% Religious/Faith Based Social/Service Clubs, Reunions, Fraternal Education
Administration, Public Affairs, Govt
Sports & Athletics
Related
Public
Recreation,
Job
& Engineering
Technology, Science
& Medical, Pharmaceutical
Health
Bookings are Down, but Not Equally
2023: Number of bookings by region compared to 2019
-23% -10% -8% -8% -3% -13% Canada Midwest Northeast South/Southeast Southwest West/Pacific
Booked Room Nights –Southwest
Booked Room Nights Compared to 2019
2023 YTD:
-4.9%
-18.7% -20.9% -35.4% -13.6% -11.1% -0.3% -15.9% 8.7% -10.2% Q1 Q2 Q3 Q4
2022 2023 2024
2023: Lead Volume and Booking Summary
10.2% -9.1% -7.2% 4.7% 31.0% -3.0% -4.9% 4.4% Lead Volume Definite Bookings Definite Room Nights Definite Attendance Aggregate Southwest
 Corpus Christi
Leads Surpass to 2019 Levels
Number of Leads compared to 2019 Average 47.2% 47.2% 39.0% 18.9% 47.2% 75.0% 51.2% 18.9% 127.8% Q1 Q2 Q3 Q4 2022 2023 2024
2023: 48.0%
Lead Market Segments 2023
3.8% 3.8% 4.4% 5.4% 6.7% 9.5% Dance/Cheer Water
Commercial or Business Educational Niche Government, Public Administration, Public Affairs Top Market
Trade,
Segments
Definite Bookings Strong for 2023
77.8% 76.9% 78.9% 160.0% 33.3% 46.2% 31.6% 300.0% 55.6% Q1 Q2 Q3 Q4 2022 2023 2024 2023: +65.2%
Lead Volume and Booking Summary 2023
10.2% -9.1% -7.2% 4.7% 31.0% -3.0% -4.9% 4.4% 4.8% 65.2% 72.0% 125.1% Leads Definite Bookings Definite Room Nights Definite Attendance Aggregate Southwest Corpus Christi
Competitive Destination Comparison
 Providence
Grand Rapids
Oklahoma City
Chattanooga
Lexington Buffalo
Corpus Christi
Convention Center: Largest
Source: CC website
200,730 162,000 100,800 100,000 100,000 76,500 64,000 Oklahoma City Grand Rapids Chattanooga Lexington Providence Corpus Christi Buffalo
Exhibit Space (GSF)
Competitive CitiesTotal Hotel Rooms
Source: CoStar through 2023
28,974 15,853 15,338 12,924 12,132 12,029 7,765 Oklahoma City Buffalo Grand Rapids Lexington Corpus Christi Chattanooga Providence
Total Full-Service Hotel Rooms
Source: CoStar
8,619 5,678 5,230 4,319 4,257 3,799 2,987 Oklahoma City Grand Rapids Buffalo Providence Lexington Chattanooga Corpus Christi
Competitive CitiesAverage Daily Rate
Source: CoStar through 2023
$153.07 $133.78 $125.89 $115.69 $114.74 $105.34 $95.40 Providence
Buffalo Grand Rapids Lexington Chattanooga Corpus Christi Oklahoma City
Key Takeaways
• Leads are higher compared to 2019
• Short-term business is still strong
• Definite bookings are still down, but up year over year
• The Southwest region has recovered stronger than all other regions
• Corpus Christi leads far surpass 2019
• Partner with Visit Corpus Christi to bring the best meetings and events to the destination
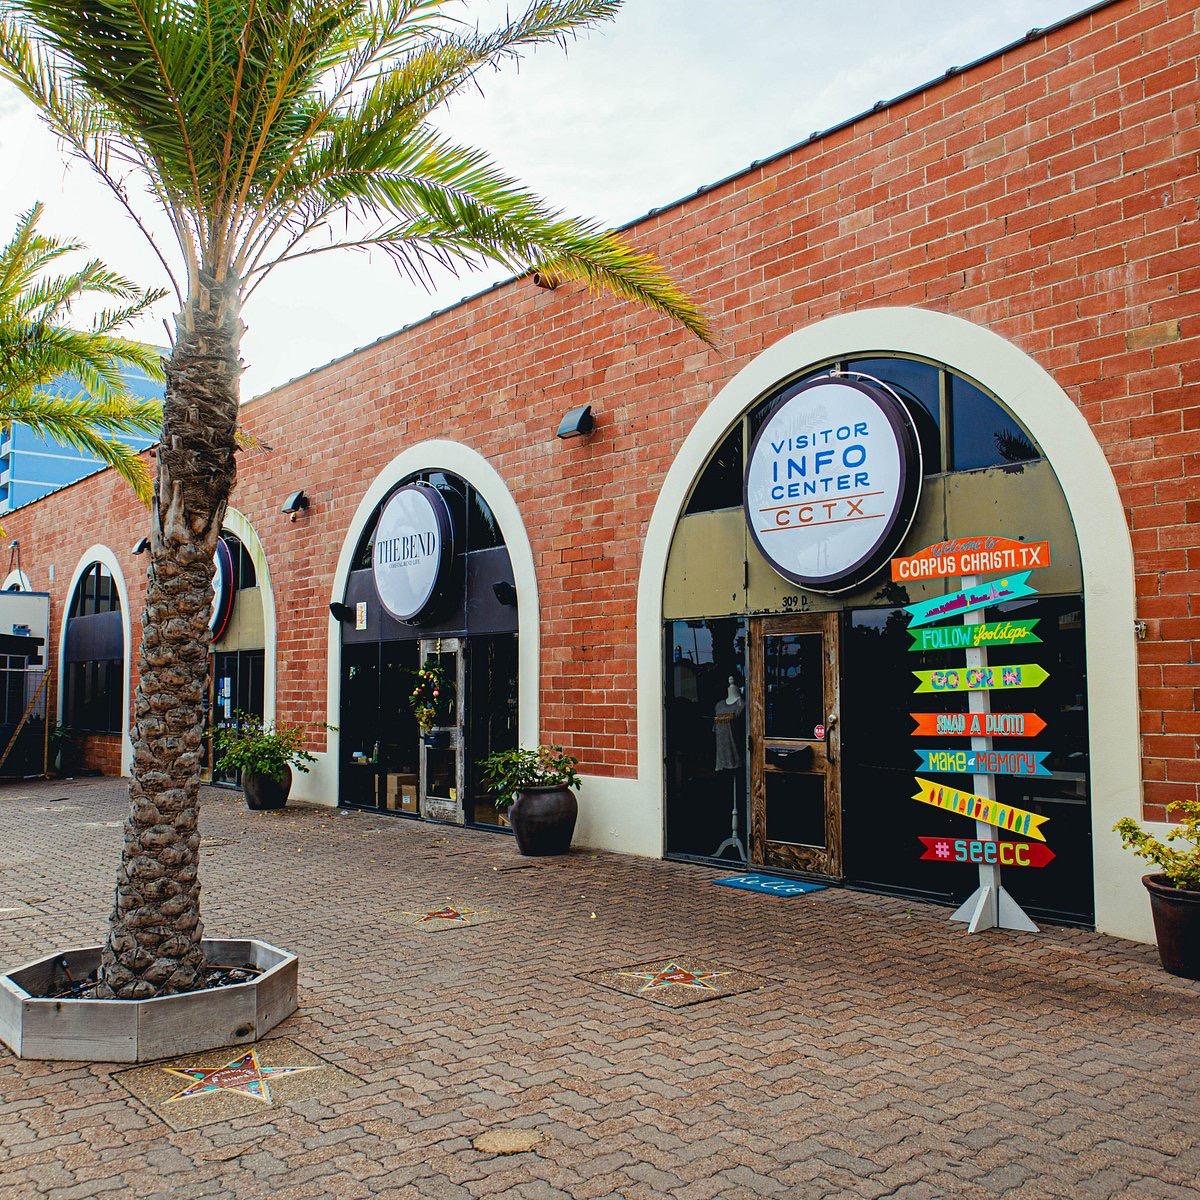

Corpus Christi | 2024 Thank You!
Visit


meetings
Global
Industry day

NICOLE OLIVARES
Vice president of sales & Services
Visit corpus Christi


SALES MISSION
To promote Corpus Christi as the Gulf Coast Capital and premier meeting and convention destination by Marketing our natural resources, first in class facilities, and accommodations.



BY WORKING TOGETHER, WE CAN BRING MORE BUSINESS TO CORPUS CHRISTI, AND EVERYONE BENEFITS.


SALES MARKETING STRUCTURE
MARKET SEGMENTS
• Texas State Association
• National Association
• Government
• Corporate
• SMERF: Social, Military, Education, Religious, and Fraternal
TOP CONVENTION

SALES INITIATIVES
Strategy #1
Continue to develop the SMERF market and expand Association market.
STRATEGY #2
Develop a unified and aligned destination sales approach.
STRATEGY #3
Target new tradeshows, clients, and creative marketing opportunities.

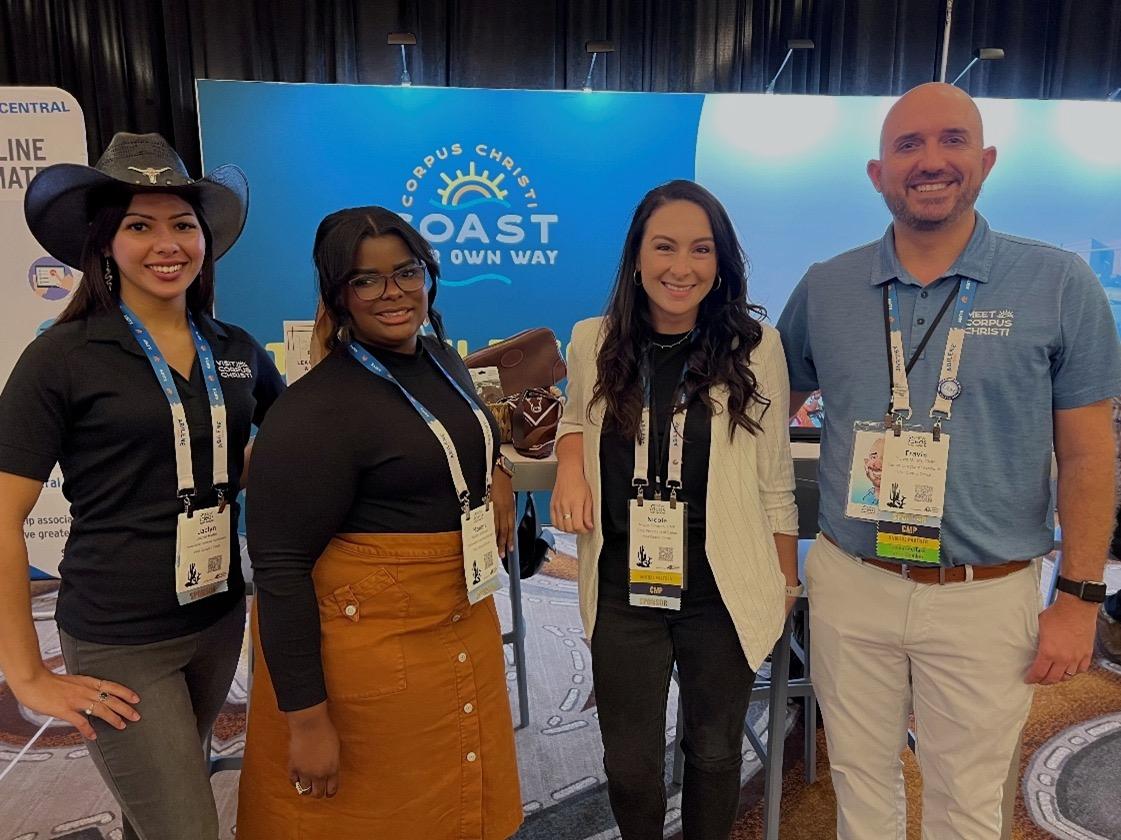
Sales Tradeshows

TOP DESTINATION SERVICES INITIATIVES

Continue to be innovative and at the forefront of industry trends to enhance complimentary service offerings.
Create curated complimentary services and marketing collateral to meet demand.
Collaborate with local stakeholders on health and public


7 OUT OF 10
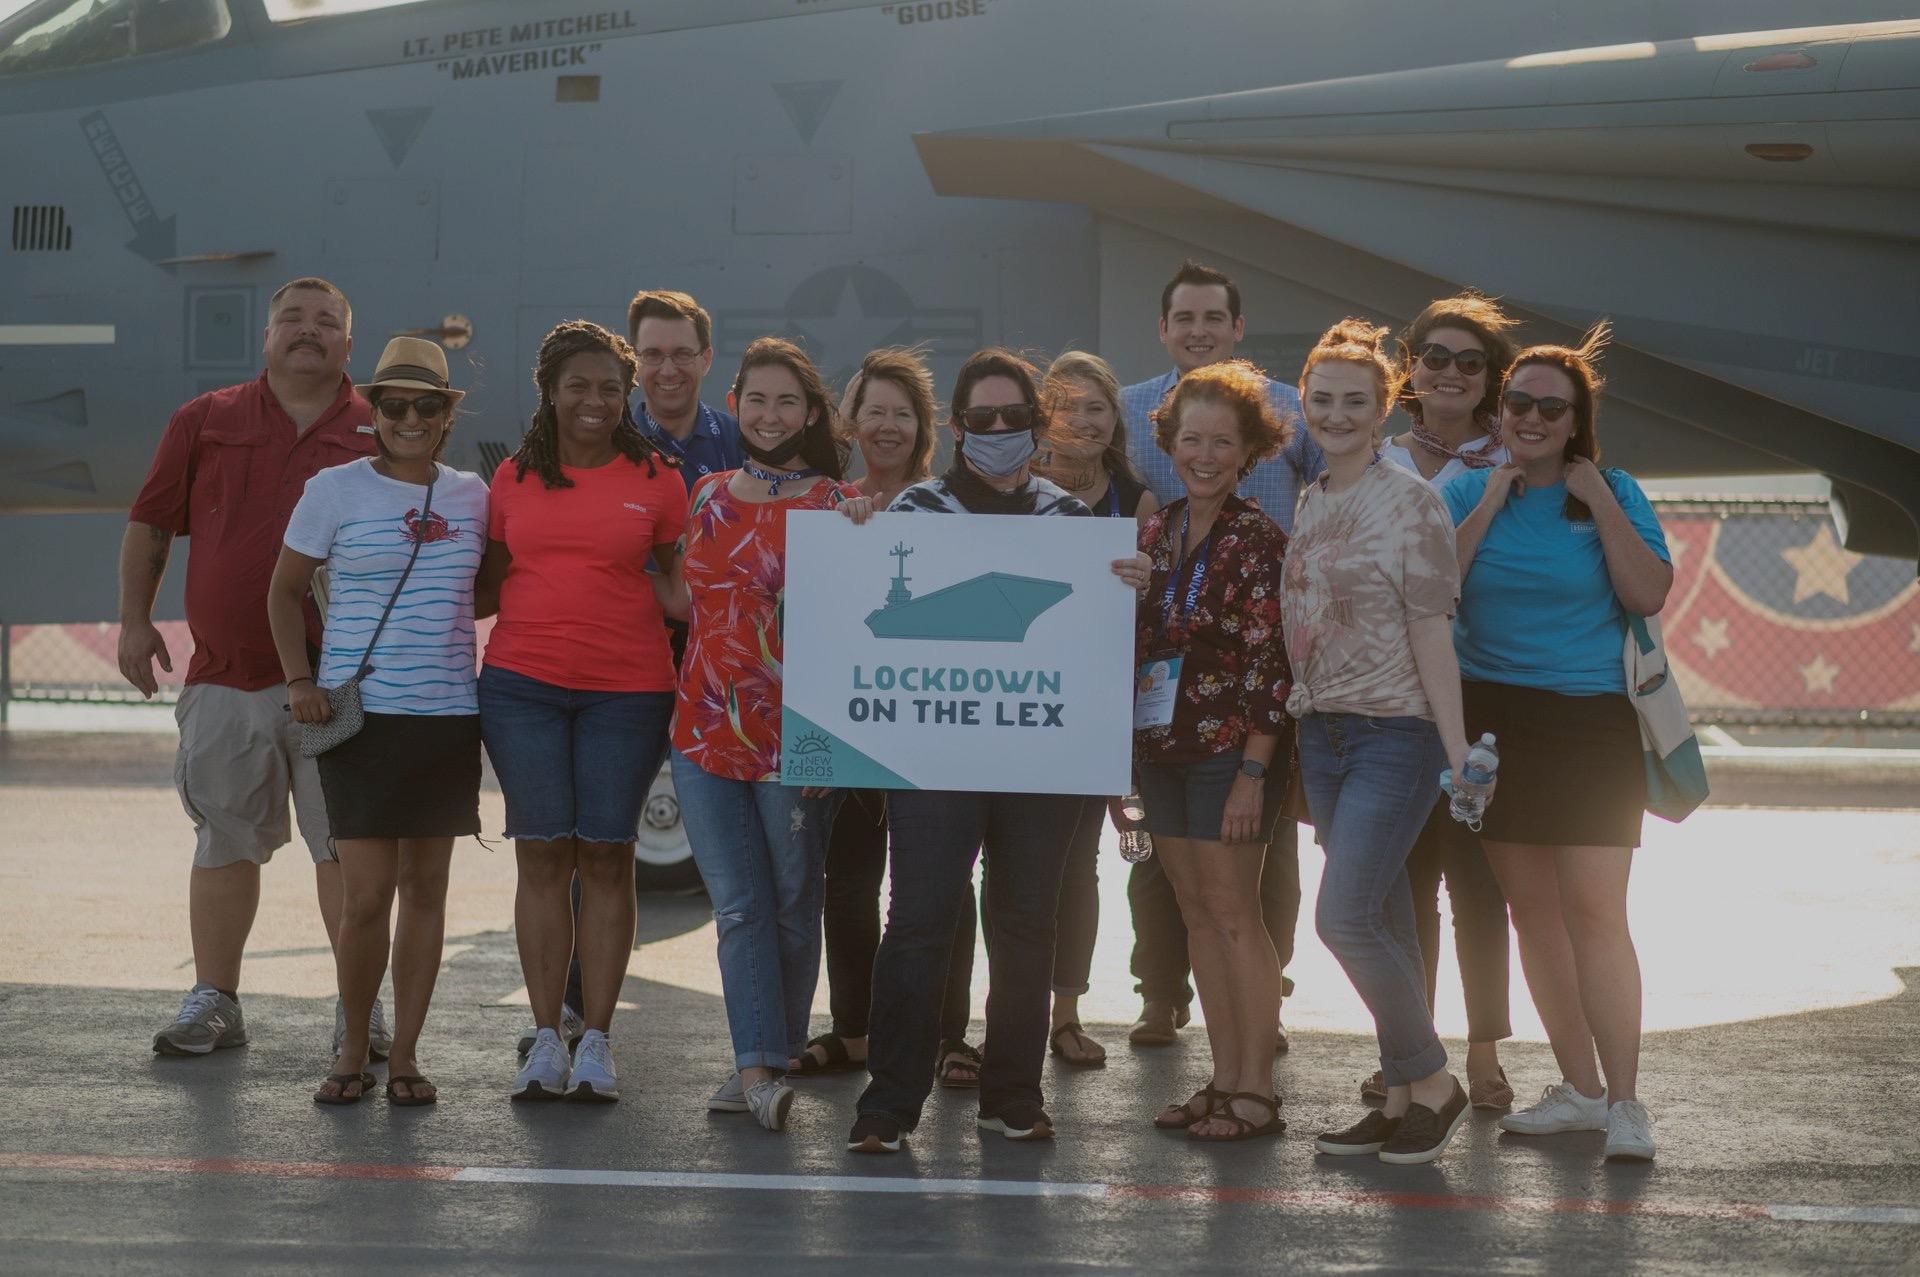
ATTENDEES EXPRESSED INTEREST COMING BACK FOR A LEISURE TRIP.
SIGNATURE EXPERIENCES
Group incentive program
$51.87
84 , 000 attendees spending
$50 million in local businesses
INSERT KSP GMID VIDEO

Nicole Olivares, Vice President of Sales & Services cell: 361-549-6582 email: nicole@visitcorpuschristi.com Thank you!


meetings
Global
Industry day


 President and CEO
Visit corpus Christi


 President and CEO
Visit corpus Christi


 Corpus Christi


 SUZZANNE RAVITZ


 Corpus Christi

 Providence
Grand Rapids
Oklahoma City
Chattanooga
Lexington Buffalo
Corpus Christi


