GULF COAST CAPITAL


quarterly data report


The first quarter of the fiscal year brought with it some familiar trends from the last. Hotel performance was about level to the last year, while short term rentals experienced consistent increases in demand both here and elsewhere on the Texas coast. However, we ' ve recently started to see a decline in the number of short term rental listings - that's good news for operators, as it means less competition. Only time will tell how long that decline in supply will continue and if we'll start to see an increase in listings as we enter busier times of year.
Looking ahead at those busier times of year, spring break is closer than it appears. Recent surveys from MMGY have found that many leisure travelers are less likely to fly this year due to recent flight service incidents - this might be good news for Corpus Christi, where the vast majority of visitors currently drive.


In the lull between spring break and summer beginning to ramp up, we'll see SkillsUSA bring over 2,000 people to Corpus Christi. These times of year, when leisure travel slows down a little, are exactly when groups this size can make a real impact. They'll fill hotel rooms that wouldn't already be occupied by leisure travel, and they'll bring visitors to local attractions, restaurants and businesses when they need it most.
It is, as always, that kind of broader impact that we want to focus on. Travel doesn't just mean heads in beds, it brings money to local businesses and the city economy in general. It accounts for 8% of the city's entire expenses Our marketing plan for the year reflects this, with an increase in visitor spend being the overarching goal rather than just an increase in visitor volume.
Larger industry trends indicate that, counterintuitively, economic conditions might make this year the perfect time for that goal. People are viewing travel as more expensive, and while this is causing some people to opt not to travel this year, it also means the people that are traveling are planning to spend more on their trips. In fact, those that intend to travel aren't even planning on taking fewer trips. They're prioritizing travel, even though they see it as more expensive, and planning to spend more accordingly. Our goal is to target those people and show them how much Corpus Christi has to offer as a vacation destination and a community.


Travelers here and nationwide are concerned about the economy in the near future.
34% The percieved affordability of travel has dropped
since this time last year
Prospective travelers in lower income brackets are most likely to cut travel.
% of people planning to travel for leisure in the next 12 months by income bracket
However, the people who are planning to travel are planning to take the same number of trips and spend more on them.
TRIPS
3.9 planned in the next year, same as this time last year
SPEND
$3.6k planned on leisure travel, up from $2.75K last year

Data via mmgy portrait of the american traveler survey and str hotel forecasts
Recent widespread issues with flight experiences have caused a drop in flight interest.
48% say they're less likely to fly in the next nine months due to recent incidents.
76% are planning a road trip this year
In turn, this means more people are planning road trips. This is good news for Corpus Christi, where most visitors drive.
44% are more likely to drive this summer due to recent incidents.
STR's forecasts, built on recent hotel performance here and elsewhere, predict growth in hotel demand this year.
+5% year-over-year increase in hotel occupancy predicted by STR 2023 Corpus Christi forecasts
In combination with short term rental demand continuing to outpace last year, travel demand seems positive despite economic concerns.

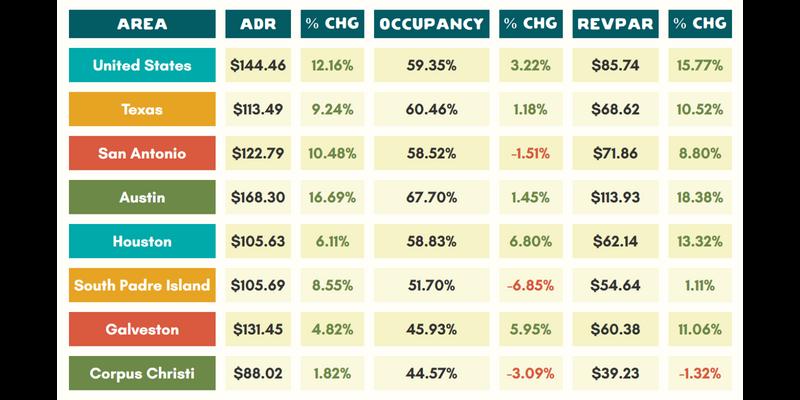

Rates in October outpaced last year before leveling off towards the end of the quarter.
-2%

2021
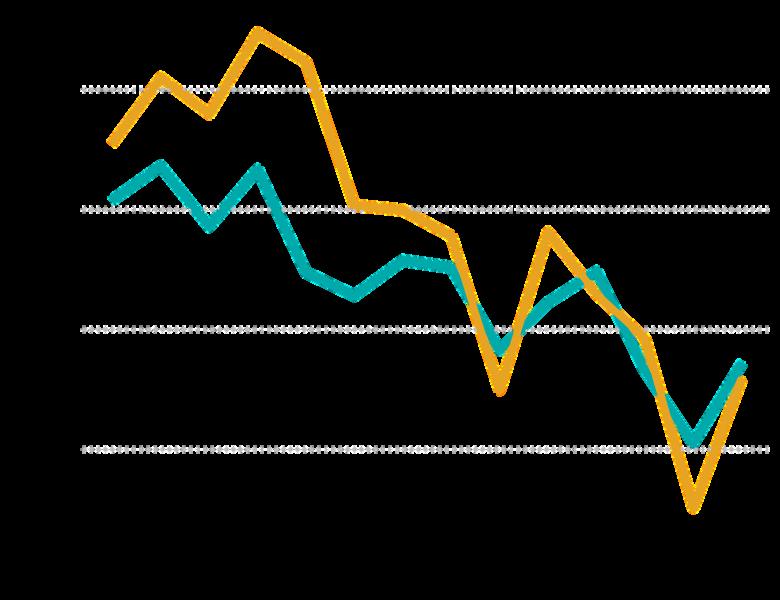
Occupancy rates were very similar to last year other than decline in the first few weeks of October.
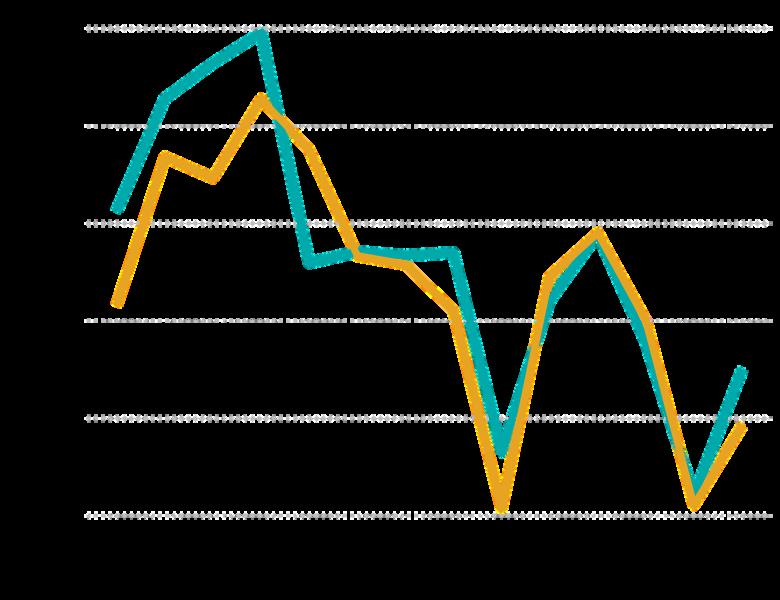
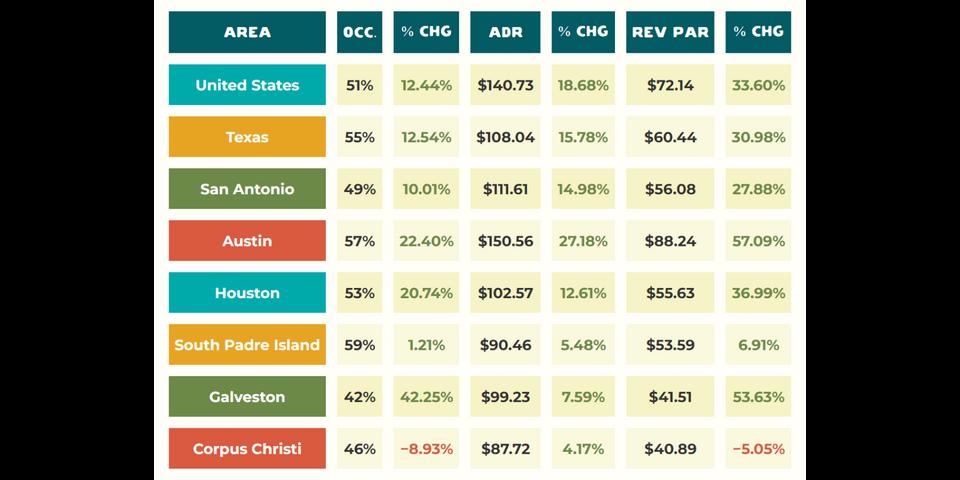
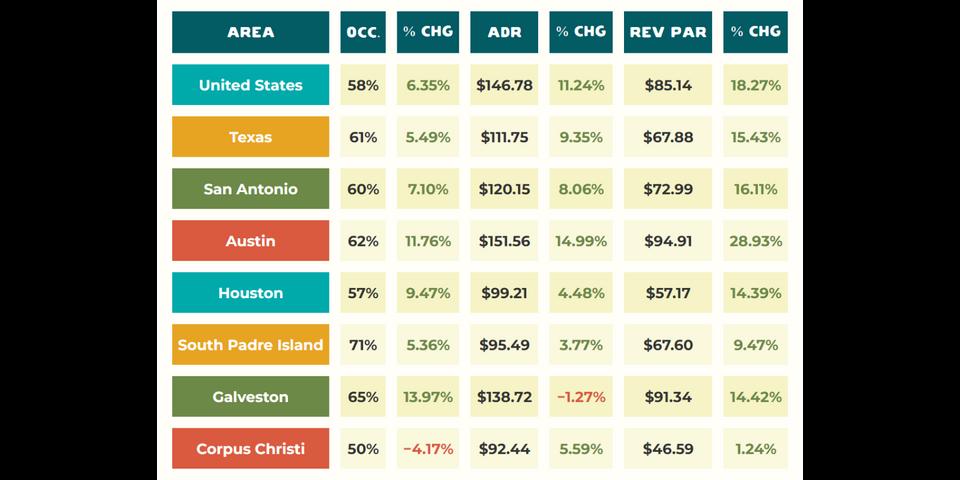
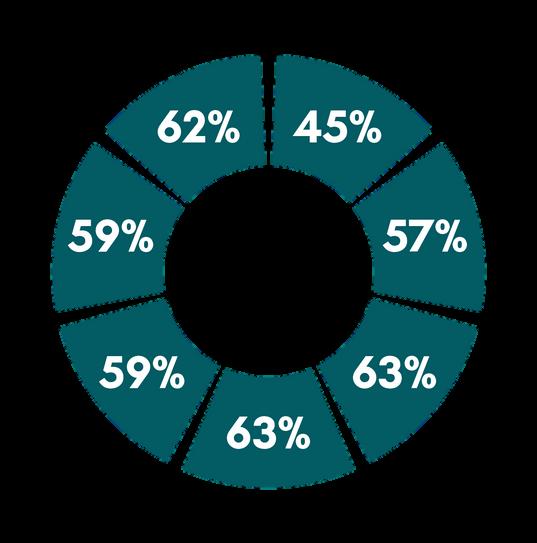
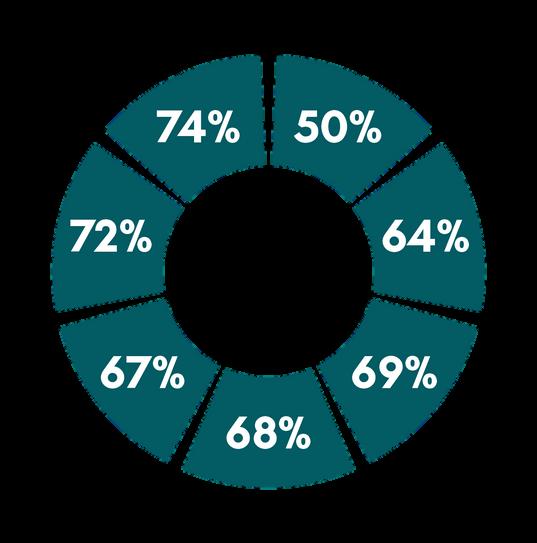
Occupancy forecasts are based on historical patterns and recent trends. January forecasts include actual data for the majority of the month.
Room rate forecasts are a 3%-5% increase above 2022 citywide averages. Hotels should aim to match this to keep pace with recent industry trends.
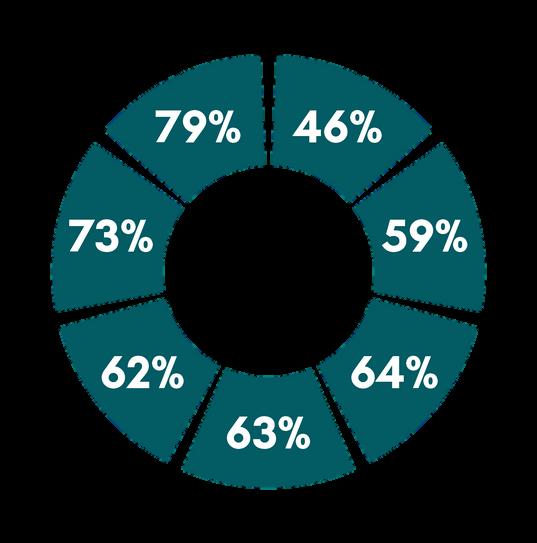

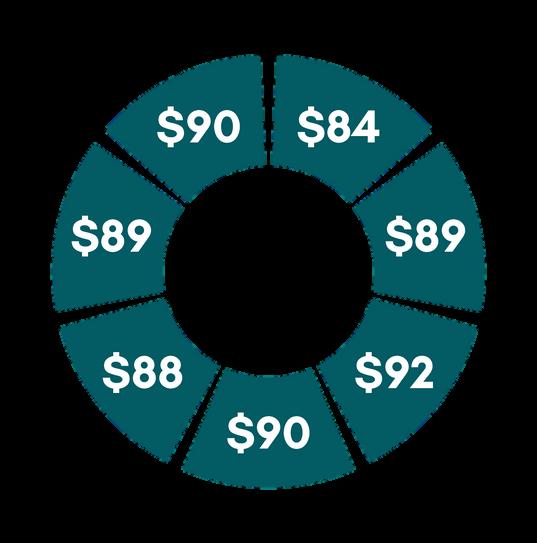

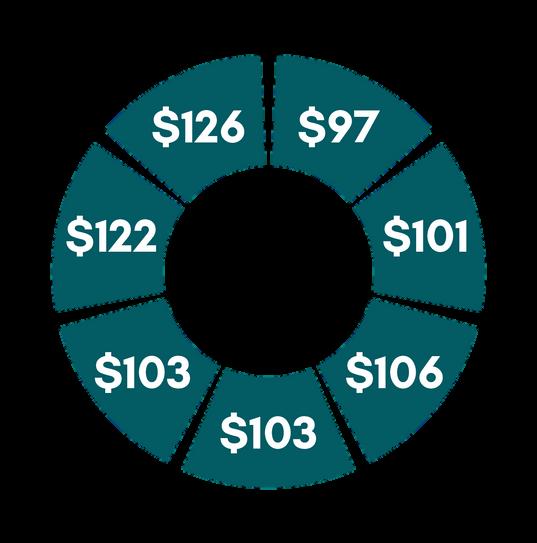
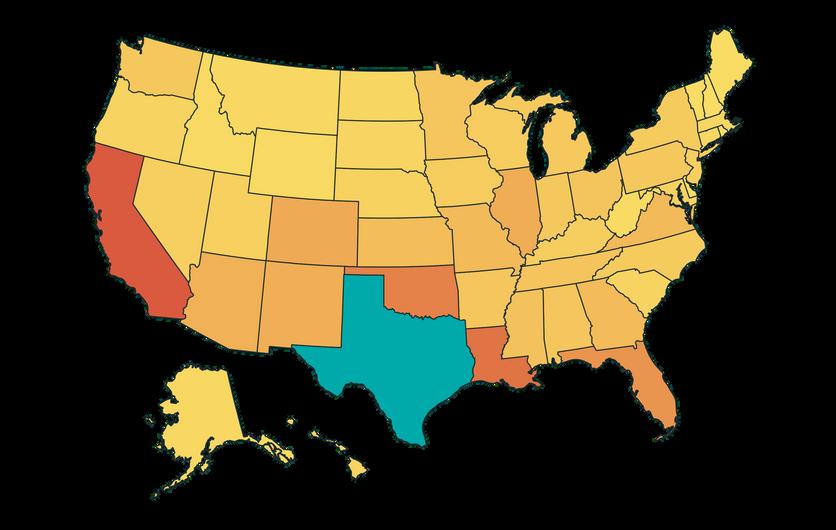
Advertising in recent months has focused attracting visitors from colder areas in the Midwest such as Chicago and Minneapolis and bringing perennial snowbird visitors to the valley up to Corpus to see how the city has grown

This past quarter, we have seen increases in the share of visitors from the valley as well as increases in visitors from the Chicago area.
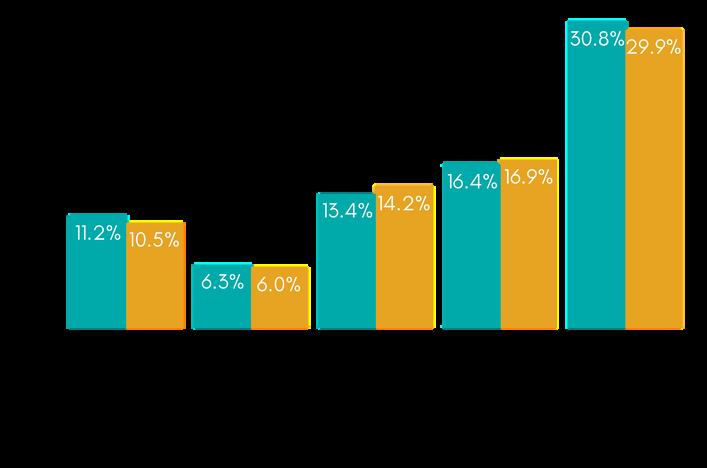
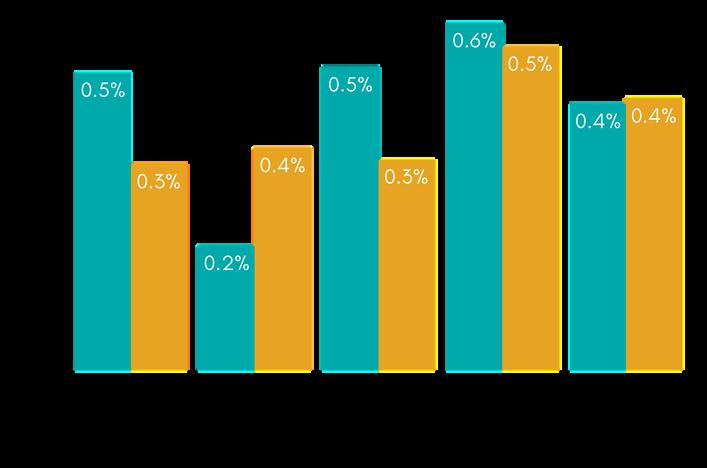
Last Year This Year
m a r k e t s
t o p t e x a s
People who saw our ads were 65% more likely to visit
65% t o p o u t o f s t a t e
m a r k e t s
Darker red means more visitors from state in Q1
After rebounding to pre-COVID levels during summer, leisure & hospitality employment in Corpus Christi has begun to grow beyond 2019's employment levels
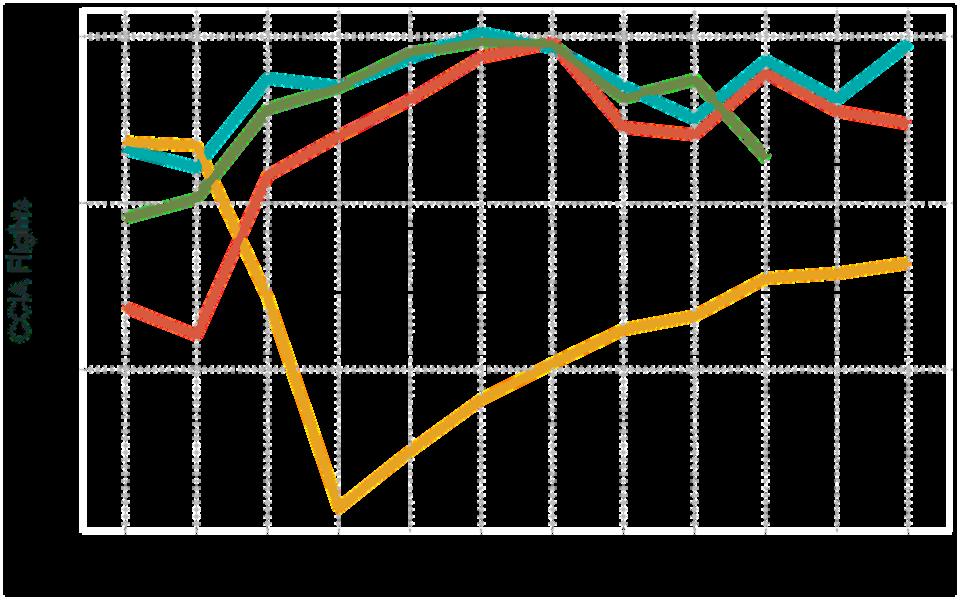
data via Bureau of Transportation Statistics
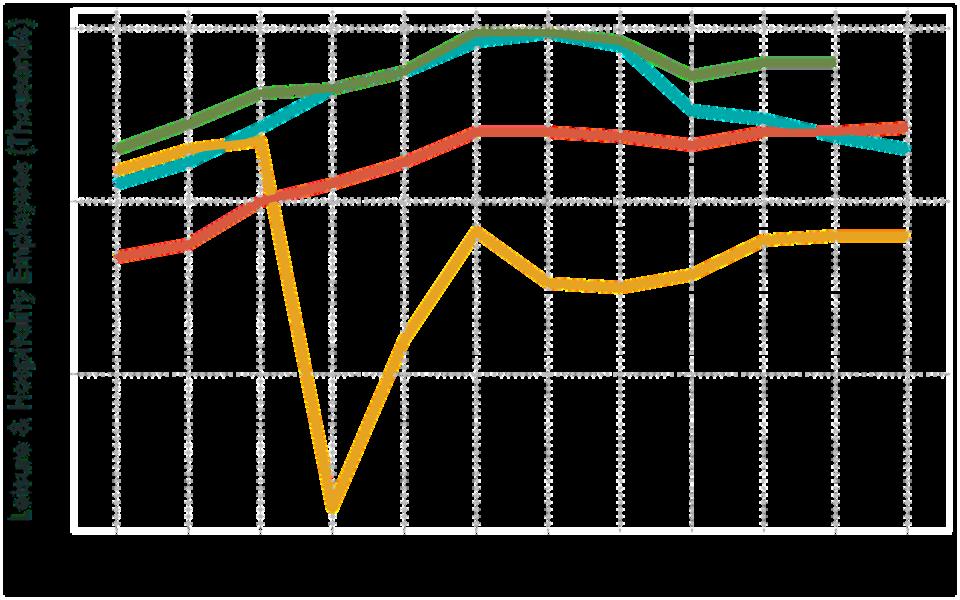
data via Bureau of Labor Statistics 2022 2020
After returning to pre-COVID levels during summer, flight volume took a dip in October. Consumer surveys indicate Southwest issues during the holidays might cause future declines in traveler flight intentions
Short term rental demand is continuing to increase.
Notably, short term rental supply is starting to level off. Only time will tell if this will last; we might see listings increase as we get into busier times of year.
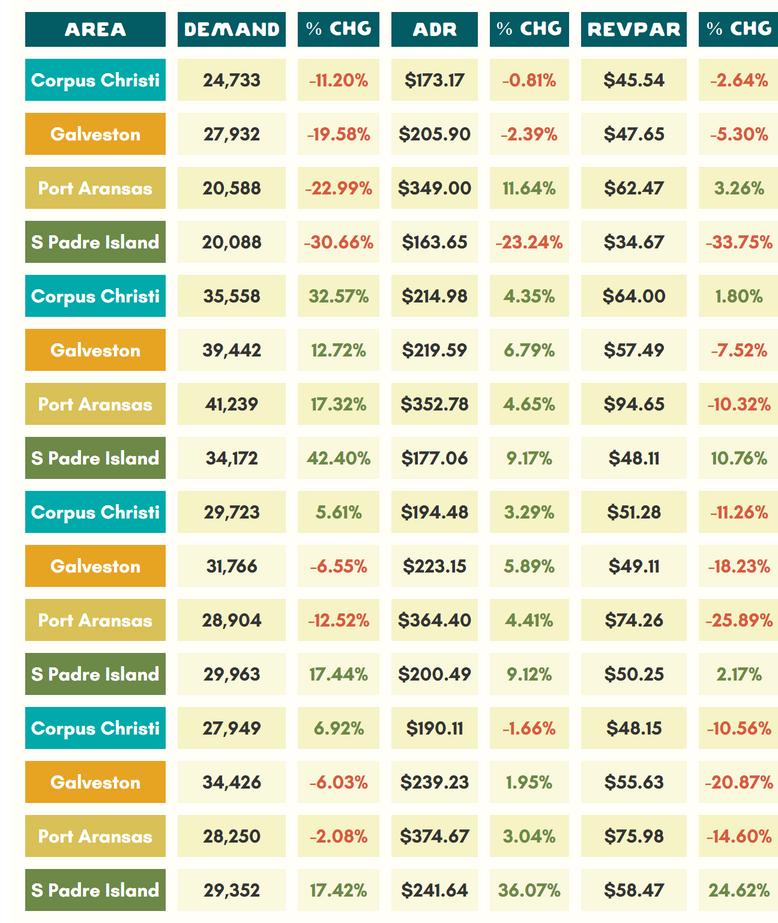
Still, Corpus Christi is seeing the largest demand increases, but the lowest rate increases.

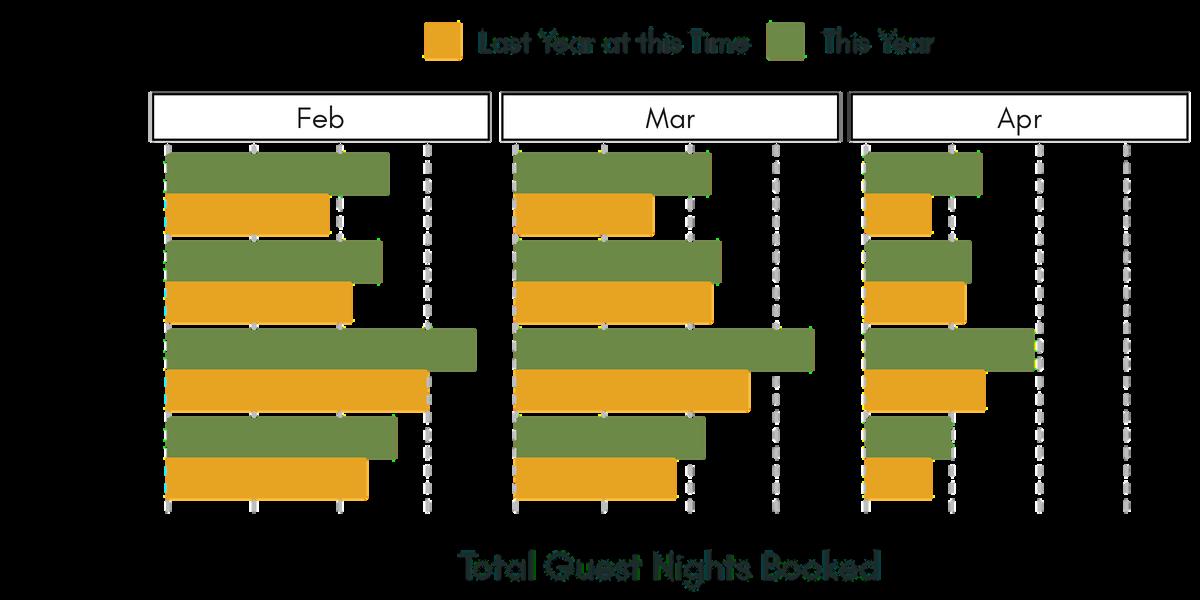
This trend looks like it will continue, with future bookings outpacing last year ' s bookings at this time across the Texas coast.
This has been the case for the last several quarters. While demand will surely level out at some point, pacing indicates it won't be next quarter.
While Corpus has fewer short term rental stays than South Padre or Port Aransas, it has many more hotels, so it has the most visitation of these places in total.

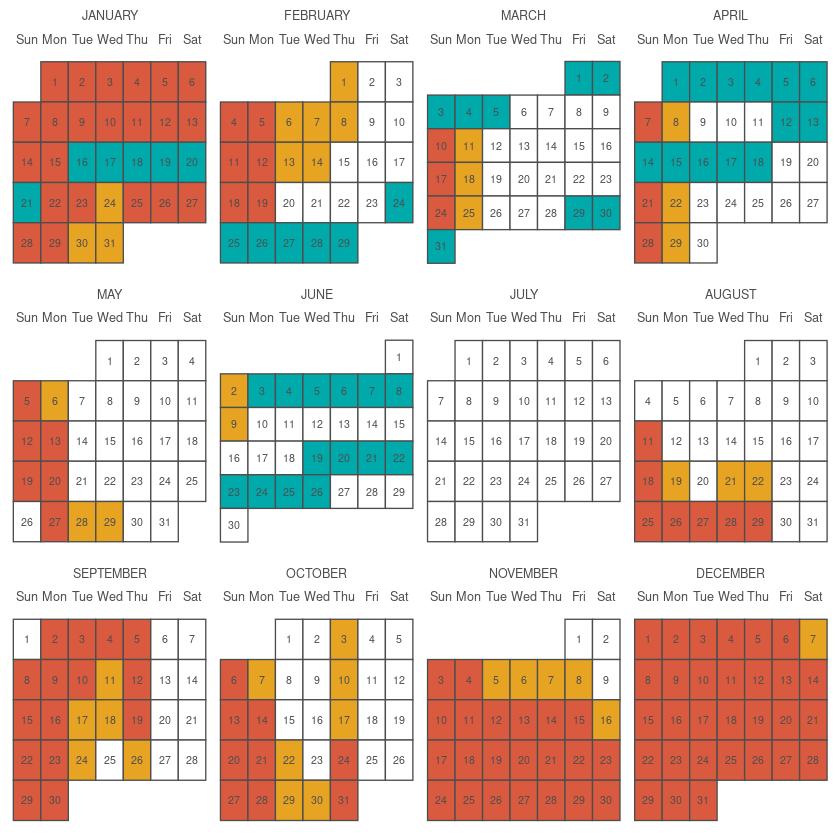
Our strategy is to bring visitors to Corpus Christi when our community benefits from their impact the most: during slower times of year To accomplish this, we use a need date calendar based on seasonal projections to help monitor our progress. Projected occupancy rates below 55% are marked as medium need (orange); below 50% are marked high need (red).
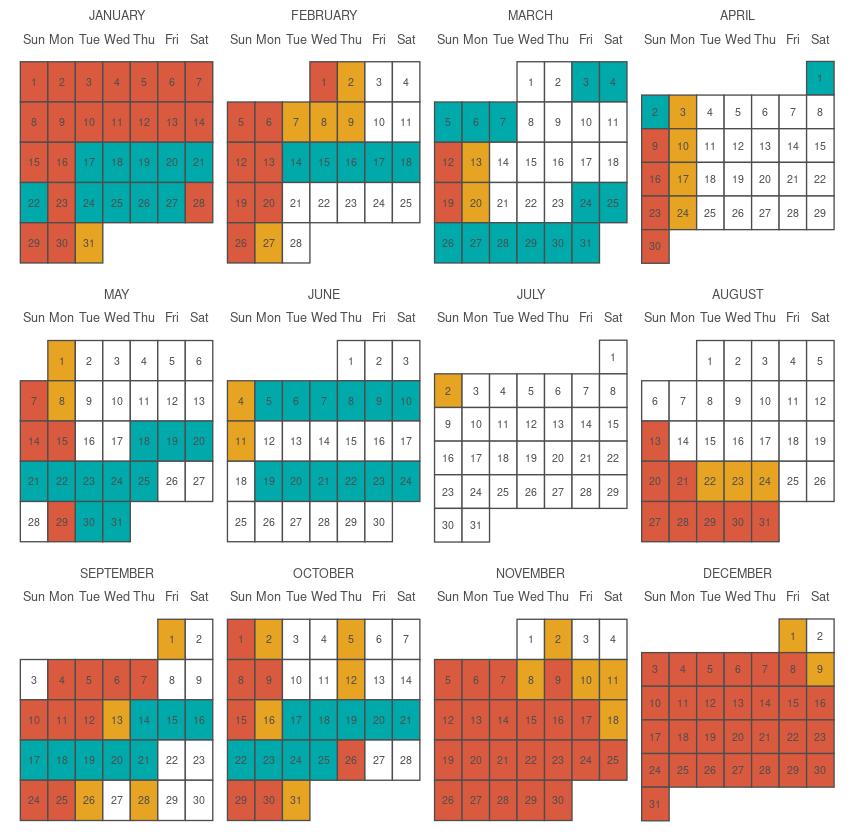
The calendar does not depict effects of all holidays, but they are always taken into account when booking groups. Only very large groups are blocked off on the calendar which represent dates for which we can no longer book further group business - we have booked business for dates elsewhere, but will continue to try to fill those dates.
