
2 minute read
Marketing


Jackson Tourism generated $10.9M in total tax revenue for federal, state & local taxes.
Local Tax Total $1.5M
MS Tax Total
Federal Tax Total $4.0M
$5.4M
0 4 8 12
Millions Tourism offset local property tax by $1.5 million
Total tax revenue
generated by travel spending for federal, state & local governments:
Local: $10.9 million MS: $1 billion Federal: $179.7 billion
In 2020, Visit Jackson’s marketing efforts focused on revitalizing the destination brand, introducing the strategic destination pillars, strengthening the reputation of the organization, showcasing Jackson’s diversity and multicultural offerings, all while maintaining steady growth in traditional advertising and marketing KPIs.
As soon as COVID-19 cases were being reported in Mississippi, Visit Jackson paused (eventually, stopping) all ongoing advertising. Creative messaging was developed and deployed to support public health information, partner and stakeholder updates, and short-term marketing campaigns.
Eventually, Visit Jackson started inviting people to visit the City With Soul in a safe manner which culminated with the Tourism Recovery Fund that launched in late September.
Jackson
Baton Rouge Mobile
Target Markets
Social Media Channels
Twitter • Engagements – up 253% YOY • Impressions – up 210% YOY
Facebook • Engagements – up 38.4% YOY • Impressions – down 44.8% YOY
Instagram • Engagements – up 37.1% YOY • Impressions – up 2.1% YOY
Soul Sessions • Podcasts - 7 • Plays - 409 YouTube • Views 52,055 (previous year, 125,635) • Watch Time – 5,783.50 hours (previous 1,691.70 hours) • Published Videos - 9
Websites
Visitjackson.com • Sessions - down 22.45% (91,023 vs. 117.376) YOY • Pageviews - up 38.56% (304,125 vs. 219,493) YOY • Session duration - up 51.01% (2:28 vs. 1:38) YOY • Organic searches – down 41.93% (22,132 vs. 38,111) YOY
My City
JXN.MS • Sessions - up 239.24% (52,464 vs. 15,465) • Pageviews – up 205.54% (65,189 vs. 21,336) • Session duration down 28.94% (:36 vs. :50) • Organic searches –up 518.50% (3,043 vs. 492)
MyCity TV • Episodes – 30 • Total Views – 36,914
Email Marketing
• Sends – 120,723 (vs. 14,527 in FY19) • Open Rate – 23% (29% in FY19) • Click Rate – 14% (15% in FY19)

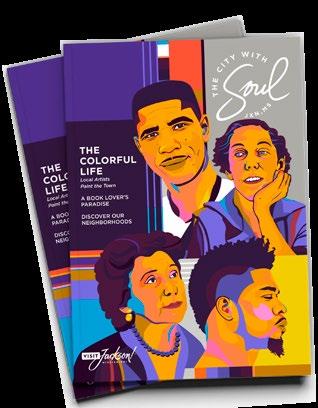
Visitor Guides Distributed TOTAL Partners/ Contacts Groups Inquiries
18,871 5,646 10,101 3,053
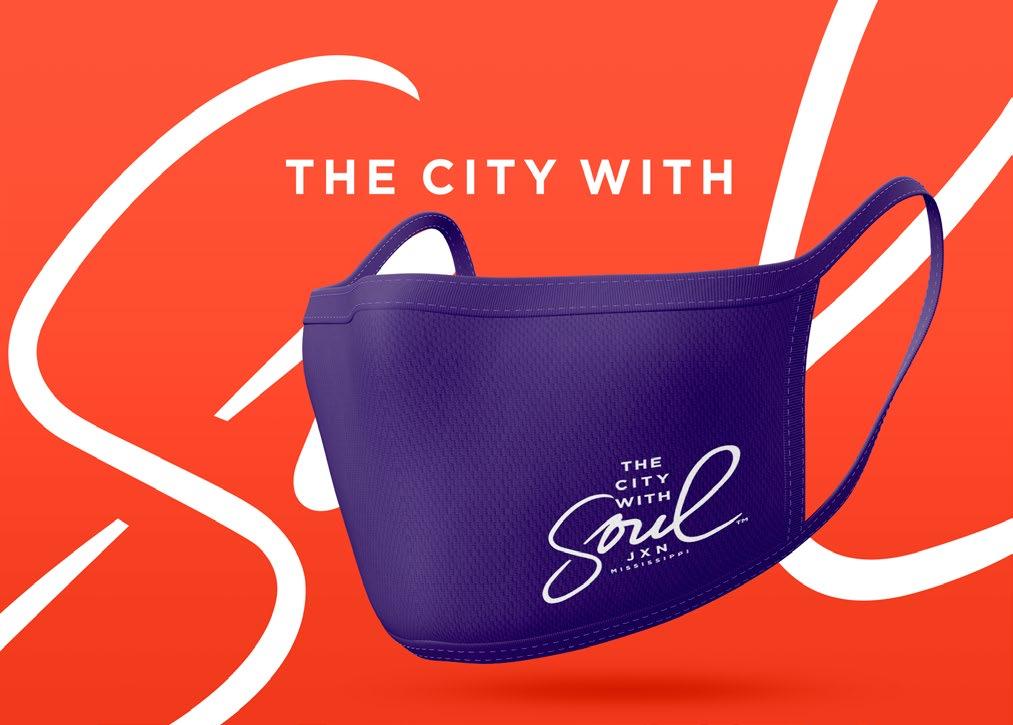
Masks 4,723 4,807 650 286
Hand Sanitizers 8,871 10,389 7,671 206
Inquiries/Visitor Guides
3,053 Visitors Guides requested and mailed in addition to 1,193 Tour Guide reads on e-reader. Supplied 18,871 Visitors Guides to meetings and convention delegates.


