The Economic Impact of Travel

California
2022p (preliminary)

April 2023
PREPARED FOR Visit California
Page intentionally blank

The Economic Impact of Travel in California 2022p (preliminary) Visit California 4/13/2023 PRIMARY RESEARCH CONDUCTED BY Dean Runyan Associates 833 SW 11th Avenue Suite 920 Portland, Oregon 97205
Table
Contents Introduction....................................................................................................................................................... 5 National Impacts............................................................................................................................................... 6 National Spending.....................................................................................................................................7 National Employment................................................................................................................................8 International Spending.............................................................................................................................. 9 State Impacts.................................................................................................................................................... 10 Summary...................................................................................................................................................11 Spending...................................................................................................................................................12 Direct Spending (Inflation Adjusted)..........................................................................................................13 Visitor Spending by Commodity................................................................................................................14 Visitor Spending by Accommodation Type................................................................................................14 Earnings....................................................................................................................................................15 Employment.............................................................................................................................................. 16 Tax Receipts............................................................................................................................................. 17 State and Local Government Tax Revenues............................................................................................ 18 Industry Gross Domestic Product and Taxes............................................................................................19 Total and Visitor-Generated Taxable Sales.............................................................................................. 20 State & Local Tax Revenue Per Household..............................................................................................21 Impacts Table, Summary.......................................................................................................................... 23 Impacts Table, Detailed (Spending)..........................................................................................................24 Impacts Table, Detailed (Earnings, Employment, Tax Receipts)..............................................................25 Traveler Origin...........................................................................................................................................26 Air Travel & Employment Trend................................................................................................................27 Travel Gross Domestic Product (GDP).....................................................................................................28 Secondary Effects.....................................................................................................................................29 Region Impacts................................................................................................................................................. 32 County Impacts................................................................................................................................................. 74 Glossary.......................................................................................................................................................... 270 Methodology......................................................................................................................................................271
of
Purpose of the Report

This report was commissioned by Visit California to assess the economic impact of travel to the state of California. The travel industry represents an important component of California's state economy. Spending associated with travel in California generates earnings, employment, and taxes throughout the state. Many counties in California contain attractive travel destinations and count the travel industry as a primary economic industry in their area. This report describes the economic activity associated with travel throughout the state, detailing important trends within the industry.
How to Use the Report
This report brings together data collected from many sources, both public and private, that are relevant to the measurement of travel throughout California. Our analysis synthesizes the data and generates estimates for the impact of travel to counties in the state. We encourage the reader of this report to use the table of contents to navigate to the section of the report that is relevant to their concerns and to reach out to Dean Runyan Associates with any questions on further detail or clarification.
2022 Considerations
Inflation hit multi-decade highs globally. These increased costs for goods and services also affected the travel industry. Spending growth is representative of visitor activity and the effects of price increases.
The California travel economy reached new highs across most categories in 2022. Continued demand for overnight accommodations and increased price inflation led to large gains in visitor spending. This increased spending and a tight labor market contributed to an increase in employee earnings, with both having a cumulative effect on increased tax revenue. Employment has recovered to 93% of peak employment reached in 2019.
Spending, Employment, Earnings, and Taxes
are the key metrics to measure the economic impacts of travel.

What are travel impacts?
Travel impacts measure the economic activity associated with the activity of travel within a region. As travel is a broad activity that encompasses many other activities (transportation, lodging, eating & drinking, recreational activities, etc.), it is necessary to make estimates for each of the composite elements of travel in order to arrive at a total number. Reporting on travel impacts allows decision-makers to benchmark the travel industry against other local industries, gain insight on the makeup of traveler activity in their region, and communicate clearly to stakeholders the relevance of the traveler economy to their region.
Introduction
The Economic Impact of Travel in California / 2022p / Prepared by Dean Runyan Associates 5

2022p
National Impacts
National / Summary

U.S. Travel Impacts 2022 Preliminary
The COVID-19 pandemic brought economic disruption to almost all sectors of the U.S. economy in 2020, but few industries were as hard hit as travel. The combination of economic instability and health and safety measures in the U.S. led to a large reduction in the demand for such services. Total travel output decreased by 47% (-$632B) in 2020, as compared to 2019 levels. In 2022 travel activity continued the recovery expansion started in mid-late 2020. By the end of the year, travel output exceeded 2019 levels of activity by 3%.
At the time of this report, the Bureau of Economic Analysis (BEA) Tourism Satellite Account covered travel activity through 2021; all 2022 estimates have been made by Dean Runyan Associates.
Ÿ Direct travel output by resident and foreign visitors was $1,226 billion in 2022. This represents a 24% increase over 2021. When adjusted for inflation (real dollars), spending increased by 16% from 2021 to 2022.
Ÿ Leisure & Hospitality categories make up 44% of travel spending in the U.S. in 2022.
The U.S. travel industry expanded 24% ($238B) in 2022. Travel spending is 3% higher than in 2019.
0 200 400 600 800 1,000 1,200 1,400 200020022004200620082010201220142016201820202022 Current Inflation Adjusted Output ($Billions) Direct Travel Output 2000-2022p 0 100 200 300 400 500 600 2000 2002 2004 2006 2008 2010 2012 2014 2016 2018 2020 2022 Spending ($Millions) Spending by Summary Commodity 2000-2022p Leisure & Hospitality Retail Transportation The Economic Impact of Travel in California / 2022p / Prepared by Dean Runyan Associates 7
National / Summary

International Spending 2022p
Travel Spending ($ Billions)
While international spending is up 88% relative to 2021, most regions are still lagging compared to 2019 levels of travel activity. Travel from Asia & Pacific was especially limited in 2022, as travel restrictions related to COVID-19 remained in effect for much of the year. The increased cost of airline travel associated with inflation of oil prices also had a major impact on international travel.
Sources: Dean Runyan Associates, Bureau of Economic Analysis
0 5 10 15 20 25 30 35 40 45 50 Africa Asia & Pacific Canada Europe Lat. Am excl Mexico Mexico Middle East 2019 2020 2021 2022
The Economic Impact of Travel in California / 2022p / Prepared by
Runyan Associates 8
Dean
U.S. Travel Industry Direct Employment

Employment in the travel industry continues to recover nationally. Nearly a half million jobs were gained in 2022, a year-over-year increase of 11%.
U.S. Travel Industry Employment by Sector
In 2022, Leisure and Hospitality jobs remained 16% below the pre-pandemic level in 2019. Approximately 640,000 jobs are needed to get back to past levels of employment.
National / Summary
0 1 2 3 4 5 6 7 2000 2002 2004 2006 2008 2010 2012 2014 2016 2018 2020 2022 E mployment (Millions)
Sources: Bureau of Economic Analysis, Dean Runyan Associates
0.0 0.5 1.0 1.5 2.0 2.5 3.0 3.5 4.0 4.5 2001 2003 2005 2007 2009 2011 2013 2015 2017 2019 2021 E mployment (Million)
Leisure & Hospitality Transportation Retail & Other
The Economic Impact of Travel in California / 2022p / Prepared by Dean Runyan Associates 9
Sources: Bureau of Economic Analysis, Dean Runyan Associates
State Impacts 2022p
Travel Impacts 2022p
31.7% Increase in Travel Spending


Travel spending in California increased 31.7% from $102.0 billion in 2021 to $134.4 billion in 2022.
156,900 Jobs Gained

Direct travel-generated employment gained approximately 156,900 jobs, a 16.8% increase in travel-generated employment compared to 2021.
20.8% Growth in Travel Earnings
Direct travel-generated earnings added $9.5 billion in 2022, a 20.8% increase compared to 2021.
25.3% Increase in Tax Revenue
Tax receipts generated by travel spending were up 25.3% compared to 2021.
Note: These estimates for California are subject to revision when more complete or additional data becomes available.
California / Summary
The Economic Impact of Travel in California / 2022p / Prepared
Runyan Associates 11
by Dean
California / Spending
Direct Travel Spending
Direct travel spending increased by $32.4 billion in 2022.
Direct travel spending increases in top 5 regions.
Destination + Other Travel = Direct Travel Spending
What is direct travel spending?
In 2022, travel spending grew to $134.4 billion, a 31.7% increase from the prior year.
Since the peak of 2019, travel spending has declined by 7.2%.
All 5 of the travel regions that generate the highest travel spending in California grew in 2022. The growth rate of the top 5 regions was 36.3%, compared to a growth rate of 31.7% for the state as a whole.
The top 5 regions contribute 74.4% of direct travel spending in the state.
Direct travel spending includes both destination spending and other spending. Destination spending refers to all spending on goods and services by visitors at the destination. Other travel spending refers to expenditures at travel arrangement companies located in California, convention and trade show operations, and spending on air by residents to leave the state for travel elsewhere. These expenditures directly support the travel industry but are not considered visitor spending in our methodology.
0B 20B 40B 60B 80B 100B 120B 140B 160B 1992199419961998200020022004200620082010201220142016201820202022
0B 8B 16B 24B 32B 40B San
Los
Orange County San Diego County Central Coast 2022 2021 The Economic Impact of Travel in California / 2022p / Prepared by Dean Runyan Associates 12
Francisco Bay Area
Angeles County
California / Spending
Direct Spending / Current and Inflation Adjusted Dollars
How does inflation affect the travel industry?
Inflation is the rate of increase in prices of goods and services. An increase in the rate of inflation translates into reduced purchasing power for consumers. To track the quantity of goods and services that consumers purchase when they travel, we report the “Inflation
Adjusted” travel spending in the chart to the left. This is also known as “real” spending, as it shows the quantity of goods and services that were purchased while keeping the purchasing power constant across time.
U.S. CPI (annual % chg.)
2021: 4.6%
2022: 8.6%
Target: 2% Annually
Direct travel spending in 2022 totaled $134.4 billion, only 7.2% below pre-pandemic levels in 2019. However, taking into account the reduced purchasing power of the dollar associated with recent inflation, the true quantity of goods and services purchased by travelers still lags 2019 levels by approximately 20.8%.
Sources: Dean Runyan Associates, Bureau of Labor Statistics CPI
California 2022 Selected Prices (% Chg.)
Hotel & STVR Room Rates: 18%
Gasoline Prices: 25%
Air Fares: 23%
0 20 40 60 80 100 120 140 160 180 2010 2011 2012 2013 2014 2015 2016 2017 2018 2019 2020 2021 2022 Travel Spending ($ Billions)
Current Inflation
(2022 Dollars)
Adjusted
The Economic Impact of Travel in California / 2022p / Prepared by Dean Runyan Associates 13
California / Spending
Spending on accommodations grew to $31.8 billion in 2022, an increase of 36.1%, and the highest amount of spending of all commodities.
Spending on food service added an additional $30.0 billion, an increase of 18.1%.
Visitors who stayed in a hotel, motel, or short term vacation rental (STVR) spent a combined $67.6 billion in 2022, an increase of 25.7% compared to 2021.
Spending by Commodity Purchased 0B 5B 10B 15B 20B 25B 30B 35B 31.8B 14.4B 30.0B 4.6B 17.6B 15.8B 6.1B 23.3B 12.3B 25.4B 3.8B 12.9B 12.8B 3.0B Accommodations Arts, Ent. & Rec. Food Service Food Stores Local Tran. & Gas Retail Sales Visitor Air Tran. Visitor Spending ($)
Visitor
2022 2021 Visitor Spending by Accommodation Type 0B 10B 20B 30B 40B 50B 60B 70B 67.6B 21.9B 20.0B 6.4B 4.3B 53.8B 12.6B 17.4B 6.5B 3.3B Hotel, Motel, STVR Day Travel Private Home 2nd Home Campground Visitor Spending ($Billions)
2022 2021 Sources: Dean Runyan Associates, Omnitrak Group, Energy Information Administration, Bureau of Labor Statistics CPI, STR LLC. The Economic Impact of Travel in California / 2022p / Prepared by Dean Runyan Associates 14
California / Earnings
Direct Travel Earnings
Direct travel earnings increased by $9.5 billion in 2022.
Component sectors of the travel industry show mixed rates of growth.
(Revenue - Cost of Goods SoldExpenses - Point of Sale Taxes) = Earnings
What are direct travel-related earnings?
Direct travel-related earnings represent the total after-point of sale tax income from travel activity. It includes wage and salary disbursements, proprietor income, and other earned income or benefits.
In 2021, regional travel earnings grew to $55.1 billion, a 20.8% increase from the prior year.
Since 2019, travel industry earnings has increased by 0.7%.
Accommodation & Food Services (ACM & FS) grew at the fastest rate (25.5%) of the primary sectors that make up the travel industry. Arts, and Entertainment, Recreation (AER), grew by 22.7%.
Earnings are an important measure of the benefit of the travel industry that flow to proprietors and employees. Because the travel industry is highly labor intensive, much of travel-related earnings flow to workers in the form of wages as opposed to owners of capital and intellectual property assets.
0B 10B 20B 30B 40B 50B 60B 1992199419961998200020022004200620082010201220142016201820202022
Accommodation
Food Services
Entertainment, Recreation
0B 8B 16B 24B 32B ACM & FS AER Other Travel Retail Visitor Air Ground Tran. 2022 2021 The Economic Impact of Travel in California / 2022p / Prepared by Dean Runyan Associates 15
&
(ACM & FS) Arts,
(AER)
California / Employment
Direct Travel Employment
Direct travel employment increased by 156,900 jobs in 2022.
Accommodations and Food Services accounted for 56% of the gain.
What is direct travel employment?

Direct travel-related employment refers to the total number of full and part-time jobs directly attributable to travel spending. A significant share of many industries’ earnings come from travel-related spending. Part of these earnings are used to pay employees in the form of income and benefits. Based on average salaries for employees in the various travel-related industries in California, a total employment number attributable to travel can be reached.
1992199419961998200020022004200620082010201220142016201820202022
The travel industry supported approximately 1.09 million jobs in 2022, a 16.8% increase from the prior year.
Since 2019, travel industry employment has declined by 7.3%.
Employment in the Accommodations and Food Services sector totaled 627,200 in 2022, a gain of 88,100 jobs (16.3%) from 2021. Arts, Entertainment, and Recreation grew at the highest rate, gaining 57,400 jobs (27.7%).
Accommodation & Food Services (ACM & FS) Arts, Entertainment, Recreation (AER)
In 2022, every $1 million in travel-related spending resulted in 8.1 jobs for the industry.
0.0M 0.2M 0.4M 0.6M 0.8M 1.0M 1.2M
0K 200K 400K 600K 800K ACM & FS AER Retail Other Travel Ground Tran. Visitor Air 2022 2021 The Economic Impact of Travel in California / 2022p / Prepared by Dean Runyan Associates 16
California / Tax Receipts
Direct Travel-Generated Tax Revenue
Direct travel-generated tax revenue increased by $3.9 billion in 2022.
Tax revenue increases across state and local sources.
What are direct travel-generated tax receipts?
Direct travel-generated tax receipts include state and local taxes related to travel.State taxes include lodging taxes, motor fuel taxes, and sales taxes, as well as business and personal taxes paid by employees and proprietors of travel-related businesses. Local taxes primarily take the form of lodging taxes imposed by cities, counties, and other tax jurisdictions in California. They also include any applicable local sales tax.
1992199419961998200020022004200620082010201220142016201820202022
Travel-generated tax revenue increased to $19.4 billion in 2022, an increase of 25.3% from the prior year.
Since the peak year of 2019, travel-generated tax revenue has fallen by 3.5%.
In 2022, state tax receipts grew 17.8%, while local tax receipts grew 25.0%. The stronger growth in local tax receipts is largely attributable to local sales and transient lodging tax revenue.
Travel-generated state and local tax revenue generated approximately $906 per California household in 2022.
0B 3B 6B 9B 12B 15B 18B 21B 24B
0B 2B 4B 6B 8B Federal Tax Receipts Local Tax Receipts State Tax Receipts 2022 2021 The Economic Impact of Travel in California / 2022p / Prepared by Dean Runyan Associates 17
California / Travel Industry Tax Revenue
Travel Industry State and Local Government Tax Revenues, 2021-2022 FY
The distribution of taxes generated by the travel industry for the 2021-2022 fiscal year is shown in the following chart. Sales tax receipts are distinguished between those that are generated by visitor spending and those that are generated by the spending of travel industry employees.
State and Local Tax Revenue by Category ($Millions)
Visitor Sales 65.3% $7,098
Employee Sales 14.2% $1,548
Income 4.6% $504
Property 14.7% $1,598
Other 1.2% $128
Total: 100.0% $10,876
Source: Dean Runyan Associates. "Other" travel generated tax revenue includes passenger facility charges for visitors who travel to California airports.
Approximately 65.3% of the tax revenue generated by travel related spending is attributable to sales taxes paid by visitors. An additional 14.2% of tax revenue is raised through sales taxes on the consumption of goods and services by employees within the travel industry. Income taxes contribute 4.6% of total tax revenue. Property taxes applied to businesses involved in the travel industry generated approximately $1.6 billion (14.7% of total). The remainder of taxes generated directly by travel is categorized as "Other" and includes passenger facility charges for visitors who travel to California airports.
The Economic Impact of Travel in California / 2022p / Prepared by Dean Runyan Associates 18
California / Travel Industry Tax Revenue
Industry Gross Domestic Product and Taxes, 2021 CY
One way to consider the contributions of various industries is to express the tax payments of businesses to government as a percentage of their Gross Domestic Product. Both figures highlight these tax payments for a sample of goods-producing and service sectors in the state, including travel.
Taxes on production and imports (TOPI) includes most taxes paid by businesses except for income taxes. Industries with negative TOPI amounts are due to subsidies in excess of production and import taxes.
Production & Import Taxes as a Percent of GDP, Selected Industries, 2021 CY
& Import Taxes as a Percent of GDP
Source: Bureau of Economic Analysis and Dean Runyan Associates
TOPI denotes taxes on production and imports less subsidies.
Industry GDP (Millions) TOPI (Millions) Percent Information $362,002 $4,353 1.2% Construction $124,565 $21 0.0% Health care and social assistance $222,235 -$508 -0.2% Manufacturing $394,828 $10,420 2.6% Retail trade $178,862 $37,508 21.0% Travel $83,796 $3,327 4.0% All industry total $3,373,241 $168,091 5.0%
Production
0% 1% 2% 3% 4% 5% 6% All industry total Others Percent of GDP Travel All industry total Others The Economic Impact of Travel in California / 2022p / Prepared by Dean Runyan Associates 19
California / Travel Industry Tax Revenue
Total and Visitor-Generated Taxable Sales, 2022 CY
County Percent Percent Total (Millions) County Travel (Millions) Total (Millions) Travel (Millions) Alameda $44,052 $1,358 3.1% Alpine $31 $7 22.8% Amador $624 $57 9.2% Butte $4,689 $133 2.8% Calaveras $629 $68 10.9% Colusa $584 $21 3.6% Contra Costa $22,441 $751 3.3% Del Norte $372 $54 14.5% El Dorado $3,363 $313 9.3% Fresno $24,211 $626 2.6% Glenn $641 $25 3.9% Humboldt $2,319 $181 7.8% Imperial $3,579 $204 5.7% Inyo $470 $66 14.1% Kern $22,758 $798 3.5% Kings $2,641 $103 3.9% Lake $811 $72 8.8% Lassen $377 $31 8.1% Los Angeles $212,781 $8,811 4.1% Madera $2,620 $119 4.6% Marin $6,527 $246 3.8% Mariposa $257 $67 26.3% Mendocino $1,847 $163 8.8% Merced $4,360 $130 3.0% Modoc $121 $11 9.4% Mono $446 $109 24.5% Monterey $9,278 $1,128 12.2% Napa $4,620 $579 12.5% Nevada $1,963 $149 7.6% Orange $87,596 $5,045 5.8% Placer $13,351 $458 3.4% Plumas $363 $51 14.2% Riverside $61,908 $3,540 5.7% Sacramento $36,380 $1,379 3.8% San Benito $1,030 $60 5.8% San Bernardino $59,745 $2,157 3.6% San Diego $79,995 $3,800 4.8% San Francisco $19,574 $3,191 16.3% San Joaquin $23,425 $528 2.3% San Luis Obispo $7,023 $749 10.7% San Mateo $21,852 $1,900 8.7% Santa Barbara $9,793 $686 7.0% Santa Clara $57,492 $2,118 3.7% Santa Cruz $4,817 $627 13.0% Shasta $4,176 $175 4.2% Sierra $34 $5 15.7% Siskiyou $853 $75 8.8% Solano $10,378 $364 3.5% Sonoma $12,154 $825 6.8% Stanislaus $12,972 $258 2.0% Sutter $2,348 $43 1.8% Tehama $1,170 $68 5.8% Trinity $129 $18 14.4% Tulare $11,664 $198 1.7% Tuolumne $1,014 $89 8.8% Ventura $18,862 $746 4.0% Yolo $5,875 $180 3.1% Yuba $1,024 $49 4.8% The Economic Impact of Travel in California / 2022p / Prepared
Runyan Associates 20
by Dean
California / Travel Industry Tax Revenue
Local Tax Revenue
Household,
County Local (Millions) State (Millions) Total (Millions) Households (000's) Tax Per Household Alameda $188.2 $161.6 $349.9 591.9 $591 Alpine $1.1 $0.8 $2.0 0.5 $3,705 Amador $6.4 $7.9 $14.3 15.8 $903 Butte $10.3 $18.0 $28.2 82.7 $341 Calaveras $8.5 $10.7 $19.1 19.1 $999 Colusa $1.6 $2.4 $3.9 7.2 $545 Contra Costa $58.2 $94.9 $153.1 412.8 $371 Del Norte $6.9 $7.1 $14.0 9.7 $1,442 El Dorado $54.7 $45.8 $100.6 74.7 $1,346 Fresno $49.7 $80.7 $130.5 313.6 $416 Glenn $2.0 $3.0 $5.0 10.0 $500 Humboldt $25.0 $24.1 $49.1 56.4 $871 Imperial $15.4 $24.4 $39.8 50.4 $789 Inyo $12.3 $8.9 $21.2 8.2 $2,578 Kern $58.5 $102.1 $160.7 276.8 $581 Kings $5.8 $12.6 $18.3 41.4 $443 Lake $4.7 $8.4 $13.1 28.1 $467 Lassen $2.1 $3.6 $5.7 9.5 $598 Los Angeles $1,606.1 $1,161.4 $2,767.5 3,232.8 $856 Madera $16.6 $17.2 $33.8 45.6 $741 Marin $41.5 $31.5 $73.0 105.9 $690 Mariposa $25.3 $10.8 $36.1 7.2 $5,014 Mendocino $26.5 $20.8 $47.3 36.2 $1,305 Merced $10.2 $18.1 $28.3 84.1 $336 Modoc $0.9 $1.4 $2.3 3.6 $640 Mono $44.2 $16.9 $61.1 5.3 $11,428 Monterey $176.0 $131.3 $307.3 131.9 $2,330 Napa $114.9 $68.7 $183.6 48.5 $3,784 Nevada $20.0 $18.3 $38.3 43.4 $883 The Economic Impact of Travel in California / 2022p / Prepared by Dean Runyan Associates 21
State &
per
2022p CY
California / Travel Industry Tax Revenue
State & Local Tax Revenue per Household, 2022p CY County Local (Millions) State (Millions) Total (Millions) Households (000's) Tax Per Household Orange $743.6 $547.0 $1,290.5 1,039.1 $1,242 Placer $59.9 $60.2 $120.2 155.7 $772 Plumas $5.1 $6.4 $11.5 8.9 $1,287 Riverside $337.9 $389.3 $727.2 763.8 $952 Sacramento $136.8 $165.2 $302.0 572.5 $527 San Benito $5.5 $7.1 $12.6 20.1 $627 San Bernardino $183.0 $253.9 $436.9 655.5 $666 San Diego $690.2 $451.5 $1,141.8 1,147.0 $995 San Francisco $529.3 $349.7 $879.0 348.8 $2,520 San Joaquin $45.4 $64.2 $109.6 246.2 $445 San Luis Obispo $115.6 $90.0 $205.6 106.7 $1,927 San Mateo $245.7 $196.0 $441.7 263.5 $1,677 Santa Barbara $122.5 $84.7 $207.2 149.0 $1,390 Santa Clara $264.9 $237.2 $502.1 635.7 $790 Santa Cruz $69.5 $63.7 $133.3 95.7 $1,393 Shasta $19.1 $23.5 $42.6 72.0 $592 Sierra $0.8 $0.7 $1.5 1.5 $972 Siskiyou $7.9 $9.2 $17.1 19.1 $898 Solano $27.2 $41.3 $68.5 154.2 $444 Sonoma $130.1 $92.8 $222.9 185.7 $1,200 Stanislaus $20.0 $35.2 $55.2 176.7 $312 Sutter $3.4 $6.2 $9.6 32.8 $294 Tehama $5.1 $8.2 $13.3 24.4 $545 Trinity $1.5 $2.7 $4.2 7.1 $596 Tulare $22.8 $28.7 $51.5 139.9 $368 Tuolumne $10.5 $10.8 $21.3 22.3 $954 Ventura $65.7 $87.5 $153.2 270.8 $566 Yolo $16.5 $21.9 $38.4 76.2 $504 Yuba $3.1 $6.7 $9.8 27.9 $351 $6,482 $5,455 $11,937 $13,173 $906 California The Economic Impact of Travel in California / 2022p / Prepared
Runyan Associates 22
by Dean
California / Impacts, Summary
Details may not add to totals due to rounding. Percent change calculated on unrounded figures. Earnings and Employment include CARES act support, data limitations prevent disaggregation.
Direct Travel Impacts 2013-2022p 2013 2014 2015 2016 2017 2018 2019 2020 2021 2022 2021-22 2019-22 Spending ($Billions) 111.7 117.4 121.9 126.4 133.3 140.3 144.9 68.5 102.0 134.4 31.7% Total (Current $) p -7.2% q 9.3 10.0 10.7 11.5 12.3 13.1 13.8 7.1 8.5 14.2 66.1% Other p 2.9% p 102.4 107.4 111.3 114.9 121.0 127.3 131.1 61.3 93.5 120.2 28.6% Visitor p -8.3% q Earnings ($Billions) 35.9 38.1 41.4 46.1 49.4 52.3 54.7 41.3 45.6 55.1 20.8% Earnings (Current $) p 0.7% p Employment (000's) 997 1,028 1,063 1,110 1,144 1,163 1,177 871 933 1,090 16.8% Employment p -7.3% q Tax Revenue ($Billions) 14.8 15.6 16.5 17.4 18.1 19.3 20.1 12.2 15.5 19.4 25.3% Total (Current $) p -3.6% q 9.1 9.7 10.1 10.5 10.9 11.8 12.3 7.4 9.8 11.9 21.6% Total Local & State p -3.0% q 4.1 4.5 4.9 5.3 5.6 6.1 6.3 3.9 5.2 6.5 25.0% Local p 3.1% p 2.9 3.2 3.5 3.7 4.0 4.4 4.5 2.1 3.2 4.4 37.4% Visitor p -2.1% q 1.3 1.3 1.4 1.5 1.6 1.7 1.8 1.8 2.0 2.1 4.8% Business/Employee p 16.1% p 5.0 5.2 5.2 5.3 5.3 5.7 6.0 3.5 4.6 5.5 17.8% State p -9.3% q 3.7 3.9 3.8 3.8 3.9 4.3 4.6 2.1 3.1 3.7 21.2% Visitor p -18.0%q 1.2 1.3 1.4 1.5 1.4 1.4 1.5 1.4 1.5 1.7 11.0% Business/Employee p 17.8% p 5.6 6.0 6.4 6.9 7.1 7.5 7.8 4.8 5.7 7.5 31.8% Federal p -4.5% q
The Economic Impact of Travel in California / 2022p / Prepared
Runyan Associates 23
by Dean
California / Impacts, Detailed
Details may not add to totals due to rounding. Percent change calculated on unrounded figures.
*Other Travel includes resident air travel, travel arrangment, and convention/ trade shows.
Direct Travel Impacts 2013-2022p 2013 2014 2015 2016 2017 2018 2019 2020 2021 2022 2021-2022 Direct Travel Spending ($Billions) 102.4 107.4 111.3 114.9 121.0 127.3 131.1 61.3 93.5 120.2 Destination Spending 28.6% p 9.3 10.0 10.7 11.5 12.3 13.1 13.8 7.1 8.5 14.2 Other Travel* 66.1% p 111.7 TOTAL 117.4 121.9 126.4 133.3 140.3 144.9 68.5 102.0 134.4 31.7% p Visitor Spending by Type of Traveler Accommodation ($Billions) 55.4 59.7 63.7 67.3 70.5 72.8 74.2 36.4 53.8 67.6 Hotel, Motel, STVR 25.7% p 15.7 16.1 15.9 15.8 17.2 19.0 20.3 7.2 17.4 20.0 Private Home 14.7% p 2.5 2.6 2.6 2.6 2.7 2.9 3.2 2.6 3.3 4.3 Campground 29.6% p 4.2 4.3 4.3 4.3 4.6 5.0 5.1 7.2 6.5 6.4 2nd Home -0.3% q 24.6 24.8 24.8 24.9 26.0 27.6 28.3 7.9 12.6 21.9 Day Travel 74.7% p 102.4 TOTAL 107.4 111.3 114.9 121.0 127.3 131.1 61.3 93.5 120.2 28.6% p Visitor Spending by Commodity Purchased ($Billions) 19.7 22.0 24.3 26.2 27.4 29.0 29.8 15.8 23.3 31.8 Accommodations 36.1% p 26.3 27.2 28.7 30.4 32.0 33.1 34.1 17.1 25.4 30.0 Food Service 18.1% p 3.5 3.6 3.8 3.9 3.9 3.9 4.0 2.2 3.8 4.6 Food Stores 22.7% p 18.3 18.6 17.2 16.0 17.6 19.8 20.4 7.5 12.9 17.6 Local Tran. & Gas 37.1% p 15.6 16.1 16.7 17.4 17.8 18.0 18.1 8.5 12.3 14.4 Arts, Ent. & Rec. 16.9% p 14.0 14.5 15.0 15.3 16.5 17.4 18.3 8.3 12.8 15.8 Retail Sales 22.6% p 5.0 5.4 5.6 5.7 5.8 6.1 6.4 1.8 3.0 6.1 Visitor Air Tran. 104.9% p 102.4 TOTAL 107.4 111.3 114.9 121.0 127.3 131.1 61.3 93.5 120.2 28.6% p
The Economic Impact of Travel in California / 2022p / Prepared by Dean Runyan Associates 24
California / Impacts, Detailed
Details may not add to totals due to rounding. Percent change calculated on unrounded figures.
*Other Travel includes resident air travel, travel arrangement, and convention/ trade shows.
**Retail includes gasoline station employment and earnings.
Direct Travel Impacts 2012-2022p 2012 2014 2015 2016 2017 2018 2019 2020 2021 2022 2021-2022 Travel Industry Earnings ($Billions) 18.1 19.4 21.2 23.4 25.0 26.5 27.9 20.4 24.1 30.3 Accom. & Food Serv. 25.5% p 8.7 9.3 9.9 10.6 11.0 11.3 11.7 7.9 9.3 11.4 Arts, Ent. & Rec. 22.7% p 2.5 2.7 2.8 3.0 3.1 3.3 3.4 3.4 3.7 4.0 Retail** 5.5% p 1.2 1.3 1.4 1.5 1.7 2.2 2.4 1.0 1.0 1.2 Ground Tran. 12.7% p 1.8 1.8 2.0 2.7 3.1 3.2 3.3 3.2 2.6 2.8 Visitor Air Tran. 7.9% p 3.5 3.6 4.0 4.9 5.5 5.9 6.1 5.4 4.8 5.5 Other Travel* 14.5% p 35.9 TOTAL 38.1 41.4 46.1 49.4 52.3 54.7 41.3 45.6 55.1 20.8% p Travel Industry Employment (Thousand Jobs) 572.0 589.6 608.8 632.5 652.0 659.0 662.2 493.4 539.1 627.2 Accom. & Food Serv. 16.3% p 243.1 252.4 261.3 270.8 276.8 279.4 283.1 179.3 207.3 264.7 Arts, Ent. & Rec. 27.7% p 78.9 82.2 83.5 85.8 87.3 87.9 87.4 82.9 85.0 86.1 Retail** 1.2% p 31.2 31.6 32.7 34.0 35.1 42.3 45.9 34.3 33.5 38.8 Ground Tran. 15.7% p 22.7 22.8 24.2 27.5 30.2 30.7 32.1 28.1 23.0 23.4 Visitor Air Tran. 1.8% p 49.4 49.8 52.6 59.0 62.4 63.6 66.1 53.3 45.6 50.2 Other Travel* 10.1% p 997.3 TOTAL 1,028.4 1,063.1 1,109.6 1,143.8 1,163.0 1,176.8 871.3 933.5 1,090.4 16.8% p Tax Receipts Generated by Travel Spending ($Billions) 4.1 4.5 4.9 5.3 5.6 6.1 6.3 3.9 5.2 6.5 Local Tax Receipts 25.0% p 5.0 5.2 5.2 5.3 5.3 5.7 6.0 3.5 4.6 5.5 State Tax Receipts 17.8% p 5.6 6.0 6.4 6.9 7.1 7.5 7.8 4.8 5.7 7.5 Federal Tax Receipts 31.8% p 14.8 TOTAL 15.6 16.5 17.4 18.1 19.3 20.1 12.2 15.5 19.4 25.3% p
The Economic Impact of Travel in California / 2022p / Prepared by Dean Runyan Associates 25
California / Traveler Origin
Visitor Spending by Origin, 2022p
Residents of California accounted for 45% of all travel spending in California in 2022. U.S. residents of states other than California accounted for approximately 41% while international visitors accounted for 14% of travel spending in the state.
International spending has historically constituted 18-22% of total travel spending in California. Following the COVID-19 pandemic, which resulted in travel restrictions to the U.S. from multiple large travel markets, the share of international spending recovered to 14% in 2022.
International spending impacts for California were derived from the U.S. International Transaction estimates from the Bureau of Economic Analysis (BEA) and origin & destination counts from the National Travel and Tourism Office. Spending for 2016-2022 is sourced from Tourism Economics.
International Visitor Spending 0B 4B 8B 12B 16B 20B 24B 28B 32B 0% 4% 8% 12% 16% 20% 24% 2010 2012 2014 2016 2018 2020 2022 International Spend Share of Visitor Spending Int ernational Spending ($ USD)
45% 14% 41% California International Other U.S. Visitor Spending by Residence, 2022p Spending (Billions) Origin $53.8 California $17.0 International $49.4 Other U.S. $120.2 Visitor Spending The Economic Impact of Travel in California / 2022p / Prepared by Dean Runyan Associates 26
California / Air Travel & Employment Trend
Air Passenger Visitor Arrivals / U.S. Air Carriers
Sources: Bureau of Transportation Statistics, Dean Runyan Associates
Visitor air travel on domestic flights to California destinations increased by 66% in 2022, from 21.4 million to 35.5 million arrivals.
Travel industry employment increased by 16.8% in 2022, a gain of approximately 156,900 jobs.
0M 5M 10M 15M 20M 25M 30M 35M 40M 45M 2000 2002 2004 2006 2008 2010 2012 2014 2016 2018 2020 2022 Visitor Air Arrivals
Travel Employment
0.0M 0.2M 0.4M 0.6M 0.8M 1.0M 1.2M 2000 2002 2004 2006 2008 2010 2012 2014 2016 2018 2020 2022 Numb er of Jobs Travel Employment
Runyan
The Economic Impact of Travel in California / 2022p / Prepared
Runyan Associates 27
Sources: Dean
Associates
by Dean
California / Travel GDP
Travel Industry GDP, 2022p
Gross Domestic Product (GDP, also referred to as value-added) is a measure of economic activity that reflects the market value of the labor and capital used to produce goods and services. The GDP for a particular industry within a state excludes the intermediate inputs purchased by businesses from other firms in the production process. It includes payments to individual in the form of earnings, indirect business taxes to government, and other payments to individuals and corporations. The relationship between travel spending and the GDP of the California travel industry is shown to the right. California travel industry GDP of $83.2 billion represents approximately 2 percent of the total California GDP.
The estimates represent only the direct impacts of travel spending. A portion of the inputs purchased by travel businesses in California will be delivered by other California firms that are not strictly part of the travel industry. Restaurants, for example, will purchase agricultural products from other California businesses. These inputs are sometimes referred to as "indirect" effects.
0B 20B 40B 60B 80B 100B 120B 140B Spending GDP Travel Spending and GDP of Travel Industry ($ Billions) Earnings Intermed. Inputs Other Value Added The Economic Impact of Travel in California / 2022p / Prepared by Dean Runyan Associates 28
California / Secondary Effects
Travel spending brings money into many California communities in the form of business receipts. Portions of these receipts are spent within the state for labor and supplies. Employees, in turn, spend a portion of their earnings on goods and services in the state. This re-spending of travel-related revenues creates indirect and induced impacts.
Direct impacts represent effects attributable to traveler expenditures.
Indirect impacts represent effects associated with industries that supply goods and services to the direct businesses.
Induced impacts represent effects of purchases made by employees in both the direct and indirect businesses.
The impacts in this section are presented in eleven major industry groups. These industry groups are similar, but not identical to the business categories presented elsewhere in this report.
It should be emphasized that the estimates of indirect and induced impacts reported here apply to the entire state of California and do not necessarily reflect economic patterns for individual counties, regions or sub-regions within the state. In general, geographic areas with lower levels of economic activity will have smaller secondary impacts within those same geographic boundaries.
Largest Secondary Industries 2022p
Professional Services (144,400 jobs and $12.4 billion in earnings) A variety of administrative services (e.g., accounting and advertising) are utilized by travel businesses. Employees of these businesses also purchase professional services.
Education & Health Services (106,300 jobs and $8.5 billion in earnings) The secondary effects are primarily induced, such as employees of travel-related businesses use of medical services.
Financial Activities (86,900 jobs and $6.4 billion in earnings) Both businesses and individuals make use of banking and insurance institutions.
Other Services (53,500 jobs and $3.2 billion in earnings) Employees and travel businesses utilize a number of service providers such as repair shops, laundry, maintenance, and business services.
Full list of industries available in Implan/Secondary Effects on the following two pages.
The Economic Impact of Travel in California / 2022p / Prepared by Dean Runyan Associates 29
California / Secondary Effects
Total Employment 2022p
Values may not add to totals due to rounding. Figures in Thousands.
MOST DIRECT JOBS


0K 100K 200K 300K 400K 500K 600K 700K 800K Accommodation & Food Services Arts, Entertainment & Recreation Retail Trade Professional & Business Services Transportation Natural Resources & Mining Construction Manufacturing & Utilities Information Financial Activities Education & Health Services Other Services Public Administration Direct & Secondary Employment 59% 14% 27% Direct Indirect Induced Share of Total Employment Direct Secondary Secondary Direct Indirect Induced Total Grand Total Industry Group Accommodation & Food Services 627.2 22.5 59.9 82.4 709.6 Arts, Entertainment & Recreation 264.7 32.6 16.1 48.7 313.4 Transportation 88.0 17.2 15.0 32.1 120.1 Retail Trade 86.1 9.1 95.5 104.6 190.6 Professional & Business Services 24.4 84.1 60.4 144.4 168.9 Natural Resources & Mining 0.0 3.7 4.1 7.9 7.9 Construction 0.0 6.1 13.2 19.3 19.3 Manufacturing & Utilities 0.0 14.3 15.8 30.1 30.1 Information 0.0 9.7 8.2 17.9 17.9 Financial Activities 0.0 31.9 55.1 86.9 86.9 Education & Health Services 0.0 1.9 104.3 106.3 106.3 Other Services 0.0 10.3 43.2 53.5 53.5 Public Administration 0.0 5.6 5.8 11.4 11.4 1,090 249 496 745 1,836 All Industries
Accommodation
Professional &
& Food Services
Business Services MOST SECONDARY JOBS
The Economic Impact of Travel in California / 2022p / Prepared by Dean Runyan Associates 30
California / Secondary Effects
Total Earnings 2022p
Values may not add to totals due to rounding. Figures in
MOST DIRECT Earnings
Secondary Direct Indirect Induced Total Grand Total Industry Group Accommodation & Food Services 30.3 0.8 2.2 3.0 33.3 Arts, Entertainment & Recreation 11.4 1.6 0.7 2.3 13.8 Transportation 7.0 1.4 1.1 2.5 9.5 Retail Trade 4.0 0.9 6.1 7.0 10.9 Professional & Business Services 2.5 7.3 5.1 12.4 14.9 Natural Resources & Mining 0.0 0.3 0.4 0.6 0.6 Construction 0.0 0.5 1.2 1.7 1.7 Manufacturing & Utilities 0.0 1.5 1.8 3.3 3.3 Information 0.0 1.9 1.3 3.3 3.3 Financial Activities 0.0 2.3 4.2 6.4 6.4 Education & Health Services 0.0 0.1 8.4 8.5 8.5 Other Services 0.0 0.8 2.3 3.2 3.2 Public Administration 0.0 0.8 0.8 1.6 1.6 55.1 20.2 35.7 55.9 111.0 All Industries
Accommodation & Food
Professional & Business
Services
Services MOST SECONDARY Earnings
0B 5B 10B 15B 20B 25B 30B 35B Accommodation & Food Services Arts, Entertainment & Recreation Retail Trade Professional & Business Services Transportation Natural Resources & Mining Construction Manufacturing & Utilities Information Financial Activities Education & Health Services Other Services Public Administration Direct & Secondary Earnings 50% 18% 32% Direct Indirect Induced Share of Total Earnings Direct Secondary The Economic Impact of Travel in California / 2022p / Prepared by Dean Runyan Associates 31
$Billions
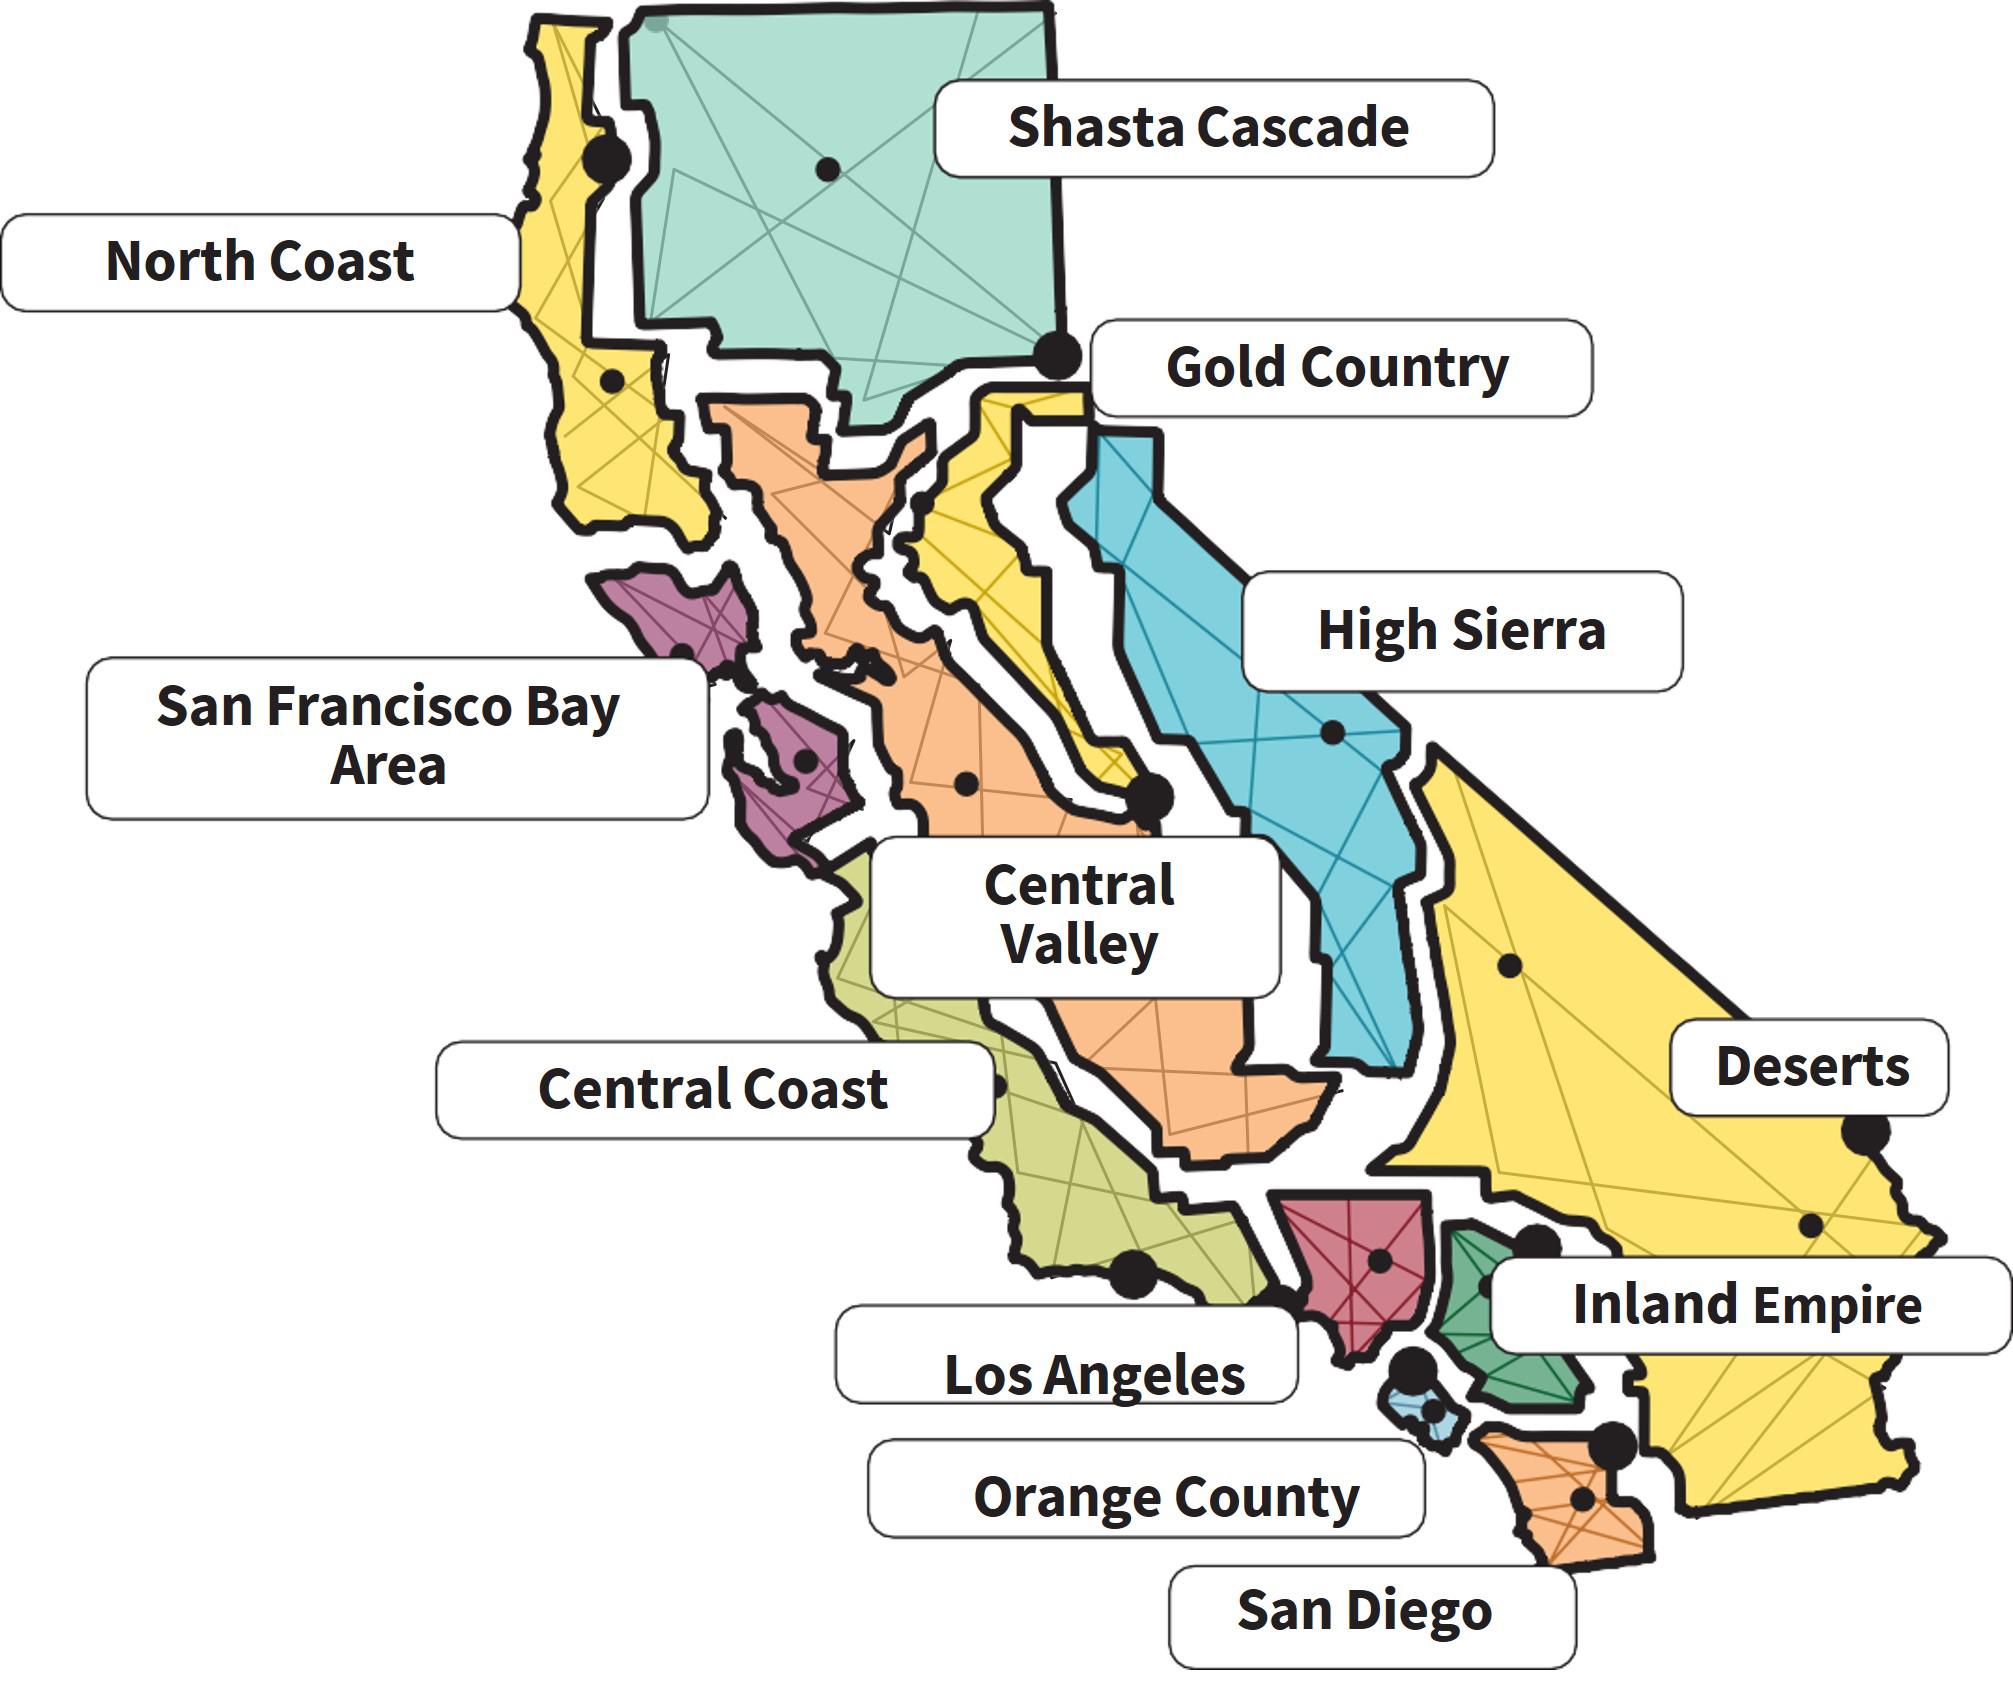
Region Impacts 2022p
Central Coast
Monterey
San Benito
San Luis Obispo
Santa Barbara
Ventura
Central Valley
Colusa
Contra Costa (part)
Fresno (part)
Glenn
Kern (part)
Kings
Madera (part)
Merced
Placer (part)
San Joaquin
Solano (part)
Central Valley (cont.)
Stanislaus
Sutter
Tulare (part)
Tuolumne (part)
Yolo
Yuba
Gold Country
Amador (part)
Calaveras (part)
El Dorado (part)
Madera (part)
Mariposa (part)
Nevada (part)
Placer (part)
Sacramento
High Sierra
Alpine
Amador (part)
Calaveras (part)
El Dorado (part)
Fresno (part)
Inyo (part)
Mariposa (part)
Mono
Nevada (part)
Placer (part)
Sierra
Tulare (part)
Tuolumne (part)
Inland Empire
Riverside (part)
San Bernardino (part)
Los Angeles County
Los Angeles
North Coast
Del Norte
Humboldt
Lake
Mendocino
San Diego County
San Diego
San Francisco Bay
Area
Alameda
Contra Costa (part)
Marin
Napa
San Francisco
San Mateo
Santa Clara
Santa Cruz
Solano (part)
Sonoma
Shasta Cascades
Butte
Lassen
Modoc
Plumas
Shasta
Siskiyou
Tehama
Trinity
The Deserts
Imperial
Inyo (part)
Kern (part)
Riverside (part)
San Bernardino (part)
Orange County
Orange
The Economic Impact of Travel in California / 2022p / Prepared by Dean Runyan Associates 33
Region / Summary
Direct Travel Impacts 2022p
Note: Total Earnings includes wage and salary disbursements, other earned income and proprietor income. Employment includes payroll employees and proprietors.
Travel Spending Total (Millions) Earnings (Millions) Employ. (000's Jobs) Local Tax (Millions) State Tax (Millions) Total Tax (Millions) Visitor (Millions) North Coast $1,300 $617 15.1 $63 $60 $123 $1,258 Shasta Cascade $1,508 $573 16.2 $52 $73 $125 $1,453 San Francisco Bay Area $34,196 $12,818 221.3 $1,646 $1,299 $2,944 $28,481 Central Valley $8,177 $3,121 87.5 $275 $435 $710 $7,600 Gold Country $5,146 $2,003 47.9 $190 $222 $412 $4,307 High Sierra $3,149 $1,401 36.0 $185 $124 $309 $3,071 Central Coast $9,187 $3,842 84.1 $485 $401 $886 $8,809 Los Angeles County $28,493 $14,750 210.8 $1,606 $1,161 $2,767 $22,453 Orange County $14,766 $5,845 125.0 $744 $547 $1,291 $13,174 San Diego County $13,344 $4,734 96.0 $690 $452 $1,142 $11,393 The Deserts $7,890 $2,667 73.8 $314 $352 $666 $7,393 Inland Empire $7,237 $2,746 76.9 $232 $329 $561 $6,696 $134,391 $55,116 1,090.4 $11,937 $5,455 $6,482 California $116,090
The Economic Impact of Travel in California / 2022p / Prepared by Dean Runyan Associates 34
Region / Summary Trend
Direct Travel Spending 2013-2022p 2013 2014 2015 2016 2017 2018 2019 2020 2021 2022 2021-22 2019-22 Spending ($Million) 1,023 1,070 1,100 1,150 1,211 1,254 1,299 776 1,321 1,300 -1.6% q 0.0% p North Coast 1,263 1,288 1,275 1,296 1,377 1,485 1,604 962 1,425 1,508 5.8% p -6.0% q Shasta Cascade 29,211 31,829 33,368 34,334 36,154 38,063 38,862 15,374 23,198 34,196 47.4% p -12.0%q San Francisco Bay Area 6,420 6,608 6,555 6,506 7,058 7,701 8,071 4,321 6,944 8,177 17.8% p 1.3% p Central Valley 4,266 4,435 4,578 4,697 4,968 5,364 5,693 2,731 4,127 5,146 24.7% p -9.6% q Gold Country 2,626 2,696 2,864 3,071 3,297 3,392 3,622 2,421 2,885 3,149 9.1% p -13.1%q High Sierra 7,466 7,772 8,003 8,083 8,369 8,946 9,352 4,986 8,111 9,187 13.3% p -1.8% q Central Coast 25,065 25,769 26,828 28,039 29,854 31,952 32,675 13,254 21,036 28,493 35.4% p -12.8%q Los Angeles County 11,026 11,883 12,696 13,477 13,815 13,922 14,463 6,803 10,830 14,766 36.3% p 2.1% p Orange County 11,602 12,020 12,321 12,996 13,694 13,652 13,792 5,828 10,180 13,344 31.1% p -3.2% q San Diego County 6,194 6,352 6,540 6,783 7,137 7,732 8,083 5,735 6,091 7,890 29.5% p -2.4% q The Deserts 5,531 5,664 5,816 5,971 6,385 6,886 7,335 5,276 5,872 7,237 23.2% p -1.3% q Inland Empire 111,692 117,385 121,945 126,402 133,321 140,350 144,851 68,467 102,021 134,391 California 31.7% p -7.2% q The Economic Impact of Travel in California / 2022p / Prepared by Dean Runyan Associates 35
Region / Summary Trend
Note: Total Earnings includes wage and salary disbursements, other earned income and proprietor income.
Travel Industry Earnings 2013-2022p 2013 2014 2015 2016 2017 2018 2019 2020 2021 2022 2021-22 2019-22 Earnings ($Million) 362 379 399 437 483 500 533 421 548 617 12.6% p 15.8% p North Coast 363 375 392 426 454 475 527 442 515 573 11.3% p 8.7% p Shasta Cascade 9,757 10,636 11,670 13,002 13,922 14,892 14,124 10,038 10,621 12,818 20.7% p -9.2% q San Francisco Bay Area 1,704 1,782 1,883 2,005 2,259 2,467 2,632 2,138 2,640 3,121 18.2% p 18.6% p Central Valley 1,136 1,194 1,294 1,406 1,523 1,656 1,772 1,373 1,628 2,003 23.0% p 13.0% p Gold Country 766 802 877 975 1,108 1,150 1,259 1,044 1,146 1,401 22.3% p 11.3% p High Sierra 2,485 2,609 2,782 2,907 3,106 3,376 3,632 2,815 3,194 3,842 20.3% p 5.8% p Central Coast 8,926 9,307 10,236 11,830 12,689 13,730 15,497 12,233 12,563 14,750 17.4% p -4.8% q Los Angeles County 3,772 4,144 4,534 5,052 5,334 5,325 5,564 3,827 4,563 5,845 28.1% p 5.0% p Orange County 3,448 3,563 3,785 4,216 4,432 4,299 4,429 3,166 3,650 4,734 29.7% p 6.9% p San Diego County 1,610 1,707 1,828 2,011 2,117 2,307 2,454 1,972 2,215 2,667 20.4% p 8.7% p The Deserts 1,549 1,553 1,674 1,836 1,991 2,135 2,297 1,868 2,337 2,746 17.5% p 19.5% p Inland Empire 35,879 38,050 41,353 46,104 49,417 52,312 54,720 41,339 45,621 55,116 California 20.8% p 0.7% p
The Economic Impact of Travel in California / 2022p / Prepared by Dean Runyan Associates 36
Region / Summary Trend
Travel Industry Employment 2013-2022p 2013 2014 2015 2016 2017 2018 2019 2020 2021 2022 2021-22 2019-22 Employment (Thousand Jobs) 15 15 15 16 16 16 16 12 13 15 11.6% p -4.3% q North Coast 15 15 15 15 15 16 16 14 15 16 7.1% p -1.0% q Shasta Cascade 231 243 252 260 267 273 264 180 186 221 19.1% p -16.3%q San Francisco Bay Area 71 72 73 73 78 82 83 65 76 88 15.8% p 5.2% p Central Valley 40 40 41 42 44 46 48 37 41 48 16.9% p 0.2% p Gold Country 29 30 31 32 35 35 36 30 31 36 15.3% p -0.9% q High Sierra 75 77 78 79 81 85 88 68 73 84 14.7% p -4.4% q Central Coast 188 192 203 216 223 232 240 180 185 211 14.0% p -12.2%q Los Angeles County 108 115 122 130 131 130 132 91 100 125 25.2% p -5.6% q Orange County 101 102 102 109 111 103 102 73 80 96 19.8% p -5.4% q San Diego County 62 65 67 70 71 74 76 62 64 74 14.6% p -3.5% q The Deserts 63 63 66 68 71 72 75 59 69 77 11.6% p 2.9% p Inland Empire 997 1,028 1,063 1,110 1,144 1,163 1,177 871 933 1,090 California 16.8% p -7.3% q Note: Employment includes payroll employees and proprietors. The Economic Impact of Travel in California / 2022p / Prepared by Dean Runyan Associates 37
Central Coast Region / Detail Trend
Details may not add to totals due to rounding.
*Other Travel includes ground transportation and air travel impacts to other California destinations, travel arrangement and convention/trade show services.
Economic impacts are attributed to visitor trips which are defined as trips taken by individuals that stay overnight away from home, or travel more than 50 miles one-way on a non-routine trip, as defined by the California Tourism Marketing Act
Direct Travel Impacts 2013-2022p 2013 2014 2015 2016 2017 2018 2019 2020 2021 2022 2021-2022 Direct Travel Spending ($Million) 7,114 7,423 7,671 7,760 8,023 8,559 8,941 4,799 7,856 8,809 Destination Spending 12.1% p 352 349 332 323 346 387 411 187 255 378 Other Travel* 48.1% p 7,466 TOTAL 7,772 8,003 8,083 8,369 8,946 9,352 4,986 8,111 9,187 13.3% p Visitor Spending by Type of Traveler Accommodation ($Million) 4,313 4,569 4,787 4,885 4,981 5,308 5,528 3,216 5,440 5,491 Hotel, Motel, STVR 0.9% p 728 731 744 735 812 898 969 386 927 1,026 Private Home 10.8% p 311 325 329 331 349 368 397 328 410 530 Campground 29.3% p 179 182 185 187 202 229 234 346 310 320 2nd Home 3.2% p 1,582 1,615 1,626 1,622 1,679 1,757 1,814 523 770 1,443 Day Travel 87.3% p 7,114 TOTAL 7,423 7,671 7,760 8,023 8,559 8,941 4,799 7,856 8,809 12.1% p Visitor Spending by Commodity Purchased ($Million) 1,584 1,741 1,880 1,964 2,000 2,137 2,265 1,488 2,597 3,007 Accommodations 15.8% p 2,046 2,103 2,208 2,285 2,363 2,499 2,602 1,390 2,184 2,273 Food Service 4.1% p 247 258 267 267 268 274 284 180 279 342 Food Stores 22.4% p 1,058 1,087 1,003 917 996 1,125 1,165 475 805 991 Local Tran. & Gas 23.1% p 945 972 997 1,012 1,023 1,057 1,072 530 827 846 Arts, Ent. & Rec. 2.2% p 1,174 1,200 1,252 1,252 1,305 1,393 1,458 706 1,106 1,235 Retail Sales 11.7% p 60 62 63 64 68 74 96 30 57 115 Visitor Air Tran. 101.1% p 7,114 TOTAL 7,423 7,671 7,760 8,023 8,559 8,941 4,799 7,856 8,809 12.1% p
The Economic Impact of Travel in California / 2022p / Prepared by Dean Runyan Associates 38
Central Coast Region / Detail Trend
Details may not add to totals due to rounding.
*Other Travel includes ground transportation and air travel impacts to other California destinations, travel arrangement and convention/trade show services.
**Retail includes gasoline station employment and earnings.
Economic impacts are attributed to visitor trips which are defined as trips taken by individuals that stay overnight away from home, or travel more than 50 miles one-way on a non-routine trip, as defined by the California Tourism Marketing Act
Direct Travel Impacts 2013-2022p 2013 2014 2015 2016 2017 2018 2019 2020 2021 2022 2021-2022 Travel Industry Earnings ($MIllion) 1,461 1,554 1,666 1,765 1,913 2,068 2,205 1,692 2,037 2,526 Accom. & Food Serv. 24.0% p 633 663 695 707 737 790 824 624 706 841 Arts, Ent. & Rec. 19.2% p 195 204 218 223 226 240 249 251 277 292 Retail** 5.5% p 80 85 91 99 111 151 164 68 70 63 Ground Tran. -10.6% q 29 22 26 25 27 28 56 56 23 24 Visitor Air Tran. 5.4% p 87 80 86 88 93 99 134 124 81 96 Other Travel* 17.6% p 2,485 TOTAL 2,609 2,782 2,907 3,106 3,376 3,632 2,815 3,194 3,842 20.3% p Travel Industry Employment (Jobs) 46,960 47,960 48,850 49,620 51,560 53,330 54,780 42,260 46,490 53,440 Accom. & Food Serv. 15.0% p 18,150 18,470 18,430 18,400 18,530 19,900 20,870 14,340 16,080 19,710 Arts, Ent. & Rec. 22.6% p 6,100 6,190 6,370 6,420 6,360 6,610 6,580 6,200 6,410 6,440 Retail** 0.4% p 2,130 2,190 2,240 2,280 2,320 2,920 3,200 2,710 2,680 2,720 Ground Tran. 1.5% p 340 260 290 260 300 300 520 470 270 270 Visitor Air Tran. -0.9% q 1,710 1,600 1,640 1,660 1,680 1,720 2,030 1,760 1,420 1,530 Other Travel* 7.9% p 75,390 TOTAL 76,680 77,820 78,650 80,750 84,790 87,990 67,740 73,350 84,110 14.7% p
The Economic Impact of Travel in California / 2022p / Prepared by Dean Runyan Associates 39
Central Coast Region / Detail Trend
Details may not add to totals due to rounding.
Local tax receipts include transient occupancy taxes, sales taxes, and airport passenger facility charges paid by visitors, and the property tax payments and sales tax payments attributable to the travel industry income of employees and businesses. State tax receipts include sales tax payments and motor fuel tax payments of visitors, and the income tax payments and sales tax payments attributable to the travel industry income of employees and businesses.
Economic impacts are attributed to visitor trips which are defined as trips taken by individuals that stay overnight away from home, or travel more than 50 miles one-way on a non-routine trip, as defined by the California Tourism Marketing Act
Direct Travel Impacts 2013-2022p 2013 2014 2015 2016 2017 2018 2019 2020 2021 2022 2021-2022 Tax Receipts Generated by Travel Spending ($Millions) 273 292 313 324 341 376 400 290 435 485 Local Tax Receipts 11.7% p 370 384 386 378 378 413 436 267 367 401 State Tax Receipts 9.1% p 643 TOTAL 676 699 702 719 789 836 557 802 886 10.5% p Local Tax Receipts Generated by Travel Spending ($Millions) 191 208 224 234 247 272 289 176 304 349 Visitor 14.8% p 82 84 89 90 94 104 111 114 131 136 Business or Employee 4.3% p 273 TOTAL 292 313 324 341 376 400 290 435 485 11.7% p State Tax Receipts Generated by Travel Spending ($Millions) 281 290 288 281 285 318 335 169 251 275 Visitor 9.7% p 89 94 98 97 93 94 101 99 117 125 Business or Employee 7.7% p 370 TOTAL 384 386 378 378 413 436 267 367 401 9.1% p
The Economic Impact of Travel in California / 2022p / Prepared by Dean Runyan Associates 40
Central Valley Region / Detail Trend
Details may not add to totals due to rounding.
*Other Travel includes ground transportation and air travel impacts to other California destinations, travel arrangement and convention/trade show services.
Economic impacts are attributed to visitor trips which are defined as trips taken by individuals that stay overnight away from home, or travel more than 50 miles one-way on a non-routine trip, as defined by the California Tourism Marketing Act
Direct Travel Impacts 2013-2022p 2013 2014 2015 2016 2017 2018 2019 2020 2021 2022 2021-2022 Direct Travel Spending ($Million) 5,866 6,044 6,035 6,023 6,521 7,083 7,424 4,066 6,547 7,600 Destination Spending 16.1% p 554 564 520 484 538 618 647 255 396 577 Other Travel* 45.5% p 6,420 TOTAL 6,608 6,555 6,506 7,058 7,701 8,071 4,321 6,944 8,177 17.8% p Visitor Spending by Type of Traveler Accommodation ($Million) 1,923 2,029 2,126 2,174 2,384 2,569 2,698 2,264 2,885 2,850 Hotel, Motel, STVR -1.2% q 1,803 1,817 1,739 1,697 1,875 2,082 2,219 607 2,046 2,351 Private Home 14.9% p 182 211 208 209 220 233 252 213 262 339 Campground 29.1% p 318 325 317 322 338 361 370 518 465 444 2nd Home -4.5% q 1,640 1,663 1,644 1,622 1,702 1,838 1,885 464 889 1,615 Day Travel 81.7% p 5,866 TOTAL 6,044 6,035 6,023 6,521 7,083 7,424 4,066 6,547 7,600 16.1% p Visitor Spending by Commodity Purchased ($Million) 779 849 913 957 1,050 1,122 1,179 1,050 1,331 1,400 Accommodations 5.2% p 1,544 1,574 1,646 1,707 1,820 1,933 2,018 1,130 1,897 2,120 Food Service 11.8% p 285 298 306 305 311 317 326 187 340 407 Food Stores 19.5% p 1,592 1,625 1,486 1,350 1,495 1,719 1,782 650 1,179 1,585 Local Tran. & Gas 34.5% p 809 825 843 859 893 926 940 509 814 890 Arts, Ent. & Rec. 9.3% p 803 816 784 788 895 1,005 1,106 511 937 1,118 Retail Sales 19.2% p 54 56 58 57 57 61 73 28 48 80 Visitor Air Tran. 66.8% p 5,866 TOTAL 6,044 6,035 6,023 6,521 7,083 7,424 4,066 6,547 7,600 16.1% p
The Economic Impact of Travel in California / 2022p / Prepared by Dean Runyan Associates 41
Central Valley Region / Detail Trend
Details may not add to totals due to rounding.
*Other Travel includes ground transportation and air travel impacts to other California destinations, travel arrangement and convention/trade show services.
**Retail includes gasoline station employment and earnings.
Economic impacts are attributed to visitor trips which are defined as trips taken by individuals that stay overnight away from home, or travel more than 50 miles one-way on a non-routine trip, as defined by the California Tourism Marketing Act
Direct Travel Impacts 2013-2022p 2013 2014 2015 2016 2017 2018 2019 2020 2021 2022 2021-2022 Travel Industry Earnings ($MIllion) 954 1,000 1,089 1,182 1,320 1,433 1,528 1,321 1,642 1,929 Accom. & Food Serv. 17.4% p 392 409 407 431 463 485 503 323 439 596 Arts, Ent. & Rec. 35.8% p 161 169 171 177 192 206 217 220 261 282 Retail** 8.1% p 97 102 109 119 136 188 205 93 99 102 Ground Tran. 2.5% p 22 21 22 15 31 30 37 37 51 50 Visitor Air Tran. -1.8% q 79 81 84 81 118 126 142 143 147 162 Other Travel* 9.9% p 1,704 TOTAL 1,782 1,883 2,005 2,259 2,467 2,632 2,138 2,640 3,121 18.2% p Travel Industry Employment (Jobs) 38,670 39,230 40,200 40,380 43,460 45,240 45,840 38,590 43,930 49,250 Accom. & Food Serv. 12.1% p 20,990 21,880 21,330 21,530 22,790 23,220 23,460 13,870 17,990 23,870 Arts, Ent. & Rec. 32.7% p 5,670 5,880 5,770 5,770 6,140 6,420 6,480 6,090 6,790 6,940 Retail** 2.3% p 2,590 2,640 2,680 2,740 2,860 3,640 4,000 3,290 3,700 4,190 Ground Tran. 13.4% p 410 350 370 240 390 370 450 400 470 440 Visitor Air Tran. -5.8% q 2,220 2,270 2,300 2,260 2,670 2,760 2,920 2,880 2,700 2,810 Other Travel* 4.3% p 70,540 TOTAL 72,250 72,660 72,930 78,300 81,640 83,150 65,130 75,570 87,510 15.8% p
The Economic Impact of Travel in California / 2022p / Prepared by Dean Runyan Associates 42
Central Valley Region / Detail Trend
Details may not add to totals due to rounding.
Local tax receipts include transient occupancy taxes, sales taxes, and airport passenger facility charges paid by visitors, and the property tax payments and sales tax payments attributable to the travel industry income of employees and businesses. State tax receipts include sales tax payments and motor fuel tax payments of visitors, and the income tax payments and sales tax payments attributable to the travel industry income of employees and businesses.
Economic impacts are attributed to visitor trips which are defined as trips taken by individuals that stay overnight away from home, or travel more than 50 miles one-way on a non-routine trip, as defined by the California Tourism Marketing Act
Direct Travel Impacts 2013-2022p 2013 2014 2015 2016 2017 2018 2019 2020 2021 2022 2021-2022 Tax Receipts Generated by Travel Spending ($Millions) 147 155 164 171 191 215 228 193 259 275 Local Tax Receipts 6.4% p 373 386 371 355 373 437 464 255 378 435 State Tax Receipts 15.3% p 520 TOTAL 541 535 526 564 652 693 448 636 710 11.7% p Local Tax Receipts Generated by Travel Spending ($Millions) 92 99 106 111 125 142 150 107 155 169 Visitor 9.2% p 55 56 59 60 66 73 78 86 104 106 Business or Employee 2.1% p 147 TOTAL 155 164 171 191 215 228 193 259 275 6.4% p State Tax Receipts Generated by Travel Spending ($Millions) 312 322 306 289 306 368 391 180 284 335 Visitor 18.0% p 60 63 65 65 67 69 73 74 93 100 Business or Employee 7.0% p 373 TOTAL 386 371 355 373 437 464 255 378 435 15.3% p
The Economic Impact of Travel in California / 2022p / Prepared by Dean Runyan Associates 43
Gold Country Region / Detail Trend
Details may not add to totals due to rounding.
*Other Travel includes ground transportation and air travel impacts to other California destinations, travel arrangement and convention/trade show services.
Economic impacts are attributed to visitor trips which are defined as trips taken by individuals that stay overnight away from home, or travel more than 50 miles one-way on a non-routine trip, as defined by the California Tourism Marketing Act
Direct Travel Impacts 2013-2022p 2013 2014 2015 2016 2017 2018 2019 2020 2021 2022 2021-2022 Direct Travel Spending ($Million) 3,631 3,768 3,888 4,004 4,261 4,598 4,863 2,398 3,611 4,307 Destination Spending 19.3% p 636 667 690 694 708 766 830 333 516 839 Other Travel* 62.5% p 4,266 TOTAL 4,435 4,578 4,697 4,968 5,364 5,693 2,731 4,127 5,146 24.7% p Visitor Spending by Type of Traveler Accommodation ($Million) 1,593 1,688 1,806 1,919 2,004 2,168 2,298 1,443 1,767 1,950 Hotel, Motel, STVR 10.4% p 914 929 925 922 1,017 1,121 1,207 362 1,041 1,178 Private Home 13.2% p 93 100 99 99 105 110 119 100 125 162 Campground 29.6% p 148 150 150 152 162 173 177 230 206 224 2nd Home 8.9% p 882 902 908 911 973 1,025 1,061 262 473 794 Day Travel 67.8% p 3,631 TOTAL 3,768 3,888 4,004 4,261 4,598 4,863 2,398 3,611 4,307 19.3% p Visitor Spending by Commodity Purchased ($Million) 473 518 572 628 675 729 773 541 682 795 Accommodations 16.5% p 973 996 1,058 1,120 1,181 1,258 1,327 679 1,031 1,150 Food Service 11.5% p 137 142 148 149 152 156 161 85 152 182 Food Stores 19.8% p 777 801 751 704 767 869 905 338 574 755 Local Tran. & Gas 31.6% p 586 601 623 646 666 692 710 356 519 564 Arts, Ent. & Rec. 8.7% p 437 447 459 471 526 587 648 284 477 553 Retail Sales 15.9% p 248 263 277 287 295 307 340 114 175 308 Visitor Air Tran. 75.6% p 3,631 TOTAL 3,768 3,888 4,004 4,261 4,598 4,863 2,398 3,611 4,307 19.3% p
The Economic Impact of Travel in California / 2022p / Prepared
Runyan Associates 44
by Dean
Gold Country Region / Detail Trend
Details may not add to totals due to rounding.
*Other Travel includes ground transportation and air travel impacts to other California destinations, travel arrangement and convention/trade show services.
**Retail includes gasoline station employment and earnings.
Economic impacts are attributed to visitor trips which are defined as trips taken by individuals that stay overnight away from home, or travel more than 50 miles one-way on a non-routine trip, as defined by the California Tourism Marketing Act
Direct Travel Impacts 2013-2022p 2013 2014 2015 2016 2017 2018 2019 2020 2021 2022 2021-2022 Travel Industry Earnings ($MIllion) 612 640 688 768 830 922 995 794 963 1,179 Accom. & Food Serv. 22.4% p 287 302 331 360 405 406 428 297 350 473 Arts, Ent. & Rec. 35.4% p 82 86 91 95 103 111 117 120 138 145 Retail** 5.4% p 59 64 70 77 84 109 120 58 58 63 Ground Tran. 9.1% p 20 21 23 19 18 19 19 19 24 25 Visitor Air Tran. 8.0% p 77 81 90 88 83 88 92 85 97 117 Other Travel* 20.5% p 1,136 TOTAL 1,194 1,294 1,406 1,523 1,656 1,772 1,373 1,628 2,003 23.0% p Travel Industry Employment (Jobs) 22,710 23,150 23,380 24,230 25,340 26,990 27,640 21,780 24,120 27,700 Accom. & Food Serv. 14.8% p 11,020 10,720 10,950 11,390 11,840 12,080 12,540 8,200 9,670 12,660 Arts, Ent. & Rec. 30.9% p 2,730 2,830 2,890 2,930 3,100 3,260 3,300 3,150 3,430 3,430 Retail** 0.0% q 1,500 1,560 1,630 1,680 1,720 2,080 2,310 1,790 1,770 1,950 Ground Tran. 10.6% p 340 350 370 330 310 310 340 300 350 360 Visitor Air Tran. 1.8% p 1,470 1,510 1,610 1,610 1,680 1,550 1,640 1,520 1,610 1,770 Other Travel* 10.1% p 39,770 TOTAL 40,110 40,840 42,160 43,990 46,270 47,760 36,740 40,950 47,870 16.9% p
The Economic Impact of Travel in California / 2022p / Prepared by Dean Runyan Associates 45
Gold Country Region / Detail Trend
Details may not add to totals due to rounding.
Local tax receipts include transient occupancy taxes, sales taxes, and airport passenger facility charges paid by visitors, and the property tax payments and sales tax payments attributable to the travel industry income of employees and businesses. State tax receipts include sales tax payments and motor fuel tax payments of visitors, and the income tax payments and sales tax payments attributable to the travel industry income of employees and businesses.
Economic impacts are attributed to visitor trips which are defined as trips taken by individuals that stay overnight away from home, or travel more than 50 miles one-way on a non-routine trip, as defined by the California Tourism Marketing Act
Travel Impacts 2013-2022p 2013 2014 2015 2016 2017 2018 2019 2020 2021 2022 2021-2022 Tax Receipts Generated by Travel Spending ($Millions) 115 124 135 144 154 173 184 130 167 190 Local Tax Receipts 13.6% p 196 203 203 201 208 235 250 138 193 222 State Tax Receipts 15.1% p 311 TOTAL 328 338 345 361 407 435 269 360 412 14.4% p Local Tax Receipts Generated by Travel Spending ($Millions) 77 84 92 99 107 121 129 74 100 119 Visitor 18.7% p 39 40 43 45 47 51 55 57 66 70 Business or Employee 6.1% p 115 TOTAL 124 135 144 154 173 184 130 167 190 13.6% p State Tax Receipts Generated by Travel Spending ($Millions) 155 161 158 154 161 188 200 91 135 158 Visitor 16.5% p 41 43 45 46 46 47 50 48 57 64 Business or Employee 11.8% p 196 TOTAL 203 203 201 208 235 250 138 193 222 15.1% p
Direct
The Economic Impact of Travel in California / 2022p / Prepared by Dean Runyan Associates 46
High Sierra Region / Detail Trend
Details may not add to totals due to rounding.
*Other Travel includes ground transportation and air travel impacts to other California destinations, travel arrangement and convention/trade show services.
Economic impacts are attributed to visitor trips which are defined as trips taken by individuals that stay overnight away from home, or travel more than 50 miles one-way on a non-routine trip, as defined by the California Tourism Marketing Act
Direct Travel Impacts 2013-2022p 2013 2014 2015 2016 2017 2018 2019 2020 2021 2022 2021-2022 Direct Travel Spending ($Million) 2,553 2,629 2,801 3,005 3,222 3,307 3,533 2,380 2,829 3,071 Destination Spending 8.6% p 73 67 63 65 75 85 89 41 56 77 Other Travel* 37.6% p 2,626 TOTAL 2,696 2,864 3,071 3,297 3,392 3,622 2,421 2,885 3,149 9.1% p Visitor Spending by Type of Traveler Accommodation ($Million) 1,656 1,716 1,891 2,084 2,252 2,273 2,447 1,609 1,930 1,924 Hotel, Motel, STVR -0.3% q 139 139 130 125 136 152 161 48 139 166 Private Home 19.4% p 169 177 175 176 186 196 211 175 220 284 Campground 29.2% p 265 268 268 272 288 310 317 413 369 378 2nd Home 2.2% p 323 328 336 348 359 377 397 135 170 320 Day Travel 87.8% p 2,553 TOTAL 2,629 2,801 3,005 3,222 3,307 3,533 2,380 2,829 3,071 8.6% p Visitor Spending by Commodity Purchased ($Million) 699 740 820 914 993 989 1,068 844 1,155 1,314 Accommodations 13.7% p 706 719 788 865 922 945 1,017 666 695 687 Food Service -1.2% q 101 104 110 113 115 116 123 93 142 169 Food Stores 19.2% p 354 361 338 318 355 401 426 198 257 317 Local Tran. & Gas 23.5% p 396 403 431 462 480 482 504 340 330 322 Arts, Ent. & Rec. -2.3% q 297 301 314 334 355 371 393 238 249 262 Retail Sales 5.1% p 2,553 TOTAL 2,629 2,801 3,005 3,220 3,304 3,531 2,379 2,829 3,071 8.6% p
The Economic Impact of Travel in California / 2022p / Prepared by Dean Runyan Associates 47
High Sierra Region / Detail Trend
Details may not add to totals due to rounding.
*Other Travel includes ground transportation and air travel impacts to other California destinations, travel arrangement and convention/trade show services.
**Retail includes gasoline station employment and earnings.
Economic impacts are attributed to visitor trips which are defined as trips taken by individuals that stay overnight away from home, or travel more than 50 miles one-way on a non-routine trip, as defined by the California Tourism Marketing Act
Travel Impacts 2013-2022p 2013 2014 2015 2016 2017 2018 2019 2020 2021 2022 2021-2022 Travel Industry Earnings ($MIllion) 501 525 583 661 758 775 855 710 814 1,016 Accom. & Food Serv. 24.8% p 170 179 188 196 212 219 235 195 211 262 Arts, Ent. & Rec. 24.3% p 61 64 68 74 79 81 84 93 92 94 Retail** 2.9% p 26 27 30 35 41 58 64 27 17 14 Ground Tran. -14.4% q 8 7 8 10 12 13 14 12 12 14 Other Travel* 18.3% p 766 TOTAL 802 877 975 1,103 1,145 1,252 1,037 1,146 1,401 22.3% p Travel Industry Employment (Jobs) 17,670 17,690 18,600 19,280 21,060 20,900 22,130 18,310 19,460 22,660 Accom. & Food Serv. 16.4% p 8,380 8,740 8,970 9,340 9,940 9,920 10,130 7,660 8,330 9,970 Arts, Ent. & Rec. 19.7% p 2,050 2,150 2,200 2,290 2,340 2,380 2,360 2,460 2,310 2,240 Retail** -3.0% q 720 740 770 830 880 1,120 1,270 1,270 790 780 Ground Tran. -0.7% q 250 230 240 300 350 360 370 310 320 350 Other Travel* 9.0% p 29,070 TOTAL 29,530 30,770 32,050 34,560 34,670 36,260 30,020 31,200 35,990 15.3% p
Direct
The Economic Impact of Travel in California / 2022p / Prepared by Dean Runyan Associates 48
High Sierra Region / Detail Trend
Details may not add to totals due to rounding.
Local tax receipts include transient occupancy taxes, sales taxes, and airport passenger facility charges paid by visitors, and the property tax payments and sales tax payments attributable to the travel industry income of employees and businesses. State tax receipts include sales tax payments and motor fuel tax payments of visitors, and the income tax payments and sales tax payments attributable to the travel industry income of employees and businesses.
Economic impacts are attributed to visitor trips which are defined as trips taken by individuals that stay overnight away from home, or travel more than 50 miles one-way on a non-routine trip, as defined by the California Tourism Marketing Act
Direct Travel Impacts 2013-2022p 2013 2014 2015 2016 2017 2018 2019 2020 2021 2022 2021-2022 Tax Receipts Generated by Travel Spending ($Millions) 104 108 120 133 145 150 163 131 166 185 Local Tax Receipts 11.7% p 108 112 115 118 123 132 142 105 115 124 State Tax Receipts 7.6% p 212 TOTAL 220 235 251 268 281 305 236 281 309 10.0% p Local Tax Receipts Generated by Travel Spending ($Millions) 77 81 90 101 110 113 122 88 115 130 Visitor 13.8% p 27 28 30 32 35 37 41 44 51 55 Business or Employee 6.9% p 104 TOTAL 108 120 133 145 150 163 131 166 185 11.7% p State Tax Receipts Generated by Travel Spending ($Millions) 79 82 83 85 88 98 105 66 70 74 Visitor 5.7% p 29 30 32 34 35 34 37 39 45 50 Business or Employee 10.4% p 108 TOTAL 112 115 118 123 132 142 105 115 124 7.6% p
The Economic Impact of Travel in California / 2022p / Prepared by Dean Runyan Associates 49
Inland Empire Region / Detail Trend
Details may not add to totals due to rounding.
*Other Travel includes ground transportation and air travel impacts to other California destinations, travel arrangement and convention/trade show services.
Economic impacts are attributed to visitor trips which are defined as trips taken by individuals that stay overnight away from home, or travel more than 50 miles one-way on a non-routine trip, as defined by the California Tourism Marketing Act
Direct Travel Impacts 2013-2022p 2013 2014 2015 2016 2017 2018 2019 2020 2021 2022 2021-2022 Direct Travel Spending ($Million) 5,125 5,246 5,413 5,573 5,961 6,415 6,836 5,057 5,549 6,696 Destination Spending 20.7% p 406 417 403 398 424 471 498 219 323 541 Other Travel* 67.4% p 5,531 TOTAL 5,664 5,816 5,971 6,385 6,886 7,335 5,276 5,872 7,237 23.2% p Visitor Spending by Type of Traveler Accommodation ($Million) 1,523 1,607 1,716 1,835 1,962 2,086 2,263 1,620 1,910 2,150 Hotel, Motel, STVR 12.6% p 1,108 1,118 1,150 1,169 1,286 1,416 1,538 1,066 1,502 1,669 Private Home 11.1% p 177 175 173 173 183 193 208 170 220 282 Campground 28.0% p 936 951 973 987 1,052 1,149 1,176 1,596 1,435 1,422 2nd Home -0.9% q 1,381 1,396 1,401 1,409 1,478 1,571 1,652 605 483 1,173 Day Travel 142.9% p 5,125 TOTAL 5,246 5,413 5,573 5,961 6,415 6,836 5,057 5,549 6,696 20.7% p Visitor Spending by Commodity Purchased ($Million) 741 793 858 929 984 1,031 1,104 995 1,259 1,417 Accommodations 12.5% p 1,592 1,612 1,699 1,792 1,890 1,991 2,116 1,693 1,715 1,998 Food Service 16.5% p 221 225 233 235 238 243 253 208 254 311 Food Stores 22.5% p 881 898 834 779 858 970 1,025 511 631 884 Local Tran. & Gas 40.2% p 864 876 902 932 961 989 1,023 780 774 874 Arts, Ent. & Rec. 13.0% p 703 711 755 775 893 1,042 1,158 805 821 1,029 Retail Sales 25.3% p 122 131 133 131 137 149 158 64 95 184 Visitor Air Tran. 92.5% p 5,125 TOTAL 5,246 5,413 5,573 5,961 6,415 6,836 5,057 5,549 6,696 20.7% p
The Economic Impact of Travel in California / 2022p / Prepared by Dean Runyan Associates 50
Inland Empire Region / Detail Trend
Details may not add to totals due to rounding.
*Other Travel includes ground transportation and air travel impacts to other California destinations, travel arrangement and convention/trade show services.
**Retail includes gasoline station employment and earnings.
Economic impacts are attributed to visitor trips which are defined as trips taken by individuals that stay overnight away from home, or travel more than 50 miles one-way on a non-routine trip, as defined by the California Tourism Marketing Act
Direct Travel Impacts 2013-2022p 2013 2014 2015 2016 2017 2018 2019 2020 2021 2022 2021-2022 Travel Industry Earnings ($MIllion) 809 866 940 1,042 1,125 1,206 1,312 1,109 1,390 1,636 Accom. & Food Serv. 17.7% p 417 425 446 480 531 546 578 409 557 678 Arts, Ent. & Rec. 21.7% p 124 129 139 145 158 172 184 190 221 234 Retail** 6.0% p 63 67 72 80 91 120 134 84 54 56 Ground Tran. 3.7% p 43 11 14 15 14 15 12 12 24 25 Visitor Air Tran. 7.3% p 94 56 62 74 72 77 78 65 91 116 Other Travel* 27.1% p 1,549 TOTAL 1,553 1,674 1,836 1,991 2,135 2,297 1,868 2,337 2,746 17.5% p Travel Industry Employment (Jobs) 34,900 35,870 37,100 38,550 40,110 41,110 42,640 35,340 40,960 45,640 Accom. & Food Serv. 11.4% p 19,450 19,790 20,890 21,520 22,160 21,450 22,190 14,450 18,660 21,350 Arts, Ent. & Rec. 14.4% p 4,320 4,420 4,570 4,610 4,910 5,200 5,370 5,210 5,620 5,660 Retail** 0.8% p 1,630 1,670 1,730 1,800 1,870 2,300 2,600 2,970 1,860 2,130 Ground Tran. 14.9% p 610 190 230 240 230 230 200 180 240 240 Visitor Air Tran. 0.8% p 1,850 1,370 1,420 1,640 1,640 1,680 1,670 1,310 1,550 1,820 Other Travel* 18.0% p 62,770 TOTAL 63,310 65,950 68,370 70,920 71,980 74,660 59,460 68,880 76,850 11.6% p
The Economic Impact of Travel in California / 2022p / Prepared by Dean Runyan Associates 51
Inland Empire Region / Detail Trend
Details may not add to totals due to rounding.
Local tax receipts include transient occupancy taxes, sales taxes, and airport passenger facility charges paid by visitors, and the property tax payments and sales tax payments attributable to the travel industry income of employees and businesses. State tax receipts include sales tax payments and motor fuel tax payments of visitors, and the income tax payments and sales tax payments attributable to the travel industry income of employees and businesses.
Economic impacts are attributed to visitor trips which are defined as trips taken by individuals that stay overnight away from home, or travel more than 50 miles one-way on a non-routine trip, as defined by the California Tourism Marketing Act
Direct Travel Impacts 2013-2022p 2013 2014 2015 2016 2017 2018 2019 2020 2021 2022 2021-2022 Tax Receipts Generated by Travel Spending ($Millions) 127 130 141 152 163 182 196 164 205 232 Local Tax Receipts 13.3% p 277 282 283 282 294 330 355 260 277 329 State Tax Receipts 18.8% p 404 TOTAL 413 424 434 456 512 551 424 482 561 16.4% p Local Tax Receipts Generated by Travel Spending ($Millions) 79 84 92 100 108 123 132 96 124 147 Visitor 19.4% p 47 46 49 52 54 59 64 69 81 85 Business or Employee 4.1% p 127 TOTAL 130 141 152 163 182 196 164 205 232 13.3% p State Tax Receipts Generated by Travel Spending ($Millions) 225 230 228 224 236 272 293 194 200 245 Visitor 22.3% p 52 52 55 57 58 58 62 66 77 84 Business or Employee 9.6% p 277 TOTAL 282 283 282 294 330 355 260 277 329 18.8% p
The Economic Impact of Travel in California / 2022p / Prepared by Dean Runyan Associates 52
Los Angeles County Region / Detail Trend
Details may not add to totals due to rounding.
*Other Travel includes ground transportation and air travel impacts to other California destinations, travel arrangement and convention/trade show services.
Economic impacts are attributed to visitor trips which are defined as trips taken by individuals that stay overnight away from home, or travel more than 50 miles one-way on a non-routine trip, as defined by the California Tourism Marketing Act
Direct Travel Impacts 2013-2022p 2013 2014 2015 2016 2017 2018 2019 2020 2021 2022 2021-2022 Direct Travel Spending ($Million) 19,999 20,513 21,582 22,860 24,232 25,773 26,257 10,365 17,379 22,453 Destination Spending 29.2% p 5,065 5,257 5,246 5,179 5,622 6,179 6,418 2,889 3,657 6,040 Other Travel* 65.2% p 25,065 TOTAL 25,769 26,828 28,039 29,854 31,952 32,675 13,254 21,036 28,493 35.4% p Visitor Spending by Type of Traveler Accommodation ($Million) 11,507 11,938 12,828 13,940 14,803 15,729 15,777 7,000 11,071 13,782 Hotel, Motel, STVR 24.5% p 3,080 3,152 3,214 3,243 3,520 3,822 4,076 1,541 3,360 3,912 Private Home 16.4% p 87 92 93 94 98 103 111 93 116 149 Campground 28.2% p 163 165 162 164 173 186 191 340 305 337 2nd Home 10.5% p 5,162 5,166 5,285 5,419 5,638 5,933 6,102 1,391 2,528 4,274 Day Travel 69.1% p 19,999 TOTAL 20,513 21,582 22,860 24,232 25,773 26,257 10,365 17,379 22,453 29.2% p Visitor Spending by Commodity Purchased ($Million) 3,805 4,099 4,576 5,126 5,498 5,694 5,776 2,697 4,093 5,842 Accommodations 42.7% p 5,037 5,043 5,380 5,787 6,133 6,569 6,725 2,752 4,653 5,340 Food Service 14.8% p 577 587 615 629 640 660 667 289 544 666 Food Stores 22.4% p 3,083 3,125 3,045 3,024 3,238 3,575 3,608 1,218 2,385 3,092 Local Tran. & Gas 29.7% p 3,086 3,093 3,222 3,395 3,513 3,673 3,665 1,427 2,335 2,626 Arts, Ent. & Rec. 12.5% p 2,672 2,659 2,773 2,882 3,094 3,334 3,483 1,299 2,266 2,692 Retail Sales 18.8% p 1,739 1,906 1,972 2,017 2,116 2,267 2,333 683 1,103 2,194 Visitor Air Tran. 98.9% p 19,999 TOTAL 20,513 21,582 22,860 24,232 25,773 26,257 10,365 17,379 22,453 29.2% p
The Economic Impact of Travel in California / 2022p / Prepared by Dean Runyan Associates 53
Los Angeles County Region / Detail Trend
Details may not add to totals due to rounding.
*Other Travel includes ground transportation and air travel impacts to other California destinations, travel arrangement and convention/trade show services.
**Retail includes gasoline station employment and earnings.
Economic impacts are attributed to visitor trips which are defined as trips taken by individuals that stay overnight away from home, or travel more than 50 miles one-way on a non-routine trip, as defined by the California Tourism Marketing Act
Direct Travel Impacts 2013-2022p 2013 2014 2015 2016 2017 2018 2019 2020 2021 2022 2021-2022 Travel Industry Earnings ($MIllion) 3,777 3,949 4,372 4,932 5,247 5,692 5,913 4,144 4,896 6,294 Accom. & Food Serv. 28.5% p 2,103 2,209 2,401 2,530 2,575 2,786 2,926 2,085 2,392 2,668 Arts, Ent. & Rec. 11.6% p 442 451 484 512 529 560 575 572 643 682 Retail** 6.0% p 358 379 420 472 515 651 695 282 335 365 Ground Tran. 8.7% p 774 803 890 1,273 1,459 1,538 2,199 2,201 1,739 1,874 Visitor Air Tran. 7.8% p 1,473 1,517 1,669 2,112 2,364 2,504 3,189 2,950 2,558 2,867 Other Travel* 12.1% p 8,926 TOTAL 9,307 10,236 11,830 12,689 13,730 15,497 12,233 12,563 14,750 17.4% p Travel Industry Employment (Jobs) 108,710 110,180 115,960 121,910 125,480 129,520 127,760 91,770 99,530 117,020 Accom. & Food Serv. 17.6% p 25,380 26,740 29,230 30,580 30,210 32,160 32,730 21,670 24,590 30,480 Arts, Ent. & Rec. 23.9% p 13,200 13,230 13,640 14,060 14,110 14,400 13,990 12,810 13,400 13,590 Retail** 1.4% p 8,930 9,020 9,620 10,150 10,410 12,340 13,170 8,360 9,300 10,160 Ground Tran. 9.2% p 9,580 9,970 10,660 13,100 14,750 15,050 19,420 17,380 14,090 14,300 Visitor Air Tran. 1.5% p 22,250 23,080 24,050 26,660 28,190 28,760 32,950 28,200 23,980 25,210 Other Travel* 5.1% p 188,060 TOTAL 192,230 203,160 216,460 223,160 232,230 240,020 180,190 184,890 210,760 14.0% p
The Economic Impact of Travel in California / 2022p / Prepared by Dean Runyan Associates 54
Los Angeles County Region / Detail Trend
Details may not add to totals due to rounding.
Local tax receipts include transient occupancy taxes, sales taxes, and airport passenger facility charges paid by visitors, and the property tax payments and sales tax payments attributable to the travel industry income of employees and businesses. State tax receipts include sales tax payments and motor fuel tax payments of visitors, and the income tax payments and sales tax payments attributable to the travel industry income of employees and businesses.
Economic impacts are attributed to visitor trips which are defined as trips taken by individuals that stay overnight away from home, or travel more than 50 miles one-way on a non-routine trip, as defined by the California Tourism Marketing Act
Direct Travel Impacts 2013-2022p 2013 2014 2015 2016 2017 2018 2019 2020 2021 2022 2021-2022 Tax Receipts Generated by Travel Spending ($Millions) 1,016 1,062 1,162 1,291 1,453 1,559 1,639 1,031 1,326 1,606 Local Tax Receipts 21.1% p 1,102 1,127 1,142 1,168 1,171 1,293 1,371 753 1,008 1,161 State Tax Receipts 15.3% p 2,117 TOTAL 2,188 2,304 2,459 2,624 2,851 3,010 1,784 2,334 2,767 18.6% p Local Tax Receipts Generated by Travel Spending ($Millions) 687 726 797 885 1,017 1,087 1,106 475 751 1,022 Visitor 36.0% p 329 335 365 407 436 472 533 556 575 585 Business or Employee 1.7% p 1,016 TOTAL 1,062 1,162 1,291 1,453 1,559 1,639 1,031 1,326 1,606 21.1% p State Tax Receipts Generated by Travel Spending ($Millions) 812 823 816 814 839 955 994 395 630 751 Visitor 19.2% p 290 304 326 354 332 337 378 358 377 410 Business or Employee 8.6% p 1,102 TOTAL 1,127 1,142 1,168 1,171 1,293 1,371 753 1,008 1,161 15.3% p
The Economic Impact of Travel in California / 2022p / Prepared by Dean Runyan Associates 55
North Coast Region / Detail Trend
Details may not add to totals due to rounding.
*Other Travel includes ground transportation and air travel impacts to other California destinations, travel arrangement and convention/trade show services.
Economic impacts are attributed to visitor trips which are defined as trips taken by individuals that stay overnight away from home, or travel more than 50 miles one-way on a non-routine trip, as defined by the California Tourism Marketing Act
Direct Travel Impacts 2013-2022p 2013 2014 2015 2016 2017 2018 2019 2020 2021 2022 2021-2022 Direct Travel Spending ($Million) 984 1,031 1,064 1,114 1,172 1,212 1,253 759 1,293 1,258 Destination Spending -2.7% q 39 39 37 36 39 42 46 17 29 42 Other Travel* 45.0% p 1,023 TOTAL 1,070 1,100 1,150 1,211 1,254 1,299 776 1,321 1,300 -1.6% q Visitor Spending by Type of Traveler Accommodation ($Million) 452 485 523 568 597 599 608 381 727 552 Hotel, Motel, STVR -24.0% q 175 175 164 164 176 191 202 65 199 221 Private Home 11.1% p 140 150 151 152 160 169 182 150 188 243 Campground 29.4% p 66 66 69 70 74 81 83 111 99 103 2nd Home 3.6% p 150 155 157 160 166 173 178 52 80 139 Day Travel 74.0% p 984 TOTAL 1,031 1,064 1,114 1,172 1,212 1,253 759 1,293 1,258 -2.7% q Visitor Spending by Commodity Purchased ($Million) 207 228 251 277 291 290 297 244 387 372 Accommodations -3.9% q 279 288 307 328 343 351 363 205 369 330 Food Service -10.6% q 67 70 73 74 74 75 78 53 88 105 Food Stores 18.9% p 169 175 162 151 165 186 192 85 152 172 Local Tran. & Gas 13.3% p 144 149 155 162 165 166 167 93 154 138 Arts, Ent. & Rec. -10.2% q 111 114 110 114 126 136 146 76 136 131 Retail Sales -3.6% q 7 6 6 8 8 8 9 3 6 10 Visitor Air Tran. 51.1% p 984 TOTAL 1,031 1,064 1,114 1,172 1,212 1,253 759 1,293 1,258 -2.7% q
The Economic Impact of Travel in California / 2022p / Prepared by Dean Runyan Associates 56
North Coast Region / Detail Trend
Details may not add to totals due to rounding.
*Other Travel includes ground transportation and air travel impacts to other California destinations, travel arrangement and convention/trade show services.
**Retail includes gasoline station employment and earnings.
Economic impacts are attributed to visitor trips which are defined as trips taken by individuals that stay overnight away from home, or travel more than 50 miles one-way on a non-routine trip, as defined by the California Tourism Marketing Act
Travel Impacts 2013-2022p 2013 2014 2015 2016 2017 2018 2019 2020 2021 2022 2021-2022 Travel Industry Earnings ($MIllion) 245 261 281 313 335 351 372 296 366 413 Accom. & Food Serv. 12.7% p 73 72 69 72 76 68 71 51 59 75 Arts, Ent. & Rec. 26.9% p 26 28 28 30 33 34 36 38 40 44 Retail** 10.0% p 12 13 14 16 18 25 27 11 13 10 Ground Tran. -22.8% q 1 1 1 1 7 8 10 10 29 30 Visitor Air Tran. 3.7% p 4 4 5 5 13 14 18 15 42 46 Other Travel* 11.3% p 362 TOTAL 379 399 437 483 500 533 421 548 617 12.6% p Travel Industry Employment (Jobs) 8,680 8,820 8,940 9,280 9,560 9,680 9,800 7,680 8,640 9,480 Accom. & Food Serv. 9.7% p 4,720 4,740 4,640 4,790 4,690 4,080 4,010 2,560 2,700 3,400 Arts, Ent. & Rec. 25.6% p 900 950 920 940 990 1,000 1,020 1,010 1,030 1,090 Retail** 5.4% p 340 350 360 380 390 490 530 490 520 470 Ground Tran. -9.2% q 20 20 30 30 80 80 100 90 210 210 Visitor Air Tran. -2.3% q 130 140 150 160 230 220 270 210 380 420 Other Travel* 10.2% p 14,800 TOTAL 15,020 15,030 15,580 15,930 15,550 15,740 12,040 13,490 15,060 11.6% p
Direct
The Economic Impact of Travel in California / 2022p / Prepared by Dean Runyan Associates 57
North Coast Region / Detail Trend
Details may not add to totals due to rounding.
Local tax receipts include transient occupancy taxes, sales taxes, and airport passenger facility charges paid by visitors, and the property tax payments and sales tax payments attributable to the travel industry income of employees and businesses. State tax receipts include sales tax payments and motor fuel tax payments of visitors, and the income tax payments and sales tax payments attributable to the travel industry income of employees and businesses.
Economic impacts are attributed to visitor trips which are defined as trips taken by individuals that stay overnight away from home, or travel more than 50 miles one-way on a non-routine trip, as defined by the California Tourism Marketing Act
Travel Impacts 2013-2022p 2013 2014 2015 2016 2017 2018 2019 2020 2021 2022 2021-2022 Tax Receipts Generated by Travel Spending ($Millions) 34 36 39 42 46 50 52 43 66 63 Local Tax Receipts -4.6% q 51 54 53 53 55 59 62 40 61 60 State Tax Receipts -1.3% q 85 TOTAL 90 93 95 100 109 114 83 127 123 -3.0% q Local Tax Receipts Generated by Travel Spending ($Millions) 22 24 27 28 31 35 36 26 43 41 Visitor -5.7% q 12 12 13 13 15 16 17 17 23 22 Business or Employee -2.6% q 34 TOTAL 36 39 42 46 50 52 43 66 63 -4.6% q State Tax Receipts Generated by Travel Spending ($Millions) 39 40 39 39 40 45 48 26 42 41 Visitor -1.6% q 13 13 14 14 14 13 14 14 19 19 Business or Employee -0.4% q 51 TOTAL 54 53 53 55 59 62 40 61 60 -1.3% q
Direct
The Economic Impact of Travel in California / 2022p / Prepared by Dean Runyan Associates 58
Orange County Region / Detail Trend
Details may not add to totals due to rounding.
*Other Travel includes ground transportation and air travel impacts to other California destinations, travel arrangement and convention/trade show services.
Economic impacts are attributed to visitor trips which are defined as trips taken by individuals that stay overnight away from home, or travel more than 50 miles one-way on a non-routine trip, as defined by the California Tourism Marketing Act
Direct Travel Impacts 2013-2022p 2013 2014 2015 2016 2017 2018 2019 2020 2021 2022 2021-2022 Direct Travel Spending ($Million) 9,655 10,397 11,229 11,964 12,252 12,186 12,673 5,920 9,796 13,174 Destination Spending 34.5% p 1,371 1,485 1,467 1,512 1,564 1,736 1,789 883 1,034 1,592 Other Travel* 53.9% p 11,026 TOTAL 11,883 12,696 13,477 13,815 13,922 14,463 6,803 10,830 14,766 36.3% p Visitor Spending by Type of Traveler Accommodation ($Million) 6,288 6,996 7,709 8,343 8,415 7,943 8,207 3,597 6,194 8,500 Hotel, Motel, STVR 37.2% p 1,263 1,375 1,452 1,477 1,641 1,848 2,013 950 1,992 2,303 Private Home 15.6% p 63 43 45 47 48 145 156 136 166 210 Campground 26.8% p 240 272 265 272 289 316 322 637 560 539 2nd Home -3.7% q 1,800 1,712 1,757 1,825 1,860 1,934 1,975 600 884 1,622 Day Travel 83.5% p 9,655 TOTAL 10,397 11,229 11,964 12,252 12,186 12,673 5,920 9,796 13,174 34.5% p Visitor Spending by Commodity Purchased ($Million) 2,075 2,259 2,489 2,710 2,717 2,984 3,101 1,335 2,433 3,718 Accommodations 52.8% p 2,665 2,872 3,085 3,342 3,445 3,248 3,385 1,677 2,620 3,334 Food Service 27.3% p 348 386 405 414 412 441 451 276 445 558 Food Stores 25.2% p 358 300 305 304 319 322 330 121 276 392 Local Tran. & Gas 42.2% p 2,413 2,627 2,798 2,957 2,979 2,794 2,831 1,348 2,049 2,548 Arts, Ent. & Rec. 24.3% p 1,452 1,589 1,756 1,844 1,992 1,975 2,159 1,042 1,764 2,160 Retail Sales 22.4% p 343 366 390 393 389 421 418 119 208 465 Visitor Air Tran. 123.5% p 9,655 TOTAL 10,397 11,229 11,964 12,252 12,186 12,673 5,920 9,796 13,174 34.5% p
The Economic Impact of Travel in California / 2022p / Prepared by Dean Runyan Associates 59
Orange County Region / Detail Trend
Details may not add to totals due to rounding.
*Other Travel includes ground transportation and air travel impacts to other California destinations, travel arrangement and convention/trade show services.
**Retail includes gasoline station employment and earnings.
Economic impacts are attributed to visitor trips which are defined as trips taken by individuals that stay overnight away from home, or travel more than 50 miles one-way on a non-routine trip, as defined by the California Tourism Marketing Act
Direct Travel Impacts 2013-2022p 2013 2014 2015 2016 2017 2018 2019 2020 2021 2022 2021-2022 Travel Industry Earnings ($MIllion) 1,869 1,984 2,176 2,422 2,510 2,594 2,749 2,016 2,472 3,210 Accom. & Food Serv. 29.9% p 1,365 1,562 1,713 1,900 2,065 1,926 1,973 1,098 1,375 1,827 Arts, Ent. & Rec. 32.8% p 222 245 275 292 302 301 315 314 351 367 Retail** 4.5% p 55 51 53 60 66 79 86 32 35 41 Ground Tran. 15.7% p 26 27 30 40 43 46 50 45 56 61 Visitor Air Tran. 9.6% p 236 274 288 338 348 379 392 322 275 339 Other Travel* 23.6% p 3,772 TOTAL 4,144 4,534 5,052 5,334 5,325 5,564 3,827 4,563 5,845 28.1% p Travel Industry Employment (Jobs) 57,480 60,020 62,540 66,580 67,180 65,570 66,920 50,020 56,200 65,820 Accom. & Food Serv. 17.1% p 37,430 41,200 44,990 47,550 48,110 48,970 49,410 26,940 30,690 45,290 Arts, Ent. & Rec. 47.6% p 6,440 6,910 7,490 7,750 7,930 7,690 7,750 7,220 7,470 7,430 Retail** -0.5% q 1,450 1,320 1,280 1,370 1,380 1,520 1,670 1,240 1,320 1,610 Ground Tran. 22.0% p 420 430 460 520 560 580 610 500 570 590 Visitor Air Tran. 3.2% p 4,580 5,220 5,200 5,760 5,940 6,080 6,010 4,740 3,530 4,220 Other Travel* 19.5% p 107,800 TOTAL 115,100 121,960 129,520 131,090 130,420 132,370 90,660 99,770 124,950 25.2% p
The Economic Impact of Travel in California / 2022p / Prepared by Dean Runyan Associates 60
Orange County Region / Detail Trend
Direct Travel Impacts 2013-2022p
Details may not add to totals due to rounding.
Local tax receipts include transient occupancy taxes, sales taxes, and airport passenger facility charges paid by visitors, and the property tax payments and sales tax payments attributable to the travel industry income of employees and businesses. State tax receipts include sales tax payments and motor fuel tax payments of visitors, and the income tax payments and sales tax payments attributable to the travel industry income of employees and businesses.
Economic impacts are attributed to visitor trips which are defined as trips taken by individuals that stay overnight away from home, or travel more than 50 miles one-way on a non-routine trip, as defined by the California Tourism Marketing Act
2013 2014 2015 2016 2017 2018 2019 2020 2021 2022 2021-2022 Tax Receipts Generated by Travel Spending ($Millions) 440 476 521 566 578 619 644 355 546 744 Local Tax Receipts 36.3% p 437 467 494 514 515 504 532 315 447 547 State Tax Receipts 22.3% p 876 TOTAL 943 1,015 1,080 1,093 1,123 1,176 670 993 1,291 30.0% p Local Tax Receipts Generated by Travel Spending ($Millions) 310 337 371 405 414 453 471 198 356 533 Visitor 49.6% p 130 139 151 162 164 166 173 157 189 210 Business or Employee 11.2% p 440 TOTAL 476 521 566 578 619 644 355 546 744 36.3% p State Tax Receipts Generated by Travel Spending ($Millions) 304 321 337 348 354 354 375 180 282 354 Visitor 25.2% p 133 146 157 166 161 151 157 135 165 193 Business or Employee 17.2% p 437 TOTAL 467 494 514 515 504 532 315 447 547 22.3% p
The Economic Impact of Travel in California / 2022p / Prepared by Dean Runyan Associates 61
San Diego County Region / Detail Trend
Details may not add to totals due to rounding.
*Other Travel includes ground transportation and air travel impacts to other California destinations, travel arrangement and convention/trade show services.
Economic impacts are attributed to visitor trips which are defined as trips taken by individuals that stay overnight away from home, or travel more than 50 miles one-way on a non-routine trip, as defined by the California Tourism Marketing Act
Direct Travel Impacts 2013-2022p 2013 2014 2015 2016 2017 2018 2019 2020 2021 2022 2021-2022 Direct Travel Spending ($Million) 10,167 10,542 10,839 11,466 12,062 11,854 11,859 4,989 9,004 11,393 Destination Spending 26.5% p 1,435 1,478 1,482 1,530 1,632 1,798 1,933 840 1,176 1,950 Other Travel* 65.9% p 11,602 TOTAL 12,020 12,321 12,996 13,694 13,652 13,792 5,828 10,180 13,344 31.1% p Visitor Spending by Type of Traveler Accommodation ($Million) 6,007 6,390 6,757 7,243 7,640 7,215 7,089 3,206 5,668 7,086 Hotel, Motel, STVR 25.0% p 1,182 1,223 1,218 1,249 1,356 1,485 1,594 492 1,420 1,717 Private Home 20.9% p 286 286 283 292 302 237 254 218 265 328 Campground 23.9% p 176 163 151 155 163 173 178 285 256 222 2nd Home -13.3% q 2,516 2,480 2,430 2,527 2,602 2,745 2,744 787 1,396 2,040 Day Travel 46.2% p 10,167 TOTAL 10,542 10,839 11,466 12,062 11,854 11,859 4,989 9,004 11,393 26.5% p Visitor Spending by Commodity Purchased ($Million) 2,446 2,675 2,908 3,146 3,288 3,588 3,472 1,729 3,026 4,315 Accommodations 42.6% p 2,767 2,843 2,907 3,136 3,330 3,045 3,080 1,337 2,374 2,558 Food Service 7.8% p 430 467 506 518 528 472 472 205 437 473 Food Stores 8.3% p 571 510 458 436 484 477 480 162 422 442 Local Tran. & Gas 4.7% p 1,633 1,613 1,584 1,672 1,729 1,610 1,588 589 1,010 1,151 Arts, Ent. & Rec. 14.0% p 1,636 1,687 1,686 1,757 1,873 1,788 1,837 684 1,270 1,473 Retail Sales 16.0% p 684 747 789 801 831 873 930 282 465 981 Visitor Air Tran. 110.9% p 10,167 TOTAL 10,542 10,839 11,466 12,062 11,854 11,859 4,989 9,004 11,393 26.5% p
The Economic Impact of Travel in California / 2022p / Prepared by Dean Runyan Associates 62
San Diego County Region / Detail Trend
Details may not add to totals due to rounding.
*Other Travel includes ground transportation and air travel impacts to other California destinations, travel arrangement and convention/trade show services.
**Retail includes gasoline station employment and earnings.
Economic impacts are attributed to visitor trips which are defined as trips taken by individuals that stay overnight away from home, or travel more than 50 miles one-way on a non-routine trip, as defined by the California Tourism Marketing Act
Direct Travel Impacts 2013-2022p 2013 2014 2015 2016 2017 2018 2019 2020 2021 2022 2021-2022 Travel Industry Earnings ($MIllion) 2,085 2,198 2,326 2,635 2,823 2,704 2,769 1,958 2,344 3,112 Accom. & Food Serv. 32.8% p 828 818 878 908 891 859 872 519 600 818 Arts, Ent. & Rec. 36.2% p 261 275 288 304 313 291 293 299 323 344 Retail** 6.5% p 53 47 43 49 56 67 70 21 23 24 Ground Tran. 4.8% p 49 50 56 71 79 84 94 91 88 97 Visitor Air Tran. 9.8% p 174 174 195 249 269 295 331 278 272 339 Other Travel* 24.8% p 3,448 TOTAL 3,563 3,785 4,216 4,432 4,299 4,429 3,166 3,650 4,734 29.7% p Travel Industry Employment (Jobs) 63,210 64,230 64,410 68,900 69,940 64,480 63,520 45,740 50,160 60,640 Accom. & Food Serv. 20.9% p 23,860 23,210 22,690 24,320 24,830 22,600 21,490 13,330 15,780 19,970 Arts, Ent. & Rec. 26.5% p 8,490 8,750 8,790 9,050 9,090 8,240 8,130 7,620 7,770 7,750 Retail** -0.4% q 1,410 1,220 1,060 1,130 1,180 1,290 1,380 880 920 1,050 Ground Tran. 14.4% p 830 860 920 1,170 1,370 1,400 1,690 1,460 1,380 1,430 Visitor Air Tran. 3.4% p 3,560 3,390 3,640 4,550 4,830 4,870 5,300 4,330 4,130 5,200 Other Travel* 26.1% p 101,360 TOTAL 101,670 101,510 109,110 111,240 102,890 101,500 73,360 80,140 96,040 19.8% p
The Economic Impact of Travel in California / 2022p / Prepared by Dean Runyan Associates 63
San Diego County Region / Detail Trend
Details may not add to totals due to rounding.
Local tax receipts include transient occupancy taxes, sales taxes, and airport passenger facility charges paid by visitors, and the property tax payments and sales tax payments attributable to the travel industry income of employees and businesses. State tax receipts include sales tax payments and motor fuel tax payments of visitors, and the income tax payments and sales tax payments attributable to the travel industry income of employees and businesses.
Economic impacts are attributed to visitor trips which are defined as trips taken by individuals that stay overnight away from home, or travel more than 50 miles one-way on a non-routine trip, as defined by the California Tourism Marketing Act
2013-2022p 2013 2014 2015 2016 2017 2018 2019 2020 2021 2022 2021-2022 Tax Receipts Generated by Travel Spending ($Millions) 445 474 509 547 570 606 602 342 521 690 Local Tax Receipts 32.5% p 468 479 479 492 501 482 496 267 398 452 State Tax Receipts 13.3% p 913 TOTAL 952 987 1,040 1,070 1,089 1,097 609 919 1,142 24.2% p Local Tax Receipts Generated by Travel Spending ($Millions) 327 354 383 413 434 473 464 212 370 520 Visitor 40.7% p 118 119 125 135 136 133 137 130 151 170 Business or Employee 12.5% p 445 TOTAL 474 509 547 570 606 602 342 521 690 32.5% p State Tax Receipts Generated by Travel Spending ($Millions) 346 352 347 354 366 359 370 155 264 293 Visitor 11.1% p 122 127 132 139 135 123 126 111 135 158 Business or Employee 17.7% p 468 TOTAL 479 479 492 501 482 496 267 398 452 13.3% p
Direct Travel Impacts
The Economic Impact of Travel in California / 2022p / Prepared
Runyan Associates 64
by Dean
San Francisco Bay Area Region / Detail Trend
Details may not add to totals due to rounding.
*Other Travel includes ground transportation and air travel impacts to other California destinations, travel arrangement and convention/trade show services.
Economic impacts are attributed to visitor trips which are defined as trips taken by individuals that stay overnight away from home, or travel more than 50 miles one-way on a non-routine trip, as defined by the California Tourism Marketing Act
Direct Travel Impacts 2013-2022p 2013 2014 2015 2016 2017 2018 2019 2020 2021 2022 2021-2022 Direct Travel Spending ($Million) 25,458 27,785 29,043 29,679 30,967 32,592 33,077 12,350 19,494 28,481 Destination Spending 46.1% p 3,753 4,044 4,325 4,654 5,187 5,471 5,785 3,024 3,704 5,714 Other Travel* 54.3% p 29,211 TOTAL 31,829 33,368 34,334 36,154 38,063 38,862 15,374 23,198 34,196 47.4% p Visitor Spending by Type of Traveler Accommodation ($Million) 16,412 18,366 19,594 20,194 21,022 22,026 22,152 8,758 12,006 18,661 Hotel, Motel, STVR 55.4% p 3,119 3,203 3,190 3,187 3,428 3,713 3,921 987 3,250 3,617 Private Home 11.3% p 287 353 353 354 374 395 427 362 445 572 Campground 28.6% p 368 374 386 390 417 460 471 591 528 544 2nd Home 2.9% p 5,271 5,489 5,520 5,554 5,727 5,999 6,107 1,652 3,264 5,087 Day Travel 55.8% p 25,458 TOTAL 27,785 29,043 29,679 30,967 32,592 33,077 12,350 19,494 28,481 46.1% p Visitor Spending by Commodity Purchased ($Million) 5,633 6,771 7,577 7,938 8,217 8,625 8,856 3,324 4,314 7,204 Accommodations 67.0% p 6,687 7,098 7,469 7,796 8,213 8,645 8,771 3,552 5,809 7,794 Food Service 34.2% p 736 793 821 823 834 849 855 365 714 945 Food Stores 32.4% p 3,434 3,595 3,384 3,196 3,472 3,861 3,911 1,297 2,376 3,612 Local Tran. & Gas 52.0% p 3,669 3,896 4,006 4,101 4,208 4,325 4,280 1,656 2,646 3,452 Arts, Ent. & Rec. 30.4% p 3,680 3,884 3,966 4,001 4,204 4,428 4,524 1,697 2,916 3,913 Retail Sales 34.2% p 1,619 1,748 1,820 1,825 1,820 1,858 1,880 460 720 1,562 Visitor Air Tran. 116.8% p 25,458 TOTAL 27,785 29,043 29,679 30,967 32,592 33,077 12,350 19,494 28,481 46.1% p
The Economic Impact of Travel in California / 2022p / Prepared by Dean Runyan Associates 65
San Francisco Bay Area Region / Detail Trend
Details may not add to totals due to rounding.
*Other Travel includes ground transportation and air travel impacts to other California destinations, travel arrangement and convention/trade show services.
**Retail includes gasoline station employment and earnings.
Economic impacts are attributed to visitor trips which are defined as trips taken by individuals that stay overnight away from home, or travel more than 50 miles one-way on a non-routine trip, as defined by the California Tourism Marketing Act
Direct Travel Impacts 2013-2022p 2013 2014 2015 2016 2017 2018 2019 2020 2021 2022 2021-2022 Travel Industry Earnings ($MIllion) 4,684 5,198 5,743 6,256 6,608 7,063 7,386 4,826 5,467 6,885 Accom. & Food Serv. 25.9% p 1,969 2,157 2,316 2,457 2,453 2,618 2,692 1,840 2,074 2,532 Arts, Ent. & Rec. 22.1% p 580 626 658 677 704 733 736 715 782 776 Retail** -0.7% q 325 357 387 421 469 605 640 234 256 349 Ground Tran. 36.6% p 845 864 937 1,192 1,357 1,409 764 714 513 559 Visitor Air Tran. 9.1% p 1,353 1,434 1,628 1,999 2,332 2,463 1,906 1,710 1,530 1,717 Other Travel* 12.2% p 9,757 TOTAL 10,636 11,670 13,002 13,922 14,892 14,124 10,038 10,621 12,818 20.7% p Travel Industry Employment (Jobs) 126,550 134,350 139,320 142,250 145,140 147,580 144,880 95,300 100,450 120,150 Accom. & Food Serv. 19.6% p 53,790 56,150 58,170 59,750 61,880 62,500 62,730 39,920 43,780 55,960 Arts, Ent. & Rec. 27.8% p 14,950 15,790 15,580 16,060 15,910 15,890 15,450 13,950 14,220 14,170 Retail** -0.3% q 8,320 8,760 9,090 9,290 9,610 11,570 12,300 7,570 8,240 10,900 Ground Tran. 32.3% p 9,800 10,050 10,510 11,360 11,910 11,970 8,410 7,020 5,160 5,330 Visitor Air Tran. 3.3% p 17,270 17,790 19,270 21,370 22,590 23,100 20,720 16,580 13,870 14,740 Other Travel* 6.3% p 230,680 TOTAL 242,890 251,930 260,070 267,050 272,600 264,480 180,330 185,720 221,260 19.1% p
The Economic Impact of Travel in California / 2022p / Prepared by Dean Runyan Associates 66
San Francisco Bay Area Region / Detail Trend
Details may not add to totals due to rounding.
Local tax receipts include transient occupancy taxes, sales taxes, and airport passenger facility charges paid by visitors, and the property tax payments and sales tax payments attributable to the travel industry income of employees and businesses. State tax receipts include sales tax payments and motor fuel tax payments of visitors, and the income tax payments and sales tax payments attributable to the travel industry income of employees and businesses.
Economic impacts are attributed to visitor trips which are defined as trips taken by individuals that stay overnight away from home, or travel more than 50 miles one-way on a non-routine trip, as defined by the California Tourism Marketing Act
Direct Travel Impacts 2013-2022p 2013 2014 2015 2016 2017 2018 2019 2020 2021 2022 2021-2022 Tax Receipts Generated by Travel Spending ($Millions) 1,238 1,419 1,553 1,641 1,692 1,857 1,863 946 1,174 1,646 Local Tax Receipts 40.2% p 1,215 1,294 1,314 1,323 1,337 1,426 1,440 742 1,028 1,299 State Tax Receipts 26.4% p 2,453 TOTAL 2,713 2,867 2,964 3,029 3,283 3,303 1,688 2,201 2,944 33.7% p Local Tax Receipts Generated by Travel Spending ($Millions) 884 1,039 1,140 1,198 1,234 1,360 1,393 504 703 1,150 Visitor 63.6% p 353 380 413 443 458 497 470 442 471 495 Business or Employee 5.2% p 1,238 TOTAL 1,419 1,553 1,641 1,692 1,857 1,863 946 1,174 1,646 40.2% p State Tax Receipts Generated by Travel Spending ($Millions) 888 940 935 924 947 1,040 1,070 424 677 903 Visitor 33.5% p 327 355 379 399 390 386 370 318 351 395 Business or Employee 12.6% p 1,215 TOTAL 1,294 1,314 1,323 1,337 1,426 1,440 742 1,028 1,299 26.4% p
The Economic Impact of Travel in California / 2022p / Prepared by Dean Runyan Associates 67
Shasta Cascade Region / Detail Trend
Details may not add to totals due to rounding.
*Other Travel includes ground transportation and air travel impacts to other California destinations, travel arrangement and convention/trade show services.
Economic impacts are attributed to visitor trips which are defined as trips taken by individuals that stay overnight away from home, or travel more than 50 miles one-way on a non-routine trip, as defined by the California Tourism Marketing Act
Direct Travel Impacts 2013-2022p 2013 2014 2015 2016 2017 2018 2019 2020 2021 2022 2021-2022 Direct Travel Spending ($Million) 1,204 1,230 1,224 1,249 1,326 1,426 1,542 940 1,389 1,453 Destination Spending 4.7% p 58 58 51 47 51 59 63 22 37 55 Other Travel* 48.2% p 1,263 TOTAL 1,288 1,275 1,296 1,377 1,485 1,604 962 1,425 1,508 5.8% p Visitor Spending by Type of Traveler Accommodation ($Million) 433 445 460 489 517 553 617 400 635 477 Hotel, Motel, STVR -24.8% q 212 212 198 195 214 233 252 75 231 259 Private Home 11.8% p 129 138 137 137 145 153 164 136 170 220 Campground 29.3% p 150 151 151 153 162 175 179 230 206 248 2nd Home 19.9% p 280 284 277 275 289 313 330 99 145 249 Day Travel 71.5% p 1,204 TOTAL 1,230 1,224 1,249 1,326 1,426 1,542 940 1,389 1,453 4.7% p Visitor Spending by Commodity Purchased ($Million) 237 248 261 279 294 312 347 302 385 390 Accommodations 1.3% p 322 326 338 356 374 394 425 249 391 377 Food Service -3.6% q 73 76 78 78 79 80 85 59 91 110 Food Stores 20.2% p 250 254 228 207 230 265 281 109 184 234 Local Tran. & Gas 27.1% p 167 169 171 176 180 186 195 114 165 160 Arts, Ent. & Rec. -3.5% q 152 154 146 149 165 186 204 106 168 177 Retail Sales 5.1% p 3 3 3 3 3 3 5 1 3 6 Visitor Air Tran. 70.3% p 1,204 TOTAL 1,230 1,224 1,249 1,326 1,426 1,542 940 1,389 1,453 4.7% p
The Economic Impact of Travel in California / 2022p / Prepared by Dean Runyan Associates 68
Shasta Cascade Region / Detail Trend
Details may not add to totals due to rounding.
*Other Travel includes ground transportation and air travel impacts to other California destinations, travel arrangement and convention/trade show services.
**Retail includes gasoline station employment and earnings.
Economic impacts are attributed to visitor trips which are defined as trips taken by individuals that stay overnight away from home, or travel more than 50 miles one-way on a non-routine trip, as defined by the California Tourism Marketing Act
Direct Travel Impacts 2013-2022p 2013 2014 2015 2016 2017 2018 2019 2020 2021 2022 2021-2022 Travel Industry Earnings ($MIllion) 236 247 265 288 307 314 352 305 360 400 Accom. & Food Serv. 11.3% p 70 68 67 72 73 77 84 63 77 90 Arts, Ent. & Rec. 16.5% p 34 36 36 38 40 42 45 48 52 55 Retail** 7.2% p 15 16 16 18 21 31 34 13 12 11 Ground Tran. -10.7% q 2 2 1 2 3 3 3 3 3 3 Visitor Air Tran. -0.9% q 6 7 6 8 9 9 9 10 11 13 Other Travel* 23.1% p 363 TOTAL 375 392 426 454 475 527 442 515 573 11.3% p Travel Industry Employment (Jobs) 9,390 9,410 9,420 9,560 9,880 9,760 10,130 8,540 9,370 9,920 Accom. & Food Serv. 5.9% p 3,850 3,610 3,510 3,580 3,580 3,690 3,920 2,920 3,450 3,860 Arts, Ent. & Rec. 11.8% p 1,240 1,260 1,230 1,250 1,290 1,300 1,330 1,370 1,410 1,450 Retail** 2.9% p 420 420 420 440 460 600 680 590 580 600 Ground Tran. 3.6% p 20 20 20 30 40 40 40 30 40 30 Visitor Air Tran. -6.6% q 200 210 210 250 250 260 260 250 260 310 Other Travel* 18.3% p 15,110 TOTAL 14,950 14,810 15,110 15,490 15,640 16,350 13,700 15,110 16,180 7.1% p
The Economic Impact of Travel in California / 2022p / Prepared by Dean Runyan Associates 69
Shasta Cascade Region / Detail Trend
Details may not add to totals due to rounding.
Local tax receipts include transient occupancy taxes, sales taxes, and airport passenger facility charges paid by visitors, and the property tax payments and sales tax payments attributable to the travel industry income of employees and businesses. State tax receipts include sales tax payments and motor fuel tax payments of visitors, and the income tax payments and sales tax payments attributable to the travel industry income of employees and businesses.
Economic impacts are attributed to visitor trips which are defined as trips taken by individuals that stay overnight away from home, or travel more than 50 miles one-way on a non-routine trip, as defined by the California Tourism Marketing Act
Direct Travel Impacts 2013-2022p 2013 2014 2015 2016 2017 2018 2019 2020 2021 2022 2021-2022 Tax Receipts Generated by Travel Spending ($Millions) 32 33 34 37 38 43 48 41 54 52 Local Tax Receipts -3.5% q 66 68 66 64 66 75 82 51 70 73 State Tax Receipts 4.9% p 98 TOTAL 101 100 101 105 118 129 91 124 125 1.2% p Local Tax Receipts Generated by Travel Spending ($Millions) 20 21 22 24 25 29 32 23 34 33 Visitor -3.5% q 12 12 12 13 13 14 16 17 20 20 Business or Employee -3.6% q 32 TOTAL 33 34 37 38 43 48 41 54 52 -3.5% q State Tax Receipts Generated by Travel Spending ($Millions) 53 54 51 50 52 61 66 34 50 53 Visitor 6.9% p 13 14 14 15 14 14 15 17 20 20 Business or Employee -0.3% q 66 TOTAL 68 66 64 66 75 82 51 70 73 4.9% p
The Economic Impact of Travel in California / 2022p / Prepared by Dean Runyan Associates 70
The Deserts Region / Detail Trend
Details may not add to totals due to rounding.
*Other Travel includes ground transportation and air travel impacts to other California destinations, travel arrangement and convention/trade show services.
Economic impacts are attributed to visitor trips which are defined as trips taken by individuals that stay overnight away from home, or travel more than 50 miles one-way on a non-routine trip, as defined by the California Tourism Marketing Act
Direct Travel Impacts 2013-2022p 2013 2014 2015 2016 2017 2018 2019 2020 2021 2022 2021-2022 Direct Travel Spending ($Million) 5,831 5,984 6,190 6,433 6,797 7,345 7,685 5,561 5,836 7,393 Destination Spending 26.7% p 363 368 350 350 340 387 398 173 255 497 Other Travel* 95.1% p 6,194 TOTAL 6,352 6,540 6,783 7,137 7,732 8,083 5,735 6,091 7,890 29.5% p Visitor Spending by Type of Traveler Accommodation ($Million) 2,301 2,415 2,580 2,783 2,916 3,176 3,343 2,322 2,642 3,152 Hotel, Motel, STVR 19.3% p 476 483 472 465 514 573 615 321 535 627 Private Home 17.1% p 325 327 326 327 345 364 393 321 411 528 Campground 28.3% p 964 983 1,010 1,025 1,097 1,197 1,225 1,768 1,587 1,506 2nd Home -5.1% q 1,765 1,776 1,803 1,832 1,925 2,035 2,109 829 660 1,581 Day Travel 139.4% p 5,831 TOTAL 5,984 6,190 6,433 6,797 7,345 7,685 5,561 5,836 7,393 26.7% p Visitor Spending by Commodity Purchased ($Million) 1,034 1,110 1,198 1,308 1,363 1,458 1,518 1,295 1,678 1,987 Accommodations 18.5% p 1,685 1,709 1,816 1,933 2,038 2,173 2,293 1,786 1,643 2,014 Food Service 22.6% p 234 240 250 253 257 264 275 225 267 340 Food Stores 27.7% p 986 1,003 932 870 959 1,099 1,150 577 719 1,024 Local Tran. & Gas 42.5% p 895 909 944 985 1,015 1,058 1,087 807 716 857 Arts, Ent. & Rec. 19.7% p 910 917 953 982 1,055 1,174 1,224 817 737 1,009 Retail Sales 36.9% p 86 97 98 102 109 120 139 55 78 162 Visitor Air Tran. 108.1% p 5,831 TOTAL 5,984 6,190 6,433 6,797 7,345 7,685 5,561 5,836 7,393 26.7% p
The Economic Impact of Travel in California / 2022p / Prepared by Dean Runyan Associates 71
The Deserts Region / Detail Trend
Details may not add to totals due to rounding.
*Other Travel includes ground transportation and air travel impacts to other California destinations, travel arrangement and convention/trade show services.
**Retail includes gasoline station employment and earnings.
Economic impacts are attributed to visitor trips which are defined as trips taken by individuals that stay overnight away from home, or travel more than 50 miles one-way on a non-routine trip, as defined by the California Tourism Marketing Act
Direct Travel Impacts 2013-2022p 2013 2014 2015 2016 2017 2018 2019 2020 2021 2022 2021-2022 Travel Industry Earnings ($MIllion) 906 972 1,056 1,176 1,258 1,364 1,462 1,191 1,361 1,650 Accom. & Food Serv. 21.3% p 390 422 434 471 493 524 556 407 492 586 Arts, Ent. & Rec. 19.2% p 151 155 166 174 180 194 198 206 209 234 Retail** 12.1% p 65 68 75 84 95 128 142 85 52 56 Ground Tran. 8.9% p 22 17 20 17 19 20 18 17 21 22 Visitor Air Tran. 2.2% p 77 73 77 90 73 78 78 65 81 118 Other Travel* 45.4% p 1,610 TOTAL 1,707 1,828 2,011 2,117 2,307 2,454 1,972 2,215 2,667 20.4% p Travel Industry Employment (Jobs) 37,090 38,640 40,090 41,930 43,330 44,860 46,170 38,010 39,780 45,470 Accom. & Food Serv. 14.3% p 16,130 17,140 17,530 18,060 18,270 18,850 19,600 13,440 15,540 18,190 Arts, Ent. & Rec. 17.1% p 5,230 5,340 5,430 5,530 5,620 5,880 5,840 5,670 5,350 5,680 Retail** 6.1% p 1,700 1,730 1,800 1,890 1,960 2,470 2,750 3,150 1,860 2,220 Ground Tran. 19.3% p 340 280 310 260 270 270 260 220 230 220 Visitor Air Tran. -3.5% q 1,490 1,510 1,530 1,900 1,790 1,900 1,850 1,420 1,630 2,000 Other Travel* 22.5% p 61,970 TOTAL 64,640 66,690 69,570 71,240 74,230 76,460 61,910 64,400 73,780 14.6% p
The Economic Impact of Travel in California / 2022p / Prepared by Dean Runyan Associates 72
The Deserts Region / Detail Trend
Details may not add to totals due to rounding.
Local tax receipts include transient occupancy taxes, sales taxes, and airport passenger facility charges paid by visitors, and the property tax payments and sales tax payments attributable to the travel industry income of employees and businesses. State tax receipts include sales tax payments and motor fuel tax payments of visitors, and the income tax payments and sales tax payments attributable to the travel industry income of employees and businesses.
Economic impacts are attributed to visitor trips which are defined as trips taken by individuals that stay overnight away from home, or travel more than 50 miles one-way on a non-routine trip, as defined by the California Tourism Marketing Act
Direct Travel Impacts 2013-2022p 2013 2014 2015 2016 2017 2018 2019 2020 2021 2022 2021-2022 Tax Receipts Generated by Travel Spending ($Millions) 173 183 199 218 229 257 270 215 268 314 Local Tax Receipts 17.4% p 304 313 315 316 324 362 383 284 289 352 State Tax Receipts 21.8% p 477 TOTAL 496 514 535 553 618 653 499 557 666 19.7% p Local Tax Receipts Generated by Travel Spending ($Millions) 113 121 133 148 158 179 187 126 161 205 Visitor 27.4% p 60 62 66 70 71 78 83 89 106 109 Business or Employee 2.3% p 173 TOTAL 183 199 218 229 257 270 215 268 314 17.4% p State Tax Receipts Generated by Travel Spending ($Millions) 241 246 245 244 253 289 306 204 197 252 Visitor 28.1% p 63 67 70 73 71 72 77 81 93 101 Business or Employee 8.5% p 304 TOTAL 313 315 316 324 362 383 284 289 352 21.8% p
The Economic Impact of Travel in California / 2022p / Prepared by Dean Runyan Associates 73
County Impacts 2022p
County / Summary
Direct Travel Impacts 2022p
Travel Spending Total (Millions) Visitor (Millions) Earnings (Millions) Employ. (Jobs) Local Tax (Millions) State Tax (Millions) Total Tax (Millions) Alameda $3,791 $1,599 27,280 $188 $162 $350 $2,999 Alpine $30 $4 180 $1 $1 $2 $30 Amador $148 $93 2,550 $6 $8 $14 $142 Butte $342 $116 3,750 $10 $18 $28 $308 Calaveras $246 $128 2,950 $8 $11 $19 $238 Colusa $49 $14 630 $2 $2 $4 $46 Contra Costa $1,682 $748 15,700 $58 $95 $153 $1,446 Del Norte $153 $68 1,530 $7 $7 $14 $149 El Dorado $1,005 $596 13,070 $55 $46 $101 $955 Fresno $1,597 $542 15,740 $50 $81 $130 $1,302 Glenn $55 $25 840 $2 $3 $5 $51 Humboldt $502 $258 5,960 $25 $24 $49 $468 Imperial $509 $130 4,100 $15 $24 $40 $481 Inyo $251 $79 2,650 $12 $9 $21 $247 Kern $1,890 $764 19,500 $59 $102 $161 $1,725 Kings $213 $92 2,820 $6 $13 $18 $190 Lake $176 $61 1,820 $5 $8 $13 $163 Lassen $71 $27 1,080 $2 $4 $6 $66 Los Angeles $28,493 $14,750 210,760 $1,606 $1,161 $2,767 $22,453 Madera $347 $169 4,810 $17 $17 $34 $316 The Economic Impact of Travel in California / 2022p / Prepared by Dean Runyan Associates 75
County / Summary
Direct Travel Impacts 2022p
Total (Millions) Visitor (Millions) Earnings (Millions) Employ. (Jobs) Local Tax (Millions) State Tax (Millions) Total Tax (Millions) Marin $852 $341 5,570 $41 $32 $73 $654 Mariposa $351 $171 5,670 $25 $11 $36 $348 Mendocino $469 $231 5,740 $26 $21 $47 $455 Merced $309 $113 3,630 $10 $18 $28 $268 Modoc $27 $12 310 $1 $1 $2 $26 Mono $584 $223 6,000 $44 $17 $61 $581 Monterey $3,054 $1,460 25,370 $176 $131 $307 $2,954 Napa $1,701 $870 18,050 $115 $69 $184 $1,640 Nevada $420 $180 3,800 $20 $18 $38 $405 Orange $14,766 $5,845 124,950 $744 $547 $1,291 $13,174 Placer $1,348 $616 15,640 $60 $60 $120 $1,272 Plumas $143 $57 1,440 $5 $6 $12 $140 Riverside $8,788 $3,154 87,340 $338 $389 $727 $8,104 Sacramento $3,908 $1,346 32,000 $137 $165 $302 $2,988 San Benito $141 $52 1,130 $6 $7 $13 $131 San Bernardino $5,548 $2,023 56,340 $183 $254 $437 $4,879 San Diego $13,344 $4,734 96,040 $690 $452 $1,142 $11,393 San Francisco $12,151 $3,765 50,850 $529 $350 $879 $8,929 San Joaquin $1,203 $399 10,090 $45 $64 $110 $1,082 San Luis Obispo $2,152 $865 22,480 $116 $90 $206 $2,077 The Economic Impact of Travel in California / 2022p / Prepared
Runyan Associates 76
Travel Spending
by Dean
County / Summary
Direct Travel Impacts 2022p
Details may not add to totals due to rounding.
*Sum of county visitor spending is less than statewide visitor spending because a portion of county ground transportation is allocated to "other travel" at the county level.
Note: Total Earnings includes wage and salary disbursements, other earned income and proprietor income. Employment includes payroll employees and proprietors.
Travel Spending Total (Millions) Visitor (Millions) Earnings (Millions) Employ. (Jobs) Local Tax (Millions) State Tax (Millions) Total Tax (Millions) San Mateo $3,857 $2,168 35,180 $246 $196 $442 $3,632 Santa Barbara $2,078 $846 19,410 $122 $85 $207 $1,924 Santa Clara $6,231 $2,034 37,480 $265 $237 $502 $4,914 Santa Cruz $1,580 $365 9,420 $70 $64 $133 $1,535 Shasta $495 $191 5,110 $19 $23 $43 $458 Sierra $20 $6 290 $1 $1 $1 $20 Siskiyou $203 $86 1,850 $8 $9 $17 $196 Solano $789 $297 8,640 $27 $41 $68 $717 Sonoma $2,299 $931 21,150 $130 $93 $223 $2,127 Stanislaus $604 $222 6,650 $20 $35 $55 $519 Sutter $102 $43 1,440 $3 $6 $10 $87 Tehama $163 $59 1,810 $5 $8 $13 $153 Trinity $65 $24 830 $2 $3 $4 $63 Tulare $550 $212 6,000 $23 $29 $51 $477 Tuolumne $251 $97 2,550 $10 $11 $21 $242 Ventura $1,763 $619 15,730 $66 $87 $153 $1,570 Yolo $419 $155 5,110 $16 $22 $38 $385 Yuba $115 $40 1,560 $3 $7 $10 $104 California $134,391 $55,116 1,090,350 $6,482 $5,455 $11,937 *
The Economic Impact of Travel in California / 2022p / Prepared by Dean Runyan Associates 77
County / Summary Trend
Direct Travel Spending 2013-2022p
2013 2014 2015 2016 2017 2018 2019 2020 2021 2022 2021-22 2019-22 Spending ($Million) Alameda 3,543 3,738 3,896 3,974 4,170 4,502 4,524 1,838 2,923 3,791 29.7% p -16.2%q Total (Current $) 771 815 838 837 913 967 996 371 517 792 53.2% p -20.4%q Other 2,773 2,923 3,058 3,137 3,257 3,535 3,528 1,468 2,405 2,999 24.7% p -15.0%q Visitor 2,113 2,235 2,375 2,462 2,565 2,792 2,799 1,239 1,973 2,385 20.9% p -14.8%q Non-transportation 660 688 683 674 692 743 730 229 433 614 41.9% p -15.9%q Transportation Alpine 27.8 26.6 28.8 33.7 34.6 35.9 38.1 28.4 28.1 30.1 7.1% p -21.0%q Total (Current $) 0.2 0.2 0.2 0.1 0.2 0.2 0.2 0.1 0.1 0.2 42.3% p -17.5%q Other 27.6 26.4 28.7 33.6 34.4 35.7 37.9 28.4 28.0 29.9 6.9% p -21.0%q Visitor 25.1 23.9 26.4 31.4 32.0 32.9 34.9 26.8 26.2 27.5 5.0% p -21.3%q Non-transportation 2.5 2.5 2.3 2.2 2.4 2.8 3.0 1.6 1.8 2.4 35.0% p -17.8%q Transportation Amador 121.4 130.5 133.5 140.3 143.7 155.6 165.5 91.0 132.7 148.1 11.6% p -10.5%q Total (Current $) 6.4 6.4 5.7 5.1 5.8 6.9 7.2 2.5 4.1 5.9 42.3% p -18.7%q Other 114.9 124.1 127.7 135.3 137.9 148.7 158.2 88.5 128.5 142.2 10.7% p -10.1%q Visitor 98.6 106.2 111.3 119.8 121.2 129.4 137.7 79.3 114.1 123.9 8.6% p -10.1%q Non-transportation 16.3 17.8 16.5 15.5 16.7 19.3 20.5 9.2 14.5 18.4 26.8% p -10.5%q Transportation Butte 304.1 308.3 301.1 302.4 331.7 354.2 382.5 194.6 308.2 341.9 10.9% p -10.6%q Total (Current $) 42.4 42.4 36.1 32.0 36.0 42.1 43.7 14.6 23.8 33.7 41.7% p -22.9%q Other 261.7 265.9 265.0 270.4 295.8 312.2 338.7 180.0 284.4 308.2 8.4% p -9.0% q Visitor 206.4 210.2 215.2 224.8 244.1 254.0 277.2 160.9 246.3 259.2 5.2% p -6.5% q Non-transportation 55.3 55.8 49.8 45.7 51.6 58.2 61.5 19.2 38.1 49.0 28.6% p -20.2%q Transportation Details may not add to totals due to rounding. Percent change calculated on unrounded figures. Percent change calculated on unrounded figures. The Economic Impact of Travel in California / 2022p / Prepared by Dean Runyan Associates 78
County / Summary Trend
2013 2014 2015 2016 2017 2018 2019 2020 2021 2022 2021-22 2019-22 Spending ($Million) Calaveras 172.2 179.3 180.8 188.1 195.9 209.7 222.7 171.2 216.5 246.0 13.6% p 10.5% p Total (Current $) 8.8 8.9 8.1 7.4 8.3 9.5 9.9 3.9 5.9 8.3 40.0% p -16.0%q Other 163.4 170.4 172.7 180.7 187.7 200.2 212.8 167.3 210.6 237.7 12.9% p 11.7% p Visitor 138.1 144.2 149.0 158.6 163.5 172.8 183.7 151.5 189.2 209.3 10.6% p 13.9% p Non-transportation 25.3 26.2 23.8 22.1 24.1 27.4 29.1 15.8 21.4 28.4 32.7% p -2.4% q Transportation Colusa 47.6 46.9 46.0 48.0 51.0 56.5 59.0 29.0 48.0 48.9 2.0% p -17.0%q Total (Current $) 3.7 3.7 3.3 2.9 3.3 3.8 4.0 1.3 2.2 3.2 42.3% p -19.8%q Other 43.9 43.1 42.7 45.1 47.7 52.7 55.0 27.6 45.8 45.8 0.0% q -16.8%q Visitor 37.6 37.0 37.1 39.9 42.0 46.0 48.1 25.4 41.6 41.0 -1.3% q -14.7%q Non-transportation 6.3 6.2 5.5 5.2 5.7 6.7 6.9 2.2 4.2 4.7 13.0% p -31.4%q Transportation Contra Costa 1,572 1,641 1,608 1,714 1,809 1,930 2,004 680 1,452 1,682 15.9% p -16.0%q Total (Current $) 232 239 225 210 229 254 264 109 162 237 46.2% p -10.5%q Other 1,340 1,403 1,383 1,504 1,580 1,676 1,739 571 1,290 1,446 12.1% p -16.9%q Visitor 1,122 1,173 1,177 1,306 1,365 1,432 1,488 514 1,127 1,238 9.9% p -16.8%q Non-transportation 219 230 206 198 215 244 251 57 163 207 27.3% p -17.4%q Transportation Del Norte 115.3 120.8 122.9 129.9 132.3 142.0 150.5 88.8 150.1 152.9 1.9% p 1.6% p Total (Current $) 5.8 5.7 4.6 4.5 4.9 5.6 5.8 1.7 2.9 4.1 42.3% p -29.4%q Other 109.5 115.1 118.3 125.4 127.4 136.4 144.7 87.1 147.2 148.8 1.1% p 2.8% p Visitor 92.1 97.0 102.0 109.4 110.6 117.1 124.2 76.8 130.0 128.7 -1.0% q 3.7% p Non-transportation 17.4 18.1 16.3 16.1 16.9 19.3 20.6 10.3 17.2 20.1 16.7% p -2.3% q Transportation Details may not add to totals due to rounding. Percent change calculated on unrounded figures. Percent change calculated on unrounded figures. The Economic Impact of Travel in California / 2022p / Prepared by Dean Runyan Associates 79
Direct Travel Spending 2013-2022p
County / Summary Trend
Direct Travel Spending 2013-2022p
2013 2014 2015 2016 2017 2018 2019 2020 2021 2022 2021-22 2019-22 Spending ($Million) El Dorado 778 806 892 942 987 1,064 1,143 803 843 1,005 19.3% p -12.1%q Total (Current $) 52 47 45 43 48 54 56 27 36 50 37.0% p -11.3%q Other 725 759 847 899 940 1,010 1,087 777 806 955 18.5% p -12.1%q Visitor 642 673 763 819 853 909 978 718 746 871 16.7% p -11.0%q Non-transportation 84 86 84 79 86 101 109 58 60 85 40.4% p -22.2%q Transportation Fresno 1,310 1,348 1,345 1,364 1,426 1,587 1,661 935 1,215 1,597 31.4% p -3.8% q Total (Current $) 259 267 251 238 262 300 315 125 198 295 48.9% p -6.2% q Other 1,051 1,082 1,094 1,127 1,164 1,286 1,346 810 1,017 1,302 28.0% p -3.3% q Visitor 743 764 791 834 857 937 978 641 776 954 22.9% p -2.4% q Non-transportation 308 318 304 293 307 349 368 169 241 348 44.5% p -5.5% q Transportation Glenn 50.1 51.8 41.1 32.9 50.7 60.4 63.6 29.6 51.9 55.2 6.3% p -13.2%q Total (Current $) 4.9 4.9 4.3 3.8 4.2 4.9 5.1 1.8 2.9 4.2 42.3% p -18.5%q Other 45.2 46.9 36.8 29.1 46.5 55.4 58.5 27.8 49.0 51.0 4.1% p -12.8%q Visitor 38.6 40.0 31.6 25.0 40.9 48.2 50.9 25.5 44.2 45.3 2.5% p -11.0%q Non-transportation 6.6 6.8 5.2 4.1 5.6 7.2 7.6 2.3 4.8 5.7 18.5% p -24.8%q Transportation Humboldt 396.6 412.2 422.5 428.6 452.1 486.2 483.7 253.8 500.0 502.1 0.4% p 3.8% p Total (Current $) 31.7 31.1 29.6 28.7 30.8 33.3 37.3 12.9 23.0 33.9 47.4% p -9.2% q Other 364.8 381.1 392.9 399.9 421.3 452.9 446.5 240.9 477.0 468.2 -1.8% q 4.9% p Visitor 299.4 313.6 328.4 338.1 354.7 378.0 370.5 208.5 411.4 396.3 -3.7% q 7.0% p Non-transportation 65.4 67.5 64.6 61.8 66.6 74.8 76.0 32.4 65.6 71.9 9.6% p -5.4% q Transportation Details may not add to totals due to rounding. Percent change calculated on unrounded figures. Percent change calculated on unrounded figures. The Economic Impact of Travel in California / 2022p / Prepared by Dean Runyan Associates 80
County / Summary Trend
2013 2014 2015 2016 2017 2018 2019 2020 2021 2022 2021-22 2019-22 Spending ($Million) Imperial 348.3 362.3 354.6 353.3 379.6 411.6 435.9 292.7 419.3 509.2 21.5% p 16.8% p Total (Current $) 31.9 32.4 28.5 25.2 29.0 33.3 34.5 12.1 19.7 28.2 43.2% p -18.3%q Other 316.4 329.9 326.1 328.1 350.6 378.3 401.4 280.7 399.6 481.0 20.4% p 19.8% p Visitor 258.0 268.6 270.3 277.1 293.1 312.2 331.4 242.1 341.4 401.3 17.6% p 21.1% p Non-transportation 58.4 61.3 55.8 51.0 57.6 66.0 70.0 38.5 58.2 79.7 37.0% p 13.9% p Transportation Inyo 223.8 231.6 229.5 239.2 240.2 248.7 267.4 155.0 234.4 250.5 6.9% p -6.3% q Total (Current $) 3.6 3.7 3.3 3.0 3.3 3.8 3.9 1.5 2.3 3.3 39.9% p -16.1%q Other 220.1 227.9 226.2 236.3 236.9 244.9 263.5 153.5 232.1 247.3 6.5% p -6.2% q Visitor 192.3 199.3 200.5 212.3 211.2 216.2 232.5 138.9 207.9 217.7 4.7% p -6.3% q Non-transportation 27.8 28.6 25.6 24.0 25.7 28.8 31.0 14.6 24.1 29.5 22.5% p -4.7% q Transportation Kern 1,461 1,510 1,504 1,396 1,518 1,686 1,775 1,106 1,545 1,890 22.4% p 6.5% p Total (Current $) 180 180 162 144 160 185 195 72 114 166 44.9% p -15.0%q Other 1,281 1,329 1,342 1,252 1,358 1,501 1,580 1,034 1,431 1,725 20.6% p 9.2% p Visitor 972 1,011 1,047 998 1,074 1,172 1,237 898 1,198 1,394 16.4% p 12.7% p Non-transportation 309 318 295 254 284 329 343 136 233 331 42.1% p -3.4% q Transportation Kings 163.1 166.7 163.8 158.7 167.3 185.0 193.4 93.1 170.2 212.9 25.1% p 10.1% p Total (Current $) 26.7 26.5 23.5 20.5 23.0 27.0 28.1 9.7 16.1 22.9 42.1% p -18.4%q Other 136.4 140.2 140.3 138.2 144.3 158.1 165.3 83.4 154.1 190.0 23.4% p 15.0% p Visitor 113.5 116.8 118.8 119.2 123.5 134.1 140.8 75.7 138.4 167.9 21.3% p 19.3% p Non-transportation 22.9 23.5 21.5 19.0 20.8 24.0 24.6 7.7 15.7 22.1 41.3% p -9.9% q Transportation Details may not add to totals due to rounding. Percent change calculated on unrounded figures. Percent change calculated on unrounded figures. The Economic Impact of Travel in California / 2022p / Prepared by Dean Runyan Associates 81
Direct Travel Spending 2013-2022p
County / Summary Trend
Direct Travel Spending 2013-2022p
2013 2014 2015 2016 2017 2018 2019 2020 2021 2022 2021-22 2019-22 Spending ($Million) Lake 146.1 154.5 156.3 156.9 160.6 174.4 180.7 133.6 164.8 175.8 6.6% p -2.8% q Total (Current $) 13.4 13.5 12.5 11.5 12.7 14.5 15.1 6.3 9.2 12.8 39.0% p -15.1%q Other 132.8 141.0 143.8 145.5 147.9 159.9 165.6 127.3 155.6 162.9 4.7% p -1.6% q Visitor 113.0 119.9 124.5 128.1 129.1 138.4 143.4 116.4 140.5 144.3 2.7% p 0.6% p Non-transportation 19.7 21.1 19.2 17.4 18.7 21.5 22.3 11.0 15.2 18.6 23.0% p -16.2%q Transportation Lassen 58.7 60.4 58.5 59.1 63.5 65.0 70.5 39.7 63.5 70.6 11.2% p 0.2% p Total (Current $) 5.6 5.6 4.8 4.2 4.7 5.4 5.6 1.9 3.2 4.5 42.3% p -20.1%q Other 53.1 54.8 53.7 55.0 58.8 59.6 64.8 37.8 60.3 66.1 9.5% p 1.9% p Visitor 44.7 46.2 46.0 48.0 51.0 51.1 55.7 34.2 54.1 58.1 7.3% p 4.2% p Non-transportation 8.4 8.6 7.7 7.0 7.8 8.5 9.1 3.6 6.2 8.0 28.7% p -12.2%q Transportation Los Angeles 25,065 25,769 26,828 28,039 29,854 31,952 32,675 13,254 21,036 28,493 35.4% p -12.8%q Total (Current $) 5,065 5,257 5,246 5,179 5,622 6,179 6,418 2,889 3,657 6,040 65.2% p -5.9% q Other 19,999 20,513 21,582 22,860 24,232 25,773 26,257 10,365 17,379 22,453 29.2% p -14.5%q Visitor 15,177 15,481 16,566 17,819 18,879 19,930 20,316 8,464 13,891 17,167 23.6% p -15.5%q Non-transportation 4,822 5,031 5,016 5,041 5,353 5,843 5,941 1,901 3,488 5,286 51.6% p -11.0%q Transportation Madera 264.2 275.1 268.8 291.0 316.2 339.3 355.0 206.1 338.1 346.9 2.6% p -2.3% q Total (Current $) 26.7 27.0 24.3 26.6 30.3 34.7 36.1 14.7 21.9 30.5 39.3% p -15.6%q Other 237.5 248.1 244.5 264.4 286.0 304.6 318.9 191.4 316.3 316.4 0.1% p -0.8% q Visitor 193.3 202.3 203.7 225.3 242.4 254.8 266.8 171.3 277.6 272.9 -1.7% q 2.3% p Non-transportation 44.2 45.8 40.8 39.1 43.6 49.9 52.1 20.1 38.7 43.5 12.4% p -16.5%q Transportation Details may not add to totals due to rounding. Percent change calculated on unrounded figures. Percent change calculated on unrounded figures. The Economic Impact of Travel in California / 2022p / Prepared by Dean Runyan Associates 82
County / Summary Trend
Direct Travel Spending 2013-2022p
2013 2014 2015 2016 2017 2018 2019 2020 2021 2022 2021-22 2019-22 Spending ($Million) Marin 673.4 690.2 715.2 731.1 730.9 796.4 838.3 365.6 599.5 852.2 42.2% p 1.7% p Total (Current $) 184.4 169.6 171.5 170.0 164.9 174.4 195.2 113.0 132.2 198.1 49.8% p 1.5% p Other 489.0 520.6 543.7 561.2 566.0 622.0 643.1 252.6 467.3 654.1 40.0% p 1.7% p Visitor 438.8 467.3 494.6 515.7 516.8 565.2 584.6 233.4 431.6 601.6 39.4% p 2.9% p Non-transportation 50.2 53.3 49.1 45.5 49.2 56.7 58.5 19.2 35.6 52.5 47.4% p -10.2%q Transportation Mariposa 394.4 420.8 453.5 457.9 470.7 436.8 467.2 255.3 336.8 350.6 4.1% p -25.0%q Total (Current $) 3.1 3.1 2.7 2.4 2.7 3.1 3.2 1.1 1.8 2.5 42.3% p -20.7%q Other 391.2 417.7 450.8 455.6 468.0 433.7 464.0 254.2 335.0 348.1 3.9% p -25.0%q Visitor 356.0 380.3 414.4 422.2 432.2 397.4 425.4 237.9 314.9 328.2 4.2% p -22.9%q Non-transportation 35.2 37.4 36.4 33.3 35.8 36.2 38.6 16.3 20.1 19.9 -0.9% q -48.5%q Transportation Mendocino 365.1 382.1 398.7 434.6 465.9 451.7 484.0 300.2 506.5 468.9 -7.4% q -3.1% q Total (Current $) 16.1 16.2 14.4 12.8 14.4 16.5 17.2 6.2 9.9 14.0 41.2% p -18.9%q Other 349.0 365.9 384.3 421.8 451.6 435.2 466.8 294.1 496.7 455.0 -8.4% q -2.5% q Visitor 303.5 319.1 340.5 379.5 404.4 385.1 413.4 269.0 452.3 406.8 -10.1% q -1.6% q Non-transportation 45.4 46.8 43.8 42.2 47.1 50.0 53.4 25.0 44.3 48.2 8.8% p -9.7% q Transportation Merced 244.2 264.3 260.7 245.8 270.2 296.2 311.3 152.3 245.3 308.9 25.9% p -0.8% q Total (Current $) 46.2 46.5 41.3 36.3 41.5 50.1 51.4 17.4 28.9 40.9 41.5% p -20.3%q Other 198.0 217.8 219.4 209.5 228.7 246.1 259.9 134.9 216.4 268.0 23.8% p 3.1% p Visitor 144.9 162.1 168.9 165.7 178.3 188.9 200.7 118.3 180.3 216.8 20.3% p 8.0% p Non-transportation 53.2 55.6 50.4 43.9 50.4 57.3 59.2 16.6 36.1 51.1 41.7% p -13.7%q Transportation Details may not add to totals due to rounding. Percent change calculated on unrounded figures. Percent change calculated on unrounded figures. The Economic Impact of Travel in California / 2022p / Prepared by Dean Runyan Associates 83
County / Summary Trend
Direct Travel Spending 2013-2022p
2013 2014 2015 2016 2017 2018 2019 2020 2021 2022 2021-22 2019-22 Spending ($Million) Modoc 23.2 24.2 24.0 24.3 25.9 27.3 29.5 21.0 25.3 27.4 8.4% p -7.3% q Total (Current $) 1.6 1.6 1.4 1.2 1.3 1.5 1.6 0.5 0.9 1.3 42.3% p -18.9%q Other 21.6 22.6 22.7 23.1 24.6 25.7 27.9 20.4 24.4 26.1 7.1% p -6.6% q Visitor 18.0 18.9 19.3 20.0 21.2 21.9 23.8 18.3 21.4 22.3 4.4% p -6.1% q Non-transportation 3.6 3.7 3.4 3.1 3.4 3.9 4.1 2.1 3.0 3.8 26.9% p -9.2% q Transportation Mono 473.6 474.4 495.0 548.3 615.8 625.7 671.0 436.9 508.3 583.7 14.8% p -13.0%q Total (Current $) 2.9 2.9 2.6 2.4 2.9 3.4 3.6 1.5 2.2 3.1 40.5% p -12.8%q Other 470.8 471.5 492.4 545.9 612.9 622.3 667.4 435.4 506.1 580.6 14.7% p -13.0%q Visitor 421.3 421.8 446.0 499.9 557.0 560.8 603.1 402.4 473.1 539.9 14.1% p -10.5%q Non-transportation 49.5 49.7 46.4 46.0 55.9 61.5 64.2 33.0 33.0 40.7 23.3% p -36.7%q Transportation Monterey 2,495 2,602 2,702 2,759 2,820 3,136 3,241 1,555 2,726 3,054 12.1% p -5.8% q Total (Current $) 100 101 92 85 95 105 113 43 68 100 47.9% p -11.5%q Other 2,395 2,501 2,610 2,674 2,726 3,030 3,128 1,512 2,658 2,954 11.1% p -5.5% q Visitor 2,145 2,244 2,368 2,448 2,484 2,752 2,837 1,402 2,457 2,701 9.9% p -4.8% q Non-transportation 250 257 241 226 242 278 291 110 201 253 25.9% p -12.8%q Transportation Napa 1,334 1,412 1,475 1,629 1,659 1,793 1,855 989 1,368 1,701 24.4% p -8.3% q Total (Current $) 43 45 43 62 62 71 71 30 38 62 61.5% p -13.5%q Other 1,291 1,367 1,432 1,568 1,597 1,722 1,784 959 1,329 1,640 23.3% p -8.1% q Visitor 1,214 1,287 1,356 1,494 1,517 1,631 1,690 914 1,266 1,558 23.0% p -7.8% q Non-transportation 76 80 75 74 80 91 95 45 63 82 29.7% p -13.6%q Transportation Details may not add to totals due to rounding. Percent change calculated on unrounded figures. Percent change calculated on unrounded figures. The Economic Impact of Travel in California / 2022p / Prepared
Associates 84
by Dean Runyan
County / Summary Trend
Direct Travel Spending 2013-2022p
2013 2014 2015 2016 2017 2018 2019 2020 2021 2022 2021-22 2019-22 Spending ($Million) Nevada 295.9 305.7 318.4 338.6 362.6 387.6 414.1 265.2 359.1 419.6 16.8% p 1.3% p Total (Current $) 19.7 17.3 15.3 13.4 15.1 17.5 18.3 6.2 10.3 14.7 42.3% p -19.4%q Other 276.2 288.4 303.1 325.2 347.6 370.0 395.8 259.0 348.8 404.9 16.1% p 2.3% p Visitor 237.3 248.5 265.9 290.1 308.7 325.7 348.7 237.0 320.0 366.0 14.4% p 5.0% p Non-transportation 38.9 39.9 37.1 35.1 38.9 44.4 47.1 22.0 28.8 38.9 35.1% p -17.4%q Transportation Orange 11,026 11,883 12,696 13,477 13,815 13,922 14,463 6,803 10,830 14,766 36.3% p 2.1% p Total (Current $) 1,371 1,485 1,467 1,512 1,564 1,736 1,789 883 1,034 1,592 53.9% p -11.1%q Other 9,655 10,397 11,229 11,964 12,252 12,186 12,673 5,920 9,796 13,174 34.5% p 4.0% p Visitor 8,954 9,732 10,533 11,268 11,544 11,443 11,926 5,679 9,312 12,318 32.3% p 3.3% p Non-transportation 701 666 696 697 708 743 747 240 484 857 77.1% p 14.6% p Transportation Placer 1,036 1,034 1,099 1,224 1,349 1,403 1,490 1,093 1,343 1,348 0.4% p -9.5% q Total (Current $) 69 70 64 62 75 87 93 36 54 76 40.4% p -18.3%q Other 968 965 1,035 1,162 1,274 1,315 1,397 1,057 1,289 1,272 -1.3% q -9.0% q Visitor 849 847 922 1,052 1,150 1,176 1,251 987 1,188 1,163 -2.1% q -7.0% q Non-transportation 119 118 112 110 124 139 146 70 101 109 7.6% p -25.6%q Transportation Plumas 114.1 115.3 112.5 114.4 118.8 131.2 149.7 111.3 137.1 142.9 4.2% p -4.5% q Total (Current $) 3.3 3.3 2.8 2.5 2.8 3.3 3.4 1.2 1.9 2.8 42.3% p -19.5%q Other 110.7 112.1 109.7 111.9 116.0 127.9 146.2 110.2 135.2 140.1 3.7% p -4.2% q Visitor 94.8 95.8 95.6 99.2 102.1 111.1 127.5 99.8 121.5 123.1 1.3% p -3.5% q Non-transportation 15.9 16.2 14.1 12.7 13.9 16.8 18.7 10.4 13.7 17.0 24.5% p -9.0% q Transportation Details may not add to totals due to rounding. Percent change calculated on unrounded figures. Percent change calculated on unrounded figures. The Economic Impact of Travel in California / 2022p / Prepared by Dean Runyan Associates 85
County / Summary Trend
Direct Travel Spending 2013-2022p
2013 2014 2015 2016 2017 2018 2019 2020 2021 2022 2021-22 2019-22 Spending ($Million) Riverside 6,797 6,952 7,209 7,533 7,929 8,604 8,991 6,459 6,826 8,788 28.7% p -2.3% q Total (Current $) 553 560 520 505 505 584 599 243 370 683 84.7% p 14.0% p Other 6,244 6,392 6,689 7,028 7,423 8,020 8,391 6,216 6,456 8,104 25.5% p -3.4% q Visitor 5,404 5,528 5,865 6,231 6,555 7,037 7,348 5,660 5,813 7,129 22.6% p -3.0% q Non-transportation 841 864 824 798 869 983 1,043 556 643 975 51.5% p -6.6% q Transportation Sacramento 3,350 3,495 3,592 3,638 3,836 4,162 4,413 1,837 3,005 3,908 30.1% p -11.4%q Total (Current $) 733 767 778 769 791 865 932 365 573 920 60.6% p -1.3% q Other 2,617 2,728 2,814 2,869 3,045 3,297 3,481 1,472 2,432 2,988 22.9% p -14.2%q Visitor 1,857 1,934 2,032 2,104 2,235 2,412 2,542 1,146 1,872 2,176 16.3% p -14.4%q Non-transportation 760 794 782 765 809 884 939 326 560 811 44.8% p -13.6%q Transportation San Benito 89.5 93.6 92.7 95.2 107.4 119.5 125.4 64.5 117.4 140.8 19.9% p 12.2% p Total (Current $) 10.1 10.2 9.0 8.0 9.1 10.8 11.3 3.9 6.5 9.3 42.3% p -17.8%q Other 79.4 83.4 83.6 87.2 98.3 108.6 114.1 60.6 110.9 131.5 18.6% p 15.2% p Visitor 65.3 68.5 70.0 74.5 83.9 91.8 96.5 52.9 97.3 113.1 16.2% p 17.1% p Non-transportation 14.1 14.9 13.7 12.7 14.3 16.8 17.6 7.7 13.6 18.4 35.7% p 4.6% p Transportation San Bernardino 4,351 4,466 4,558 4,643 4,975 5,343 5,717 4,087 4,481 5,548 23.8% p -2.9% q Total (Current $) 571 585 552 524 578 650 688 283 430 670 55.8% p -2.6% q Other 3,780 3,881 4,006 4,119 4,397 4,693 5,029 3,805 4,051 4,879 20.4% p -3.0% q Visitor 3,057 3,137 3,299 3,448 3,669 3,885 4,170 3,366 3,520 4,091 16.2% p -1.9% q Non-transportation 723 744 707 671 728 808 859 439 531 788 48.3% p -8.3% q Transportation Details may not add to totals due to rounding. Percent change calculated on unrounded figures. Percent change calculated on unrounded figures. The Economic Impact of Travel in California / 2022p / Prepared
Associates 86
by Dean Runyan
County / Summary Trend
Direct Travel Spending 2013-2022p
2013 2014 2015 2016 2017 2018 2019 2020 2021 2022 2021-22 2019-22 Spending ($Million) San Diego 11,602 12,020 12,321 12,996 13,694 13,652 13,792 5,828 10,180 13,344 31.1% p -3.2% q Total (Current $) 1,435 1,478 1,482 1,530 1,632 1,798 1,933 840 1,176 1,950 65.9% p 0.9% p Other 10,167 10,542 10,839 11,466 12,062 11,854 11,859 4,989 9,004 11,393 26.5% p -3.9% q Visitor 8,911 9,285 9,591 10,229 10,747 10,504 10,449 4,544 8,116 9,970 22.8% p -4.6% q Non-transportation 1,255 1,257 1,247 1,237 1,315 1,350 1,410 445 888 1,424 60.4% p 1.0% p Transportation San Francisco 10,672 12,269 12,992 13,192 13,404 13,906 14,156 5,044 7,090 12,151 71.4% p -14.2%q Total (Current $) 1,812 2,001 2,098 2,318 2,645 2,792 2,863 1,595 2,031 3,222 58.6% p 12.5% p Other 8,860 10,267 10,895 10,875 10,758 11,114 11,294 3,449 5,059 8,929 76.5% p -20.9%q Visitor 7,196 8,451 9,066 9,101 8,973 9,263 9,442 2,989 4,245 7,271 71.3% p -23.0%q Non-transportation 1,664 1,816 1,829 1,774 1,785 1,851 1,851 460 814 1,658 103.7% p -10.4%q Transportation San Joaquin 789.5 809.4 809.8 827.7 878.3 940.8 993.4 541.6 982.0 1,202.9 22.5% p 21.1% p Total (Current $) 130.7 133.0 119.4 106.6 120.0 140.4 145.9 53.3 86.0 121.2 41.0% p -16.9%q Other 658.8 676.4 690.4 721.1 758.3 800.4 847.5 488.3 896.0 1,081.7 20.7% p 27.6% p Visitor 487.5 501.4 527.6 567.0 591.9 615.2 653.8 418.4 746.1 872.9 17.0% p 33.5% p Non-transportation 171.3 175.0 162.8 154.1 166.3 185.2 193.7 69.9 149.9 208.8 39.3% p 7.8% p Transportation San Luis Obispo 1,586 1,629 1,669 1,680 1,782 1,915 2,019 1,349 1,891 2,152 13.8% p 6.6% p Total (Current $) 77 67 62 57 66 78 83 28 45 75 67.6% p -10.0%q Other 1,510 1,562 1,607 1,623 1,716 1,837 1,935 1,321 1,846 2,077 12.5% p 7.3% p Visitor 1,307 1,354 1,413 1,444 1,517 1,608 1,691 1,199 1,669 1,837 10.1% p 8.6% p Non-transportation 203 208 194 179 199 229 244 122 178 239 34.9% p -1.9% q Transportation Details may not add to totals due to rounding. Percent change calculated on unrounded figures. Percent change calculated on unrounded figures. The Economic Impact of Travel in California / 2022p / Prepared by Dean Runyan Associates 87
County / Summary Trend
Direct Travel Spending 2013-2022p
2013 2014 2015 2016 2017 2018 2019 2020 2021 2022 2021-22 2019-22 Spending ($Million) San Mateo 3,340 3,519 3,730 3,813 3,997 4,357 4,492 1,681 2,407 3,857 60.3% p -14.1%q Total (Current $) 244 261 303 294 336 374 433 198 154 225 46.4% p -48.0%q Other 3,096 3,258 3,427 3,518 3,662 3,984 4,059 1,483 2,253 3,632 61.2% p -10.5%q Visitor 2,477 2,613 2,785 2,879 2,999 3,265 3,338 1,219 1,826 2,816 54.2% p -15.6%q Non-transportation 620 645 642 639 663 718 721 265 427 816 91.2% p 13.2% p Transportation Santa Barbara 1,745 1,853 1,906 1,904 1,953 1,983 2,141 1,021 1,832 2,078 13.4% p -2.9% q Total (Current $) 137 139 131 129 135 151 164 65 102 154 50.5% p -6.4% q Other 1,608 1,714 1,774 1,775 1,818 1,832 1,977 955 1,730 1,924 11.2% p -2.7% q Visitor 1,366 1,460 1,536 1,555 1,583 1,576 1,696 856 1,542 1,684 9.2% p -0.7% q Non-transportation 242 254 238 219 235 256 280 99 189 240 27.3% p -14.4%q Transportation Santa Clara 5,391 5,769 6,090 6,304 7,221 7,446 7,629 2,989 4,269 6,231 46.0% p -18.3%q Total (Current $) 925 975 1,049 1,084 1,203 1,272 1,414 734 906 1,317 45.3% p -6.9% q Other 4,466 4,794 5,041 5,220 6,018 6,173 6,214 2,256 3,363 4,914 46.1% p -20.9%q Visitor 3,638 3,915 4,178 4,375 5,074 5,150 5,157 1,948 2,837 4,086 44.0% p -20.8%q Non-transportation 828 879 862 845 944 1,024 1,057 308 527 828 57.3% p -21.7%q Transportation Santa Cruz 870 904 928 946 1,023 1,078 1,075 503 1,113 1,580 42.0% p 46.9% p Total (Current $) 53 55 48 42 47 53 55 21 32 45 40.8% p -17.9%q Other 816 849 880 903 976 1,025 1,020 483 1,081 1,535 42.0% p 50.5% p Visitor 702 733 773 806 868 902 895 434 985 1,380 40.1% p 54.3% p Non-transportation 114 116 106 97 108 123 125 49 95 155 62.2% p 23.3% p Transportation Details may not add to totals due to rounding. Percent change calculated on unrounded figures. Percent change calculated on unrounded figures. The Economic Impact of Travel in California / 2022p / Prepared by Dean Runyan Associates 88
County / Summary Trend
Direct Travel Spending 2013-2022p
2013 2014 2015 2016 2017 2018 2019 2020 2021 2022 2021-22 2019-22 Spending ($Million) Shasta 418.9 430.1 428.0 439.4 460.9 509.7 544.7 308.9 465.9 494.5 6.1% p -9.2% q Total (Current $) 35.1 34.7 32.1 29.7 32.4 36.9 39.7 13.7 24.3 36.9 52.0% p -7.0% q Other 383.8 395.4 395.9 409.7 428.4 472.7 505.0 295.3 441.6 457.6 3.6% p -9.4% q Visitor 313.9 323.8 330.4 348.1 361.4 395.0 421.5 263.8 385.9 387.1 0.3% p -8.1% q Non-transportation 70.0 71.6 65.5 61.5 67.0 77.7 83.5 31.5 55.6 70.4 26.6% p -15.7%q Transportation Sierra 18.8 18.4 17.7 16.8 18.2 18.3 19.4 13.5 19.3 20.3 4.9% p 4.2% p Total (Current $) 0.5 0.5 0.5 0.4 0.5 0.5 0.5 0.2 0.3 0.4 42.3% p -19.0%q Other 18.2 17.9 17.3 16.4 17.7 17.8 18.9 13.3 19.0 19.8 4.3% p 4.9% p Visitor 16.1 15.8 15.5 14.9 16.0 15.9 16.9 12.4 17.5 18.1 3.4% p 7.4% p Non-transportation 2.1 2.0 1.8 1.6 1.8 1.9 2.0 1.0 1.5 1.7 14.6% p -15.8%q Transportation Siskiyou 167.2 170.4 171.9 174.6 186.5 192.6 206.0 142.1 210.2 202.6 -3.6% q -1.7% q Total (Current $) 7.9 7.9 7.0 6.3 7.0 8.1 8.4 3.0 4.8 6.8 41.5% p -18.9%q Other 159.2 162.5 164.9 168.3 179.5 184.5 197.6 139.1 205.4 195.7 -4.7% q -0.9% q Visitor 137.3 140.3 144.7 149.9 158.9 161.8 173.5 127.3 186.7 175.0 -6.3% q 0.9% p Non-transportation 21.9 22.2 20.2 18.5 20.5 22.7 24.1 11.8 18.6 20.8 11.4% p -14.0%q Transportation Solano 695.6 711.2 704.4 730.8 766.4 799.7 823.5 317.1 707.4 789.1 11.5% p -4.2% q Total (Current $) 76.6 78.0 72.3 65.1 73.4 85.1 88.5 32.4 51.0 71.9 40.8% p -18.8%q Other 619.0 633.2 632.1 665.7 693.0 714.7 735.0 284.7 656.4 717.3 9.3% p -2.4% q Visitor 541.1 554.5 561.1 599.0 620.2 633.7 652.2 266.0 598.7 645.4 7.8% p -1.0% q Non-transportation 77.8 78.7 71.0 66.7 72.8 80.9 82.8 18.6 57.7 71.9 24.6% p -13.2%q Transportation Details may not add to totals due to rounding. Percent change calculated on unrounded figures. Percent change calculated on unrounded figures. The Economic Impact of Travel in California / 2022p / Prepared by Dean Runyan Associates 89
County / Summary Trend
Direct Travel Spending 2013-2022p
2013 2014 2015 2016 2017 2018 2019 2020 2021 2022 2021-22 2019-22 Spending ($Million) Sonoma 1,756 1,828 1,876 1,975 2,084 2,200 2,237 1,250 1,938 2,299 18.7% p 2.8% p Total (Current $) 126 130 124 143 158 176 183 89 121 172 42.0% p -5.7% q Other 1,630 1,698 1,752 1,832 1,926 2,024 2,054 1,161 1,816 2,127 17.1% p 3.5% p Visitor 1,459 1,522 1,587 1,674 1,754 1,833 1,857 1,075 1,674 1,932 15.4% p 4.1% p Non-transportation 171 176 165 158 172 191 198 87 142 195 37.2% p -1.6% q Transportation Stanislaus 538.2 547.0 557.4 564.0 587.2 633.0 670.8 307.1 577.4 604.4 4.7% p -9.9% q Total (Current $) 96.6 96.7 86.3 77.1 87.1 101.2 105.3 37.3 60.6 85.8 41.6% p -18.5%q Other 441.5 450.3 471.1 487.0 500.1 531.9 565.5 269.8 516.8 518.6 0.4% p -8.3% q Visitor 329.5 337.0 363.8 386.7 393.3 412.4 440.6 233.3 426.9 419.3 -1.8% q -4.8% q Non-transportation 112.1 113.3 107.3 100.3 106.8 119.5 124.9 36.5 89.9 99.3 10.5% p -20.5%q Transportation Sutter 88.1 91.5 89.4 88.4 97.1 109.4 114.2 45.4 94.6 102.3 8.1% p -10.4%q Total (Current $) 17.0 17.1 15.2 13.5 15.1 17.5 18.3 6.4 10.5 14.8 41.8% p -18.8%q Other 71.1 74.4 74.2 74.8 82.0 91.9 95.9 39.0 84.2 87.4 3.9% p -8.9% q Visitor 53.7 56.5 58.1 60.3 65.8 72.8 76.4 34.5 71.6 72.3 1.1% p -5.3% q Non-transportation 17.4 17.9 16.1 14.6 16.2 19.1 19.6 4.5 12.6 15.1 20.0% p -22.7%q Transportation Tehama 124.8 127.1 128.5 129.0 134.2 148.7 160.7 92.6 153.9 162.9 5.8% p 1.4% p Total (Current $) 11.0 11.0 9.8 8.5 9.7 11.2 11.7 4.0 6.7 9.6 42.3% p -18.0%q Other 113.8 116.1 118.7 120.4 124.5 137.5 149.0 88.5 147.2 153.3 4.2% p 2.9% p Visitor 94.8 96.9 101.1 104.4 107.1 117.2 127.4 80.0 131.8 134.0 1.7% p 5.2% p Non-transportation 19.0 19.1 17.6 16.0 17.5 20.3 21.6 8.5 15.4 19.3 25.7% p -10.5%q Transportation
The Economic Impact of Travel in California / 2022p / Prepared by Dean Runyan Associates 90
Details may not add to totals due to rounding. Percent change calculated on unrounded figures. Percent change calculated on unrounded figures.
County / Summary Trend
Direct Travel Spending 2013-2022p
2013 2014 2015 2016 2017 2018 2019 2020 2021 2022 2021-22 2019-22 Spending ($Million) Trinity 51.6 51.9 50.0 52.8 55.9 56.4 60.7 51.5 61.4 65.1 6.0% p 7.2% p Total (Current $) 2.4 2.3 2.0 1.7 1.9 2.2 2.3 0.8 1.3 1.8 42.3% p -21.1%q Other 49.2 49.6 48.0 51.0 54.0 54.2 58.4 50.8 60.1 63.3 5.3% p 8.3% p Visitor 41.3 41.5 40.9 44.3 46.6 46.1 49.7 45.5 53.1 54.3 2.3% p 9.3% p Non-transportation 7.9 8.1 7.1 6.7 7.4 8.1 8.7 5.3 7.0 9.0 28.0% p 2.9% p Transportation Tulare 431.9 453.2 419.3 383.9 478.9 512.1 540.5 286.6 528.9 549.7 3.9% p 1.7% p Total (Current $) 83.6 84.3 74.4 66.0 74.4 85.7 89.2 31.6 51.3 72.7 41.6% p -18.6%q Other 348.3 368.9 344.9 317.9 404.6 426.4 451.2 255.0 477.5 477.1 -0.1% q 5.7% p Visitor 274.2 291.9 278.7 260.1 334.9 347.8 368.8 228.8 417.2 408.2 -2.1% q 10.7% p Non-transportation 74.1 77.0 66.3 57.8 69.7 78.6 82.4 26.2 60.4 68.9 14.1% p -16.5%q Transportation Tuolumne 189.3 192.0 205.6 223.6 250.3 255.1 273.1 176.5 240.7 251.2 4.4% p -8.0% q Total (Current $) 10.5 10.4 9.1 8.1 9.1 10.6 11.1 4.1 6.5 9.1 40.8% p -17.6%q Other 178.8 181.6 196.5 215.5 241.1 244.5 262.0 172.4 234.2 242.1 3.4% p -7.6% q Visitor 154.8 157.1 173.1 193.1 215.7 216.6 232.3 158.7 213.7 218.5 2.3% p -5.9% q Non-transportation 24.0 24.5 23.4 22.4 25.4 27.9 29.7 13.8 20.5 23.6 14.9% p -20.6%q Transportation Ventura 1,550 1,593 1,634 1,645 1,707 1,793 1,827 997 1,545 1,763 14.1% p -3.5% q Total (Current $) 207 212 197 183 199 224 229 111 142 193 36.1% p -15.8%q Other 1,343 1,381 1,437 1,462 1,508 1,568 1,597 886 1,403 1,570 11.9% p -1.7% q Visitor 1,113 1,146 1,217 1,258 1,291 1,333 1,359 784 1,230 1,368 11.3% p 0.7% p Non-transportation 230 235 220 204 217 236 238 102 174 202 16.2% p -15.3%q Transportation Details may not add to totals due to rounding. Percent change calculated on unrounded figures. Percent change calculated on unrounded figures. The Economic Impact of Travel in California / 2022p / Prepared by Dean Runyan Associates 91
County / Summary Trend
Direct Travel Spending 2013-2022p
2013 2014 2015 2016 2017 2018 2019 2020 2021 2022 2021-22 2019-22 Spending ($Million) Yolo 349.6 359.1 356.3 355.3 412.8 458.8 454.3 251.7 372.4 418.7 12.4% p -7.8% q Total (Current $) 39.7 39.1 34.7 30.5 34.7 40.6 42.7 15.0 24.0 34.0 41.7% p -20.3%q Other 309.9 320.0 321.7 324.8 378.1 418.2 411.7 236.7 348.4 384.7 10.4% p -6.6% q Visitor 257.9 266.6 273.5 280.9 327.2 357.7 351.7 215.4 309.1 334.0 8.1% p -5.0% q Non-transportation 52.0 53.4 48.2 43.9 50.9 60.5 59.9 21.3 39.3 50.7 28.9% p -15.4%q Transportation Yuba 86.4 86.1 78.2 77.0 93.4 105.0 113.0 52.0 89.4 115.3 29.0% p 2.0% p Total (Current $) 12.9 12.9 11.5 10.2 11.7 13.7 14.3 4.9 8.2 11.6 42.3% p -18.8%q Other 73.5 73.1 66.7 66.8 81.7 91.3 98.8 47.1 81.2 103.7 27.7% p 5.0% p Visitor 56.0 55.1 51.0 52.5 64.8 71.1 77.3 39.8 66.9 83.5 24.9% p 8.0% p Non-transportation 17.5 18.0 15.7 14.3 16.9 20.2 21.5 7.3 14.4 20.2 40.8% p -5.8% q Transportation Details may not add to totals due to rounding. Percent change calculated on unrounded figures. Percent change calculated on unrounded figures. The Economic Impact of Travel in California / 2022p / Prepared
Runyan Associates 92
by Dean
County / Summary Trend
Travel Industry Employment 2013-2022p
2013 2014 2015 2016 2017 2018 2019 2020 2021 2022 2021-22 2019-22 Employment (Jobs) 27,280 28,180 28,830 29,050 30,170 32,310 31,830 22,820 23,460 27,280 16.3% p -14.3%q Alameda 300 250 240 280 280 300 310 310 200 180 -12.1% q -44.3%q Alpine 1,870 1,920 1,970 2,050 2,140 2,210 2,300 2,040 2,390 2,550 6.6% p 10.7% p Amador 3,550 3,560 3,500 3,580 3,810 3,980 4,020 3,150 3,550 3,750 5.7% p -6.5% q Butte 2,170 2,210 2,400 2,490 2,670 2,760 2,770 2,370 2,590 2,950 13.9% p 6.7% p Calaveras 640 650 610 630 640 680 710 620 730 630 -13.7% q -11.4%q Colusa 16,410 16,310 16,250 17,870 17,930 17,980 18,230 13,170 14,460 15,700 8.5% p -13.9%q Contra Costa 1,400 1,400 1,400 1,400 1,430 1,560 1,600 1,270 1,430 1,530 7.3% p -4.4% q Del Norte 10,310 10,690 11,470 11,630 12,750 12,820 13,470 10,750 11,380 13,070 14.9% p -3.0% q El Dorado 12,580 13,060 13,280 13,390 13,910 14,860 15,240 12,110 13,590 15,740 15.9% p 3.3% p Fresno 790 830 710 580 720 760 770 630 760 840 10.1% p 9.2% p Glenn 5,350 5,310 5,540 5,500 5,680 6,070 5,970 4,560 5,220 5,960 14.3% p -0.2% q Humboldt 4,340 4,650 4,520 4,520 4,450 4,120 4,250 3,300 3,700 4,100 10.8% p -3.4% q Imperial 2,390 2,260 2,260 2,290 2,390 2,510 2,790 2,210 2,320 2,650 14.4% p -5.0% q Inyo 15,680 15,790 16,520 15,560 17,300 18,170 18,500 15,290 17,420 19,500 11.9% p 5.4% p Kern 1,890 1,930 2,050 2,020 1,990 2,300 2,300 2,150 2,500 2,820 12.8% p 22.7% p Kings 1,700 1,630 1,590 1,630 1,620 1,750 1,760 1,640 1,740 1,820 4.5% p 3.2% p Lake 950 940 940 900 880 970 1,120 870 1,010 1,080 7.2% p -3.1% q Lassen 188,060 192,230 203,160 216,460 223,160 232,230 240,020 180,190 184,890 210,760 14.0% p -12.2%q Los Angeles 3,170 3,520 3,210 3,540 4,050 4,320 4,350 3,820 4,270 4,810 12.8% p 10.6% p Madera The Economic Impact of Travel in California / 2022p / Prepared by Dean Runyan Associates 93
County / Summary Trend
Travel Industry Employment 2013-2022p
2013 2014 2015 2016 2017 2018 2019 2020 2021 2022 2021-22 2019-22 Employment (Jobs) 5,810 5,980 5,990 6,220 6,250 6,460 6,640 4,550 4,860 5,570 14.7% p -16.0%q Marin 4,180 4,370 4,570 4,270 4,390 3,810 4,100 3,680 4,350 5,670 30.4% p 38.3% p Mariposa 6,360 6,690 6,490 7,040 7,200 6,170 6,400 4,570 5,100 5,740 12.6% p -10.2%q Mendocino 2,790 3,190 3,150 3,030 3,150 3,150 3,190 2,500 2,890 3,630 25.6% p 13.6% p Merced 350 320 290 290 300 290 310 300 300 310 3.0% p 0.1% p Modoc 4,180 4,450 4,930 5,200 5,580 5,840 6,080 4,380 5,030 6,000 19.4% p -1.3% q Mono 23,310 23,970 24,210 24,860 24,500 26,630 27,160 20,340 21,820 25,370 16.3% p -6.6% q Monterey 14,990 16,100 15,860 16,760 17,510 18,610 18,850 12,730 14,030 18,050 28.6% p -4.2% q Napa 3,410 3,390 3,290 3,450 3,680 3,860 4,020 3,370 3,350 3,800 13.4% p -5.6% q Nevada 107,800 115,100 121,960 129,520 131,090 130,420 132,370 90,660 99,770 124,950 25.2% p -5.6% q Orange 11,900 11,210 11,380 12,950 14,190 14,440 14,610 11,900 13,410 15,640 16.6% p 7.0% p Placer 1,280 1,250 1,250 1,260 1,280 1,400 1,560 1,200 1,230 1,440 17.1% p -7.6% q Plumas 68,540 71,850 74,260 77,900 79,740 84,190 86,600 70,240 77,860 87,340 12.2% p 0.9% p Riverside 28,180 28,610 28,970 29,520 30,340 32,270 33,430 24,800 27,140 32,000 17.9% p -4.3% q Sacramento 830 830 850 910 940 940 1,020 890 990 1,130 13.9% p 11.2% p San Benito 49,490 49,100 51,430 53,180 55,430 55,230 57,490 45,440 49,190 56,340 14.5% p -2.0% q San Bernardino 101,360 101,670 101,510 109,110 111,240 102,890 101,500 73,360 80,140 96,040 19.8% p -5.4% q San Diego 54,540 61,750 66,200 66,600 66,970 67,420 66,580 40,990 40,570 50,850 25.4% p -23.6%q San Francisco 7,800 8,110 8,100 8,500 8,940 9,190 9,540 7,540 8,360 10,090 20.6% p 5.7% p San Joaquin 18,520 18,580 18,530 18,930 20,550 21,340 22,860 17,710 19,440 22,480 15.6% p -1.7% q San Luis Obispo The Economic Impact of Travel in California / 2022p / Prepared by Dean Runyan Associates 94
County / Summary Trend
Travel Industry Employment 2013-2022p
2013 2014 2015 2016 2017 2018 2019 2020 2021 2022 2021-22 2019-22 Employment (Jobs) 43,130 44,160 46,560 48,790 50,680 52,940 45,350 33,060 31,160 35,180 12.9% p -22.4%q San Mateo 16,660 17,210 17,820 17,630 17,970 18,650 19,910 15,290 16,990 19,410 14.2% p -2.5% q Santa Barbara 38,440 39,610 40,630 42,450 43,090 42,380 42,880 28,650 30,720 37,480 22.0% p -12.6%q Santa Clara 9,680 10,060 10,470 10,690 11,140 11,280 10,960 7,460 8,620 9,420 9.2% p -14.1%q Santa Cruz 4,490 4,550 4,560 4,770 4,800 4,820 5,050 4,350 4,820 5,110 6.0% p 1.2% p Shasta 210 200 240 210 220 240 270 270 280 290 3.7% p 9.5% p Sierra 2,200 2,020 1,960 1,960 2,060 1,820 1,840 1,580 1,720 1,850 7.4% p 0.5% p Siskiyou 9,240 9,090 8,760 9,110 9,200 9,400 9,350 6,410 7,260 8,640 19.1% p -7.6% q Solano 19,460 19,830 20,300 20,880 22,510 22,380 22,360 16,290 17,610 21,150 20.1% p -5.4% q Sonoma 5,640 5,920 6,030 6,260 6,440 6,620 6,870 5,270 5,950 6,650 11.8% p -3.2% q Stanislaus 1,290 1,350 1,370 1,350 1,380 1,440 1,430 1,130 1,280 1,440 12.7% p 1.2% p Sutter 1,510 1,560 1,610 1,630 1,680 1,700 1,750 1,550 1,720 1,810 5.4% p 3.5% p Tehama 790 750 690 710 680 650 710 690 760 830 8.8% p 16.5% p Trinity 4,440 4,650 4,510 4,200 5,260 5,390 5,520 4,570 5,270 6,000 13.8% p 8.6% p Tulare 2,200 2,120 2,120 2,290 2,430 2,320 2,430 2,000 2,260 2,550 13.0% p 4.8% p Tuolumne 16,080 16,090 16,400 16,320 16,800 17,230 17,040 13,510 14,110 15,730 11.5% p -7.7% q Ventura 4,310 4,370 4,470 4,480 5,140 5,270 5,230 3,820 4,260 5,110 19.7% p -2.3% q Yolo 1,120 1,030 910 950 1,110 1,230 1,230 1,020 1,240 1,560 25.9% p 26.3% p Yuba The Economic Impact of Travel in California / 2022p / Prepared by Dean Runyan Associates 95
Alameda County / Detail Trend
Details may not add to totals due to rounding. Percent change calculated on unrounded figures.
*Other Travel includes ground transportation and air travel impacts for travel to other California visitor destinations, travel arrangement services and convention/trade shows services.
Economic impacts are attributed to visitor trips which are defined as trips taken by individuals that stay overnight away from home, or travel more than 50 miles one-way on a non-routine trip, as defined by the California Tourism Marketing Act
Travel Impacts 2013-2022p 2013 2014 2015 2016 2017 2018 2019 2020 2021 2022 2021-2022 Direct Travel Spending ($Million) 2,773 2,923 3,058 3,137 3,257 3,535 3,528 1,468 2,405 2,999 Destination Spending 24.7% p 771 815 838 837 913 967 996 371 517 792 Other Travel* 53.2% p 3,543 TOTAL 3,738 3,896 3,974 4,170 4,502 4,524 1,838 2,923 3,791 29.7% p Visitor Spending by Type of Traveler Accommodation ($Million) 1,601 1,727 1,856 1,932 1,981 2,149 2,129 1,083 1,303 1,682 Hotel, Motel, STVR 29.0% p 523 534 539 544 589 648 669 174 642 669 Private Home 4.3% p 5 6 6 6 6 7 7 6 7 9 Campground 28.1% p 15 16 16 17 18 19 20 40 36 33 2nd Home -8.4% q 628 640 641 638 662 713 704 165 417 605 Day Travel 45.1% p 2,773 TOTAL 2,923 3,058 3,137 3,257 3,535 3,528 1,468 2,405 2,999 24.7% p Visitor Spending by Commodity Purchased ($Million) 509 590 683 733 761 843 843 406 458 641 Accommodations 40.1% p 751 771 804 833 869 941 943 425 732 845 Food Service 15.4% p 92 95 98 97 98 103 101 39 100 118 Food Stores 18.3% p 447 463 440 420 444 497 491 166 331 439 Local Tran. & Gas 32.5% p 380 390 398 404 412 435 425 179 310 347 Arts, Ent. & Rec. 12.1% p 381 389 393 394 424 470 487 190 373 433 Retail Sales 16.1% p 213 226 243 255 248 246 239 63 101 175 Visitor Air Tran. 72.5% p 2,773 TOTAL 2,923 3,058 3,137 3,257 3,535 3,528 1,468 2,405 2,999 24.7% p
Direct
The Economic Impact of Travel in California / 2022p / Prepared
Runyan Associates 96
by Dean
Alameda County / Detail Trend
Direct Travel Impacts 2013-2022p
Details may not add to totals due to rounding. Percent change calculated on unrounded figures.
*Other Travel includes ground transportation and air travel impacts for travel to other California visitor destinations, travel arrangement services and convention/trade shows services.
**Retail includes gasoline station employment and earnings.
Economic impacts are attributed to visitor trips which are defined as trips taken by individuals that stay overnight away from home, or travel more than 50 miles one-way on a non-routine trip, as defined by the California Tourism Marketing Act
2013 2014 2015 2016 2017 2018 2019 2020 2021 2022 2021-2022 Travel Industry Earnings ($MIllion) 491 525 582 633 675 760 781 549 641 801 Accom. & Food Serv. 25.0% p 178 193 201 224 233 267 265 138 156 186 Arts, Ent. & Rec. 19.4% p 64 67 70 72 74 82 84 80 93 95 Retail** 2.6% p 51 55 60 64 69 89 93 40 46 52 Ground Tran. 14.4% p 142 144 159 143 160 169 161 151 128 136 Visitor Air Tran. 6.5% p 271 283 315 296 342 360 363 343 297 329 Other Travel* 11.0% p 1,196 TOTAL 1,269 1,387 1,433 1,553 1,727 1,745 1,302 1,359 1,599 17.7% p Travel Industry Employment (Jobs) 15,600 16,000 16,590 16,870 17,240 18,550 18,170 12,650 13,570 16,030 Accom. & Food Serv. 18.1% p 4,070 4,330 4,090 4,160 4,370 4,710 4,620 2,640 2,830 3,760 Arts, Ent. & Rec. 32.6% p 1,930 1,970 1,960 2,000 2,000 2,100 2,070 1,830 1,950 1,960 Retail** 0.4% p 1,280 1,330 1,380 1,390 1,410 1,690 1,770 1,140 1,370 1,550 Ground Tran. 13.0% p 1,280 1,310 1,390 1,320 1,500 1,520 1,490 1,250 990 990 Visitor Air Tran. 0.3% p 3,120 3,240 3,430 3,310 3,660 3,740 3,720 3,310 2,750 3,000 Other Travel* 8.9% p 27,280 TOTAL 28,180 28,830 29,050 30,170 32,310 31,830 22,820 23,460 27,280 16.3% p
The Economic Impact of Travel in California / 2022p / Prepared by Dean Runyan Associates 97
Alameda County / Detail Trend
Direct Travel Impacts 2013-2022p
Details may not add to totals due to rounding. Percent change calculated on unrounded figures.
Local tax receipts include transient occupancy taxes, sales taxes, and airport passenger facility charges paid by visitors, and the property tax payments and sales tax payments attributable to the travel industry income of employees and businesses. State tax receipts include sales tax payments and motor fuel tax payments of visitors, and the income tax payments and sales tax payments attributable to the travel industry income of employees and businesses.
Economic impacts are attributed to visitor trips which are defined as trips taken by individuals that stay overnight away from home, or travel more than 50 miles one-way on a non-routine trip, as defined by the California Tourism Marketing Act
2013 2014 2015 2016 2017 2018 2019 2020 2021 2022 2021-2022 Tax Receipts Generated by Travel Spending ($Millions) 129 140 154 162 178 198 198 121 145 188 Local Tax Receipts 30.0% p 160 167 166 161 163 184 188 99 143 162 State Tax Receipts 13.3% p 289 TOTAL 307 321 324 341 383 387 219 288 350 21.7% p Local Tax Receipts Generated by Travel Spending ($Millions) 85 94 105 113 125 140 139 62 84 123 Visitor 47.1% p 44 46 49 49 53 59 59 59 61 65 Business or Employee 6.6% p 129 TOTAL 140 154 162 178 198 198 121 145 188 30.0% p State Tax Receipts Generated by Travel Spending ($Millions) 121 125 122 118 121 141 145 59 100 118 Visitor 18.1% p 39 41 44 43 42 43 44 39 43 44 Business or Employee 2.1% p 160 TOTAL 167 166 161 163 184 188 99 143 162 13.3% p
The Economic Impact of Travel in California / 2022p / Prepared by Dean Runyan Associates 98
Alpine County / Detail Trend
Details may not add to totals due to rounding. Percent change calculated on unrounded figures.
*Other Travel includes ground transportation and air travel impacts for travel to other California visitor destinations, travel arrangement services and convention/trade shows services.
Economic impacts are attributed to visitor trips which are defined as trips taken by individuals that stay overnight away from home, or travel more than 50 miles one-way on a non-routine trip, as defined by the California Tourism Marketing Act
Travel Impacts 2013-2022p 2013 2014 2015 2016 2017 2018 2019 2020 2021 2022 2021-2022 Direct Travel Spending ($Million) 27.6 26.4 28.7 33.6 34.4 35.7 37.9 28.4 28.0 29.9 Destination Spending 6.9% p 0.2 0.2 0.2 0.1 0.2 0.2 0.2 0.1 0.1 0.2 Other Travel* 42.3% p 27.8 TOTAL 26.6 28.8 33.7 34.6 35.9 38.1 28.4 28.1 30.1 7.1% p Visitor Spending by Type of Traveler Accommodation ($Million) 16.4 15.0 17.0 21.8 21.6 22.0 23.6 14.7 14.1 14.3 Hotel, Motel, STVR 1.6% p 0.5 0.5 0.5 0.5 0.5 0.6 0.6 0.2 0.6 0.7 Private Home 10.3% p 3.0 3.3 3.3 3.4 3.5 3.7 4.0 3.3 4.1 5.3 Campground 28.2% p 5.7 5.5 5.8 5.9 6.5 7.1 7.2 9.3 8.3 7.5 2nd Home -9.9% q 2.0 2.0 2.1 2.1 2.3 2.4 2.5 0.9 0.9 2.2 Day Travel 151.8% p 27.6 TOTAL 26.4 28.7 33.6 34.4 35.7 37.9 28.4 28.0 29.9 6.9% p Visitor Spending by Commodity Purchased ($Million) 8.5 8.2 9.1 11.0 11.2 11.3 12.1 10.0 11.2 12.3 Accommodations 9.9% p 8.2 7.7 8.5 10.3 10.5 10.9 11.6 8.5 7.3 7.1 Food Service -2.5% q 1.3 1.4 1.5 1.6 1.6 1.6 1.7 1.4 1.8 2.3 Food Stores 28.0% p 2.5 2.5 2.3 2.2 2.4 2.8 3.0 1.6 1.8 2.4 Local Tran. & Gas 35.0% p 4.3 4.1 4.4 5.1 5.1 5.2 5.4 3.9 3.3 3.1 Arts, Ent. & Rec. -4.2% q 2.7 2.6 2.9 3.4 3.6 4.0 4.2 3.1 2.7 2.7 Retail Sales 0.3% p 27.6 TOTAL 26.4 28.7 33.6 34.4 35.7 37.9 28.4 28.0 29.9 6.9% p
Direct
The Economic Impact of Travel in California / 2022p / Prepared by Dean Runyan Associates 99
Alpine County / Detail Trend
Direct Travel Impacts 2013-2022p
Details may not add to totals due to rounding. Percent change calculated on unrounded figures.
*Other Travel includes ground transportation and air travel impacts for travel to other California visitor destinations, travel arrangement services and convention/trade shows services.
**Retail includes gasoline station employment and earnings. Economic impacts are attributed to visitor trips which are defined as trips taken by individuals that stay overnight away from home, or travel more than 50 miles one-way on a non-routine trip, as defined by the California Tourism Marketing Act
2013 2014 2015 2016 2017 2018 2019 2020 2021 2022 2021-2022 Travel Industry Earnings ($MIllion) 4.2 3.6 3.1 3.8 3.9 4.0 4.4 4.4 2.7 2.6 Accom. & Food Serv. -1.9% q 0.8 0.7 0.6 0.7 0.7 0.7 0.8 0.7 0.5 0.5 Arts, Ent. & Rec. -1.4% q 0.5 0.5 0.6 0.7 0.7 0.7 0.8 1.2 0.8 0.7 Retail** -6.3% q 0.0 0.0 0.0 0.0 0.0 0.0 0.0 0.0 0.0 0.0 Other Travel* 13.6% p 5.5 TOTAL 4.8 4.3 5.1 5.2 5.4 5.9 6.4 3.9 3.8 -2.7% q Travel Industry Employment (Jobs) 240 200 190 220 220 240 250 240 150 140 Accom. & Food Serv. -12.4% q 40 30 30 30 30 30 40 30 20 20 Arts, Ent. & Rec. -10.4% q 20 20 20 30 30 30 30 40 20 20 Retail** -12.3% q <10 <10 <10 <10 <10 <10 <10 <10 <10 <10 Other Travel* 3.6% p 300 TOTAL 250 240 280 280 300 310 310 200 180 -12.1% q
The Economic Impact of Travel in California / 2022p / Prepared by Dean Runyan Associates 100
Alpine County / Detail Trend
Direct Travel Impacts 2013-2022p
Details may not add to totals due to rounding. Percent change calculated on unrounded figures.
Local tax receipts include transient occupancy taxes, sales taxes, and airport passenger facility charges paid by visitors, and the property tax payments and sales tax payments attributable to the travel industry income of employees and businesses. State tax receipts include sales tax payments and motor fuel tax payments of visitors, and the income tax payments and sales tax payments attributable to the travel industry income of employees and businesses.
Economic impacts are attributed to visitor trips which are defined as trips taken by individuals that stay overnight away from home, or travel more than 50 miles one-way on a non-routine trip, as defined by the California Tourism Marketing Act
2013 2014 2015 2016 2017 2018 2019 2020 2021 2022 2021-2022 Tax Receipts Generated by Travel Spending ($Millions) 0.8 0.8 0.8 1.0 1.1 1.1 1.2 1.0 1.0 1.1 Local Tax Receipts 9.4% p 0.9 0.9 0.9 1.0 1.0 1.1 1.2 1.0 0.8 0.8 State Tax Receipts 3.1% p 1.8 TOTAL 1.7 1.7 2.0 2.1 2.2 2.4 2.0 1.8 2.0 6.6% p Local Tax Receipts Generated by Travel Spending ($Millions) 0.7 0.6 0.7 0.9 0.9 0.9 1.0 0.7 0.9 1.0 Visitor 13.9% p 0.2 0.2 0.1 0.2 0.2 0.2 0.2 0.3 0.2 0.1 Business or Employee -15.8% q 0.8 TOTAL 0.8 0.8 1.0 1.1 1.1 1.2 1.0 1.0 1.1 9.4% p State Tax Receipts Generated by Travel Spending ($Millions) 0.7 0.7 0.7 0.8 0.8 0.9 1.0 0.7 0.6 0.7 Visitor 6.2% p 0.2 0.2 0.2 0.2 0.2 0.2 0.2 0.3 0.2 0.2 Business or Employee -6.6% q 0.9 TOTAL 0.9 0.9 1.0 1.0 1.1 1.2 1.0 0.8 0.8 3.1% p
The Economic Impact of Travel in California / 2022p / Prepared by Dean Runyan Associates 101
Amador County / Detail Trend
Details may not add to totals due to rounding. Percent change calculated on unrounded figures.
*Other Travel includes ground transportation and air travel impacts for travel to other California visitor destinations, travel arrangement services and convention/trade shows services.
Economic impacts are attributed to visitor trips which are defined as trips taken by individuals that stay overnight away from home, or travel more than 50 miles one-way on a non-routine trip, as defined by the California Tourism Marketing Act
Travel Impacts 2013-2022p 2013 2014 2015 2016 2017 2018 2019 2020 2021 2022 2021-2022 Direct Travel Spending ($Million) 114.9 124.1 127.7 135.3 137.9 148.7 158.2 88.5 128.5 142.2 Destination Spending 10.7% p 6.4 6.4 5.7 5.1 5.8 6.9 7.2 2.5 4.1 5.9 Other Travel* 42.3% p 121.4 TOTAL 130.5 133.5 140.3 143.7 155.6 165.5 91.0 132.7 148.1 11.6% p Visitor Spending by Type of Traveler Accommodation ($Million) 43.1 45.8 49.5 55.2 53.5 57.8 62.1 31.6 48.3 40.3 Hotel, Motel, STVR -16.5% q 20.2 20.7 19.5 19.7 21.3 24.0 25.7 8.5 26.2 28.9 Private Home 10.2% p 15.6 19.4 19.4 19.6 20.6 21.6 23.3 19.6 24.4 31.3 Campground 28.1% p 11.4 11.6 12.0 12.2 13.3 14.6 14.9 18.4 16.5 17.7 2nd Home 7.3% p 24.6 26.6 27.3 28.5 29.1 30.7 32.2 10.4 13.2 24.1 Day Travel 83.1% p 114.9 TOTAL 124.1 127.7 135.3 137.9 148.7 158.2 88.5 128.5 142.2 10.7% p Visitor Spending by Commodity Purchased ($Million) 18.8 21.0 22.8 25.6 26.1 27.8 29.9 21.8 26.3 29.2 Accommodations 11.0% p 32.1 33.9 36.0 39.0 39.3 42.0 44.6 24.4 38.1 39.9 Food Service 4.7% p 7.9 9.1 9.4 9.5 9.5 9.8 10.3 7.0 10.7 13.2 Food Stores 23.1% p 16.3 17.8 16.5 15.5 16.7 19.3 20.5 9.2 14.5 18.4 Local Tran. & Gas 26.8% p 27.0 28.7 30.0 32.0 31.4 32.7 34.0 16.6 23.9 24.8 Arts, Ent. & Rec. 4.0% p 12.8 13.6 13.1 13.8 14.8 17.1 18.8 9.6 15.1 16.8 Retail Sales 11.3% p 114.9 TOTAL 124.1 127.7 135.3 137.9 148.7 158.2 88.5 128.5 142.2 10.7% p
Direct
The Economic Impact of Travel in California / 2022p / Prepared
Runyan Associates 102
by Dean
Amador County / Detail Trend
Direct Travel Impacts 2013-2022p
Details may not add to totals due to rounding. Percent change calculated on unrounded figures.
*Other Travel includes ground transportation and air travel impacts for travel to other California visitor destinations, travel arrangement services and convention/trade shows services.
**Retail includes gasoline station employment and earnings.
Economic impacts are attributed to visitor trips which are defined as trips taken by individuals that stay overnight away from home, or travel more than 50 miles one-way on a non-routine trip, as defined by the California Tourism Marketing Act
2013 2014 2015 2016 2017 2018 2019 2020 2021 2022 2021-2022 Travel Industry Earnings ($MIllion) 27.9 29.1 31.3 34.8 40.4 47.3 52.2 44.9 54.4 63.5 Accom. & Food Serv. 16.8% p 12.4 13.8 12.9 13.9 14.9 14.3 15.0 13.0 19.1 21.9 Arts, Ent. & Rec. 14.6% p 3.0 3.4 3.4 3.7 4.0 4.4 4.6 5.2 5.5 5.7 Retail** 3.9% p 1.3 1.5 1.6 1.8 2.0 2.9 3.2 1.2 1.1 1.1 Ground Tran. -7.6% q 0.2 0.2 0.2 0.2 0.3 0.3 0.3 0.3 0.3 0.4 Other Travel* 26.7% p 44.9 TOTAL 47.9 49.4 54.4 61.6 69.2 75.4 64.5 80.5 92.6 15.1% p Travel Industry Employment (Jobs) 960 940 970 990 1,100 1,240 1,350 1,130 1,260 1,360 Accom. & Food Serv. 8.2% p 750 800 830 870 850 740 720 680 900 950 Arts, Ent. & Rec. 5.5% p 110 130 130 130 140 150 150 160 160 160 Retail** -0.7% q 40 40 40 40 40 60 60 60 50 60 Ground Tran. 7.2% p <10 10 10 10 10 10 10 10 10 10 Other Travel* 15.2% p 1,870 TOTAL 1,920 1,970 2,050 2,140 2,210 2,300 2,040 2,390 2,550 6.6% p
The Economic Impact of Travel in California / 2022p / Prepared by Dean Runyan Associates 103
Amador County / Detail Trend
Direct Travel Impacts 2013-2022p
Details may not add to totals due to rounding. Percent change calculated on unrounded figures.
Local tax receipts include transient occupancy taxes, sales taxes, and airport passenger facility charges paid by visitors, and the property tax payments and sales tax payments attributable to the travel industry income of employees and businesses. State tax receipts include sales tax payments and motor fuel tax payments of visitors, and the income tax payments and sales tax payments attributable to the travel industry income of employees and businesses.
Economic impacts are attributed to visitor trips which are defined as trips taken by individuals that stay overnight away from home, or travel more than 50 miles one-way on a non-routine trip, as defined by the California Tourism Marketing Act
2013 2014 2015 2016 2017 2018 2019 2020 2021 2022 2021-2022 Tax Receipts Generated by Travel Spending ($Millions) 3.0 3.3 3.7 4.1 4.3 4.9 5.4 4.7 6.1 6.4 Local Tax Receipts 4.5% p 6.0 6.5 6.4 6.4 6.6 7.5 8.1 5.4 7.3 7.9 State Tax Receipts 8.3% p 9.0 TOTAL 9.8 10.1 10.6 10.9 12.4 13.4 10.1 13.4 14.3 6.6% p Local Tax Receipts Generated by Travel Spending ($Millions) 1.5 1.7 2.1 2.4 2.5 2.8 3.0 2.0 2.8 3.1 Visitor 10.3% p 1.5 1.6 1.6 1.7 1.9 2.1 2.3 2.6 3.3 3.3 Business or Employee -0.3% q 3.0 TOTAL 3.3 3.7 4.1 4.3 4.9 5.4 4.7 6.1 6.4 4.5% p State Tax Receipts Generated by Travel Spending ($Millions) 4.5 4.8 4.7 4.7 4.8 5.6 6.0 3.2 4.6 5.1 Visitor 11.3% p 1.5 1.7 1.7 1.7 1.8 1.9 2.0 2.2 2.7 2.8 Business or Employee 3.2% p 6.0 TOTAL 6.5 6.4 6.4 6.6 7.5 8.1 5.4 7.3 7.9 8.3% p
The Economic Impact of Travel in California / 2022p / Prepared
Runyan Associates 104
by Dean
Butte County / Detail Trend
Details may not add to totals due to rounding. Percent change calculated on unrounded figures.
*Other Travel includes ground transportation and air travel impacts for travel to other California visitor destinations, travel arrangement services and convention/trade shows services.
Economic impacts are attributed to visitor trips which are defined as trips taken by individuals that stay overnight away from home, or travel more than 50 miles one-way on a non-routine trip, as defined by the California Tourism Marketing Act
Travel Impacts 2013-2022p 2013 2014 2015 2016 2017 2018 2019 2020 2021 2022 2021-2022 Direct Travel Spending ($Million) 261.7 265.9 265.0 270.4 295.8 312.2 338.7 180.0 284.4 308.2 Destination Spending 8.4% p 42.4 42.4 36.1 32.0 36.0 42.1 43.7 14.6 23.8 33.7 Other Travel* 41.7% p 304.1 TOTAL 308.3 301.1 302.4 331.7 354.2 382.5 194.6 308.2 341.9 10.9% p Visitor Spending by Type of Traveler Accommodation ($Million) 87.0 88.9 91.9 97.1 108.5 114.0 129.0 82.1 126.6 92.3 Hotel, Motel, STVR -27.1% q 55.5 55.5 52.7 51.9 58.1 63.2 68.3 19.3 59.9 66.8 Private Home 11.4% p 16.6 18.1 18.4 18.6 19.5 20.5 22.1 18.5 23.0 29.5 Campground 28.1% p 26.5 27.0 26.3 26.8 28.1 29.9 30.6 36.2 32.7 50.3 2nd Home 53.8% p 76.2 76.4 75.8 76.1 81.5 84.7 88.8 23.9 42.2 69.3 Day Travel 64.3% p 261.7 TOTAL 265.9 265.0 270.4 295.8 312.2 338.7 180.0 284.4 308.2 8.4% p Visitor Spending by Commodity Purchased ($Million) 47.2 50.0 53.1 56.5 62.2 64.7 74.6 62.0 76.5 79.1 Accommodations 3.3% p 70.2 70.5 73.3 77.3 83.6 86.8 92.9 45.8 80.0 81.3 Food Service 1.6% p 14.7 15.3 15.8 15.9 16.3 16.4 17.2 11.1 17.7 21.8 Food Stores 23.3% p 54.4 55.0 49.8 45.7 51.6 58.2 61.5 19.2 38.1 49.0 Local Tran. & Gas 28.6% p 35.2 35.4 35.9 37.2 39.2 39.8 41.5 20.4 33.0 33.4 Arts, Ent. & Rec. 1.3% p 39.1 39.0 37.1 37.9 42.8 46.4 51.0 21.7 39.1 43.6 Retail Sales 11.3% p 260.8 TOTAL 265.2 265.0 270.4 295.8 312.2 338.7 180.0 284.4 308.2 8.4% p
Direct
The Economic Impact of Travel in California / 2022p / Prepared by Dean Runyan Associates 105
Butte County / Detail Trend
Direct Travel Impacts 2013-2022p
Details may not add to totals due to rounding. Percent change calculated on unrounded figures.
*Other Travel includes ground transportation and air travel impacts for travel to other California visitor destinations, travel arrangement services and convention/trade shows services.
**Retail includes gasoline station employment and earnings.
Economic impacts are attributed to visitor trips which are defined as trips taken by individuals that stay overnight away from home, or travel more than 50 miles one-way on a non-routine trip, as defined by the California Tourism Marketing Act
2013 2014 2015 2016 2017 2018 2019 2020 2021 2022 2021-2022 Travel Industry Earnings ($MIllion) 45.7 47.7 50.0 53.7 59.2 65.4 72.6 60.4 72.8 77.2 Accom. & Food Serv. 6.1% p 15.2 15.5 15.5 16.8 20.1 22.4 24.1 13.3 17.4 19.4 Arts, Ent. & Rec. 11.3% p 7.8 8.0 8.1 8.5 9.5 9.9 10.4 10.8 11.8 12.8 Retail** 8.2% p 3.9 4.0 4.2 4.7 5.7 8.0 8.8 2.6 3.0 2.8 Ground Tran. -6.4% q 2.2 2.4 1.6 1.8 1.8 1.9 2.1 2.6 2.6 3.6 Other Travel* 36.0% p 74.8 TOTAL 77.7 79.4 85.5 96.3 107.6 118.1 89.7 107.7 115.8 7.5% p Travel Industry Employment (Jobs) 2,090 2,100 2,060 2,090 2,210 2,310 2,350 1,950 2,150 2,180 Accom. & Food Serv. 1.5% p 990 980 980 1,010 1,100 1,120 1,100 670 840 960 Arts, Ent. & Rec. 14.3% p 280 290 280 290 310 310 310 300 320 340 Retail** 5.4% p 110 110 110 110 120 160 170 120 140 160 Ground Tran. 8.5% p 80 80 70 80 80 80 80 100 90 120 Other Travel* 23.9% p 3,550 TOTAL 3,560 3,500 3,580 3,810 3,980 4,020 3,150 3,550 3,750 5.7% p
The Economic Impact of Travel in California / 2022p / Prepared by Dean Runyan Associates 106
Butte County / Detail Trend
Direct Travel Impacts 2013-2022p
Details may not add to totals due to rounding. Percent change calculated on unrounded figures.
Local tax receipts include transient occupancy taxes, sales taxes, and airport passenger facility charges paid by visitors, and the property tax payments and sales tax payments attributable to the travel industry income of employees and businesses. State tax receipts include sales tax payments and motor fuel tax payments of visitors, and the income tax payments and sales tax payments attributable to the travel industry income of employees and businesses.
Economic impacts are attributed to visitor trips which are defined as trips taken by individuals that stay overnight away from home, or travel more than 50 miles one-way on a non-routine trip, as defined by the California Tourism Marketing Act
2013 2014 2015 2016 2017 2018 2019 2020 2021 2022 2021-2022 Tax Receipts Generated by Travel Spending ($Millions) 6.5 6.7 7.0 7.4 8.2 9.1 10.4 8.3 11.0 10.3 Local Tax Receipts -6.8% q 17.4 17.9 16.9 16.4 17.4 20.2 21.8 11.2 16.5 18.0 State Tax Receipts 8.7% p 23.9 TOTAL 24.6 23.9 23.8 25.6 29.3 32.2 19.5 27.5 28.2 2.5% p Local Tax Receipts Generated by Travel Spending ($Millions) 4.1 4.3 4.5 4.8 5.4 6.0 6.9 4.8 6.8 6.3 Visitor -6.7% q 2.4 2.4 2.5 2.6 2.8 3.1 3.5 3.5 4.2 3.9 Business or Employee -7.0% q 6.5 TOTAL 6.7 7.0 7.4 8.2 9.1 10.4 8.3 11.0 10.3 -6.8% q State Tax Receipts Generated by Travel Spending ($Millions) 14.6 14.9 14.0 13.3 14.3 16.9 18.2 7.8 12.3 13.8 Visitor 12.3% p 2.9 3.0 3.0 3.0 3.1 3.3 3.6 3.4 4.2 4.1 Business or Employee -2.2% q 17.4 TOTAL 17.9 16.9 16.4 17.4 20.2 21.8 11.2 16.5 18.0 8.7% p
The Economic Impact of Travel in California / 2022p / Prepared by Dean Runyan Associates 107
Calaveras County / Detail Trend
Details may not add to totals due to rounding. Percent change calculated on unrounded figures.
*Other Travel includes ground transportation and air travel impacts for travel to other California visitor destinations, travel arrangement services and convention/trade shows services.
Economic impacts are attributed to visitor trips which are defined as trips taken by individuals that stay overnight away from home, or travel more than 50 miles one-way on a non-routine trip, as defined by the California Tourism Marketing Act
Travel Impacts
2013 2014 2015 2016 2017 2018 2019 2020 2021 2022 2021-2022 Direct Travel Spending ($Million) 163.4 170.4 172.7 180.7 187.7 200.2 212.8 167.3 210.6 237.7 Destination Spending 12.9% p 8.8 8.9 8.1 7.4 8.3 9.5 9.9 3.9 5.9 8.3 Other Travel* 40.0% p 172.2 TOTAL 179.3 180.8 188.1 195.9 209.7 222.7 171.2 216.5 246.0 13.6% p Visitor Spending by Type of Traveler Accommodation ($Million) 45.5 49.0 51.7 57.6 57.5 61.2 66.3 46.7 69.8 65.0 Hotel, Motel, STVR -6.9% q 24.5 24.8 23.2 23.5 25.2 27.4 29.5 9.8 30.0 33.1 Private Home 10.2% p 28.1 30.1 29.8 30.2 31.7 33.2 35.8 30.0 37.4 48.0 Campground 28.2% p 39.2 39.4 41.0 41.7 44.5 48.6 49.7 68.9 61.7 66.4 2nd Home 7.7% p 26.1 27.0 27.0 27.7 28.7 29.8 31.5 11.9 11.7 25.3 Day Travel 116.4% p 163.4 TOTAL 170.4 172.7 180.7 187.7 200.2 212.8 167.3 210.6 237.7 12.9% p Visitor Spending by Commodity Purchased ($Million) 35.1 37.8 40.0 43.8 45.0 46.8 50.1 48.5 61.0 67.6 Accommodations 10.8% p 47.7 49.0 51.1 54.8 55.9 58.5 62.3 48.5 60.3 64.8 Food Service 7.5% p 12.5 13.2 13.5 13.7 13.7 13.9 14.7 11.2 16.9 21.0 Food Stores 24.1% p 25.3 26.2 23.8 22.1 24.1 27.4 29.1 15.8 21.4 28.4 Local Tran. & Gas 32.7% p 26.1 26.8 27.3 28.6 28.7 29.2 30.3 23.6 27.0 28.9 Arts, Ent. & Rec. 7.2% p 16.7 17.3 17.1 17.9 20.2 24.3 26.4 19.6 24.0 27.0 Retail Sales 12.7% p 163.4 TOTAL 170.4 172.7 180.7 187.7 200.2 212.8 167.3 210.6 237.7 12.9% p
Direct
2013-2022p
The Economic Impact of Travel in California / 2022p / Prepared
Runyan Associates 108
by Dean
Calaveras County / Detail Trend
Direct Travel Impacts 2013-2022p
Details may not add to totals due to rounding. Percent change calculated on unrounded figures.
*Other Travel includes ground transportation and air travel impacts for travel to other California visitor destinations, travel arrangement services and convention/trade shows services.
**Retail includes gasoline station employment and earnings.
Economic impacts are attributed to visitor trips which are defined as trips taken by individuals that stay overnight away from home, or travel more than 50 miles one-way on a non-routine trip, as defined by the California Tourism Marketing Act
2013 2014 2015 2016 2017 2018 2019 2020 2021 2022 2021-2022 Travel Industry Earnings ($MIllion) 46.3 47.1 47.8 52.8 58.5 62.1 67.8 62.8 75.2 91.3 Accom. & Food Serv. 21.4% p 9.4 9.9 17.0 18.4 19.9 19.9 21.2 15.8 19.2 23.2 Arts, Ent. & Rec. 20.4% p 5.2 5.6 5.7 6.1 6.7 7.4 7.9 8.5 9.4 10.7 Retail** 14.3% p 1.9 2.0 2.1 2.4 2.8 3.9 4.3 2.2 1.6 1.6 Ground Tran. -2.7% q 0.7 0.7 0.8 0.9 1.0 1.1 1.1 0.9 1.0 1.2 Other Travel* 26.1% p 63.4 TOTAL 65.3 73.5 80.5 88.9 94.4 102.3 90.2 106.4 128.0 20.3% p Travel Industry Employment (Jobs) 1,510 1,500 1,420 1,500 1,640 1,690 1,700 1,490 1,630 1,840 Accom. & Food Serv. 12.6% p 390 420 690 690 700 710 690 490 580 690 Arts, Ent. & Rec. 18.2% p 190 200 200 210 230 240 250 260 270 300 Retail** 11.7% p 50 50 50 60 60 80 90 100 80 90 Ground Tran. 12.9% p 30 30 30 40 40 40 40 30 30 40 Other Travel* 18.6% p 2,170 TOTAL 2,210 2,400 2,490 2,670 2,760 2,770 2,370 2,590 2,950 13.9% p
The Economic Impact of Travel in California / 2022p / Prepared by Dean Runyan Associates 109
Calaveras County / Detail Trend
Direct Travel Impacts 2013-2022p
Details may not add to totals due to rounding. Percent change calculated on unrounded figures.
Local tax receipts include transient occupancy taxes, sales taxes, and airport passenger facility charges paid by visitors, and the property tax payments and sales tax payments attributable to the travel industry income of employees and businesses. State tax receipts include sales tax payments and motor fuel tax payments of visitors, and the income tax payments and sales tax payments attributable to the travel industry income of employees and businesses.
Economic impacts are attributed to visitor trips which are defined as trips taken by individuals that stay overnight away from home, or travel more than 50 miles one-way on a non-routine trip, as defined by the California Tourism Marketing Act
2013 2014 2015 2016 2017 2018 2019 2020 2021 2022 2021-2022 Tax Receipts Generated by Travel Spending ($Millions) 4.1 4.3 4.7 5.1 5.3 5.7 6.2 6.1 7.9 8.5 Local Tax Receipts 7.2% p 7.7 8.0 8.0 8.0 8.2 9.2 9.9 8.0 9.6 10.7 State Tax Receipts 11.5% p 11.9 TOTAL 12.4 12.7 13.1 13.5 14.9 16.1 14.1 17.5 19.1 9.5% p Local Tax Receipts Generated by Travel Spending ($Millions) 2.1 2.3 2.4 2.7 2.7 2.9 3.2 2.6 3.7 4.1 Visitor 10.6% p 2.0 2.1 2.3 2.4 2.6 2.8 3.0 3.5 4.2 4.4 Business or Employee 4.2% p 4.1 TOTAL 4.3 4.7 5.1 5.3 5.7 6.2 6.1 7.9 8.5 7.2% p State Tax Receipts Generated by Travel Spending ($Millions) 5.5 5.7 5.5 5.3 5.5 6.5 7.0 4.8 5.7 6.5 Visitor 14.2% p 2.3 2.3 2.6 2.6 2.7 2.7 2.9 3.3 3.9 4.2 Business or Employee 7.5% p 7.7 TOTAL 8.0 8.0 8.0 8.2 9.2 9.9 8.0 9.6 10.7 11.5% p
The Economic Impact of Travel in California / 2022p / Prepared
Runyan Associates 110
by Dean
Colusa County / Detail Trend
Details may not add to totals due to rounding. Percent change calculated on unrounded figures.
*Other Travel includes ground transportation and air travel impacts for travel to other California visitor destinations, travel arrangement services and convention/trade shows services.
Economic impacts are attributed to visitor trips which are defined as trips taken by individuals that stay overnight away from home, or travel more than 50 miles one-way on a non-routine trip, as defined by the California Tourism Marketing Act
Travel Impacts
2013 2014 2015 2016 2017 2018 2019 2020 2021 2022 2021-2022 Direct Travel Spending ($Million) 43.9 43.1 42.7 45.1 47.7 52.7 55.0 27.6 45.8 45.8 Destination Spending 0.0% q 3.7 3.7 3.3 2.9 3.3 3.8 4.0 1.3 2.2 3.2 Other Travel* 42.3% p 47.6 TOTAL 46.9 46.0 48.0 51.0 56.5 59.0 29.0 48.0 48.9 2.0% p Visitor Spending by Type of Traveler Accommodation ($Million) 11.5 11.2 11.3 12.6 13.4 15.4 16.4 11.2 18.4 14.5 Hotel, Motel, STVR -21.5% q 11.1 10.9 10.3 10.7 11.5 12.5 13.2 4.4 13.4 14.7 Private Home 10.2% p 0.5 0.5 0.5 0.5 0.5 0.5 0.6 0.5 0.6 0.8 Campground 28.1% p 6.1 6.2 6.4 6.5 7.0 7.6 7.8 6.6 5.9 4.7 2nd Home -20.5% q 14.7 14.3 14.2 14.8 15.4 16.6 17.0 4.9 7.4 11.1 Day Travel 49.2% p 43.9 TOTAL 43.1 42.7 45.1 47.7 52.7 55.0 27.6 45.8 45.8 0.0% q Visitor Spending by Commodity Purchased ($Million) 6.5 6.6 6.8 7.6 8.0 8.9 9.4 7.6 9.5 9.5 Accommodations -0.1% q 14.4 14.1 14.5 15.7 16.3 17.6 18.4 8.8 16.0 15.3 Food Service -4.4% q 2.3 2.3 2.4 2.5 2.5 2.5 2.6 1.1 2.4 2.7 Food Stores 11.0% p 6.3 6.2 5.5 5.2 5.7 6.7 6.9 2.2 4.2 4.7 Local Tran. & Gas 13.0% p 8.0 7.8 7.8 8.3 8.5 8.9 9.1 4.2 6.9 6.6 Arts, Ent. & Rec. -4.4% q 6.3 6.1 5.6 5.9 6.7 8.0 8.7 3.8 6.8 7.0 Retail Sales 3.0% p 43.9 TOTAL 43.1 42.7 45.1 47.7 52.7 55.0 27.6 45.8 45.8 0.0% q
Direct
2013-2022p
The Economic Impact of Travel in California / 2022p / Prepared by Dean Runyan Associates 111
Colusa County / Detail Trend
Direct Travel Impacts 2013-2022p
Details may not add to totals due to rounding. Percent change calculated on unrounded figures.
*Other Travel includes ground transportation and air travel impacts for travel to other California visitor destinations, travel arrangement services and convention/trade shows services.
**Retail includes gasoline station employment and earnings.
Economic impacts are attributed to visitor trips which are defined as trips taken by individuals that stay overnight away from home, or travel more than 50 miles one-way on a non-routine trip, as defined by the California Tourism Marketing Act
2013 2014 2015 2016 2017 2018 2019 2020 2021 2022 2021-2022 Travel Industry Earnings ($MIllion) 5.8 5.3 5.4 6.1 5.8 6.2 6.8 6.1 7.4 8.4 Accom. & Food Serv. 13.7% p 3.0 3.1 3.2 3.4 3.3 3.7 3.7 3.8 4.7 3.1 Arts, Ent. & Rec. -33.3% q 1.3 1.3 1.3 1.4 1.5 1.6 1.7 1.7 2.0 2.1 Retail** 4.2% p 0.5 0.5 0.5 0.5 0.6 0.9 1.0 0.3 0.4 0.3 Ground Tran. -18.4% q 0.1 0.1 0.1 0.1 0.2 0.2 0.3 0.3 0.3 0.4 Other Travel* 25.1% p 10.6 TOTAL 10.3 10.5 11.6 11.4 12.6 13.5 12.2 14.8 14.3 -3.1% q Travel Industry Employment (Jobs) 320 290 280 290 270 280 310 260 290 330 Accom. & Food Serv. 14.0% p 260 290 270 290 300 330 320 290 350 210 Arts, Ent. & Rec. -39.4% q 50 40 40 40 40 50 50 50 60 60 Retail** -2.9% q 10 10 10 10 10 20 20 10 20 20 Ground Tran. -5.4% q <10 <10 <10 <10 <10 <10 <10 <10 <10 10 Other Travel* 18.9% p 640 TOTAL 650 610 630 640 680 710 620 730 630 -13.7% q
The Economic Impact of Travel in California / 2022p / Prepared
Runyan Associates 112
by Dean
Colusa County / Detail Trend
Direct Travel Impacts 2013-2022p
Details may not add to totals due to rounding. Percent change calculated on unrounded figures.
Local tax receipts include transient occupancy taxes, sales taxes, and airport passenger facility charges paid by visitors, and the property tax payments and sales tax payments attributable to the travel industry income of employees and businesses. State tax receipts include sales tax payments and motor fuel tax payments of visitors, and the income tax payments and sales tax payments attributable to the travel industry income of employees and businesses.
Economic impacts are attributed to visitor trips which are defined as trips taken by individuals that stay overnight away from home, or travel more than 50 miles one-way on a non-routine trip, as defined by the California Tourism Marketing Act
2013 2014 2015 2016 2017 2018 2019 2020 2021 2022 2021-2022 Tax Receipts Generated by Travel Spending ($Millions) 1.0 1.0 1.0 1.1 1.1 1.3 1.4 1.2 1.6 1.6 Local Tax Receipts -4.5% q 2.4 2.4 2.3 2.3 2.4 2.7 2.9 1.5 2.4 2.4 State Tax Receipts -0.4% q 3.4 TOTAL 3.4 3.3 3.4 3.5 4.1 4.3 2.7 4.0 3.9 -2.0% q Local Tax Receipts Generated by Travel Spending ($Millions) 0.6 0.6 0.6 0.7 0.8 1.0 1.0 0.7 1.0 1.0 Visitor 2.5% p 0.4 0.3 0.3 0.4 0.3 0.4 0.4 0.5 0.6 0.5 Business or Employee -16.1% q 1.0 TOTAL 1.0 1.0 1.1 1.1 1.3 1.4 1.2 1.6 1.6 -4.5% q State Tax Receipts Generated by Travel Spending ($Millions) 2.0 2.0 1.9 1.9 2.0 2.4 2.5 1.1 1.8 1.8 Visitor 2.9% p 0.4 0.4 0.4 0.4 0.4 0.4 0.4 0.5 0.6 0.5 Business or Employee -10.6% q 2.4 TOTAL 2.4 2.3 2.3 2.4 2.7 2.9 1.5 2.4 2.4 -0.4% q
The Economic Impact of Travel in California / 2022p / Prepared by Dean Runyan Associates 113
Contra Costa County / Detail Trend
Details may not add to totals due to rounding. Percent change calculated on unrounded figures.
*Other Travel includes ground transportation and air travel impacts for travel to other California visitor destinations, travel arrangement services and convention/trade shows services.
Economic impacts are attributed to visitor trips which are defined as trips taken by individuals that stay overnight away from home, or travel more than 50 miles one-way on a non-routine trip, as defined by the California Tourism Marketing Act
2013 2014 2015 2016 2017 2018 2019 2020 2021 2022 2021-2022 Direct Travel Spending ($Million) 1,340 1,403 1,383 1,504 1,580 1,676 1,739 571 1,290 1,446 Destination Spending 12.1% p 232 239 225 210 229 254 264 109 162 237 Other Travel* 46.2% p 1,572 TOTAL 1,641 1,608 1,714 1,809 1,930 2,004 680 1,452 1,682 15.9% p Visitor Spending by Type of Traveler Accommodation ($Million) 431 447 441 517 545 569 581 251 323 342 Hotel, Motel, STVR 5.9% p 364 365 360 378 409 449 483 106 518 513 Private Home -0.9% q 29 66 65 66 69 73 79 66 82 105 Campground 28.0% p 32 33 34 35 37 40 41 37 34 27 2nd Home -20.3% q 483 492 482 509 520 546 555 110 334 459 Day Travel 37.6% p 1,340 TOTAL 1,403 1,383 1,504 1,580 1,676 1,739 571 1,290 1,446 12.1% p Visitor Spending by Commodity Purchased ($Million) 179 204 210 245 256 270 279 121 169 189 Accommodations 12.0% p 425 433 438 489 508 530 547 184 431 470 Food Service 8.9% p 71 81 82 85 85 86 88 36 86 99 Food Stores 15.4% p 219 230 206 198 215 244 251 57 163 207 Local Tran. & Gas 27.3% p 223 228 226 247 250 255 256 81 191 203 Arts, Ent. & Rec. 6.4% p 223 226 222 240 265 291 318 92 250 278 Retail Sales 11.0% p 1,340 TOTAL 1,403 1,383 1,504 1,580 1,676 1,739 571 1,290 1,446 12.1% p
Direct Travel Impacts 2013-2022p
The Economic Impact of Travel in California / 2022p / Prepared by Dean Runyan Associates 114
Contra Costa County / Detail Trend
Direct Travel Impacts 2013-2022p
Details may not add to totals due to rounding. Percent change calculated on unrounded figures.
*Other Travel includes ground transportation and air travel impacts for travel to other California visitor destinations, travel arrangement services and convention/trade shows services.
**Retail includes gasoline station employment and earnings.
Economic impacts are attributed to visitor trips which are defined as trips taken by individuals that stay overnight away from home, or travel more than 50 miles one-way on a non-routine trip, as defined by the California Tourism Marketing Act
2013 2014 2015 2016 2017 2018 2019 2020 2021 2022 2021-2022 Travel Industry Earnings ($MIllion) 331 337 368 439 461 467 495 367 431 485 Accom. & Food Serv. 12.5% p 127 127 129 153 165 161 166 119 138 141 Arts, Ent. & Rec. 2.7% p 40 43 44 48 52 53 56 55 66 71 Retail** 7.7% p 18 20 20 24 27 38 41 9 14 14 Ground Tran. -5.2% q 23 25 29 32 33 32 33 31 28 37 Other Travel* 33.3% p 539 TOTAL 553 591 696 738 753 791 581 677 748 10.5% p Travel Industry Employment (Jobs) 8,620 8,470 8,520 9,490 9,600 9,480 9,520 7,060 7,590 8,110 Accom. & Food Serv. 6.8% p 5,470 5,410 5,330 5,760 5,650 5,670 5,820 3,770 4,240 4,840 Arts, Ent. & Rec. 14.1% p 1,290 1,350 1,320 1,430 1,480 1,490 1,490 1,370 1,500 1,500 Retail** -0.2% q 510 530 510 560 580 750 820 400 680 740 Ground Tran. 10.0% p 510 540 570 620 630 580 580 570 450 500 Other Travel* 11.9% p 16,410 TOTAL 16,310 16,250 17,870 17,930 17,980 18,230 13,170 14,460 15,700 8.5% p
The Economic Impact of Travel in California / 2022p / Prepared by Dean Runyan Associates 115
Contra Costa County / Detail Trend
Details may not add to totals due to rounding. Percent change calculated on unrounded figures.
Local tax receipts include transient occupancy taxes, sales taxes, and airport passenger facility charges paid by visitors, and the property tax payments and sales tax payments attributable to the travel industry income of employees and businesses. State tax receipts include sales tax payments and motor fuel tax payments of visitors, and the income tax payments and sales tax payments attributable to the travel industry income of employees and businesses.
Economic impacts are attributed to visitor trips which are defined as trips taken by individuals that stay overnight away from home, or travel more than 50 miles one-way on a non-routine trip, as defined by the California Tourism Marketing Act
2013 2014 2015 2016 2017 2018 2019 2020 2021 2022 2021-2022 Tax Receipts Generated by Travel Spending ($Millions) 45 48 49 57 59 63 66 39 56 58 Local Tax Receipts 3.9% p 90 94 90 93 95 107 113 50 86 95 State Tax Receipts 10.3% p 136 TOTAL 142 140 149 154 170 179 90 142 153 7.8% p Local Tax Receipts Generated by Travel Spending ($Millions) 26 29 29 34 35 39 41 15 27 31 Visitor 12.6% p 19 19 20 23 23 24 25 24 29 27 Business or Employee -4.4% q 45 TOTAL 48 49 57 59 63 66 39 56 58 3.9% p State Tax Receipts Generated by Travel Spending ($Millions) 72 75 71 71 74 87 92 32 63 72 Visitor 13.7% p 18 18 19 21 21 20 21 18 23 23 Business or Employee 0.7% p 90 TOTAL 94 90 93 95 107 113 50 86 95 10.3% p
Direct Travel Impacts 2013-2022p
The Economic Impact of Travel in California / 2022p / Prepared by Dean Runyan Associates 116
Del Norte County / Detail Trend
Details may not add to totals due to rounding. Percent change calculated on unrounded figures.
*Other Travel includes ground transportation and air travel impacts for travel to other California visitor destinations, travel arrangement services and convention/trade shows services.
Economic impacts are attributed to visitor trips which are defined as trips taken by individuals that stay overnight away from home, or travel more than 50 miles one-way on a non-routine trip, as defined by the California Tourism Marketing Act
A - Values estimated less than $500,000
Direct Travel Impacts 2013-2022p 2013 2014 2015 2016 2017 2018 2019 2020 2021 2022 2021-2022 Direct Travel Spending ($Million) 109.5 115.1 118.3 125.4 127.4 136.4 144.7 87.1 147.2 148.8 Destination Spending 1.1% p 5.8 5.7 4.6 4.5 4.9 5.6 5.8 1.7 2.9 4.1 Other Travel* 42.3% p 115.3 TOTAL 120.8 122.9 129.9 132.3 142.0 150.5 88.8 150.1 152.9 1.9% p Visitor Spending by Type of Traveler Accommodation ($Million) 43.0 45.8 49.2 54.5 53.6 58.0 61.2 39.9 75.8 57.2 Hotel, Motel, STVR -24.5% q 16.0 15.6 14.3 14.8 15.4 17.1 18.1 5.8 17.9 19.7 Private Home 10.1% p 28.0 30.6 31.1 31.5 33.0 34.7 37.4 31.3 39.0 50.0 Campground 28.1% p 2.3 2.3 2.4 2.4 2.5 2.8 2.8 3.3 3.0 2.9 2nd Home -0.8% q 20.2 20.9 21.3 22.2 22.8 23.9 25.2 6.8 11.6 19.0 Day Travel 64.3% p 109.5 TOTAL 115.1 118.3 125.4 127.4 136.4 144.7 87.1 147.2 148.8 1.1% p Visitor Spending by Commodity Purchased ($Million) 22.1 24.4 26.9 29.8 30.0 31.7 33.3 26.9 42.1 44.9 Accommodations 6.6% p 30.5 31.5 33.3 36.0 36.6 39.1 41.7 22.5 41.4 36.5 Food Service -11.8% q 10.2 10.9 11.3 11.5 11.6 11.9 12.6 9.3 14.0 17.2 Food Stores 22.9% p 16.2 17.0 15.7 14.8 16.0 18.5 19.7 10.3 17.2 20.1 Local Tran. & Gas 16.7% p 16.2 16.7 17.3 18.3 18.2 19.0 19.7 10.1 17.5 15.7 Arts, Ent. & Rec. -10.3% q 13.1 13.5 13.1 13.7 14.3 15.5 16.9 8.0 15.0 14.4 Retail Sales -3.9% q 108.3 TOTAL 114.0 117.7 124.1 126.6 135.5 143.9 87.1 147.2 148.8 1.1% p
The Economic Impact of Travel in California / 2022p / Prepared by Dean Runyan Associates 117
Del Norte County / Detail Trend
Details may not add to totals due to rounding. Percent change calculated on unrounded figures.
*Other Travel includes ground transportation and air travel impacts for travel to other California visitor destinations, travel arrangement services and convention/trade shows services.
**Retail includes gasoline station employment and earnings.
Economic impacts are attributed to visitor trips which are defined as trips taken by individuals that stay overnight away from home, or travel more than 50 miles one-way on a non-routine trip, as defined by the California Tourism Marketing Act
A - Values estimated less than $500,000
2013 2014 2015 2016 2017 2018 2019 2020 2021 2022 2021-2022 Travel Industry Earnings ($MIllion) 25.0 25.8 28.0 30.6 31.3 36.4 39.4 29.9 37.0 43.3 Accom. & Food Serv. 17.2% p 9.0 9.0 9.4 10.0 10.1 10.9 11.6 10.8 14.1 15.6 Arts, Ent. & Rec. 10.3% p 3.5 3.7 3.8 4.0 4.5 4.6 4.9 5.4 6.0 7.1 Retail** 17.8% p 1.3 1.4 1.5 1.7 2.0 2.8 3.1 1.3 1.3 1.1 Ground Tran. -18.2% q 0.5 0.5 0.5 0.6 1.0 1.1 1.1 0.3 0.3 0.5 Other Travel* 64.3% p 39.3 TOTAL 40.4 43.3 46.9 48.9 55.8 60.2 47.6 58.7 67.6 15.0% p Travel Industry Employment (Jobs) 990 990 1,000 990 1,000 1,110 1,130 840 940 1,030 Accom. & Food Serv. 8.8% p 230 220 210 200 200 210 210 190 240 240 Arts, Ent. & Rec. 0.3% p 130 140 130 150 160 160 160 170 180 200 Retail** 9.9% p 40 40 40 40 40 60 60 60 60 60 Ground Tran. -5.1% q 10 10 10 10 20 20 20 10 10 20 Other Travel* 49.3% p 1,390 TOTAL 1,390 1,390 1,390 1,420 1,550 1,600 1,270 1,430 1,530 7.3% p
Direct Travel Impacts 2013-2022p
The Economic Impact of Travel in California / 2022p / Prepared by Dean Runyan Associates 118
Del Norte County / Detail Trend
Direct Travel Impacts 2013-2022p
Details may not add to totals due to rounding. Percent change calculated on unrounded figures.
Local tax receipts include transient occupancy taxes, sales taxes, and airport passenger facility charges paid by visitors, and the property tax payments and sales tax payments attributable to the travel industry income of employees and businesses. State tax receipts include sales tax payments and motor fuel tax payments of visitors, and the income tax payments and sales tax payments attributable to the travel industry income of employees and businesses.
Economic impacts are attributed to visitor trips which are defined as trips taken by individuals that stay overnight away from home, or travel more than 50 miles one-way on a non-routine trip, as defined by the California Tourism Marketing Act
2013 2014 2015 2016 2017 2018 2019 2020 2021 2022 2021-2022 Tax Receipts Generated by Travel Spending ($Millions) 3.6 3.8 4.1 4.4 4.6 5.2 5.5 4.6 6.7 6.9 Local Tax Receipts 2.8% p 5.7 6.0 5.9 6.0 5.9 6.7 7.2 4.8 7.1 7.1 State Tax Receipts 0.2% p 9.3 TOTAL 9.8 10.0 10.4 10.5 11.8 12.7 9.4 13.8 14.0 1.5% p Local Tax Receipts Generated by Travel Spending ($Millions) 2.3 2.5 2.7 3.0 3.1 3.4 3.6 2.7 4.4 4.6 Visitor 4.6% p 1.3 1.3 1.4 1.4 1.5 1.7 1.8 1.9 2.4 2.4 Business or Employee -0.4% q 3.6 TOTAL 3.8 4.1 4.4 4.6 5.2 5.5 4.6 6.7 6.9 2.8% p State Tax Receipts Generated by Travel Spending ($Millions) 4.3 4.5 4.4 4.4 4.4 5.1 5.5 3.1 4.9 4.9 Visitor -0.5% q 1.4 1.5 1.5 1.6 1.5 1.6 1.7 1.7 2.1 2.2 Business or Employee 1.7% p 5.7 TOTAL 6.0 5.9 6.0 5.9 6.7 7.2 4.8 7.1 7.1 0.2% p
The Economic Impact of Travel in California / 2022p / Prepared by Dean Runyan Associates 119
El Dorado County / Detail Trend
Direct Travel Impacts 2013-2022p
Details may not add to totals due to rounding. Percent change calculated on unrounded figures.
*Other Travel includes ground transportation and air travel impacts for travel to other California visitor destinations, travel arrangement services and convention/trade shows services.
Economic impacts are attributed to visitor trips which are defined as trips taken by individuals that stay overnight away from home, or travel more than 50 miles one-way on a non-routine trip, as defined by the California Tourism Marketing Act
2013 2014 2015 2016 2017 2018 2019 2020 2021 2022 2021-2022 Direct Travel Spending ($Million) 725 759 847 899 940 1,010 1,087 777 806 955 Destination Spending 18.5% p 52 47 45 43 48 54 56 27 36 50 Other Travel* 37.0% p 778 TOTAL 806 892 942 987 1,064 1,143 803 843 1,005 19.3% p Visitor Spending by Type of Traveler Accommodation ($Million) 438 467 551 599 629 670 728 501 481 517 Hotel, Motel, STVR 7.6% p 71 71 72 71 76 88 93 43 94 135 Private Home 43.2% p 56 58 59 59 62 65 70 59 74 94 Campground 28.1% p 91 92 90 91 96 101 104 142 127 133 2nd Home 5.2% p 70 72 76 78 77 86 92 31 31 76 Day Travel 142.9% p 725 TOTAL 759 847 899 940 1,010 1,087 777 806 955 18.5% p Visitor Spending by Commodity Purchased ($Million) 181 200 232 256 270 280 299 231 327 368 Accommodations 12.6% p 207 213 245 264 275 298 325 233 192 228 Food Service 18.7% p 35 36 39 40 40 42 44 36 49 62 Food Stores 27.6% p 84 86 84 79 86 101 109 58 60 85 Local Tran. & Gas 40.4% p 132 135 150 158 161 170 180 135 107 122 Arts, Ent. & Rec. 13.2% p 87 89 97 101 107 119 131 83 71 91 Retail Sales 28.1% p 725 TOTAL 759 847 899 940 1,010 1,087 777 806 955 18.5% p
The Economic Impact of Travel in California / 2022p / Prepared by Dean Runyan Associates 120
El Dorado County / Detail Trend
Direct Travel Impacts 2013-2022p
Details may not add to totals due to rounding. Percent change calculated on unrounded figures.
*Other Travel includes ground transportation and air travel impacts for travel to other California visitor destinations, travel arrangement services and convention/trade shows services.
**Retail includes gasoline station employment and earnings. Economic impacts are attributed to visitor trips which are defined as trips taken by individuals that stay overnight away from home, or travel more than 50 miles one-way on a non-routine trip, as defined by the California Tourism Marketing Act
2013 2014 2015 2016 2017 2018 2019 2020 2021 2022 2021-2022 Travel Industry Earnings ($MIllion) 185 204 238 266 313 325 357 291 342 439 Accom. & Food Serv. 28.5% p 73 75 79 85 92 96 103 85 95 111 Arts, Ent. & Rec. 15.9% p 18 19 21 23 25 27 29 32 33 36 Retail** 6.4% p 8 8 9 10 12 18 20 9 5 5 Ground Tran. 4.8% p 4 4 4 4 5 5 5 4 5 6 Other Travel* 23.9% p 287 TOTAL 310 352 388 446 471 514 421 480 596 24.2% p Travel Industry Employment (Jobs) 5,720 6,100 6,820 6,930 7,760 7,680 8,100 6,390 6,970 8,110 Accom. & Food Serv. 16.3% p 3,630 3,620 3,630 3,590 3,830 3,840 4,000 2,950 3,200 3,680 Arts, Ent. & Rec. 15.0% p 640 660 690 740 770 820 840 880 890 890 Retail** 0.9% p 210 210 230 250 250 340 390 430 220 270 Ground Tran. 21.5% p 120 100 110 120 130 130 130 100 110 130 Other Travel* 17.7% p 10,310 TOTAL 10,690 11,470 11,630 12,750 12,820 13,470 10,750 11,380 13,070 14.9% p
The Economic Impact of Travel in California / 2022p / Prepared by Dean Runyan Associates 121
El Dorado County / Detail Trend
Direct Travel Impacts 2013-2022p
Details may not add to totals due to rounding. Percent change calculated on unrounded figures.
Local tax receipts include transient occupancy taxes, sales taxes, and airport passenger facility charges paid by visitors, and the property tax payments and sales tax payments attributable to the travel industry income of employees and businesses. State tax receipts include sales tax payments and motor fuel tax payments of visitors, and the income tax payments and sales tax payments attributable to the travel industry income of employees and businesses.
Economic impacts are attributed to visitor trips which are defined as trips taken by individuals that stay overnight away from home, or travel more than 50 miles one-way on a non-routine trip, as defined by the California Tourism Marketing Act
2013 2014 2015 2016 2017 2018 2019 2020 2021 2022 2021-2022 Tax Receipts Generated by Travel Spending ($Millions) 29 32 36 40 43 46 50 41 51 55 Local Tax Receipts 7.3% p 36 38 40 41 42 46 51 39 38 46 State Tax Receipts 20.2% p 65 TOTAL 69 77 81 85 93 100 80 89 101 12.8% p Local Tax Receipts Generated by Travel Spending ($Millions) 20 21 25 28 29 32 34 24 31 34 Visitor 9.8% p 10 10 12 12 13 15 16 17 20 20 Business or Employee 3.3% p 29 TOTAL 32 36 40 43 46 50 41 51 55 7.3% p State Tax Receipts Generated by Travel Spending ($Millions) 26 27 28 29 29 34 37 24 22 27 Visitor 23.1% p 10 11 12 12 13 13 14 15 17 19 Business or Employee 16.5% p 36 TOTAL 38 40 41 42 46 51 39 38 46 20.2% p
The Economic Impact of Travel in California / 2022p / Prepared by Dean Runyan Associates 122
Fresno County / Detail Trend
Direct Travel Impacts 2013-2022p
Details may not add to totals due to rounding. Percent change calculated on unrounded figures.
*Other Travel includes ground transportation and air travel impacts for travel to other California visitor destinations, travel arrangement services and convention/trade shows services.
Economic impacts are attributed to visitor trips which are defined as trips taken by individuals that stay overnight away from home, or travel more than 50 miles one-way on a non-routine trip, as defined by the California Tourism Marketing Act
2013 2014 2015 2016 2017 2018 2019 2020 2021 2022 2021-2022 Direct Travel Spending ($Million) 1,051 1,082 1,094 1,127 1,164 1,286 1,346 810 1,017 1,302 Destination Spending 28.0% p 259 267 251 238 262 300 315 125 198 295 Other Travel* 48.9% p 1,310 TOTAL 1,348 1,345 1,364 1,426 1,587 1,661 935 1,215 1,597 31.4% p Visitor Spending by Type of Traveler Accommodation ($Million) 395 413 437 468 466 526 555 492 474 516 Hotel, Motel, STVR 8.9% p 255 259 250 247 268 301 320 102 284 351 Private Home 23.4% p 29 31 31 32 33 35 38 32 39 51 Campground 28.1% p 75 77 75 76 80 85 87 97 88 104 2nd Home 18.4% p 298 302 301 303 316 339 346 87 132 281 Day Travel 113.4% p 1,051 TOTAL 1,082 1,094 1,127 1,164 1,286 1,346 810 1,017 1,302 28.0% p Visitor Spending by Commodity Purchased ($Million) 156 167 181 196 199 220 229 194 203 220 Accommodations 8.5% p 262 267 280 298 306 333 347 219 274 345 Food Service 25.8% p 48 50 51 52 52 54 55 35 51 66 Food Stores 29.3% p 267 274 257 245 259 298 307 146 200 279 Local Tran. & Gas 39.5% p 130 132 136 141 142 151 153 94 111 137 Arts, Ent. & Rec. 23.9% p 146 148 143 147 159 180 194 100 137 186 Retail Sales 35.3% p 41 44 47 48 48 51 61 23 40 68 Visitor Air Tran. 69.8% p 1,051 TOTAL 1,082 1,094 1,127 1,164 1,286 1,346 810 1,017 1,302 28.0% p
The Economic Impact of Travel in California / 2022p / Prepared by Dean Runyan Associates 123
Fresno County / Detail Trend
Direct Travel Impacts 2013-2022p
Details may not add to totals due to rounding. Percent change calculated on unrounded figures.
*Other Travel includes ground transportation and air travel impacts for travel to other California visitor destinations, travel arrangement services and convention/trade shows services.
**Retail includes gasoline station employment and earnings.
Economic impacts are attributed to visitor trips which are defined as trips taken by individuals that stay overnight away from home, or travel more than 50 miles one-way on a non-routine trip, as defined by the California Tourism Marketing Act
2013 2014 2015 2016 2017 2018 2019 2020 2021 2022 2021-2022 Travel Industry Earnings ($MIllion) 147 154 166 186 204 227 243 206 247 284 Accom. & Food Serv. 15.0% p 59 64 66 72 76 84 86 57 84 117 Arts, Ent. & Rec. 39.5% p 29 30 31 33 34 37 38 40 45 51 Retail** 12.5% p 24 25 27 30 33 44 48 32 25 28 Ground Tran. 10.6% p 18 19 22 14 17 17 19 19 14 15 Visitor Air Tran. 6.3% p 42 44 47 38 45 48 51 49 44 48 Other Travel* 10.2% p 319 TOTAL 336 359 373 409 457 485 401 458 542 18.2% p Travel Industry Employment (Jobs) 6,500 6,680 6,790 6,990 7,310 7,850 8,050 6,630 7,260 7,980 Accom. & Food Serv. 10.0% p 3,160 3,370 3,410 3,500 3,590 3,750 3,800 2,250 3,290 4,470 Arts, Ent. & Rec. 35.8% p 1,060 1,090 1,060 1,090 1,110 1,190 1,190 1,150 1,210 1,280 Retail** 5.9% p 600 620 640 670 670 840 910 900 750 900 Ground Tran. 19.8% p 310 320 360 230 240 240 260 230 190 200 Visitor Air Tran. 0.1% p 940 980 1,020 910 980 1,000 1,020 950 890 930 Other Travel* 3.8% p 12,580 TOTAL 13,060 13,280 13,390 13,910 14,860 15,240 12,110 13,590 15,740 15.9% p
The Economic Impact of Travel in California / 2022p / Prepared by Dean Runyan Associates 124
Fresno County / Detail Trend
Direct Travel Impacts 2013-2022p
Details may not add to totals due to rounding. Percent change calculated on unrounded figures.
Local tax receipts include transient occupancy taxes, sales taxes, and airport passenger facility charges paid by visitors, and the property tax payments and sales tax payments attributable to the travel industry income of employees and businesses. State tax receipts include sales tax payments and motor fuel tax payments of visitors, and the income tax payments and sales tax payments attributable to the travel industry income of employees and businesses.
Economic impacts are attributed to visitor trips which are defined as trips taken by individuals that stay overnight away from home, or travel more than 50 miles one-way on a non-routine trip, as defined by the California Tourism Marketing Act
2013 2014 2015 2016 2017 2018 2019 2020 2021 2022 2021-2022 Tax Receipts Generated by Travel Spending ($Millions) 32 33 35 37 38 44 47 40 46 50 Local Tax Receipts 8.8% p 72 75 72 69 71 85 90 53 66 81 State Tax Receipts 23.3% p 104 TOTAL 108 107 107 110 129 137 93 111 130 17.3% p Local Tax Receipts Generated by Travel Spending ($Millions) 21 22 23 25 26 30 32 23 27 30 Visitor 13.4% p 11 11 12 12 13 14 15 17 19 19 Business or Employee 2.4% p 32 TOTAL 33 35 37 38 44 47 40 46 50 8.8% p State Tax Receipts Generated by Travel Spending ($Millions) 60 62 59 57 59 71 75 38 49 63 Visitor 27.9% p 12 12 13 13 13 13 14 14 17 18 Business or Employee 9.5% p 72 TOTAL 75 72 69 71 85 90 53 66 81 23.3% p
The Economic Impact of Travel in California / 2022p / Prepared by Dean Runyan Associates 125
Glenn County / Detail Trend
Details may not add to totals due to rounding. Percent change calculated on unrounded figures.
*Other Travel includes ground transportation and air travel impacts for travel to other California visitor destinations, travel arrangement services and convention/trade shows services.
Economic impacts are attributed to visitor trips which are defined as trips taken by individuals that stay overnight away from home, or travel more than 50 miles one-way on a non-routine trip, as defined by the California Tourism Marketing Act
2013 2014 2015 2016 2017 2018 2019 2020 2021 2022 2021-2022 Direct Travel Spending ($Million) 45.2 46.9 36.8 29.1 46.5 55.4 58.5 27.8 49.0 51.0 Destination Spending 4.1% p 4.9 4.9 4.3 3.8 4.2 4.9 5.1 1.8 2.9 4.2 Other Travel* 42.3% p 50.1 TOTAL 51.8 41.1 32.9 50.7 60.4 63.6 29.6 51.9 55.2 6.3% p Visitor Spending by Type of Traveler Accommodation ($Million) 12.9 13.7 7.8 2.0 17.0 18.5 19.6 13.4 18.1 14.2 Hotel, Motel, STVR -21.6% q 14.8 15.2 13.7 13.7 15.3 16.6 17.7 6.0 18.3 20.1 Private Home 10.1% p 1.2 1.2 1.2 1.2 1.3 1.3 1.4 1.2 1.5 1.9 Campground 28.1% p 1.0 1.0 1.1 1.1 1.1 1.2 1.3 2.3 2.1 1.4 2nd Home -31.4% q 15.3 15.7 13.1 11.1 11.7 17.7 18.4 4.9 9.0 13.3 Day Travel 47.6% p 45.2 TOTAL 46.9 36.8 29.1 46.5 55.4 58.5 27.8 49.0 51.0 4.1% p Visitor Spending by Commodity Purchased ($Million) 5.4 5.9 3.8 1.5 7.5 8.2 8.7 7.4 8.2 8.4 Accommodations 2.0% p 15.1 15.6 13.1 11.2 16.3 19.1 20.0 8.9 17.6 17.6 Food Service -0.1% q 2.9 3.0 2.8 2.6 2.9 3.2 3.2 1.4 3.2 3.7 Food Stores 13.8% p 6.6 6.8 5.2 4.1 5.6 7.2 7.6 2.3 4.8 5.7 Local Tran. & Gas 18.5% p 8.1 8.3 6.9 5.7 7.9 9.4 9.6 4.0 7.5 7.5 Arts, Ent. & Rec. 0.1% p 7.0 7.2 5.0 4.0 6.3 8.4 9.3 3.7 7.6 8.2 Retail Sales 7.0% p 45.2 TOTAL 46.9 36.8 29.1 46.5 55.4 58.5 27.8 49.0 51.0 4.1% p
Direct Travel Impacts 2013-2022p
The Economic Impact of Travel in California / 2022p / Prepared
Runyan Associates 126
by Dean
Glenn County / Detail Trend
Direct Travel Impacts 2013-2022p
Details may not add to totals due to rounding. Percent change calculated on unrounded figures.
*Other Travel includes ground transportation and air travel impacts for travel to other California visitor destinations, travel arrangement services and convention/trade shows services.
**Retail includes gasoline station employment and earnings.
Economic impacts are attributed to visitor trips which are defined as trips taken by individuals that stay overnight away from home, or travel more than 50 miles one-way on a non-routine trip, as defined by the California Tourism Marketing Act
2013 2014 2015 2016 2017 2018 2019 2020 2021 2022 2021-2022 Travel Industry Earnings ($MIllion) 10.1 9.7 8.7 7.2 11.3 12.1 13.0 11.2 14.6 16.0 Accom. & Food Serv. 9.6% p 5.6 6.2 5.6 4.7 4.7 4.9 5.3 4.3 4.7 5.7 Arts, Ent. & Rec. 20.8% p 1.5 1.6 1.3 1.1 1.4 1.4 1.5 1.6 2.2 2.3 Retail** 6.0% p 0.5 0.5 0.4 0.4 0.6 1.0 1.1 0.3 0.4 0.3 Ground Tran. -13.9% q 0.1 0.2 0.2 0.2 0.1 0.2 0.2 0.2 0.4 0.5 Other Travel* 13.6% p 17.8 TOTAL 18.2 16.2 13.6 18.2 19.6 21.2 17.7 22.4 24.9 11.3% p Travel Industry Employment (Jobs) 400 390 320 250 390 400 390 330 390 400 Accom. & Food Serv. 2.9% p 310 370 330 260 260 280 300 230 270 340 Arts, Ent. & Rec. 22.5% p 60 60 50 40 50 50 50 50 70 70 Retail** 3.3% p 10 10 10 <10 10 20 20 20 20 20 Ground Tran. -0.2% q <10 <10 <10 <10 <10 <10 <10 <10 10 20 Other Travel* 18.1% p 790 TOTAL 830 710 580 720 760 770 630 760 840 10.1% p
The Economic Impact of Travel in California / 2022p / Prepared by Dean Runyan Associates 127
Glenn County / Detail Trend
Direct Travel Impacts 2013-2022p
Details may not add to totals due to rounding. Percent change calculated on unrounded figures.
Local tax receipts include transient occupancy taxes, sales taxes, and airport passenger facility charges paid by visitors, and the property tax payments and sales tax payments attributable to the travel industry income of employees and businesses. State tax receipts include sales tax payments and motor fuel tax payments of visitors, and the income tax payments and sales tax payments attributable to the travel industry income of employees and businesses.
Economic impacts are attributed to visitor trips which are defined as trips taken by individuals that stay overnight away from home, or travel more than 50 miles one-way on a non-routine trip, as defined by the California Tourism Marketing Act
2013 2014 2015 2016 2017 2018 2019 2020 2021 2022 2021-2022 Tax Receipts Generated by Travel Spending ($Millions) 1.5 1.6 1.1 0.6 1.5 1.7 1.8 1.5 2.0 2.0 Local Tax Receipts 0.7% p 2.9 3.0 2.5 2.0 2.6 3.2 3.4 1.8 2.9 3.0 State Tax Receipts 4.8% p 4.4 TOTAL 4.6 3.6 2.7 4.1 4.9 5.2 3.3 4.9 5.0 3.1% p Local Tax Receipts Generated by Travel Spending ($Millions) 0.9 1.0 0.6 0.2 0.9 1.1 1.2 0.8 1.1 1.1 Visitor 4.3% p 0.6 0.6 0.5 0.4 0.5 0.6 0.6 0.7 0.9 0.9 Business or Employee -3.6% q 1.5 TOTAL 1.6 1.1 0.6 1.5 1.7 1.8 1.5 2.0 2.0 0.7% p State Tax Receipts Generated by Travel Spending ($Millions) 2.3 2.4 1.9 1.6 2.1 2.6 2.8 1.2 2.1 2.2 Visitor 7.0% p 0.6 0.7 0.6 0.4 0.6 0.6 0.6 0.6 0.8 0.8 Business or Employee -0.7% q 2.9 TOTAL 3.0 2.5 2.0 2.6 3.2 3.4 1.8 2.9 3.0 4.8% p
The Economic Impact of Travel in California / 2022p / Prepared
Runyan Associates 128
by Dean
Humboldt County / Detail Trend
Details may not add to totals due to rounding. Percent change calculated on unrounded figures.
*Other Travel includes ground transportation and air travel impacts for travel to other California visitor destinations, travel arrangement services and convention/trade shows services.
Economic impacts are attributed to visitor trips which are defined as trips taken by individuals that stay overnight away from home, or travel more than 50 miles one-way on a non-routine trip, as defined by the California Tourism Marketing Act
Direct Travel Impacts 2013-2022p 2013 2014 2015 2016 2017 2018 2019 2020 2021 2022 2021-2022 Direct Travel Spending ($Million) 364.8 381.1 392.9 399.9 421.3 452.9 446.5 240.9 477.0 468.2 Destination Spending -1.8% q 31.7 31.1 29.6 28.7 30.8 33.3 37.3 12.9 23.0 33.9 Other Travel* 47.4% p 396.6 TOTAL 412.2 422.5 428.6 452.1 486.2 483.7 253.8 500.0 502.1 0.4% p Visitor Spending by Type of Traveler Accommodation ($Million) 175.3 188.2 201.7 207.2 217.8 233.6 219.3 118.0 273.1 213.9 Hotel, Motel, STVR -21.7% q 72.4 72.3 68.1 68.6 74.0 81.4 84.4 27.8 84.0 93.7 Private Home 11.5% p 53.8 55.8 56.9 57.5 60.4 63.3 68.3 57.1 71.2 91.3 Campground 28.2% p 11.5 11.6 12.1 12.3 13.0 14.2 14.5 22.1 19.8 20.9 2nd Home 5.7% p 51.9 53.2 54.1 54.2 56.1 60.4 60.0 15.8 28.8 48.3 Day Travel 67.9% p 364.8 TOTAL 381.1 392.9 399.9 421.3 452.9 446.5 240.9 477.0 468.2 -1.8% q Visitor Spending by Commodity Purchased ($Million) 74.6 81.8 89.8 94.3 99.6 103.8 96.9 72.0 138.8 133.9 Accommodations -3.5% q 103.7 106.9 113.3 117.4 122.9 132.4 131.2 64.4 133.8 122.4 Food Service -8.5% q 26.5 27.4 28.5 28.5 28.9 29.6 30.3 19.9 34.4 41.3 Food Stores 20.0% p 60.0 62.3 58.8 54.8 59.5 67.9 67.7 29.3 59.2 62.3 Local Tran. & Gas 5.2% p 52.8 54.4 56.3 57.3 58.5 61.6 59.6 28.5 55.1 50.4 Arts, Ent. & Rec. -8.5% q 41.8 43.0 40.4 40.6 44.8 50.6 52.5 23.7 49.3 48.3 Retail Sales -2.0% q 5.5 5.2 5.7 7.0 7.1 7.0 8.3 3.1 6.3 9.6 Visitor Air Tran. 51.1% p 364.8 TOTAL 381.1 392.9 399.9 421.3 452.9 446.5 240.9 477.0 468.2 -1.8% q
The Economic Impact of Travel in California / 2022p / Prepared by Dean Runyan Associates 129
Humboldt County / Detail Trend
Details may not add to totals due to rounding. Percent change calculated on unrounded figures.
*Other Travel includes ground transportation and air travel impacts for travel to other California visitor destinations, travel arrangement services and convention/trade shows services.
**Retail includes gasoline station employment and earnings.
Economic impacts are attributed to visitor trips which are defined as trips taken by individuals that stay overnight away from home, or travel more than 50 miles one-way on a non-routine trip, as defined by the California Tourism Marketing Act
Direct Travel Impacts 2013-2022p 2013 2014 2015 2016 2017 2018 2019 2020 2021 2022 2021-2022 Travel Industry Earnings ($MIllion) 81.9 86.9 94.6 100.7 108.3 116.9 116.5 95.3 119.0 136.7 Accom. & Food Serv. 14.9% p 24.7 21.7 21.6 22.2 23.9 26.0 26.4 18.6 20.0 28.9 Arts, Ent. & Rec. 44.1% p 9.9 10.4 10.5 10.8 12.2 13.4 13.4 14.2 13.9 15.3 Retail** 10.3% p 5.6 6.1 6.6 7.2 8.1 11.0 11.5 4.8 6.4 4.7 Ground Tran. -25.5% q 0.4 0.5 0.5 0.6 6.4 7.0 8.9 9.8 29.2 30.2 Visitor Air Tran. 3.7% p 1.6 1.7 1.8 2.2 9.6 9.8 13.6 12.0 38.5 42.1 Other Travel* 9.3% p 124.1 TOTAL 127.2 135.8 143.8 168.5 184.1 190.3 154.6 227.0 258.0 13.7% p Travel Industry Employment (Jobs) 3,140 3,180 3,280 3,300 3,360 3,520 3,340 2,630 2,990 3,320 Accom. & Food Serv. 11.2% p 1,630 1,530 1,670 1,600 1,600 1,770 1,760 1,160 1,130 1,540 Arts, Ent. & Rec. 35.7% p 340 350 340 330 350 370 370 350 350 370 Retail** 5.6% p 150 150 160 160 170 210 220 180 220 190 Ground Tran. -12.0% q 20 20 20 20 70 70 90 90 210 210 Visitor Air Tran. -2.3% q 70 80 80 90 140 140 180 150 320 330 Other Travel* 5.1% p 5,350 TOTAL 5,310 5,540 5,500 5,680 6,070 5,970 4,560 5,220 5,960 14.3% p
The Economic Impact of Travel in California / 2022p / Prepared by Dean Runyan Associates 130
Humboldt County / Detail Trend
Direct Travel Impacts 2013-2022p
Details may not add to totals due to rounding. Percent change calculated on unrounded figures.
Local tax receipts include transient occupancy taxes, sales taxes, and airport passenger facility charges paid by visitors, and the property tax payments and sales tax payments attributable to the travel industry income of employees and businesses. State tax receipts include sales tax payments and motor fuel tax payments of visitors, and the income tax payments and sales tax payments attributable to the travel industry income of employees and businesses.
Economic impacts are attributed to visitor trips which are defined as trips taken by individuals that stay overnight away from home, or travel more than 50 miles one-way on a non-routine trip, as defined by the California Tourism Marketing Act
2013 2014 2015 2016 2017 2018 2019 2020 2021 2022 2021-2022 Tax Receipts Generated by Travel Spending ($Millions) 12.6 13.4 14.6 15.4 17.5 19.0 18.5 14.6 25.9 25.0 Local Tax Receipts -3.5% q 19.8 20.5 20.3 19.8 20.4 22.9 23.5 14.4 24.1 24.1 State Tax Receipts -0.2% q 32.4 TOTAL 33.9 34.9 35.2 37.9 41.9 42.0 29.0 50.0 49.1 -1.9% q Local Tax Receipts Generated by Travel Spending ($Millions) 8.6 9.4 10.4 11.1 12.4 13.3 12.7 8.3 16.5 15.8 Visitor -4.5% q 4.0 4.0 4.2 4.3 5.1 5.7 5.9 6.3 9.3 9.2 Business or Employee -1.6% q 12.6 TOTAL 13.4 14.6 15.4 17.5 19.0 18.5 14.6 25.9 25.0 -3.5% q State Tax Receipts Generated by Travel Spending ($Millions) 15.3 15.8 15.4 14.9 15.4 17.9 18.3 9.0 16.1 16.0 Visitor -0.7% q 4.5 4.7 4.9 4.9 5.0 5.1 5.2 5.3 8.0 8.1 Business or Employee 0.8% p 19.8 TOTAL 20.5 20.3 19.8 20.4 22.9 23.5 14.4 24.1 24.1 -0.2% q
The Economic Impact of Travel in California / 2022p / Prepared by Dean Runyan Associates 131
Imperial County / Detail Trend
Details may not add to totals due to rounding. Percent change calculated on unrounded figures.
*Other Travel includes ground transportation and air travel impacts for travel to other California visitor destinations, travel arrangement services and convention/trade shows services.
Economic impacts are attributed to visitor trips which are defined as trips taken by individuals that stay overnight away from home, or travel more than 50 miles one-way on a non-routine trip, as defined by the California Tourism Marketing Act
Travel Impacts 2013-2022p 2013 2014 2015 2016 2017 2018 2019 2020 2021 2022 2021-2022 Direct Travel Spending ($Million) 316.4 329.9 326.1 328.1 350.6 378.3 401.4 280.7 399.6 481.0 Destination Spending 20.4% p 31.9 32.4 28.5 25.2 29.0 33.3 34.5 12.1 19.7 28.2 Other Travel* 43.2% p 348.3 TOTAL 362.3 354.6 353.3 379.6 411.6 435.9 292.7 419.3 509.2 21.5% p Visitor Spending by Type of Traveler Accommodation ($Million) 73.7 73.9 73.0 72.6 78.5 87.2 92.1 79.9 105.4 115.0 Hotel, Motel, STVR 9.2% p 82.8 83.3 77.7 78.1 85.8 94.1 99.3 38.7 100.7 110.7 Private Home 10.0% p 107.8 118.8 120.9 122.4 128.4 134.7 145.3 121.4 151.4 194.0 Campground 28.1% p 16.4 16.7 17.4 17.7 18.8 20.6 21.1 28.4 25.5 23.8 2nd Home -6.5% q 35.6 37.1 37.1 37.4 39.1 41.7 43.7 12.3 16.7 37.5 Day Travel 124.1% p 316.4 TOTAL 329.9 326.1 328.1 350.6 378.3 401.4 280.7 399.6 481.0 20.4% p Visitor Spending by Commodity Purchased ($Million) 54.1 57.2 58.7 59.9 62.0 65.8 70.3 64.2 77.6 91.3 Accommodations 17.7% p 87.1 89.3 92.0 95.9 101.8 108.5 114.0 77.8 117.5 135.1 Food Service 15.0% p 39.1 42.1 43.7 44.1 44.9 45.7 48.2 37.1 52.0 65.8 Food Stores 26.4% p 58.3 61.3 55.7 51.0 56.9 65.5 69.4 38.2 57.7 78.8 Local Tran. & Gas 36.6% p 44.6 45.9 46.3 47.3 49.1 51.0 52.4 34.8 49.4 56.2 Arts, Ent. & Rec. 13.9% p 33.1 34.0 29.6 30.0 35.3 41.2 46.5 28.3 44.9 52.8 Retail Sales 17.7% p 0.2 0.0 0.1 0.0 0.6 0.5 0.6 0.3 0.5 1.0 Visitor Air Tran. 80.2% p 316.4 TOTAL 329.9 326.1 328.1 350.6 378.3 401.4 280.7 399.6 481.0 20.4% p
Direct
The Economic Impact of Travel in California / 2022p / Prepared by Dean Runyan Associates 132
Imperial County / Detail Trend
Details may not add to totals due to rounding. Percent change calculated on unrounded figures.
*Other Travel includes ground transportation and air travel impacts for travel to other California visitor destinations, travel arrangement services and convention/trade shows services.
**Retail includes gasoline station employment and earnings.
Economic impacts are attributed to visitor trips which are defined as trips taken by individuals that stay overnight away from home, or travel more than 50 miles one-way on a non-routine trip, as defined by the California Tourism Marketing Act
2013 2014 2015 2016 2017 2018 2019 2020 2021 2022 2021-2022 Travel Industry Earnings ($MIllion) 52.3 54.8 56.4 61.3 63.8 66.0 70.7 59.7 76.0 84.7 Accom. & Food Serv. 11.4% p 21.1 26.1 25.3 26.4 21.8 18.7 20.2 11.6 13.6 18.0 Arts, Ent. & Rec. 32.9% p 10.3 11.0 10.9 11.3 12.2 13.2 13.9 14.6 15.7 17.3 Retail** 10.4% p 4.3 4.6 4.8 5.3 6.3 9.0 10.0 4.8 4.2 4.3 Ground Tran. 3.4% p 0.1 0.0 0.3 0.0 0.0 0.0 1.3 1.0 2.1 1.9 Visitor Air Tran. -8.3% q 1.2 1.5 1.3 1.5 1.6 1.7 2.7 2.6 2.7 3.3 Other Travel* 23.1% p 89.3 TOTAL 98.0 99.0 105.7 105.6 108.7 118.7 94.2 114.3 129.7 13.5% p Travel Industry Employment (Jobs) 2,420 2,510 2,390 2,430 2,480 2,380 2,440 1,970 2,300 2,440 Accom. & Food Serv. 6.1% p 1,320 1,530 1,530 1,470 1,330 1,030 1,050 580 650 850 Arts, Ent. & Rec. 30.6% p 420 430 420 420 440 460 460 450 470 480 Retail** 3.5% p 120 120 120 130 130 180 200 220 200 240 Ground Tran. 19.9% p <10 0 <10 0 0 0 10 <10 20 10 Visitor Air Tran. -13.6% q 60 60 60 70 70 70 80 70 70 80 Other Travel* 10.0% p 4,340 TOTAL 4,650 4,520 4,520 4,450 4,120 4,250 3,300 3,700 4,100 10.8% p
Direct Travel Impacts 2013-2022p
The Economic Impact of Travel in California / 2022p / Prepared by Dean Runyan Associates 133
Imperial County / Detail Trend
Direct Travel Impacts 2013-2022p
Details may not add to totals due to rounding. Percent change calculated on unrounded figures.
Local tax receipts include transient occupancy taxes, sales taxes, and airport passenger facility charges paid by visitors, and the property tax payments and sales tax payments attributable to the travel industry income of employees and businesses. State tax receipts include sales tax payments and motor fuel tax payments of visitors, and the income tax payments and sales tax payments attributable to the travel industry income of employees and businesses.
Economic impacts are attributed to visitor trips which are defined as trips taken by individuals that stay overnight away from home, or travel more than 50 miles one-way on a non-routine trip, as defined by the California Tourism Marketing Act
2013 2014 2015 2016 2017 2018 2019 2020 2021 2022 2021-2022 Tax Receipts Generated by Travel Spending ($Millions) 9.1 9.7 9.8 10.0 10.2 11.2 12.1 10.7 13.8 15.4 Local Tax Receipts 12.1% p 18.4 19.4 18.4 17.7 18.3 21.1 22.8 15.7 21.0 24.4 State Tax Receipts 16.0% p 27.5 TOTAL 29.0 28.1 27.7 28.5 32.3 34.8 26.5 34.7 39.8 14.5% p Local Tax Receipts Generated by Travel Spending ($Millions) 6.1 6.4 6.5 6.7 7.0 7.9 8.4 6.9 9.1 10.8 Visitor 19.3% p 3.0 3.2 3.2 3.3 3.2 3.3 3.6 3.8 4.7 4.6 Business or Employee -1.8% q 9.1 TOTAL 9.7 9.8 10.0 10.2 11.2 12.1 10.7 13.8 15.4 12.1% p State Tax Receipts Generated by Travel Spending ($Millions) 15.1 15.8 14.8 14.2 15.0 17.9 19.3 12.1 16.5 19.6 Visitor 19.0% p 3.2 3.6 3.5 3.5 3.3 3.2 3.5 3.6 4.5 4.7 Business or Employee 5.2% p 18.4 TOTAL 19.4 18.4 17.7 18.3 21.1 22.8 15.7 21.0 24.4 16.0% p
The Economic Impact of Travel in California / 2022p / Prepared by Dean Runyan Associates 134
Inyo County / Detail Trend
Details may not add to totals due to rounding. Percent change calculated on unrounded figures.
*Other Travel includes ground transportation and air travel impacts for travel to other California visitor destinations, travel arrangement services and convention/trade shows services.
Economic impacts are attributed to visitor trips which are defined as trips taken by individuals that stay overnight away from home, or travel more than 50 miles one-way on a non-routine trip, as defined by the California Tourism Marketing Act
Impacts
2013 2014 2015 2016 2017 2018 2019 2020 2021 2022 2021-2022 Direct Travel Spending ($Million) 220.1 227.9 226.2 236.3 236.9 244.9 263.5 153.5 232.1 247.3 Destination Spending 6.5% p 3.6 3.7 3.3 3.0 3.3 3.8 3.9 1.5 2.3 3.3 Other Travel* 39.9% p 223.8 TOTAL 231.6 229.5 239.2 240.2 248.7 267.4 155.0 234.4 250.5 6.9% p Visitor Spending by Type of Traveler Accommodation ($Million) 133.7 139.0 139.0 147.6 143.8 149.0 160.6 100.7 158.2 141.9 Hotel, Motel, STVR -10.3% q 9.4 9.3 8.5 8.6 9.2 9.9 10.6 3.5 10.7 11.8 Private Home 10.4% p 28.5 29.9 29.5 29.9 31.3 32.9 35.5 29.7 37.1 47.6 Campground 28.2% p 3.4 3.5 3.6 3.6 3.8 4.1 4.2 5.2 4.7 5.1 2nd Home 9.6% p 45.1 46.3 45.5 46.6 48.8 49.0 52.5 14.3 21.4 40.9 Day Travel 90.9% p 220.1 TOTAL 227.9 226.2 236.3 236.9 244.9 263.5 153.5 232.1 247.3 6.5% p Visitor Spending by Commodity Purchased ($Million) 54.2 57.9 59.2 64.3 64.2 66.2 71.7 54.8 70.9 79.3 Accommodations 11.9% p 64.1 65.5 66.5 70.7 70.6 72.9 78.9 41.5 69.2 66.7 Food Service -3.7% q 11.9 12.5 12.6 12.8 12.8 12.9 13.8 9.8 14.6 17.5 Food Stores 20.0% p 27.8 28.6 25.6 24.0 25.7 28.8 31.0 14.6 24.1 29.5 Local Tran. & Gas 22.5% p 33.8 34.6 34.3 35.8 35.1 35.3 37.3 18.4 29.2 28.8 Arts, Ent. & Rec. -1.4% q 28.3 28.8 27.9 28.6 28.4 28.9 30.8 14.4 24.0 25.4 Retail Sales 6.0% p 220.1 TOTAL 227.9 226.2 236.3 236.9 244.9 263.5 153.5 232.1 247.3 6.5% p
Direct Travel
2013-2022p
The Economic Impact of Travel in California / 2022p / Prepared by Dean Runyan Associates 135
Inyo County / Detail Trend
Direct Travel Impacts 2013-2022p
Details may not add to totals due to rounding. Percent change calculated on unrounded figures.
*Other Travel includes ground transportation and air travel impacts for travel to other California visitor destinations, travel arrangement services and convention/trade shows services.
**Retail includes gasoline station employment and earnings.
Economic impacts are attributed to visitor trips which are defined as trips taken by individuals that stay overnight away from home, or travel more than 50 miles one-way on a non-routine trip, as defined by the California Tourism Marketing Act
2013 2014 2015 2016 2017 2018 2019 2020 2021 2022 2021-2022 Travel Industry Earnings ($MIllion) 34.2 32.5 35.2 37.4 41.6 46.1 51.0 38.9 43.0 52.1 Accom. & Food Serv. 21.2% p 9.0 9.4 9.4 10.5 10.5 12.0 13.5 10.4 13.4 17.2 Arts, Ent. & Rec. 27.8% p 5.7 5.9 6.0 6.3 6.8 6.9 7.1 7.3 7.6 7.8 Retail** 3.3% p 2.5 2.7 2.7 3.1 3.4 4.8 5.4 2.0 2.0 1.7 Ground Tran. -12.1% q 0.3 0.3 0.3 0.3 0.4 0.4 0.4 0.3 0.3 0.4 Other Travel* 14.0% p 51.7 TOTAL 50.7 53.5 57.6 62.8 70.3 77.3 59.0 66.3 79.2 19.5% p Travel Industry Employment (Jobs) 1,520 1,370 1,420 1,440 1,500 1,540 1,750 1,360 1,390 1,550 Accom. & Food Serv. 11.3% p 580 600 550 560 590 650 710 530 620 800 Arts, Ent. & Rec. 28.3% p 200 210 200 200 210 220 210 210 200 200 Retail** -0.2% q 70 70 70 70 70 90 110 100 90 90 Ground Tran. 1.9% p <10 10 10 10 10 10 10 10 10 10 Other Travel* 3.5% p 2,390 TOTAL 2,260 2,260 2,290 2,390 2,510 2,790 2,210 2,320 2,650 14.4% p
The Economic Impact of Travel in California / 2022p / Prepared by Dean Runyan Associates 136
Inyo County / Detail Trend
Direct Travel Impacts 2013-2022p
Details may not add to totals due to rounding. Percent change calculated on unrounded figures.
Local tax receipts include transient occupancy taxes, sales taxes, and airport passenger facility charges paid by visitors, and the property tax payments and sales tax payments attributable to the travel industry income of employees and businesses. State tax receipts include sales tax payments and motor fuel tax payments of visitors, and the income tax payments and sales tax payments attributable to the travel industry income of employees and businesses.
Economic impacts are attributed to visitor trips which are defined as trips taken by individuals that stay overnight away from home, or travel more than 50 miles one-way on a non-routine trip, as defined by the California Tourism Marketing Act
2013 2014 2015 2016 2017 2018 2019 2020 2021 2022 2021-2022 Tax Receipts Generated by Travel Spending ($Millions) 8.4 8.7 8.9 9.6 9.7 10.3 11.2 8.8 11.3 12.3 Local Tax Receipts 8.8% p 8.1 8.3 8.0 8.0 7.9 8.7 9.4 6.1 8.5 8.9 State Tax Receipts 5.4% p 16.4 TOTAL 17.0 16.9 17.6 17.6 19.0 20.6 14.9 19.8 21.2 7.3% p Local Tax Receipts Generated by Travel Spending ($Millions) 6.6 7.0 7.2 7.8 7.7 8.1 8.8 6.4 8.6 9.5 Visitor 10.5% p 1.8 1.7 1.8 1.8 1.9 2.2 2.4 2.4 2.7 2.8 Business or Employee 3.4% p 8.4 TOTAL 8.7 8.9 9.6 9.7 10.3 11.2 8.8 11.3 12.3 8.8% p State Tax Receipts Generated by Travel Spending ($Millions) 6.1 6.3 6.0 6.0 5.9 6.5 7.1 3.9 5.8 6.1 Visitor 4.7% p 1.9 1.9 2.0 2.0 2.0 2.1 2.3 2.3 2.7 2.9 Business or Employee 6.7% p 8.1 TOTAL 8.3 8.0 8.0 7.9 8.7 9.4 6.1 8.5 8.9 5.4% p
The Economic Impact of Travel in California / 2022p / Prepared by Dean Runyan Associates 137
Kern County / Detail Trend
Direct Travel Impacts 2013-2022p
Details may not add to totals due to rounding. Percent change calculated on unrounded figures.
*Other Travel includes ground transportation and air travel impacts for travel to other California visitor destinations, travel arrangement services and convention/trade shows services.
Economic impacts are attributed to visitor trips which are defined as trips taken by individuals that stay overnight away from home, or travel more than 50 miles one-way on a non-routine trip, as defined by the California Tourism Marketing Act
2013 2014 2015 2016 2017 2018 2019 2020 2021 2022 2021-2022 Direct Travel Spending ($Million) 1,281 1,329 1,342 1,252 1,358 1,501 1,580 1,034 1,431 1,725 Destination Spending 20.6% p 180 180 162 144 160 185 195 72 114 166 Other Travel* 44.9% p 1,461 TOTAL 1,510 1,504 1,396 1,518 1,686 1,775 1,106 1,545 1,890 22.4% p Visitor Spending by Type of Traveler Accommodation ($Million) 421 443 472 419 457 513 550 496 566 638 Hotel, Motel, STVR 12.7% p 321 325 311 292 330 372 393 82 358 433 Private Home 20.8% p 68 79 78 79 83 87 94 79 99 126 Campground 28.1% p 136 139 135 138 144 154 157 274 247 195 2nd Home -21.0% q 337 343 345 324 343 375 385 103 161 333 Day Travel 106.5% p 1,281 TOTAL 1,329 1,342 1,252 1,358 1,501 1,580 1,034 1,431 1,725 20.6% p Visitor Spending by Commodity Purchased ($Million) 214 232 248 235 249 270 287 298 356 355 Accommodations -0.4% q 337 345 365 353 380 414 435 285 395 485 Food Service 22.7% p 71 75 78 75 77 80 82 60 88 107 Food Stores 21.1% p 296 306 283 245 275 319 331 131 225 318 Local Tran. & Gas 41.3% p 168 172 178 169 177 189 193 128 164 195 Arts, Ent. & Rec. 18.5% p 183 186 179 167 190 220 240 127 194 253 Retail Sales 30.4% p 13 12 12 9 9 10 12 5 8 13 Visitor Air Tran. 63.7% p 1,281 TOTAL 1,329 1,342 1,252 1,358 1,501 1,580 1,034 1,431 1,725 20.6% p
The Economic Impact of Travel in California / 2022p / Prepared by Dean Runyan Associates 138
Kern County / Detail Trend
Direct Travel Impacts 2013-2022p
Details may not add to totals due to rounding. Percent change calculated on unrounded figures.
*Other Travel includes ground transportation and air travel impacts for travel to other California visitor destinations, travel arrangement services and convention/trade shows services.
**Retail includes gasoline station employment and earnings.
Economic impacts are attributed to visitor trips which are defined as trips taken by individuals that stay overnight away from home, or travel more than 50 miles one-way on a non-routine trip, as defined by the California Tourism Marketing Act
2013 2014 2015 2016 2017 2018 2019 2020 2021 2022 2021-2022 Travel Industry Earnings ($MIllion) 218 228 262 265 306 338 360 322 395 451 Accom. & Food Serv. 13.9% p 84 86 81 81 92 91 96 65 83 105 Arts, Ent. & Rec. 26.4% p 39 41 42 40 45 48 50 53 61 67 Retail** 9.9% p 23 25 27 27 32 44 48 24 23 26 Ground Tran. 11.9% p 2 0 0 0 9 9 13 12 38 39 Visitor Air Tran. 3.0% p 11 9 9 11 25 26 33 33 70 76 Other Travel* 8.6% p 377 TOTAL 389 421 425 508 558 601 509 671 764 13.9% p Travel Industry Employment (Jobs) 8,980 9,030 9,890 9,240 10,400 11,040 11,090 9,730 10,920 11,940 Accom. & Food Serv. 9.4% p 4,270 4,400 4,230 4,040 4,240 4,210 4,280 2,610 3,040 3,830 Arts, Ent. & Rec. 26.0% p 1,340 1,410 1,420 1,340 1,460 1,520 1,520 1,480 1,590 1,660 Retail** 4.1% p 620 640 650 620 660 860 950 840 860 1,060 Ground Tran. 22.0% p 70 0 0 <10 90 90 130 110 280 270 Visitor Air Tran. -3.0% q 390 310 320 310 440 460 530 510 720 740 Other Travel* 2.2% p 15,680 TOTAL 15,790 16,520 15,560 17,300 18,170 18,500 15,290 17,420 19,500 11.9% p
The Economic Impact of Travel in California / 2022p / Prepared by Dean Runyan Associates 139
Kern County / Detail Trend
Direct Travel Impacts 2013-2022p
Details may not add to totals due to rounding. Percent change calculated on unrounded figures.
Local tax receipts include transient occupancy taxes, sales taxes, and airport passenger facility charges paid by visitors, and the property tax payments and sales tax payments attributable to the travel industry income of employees and businesses. State tax receipts include sales tax payments and motor fuel tax payments of visitors, and the income tax payments and sales tax payments attributable to the travel industry income of employees and businesses.
Economic impacts are attributed to visitor trips which are defined as trips taken by individuals that stay overnight away from home, or travel more than 50 miles one-way on a non-routine trip, as defined by the California Tourism Marketing Act
2013 2014 2015 2016 2017 2018 2019 2020 2021 2022 2021-2022 Tax Receipts Generated by Travel Spending ($Millions) 31 33 35 33 36 42 45 41 55 59 Local Tax Receipts 6.0% p 83 86 83 76 81 96 102 62 86 102 State Tax Receipts 19.3% p 114 TOTAL 119 118 109 117 138 147 103 141 161 14.1% p Local Tax Receipts Generated by Travel Spending ($Millions) 19 21 22 20 21 25 27 21 29 32 Visitor 12.8% p 12 12 13 13 15 16 18 20 26 26 Business or Employee -1.3% q 31 TOTAL 33 35 33 36 42 45 41 55 59 6.0% p State Tax Receipts Generated by Travel Spending ($Millions) 68 71 68 61 65 79 84 43 60 76 Visitor 25.7% p 14 15 16 15 16 17 18 19 25 26 Business or Employee 4.0% p 83 TOTAL 86 83 76 81 96 102 62 86 102 19.3% p
The Economic Impact of Travel in California / 2022p / Prepared by Dean Runyan Associates 140
Kings County / Detail Trend
Details may not add to totals due to rounding. Percent change calculated on unrounded figures.
*Other Travel includes ground transportation and air travel impacts for travel to other California visitor destinations, travel arrangement services and convention/trade shows services.
Economic impacts are attributed to visitor trips which are defined as trips taken by individuals that stay overnight away from home, or travel more than 50 miles one-way on a non-routine trip, as defined by the California Tourism Marketing Act
Travel Impacts 2013-2022p 2013 2014 2015 2016 2017 2018 2019 2020 2021 2022 2021-2022 Direct Travel Spending ($Million) 136.4 140.2 140.3 138.2 144.3 158.1 165.3 83.4 154.1 190.0 Destination Spending 23.4% p 26.7 26.5 23.5 20.5 23.0 27.0 28.1 9.7 16.1 22.9 Other Travel* 42.1% p 163.1 TOTAL 166.7 163.8 158.7 167.3 185.0 193.4 93.1 170.2 212.9 25.1% p Visitor Spending by Type of Traveler Accommodation ($Million) 26.8 28.7 32.4 33.1 30.8 34.9 36.8 38.7 41.3 44.5 Hotel, Motel, STVR 7.7% p 77.5 77.9 73.8 71.6 78.4 86.5 91.1 32.6 92.7 110.1 Private Home 18.9% p 3.2 4.1 4.1 4.2 4.4 4.6 4.9 4.1 5.2 6.6 Campground 28.1% p 1.4 1.4 1.5 1.5 1.6 1.7 1.8 0.7 0.6 0.8 2nd Home 27.4% p 27.5 28.0 28.6 27.9 29.2 30.4 30.8 7.2 14.3 28.0 Day Travel 95.9% p 136.4 TOTAL 140.2 140.3 138.2 144.3 158.1 165.3 83.4 154.1 190.0 23.4% p Visitor Spending by Commodity Purchased ($Million) 10.6 11.9 13.5 14.2 13.5 15.2 16.1 14.6 18.6 19.5 Accommodations 5.2% p 48.0 48.8 51.8 52.4 53.8 57.3 58.9 30.6 58.2 71.5 Food Service 23.0% p 11.9 12.3 12.8 12.3 12.4 12.8 12.8 5.9 13.5 17.0 Food Stores 25.7% p 22.9 23.5 21.5 19.0 20.8 24.0 24.6 7.7 15.7 22.1 Local Tran. & Gas 41.3% p 23.6 24.0 24.9 24.7 24.8 25.8 25.8 12.5 22.9 28.0 Arts, Ent. & Rec. 22.3% p 19.3 19.7 15.7 15.6 19.1 23.0 27.1 12.1 25.3 31.9 Retail Sales 26.1% p 136.4 TOTAL 140.2 140.3 138.2 144.3 158.1 165.3 83.4 154.1 190.0 23.4% p
Direct
The Economic Impact of Travel in California / 2022p / Prepared by Dean Runyan Associates 141
Kings County / Detail Trend
Direct Travel Impacts 2013-2022p
Details may not add to totals due to rounding. Percent change calculated on unrounded figures.
*Other Travel includes ground transportation and air travel impacts for travel to other California visitor destinations, travel arrangement services and convention/trade shows services.
**Retail includes gasoline station employment and earnings.
Economic impacts are attributed to visitor trips which are defined as trips taken by individuals that stay overnight away from home, or travel more than 50 miles one-way on a non-routine trip, as defined by the California Tourism Marketing Act
2013 2014 2015 2016 2017 2018 2019 2020 2021 2022 2021-2022 Travel Industry Earnings ($MIllion) 29.5 30.4 35.0 36.9 37.9 44.6 47.0 45.0 56.0 61.5 Accom. & Food Serv. 9.7% p 6.9 7.0 8.2 9.0 8.4 10.1 10.5 9.7 13.7 20.0 Arts, Ent. & Rec. 46.0% p 4.5 4.7 4.4 4.4 4.9 5.5 6.0 6.3 6.8 7.5 Retail** 10.6% p 1.6 1.7 1.8 1.9 2.2 3.1 3.4 1.2 1.3 1.4 Ground Tran. 6.7% p 0.8 0.9 1.0 1.1 1.0 1.0 1.0 1.2 1.3 1.5 Other Travel* 10.0% p 43.3 TOTAL 44.7 50.4 53.3 54.3 64.5 67.8 63.4 79.2 91.9 16.0% p Travel Industry Employment (Jobs) 1,210 1,230 1,340 1,310 1,300 1,490 1,490 1,420 1,630 1,750 Accom. & Food Serv. 7.1% p 420 420 450 460 420 510 500 430 550 730 Arts, Ent. & Rec. 32.7% p 170 180 160 150 170 190 200 190 200 210 Retail** 4.2% p 40 40 50 50 50 60 70 50 60 80 Ground Tran. 23.7% p 50 50 50 50 50 50 50 60 60 60 Other Travel* 3.4% p 1,890 TOTAL 1,930 2,050 2,020 1,990 2,300 2,300 2,150 2,500 2,820 12.8% p
The Economic Impact of Travel in California / 2022p / Prepared by Dean Runyan Associates 142
Kings County / Detail Trend
Direct Travel Impacts 2013-2022p
Details may not add to totals due to rounding. Percent change calculated on unrounded figures.
Local tax receipts include transient occupancy taxes, sales taxes, and airport passenger facility charges paid by visitors, and the property tax payments and sales tax payments attributable to the travel industry income of employees and businesses. State tax receipts include sales tax payments and motor fuel tax payments of visitors, and the income tax payments and sales tax payments attributable to the travel industry income of employees and businesses.
Economic impacts are attributed to visitor trips which are defined as trips taken by individuals that stay overnight away from home, or travel more than 50 miles one-way on a non-routine trip, as defined by the California Tourism Marketing Act
2013 2014 2015 2016 2017 2018 2019 2020 2021 2022 2021-2022 Tax Receipts Generated by Travel Spending ($Millions) 2.8 2.9 3.2 3.3 3.2 3.9 4.1 4.1 5.5 5.8 Local Tax Receipts 5.7% p 10.0 10.3 9.9 9.3 9.6 11.4 12.1 6.8 10.6 12.6 State Tax Receipts 18.9% p 12.8 TOTAL 13.2 13.1 12.6 12.8 15.3 16.3 10.9 16.0 18.3 14.4% p Local Tax Receipts Generated by Travel Spending ($Millions) 1.4 1.5 1.6 1.7 1.7 2.0 2.1 1.6 2.3 2.6 Visitor 12.4% p 1.4 1.4 1.6 1.6 1.6 1.9 2.0 2.5 3.1 3.1 Business or Employee 0.6% p 2.8 TOTAL 2.9 3.2 3.3 3.2 3.9 4.1 4.1 5.5 5.8 5.7% p State Tax Receipts Generated by Travel Spending ($Millions) 8.4 8.6 8.1 7.5 7.9 9.5 10.1 4.5 7.6 9.5 Visitor 23.9% p 1.6 1.7 1.8 1.8 1.7 1.9 2.0 2.3 2.9 3.1 Business or Employee 5.8% p 10.0 TOTAL 10.3 9.9 9.3 9.6 11.4 12.1 6.8 10.6 12.6 18.9% p
The Economic Impact of Travel in California / 2022p / Prepared by Dean Runyan Associates 143
Lake County / Detail Trend
Details may not add to totals due to rounding. Percent change calculated on unrounded figures.
*Other Travel includes ground transportation and air travel impacts for travel to other California visitor destinations, travel arrangement services and convention/trade shows services.
Economic impacts are attributed to visitor trips which are defined as trips taken by individuals that stay overnight away from home, or travel more than 50 miles one-way on a non-routine trip, as defined by the California Tourism Marketing Act
2013 2014 2015 2016 2017 2018 2019 2020 2021 2022 2021-2022 Direct Travel Spending ($Million) 132.8 141.0 143.8 145.5 147.9 159.9 165.6 127.3 155.6 162.9 Destination Spending 4.7% p 13.4 13.5 12.5 11.5 12.7 14.5 15.1 6.3 9.2 12.8 Other Travel* 39.0% p 146.1 TOTAL 154.5 156.3 156.9 160.6 174.4 180.7 133.6 164.8 175.8 6.6% p Visitor Spending by Type of Traveler Accommodation ($Million) 27.7 30.0 33.0 34.5 30.6 33.7 34.5 31.7 35.5 27.5 Hotel, Motel, STVR -22.5% q 33.7 34.0 32.0 31.3 33.8 37.3 39.2 13.1 40.2 44.3 Private Home 10.1% p 11.3 15.1 15.2 15.4 16.1 16.9 18.3 15.3 19.1 24.4 Campground 28.1% p 36.8 37.3 38.8 39.5 41.7 45.5 46.6 56.4 50.5 46.3 2nd Home -8.3% q 23.3 24.6 24.8 24.8 25.6 26.4 27.1 10.8 10.4 20.4 Day Travel 96.9% p 132.8 TOTAL 141.0 143.8 145.5 147.9 159.9 165.6 127.3 155.6 162.9 4.7% p Visitor Spending by Commodity Purchased ($Million) 25.3 27.9 30.1 31.7 30.5 31.7 32.7 35.6 36.1 36.5 Accommodations 1.3% p 41.6 43.2 45.4 47.0 47.2 49.8 51.5 38.5 49.5 49.6 Food Service 0.3% p 9.1 10.2 10.5 10.5 10.4 10.6 11.0 7.4 11.9 14.2 Food Stores 18.9% p 19.7 21.1 19.2 17.4 18.7 21.5 22.3 11.0 15.2 18.6 Local Tran. & Gas 23.0% p 22.6 23.5 24.2 24.5 24.2 24.8 25.0 18.7 22.0 21.8 Arts, Ent. & Rec. -0.7% q 14.3 15.0 14.3 14.5 16.9 21.4 23.2 16.2 21.0 22.1 Retail Sales 5.3% p 132.8 TOTAL 141.0 143.8 145.5 147.9 159.9 165.6 127.3 155.6 162.9 4.7% p
Direct Travel Impacts 2013-2022p
The Economic Impact of Travel in California / 2022p / Prepared
Runyan Associates 144
by Dean
Lake County / Detail Trend
Direct Travel Impacts 2013-2022p
Details may not add to totals due to rounding. Percent change calculated on unrounded figures.
*Other Travel includes ground transportation and air travel impacts for travel to other California visitor destinations, travel arrangement services and convention/trade shows services.
**Retail includes gasoline station employment and earnings.
Economic impacts are attributed to visitor trips which are defined as trips taken by individuals that stay overnight away from home, or travel more than 50 miles one-way on a non-routine trip, as defined by the California Tourism Marketing Act
2013 2014 2015 2016 2017 2018 2019 2020 2021 2022 2021-2022 Travel Industry Earnings ($MIllion) 26.5 27.4 29.3 32.2 33.3 35.7 37.9 34.5 40.7 45.1 Accom. & Food Serv. 10.8% p 5.8 4.0 3.9 3.8 4.1 4.6 4.8 5.4 6.3 5.8 Arts, Ent. & Rec. -7.0% q 3.5 3.8 3.9 4.0 4.5 5.1 5.3 6.1 6.3 6.8 Retail** 7.6% p 1.4 1.6 1.7 1.8 2.0 2.9 3.2 1.5 1.2 1.1 Ground Tran. -10.5% q 1.2 1.3 1.4 1.6 1.7 1.8 2.0 1.7 1.7 2.1 Other Travel* 24.7% p 38.4 TOTAL 38.1 40.2 43.3 45.7 50.1 53.1 49.2 56.2 60.9 8.4% p Travel Industry Employment (Jobs) 1,070 1,090 1,100 1,110 1,080 1,140 1,160 1,010 1,110 1,200 Accom. & Food Serv. 8.8% p 430 330 290 310 300 360 340 350 370 330 Arts, Ent. & Rec. -10.1% q 130 150 140 140 150 160 170 180 180 190 Retail** 4.1% p 40 40 40 40 40 60 60 70 60 60 Ground Tran. 3.7% p 30 30 30 30 30 30 40 30 30 40 Other Travel* 24.6% p 1,700 TOTAL 1,630 1,590 1,630 1,620 1,750 1,760 1,640 1,740 1,820 4.5% p
The Economic Impact of Travel in California / 2022p / Prepared by Dean Runyan Associates 145
Lake County / Detail Trend
Direct Travel Impacts 2013-2022p
Details may not add to totals due to rounding. Percent change calculated on unrounded figures.
Local tax receipts include transient occupancy taxes, sales taxes, and airport passenger facility charges paid by visitors, and the property tax payments and sales tax payments attributable to the travel industry income of employees and businesses. State tax receipts include sales tax payments and motor fuel tax payments of visitors, and the income tax payments and sales tax payments attributable to the travel industry income of employees and businesses.
Economic impacts are attributed to visitor trips which are defined as trips taken by individuals that stay overnight away from home, or travel more than 50 miles one-way on a non-routine trip, as defined by the California Tourism Marketing Act
2013 2014 2015 2016 2017 2018 2019 2020 2021 2022 2021-2022 Tax Receipts Generated by Travel Spending ($Millions) 2.8 2.9 3.1 3.3 3.2 3.7 3.9 4.1 4.7 4.7 Local Tax Receipts 0.2% p 7.3 7.7 7.5 7.3 7.4 8.5 9.0 6.6 8.0 8.4 State Tax Receipts 4.8% p 10.1 TOTAL 10.6 10.6 10.6 10.6 12.2 12.8 10.7 12.7 13.1 3.1% p Local Tax Receipts Generated by Travel Spending ($Millions) 1.5 1.7 1.9 2.0 1.9 2.2 2.3 2.2 2.5 2.6 Visitor 5.8% p 1.2 1.2 1.3 1.3 1.3 1.5 1.6 1.9 2.2 2.1 Business or Employee -6.1% q 2.8 TOTAL 2.9 3.1 3.3 3.2 3.7 3.9 4.1 4.7 4.7 0.2% p State Tax Receipts Generated by Travel Spending ($Millions) 5.9 6.2 6.0 5.8 5.9 7.0 7.4 4.7 5.8 6.3 Visitor 7.5% p 1.4 1.4 1.5 1.5 1.5 1.5 1.6 1.9 2.2 2.1 Business or Employee -2.3% q 7.3 TOTAL 7.7 7.5 7.3 7.4 8.5 9.0 6.6 8.0 8.4 4.8% p
The Economic Impact of Travel in California / 2022p / Prepared
Runyan Associates 146
by Dean
Lassen County / Detail Trend
Details may not add to totals due to rounding. Percent change calculated on unrounded figures.
*Other Travel includes ground transportation and air travel impacts for travel to other California visitor destinations, travel arrangement services and convention/trade shows services.
Economic impacts are attributed to visitor trips which are defined as trips taken by individuals that stay overnight away from home, or travel more than 50 miles one-way on a non-routine trip, as defined by the California Tourism Marketing Act
Travel Impacts 2013-2022p 2013 2014 2015 2016 2017 2018 2019 2020 2021 2022 2021-2022 Direct Travel Spending ($Million) 53.1 54.8 53.7 55.0 58.8 59.6 64.8 37.8 60.3 66.1 Destination Spending 9.5% p 5.6 5.6 4.8 4.2 4.7 5.4 5.6 1.9 3.2 4.5 Other Travel* 42.3% p 58.7 TOTAL 60.4 58.5 59.1 63.5 65.0 70.5 39.7 63.5 70.6 11.2% p Visitor Spending by Type of Traveler Accommodation ($Million) 12.8 13.4 13.9 14.9 16.2 15.3 17.0 9.6 17.3 12.5 Hotel, Motel, STVR -27.6% q 17.1 17.1 15.7 15.6 17.0 17.6 19.6 6.4 19.6 21.6 Private Home 10.1% p 5.1 5.8 5.8 5.9 6.1 6.4 6.9 5.8 7.1 9.1 Campground 27.3% p 6.6 6.5 6.7 6.8 7.2 7.9 8.1 11.8 10.6 12.3 2nd Home 16.0% p 11.5 11.9 11.7 11.8 12.3 12.4 13.3 4.2 5.7 10.6 Day Travel 86.2% p 53.1 TOTAL 54.8 53.7 55.0 58.8 59.6 64.8 37.8 60.3 66.1 9.5% p Visitor Spending by Commodity Purchased ($Million) 8.3 8.9 9.3 9.9 10.6 10.4 11.4 9.8 12.3 12.7 Accommodations 3.7% p 16.9 17.2 17.5 18.4 19.4 19.2 20.7 11.5 20.1 21.1 Food Service 5.2% p 4.1 4.3 4.3 4.3 4.3 4.2 4.5 2.6 4.7 5.7 Food Stores 19.7% p 8.4 8.6 7.7 7.0 7.8 8.5 9.1 3.6 6.2 8.0 Local Tran. & Gas 28.7% p 8.9 9.1 9.0 9.3 9.6 9.3 9.7 5.4 8.6 9.1 Arts, Ent. & Rec. 5.9% p 6.6 6.8 5.9 6.1 7.2 8.1 9.3 4.9 8.5 9.5 Retail Sales 12.0% p 53.1 TOTAL 54.8 53.7 55.0 58.8 59.6 64.8 37.8 60.3 66.1 9.5% p
Direct
The Economic Impact of Travel in California / 2022p / Prepared by Dean Runyan Associates 147
Lassen County / Detail Trend
Direct Travel Impacts 2013-2022p
Details may not add to totals due to rounding. Percent change calculated on unrounded figures.
*Other Travel includes ground transportation and air travel impacts for travel to other California visitor destinations, travel arrangement services and convention/trade shows services.
**Retail includes gasoline station employment and earnings.
Economic impacts are attributed to visitor trips which are defined as trips taken by individuals that stay overnight away from home, or travel more than 50 miles one-way on a non-routine trip, as defined by the California Tourism Marketing Act
2013 2014 2015 2016 2017 2018 2019 2020 2021 2022 2021-2022 Travel Industry Earnings ($MIllion) 10.0 11.2 12.7 13.2 13.3 12.3 13.6 11.4 12.4 13.3 Accom. & Food Serv. 7.8% p 6.3 6.1 5.1 5.3 5.6 8.5 9.2 7.4 9.1 10.3 Arts, Ent. & Rec. 13.2% p 1.7 1.8 1.7 1.8 1.9 1.9 2.0 2.2 2.5 2.6 Retail** 5.6% p 0.6 0.6 0.7 0.7 0.9 1.2 1.3 0.5 0.5 0.5 Ground Tran. -6.3% q 0.2 0.2 0.2 0.2 0.2 0.2 0.2 0.2 0.2 0.3 Other Travel* 57.5% p 18.8 TOTAL 19.9 20.3 21.3 21.8 24.1 26.3 21.6 24.6 27.0 9.7% p Travel Industry Employment (Jobs) 440 480 510 490 470 410 450 370 360 380 Accom. & Food Serv. 4.5% p 420 370 340 330 330 470 570 420 560 600 Arts, Ent. & Rec. 9.0% p 60 60 60 60 60 60 60 60 60 70 Retail** 3.1% p 20 20 20 20 20 20 30 20 20 30 Ground Tran. 8.6% p <10 <10 <10 <10 <10 <10 <10 <10 <10 <10 Other Travel* 44.6% p 950 TOTAL 940 940 900 880 970 1,120 870 1,010 1,080 7.2% p
The Economic Impact of Travel in California / 2022p / Prepared
Runyan Associates 148
by Dean
Lassen County / Detail Trend
Direct Travel Impacts 2013-2022p
Details may not add to totals due to rounding. Percent change calculated on unrounded figures.
Local tax receipts include transient occupancy taxes, sales taxes, and airport passenger facility charges paid by visitors, and the property tax payments and sales tax payments attributable to the travel industry income of employees and businesses. State tax receipts include sales tax payments and motor fuel tax payments of visitors, and the income tax payments and sales tax payments attributable to the travel industry income of employees and businesses.
Economic impacts are attributed to visitor trips which are defined as trips taken by individuals that stay overnight away from home, or travel more than 50 miles one-way on a non-routine trip, as defined by the California Tourism Marketing Act
2013 2014 2015 2016 2017 2018 2019 2020 2021 2022 2021-2022 Tax Receipts Generated by Travel Spending ($Millions) 1.4 1.4 1.5 1.5 1.6 1.7 1.9 1.6 2.1 2.1 Local Tax Receipts -1.8% q 3.3 3.4 3.2 3.1 3.2 3.5 3.8 2.3 3.3 3.6 State Tax Receipts 8.5% p 4.6 TOTAL 4.8 4.7 4.6 4.8 5.2 5.8 3.9 5.5 5.7 4.5% p Local Tax Receipts Generated by Travel Spending ($Millions) 0.8 0.8 0.8 0.9 1.0 1.0 1.1 0.8 1.1 1.2 Visitor 1.0% p 0.6 0.6 0.6 0.6 0.6 0.7 0.8 0.8 1.0 0.9 Business or Employee -5.0% q 1.4 TOTAL 1.4 1.5 1.5 1.6 1.7 1.9 1.6 2.1 2.1 -1.8% q State Tax Receipts Generated by Travel Spending ($Millions) 2.6 2.7 2.5 2.4 2.5 2.8 3.1 1.6 2.4 2.7 Visitor 12.2% p 0.7 0.7 0.7 0.7 0.7 0.7 0.7 0.8 0.9 0.9 Business or Employee -1.0% q 3.3 TOTAL 3.4 3.2 3.1 3.2 3.5 3.8 2.3 3.3 3.6 8.5% p
The Economic Impact of Travel in California / 2022p / Prepared by Dean Runyan Associates 149
Los Angeles County / Detail Trend
Details may not add to totals due to rounding. Percent change calculated on unrounded figures.
*Other Travel includes ground transportation and air travel impacts for travel to other California visitor destinations, travel arrangement services and convention/trade shows services.
Economic impacts are attributed to visitor trips which are defined as trips taken by individuals that stay overnight away from home, or travel more than 50 miles one-way on a non-routine trip, as defined by the California Tourism Marketing Act
2013 2014 2015 2016 2017 2018 2019 2020 2021 2022 2021-2022 Direct Travel Spending ($Million) 19,999 20,513 21,582 22,860 24,232 25,773 26,257 10,365 17,379 22,453 Destination Spending 29.2% p 5,065 5,257 5,246 5,179 5,622 6,179 6,418 2,889 3,657 6,040 Other Travel* 65.2% p 25,065 TOTAL 25,769 26,828 28,039 29,854 31,952 32,675 13,254 21,036 28,493 35.4% p Visitor Spending by Type of Traveler Accommodation ($Million) 11,507 11,938 12,828 13,940 14,803 15,729 15,777 7,000 11,071 13,782 Hotel, Motel, STVR 24.5% p 3,080 3,152 3,214 3,243 3,520 3,822 4,076 1,541 3,360 3,912 Private Home 16.4% p 87 92 93 94 98 103 111 93 116 149 Campground 28.2% p 163 165 162 164 173 186 191 340 305 337 2nd Home 10.5% p 5,162 5,166 5,285 5,419 5,638 5,933 6,102 1,391 2,528 4,274 Day Travel 69.1% p 19,999 TOTAL 20,513 21,582 22,860 24,232 25,773 26,257 10,365 17,379 22,453 29.2% p Visitor Spending by Commodity Purchased ($Million) 3,805 4,099 4,576 5,126 5,498 5,694 5,776 2,697 4,093 5,842 Accommodations 42.7% p 5,037 5,043 5,380 5,787 6,133 6,569 6,725 2,752 4,653 5,340 Food Service 14.8% p 577 587 615 629 640 660 667 289 544 666 Food Stores 22.4% p 3,083 3,125 3,045 3,024 3,238 3,575 3,608 1,218 2,385 3,092 Local Tran. & Gas 29.7% p 3,086 3,093 3,222 3,395 3,513 3,673 3,665 1,427 2,335 2,626 Arts, Ent. & Rec. 12.5% p 2,672 2,659 2,773 2,882 3,094 3,334 3,483 1,299 2,266 2,692 Retail Sales 18.8% p 1,739 1,906 1,972 2,017 2,116 2,267 2,333 683 1,103 2,194 Visitor Air Tran. 98.9% p 19,999 TOTAL 20,513 21,582 22,860 24,232 25,773 26,257 10,365 17,379 22,453 29.2% p
Direct Travel Impacts 2013-2022p
The Economic Impact of Travel in California / 2022p / Prepared
Runyan Associates 150
by Dean
Los Angeles County / Detail Trend
Details may not add to totals due to rounding. Percent change calculated on unrounded figures.
*Other Travel includes ground transportation and air travel impacts for travel to other California visitor destinations, travel arrangement services and convention/trade shows services.
**Retail includes gasoline station employment and earnings.
Economic impacts are attributed to visitor trips which are defined as trips taken by individuals that stay overnight away from home, or travel more than 50 miles one-way on a non-routine trip, as defined by the California Tourism Marketing Act
2013 2014 2015 2016 2017 2018 2019 2020 2021 2022 2021-2022 Travel Industry Earnings ($MIllion) 3,777 3,949 4,372 4,932 5,247 5,692 5,913 4,144 4,896 6,294 Accom. & Food Serv. 28.5% p 2,103 2,209 2,401 2,530 2,575 2,786 2,926 2,085 2,392 2,668 Arts, Ent. & Rec. 11.6% p 442 451 484 512 529 560 575 572 643 682 Retail** 6.0% p 358 379 420 472 515 651 695 282 335 365 Ground Tran. 8.7% p 774 803 890 1,273 1,459 1,538 2,199 2,201 1,739 1,874 Visitor Air Tran. 7.8% p 1,473 1,517 1,669 2,112 2,364 2,504 3,189 2,950 2,558 2,867 Other Travel* 12.1% p 8,926 TOTAL 9,307 10,236 11,830 12,689 13,730 15,497 12,233 12,563 14,750 17.4% p Travel Industry Employment (Jobs) 108,710 110,180 115,960 121,910 125,480 129,520 127,760 91,770 99,530 117,020 Accom. & Food Serv. 17.6% p 25,380 26,740 29,230 30,580 30,210 32,160 32,730 21,670 24,590 30,480 Arts, Ent. & Rec. 23.9% p 13,200 13,230 13,640 14,060 14,110 14,400 13,990 12,810 13,400 13,590 Retail** 1.4% p 8,930 9,020 9,620 10,150 10,410 12,340 13,170 8,360 9,300 10,160 Ground Tran. 9.2% p 9,580 9,970 10,660 13,100 14,750 15,050 19,420 17,380 14,090 14,300 Visitor Air Tran. 1.5% p 22,250 23,080 24,050 26,660 28,190 28,760 32,950 28,200 23,980 25,210 Other Travel* 5.1% p 188,060 TOTAL 192,230 203,160 216,460 223,160 232,230 240,020 180,190 184,890 210,760 14.0% p
Direct Travel Impacts 2013-2022p
The Economic Impact of Travel in California / 2022p / Prepared by Dean Runyan Associates 151
Los Angeles County / Detail Trend
Direct Travel Impacts 2013-2022p
Details may not add to totals due to rounding. Percent change calculated on unrounded figures.
Local tax receipts include transient occupancy taxes, sales taxes, and airport passenger facility charges paid by visitors, and the property tax payments and sales tax payments attributable to the travel industry income of employees and businesses. State tax receipts include sales tax payments and motor fuel tax payments of visitors, and the income tax payments and sales tax payments attributable to the travel industry income of employees and businesses.
Economic impacts are attributed to visitor trips which are defined as trips taken by individuals that stay overnight away from home, or travel more than 50 miles one-way on a non-routine trip, as defined by the California Tourism Marketing Act
2013 2014 2015 2016 2017 2018 2019 2020 2021 2022 2021-2022 Tax Receipts Generated by Travel Spending ($Millions) 1,016 1,062 1,162 1,291 1,453 1,559 1,639 1,031 1,326 1,606 Local Tax Receipts 21.1% p 1,102 1,127 1,142 1,168 1,171 1,293 1,371 753 1,008 1,161 State Tax Receipts 15.3% p 2,117 TOTAL 2,188 2,304 2,459 2,624 2,851 3,010 1,784 2,334 2,767 18.6% p Local Tax Receipts Generated by Travel Spending ($Millions) 687 726 797 885 1,017 1,087 1,106 475 751 1,022 Visitor 36.0% p 329 335 365 407 436 472 533 556 575 585 Business or Employee 1.7% p 1,016 TOTAL 1,062 1,162 1,291 1,453 1,559 1,639 1,031 1,326 1,606 21.1% p State Tax Receipts Generated by Travel Spending ($Millions) 812 823 816 814 839 955 994 395 630 751 Visitor 19.2% p 290 304 326 354 332 337 378 358 377 410 Business or Employee 8.6% p 1,102 TOTAL 1,127 1,142 1,168 1,171 1,293 1,371 753 1,008 1,161 15.3% p
The Economic Impact of Travel in California / 2022p / Prepared by Dean Runyan Associates 152
Madera County / Detail Trend
Details may not add to totals due to rounding. Percent change calculated on unrounded figures.
*Other Travel includes ground transportation and air travel impacts for travel to other California visitor destinations, travel arrangement services and convention/trade shows services.
Economic impacts are attributed to visitor trips which are defined as trips taken by individuals that stay overnight away from home, or travel more than 50 miles one-way on a non-routine trip, as defined by the California Tourism Marketing Act
Travel Impacts
2013 2014 2015 2016 2017 2018 2019 2020 2021 2022 2021-2022 Direct Travel Spending ($Million) 237.5 248.1 244.5 264.4 286.0 304.6 318.9 191.4 316.3 316.4 Destination Spending 0.1% p 26.7 27.0 24.3 26.6 30.3 34.7 36.1 14.7 21.9 30.5 Other Travel* 39.3% p 264.2 TOTAL 275.1 268.8 291.0 316.2 339.3 355.0 206.1 338.1 346.9 2.6% p Visitor Spending by Type of Traveler Accommodation ($Million) 110.8 116.3 117.2 133.9 148.0 156.3 163.1 119.5 197.9 160.6 Hotel, Motel, STVR -18.8% q 37.7 37.9 35.5 35.6 38.7 42.8 45.7 13.7 42.4 47.3 Private Home 11.5% p 19.4 22.2 22.0 22.2 23.3 24.5 26.4 22.0 27.5 35.2 Campground 28.2% p 17.5 18.0 17.5 17.8 18.7 19.9 20.4 19.0 17.2 23.1 2nd Home 34.5% p 52.1 53.6 52.3 54.8 57.1 61.1 63.4 17.2 31.3 50.2 Day Travel 60.5% p 237.5 TOTAL 248.1 244.5 264.4 286.0 304.6 318.9 191.4 316.3 316.4 0.1% p Visitor Spending by Commodity Purchased ($Million) 52.0 56.4 58.5 66.8 73.2 76.4 79.7 68.6 98.8 106.8 Accommodations 8.0% p 63.2 65.0 66.2 73.7 79.1 83.5 87.9 49.4 87.1 77.1 Food Service -11.4% q 13.1 14.0 14.1 14.6 14.9 15.2 15.8 10.7 17.5 20.4 Food Stores 16.4% p 44.2 45.8 40.8 39.1 43.6 49.9 52.1 20.1 38.7 43.5 Local Tran. & Gas 12.4% p 31.4 32.4 32.2 35.1 36.8 38.0 38.9 21.3 35.4 30.9 Arts, Ent. & Rec. -12.6% q 33.7 34.5 32.6 35.1 38.4 41.7 44.5 21.4 38.8 37.7 Retail Sales -2.7% q 237.5 TOTAL 248.1 244.5 264.4 286.0 304.6 318.9 191.4 316.3 316.4 0.1% p
Direct
2013-2022p
The Economic Impact of Travel in California / 2022p / Prepared by Dean Runyan Associates 153
Madera County / Detail Trend
Direct Travel Impacts 2013-2022p
Details may not add to totals due to rounding. Percent change calculated on unrounded figures.
*Other Travel includes ground transportation and air travel impacts for travel to other California visitor destinations, travel arrangement services and convention/trade shows services.
**Retail includes gasoline station employment and earnings.
Economic impacts are attributed to visitor trips which are defined as trips taken by individuals that stay overnight away from home, or travel more than 50 miles one-way on a non-routine trip, as defined by the California Tourism Marketing Act
2013 2014 2015 2016 2017 2018 2019 2020 2021 2022 2021-2022 Travel Industry Earnings ($MIllion) 53.3 55.4 60.0 69.4 77.4 81.8 87.7 79.9 100.2 116.8 Accom. & Food Serv. 16.6% p 14.0 19.2 15.7 16.5 21.4 22.9 24.3 20.7 25.0 31.2 Arts, Ent. & Rec. 24.9% p 7.9 8.4 8.3 9.1 9.7 10.3 10.9 12.8 14.4 14.7 Retail** 2.0% p 3.5 3.7 3.8 4.5 5.3 7.6 8.3 3.0 3.3 2.6 Ground Tran. -20.0% q 0.8 1.0 1.1 2.3 2.7 2.8 3.1 3.2 3.2 3.7 Other Travel* 17.9% p 79.6 TOTAL 87.7 88.9 101.8 116.6 125.5 134.3 119.4 146.0 169.0 15.8% p Travel Industry Employment (Jobs) 1,910 1,910 1,910 2,070 2,150 2,200 2,250 2,010 2,300 2,510 Accom. & Food Serv. 9.4% p 870 1,200 890 990 1,380 1,550 1,510 1,220 1,350 1,690 Arts, Ent. & Rec. 25.9% p 260 270 260 280 290 300 310 340 370 350 Retail** -3.7% q 100 100 100 110 110 150 170 140 150 140 Ground Tran. -7.2% q 40 50 50 90 110 110 110 110 100 110 Other Travel* 9.3% p 3,170 TOTAL 3,520 3,210 3,540 4,050 4,320 4,350 3,820 4,270 4,810 12.8% p
The Economic Impact of Travel in California / 2022p / Prepared by Dean Runyan Associates 154
Madera County / Detail Trend
Direct Travel Impacts 2013-2022p
Details may not add to totals due to rounding. Percent change calculated on unrounded figures.
Local tax receipts include transient occupancy taxes, sales taxes, and airport passenger facility charges paid by visitors, and the property tax payments and sales tax payments attributable to the travel industry income of employees and businesses. State tax receipts include sales tax payments and motor fuel tax payments of visitors, and the income tax payments and sales tax payments attributable to the travel industry income of employees and businesses.
Economic impacts are attributed to visitor trips which are defined as trips taken by individuals that stay overnight away from home, or travel more than 50 miles one-way on a non-routine trip, as defined by the California Tourism Marketing Act
2013 2014 2015 2016 2017 2018 2019 2020 2021 2022 2021-2022 Tax Receipts Generated by Travel Spending ($Millions) 7.6 8.3 8.8 9.9 10.9 11.9 12.6 11.7 16.3 16.6 Local Tax Receipts 1.6% p 14.4 15.2 14.3 14.5 15.3 17.5 18.6 11.5 17.0 17.2 State Tax Receipts 1.2% p 22.1 TOTAL 23.5 23.1 24.5 26.3 29.4 31.2 23.2 33.3 33.8 1.4% p Local Tax Receipts Generated by Travel Spending ($Millions) 5.0 5.4 5.9 6.7 7.4 8.1 8.5 6.8 10.4 10.6 Visitor 2.5% p 2.7 2.9 2.9 3.2 3.5 3.8 4.1 4.9 6.0 6.0 Business or Employee 0.0% q 7.6 TOTAL 8.3 8.8 9.9 10.9 11.9 12.6 11.7 16.3 16.6 1.6% p State Tax Receipts Generated by Travel Spending ($Millions) 11.7 12.1 11.3 11.3 11.9 14.0 14.9 7.4 11.8 11.9 Visitor 0.5% p 2.8 3.1 3.0 3.3 3.4 3.5 3.7 4.1 5.2 5.3 Business or Employee 2.7% p 14.4 TOTAL 15.2 14.3 14.5 15.3 17.5 18.6 11.5 17.0 17.2 1.2% p
The Economic Impact of Travel in California / 2022p / Prepared by Dean Runyan Associates 155
Marin County / Detail Trend
Details may not add to totals due to rounding. Percent change calculated on unrounded figures.
*Other Travel includes ground transportation and air travel impacts for travel to other California visitor destinations, travel arrangement services and convention/trade shows services.
Economic impacts are attributed to visitor trips which are defined as trips taken by individuals that stay overnight away from home, or travel more than 50 miles one-way on a non-routine trip, as defined by the California Tourism Marketing Act
Travel Impacts 2013-2022p 2013 2014 2015 2016 2017 2018 2019 2020 2021 2022 2021-2022 Direct Travel Spending ($Million) 489.0 520.6 543.7 561.2 566.0 622.0 643.1 252.6 467.3 654.1 Destination Spending 40.0% p 184.4 169.6 171.5 170.0 164.9 174.4 195.2 113.0 132.2 198.1 Other Travel* 49.8% p 673.4 TOTAL 690.2 715.2 731.1 730.9 796.4 838.3 365.6 599.5 852.2 42.2% p Visitor Spending by Type of Traveler Accommodation ($Million) 255.1 274.0 295.0 309.9 300.0 335.8 345.1 118.9 250.3 377.7 Hotel, Motel, STVR 50.9% p 82.1 83.3 84.1 84.8 92.4 101.9 108.0 28.6 83.5 91.5 Private Home 9.5% p 27.0 34.8 35.4 35.9 37.6 39.5 42.6 35.8 44.6 57.1 Campground 28.1% p 30.8 31.3 31.1 31.6 33.6 37.2 38.1 41.1 36.9 40.9 2nd Home 10.8% p 94.1 97.2 98.0 99.0 102.4 107.5 109.3 28.1 51.9 86.9 Day Travel 67.4% p 489.0 TOTAL 520.6 543.7 561.2 566.0 622.0 643.1 252.6 467.3 654.1 40.0% p Visitor Spending by Commodity Purchased ($Million) 121.3 139.0 154.9 164.3 158.6 177.4 184.2 85.4 152.2 232.6 Accommodations 52.8% p 142.8 147.0 154.2 161.9 164.3 177.4 182.9 65.8 127.8 170.5 Food Service 33.3% p 23.8 26.3 27.2 27.3 27.3 28.1 28.9 16.7 27.6 36.4 Food Stores 31.8% p 50.2 53.3 49.1 45.5 49.2 56.7 58.5 19.2 35.6 52.5 Local Tran. & Gas 47.4% p 79.8 82.2 84.2 86.7 86.0 90.7 91.0 31.1 59.2 76.1 Arts, Ent. & Rec. 28.5% p 71.0 72.8 74.1 75.4 80.6 91.7 97.6 34.4 64.7 86.0 Retail Sales 33.0% p 489.0 TOTAL 520.6 543.7 561.2 566.0 622.0 643.1 252.6 467.3 654.1 40.0% p
Direct
The Economic Impact of Travel in California / 2022p / Prepared by Dean Runyan Associates 156
Marin County / Detail Trend
Direct Travel Impacts 2013-2022p
Details may not add to totals due to rounding. Percent change calculated on unrounded figures.
*Other Travel includes ground transportation and air travel impacts for travel to other California visitor destinations, travel arrangement services and convention/trade shows services.
**Retail includes gasoline station employment and earnings.
Economic impacts are attributed to visitor trips which are defined as trips taken by individuals that stay overnight away from home, or travel more than 50 miles one-way on a non-routine trip, as defined by the California Tourism Marketing Act
2013 2014 2015 2016 2017 2018 2019 2020 2021 2022 2021-2022 Travel Industry Earnings ($MIllion) 151.5 162.1 170.5 188.5 197.1 209.6 221.4 150.5 174.7 222.8 Accom. & Food Serv. 27.5% p 47.4 49.9 51.3 55.4 56.1 58.6 59.8 45.4 51.3 56.0 Arts, Ent. & Rec. 9.2% p 12.5 13.3 14.0 14.5 15.0 17.4 17.0 16.9 17.5 18.0 Retail** 2.9% p 4.9 5.2 5.5 6.1 7.0 10.2 10.9 2.8 3.1 3.6 Ground Tran. 13.4% p 42.9 38.9 41.2 42.6 39.9 40.9 46.6 23.2 34.0 40.4 Other Travel* 18.8% p 259.1 TOTAL 269.4 282.5 307.1 315.1 336.7 355.7 238.7 280.7 340.8 21.4% p Travel Industry Employment (Jobs) 3,320 3,390 3,390 3,450 3,510 3,620 3,650 2,490 2,640 3,110 Accom. & Food Serv. 17.8% p 1,450 1,540 1,570 1,670 1,690 1,670 1,720 1,250 1,290 1,440 Arts, Ent. & Rec. 11.9% p 340 350 340 350 350 380 400 390 380 370 Retail** -2.5% q 130 140 140 150 150 200 220 130 150 190 Ground Tran. 31.5% p 570 550 560 600 550 590 650 290 400 460 Other Travel* 13.6% p 5,810 TOTAL 5,980 5,990 6,220 6,250 6,460 6,640 4,550 4,860 5,570 14.7% p
The Economic Impact of Travel in California / 2022p / Prepared by Dean Runyan Associates 157
Marin County / Detail Trend
Direct Travel Impacts 2013-2022p
Details may not add to totals due to rounding. Percent change calculated on unrounded figures.
Local tax receipts include transient occupancy taxes, sales taxes, and airport passenger facility charges paid by visitors, and the property tax payments and sales tax payments attributable to the travel industry income of employees and businesses. State tax receipts include sales tax payments and motor fuel tax payments of visitors, and the income tax payments and sales tax payments attributable to the travel industry income of employees and businesses.
Economic impacts are attributed to visitor trips which are defined as trips taken by individuals that stay overnight away from home, or travel more than 50 miles one-way on a non-routine trip, as defined by the California Tourism Marketing Act
2013 2014 2015 2016 2017 2018 2019 2020 2021 2022 2021-2022 Tax Receipts Generated by Travel Spending ($Millions) 25.0 27.6 29.8 31.1 30.8 34.8 36.8 20.4 31.0 41.5 Local Tax Receipts 34.0% p 28.7 29.7 29.5 29.2 29.0 32.3 34.0 17.4 25.5 31.5 State Tax Receipts 23.8% p 53.7 TOTAL 57.3 59.3 60.3 59.9 67.1 70.8 37.7 56.4 73.0 29.4% p Local Tax Receipts Generated by Travel Spending ($Millions) 15.8 18.1 19.9 20.8 20.7 23.8 25.2 10.1 18.8 28.7 Visitor 52.4% p 9.2 9.5 9.9 10.3 10.1 10.9 11.5 10.2 12.1 12.8 Business or Employee 5.3% p 25.0 TOTAL 27.6 29.8 31.1 30.8 34.8 36.8 20.4 31.0 41.5 34.0% p State Tax Receipts Generated by Travel Spending ($Millions) 20.2 21.0 20.5 20.1 20.4 23.7 24.9 9.8 16.2 21.2 Visitor 30.5% p 8.5 8.7 8.9 9.2 8.6 8.6 9.1 7.5 9.3 10.4 Business or Employee 12.2% p 28.7 TOTAL 29.7 29.5 29.2 29.0 32.3 34.0 17.4 25.5 31.5 23.8% p
The Economic Impact of Travel in California / 2022p / Prepared by Dean Runyan Associates 158
Mariposa County / Detail Trend
Details may not add to totals due to rounding. Percent change calculated on unrounded figures.
*Other Travel includes ground transportation and air travel impacts for travel to other California visitor destinations, travel arrangement services and convention/trade shows services.
Economic impacts are attributed to visitor trips which are defined as trips taken by individuals that stay overnight away from home, or travel more than 50 miles one-way on a non-routine trip, as defined by the California Tourism Marketing Act
Direct Travel Impacts 2013-2022p 2013 2014 2015 2016 2017 2018 2019 2020 2021 2022 2021-2022 Direct Travel Spending ($Million) 391.2 417.7 450.8 455.6 468.0 433.7 464.0 254.2 335.0 348.1 Destination Spending 3.9% p 3.1 3.1 2.7 2.4 2.7 3.1 3.2 1.1 1.8 2.5 Other Travel* 42.3% p 394.4 TOTAL 420.8 453.5 457.9 470.7 436.8 467.2 255.3 336.8 350.6 4.1% p Visitor Spending by Type of Traveler Accommodation ($Million) 336.4 361.0 392.7 397.6 407.3 373.9 400.6 226.5 292.7 292.0 Hotel, Motel, STVR -0.3% q 9.3 9.5 8.8 8.5 9.3 9.8 10.8 3.5 10.8 11.9 Private Home 10.2% p 2.5 2.7 2.6 2.7 2.8 2.9 3.1 2.6 3.3 4.2 Campground 28.1% p 9.9 9.9 10.2 10.4 11.1 12.1 12.4 10.8 9.6 10.5 2nd Home 9.2% p 33.1 34.7 36.5 36.5 37.5 35.1 37.1 10.8 18.6 29.5 Day Travel 58.8% p 391.2 TOTAL 417.7 450.8 455.6 468.0 433.7 464.0 254.2 335.0 348.1 3.9% p Visitor Spending by Commodity Purchased ($Million) 130.9 142.5 157.5 162.5 168.3 152.6 165.4 109.3 160.4 184.5 Accommodations 15.0% p 114.5 121.1 132.7 136.0 139.5 130.5 140.1 70.8 82.6 74.8 Food Service -9.4% q 8.7 9.2 9.9 9.7 9.6 8.9 9.4 4.8 11.5 12.7 Food Stores 10.5% p 35.2 37.4 36.4 33.3 35.8 36.2 38.6 16.3 20.1 19.9 Local Tran. & Gas -0.9% q 56.6 59.9 64.0 64.3 64.5 59.0 61.7 29.8 33.2 30.0 Arts, Ent. & Rec. -9.9% q 45.3 47.6 50.3 49.7 50.1 46.4 48.9 23.2 27.3 26.2 Retail Sales -3.9% q 391.2 TOTAL 417.7 450.8 455.6 468.0 433.7 464.0 254.2 335.0 348.1 3.9% p
The Economic Impact of Travel in California / 2022p / Prepared by Dean Runyan Associates 159
Mariposa County / Detail Trend
Details may not add to totals due to rounding. Percent change calculated on unrounded figures.
*Other Travel includes ground transportation and air travel impacts for travel to other California visitor destinations, travel arrangement services and convention/trade shows services.
**Retail includes gasoline station employment and earnings.
Economic impacts are attributed to visitor trips which are defined as trips taken by individuals that stay overnight away from home, or travel more than 50 miles one-way on a non-routine trip, as defined by the California Tourism Marketing Act
2013 2014 2015 2016 2017 2018 2019 2020 2021 2022 2021-2022 Travel Industry Earnings ($MIllion) 64.7 68.7 77.8 78.2 84.5 72.8 83.1 78.3 94.4 144.5 Accom. & Food Serv. 53.0% p 13.9 14.2 16.7 14.3 13.9 9.6 10.3 5.9 10.5 11.1 Arts, Ent. & Rec. 5.8% p 10.7 11.5 12.5 12.7 13.8 13.0 13.4 13.2 13.6 13.3 Retail** -1.9% q 4.1 4.5 5.0 5.4 6.1 7.8 8.7 2.9 1.8 1.3 Ground Tran. -29.0% q 0.1 0.1 0.1 0.2 0.2 0.2 0.2 0.2 0.3 0.2 Other Travel* -13.8% q 93.6 TOTAL 99.1 112.1 110.7 118.5 103.3 115.6 100.4 120.6 170.5 41.4% p Travel Industry Employment (Jobs) 2,960 2,990 3,120 2,880 3,080 2,680 2,850 2,760 3,040 4,240 Accom. & Food Serv. 39.7% p 750 840 900 860 760 580 690 440 880 1,030 Arts, Ent. & Rec. 17.5% p 360 400 410 400 410 390 380 340 340 320 Retail** -5.9% q 110 120 130 130 130 150 170 140 80 70 Ground Tran. -17.7% q <10 <10 <10 <10 <10 <10 <10 <10 10 <10 Other Travel* -7.8% q 4,180 TOTAL 4,370 4,570 4,270 4,390 3,810 4,100 3,680 4,350 5,670 30.4% p
Direct Travel Impacts 2013-2022p
The Economic Impact of Travel in California / 2022p / Prepared by Dean Runyan Associates 160
Mariposa County / Detail Trend
Direct Travel Impacts 2013-2022p
Details may not add to totals due to rounding. Percent change calculated on unrounded figures.
Local tax receipts include transient occupancy taxes, sales taxes, and airport passenger facility charges paid by visitors, and the property tax payments and sales tax payments attributable to the travel industry income of employees and businesses. State tax receipts include sales tax payments and motor fuel tax payments of visitors, and the income tax payments and sales tax payments attributable to the travel industry income of employees and businesses.
Economic impacts are attributed to visitor trips which are defined as trips taken by individuals that stay overnight away from home, or travel more than 50 miles one-way on a non-routine trip, as defined by the California Tourism Marketing Act
2013 2014 2015 2016 2017 2018 2019 2020 2021 2022 2021-2022 Tax Receipts Generated by Travel Spending ($Millions) 17.4 18.7 20.6 21.0 21.7 20.0 21.8 15.7 21.0 25.3 Local Tax Receipts 20.8% p 12.4 13.2 14.0 13.5 13.4 12.6 13.7 9.0 10.6 10.8 State Tax Receipts 1.8% p 29.8 TOTAL 31.9 34.5 34.5 35.2 32.6 35.4 24.6 31.6 36.1 14.4% p Local Tax Receipts Generated by Travel Spending ($Millions) 14.2 15.4 16.9 17.5 18.1 16.8 18.2 11.5 16.0 18.8 Visitor 17.6% p 3.2 3.3 3.7 3.5 3.6 3.2 3.6 4.1 5.0 6.5 Business or Employee 31.0% p 17.4 TOTAL 18.7 20.6 21.0 21.7 20.0 21.8 15.7 21.0 25.3 20.8% p State Tax Receipts Generated by Travel Spending ($Millions) 9.0 9.5 9.9 9.6 9.6 9.4 10.1 5.1 5.9 5.5 Visitor -7.5% q 3.5 3.7 4.1 3.9 3.8 3.2 3.5 3.8 4.7 5.3 Business or Employee 13.6% p 12.4 TOTAL 13.2 14.0 13.5 13.4 12.6 13.7 9.0 10.6 10.8 1.8% p
The Economic Impact of Travel in California / 2022p / Prepared by Dean Runyan Associates 161
Mendocino County / Detail Trend
Details may not add to totals due to rounding. Percent change calculated on unrounded figures.
*Other Travel includes ground transportation and air travel impacts for travel to other California visitor destinations, travel arrangement services and convention/trade shows services.
Economic impacts are attributed to visitor trips which are defined as trips taken by individuals that stay overnight away from home, or travel more than 50 miles one-way on a non-routine trip, as defined by the California Tourism Marketing Act
Direct Travel Impacts 2013-2022p 2013 2014 2015 2016 2017 2018 2019 2020 2021 2022 2021-2022 Direct Travel Spending ($Million) 349.0 365.9 384.3 421.8 451.6 435.2 466.8 294.1 496.7 455.0 Destination Spending -8.4% q 16.1 16.2 14.4 12.8 14.4 16.5 17.2 6.2 9.9 14.0 Other Travel* 41.2% p 365.1 TOTAL 382.1 398.7 434.6 465.9 451.7 484.0 300.2 506.5 468.9 -7.4% q Visitor Spending by Type of Traveler Accommodation ($Million) 200.1 214.6 233.7 267.2 289.3 267.4 286.3 188.6 337.4 249.5 Hotel, Motel, STVR -26.1% q 46.3 46.6 43.6 44.1 46.8 49.0 54.2 17.8 54.7 60.2 Private Home 10.1% p 40.0 40.8 41.5 41.9 44.0 46.2 49.8 41.8 52.1 66.8 Campground 28.1% p 13.5 13.7 14.1 14.4 15.2 16.6 17.0 28.1 25.1 31.5 2nd Home 25.3% p 49.1 50.2 51.4 54.1 56.2 56.1 59.5 17.7 27.3 47.0 Day Travel 72.3% p 349.0 TOTAL 365.9 384.3 421.8 451.6 435.2 466.8 294.1 496.7 455.0 -8.4% q Visitor Spending by Commodity Purchased ($Million) 85.1 93.9 104.2 121.4 130.6 123.0 134.3 109.2 170.2 156.9 Accommodations -7.8% q 103.5 106.9 114.8 127.7 136.4 130.1 139.0 80.2 144.2 121.1 Food Service -16.0% q 20.8 21.4 22.4 23.0 23.3 22.8 24.1 16.2 27.9 32.2 Food Stores 15.4% p 45.4 46.8 43.8 42.2 47.1 50.0 53.4 25.0 44.3 48.2 Local Tran. & Gas 8.8% p 52.5 54.3 56.9 61.9 64.5 60.4 62.8 35.1 59.3 50.2 Arts, Ent. & Rec. -15.3% q 41.6 42.7 42.1 45.5 49.6 48.9 53.2 28.4 50.8 46.4 Retail Sales -8.7% q 349.0 TOTAL 365.9 384.3 421.8 451.6 435.2 466.8 294.1 496.7 455.0 -8.4% q
The Economic Impact of Travel in California / 2022p / Prepared
Runyan Associates 162
by Dean
Mendocino County / Detail Trend
Direct Travel Impacts 2013-2022p
Details may not add to totals due to rounding. Percent change calculated on unrounded figures.
*Other Travel includes ground transportation and air travel impacts for travel to other California visitor destinations, travel arrangement services and convention/trade shows services.
**Retail includes gasoline station employment and earnings.
Economic impacts are attributed to visitor trips which are defined as trips taken by individuals that stay overnight away from home, or travel more than 50 miles one-way on a non-routine trip, as defined by the California Tourism Marketing Act
2013 2014 2015 2016 2017 2018 2019 2020 2021 2022 2021-2022 Travel Industry Earnings ($MIllion) 111.8 120.7 129.0 149.2 162.1 161.8 177.8 136.6 169.5 187.5 Accom. & Food Serv. 10.6% p 33.7 36.9 34.4 35.6 37.8 26.5 28.4 15.9 18.5 24.5 Arts, Ent. & Rec. 32.4% p 9.4 9.9 10.2 11.1 11.6 11.3 12.0 12.5 13.5 14.5 Retail** 7.4% p 4.0 4.2 4.6 5.4 6.4 8.4 9.3 3.6 3.7 2.9 Ground Tran. -23.6% q 0.8 0.8 0.9 1.0 1.1 1.2 1.2 1.0 1.0 1.5 Other Travel* 48.8% p 159.7 TOTAL 172.5 179.1 202.3 219.0 209.1 228.6 169.5 206.3 230.8 11.9% p Travel Industry Employment (Jobs) 3,490 3,560 3,560 3,880 4,120 3,920 4,160 3,210 3,610 3,930 Accom. & Food Serv. 8.9% p 2,430 2,670 2,480 2,680 2,590 1,740 1,700 860 970 1,290 Arts, Ent. & Rec. 33.5% p 300 310 310 320 330 310 320 310 320 330 Retail** 3.4% p 110 110 120 130 140 160 180 170 180 160 Ground Tran. -11.4% q 20 30 30 30 30 30 30 20 20 30 Other Travel* 41.6% p 6,360 TOTAL 6,690 6,490 7,040 7,200 6,170 6,400 4,570 5,100 5,740 12.6% p
The Economic Impact of Travel in California / 2022p / Prepared by Dean Runyan Associates 163
Mendocino County / Detail Trend
Direct Travel Impacts 2013-2022p
Details may not add to totals due to rounding. Percent change calculated on unrounded figures.
Local tax receipts include transient occupancy taxes, sales taxes, and airport passenger facility charges paid by visitors, and the property tax payments and sales tax payments attributable to the travel industry income of employees and businesses. State tax receipts include sales tax payments and motor fuel tax payments of visitors, and the income tax payments and sales tax payments attributable to the travel industry income of employees and businesses.
Economic impacts are attributed to visitor trips which are defined as trips taken by individuals that stay overnight away from home, or travel more than 50 miles one-way on a non-routine trip, as defined by the California Tourism Marketing Act
2013 2014 2015 2016 2017 2018 2019 2020 2021 2022 2021-2022 Tax Receipts Generated by Travel Spending ($Millions) 15.0 16.2 17.5 18.5 20.1 22.3 24.3 19.6 28.8 26.5 Local Tax Receipts -8.1% q 18.6 19.5 19.5 20.3 20.9 20.5 22.2 14.7 21.9 20.8 State Tax Receipts -5.1% q 33.6 TOTAL 35.7 37.0 38.8 41.0 42.7 46.4 34.3 50.7 47.3 -6.8% q Local Tax Receipts Generated by Travel Spending ($Millions) 9.7 10.6 11.6 12.2 13.5 15.6 17.0 12.4 20.0 17.9 Visitor -10.3% q 5.4 5.7 5.8 6.3 6.6 6.7 7.3 7.2 8.8 8.5 Business or Employee -3.2% q 15.0 TOTAL 16.2 17.5 18.5 20.1 22.3 24.3 19.6 28.8 26.5 -8.1% q State Tax Receipts Generated by Travel Spending ($Millions) 13.2 13.7 13.6 14.0 14.6 15.2 16.4 9.1 14.9 13.9 Visitor -6.7% q 5.4 5.8 5.9 6.3 6.3 5.3 5.8 5.5 7.0 6.9 Business or Employee -1.9% q 18.6 TOTAL 19.5 19.5 20.3 20.9 20.5 22.2 14.7 21.9 20.8 -5.1% q
The Economic Impact of Travel in California / 2022p / Prepared by
Runyan Associates 164
Dean
Merced County / Detail Trend
Details may not add to totals due to rounding. Percent change calculated on unrounded figures.
*Other Travel includes ground transportation and air travel impacts for travel to other California visitor destinations, travel arrangement services and convention/trade shows services.
Economic impacts are attributed to visitor trips which are defined as trips taken by individuals that stay overnight away from home, or travel more than 50 miles one-way on a non-routine trip, as defined by the California Tourism Marketing Act
Direct Travel Impacts 2013-2022p 2013 2014 2015 2016 2017 2018 2019 2020 2021 2022 2021-2022 Direct Travel Spending ($Million) 198.0 217.8 219.4 209.5 228.7 246.1 259.9 134.9 216.4 268.0 Destination Spending 23.8% p 46.2 46.5 41.3 36.3 41.5 50.1 51.4 17.4 28.9 40.9 Other Travel* 41.5% p 244.2 TOTAL 264.3 260.7 245.8 270.2 296.2 311.3 152.3 245.3 308.9 25.9% p Visitor Spending by Type of Traveler Accommodation ($Million) 53.9 69.8 76.3 72.7 77.5 82.3 87.2 79.0 86.8 89.4 Hotel, Motel, STVR 3.0% p 77.2 78.0 73.8 69.8 79.7 88.1 94.3 25.5 87.5 105.0 Private Home 20.0% p 6.9 7.2 7.3 7.4 7.8 8.2 8.8 7.4 9.2 11.8 Campground 28.1% p 15.3 15.7 15.3 15.6 16.4 17.5 17.9 12.0 10.8 16.7 2nd Home 54.0% p 44.7 47.1 46.7 44.1 47.3 50.1 51.8 10.9 22.1 45.1 Day Travel 104.0% p 198.0 TOTAL 217.8 219.4 209.5 228.7 246.1 259.9 134.9 216.4 268.0 23.8% p Visitor Spending by Commodity Purchased ($Million) 28.9 36.2 40.1 39.9 42.3 44.6 47.3 36.8 43.5 48.3 Accommodations 10.9% p 53.3 58.0 61.2 60.6 64.6 67.8 71.2 40.1 65.5 79.6 Food Service 21.5% p 11.5 12.2 12.5 12.1 12.5 12.7 13.0 6.8 13.0 16.7 Food Stores 28.3% p 53.2 55.6 50.4 43.9 49.7 56.7 58.9 16.3 35.6 51.1 Local Tran. & Gas 43.6% p 25.5 27.8 28.7 27.8 29.0 29.7 30.4 16.7 25.5 30.5 Arts, Ent. & Rec. 19.5% p 25.6 27.9 26.4 25.3 29.9 34.1 38.7 17.9 32.7 41.8 Retail Sales 27.6% p 198.0 TOTAL 217.8 219.4 209.5 228.0 245.5 259.6 134.6 215.9 268.0 24.1% p
The Economic Impact of Travel in California / 2022p / Prepared by Dean Runyan Associates 165
Merced County / Detail Trend
Direct Travel Impacts 2013-2022p
Details may not add to totals due to rounding. Percent change calculated on unrounded figures.
*Other Travel includes ground transportation and air travel impacts for travel to other California visitor destinations, travel arrangement services and convention/trade shows services.
**Retail includes gasoline station employment and earnings.
Economic impacts are attributed to visitor trips which are defined as trips taken by individuals that stay overnight away from home, or travel more than 50 miles one-way on a non-routine trip, as defined by the California Tourism Marketing Act
2013 2014 2015 2016 2017 2018 2019 2020 2021 2022 2021-2022 Travel Industry Earnings ($MIllion) 31.5 38.6 43.2 44.4 46.6 49.7 53.0 48.9 58.1 65.8 Accom. & Food Serv. 13.1% p 16.4 19.2 18.7 18.5 19.7 20.9 20.8 10.8 16.0 30.1 Arts, Ent. & Rec. 88.9% p 6.1 6.7 6.8 6.8 7.4 7.8 8.4 8.6 9.8 11.0 Retail** 12.2% p 3.7 4.0 4.2 4.4 5.3 7.5 8.1 2.5 3.0 3.2 Ground Tran. 7.5% p 1.3 1.5 1.6 1.8 2.3 3.5 3.7 3.7 3.4 3.1 Other Travel* -10.6% q 59.0 TOTAL 70.0 74.5 75.9 81.3 89.3 94.0 74.6 90.4 113.3 25.3% p Travel Industry Employment (Jobs) 1,330 1,530 1,610 1,550 1,570 1,580 1,630 1,480 1,620 1,770 Accom. & Food Serv. 9.7% p 1,080 1,240 1,130 1,080 1,140 1,090 1,060 560 770 1,320 Arts, Ent. & Rec. 71.7% p 220 250 240 230 240 250 260 240 260 280 Retail** 5.1% p 100 110 110 110 110 150 160 120 140 180 Ground Tran. 24.6% p 50 60 60 70 70 80 80 90 70 80 Other Travel* 0.7% p 2,790 TOTAL 3,190 3,150 3,030 3,140 3,150 3,190 2,490 2,870 3,630 26.5% p
The Economic Impact of Travel in California / 2022p / Prepared by Dean Runyan Associates 166
Merced County / Detail Trend
Direct Travel Impacts 2013-2022p
Details may not add to totals due to rounding. Percent change calculated on unrounded figures.
Local tax receipts include transient occupancy taxes, sales taxes, and airport passenger facility charges paid by visitors, and the property tax payments and sales tax payments attributable to the travel industry income of employees and businesses. State tax receipts include sales tax payments and motor fuel tax payments of visitors, and the income tax payments and sales tax payments attributable to the travel industry income of employees and businesses.
Economic impacts are attributed to visitor trips which are defined as trips taken by individuals that stay overnight away from home, or travel more than 50 miles one-way on a non-routine trip, as defined by the California Tourism Marketing Act
2013 2014 2015 2016 2017 2018 2019 2020 2021 2022 2021-2022 Tax Receipts Generated by Travel Spending ($Millions) 4.8 5.8 6.3 6.2 7.2 8.1 8.6 7.1 9.4 10.2 Local Tax Receipts 8.9% p 15.7 16.9 16.1 14.7 15.5 18.6 19.8 10.0 14.9 18.1 State Tax Receipts 21.5% p 20.5 TOTAL 22.8 22.4 20.9 22.7 26.7 28.5 17.1 24.2 28.3 16.7% p Local Tax Receipts Generated by Travel Spending ($Millions) 2.9 3.6 3.9 3.9 4.7 5.3 5.7 4.0 5.4 6.1 Visitor 11.6% p 1.9 2.2 2.4 2.3 2.6 2.8 3.0 3.2 3.9 4.1 Business or Employee 5.1% p 4.8 TOTAL 5.8 6.3 6.2 7.2 8.1 8.6 7.1 9.4 10.2 8.9% p State Tax Receipts Generated by Travel Spending ($Millions) 13.5 14.4 13.4 12.2 13.0 16.1 17.2 7.4 11.6 14.4 Visitor 24.6% p 2.2 2.6 2.7 2.6 2.5 2.5 2.6 2.6 3.3 3.6 Business or Employee 10.8% p 15.7 TOTAL 16.9 16.1 14.7 15.5 18.6 19.8 10.0 14.9 18.1 21.5% p
The Economic Impact of Travel in California / 2022p / Prepared by Dean Runyan Associates 167
Modoc County / Detail Trend
Details may not add to totals due to rounding. Percent change calculated on unrounded figures.
*Other Travel includes ground transportation and air travel impacts for travel to other California visitor destinations, travel arrangement services and convention/trade shows services.
Economic impacts are attributed to visitor trips which are defined as trips taken by individuals that stay overnight away from home, or travel more than 50 miles one-way on a non-routine trip, as defined by the California Tourism Marketing Act
Travel Impacts
2013 2014 2015 2016 2017 2018 2019 2020 2021 2022 2021-2022 Direct Travel Spending ($Million) 21.6 22.6 22.7 23.1 24.6 25.7 27.9 20.4 24.4 26.1 Destination Spending 7.1% p 1.6 1.6 1.4 1.2 1.3 1.5 1.6 0.5 0.9 1.3 Other Travel* 42.3% p 23.2 TOTAL 24.2 24.0 24.3 25.9 27.3 29.5 21.0 25.3 27.4 8.4% p Visitor Spending by Type of Traveler Accommodation ($Million) 6.3 6.8 7.3 7.7 8.2 8.5 9.5 9.4 8.5 6.3 Hotel, Motel, STVR -25.6% q 4.6 4.7 4.3 4.2 4.6 4.9 5.3 1.8 5.4 5.9 Private Home 10.2% p 3.9 4.1 4.1 4.1 4.3 4.5 4.9 4.1 5.1 6.6 Campground 28.1% p 1.3 1.3 1.4 1.4 1.5 1.6 1.7 2.6 2.4 2.6 2nd Home 11.4% p 5.5 5.7 5.7 5.7 6.0 6.2 6.6 2.5 3.0 4.6 Day Travel 55.3% p 21.6 TOTAL 22.6 22.7 23.1 24.6 25.7 27.9 20.4 24.4 26.1 7.1% p Visitor Spending by Commodity Purchased ($Million) 3.5 3.8 4.1 4.4 4.7 4.9 5.4 6.2 5.3 5.3 Accommodations 0.6% p 6.4 6.7 6.9 7.2 7.6 7.9 8.5 5.8 7.6 7.6 Food Service 1.2% p 1.8 1.9 2.0 2.0 2.0 2.0 2.1 1.5 2.3 2.8 Food Stores 23.0% p 3.6 3.7 3.4 3.1 3.4 3.9 4.1 2.1 3.0 3.8 Local Tran. & Gas 26.9% p 3.5 3.6 3.6 3.7 3.8 3.9 4.1 2.6 3.3 3.3 Arts, Ent. & Rec. 1.6% p 2.8 2.9 2.7 2.7 3.0 3.3 3.7 2.2 3.0 3.3 Retail Sales 7.7% p 21.6 TOTAL 22.6 22.7 23.1 24.6 25.7 27.9 20.4 24.4 26.1 7.1% p
Direct
2013-2022p
The Economic Impact of Travel in California / 2022p / Prepared
Runyan Associates 168
by Dean
Modoc County / Detail Trend
Details may not add to totals due to rounding. Percent change calculated on unrounded figures.
*Other Travel includes ground transportation and air travel impacts for travel to other California visitor destinations, travel arrangement services and convention/trade shows services.
**Retail includes gasoline station employment and earnings.
Economic impacts are attributed to visitor trips which are defined as trips taken by individuals that stay overnight away from home, or travel more than 50 miles one-way on a non-routine trip, as defined by the California Tourism Marketing Act
Travel Impacts
2013 2014 2015 2016 2017 2018 2019 2020 2021 2022 2021-2022 Travel Industry Earnings ($MIllion) 6.8 6.8 6.7 7.4 7.9 7.7 8.7 9.0 9.2 10.0 Accom. & Food Serv. 8.6% p 1.0 0.9 0.9 0.9 1.0 1.0 1.1 0.9 0.9 1.0 Arts, Ent. & Rec. 8.0% p 0.9 1.0 1.0 1.0 1.0 1.0 1.1 1.3 1.2 1.2 Retail** -1.0% q 0.3 0.3 0.3 0.3 0.4 0.6 0.6 0.3 0.2 0.2 Ground Tran. -7.8% q 0.1 0.1 0.1 0.1 0.1 0.1 0.1 0.1 0.1 0.1 Other Travel* 13.6% p 9.1 TOTAL 9.1 8.9 9.8 10.4 10.4 11.6 11.5 11.6 12.4 7.3% p Travel Industry Employment (Jobs) 260 240 220 220 220 210 230 220 230 240 Accom. & Food Serv. 4.3% p 50 40 40 30 30 30 30 30 30 30 Arts, Ent. & Rec. 2.9% p 30 40 30 30 30 30 30 30 30 30 Retail** -7.1% q <10 <10 <10 <10 <10 10 10 10 10 10 Ground Tran. 6.9% p <10 <10 <10 <10 <10 <10 <10 <10 <10 <10 Other Travel* 3.3% p 350 TOTAL 320 290 290 300 290 310 300 300 310 3.0% p
Direct
2013-2022p
The Economic Impact of Travel in California / 2022p / Prepared by Dean Runyan Associates 169
Modoc County / Detail Trend
Direct Travel Impacts 2013-2022p
Details may not add to totals due to rounding. Percent change calculated on unrounded figures.
Local tax receipts include transient occupancy taxes, sales taxes, and airport passenger facility charges paid by visitors, and the property tax payments and sales tax payments attributable to the travel industry income of employees and businesses. State tax receipts include sales tax payments and motor fuel tax payments of visitors, and the income tax payments and sales tax payments attributable to the travel industry income of employees and businesses.
Economic impacts are attributed to visitor trips which are defined as trips taken by individuals that stay overnight away from home, or travel more than 50 miles one-way on a non-routine trip, as defined by the California Tourism Marketing Act
2013 2014 2015 2016 2017 2018 2019 2020 2021 2022 2021-2022 Tax Receipts Generated by Travel Spending ($Millions) 0.6 0.6 0.6 0.7 0.7 0.7 0.8 0.9 0.9 0.9 Local Tax Receipts -3.5% q 1.3 1.3 1.3 1.3 1.3 1.4 1.5 1.2 1.4 1.4 State Tax Receipts 5.5% p 1.9 TOTAL 2.0 1.9 1.9 2.0 2.2 2.4 2.1 2.3 2.3 1.9% p Local Tax Receipts Generated by Travel Spending ($Millions) 0.3 0.3 0.3 0.4 0.4 0.4 0.5 0.5 0.4 0.5 Visitor 0.2% p 0.3 0.3 0.3 0.3 0.3 0.3 0.3 0.5 0.5 0.4 Business or Employee -7.1% q 0.6 TOTAL 0.6 0.6 0.7 0.7 0.7 0.8 0.9 0.9 0.9 -3.5% q State Tax Receipts Generated by Travel Spending ($Millions) 1.0 1.0 1.0 0.9 1.0 1.1 1.2 0.7 0.9 1.0 Visitor 9.5% p 0.3 0.3 0.3 0.3 0.3 0.3 0.3 0.4 0.4 0.4 Business or Employee -3.3% q 1.3 TOTAL 1.3 1.3 1.3 1.3 1.4 1.5 1.2 1.4 1.4 5.5% p
The Economic Impact of Travel in California / 2022p / Prepared by Dean Runyan Associates 170
Mono County / Detail Trend
Details may not add to totals due to rounding. Percent change calculated on unrounded figures.
*Other Travel includes ground transportation and air travel impacts for travel to other California visitor destinations, travel arrangement services and convention/trade shows services.
Economic impacts are attributed to visitor trips which are defined as trips taken by individuals that stay overnight away from home, or travel more than 50 miles one-way on a non-routine trip, as defined by the California Tourism Marketing Act
Travel Impacts 2013-2022p 2013 2014 2015 2016 2017 2018 2019 2020 2021 2022 2021-2022 Direct Travel Spending ($Million) 470.8 471.5 492.4 545.9 612.9 622.3 667.4 435.4 506.1 580.6 Destination Spending 14.7% p 2.9 2.9 2.6 2.4 2.9 3.4 3.6 1.5 2.2 3.1 Other Travel* 40.5% p 473.6 TOTAL 474.4 495.0 548.3 615.8 625.7 671.0 436.9 508.3 583.7 14.8% p Visitor Spending by Type of Traveler Accommodation ($Million) 358.1 359.2 379.7 429.9 487.5 490.0 529.3 317.5 379.2 424.8 Hotel, Motel, STVR 12.0% p 8.7 8.4 7.7 7.8 9.7 10.3 10.0 3.1 8.6 9.5 Private Home 10.3% p 32.6 32.4 32.1 32.5 34.1 35.8 38.6 32.4 40.4 51.9 Campground 28.3% p 39.0 39.3 40.2 40.9 43.7 47.7 48.9 66.8 59.8 58.8 2nd Home -1.6% q 32.3 32.2 32.6 34.8 37.8 38.5 40.5 15.6 18.1 35.6 Day Travel 97.0% p 470.8 TOTAL 471.5 492.4 545.9 612.9 622.3 667.4 435.4 506.1 580.6 14.7% p Visitor Spending by Commodity Purchased ($Million) 153.7 154.1 165.6 188.9 214.2 212.6 234.4 175.7 257.1 306.3 Accommodations 19.1% p 133.7 133.9 141.8 159.9 178.1 181.5 194.5 118.9 108.1 114.4 Food Service 5.8% p 17.0 17.1 17.6 18.4 19.3 19.3 20.4 14.8 27.2 32.8 Food Stores 20.9% p 49.5 49.7 46.4 46.0 53.3 58.9 62.6 32.2 33.0 40.7 Local Tran. & Gas 23.3% p 67.2 67.4 69.6 76.7 83.2 82.9 86.5 52.3 44.8 46.8 Arts, Ent. & Rec. 4.5% p 49.7 49.4 51.3 56.0 62.2 64.5 67.4 40.7 35.9 39.5 Retail Sales 10.0% p 470.8 TOTAL 471.5 492.4 545.9 610.2 619.7 665.7 434.6 506.1 580.6 14.7% p
Direct
The Economic Impact of Travel in California / 2022p / Prepared by Dean Runyan Associates 171
Mono County / Detail Trend
Details may not add to totals due to rounding. Percent change calculated on unrounded figures.
*Other Travel includes ground transportation and air travel impacts for travel to other California visitor destinations, travel arrangement services and convention/trade shows services.
**Retail includes gasoline station employment and earnings.
Economic impacts are attributed to visitor trips which are defined as trips taken by individuals that stay overnight away from home, or travel more than 50 miles one-way on a non-routine trip, as defined by the California Tourism Marketing Act
2013 2014 2015 2016 2017 2018 2019 2020 2021 2022 2021-2022 Travel Industry Earnings ($MIllion) 72.2 71.1 75.2 87.9 106.6 108.3 121.4 84.2 116.1 147.8 Accom. & Food Serv. 27.3% p 28.3 37.2 42.0 44.0 43.5 48.8 51.7 39.5 40.7 56.2 Arts, Ent. & Rec. 37.9% p 10.1 10.3 10.9 12.1 13.4 13.6 13.7 13.7 15.2 16.6 Retail** 9.4% p 5.3 5.4 5.7 6.8 8.5 11.8 13.1 5.2 2.4 2.2 Ground Tran. -9.5% q 0.2 0.3 0.3 0.3 0.8 1.0 1.4 0.9 0.4 0.5 Other Travel* 26.1% p 116.1 TOTAL 124.3 134.1 151.0 172.8 183.5 201.3 143.5 174.9 223.3 27.7% p Travel Industry Employment (Jobs) 2,390 2,230 2,270 2,420 2,720 2,840 3,090 2,160 2,920 3,470 Accom. & Food Serv. 18.9% p 1,310 1,720 2,160 2,250 2,250 2,340 2,280 1,560 1,620 2,040 Arts, Ent. & Rec. 25.3% p 330 350 350 350 350 370 360 330 360 360 Retail** 0.9% p 150 150 150 160 180 230 260 250 110 120 Ground Tran. 4.9% p <10 <10 <10 10 20 20 20 10 10 10 Other Travel* 17.6% p 4,180 TOTAL 4,450 4,930 5,200 5,520 5,790 6,010 4,320 5,030 6,000 19.4% p
Direct Travel Impacts 2013-2022p
The Economic Impact of Travel in California / 2022p / Prepared by Dean Runyan Associates 172
Mono County / Detail Trend
Direct Travel Impacts 2013-2022p
Details may not add to totals due to rounding. Percent change calculated on unrounded figures.
Local tax receipts include transient occupancy taxes, sales taxes, and airport passenger facility charges paid by visitors, and the property tax payments and sales tax payments attributable to the travel industry income of employees and businesses. State tax receipts include sales tax payments and motor fuel tax payments of visitors, and the income tax payments and sales tax payments attributable to the travel industry income of employees and businesses.
Economic impacts are attributed to visitor trips which are defined as trips taken by individuals that stay overnight away from home, or travel more than 50 miles one-way on a non-routine trip, as defined by the California Tourism Marketing Act
2013 2014 2015 2016 2017 2018 2019 2020 2021 2022 2021-2022 Tax Receipts Generated by Travel Spending ($Millions) 26.2 26.3 28.7 32.8 37.0 37.6 41.4 30.0 37.1 44.2 Local Tax Receipts 19.2% p 15.3 15.7 15.9 16.9 18.3 19.3 20.8 15.0 15.2 16.9 State Tax Receipts 11.1% p 41.5 TOTAL 42.0 44.6 49.7 55.3 56.8 62.3 45.0 52.3 61.1 16.8% p Local Tax Receipts Generated by Travel Spending ($Millions) 22.2 22.2 24.3 28.0 31.6 31.7 35.0 23.8 29.9 36.2 Visitor 21.3% p 3.9 4.1 4.4 4.8 5.4 5.8 6.4 6.1 7.2 8.0 Business or Employee 10.7% p 26.2 TOTAL 26.3 28.7 32.8 37.0 37.6 41.4 30.0 37.1 44.2 19.2% p State Tax Receipts Generated by Travel Spending ($Millions) 11.1 11.2 11.1 11.8 12.8 13.8 14.8 9.2 8.6 9.4 Visitor 8.9% p 4.3 4.5 4.8 5.1 5.6 5.5 6.0 5.8 6.6 7.5 Business or Employee 13.9% p 15.3 TOTAL 15.7 15.9 16.9 18.3 19.3 20.8 15.0 15.2 16.9 11.1% p
The Economic Impact of Travel in California / 2022p / Prepared by Dean Runyan Associates 173
Monterey County / Detail Trend
Details may not add to totals due to rounding. Percent change calculated on unrounded figures.
*Other Travel includes ground transportation and air travel impacts for travel to other California visitor destinations, travel arrangement services and convention/trade shows services.
Economic impacts are attributed to visitor trips which are defined as trips taken by individuals that stay overnight away from home, or travel more than 50 miles one-way on a non-routine trip, as defined by the California Tourism Marketing Act
2013 2014 2015 2016 2017 2018 2019 2020 2021 2022 2021-2022 Direct Travel Spending ($Million) 2,395 2,501 2,610 2,674 2,726 3,030 3,128 1,512 2,658 2,954 Destination Spending 11.1% p 100 101 92 85 95 105 113 43 68 100 Other Travel* 47.9% p 2,495 TOTAL 2,602 2,702 2,759 2,820 3,136 3,241 1,555 2,726 3,054 12.1% p Visitor Spending by Type of Traveler Accommodation ($Million) 1,705 1,797 1,893 1,952 1,964 2,214 2,281 1,145 2,090 2,169 Hotel, Motel, STVR 3.8% p 154 154 158 157 173 191 205 71 197 220 Private Home 11.8% p 38 41 41 42 44 46 50 41 52 66 Campground 28.1% p 56 57 58 58 63 72 73 101 90 92 2nd Home 2.3% p 442 452 460 465 482 508 519 153 230 406 Day Travel 76.8% p 2,395 TOTAL 2,501 2,610 2,674 2,726 3,030 3,128 1,512 2,658 2,954 11.1% p Visitor Spending by Commodity Purchased ($Million) 582 634 684 712 716 835 879 449 897 1,078 Accommodations 20.3% p 734 757 800 837 859 939 967 485 796 813 Food Service 2.1% p 67 70 73 73 73 76 78 43 70 83 Food Stores 19.0% p 233 240 224 208 224 261 267 103 186 222 Local Tran. & Gas 19.3% p 336 346 358 367 368 393 394 184 300 300 Arts, Ent. & Rec. -0.2% q 426 437 454 459 469 509 520 241 394 426 Retail Sales 8.3% p 17 17 18 18 17 18 24 7 15 32 Visitor Air Tran. 105.9% p 2,395 TOTAL 2,501 2,610 2,674 2,726 3,030 3,128 1,512 2,658 2,954 11.1% p
Direct Travel Impacts 2013-2022p
The Economic Impact of Travel in California / 2022p / Prepared
Runyan Associates 174
by Dean
Monterey County / Detail Trend
Direct Travel Impacts 2013-2022p
Details may not add to totals due to rounding. Percent change calculated on unrounded figures.
*Other Travel includes ground transportation and air travel impacts for travel to other California visitor destinations, travel arrangement services and convention/trade shows services.
**Retail includes gasoline station employment and earnings.
Economic impacts are attributed to visitor trips which are defined as trips taken by individuals that stay overnight away from home, or travel more than
miles one-way on a non-routine trip, as defined by the California Tourism Marketing Act
2013 2014 2015 2016 2017 2018 2019 2020 2021 2022 2021-2022 Travel Industry Earnings ($MIllion) 524 559 590 637 656 744 786 561 674 866 Accom. & Food Serv. 28.5% p 346 365 386 388 397 439 455 349 374 465 Arts, Ent. & Rec. 24.3% p 67 70 75 77 76 85 86 87 97 101 Retail** 3.6% p 23 24 26 28 32 46 49 18 19 17 Ground Tran. -10.9% q 13 13 16 16 16 18 20 19 1 2 Visitor Air Tran. 10.2% p 17 18 19 20 21 22 24 22 8 9 Other Travel* 14.9% p 989 TOTAL 1,050 1,111 1,166 1,199 1,354 1,420 1,056 1,174 1,460 24.3% p Travel Industry Employment (Jobs) 15,740 16,160 16,270 16,780 16,620 17,940 18,160 13,350 14,600 17,210 Accom. & Food Serv. 17.8% p 4,500 4,660 4,710 4,770 4,670 5,070 5,360 3,750 4,020 4,950 Arts, Ent. & Rec. 23.2% p 2,080 2,130 2,170 2,200 2,090 2,270 2,220 2,090 2,180 2,170 Retail** -0.5% q 620 630 640 660 670 900 980 760 800 810 Ground Tran. 0.7% p 110 110 130 130 130 140 140 120 20 20 Visitor Air Tran. 3.8% p 270 280 290 310 320 320 310 270 190 200 Other Travel* 9.3% p 23,310 TOTAL 23,970 24,210 24,860 24,500 26,630 27,160 20,340 21,820 25,370 16.3% p
50
The Economic Impact of Travel in California / 2022p / Prepared by Dean Runyan Associates 175
Monterey County / Detail Trend
Direct Travel Impacts 2013-2022p
Details may not add to totals due to rounding. Percent change calculated on unrounded figures.
Local tax receipts include transient occupancy taxes, sales taxes, and airport passenger facility charges paid by visitors, and the property tax payments and sales tax payments attributable to the travel industry income of employees and businesses. State tax receipts include sales tax payments and motor fuel tax payments of visitors, and the income tax payments and sales tax payments attributable to the travel industry income of employees and businesses.
Economic impacts are attributed to visitor trips which are defined as trips taken by individuals that stay overnight away from home, or travel more than 50 miles one-way on a non-routine trip, as defined by the California Tourism Marketing Act
2013 2014 2015 2016 2017 2018 2019 2020 2021 2022 2021-2022 Tax Receipts Generated by Travel Spending ($Millions) 100 106 113 117 125 146 154 97 153 176 Local Tax Receipts 14.8% p 123 129 131 130 126 139 144 86 122 131 State Tax Receipts 8.0% p 223 TOTAL 235 244 247 251 285 298 183 275 307 11.8% p Local Tax Receipts Generated by Travel Spending ($Millions) 67 73 78 82 88 104 109 54 105 124 Visitor 18.0% p 32 33 35 35 37 42 44 43 49 52 Business or Employee 7.8% p 100 TOTAL 106 113 117 125 146 154 97 153 176 14.8% p State Tax Receipts Generated by Travel Spending ($Millions) 89 92 92 92 92 103 106 51 80 86 Visitor 6.8% p 35 37 38 38 34 36 38 35 41 46 Business or Employee 10.4% p 123 TOTAL 129 131 130 126 139 144 86 122 131 8.0% p
The Economic Impact of Travel in California / 2022p / Prepared by Dean Runyan Associates 176
Napa County / Detail Trend
Direct Travel Impacts 2013-2022p
Details may not add to totals due to rounding. Percent change calculated on unrounded figures.
*Other Travel includes ground transportation and air travel impacts for travel to other California visitor destinations, travel arrangement services and convention/trade shows services.
Economic impacts are attributed to visitor trips which are defined as trips taken by individuals that stay overnight away from home, or travel more than 50 miles one-way on a non-routine trip, as defined by the California Tourism Marketing Act
2013 2014 2015 2016 2017 2018 2019 2020 2021 2022 2021-2022 Direct Travel Spending ($Million) 1,291 1,367 1,432 1,568 1,597 1,722 1,784 959 1,329 1,640 Destination Spending 23.3% p 43 45 43 62 62 71 71 30 38 62 Other Travel* 61.5% p 1,334 TOTAL 1,412 1,475 1,629 1,659 1,793 1,855 989 1,368 1,701 24.4% p Visitor Spending by Type of Traveler Accommodation ($Million) 912 975 1,033 1,149 1,164 1,287 1,335 746 1,031 1,218 Hotel, Motel, STVR 18.2% p 32 32 30 31 32 35 37 11 39 39 Private Home -0.7% q 14 16 16 16 17 17 19 16 20 25 Campground 28.0% p 19 19 21 21 22 25 26 46 41 45 2nd Home 10.4% p 315 325 332 351 362 358 368 140 199 312 Day Travel 57.0% p 1,291 TOTAL 1,367 1,432 1,568 1,597 1,722 1,784 959 1,329 1,640 23.3% p Visitor Spending by Commodity Purchased ($Million) 354 393 427 485 489 546 572 281 481 629 Accommodations 30.8% p 351 365 385 426 440 473 494 293 362 420 Food Service 16.1% p 35 37 38 40 40 41 43 24 35 44 Food Stores 25.4% p 76 80 75 74 80 91 95 45 63 82 Local Tran. & Gas 29.7% p 238 248 255 276 279 290 295 161 195 228 Arts, Ent. & Rec. 16.9% p 237 245 250 267 269 280 285 154 193 237 Retail Sales 22.3% p 1,291 TOTAL 1,367 1,432 1,568 1,597 1,722 1,784 959 1,329 1,640 23.3% p
The Economic Impact of Travel in California / 2022p / Prepared by Dean Runyan Associates 177
Napa County / Detail Trend
Direct Travel Impacts 2013-2022p
Details may not add to totals due to rounding. Percent change calculated on unrounded figures.
*Other Travel includes ground transportation and air travel impacts for travel to other California visitor destinations, travel arrangement services and convention/trade shows services.
**Retail includes gasoline station employment and earnings. Economic impacts are attributed to visitor trips which are defined as trips taken by individuals that stay overnight away from home, or travel more than 50 miles one-way on a non-routine trip, as defined by the California Tourism Marketing Act
2013 2014 2015 2016 2017 2018 2019 2020 2021 2022 2021-2022 Travel Industry Earnings ($MIllion) 349 389 416 465 483 544 580 379 470 627 Accom. & Food Serv. 33.5% p 108 115 111 127 149 170 186 122 135 176 Arts, Ent. & Rec. 30.5% p 35 37 39 42 42 42 43 44 46 49 Retail** 6.0% p 10 10 11 13 15 22 23 9 7 7 Ground Tran. -2.9% q 6 7 8 14 14 16 16 11 8 12 Other Travel* 41.6% p 508 TOTAL 559 585 661 702 793 848 566 666 870 30.7% p Travel Industry Employment (Jobs) 8,560 9,370 9,500 9,880 9,910 10,490 10,650 7,050 7,970 9,910 Accom. & Food Serv. 24.3% p 5,000 5,210 4,840 5,210 5,960 6,370 6,440 4,030 4,570 6,530 Arts, Ent. & Rec. 43.0% p 1,020 1,090 1,080 1,160 1,120 1,130 1,100 1,090 1,040 1,060 Retail** 1.7% p 270 280 280 310 310 420 470 430 340 380 Ground Tran. 12.6% p 140 160 150 210 210 200 200 130 120 170 Other Travel* 44.1% p 14,990 TOTAL 16,100 15,860 16,760 17,510 18,610 18,850 12,730 14,030 18,050 28.6% p
The Economic Impact of Travel in California / 2022p / Prepared by Dean Runyan Associates 178
Napa County / Detail Trend
Direct Travel Impacts 2013-2022p
Details may not add to totals due to rounding. Percent change calculated on unrounded figures.
Local tax receipts include transient occupancy taxes, sales taxes, and airport passenger facility charges paid by visitors, and the property tax payments and sales tax payments attributable to the travel industry income of employees and businesses. State tax receipts include sales tax payments and motor fuel tax payments of visitors, and the income tax payments and sales tax payments attributable to the travel industry income of employees and businesses.
Economic impacts are attributed to visitor trips which are defined as trips taken by individuals that stay overnight away from home, or travel more than 50 miles one-way on a non-routine trip, as defined by the California Tourism Marketing Act
2013 2014 2015 2016 2017 2018 2019 2020 2021 2022 2021-2022 Tax Receipts Generated by Travel Spending ($Millions) 69 75 80 89 87 98 103 63 92 115 Local Tax Receipts 24.8% p 57 61 62 66 65 69 73 48 58 69 State Tax Receipts 18.2% p 126 TOTAL 136 142 155 152 167 176 111 150 184 22.3% p Local Tax Receipts Generated by Travel Spending ($Millions) 51 56 61 68 66 73 77 40 64 84 Visitor 29.6% p 17 19 19 21 22 25 26 23 28 31 Business or Employee 13.5% p 69 TOTAL 75 80 89 87 98 103 63 92 115 24.8% p State Tax Receipts Generated by Travel Spending ($Millions) 40 41 42 44 44 47 49 28 34 41 Visitor 18.9% p 18 19 20 21 21 22 23 20 24 28 Business or Employee 17.3% p 57 TOTAL 61 62 66 65 69 73 48 58 69 18.2% p
The Economic Impact of Travel in California / 2022p / Prepared by Dean Runyan Associates 179
Nevada County / Detail Trend
Details may not add to totals due to rounding. Percent change calculated on unrounded figures.
*Other Travel includes ground transportation and air travel impacts for travel to other California visitor destinations, travel arrangement services and convention/trade shows services.
Economic impacts are attributed to visitor trips which are defined as trips taken by individuals that stay overnight away from home, or travel more than 50 miles one-way on a non-routine trip, as defined by the California Tourism Marketing Act
Impacts
2013 2014 2015 2016 2017 2018 2019 2020 2021 2022 2021-2022 Direct Travel Spending ($Million) 276.2 288.4 303.1 325.2 347.6 370.0 395.8 259.0 348.8 404.9 Destination Spending 16.1% p 19.7 17.3 15.3 13.4 15.1 17.5 18.3 6.2 10.3 14.7 Other Travel* 42.3% p 295.9 TOTAL 305.7 318.4 338.6 362.6 387.6 414.1 265.2 359.1 419.6 16.8% p Visitor Spending by Type of Traveler Accommodation ($Million) 89.9 99.7 115.3 134.1 146.7 155.4 169.5 93.8 140.4 152.4 Hotel, Motel, STVR 8.6% p 54.3 54.8 51.3 51.3 54.7 59.2 63.8 21.0 64.4 70.9 Private Home 10.2% p 26.3 26.5 26.3 26.6 27.9 29.3 31.6 26.5 33.1 42.4 Campground 28.2% p 43.2 43.8 45.4 46.2 49.0 53.5 54.8 86.2 77.1 71.9 2nd Home -6.7% q 62.5 63.5 64.8 67.0 69.1 72.6 76.1 31.4 33.8 67.2 Day Travel 98.9% p 276.2 TOTAL 288.4 303.1 325.2 347.6 370.0 395.8 259.0 348.8 404.9 16.1% p Visitor Spending by Commodity Purchased ($Million) 53.1 58.2 65.6 74.2 80.5 83.9 91.1 73.8 122.3 136.5 Accommodations 11.7% p 85.6 88.5 95.8 105.0 110.8 116.5 124.5 79.1 93.3 106.3 Food Service 14.0% p 17.9 18.4 19.0 19.3 19.5 19.8 20.7 13.5 24.4 30.0 Food Stores 22.7% p 38.9 39.9 37.1 35.1 38.9 44.4 47.1 22.0 28.8 38.9 Local Tran. & Gas 35.1% p 46.5 48.0 50.5 54.1 55.6 57.1 59.4 38.0 41.2 46.8 Arts, Ent. & Rec. 13.7% p 34.3 35.4 35.1 37.4 42.3 48.5 53.1 32.6 38.8 46.4 Retail Sales 19.4% p 276.2 TOTAL 288.4 303.1 325.2 347.6 370.0 395.8 259.0 348.8 404.9 16.1% p
Direct Travel
2013-2022p
The Economic Impact of Travel in California / 2022p / Prepared
Runyan Associates 180
by Dean
Nevada County / Detail Trend
Direct Travel Impacts 2013-2022p
Details may not add to totals due to rounding. Percent change calculated on unrounded figures.
*Other Travel includes ground transportation and air travel impacts for travel to other California visitor destinations, travel arrangement services and convention/trade shows services.
**Retail includes gasoline station employment and earnings.
Economic impacts are attributed to visitor trips which are defined as trips taken by individuals that stay overnight away from home, or travel more than 50 miles one-way on a non-routine trip, as defined by the California Tourism Marketing Act
2013 2014 2015 2016 2017 2018 2019 2020 2021 2022 2021-2022 Travel Industry Earnings ($MIllion) 68.8 79.1 84.0 95.2 103.1 113.6 124.4 99.9 111.1 134.0 Accom. & Food Serv. 20.7% p 22.6 17.5 16.6 18.6 21.2 21.1 22.6 21.9 23.3 28.3 Arts, Ent. & Rec. 21.6% p 8.1 8.5 8.8 9.5 10.0 10.9 11.5 12.5 13.7 14.4 Retail** 5.0% p 3.0 3.2 3.5 4.0 4.7 6.8 7.5 3.1 2.1 2.1 Ground Tran. -0.7% q 1.5 0.6 0.6 0.7 0.7 0.8 0.8 0.7 0.7 1.0 Other Travel* 37.2% p 104.0 TOTAL 108.9 113.4 128.0 139.8 153.1 166.8 138.2 150.9 179.9 19.2% p Travel Industry Employment (Jobs) 1,960 2,200 2,170 2,280 2,430 2,580 2,690 2,150 2,180 2,480 Accom. & Food Serv. 13.8% p 1,060 820 740 770 840 820 850 750 730 860 Arts, Ent. & Rec. 17.6% p 270 270 270 280 290 310 310 310 320 320 Retail** 0.3% p 80 90 90 100 100 130 150 150 100 110 Ground Tran. 15.1% p 40 20 20 20 20 20 20 20 20 20 Other Travel* 25.5% p 3,410 TOTAL 3,390 3,290 3,450 3,680 3,860 4,020 3,370 3,350 3,800 13.4% p
The Economic Impact of Travel in California / 2022p / Prepared by Dean Runyan Associates 181
Nevada County / Detail Trend
Direct Travel Impacts 2013-2022p
Details may not add to totals due to rounding. Percent change calculated on unrounded figures.
Local tax receipts include transient occupancy taxes, sales taxes, and airport passenger facility charges paid by visitors, and the property tax payments and sales tax payments attributable to the travel industry income of employees and businesses. State tax receipts include sales tax payments and motor fuel tax payments of visitors, and the income tax payments and sales tax payments attributable to the travel industry income of employees and businesses.
Economic impacts are attributed to visitor trips which are defined as trips taken by individuals that stay overnight away from home, or travel more than 50 miles one-way on a non-routine trip, as defined by the California Tourism Marketing Act
2013 2014 2015 2016 2017 2018 2019 2020 2021 2022 2021-2022 Tax Receipts Generated by Travel Spending ($Millions) 8.6 9.2 10.1 11.3 12.7 14.2 15.5 12.4 18.0 20.0 Local Tax Receipts 11.3% p 15.2 15.7 15.7 16.1 16.5 18.4 19.8 13.7 15.9 18.3 State Tax Receipts 14.7% p 23.8 TOTAL 25.0 25.7 27.3 29.2 32.5 35.3 26.1 33.9 38.3 12.9% p Local Tax Receipts Generated by Travel Spending ($Millions) 5.0 5.6 6.3 7.2 8.3 9.3 10.1 6.5 11.6 13.4 Visitor 15.7% p 3.5 3.6 3.8 4.1 4.4 4.9 5.3 5.9 6.4 6.7 Business or Employee 3.3% p 8.6 TOTAL 9.2 10.1 11.3 12.7 14.2 15.5 12.4 18.0 20.0 11.3% p State Tax Receipts Generated by Travel Spending ($Millions) 11.6 12.0 11.9 12.0 12.5 14.4 15.5 9.1 10.8 12.7 Visitor 18.0% p 3.6 3.7 3.8 4.0 4.0 4.0 4.3 4.6 5.1 5.5 Business or Employee 7.7% p 15.2 TOTAL 15.7 15.7 16.1 16.5 18.4 19.8 13.7 15.9 18.3 14.7% p
The Economic Impact of Travel in California / 2022p / Prepared by Dean Runyan Associates 182
Orange County / Detail Trend
Details may not add to totals due to rounding. Percent change calculated on unrounded figures.
*Other Travel includes ground transportation and air travel impacts for travel to other California visitor destinations, travel arrangement services and convention/trade shows services.
Economic impacts are attributed to visitor trips which are defined as trips taken by individuals that stay overnight away from home, or travel more than 50 miles one-way on a non-routine trip, as defined by the California Tourism Marketing Act
2013 2014 2015 2016 2017 2018 2019 2020 2021 2022 2021-2022 Direct Travel Spending ($Million) 9,655 10,397 11,229 11,964 12,252 12,186 12,673 5,920 9,796 13,174 Destination Spending 34.5% p 1,371 1,485 1,467 1,512 1,564 1,736 1,789 883 1,034 1,592 Other Travel* 53.9% p 11,026 TOTAL 11,883 12,696 13,477 13,815 13,922 14,463 6,803 10,830 14,766 36.3% p Visitor Spending by Type of Traveler Accommodation ($Million) 6,288 6,996 7,709 8,343 8,415 7,943 8,207 3,597 6,194 8,500 Hotel, Motel, STVR 37.2% p 1,263 1,375 1,452 1,477 1,641 1,848 2,013 950 1,992 2,303 Private Home 15.6% p 63 43 45 47 48 145 156 136 166 210 Campground 26.8% p 240 272 265 272 289 316 322 637 560 539 2nd Home -3.7% q 1,800 1,712 1,757 1,825 1,860 1,934 1,975 600 884 1,622 Day Travel 83.5% p 9,655 TOTAL 10,397 11,229 11,964 12,252 12,186 12,673 5,920 9,796 13,174 34.5% p Visitor Spending by Commodity Purchased ($Million) 2,075 2,259 2,489 2,710 2,717 2,984 3,101 1,335 2,433 3,718 Accommodations 52.8% p 2,665 2,872 3,085 3,342 3,445 3,248 3,385 1,677 2,620 3,334 Food Service 27.3% p 348 386 405 414 412 441 451 276 445 558 Food Stores 25.2% p 358 300 305 304 319 322 330 121 276 392 Local Tran. & Gas 42.2% p 2,413 2,627 2,798 2,957 2,979 2,794 2,831 1,348 2,049 2,548 Arts, Ent. & Rec. 24.3% p 1,452 1,589 1,756 1,844 1,992 1,975 2,159 1,042 1,764 2,160 Retail Sales 22.4% p 343 366 390 393 389 421 418 119 208 465 Visitor Air Tran. 123.5% p 9,655 TOTAL 10,397 11,229 11,964 12,252 12,186 12,673 5,920 9,796 13,174 34.5% p
Direct Travel Impacts 2013-2022p
The Economic Impact of Travel in California / 2022p / Prepared by Dean Runyan Associates 183
Orange County / Detail Trend
Details may not add to totals due to rounding. Percent change calculated on unrounded figures.
*Other Travel includes ground transportation and air travel impacts for travel to other California visitor destinations, travel arrangement services and convention/trade shows services.
**Retail includes gasoline station employment and earnings.
Economic impacts are attributed to visitor trips which are defined as trips taken by individuals that stay overnight away from home, or travel more than 50 miles one-way on a non-routine trip, as defined by the California Tourism Marketing Act
2013 2014 2015 2016 2017 2018 2019 2020 2021 2022 2021-2022 Travel Industry Earnings ($MIllion) 1,869 1,984 2,176 2,422 2,510 2,594 2,749 2,016 2,472 3,210 Accom. & Food Serv. 29.9% p 1,365 1,562 1,713 1,900 2,065 1,926 1,973 1,098 1,375 1,827 Arts, Ent. & Rec. 32.8% p 222 245 275 292 302 301 315 314 351 367 Retail** 4.5% p 55 51 53 60 66 79 86 32 35 41 Ground Tran. 15.7% p 26 27 30 40 43 46 50 45 56 61 Visitor Air Tran. 9.6% p 236 274 288 338 348 379 392 322 275 339 Other Travel* 23.6% p 3,772 TOTAL 4,144 4,534 5,052 5,334 5,325 5,564 3,827 4,563 5,845 28.1% p Travel Industry Employment (Jobs) 57,480 60,020 62,540 66,580 67,180 65,570 66,920 50,020 56,200 65,820 Accom. & Food Serv. 17.1% p 37,430 41,200 44,990 47,550 48,110 48,970 49,410 26,940 30,690 45,290 Arts, Ent. & Rec. 47.6% p 6,440 6,910 7,490 7,750 7,930 7,690 7,750 7,220 7,470 7,430 Retail** -0.5% q 1,450 1,320 1,280 1,370 1,380 1,520 1,670 1,240 1,320 1,610 Ground Tran. 22.0% p 420 430 460 520 560 580 610 500 570 590 Visitor Air Tran. 3.2% p 4,580 5,220 5,200 5,760 5,940 6,080 6,010 4,740 3,530 4,220 Other Travel* 19.5% p 107,800 TOTAL 115,100 121,960 129,520 131,090 130,420 132,370 90,660 99,770 124,950 25.2% p
Direct Travel Impacts 2013-2022p
The Economic Impact of Travel in California / 2022p / Prepared by Dean Runyan Associates 184
Orange County / Detail Trend
Direct Travel Impacts 2013-2022p
Details may not add to totals due to rounding. Percent change calculated on unrounded figures.
Local tax receipts include transient occupancy taxes, sales taxes, and airport passenger facility charges paid by visitors, and the property tax payments and sales tax payments attributable to the travel industry income of employees and businesses. State tax receipts include sales tax payments and motor fuel tax payments of visitors, and the income tax payments and sales tax payments attributable to the travel industry income of employees and businesses.
Economic impacts are attributed to visitor trips which are defined as trips taken by individuals that stay overnight away from home, or travel more than 50 miles one-way on a non-routine trip, as defined by the California Tourism Marketing Act
2013 2014 2015 2016 2017 2018 2019 2020 2021 2022 2021-2022 Tax Receipts Generated by Travel Spending ($Millions) 440 476 521 566 578 619 644 355 546 744 Local Tax Receipts 36.3% p 437 467 494 514 515 504 532 315 447 547 State Tax Receipts 22.3% p 876 TOTAL 943 1,015 1,080 1,093 1,123 1,176 670 993 1,291 30.0% p Local Tax Receipts Generated by Travel Spending ($Millions) 310 337 371 405 414 453 471 198 356 533 Visitor 49.6% p 130 139 151 162 164 166 173 157 189 210 Business or Employee 11.2% p 440 TOTAL 476 521 566 578 619 644 355 546 744 36.3% p State Tax Receipts Generated by Travel Spending ($Millions) 304 321 337 348 354 354 375 180 282 354 Visitor 25.2% p 133 146 157 166 161 151 157 135 165 193 Business or Employee 17.2% p 437 TOTAL 467 494 514 515 504 532 315 447 547 22.3% p
The Economic Impact of Travel in California / 2022p / Prepared by Dean Runyan Associates 185
Placer County / Detail Trend
Direct Travel Impacts 2013-2022p
Details may not add to totals due to rounding. Percent change calculated on unrounded figures.
*Other Travel includes ground transportation and air travel impacts for travel to other California visitor destinations, travel arrangement services and convention/trade shows services.
Economic impacts are attributed to visitor trips which are defined as trips taken by individuals that stay overnight away from home, or travel more than 50 miles one-way on a non-routine trip, as defined by the California Tourism Marketing Act
2013 2014 2015 2016 2017 2018 2019 2020 2021 2022 2021-2022 Direct Travel Spending ($Million) 968 965 1,035 1,162 1,274 1,315 1,397 1,057 1,289 1,272 Destination Spending -1.3% q 69 70 64 62 75 87 93 36 54 76 Other Travel* 40.4% p 1,036 TOTAL 1,034 1,099 1,224 1,349 1,403 1,490 1,093 1,343 1,348 0.4% p Visitor Spending by Type of Traveler Accommodation ($Million) 547 543 605 718 804 813 866 727 816 721 Hotel, Motel, STVR -11.7% q 153 152 157 159 172 189 206 67 207 228 Private Home 10.1% p 29 30 30 30 32 33 36 30 38 48 Campground 28.1% p 109 111 109 110 116 122 125 170 151 154 2nd Home 1.6% p 130 129 135 144 150 158 165 63 78 122 Day Travel 57.3% p 968 TOTAL 965 1,035 1,162 1,274 1,315 1,397 1,057 1,289 1,272 -1.3% q Visitor Spending by Commodity Purchased ($Million) 217 223 251 297 334 337 362 360 398 448 Accommodations 12.4% p 288 284 312 357 388 398 423 303 380 336 Food Service -11.5% q 40 40 43 45 46 46 48 36 53 57 Food Stores 7.6% p 119 118 112 110 124 139 146 70 101 109 Local Tran. & Gas 7.6% p 183 181 193 214 226 227 235 174 204 178 Arts, Ent. & Rec. -12.5% q 121 119 124 139 156 167 182 113 153 144 Retail Sales -6.0% q 968 TOTAL 965 1,035 1,162 1,274 1,315 1,397 1,057 1,289 1,272 -1.3% q
The Economic Impact of Travel in California / 2022p / Prepared by Dean Runyan Associates 186
Placer County / Detail Trend
Direct Travel Impacts 2013-2022p
Details may not add to totals due to rounding. Percent change calculated on unrounded figures.
*Other Travel includes ground transportation and air travel impacts for travel to other California visitor destinations, travel arrangement services and convention/trade shows services.
**Retail includes gasoline station employment and earnings. Economic impacts are attributed to visitor trips which are defined as trips taken by individuals that stay overnight away from home, or travel more than 50 miles one-way on a non-routine trip, as defined by the California Tourism Marketing Act
2013 2014 2015 2016 2017 2018 2019 2020 2021 2022 2021-2022 Travel Industry Earnings ($MIllion) 185 183 197 244 272 285 310 261 310 378 Accom. & Food Serv. 22.0% p 97 93 94 96 112 117 124 102 129 182 Arts, Ent. & Rec. 41.6% p 22 22 24 27 29 31 32 36 39 40 Retail** 0.5% p 10 10 11 14 16 23 25 11 9 7 Ground Tran. -21.6% q 3 4 4 6 9 9 11 8 9 9 Other Travel* 6.3% p 317 TOTAL 312 331 387 439 465 502 419 496 616 24.3% p Travel Industry Employment (Jobs) 6,580 6,280 6,440 7,340 7,880 7,970 8,230 6,660 7,330 8,300 Accom. & Food Serv. 13.3% p 4,270 3,880 3,820 4,340 4,910 4,960 4,800 3,590 4,520 5,900 Arts, Ent. & Rec. 30.7% p 680 680 710 790 830 840 850 920 920 850 Retail** -8.0% q 280 280 290 320 350 450 500 530 430 390 Ground Tran. -9.1% q 100 100 120 160 210 220 240 200 210 190 Other Travel* -8.1% q 11,900 TOTAL 11,210 11,380 12,950 14,190 14,440 14,610 11,900 13,410 15,640 16.6% p
The Economic Impact of Travel in California / 2022p / Prepared by Dean Runyan Associates 187
Placer County / Detail Trend
Direct Travel Impacts 2013-2022p
Details may not add to totals due to rounding. Percent change calculated on unrounded figures.
Local tax receipts include transient occupancy taxes, sales taxes, and airport passenger facility charges paid by visitors, and the property tax payments and sales tax payments attributable to the travel industry income of employees and businesses. State tax receipts include sales tax payments and motor fuel tax payments of visitors, and the income tax payments and sales tax payments attributable to the travel industry income of employees and businesses.
Economic impacts are attributed to visitor trips which are defined as trips taken by individuals that stay overnight away from home, or travel more than 50 miles one-way on a non-routine trip, as defined by the California Tourism Marketing Act
2013 2014 2015 2016 2017 2018 2019 2020 2021 2022 2021-2022 Tax Receipts Generated by Travel Spending ($Millions) 30 30 33 38 43 45 49 47 55 60 Local Tax Receipts 9.0% p 50 50 51 54 58 63 67 49 60 60 State Tax Receipts 0.3% p 80 TOTAL 80 84 92 100 108 116 96 115 120 4.4% p Local Tax Receipts Generated by Travel Spending ($Millions) 19 20 22 26 30 32 34 31 35 39 Visitor 9.7% p 10 10 10 12 13 14 15 16 20 21 Business or Employee 7.7% p 30 TOTAL 30 33 38 43 45 49 47 55 60 9.0% p State Tax Receipts Generated by Travel Spending ($Millions) 38 38 39 41 43 49 52 32 41 39 Visitor -3.8% q 12 12 12 13 14 14 15 16 19 21 Business or Employee 8.8% p 50 TOTAL 50 51 54 58 63 67 49 60 60 0.3% p
The Economic Impact of Travel in California / 2022p / Prepared by Dean Runyan Associates 188
Plumas County / Detail Trend
Details may not add to totals due to rounding. Percent change calculated on unrounded figures.
*Other Travel includes ground transportation and air travel impacts for travel to other California visitor destinations, travel arrangement services and convention/trade shows services.
Economic impacts are attributed to visitor trips which are defined as trips taken by individuals that stay overnight away from home, or travel more than 50 miles one-way on a non-routine trip, as defined by the California Tourism Marketing Act
Travel Impacts 2013-2022p 2013 2014 2015 2016 2017 2018 2019 2020 2021 2022 2021-2022 Direct Travel Spending ($Million) 110.7 112.1 109.7 111.9 116.0 127.9 146.2 110.2 135.2 140.1 Destination Spending 3.7% p 3.3 3.3 2.8 2.5 2.8 3.3 3.4 1.2 1.9 2.8 Other Travel* 42.3% p 114.1 TOTAL 115.3 112.5 114.4 118.8 131.2 149.7 111.3 137.1 142.9 4.2% p Visitor Spending by Type of Traveler Accommodation ($Million) 42.3 42.3 43.5 47.4 47.3 49.0 61.6 39.7 55.3 41.2 Hotel, Motel, STVR -25.5% q 10.4 10.2 9.2 9.4 10.5 11.3 12.4 4.1 12.5 13.7 Private Home 10.1% p 19.3 20.8 20.6 20.8 21.8 22.9 24.7 20.7 25.9 33.2 Campground 28.2% p 21.4 21.2 21.7 22.1 23.5 25.6 26.2 37.8 33.9 36.7 2nd Home 8.3% p 17.4 17.6 14.6 12.2 12.8 19.1 21.2 7.8 7.6 15.3 Day Travel 101.1% p 110.7 TOTAL 112.1 109.7 111.9 116.0 127.9 146.2 110.2 135.2 140.1 3.7% p Visitor Spending by Commodity Purchased ($Million) 26.6 27.4 28.5 30.8 31.3 32.3 38.4 34.8 42.9 43.0 Accommodations 0.2% p 31.6 31.5 31.4 32.7 33.6 36.8 42.2 30.8 37.3 36.2 Food Service -3.0% q 7.8 8.2 8.2 8.3 8.4 8.7 9.4 7.3 10.4 12.7 Food Stores 22.1% p 15.9 16.2 14.1 12.7 13.9 16.8 18.7 10.4 13.7 17.0 Local Tran. & Gas 24.5% p 17.2 17.2 16.6 16.8 16.9 18.3 20.3 14.8 16.7 16.4 Arts, Ent. & Rec. -1.8% q 11.6 11.6 10.9 10.7 11.8 15.0 17.2 12.1 14.3 14.9 Retail Sales 4.4% p 110.7 TOTAL 112.1 109.7 111.9 116.0 127.9 146.2 110.2 135.2 140.1 3.7% p
Direct
The Economic Impact of Travel in California / 2022p / Prepared by Dean Runyan Associates 189
Plumas County / Detail Trend
Direct Travel Impacts 2013-2022p
Details may not add to totals due to rounding. Percent change calculated on unrounded figures.
*Other Travel includes ground transportation and air travel impacts for travel to other California visitor destinations, travel arrangement services and convention/trade shows services.
**Retail includes gasoline station employment and earnings.
Economic impacts are attributed to visitor trips which are defined as trips taken by individuals that stay overnight away from home, or travel more than 50 miles one-way on a non-routine trip, as defined by the California Tourism Marketing Act
2013 2014 2015 2016 2017 2018 2019 2020 2021 2022 2021-2022 Travel Industry Earnings ($MIllion) 25.6 26.2 26.9 29.6 31.8 35.7 42.4 32.8 36.1 45.4 Accom. & Food Serv. 25.6% p 5.3 5.4 5.3 5.4 3.9 3.9 4.4 4.0 4.2 5.5 Arts, Ent. & Rec. 30.7% p 3.1 3.2 3.2 3.2 3.6 4.1 4.4 4.9 4.9 5.3 Retail** 8.5% p 1.3 1.3 1.3 1.5 1.7 2.5 3.0 1.4 1.0 0.9 Ground Tran. -10.6% q 0.1 0.1 0.1 0.1 0.1 0.2 0.2 0.1 0.2 0.2 Other Travel* 33.9% p 35.3 TOTAL 36.2 36.9 39.8 41.2 46.4 54.3 43.2 46.4 57.3 23.5% p Travel Industry Employment (Jobs) 940 900 920 920 980 1,070 1,200 850 890 1,050 Accom. & Food Serv. 18.1% p 170 190 170 180 120 130 140 110 120 160 Arts, Ent. & Rec. 30.1% p 120 120 120 130 130 150 160 160 160 170 Retail** 5.9% p 40 40 30 40 40 50 60 70 50 50 Ground Tran. 3.7% p <10 <10 <10 <10 <10 <10 <10 <10 <10 <10 Other Travel* 21.7% p 1,280 TOTAL 1,250 1,250 1,260 1,280 1,400 1,560 1,200 1,230 1,440 17.1% p
The Economic Impact of Travel in California / 2022p / Prepared by Dean Runyan Associates 190
Plumas County / Detail Trend
Direct Travel Impacts 2013-2022p
Details may not add to totals due to rounding. Percent change calculated on unrounded figures.
Local tax receipts include transient occupancy taxes, sales taxes, and airport passenger facility charges paid by visitors, and the property tax payments and sales tax payments attributable to the travel industry income of employees and businesses. State tax receipts include sales tax payments and motor fuel tax payments of visitors, and the income tax payments and sales tax payments attributable to the travel industry income of employees and businesses.
Economic impacts are attributed to visitor trips which are defined as trips taken by individuals that stay overnight away from home, or travel more than 50 miles one-way on a non-routine trip, as defined by the California Tourism Marketing Act
2013 2014 2015 2016 2017 2018 2019 2020 2021 2022 2021-2022 Tax Receipts Generated by Travel Spending ($Millions) 3.1 3.2 3.3 3.5 3.5 4.0 4.8 4.1 5.1 5.1 Local Tax Receipts 0.9% p 5.3 5.4 5.1 5.0 5.1 5.9 6.8 5.2 6.0 6.4 State Tax Receipts 6.4% p 8.5 TOTAL 8.6 8.4 8.5 8.6 9.9 11.5 9.3 11.1 11.5 3.9% p Local Tax Receipts Generated by Travel Spending ($Millions) 2.0 2.0 2.1 2.3 2.3 2.6 3.2 2.4 3.3 3.2 Visitor -2.5% q 1.1 1.1 1.2 1.2 1.2 1.4 1.6 1.7 1.8 2.0 Business or Employee 7.0% p 3.1 TOTAL 3.2 3.3 3.5 3.5 4.0 4.8 4.1 5.1 5.1 0.9% p State Tax Receipts Generated by Travel Spending ($Millions) 4.1 4.1 3.8 3.7 3.8 4.6 5.2 3.6 4.2 4.4 Visitor 5.5% p 1.3 1.3 1.3 1.3 1.3 1.3 1.6 1.6 1.8 1.9 Business or Employee 8.3% p 5.3 TOTAL 5.4 5.1 5.0 5.1 5.9 6.8 5.2 6.0 6.4 6.4% p
The Economic Impact of Travel in California / 2022p / Prepared by Dean Runyan Associates 191
Riverside County / Detail Trend
Direct Travel Impacts 2013-2022p
Details may not add to totals due to rounding. Percent change calculated on unrounded figures.
*Other Travel includes ground transportation and air travel impacts for travel to other California visitor destinations, travel arrangement services and convention/trade shows services.
Economic impacts are attributed to visitor trips which are defined as trips taken by individuals that stay overnight away from home, or travel more than 50 miles one-way on a non-routine trip, as defined by the California Tourism Marketing Act
2013 2014 2015 2016 2017 2018 2019 2020 2021 2022 2021-2022 Direct Travel Spending ($Million) 6,244 6,392 6,689 7,028 7,423 8,020 8,391 6,216 6,456 8,104 Destination Spending 25.5% p 553 560 520 505 505 584 599 243 370 683 Other Travel* 84.7% p 6,797 TOTAL 6,952 7,209 7,533 7,929 8,604 8,991 6,459 6,826 8,788 28.7% p Visitor Spending by Type of Traveler Accommodation ($Million) 2,430 2,554 2,745 2,993 3,123 3,404 3,567 2,444 2,728 3,314 Hotel, Motel, STVR 21.5% p 824 835 863 885 976 1,079 1,170 824 1,153 1,292 Private Home 12.1% p 198 185 185 187 196 206 222 186 232 297 Campground 28.2% p 984 1,004 1,038 1,058 1,132 1,234 1,263 1,871 1,670 1,579 2nd Home -5.5% q 1,807 1,815 1,858 1,905 1,996 2,098 2,169 891 673 1,621 Day Travel 140.9% p 6,244 TOTAL 6,392 6,689 7,028 7,423 8,020 8,391 6,216 6,456 8,104 25.5% p Visitor Spending by Commodity Purchased ($Million) 1,069 1,148 1,244 1,371 1,427 1,531 1,584 1,329 1,740 2,088 Accommodations 20.0% p 1,996 2,019 2,149 2,293 2,414 2,574 2,704 2,120 1,980 2,405 Food Service 21.5% p 250 253 263 267 272 279 288 237 275 347 Food Stores 25.9% p 755 767 725 693 756 860 897 499 563 805 Local Tran. & Gas 42.9% p 1,076 1,089 1,132 1,185 1,218 1,269 1,299 971 883 1,043 Arts, Ent. & Rec. 18.1% p 1,013 1,019 1,076 1,114 1,224 1,384 1,473 1,004 934 1,246 Retail Sales 33.4% p 85 98 99 105 112 124 146 57 80 170 Visitor Air Tran. 112.5% p 6,244 TOTAL 6,392 6,689 7,028 7,423 8,020 8,391 6,216 6,456 8,104 25.5% p
The Economic Impact of Travel in California / 2022p / Prepared
Runyan Associates 192
by Dean
Riverside County / Detail Trend
Details may not add to totals due to rounding. Percent change calculated on unrounded figures.
*Other Travel includes ground transportation and air travel impacts for travel to other California visitor destinations, travel arrangement services and convention/trade shows services.
**Retail includes gasoline station employment and earnings.
Economic impacts are attributed to visitor trips which are defined as trips taken by individuals that stay overnight away from home, or travel more than 50 miles one-way on a non-routine trip, as defined by the California Tourism Marketing Act
2013 2014 2015 2016 2017 2018 2019 2020 2021 2022 2021-2022 Travel Industry Earnings ($MIllion) 1,026 1,104 1,201 1,343 1,433 1,557 1,664 1,341 1,625 1,947 Accom. & Food Serv. 19.8% p 459 497 512 557 584 630 665 496 648 741 Arts, Ent. & Rec. 14.4% p 165 170 183 193 202 221 230 239 260 280 Retail** 7.7% p 68 72 79 89 100 136 150 90 53 58 Ground Tran. 8.7% p 20 20 23 19 20 21 17 17 14 15 Visitor Air Tran. 2.3% p 78 79 84 98 74 79 77 62 72 113 Other Travel* 56.6% p 1,816 TOTAL 1,941 2,081 2,298 2,412 2,644 2,804 2,245 2,673 3,154 18.0% p Travel Industry Employment (Jobs) 41,730 43,670 45,450 47,770 49,180 51,170 52,510 43,060 47,870 53,930 Accom. & Food Serv. 12.7% p 17,620 18,720 19,070 19,790 20,130 21,530 22,370 15,710 19,730 22,250 Arts, Ent. & Rec. 12.8% p 5,660 5,770 5,930 6,060 6,230 6,630 6,700 6,480 6,550 6,680 Retail** 2.0% p 1,800 1,820 1,900 2,010 2,080 2,620 2,910 3,380 1,940 2,290 Ground Tran. 18.4% p 310 320 350 280 290 290 260 220 190 180 Visitor Air Tran. -3.7% q 1,430 1,550 1,570 1,990 1,830 1,950 1,860 1,400 1,590 2,000 Other Travel* 25.5% p 68,540 TOTAL 71,850 74,260 77,900 79,740 84,190 86,600 70,240 77,860 87,340 12.2% p
Direct Travel Impacts 2013-2022p
The Economic Impact of Travel in California / 2022p / Prepared by Dean Runyan Associates 193
Riverside County / Detail Trend
Direct Travel Impacts 2013-2022p
Details may not add to totals due to rounding. Percent change calculated on unrounded figures.
Local tax receipts include transient occupancy taxes, sales taxes, and airport passenger facility charges paid by visitors, and the property tax payments and sales tax payments attributable to the travel industry income of employees and businesses. State tax receipts include sales tax payments and motor fuel tax payments of visitors, and the income tax payments and sales tax payments attributable to the travel industry income of employees and businesses.
Economic impacts are attributed to visitor trips which are defined as trips taken by individuals that stay overnight away from home, or travel more than 50 miles one-way on a non-routine trip, as defined by the California Tourism Marketing Act
2013 2014 2015 2016 2017 2018 2019 2020 2021 2022 2021-2022 Tax Receipts Generated by Travel Spending ($Millions) 184 195 213 236 248 280 293 229 285 338 Local Tax Receipts 18.4% p 331 340 345 349 358 399 423 316 321 389 State Tax Receipts 21.1% p 515 TOTAL 535 558 585 606 679 716 545 607 727 19.9% p Local Tax Receipts Generated by Travel Spending ($Millions) 122 130 144 163 174 198 207 137 175 225 Visitor 28.6% p 62 65 69 73 74 82 87 92 110 113 Business or Employee 2.3% p 184 TOTAL 195 213 236 248 280 293 229 285 338 18.4% p State Tax Receipts Generated by Travel Spending ($Millions) 264 269 271 272 282 322 341 230 222 282 Visitor 26.7% p 66 71 74 78 76 78 82 86 99 108 Business or Employee 8.6% p 331 TOTAL 340 345 349 358 399 423 316 321 389 21.1% p
The Economic Impact of Travel in California / 2022p / Prepared
Associates 194
by Dean Runyan
Sacramento County / Detail Trend
Details may not add to totals due to rounding. Percent change calculated on unrounded figures.
*Other Travel includes ground transportation and air travel impacts for travel to other California visitor destinations, travel arrangement services and convention/trade shows services.
Economic impacts are attributed to visitor trips which are defined as trips taken by individuals that stay overnight away from home, or travel more than 50 miles one-way on a non-routine trip, as defined by the California Tourism Marketing Act
2013 2014 2015 2016 2017 2018 2019 2020 2021 2022 2021-2022 Direct Travel Spending ($Million) 2,617 2,728 2,814 2,869 3,045 3,297 3,481 1,472 2,432 2,988 Destination Spending 22.9% p 733 767 778 769 791 865 932 365 573 920 Other Travel* 60.6% p 3,350 TOTAL 3,495 3,592 3,638 3,836 4,162 4,413 1,837 3,005 3,908 30.1% p Visitor Spending by Type of Traveler Accommodation ($Million) 1,184 1,264 1,336 1,385 1,430 1,568 1,654 972 1,208 1,424 Hotel, Motel, STVR 17.9% p 698 712 719 722 799 876 946 277 809 896 Private Home 10.7% p 13 13 13 13 14 15 16 13 17 21 Campground 28.1% p 23 23 23 23 24 26 26 24 21 33 2nd Home 54.2% p 699 715 723 725 777 813 839 186 378 614 Day Travel 62.8% p 2,617 TOTAL 2,728 2,814 2,869 3,045 3,297 3,481 1,472 2,432 2,988 22.9% p Visitor Spending by Commodity Purchased ($Million) 293 326 359 384 412 459 483 279 355 429 Accommodations 20.8% p 716 736 775 808 853 914 960 425 721 829 Food Service 15.0% p 87 91 94 94 96 99 102 41 86 102 Food Stores 18.8% p 512 531 505 478 515 577 599 212 385 503 Local Tran. & Gas 30.8% p 425 437 450 460 474 496 507 215 359 401 Arts, Ent. & Rec. 11.9% p 335 344 354 358 400 444 491 186 351 415 Retail Sales 18.1% p 248 263 277 287 295 307 340 114 175 308 Visitor Air Tran. 75.6% p 2,617 TOTAL 2,728 2,814 2,869 3,045 3,297 3,481 1,472 2,432 2,988 22.9% p
Direct Travel Impacts 2013-2022p
The Economic Impact of Travel in California / 2022p / Prepared by Dean Runyan Associates 195
Sacramento County / Detail Trend
Direct Travel Impacts 2013-2022p
Details may not add to totals due to rounding. Percent change calculated on unrounded figures.
*Other Travel includes ground transportation and air travel impacts for travel to other California visitor destinations, travel arrangement services and convention/trade shows services.
**Retail includes gasoline station employment and earnings.
Economic impacts are attributed to visitor trips which are defined as trips taken by individuals that stay overnight away from home, or travel more than 50 miles one-way on a non-routine trip, as defined by the California Tourism Marketing Act
2013 2014 2015 2016 2017 2018 2019 2020 2021 2022 2021-2022 Travel Industry Earnings ($MIllion) 411 431 463 508 537 608 651 502 598 727 Accom. & Food Serv. 21.6% p 208 224 247 270 305 305 320 208 235 328 Arts, Ent. & Rec. 39.6% p 59 62 65 68 72 78 83 82 94 98 Retail** 4.9% p 49 54 59 64 69 88 97 47 50 56 Ground Tran. 11.8% p 20 21 23 19 18 19 19 19 24 25 Visitor Air Tran. 8.0% p 73 78 87 84 77 82 86 80 92 111 Other Travel* 20.8% p 821 TOTAL 869 944 1,013 1,080 1,180 1,256 939 1,092 1,346 23.2% p Travel Industry Employment (Jobs) 16,070 16,480 16,590 16,980 17,430 18,810 19,150 14,790 16,100 18,500 Accom. & Food Serv. 15.0% p 7,230 7,070 7,090 7,310 7,510 7,830 8,340 4,920 5,560 7,710 Arts, Ent. & Rec. 38.7% p 1,940 2,020 2,060 2,050 2,160 2,260 2,280 2,100 2,280 2,260 Retail** -1.0% q 1,240 1,280 1,350 1,380 1,400 1,670 1,840 1,300 1,390 1,550 Ground Tran. 11.7% p 340 350 370 330 310 310 340 300 350 360 Visitor Air Tran. 1.8% p 1,370 1,400 1,500 1,480 1,530 1,380 1,470 1,380 1,460 1,620 Other Travel* 10.6% p 28,180 TOTAL 28,610 28,970 29,520 30,340 32,270 33,430 24,800 27,140 32,000 17.9% p
The Economic Impact of Travel in California / 2022p / Prepared by Dean Runyan Associates 196
Sacramento County / Detail Trend
Direct Travel Impacts 2013-2022p
Details may not add to totals due to rounding. Percent change calculated on unrounded figures.
Local tax receipts include transient occupancy taxes, sales taxes, and airport passenger facility charges paid by visitors, and the property tax payments and sales tax payments attributable to the travel industry income of employees and businesses. State tax receipts include sales tax payments and motor fuel tax payments of visitors, and the income tax payments and sales tax payments attributable to the travel industry income of employees and businesses.
Economic impacts are attributed to visitor trips which are defined as trips taken by individuals that stay overnight away from home, or travel more than 50 miles one-way on a non-routine trip, as defined by the California Tourism Marketing Act
2013 2014 2015 2016 2017 2018 2019 2020 2021 2022 2021-2022 Tax Receipts Generated by Travel Spending ($Millions) 89 97 105 110 117 133 141 91 118 137 Local Tax Receipts 15.9% p 152 158 157 153 158 180 192 95 141 165 State Tax Receipts 17.2% p 241 TOTAL 255 262 264 275 313 333 187 259 302 16.6% p Local Tax Receipts Generated by Travel Spending ($Millions) 61 67 73 77 83 96 101 52 72 87 Visitor 21.8% p 28 30 32 33 34 37 40 40 46 49 Business or Employee 6.8% p 89 TOTAL 97 105 110 117 133 141 91 118 137 15.9% p State Tax Receipts Generated by Travel Spending ($Millions) 122 126 124 120 125 146 156 63 102 121 Visitor 18.8% p 30 31 33 34 33 34 36 32 39 44 Business or Employee 13.1% p 152 TOTAL 158 157 153 158 180 192 95 141 165 17.2% p
The Economic Impact of Travel in California / 2022p / Prepared by Dean Runyan Associates 197
San Benito County / Detail Trend
Details may not add to totals due to rounding. Percent change calculated on unrounded figures.
*Other Travel includes ground transportation and air travel impacts for travel to other California visitor destinations, travel arrangement services and convention/trade shows services.
Economic impacts are attributed to visitor trips which are defined as trips taken by individuals that stay overnight away from home, or travel more than 50 miles one-way on a non-routine trip, as defined by the California Tourism Marketing Act
Travel Impacts 2013-2022p 2013 2014 2015 2016 2017 2018 2019 2020 2021 2022 2021-2022 Direct Travel Spending ($Million) 79.4 83.4 83.6 87.2 98.3 108.6 114.1 60.6 110.9 131.5 Destination Spending 18.6% p 10.1 10.2 9.0 8.0 9.1 10.8 11.3 3.9 6.5 9.3 Other Travel* 42.3% p 89.5 TOTAL 93.6 92.7 95.2 107.4 119.5 125.4 64.5 117.4 140.8 19.9% p Visitor Spending by Type of Traveler Accommodation ($Million) 11.0 11.5 12.4 14.4 21.0 24.1 25.3 14.8 30.2 28.9 Hotel, Motel, STVR -4.4% q 29.2 29.6 28.1 28.8 31.2 34.8 36.4 13.3 38.4 41.6 Private Home 8.3% p 19.1 21.5 21.9 22.1 23.2 24.3 26.2 22.0 27.4 35.1 Campground 28.1% p 2.2 2.3 2.4 2.4 2.6 2.8 2.9 4.2 3.8 5.2 2nd Home 39.2% p 17.8 18.6 18.9 19.5 20.3 22.6 23.3 6.3 11.0 20.6 Day Travel 86.8% p 79.4 TOTAL 83.4 83.6 87.2 98.3 108.6 114.1 60.6 110.9 131.5 18.6% p Visitor Spending by Commodity Purchased ($Million) 8.3 9.3 10.0 11.1 13.6 15.0 15.9 11.5 19.1 22.7 Accommodations 18.9% p 24.5 25.3 26.7 28.8 32.0 34.9 36.3 18.3 36.0 40.6 Food Service 12.7% p 9.1 9.9 10.3 10.4 10.7 11.0 11.4 7.6 12.5 15.3 Food Stores 23.0% p 14.1 14.9 13.7 12.7 14.3 16.8 17.6 7.7 13.6 18.4 Local Tran. & Gas 35.7% p 12.8 13.3 13.7 14.5 15.6 16.7 16.9 8.2 15.0 17.1 Arts, Ent. & Rec. 13.7% p 10.4 10.8 9.3 9.8 12.0 14.3 16.1 7.2 14.7 17.4 Retail Sales 18.2% p 79.4 TOTAL 83.4 83.6 87.2 98.3 108.6 114.1 60.6 110.9 131.5 18.6% p
Direct
The Economic Impact of Travel in California / 2022p / Prepared
Runyan Associates 198
by Dean
San Benito County / Detail Trend
Details may not add to totals due to rounding. Percent change calculated on unrounded figures.
*Other Travel includes ground transportation and air travel impacts for travel to other California visitor destinations, travel arrangement services and convention/trade shows services.
**Retail includes gasoline station employment and earnings.
Economic impacts are attributed to visitor trips which are defined as trips taken by individuals that stay overnight away from home, or travel more than 50 miles one-way on a non-routine trip, as defined by the California Tourism Marketing Act
Impacts
2013 2014 2015 2016 2017 2018 2019 2020 2021 2022 2021-2022 Travel Industry Earnings ($MIllion) 15.7 16.3 19.2 22.7 26.4 30.1 32.4 31.5 38.8 45.9 Accom. & Food Serv. 18.3% p 3.4 3.6 3.6 3.6 3.4 2.4 2.7 1.8 2.0 1.9 Arts, Ent. & Rec. -5.1% q 2.7 2.9 2.8 3.0 1.4 1.4 1.6 1.7 1.9 2.8 Retail** 44.5% p 1.0 1.0 1.1 1.3 1.5 2.2 2.4 0.9 1.0 1.0 Ground Tran. 1.9% p 0.3 0.3 0.3 0.4 0.4 0.4 0.5 0.4 0.5 1.0 Other Travel* 94.9% p 23.0 TOTAL 24.1 27.0 30.9 33.1 36.6 39.6 36.3 44.1 52.5 18.9% p Travel Industry Employment (Jobs) 510 510 550 600 640 690 740 670 760 860 Accom. & Food Serv. 12.6% p 210 200 190 200 210 140 170 110 120 120 Arts, Ent. & Rec. -0.5% q 70 70 70 70 40 40 40 40 50 70 Retail** 43.7% p 30 30 30 30 30 40 50 40 50 60 Ground Tran. 18.1% p 10 10 20 20 20 20 20 20 20 30 Other Travel* 77.2% p 830 TOTAL 830 850 910 940 940 1,020 890 990 1,130 13.9% p
Direct Travel
2013-2022p
The Economic Impact of Travel in California / 2022p / Prepared
Runyan Associates 199
by Dean
San Benito County / Detail Trend
Direct Travel Impacts 2013-2022p
Details may not add to totals due to rounding. Percent change calculated on unrounded figures.
Local tax receipts include transient occupancy taxes, sales taxes, and airport passenger facility charges paid by visitors, and the property tax payments and sales tax payments attributable to the travel industry income of employees and businesses. State tax receipts include sales tax payments and motor fuel tax payments of visitors, and the income tax payments and sales tax payments attributable to the travel industry income of employees and businesses.
Economic impacts are attributed to visitor trips which are defined as trips taken by individuals that stay overnight away from home, or travel more than 50 miles one-way on a non-routine trip, as defined by the California Tourism Marketing Act
2013 2014 2015 2016 2017 2018 2019 2020 2021 2022 2021-2022 Tax Receipts Generated by Travel Spending ($Millions) 1.9 2.0 2.1 2.4 2.6 3.9 4.1 3.3 5.0 5.5 Local Tax Receipts 10.9% p 5.1 5.3 5.2 5.1 5.5 6.3 6.7 4.0 6.1 7.1 State Tax Receipts 15.6% p 6.9 TOTAL 7.3 7.3 7.5 8.1 10.2 10.9 7.3 11.1 12.6 13.5% p Local Tax Receipts Generated by Travel Spending ($Millions) 1.1 1.2 1.2 1.4 1.6 2.6 2.8 1.6 3.0 3.5 Visitor 16.2% p 0.8 0.8 0.9 1.0 1.0 1.2 1.3 1.6 2.0 2.1 Business or Employee 2.9% p 1.9 TOTAL 2.0 2.1 2.4 2.6 3.9 4.1 3.3 5.0 5.5 10.9% p State Tax Receipts Generated by Travel Spending ($Millions) 4.2 4.5 4.2 4.1 4.5 5.4 5.8 2.9 4.7 5.5 Visitor 17.8% p 0.8 0.9 0.9 1.0 1.0 0.9 1.0 1.1 1.4 1.5 Business or Employee 8.5% p 5.1 TOTAL 5.3 5.2 5.1 5.5 6.3 6.7 4.0 6.1 7.1 15.6% p
The Economic Impact of Travel in California / 2022p / Prepared
Runyan Associates 200
by Dean
San Bernardino County / Detail Trend
Details may not add to totals due to rounding. Percent change calculated on unrounded figures.
*Other Travel includes ground transportation and air travel impacts for travel to other California visitor destinations, travel arrangement services and convention/trade shows services.
Economic impacts are attributed to visitor trips which are defined as trips taken by individuals that stay overnight away from home, or travel more than 50 miles one-way on a non-routine trip, as defined by the California Tourism Marketing Act
2013 2014 2015 2016 2017 2018 2019 2020 2021 2022 2021-2022 Direct Travel Spending ($Million) 3,780 3,881 4,006 4,119 4,397 4,693 5,029 3,805 4,051 4,879 Destination Spending 20.4% p 571 585 552 524 578 650 688 283 430 670 Other Travel* 55.8% p 4,351 TOTAL 4,466 4,558 4,643 4,975 5,343 5,717 4,087 4,481 5,548 23.8% p Visitor Spending by Type of Traveler Accommodation ($Million) 1,182 1,250 1,336 1,418 1,532 1,607 1,772 1,300 1,558 1,702 Hotel, Motel, STVR 9.3% p 559 565 575 577 631 693 757 497 700 797 Private Home 13.8% p 142 143 143 145 152 159 172 144 179 230 Campground 28.1% p 815 827 851 867 921 1,004 1,028 1,395 1,246 1,252 2nd Home 0.5% p 1,081 1,095 1,102 1,112 1,160 1,229 1,300 469 368 898 Day Travel 143.9% p 3,780 TOTAL 3,881 4,006 4,119 4,397 4,693 5,029 3,805 4,051 4,879 20.4% p Visitor Spending by Commodity Purchased ($Million) 613 654 708 761 812 842 915 847 1,058 1,162 Accommodations 9.8% p 1,140 1,157 1,216 1,279 1,352 1,418 1,522 1,236 1,200 1,400 Food Service 16.7% p 155 159 164 165 167 170 179 150 179 223 Food Stores 24.0% p 601 616 576 544 596 665 710 378 440 615 Local Tran. & Gas 39.9% p 611 621 638 657 679 696 728 562 531 602 Arts, Ent. & Rec. 13.4% p 539 546 574 586 660 759 827 571 551 704 Retail Sales 27.7% p 122 128 131 127 132 143 149 61 92 173 Visitor Air Tran. 88.6% p 3,780 TOTAL 3,881 4,006 4,119 4,397 4,693 5,029 3,805 4,051 4,879 20.4% p
Direct Travel Impacts 2013-2022p
The Economic Impact of Travel in California / 2022p / Prepared by Dean Runyan Associates 201
San Bernardino County / Detail Trend
Details may not add to totals due to rounding. Percent change calculated on unrounded figures.
*Other Travel includes ground transportation and air travel impacts for travel to other California visitor destinations, travel arrangement services and convention/trade shows services.
**Retail includes gasoline station employment and earnings.
Economic impacts are attributed to visitor trips which are defined as trips taken by individuals that stay overnight away from home, or travel more than 50 miles one-way on a non-routine trip, as defined by the California Tourism Marketing Act
2013 2014 2015 2016 2017 2018 2019 2020 2021 2022 2021-2022 Travel Industry Earnings ($MIllion) 603 645 701 774 842 896 985 851 995 1,191 Accom. & Food Serv. 19.7% p 315 312 332 356 405 408 433 299 375 489 Arts, Ent. & Rec. 30.5% p 93 97 104 109 117 124 131 134 146 162 Retail** 11.2% p 52 55 60 66 75 97 110 70 45 47 Ground Tran. 3.4% p 45 9 11 13 11 12 10 9 24 26 Visitor Air Tran. 7.9% p 90 47 52 63 67 71 72 61 89 108 Other Travel* 21.7% p 1,198 TOTAL 1,164 1,261 1,382 1,517 1,608 1,741 1,425 1,673 2,023 20.9% p Travel Industry Employment (Jobs) 26,440 26,970 27,880 28,890 30,240 30,790 32,170 26,820 29,010 33,020 Accom. & Food Serv. 13.8% p 16,010 16,050 17,200 17,720 18,350 17,100 17,700 11,160 13,320 15,800 Arts, Ent. & Rec. 18.7% p 3,260 3,340 3,450 3,450 3,640 3,770 3,830 3,720 3,730 3,950 Retail** 5.7% p 1,340 1,370 1,420 1,470 1,540 1,850 2,110 2,400 1,470 1,690 Ground Tran. 14.8% p 640 150 190 210 200 200 170 150 230 240 Visitor Air Tran. 1.7% p 1,810 1,220 1,290 1,440 1,470 1,500 1,500 1,190 1,420 1,650 Other Travel* 16.1% p 49,490 TOTAL 49,100 51,430 53,180 55,430 55,230 57,490 45,440 49,190 56,340 14.5% p
Direct Travel Impacts 2013-2022p
The Economic Impact of Travel in California / 2022p / Prepared by Dean Runyan Associates 202
San Bernardino County / Detail Trend
Direct Travel Impacts 2013-2022p
Details may not add to totals due to rounding. Percent change calculated on unrounded figures.
Local tax receipts include transient occupancy taxes, sales taxes, and airport passenger facility charges paid by visitors, and the property tax payments and sales tax payments attributable to the travel industry income of employees and businesses. State tax receipts include sales tax payments and motor fuel tax payments of visitors, and the income tax payments and sales tax payments attributable to the travel industry income of employees and businesses.
Economic impacts are attributed to visitor trips which are defined as trips taken by individuals that stay overnight away from home, or travel more than 50 miles one-way on a non-routine trip, as defined by the California Tourism Marketing Act
2013 2014 2015 2016 2017 2018 2019 2020 2021 2022 2021-2022 Tax Receipts Generated by Travel Spending ($Millions) 101 103 111 118 127 140 153 132 164 183 Local Tax Receipts 11.5% p 220 224 223 220 230 258 279 203 212 254 State Tax Receipts 19.7% p 321 TOTAL 327 334 338 357 399 431 335 376 437 16.1% p Local Tax Receipts Generated by Travel Spending ($Millions) 60 64 69 74 81 91 99 74 95 111 Visitor 16.5% p 41 39 41 44 46 50 54 58 69 72 Business or Employee 4.7% p 101 TOTAL 103 111 118 127 140 153 132 164 183 11.5% p State Tax Receipts Generated by Travel Spending ($Millions) 177 181 178 174 182 211 228 149 150 185 Visitor 23.6% p 43 43 45 47 47 47 51 54 62 68 Business or Employee 10.2% p 220 TOTAL 224 223 220 230 258 279 203 212 254 19.7% p
The Economic Impact of Travel in California / 2022p / Prepared by Dean Runyan Associates 203
San Diego County / Detail Trend
Details may not add to totals due to rounding. Percent change calculated on unrounded figures.
*Other Travel includes ground transportation and air travel impacts for travel to other California visitor destinations, travel arrangement services and convention/trade shows services.
Economic impacts are attributed to visitor trips which are defined as trips taken by individuals that stay overnight away from home, or travel more than 50 miles one-way on a non-routine trip, as defined by the California Tourism Marketing Act
2013 2014 2015 2016 2017 2018 2019 2020 2021 2022 2021-2022 Direct Travel Spending ($Million) 10,167 10,542 10,839 11,466 12,062 11,854 11,859 4,989 9,004 11,393 Destination Spending 26.5% p 1,435 1,478 1,482 1,530 1,632 1,798 1,933 840 1,176 1,950 Other Travel* 65.9% p 11,602 TOTAL 12,020 12,321 12,996 13,694 13,652 13,792 5,828 10,180 13,344 31.1% p Visitor Spending by Type of Traveler Accommodation ($Million) 6,007 6,390 6,757 7,243 7,640 7,215 7,089 3,206 5,668 7,086 Hotel, Motel, STVR 25.0% p 1,182 1,223 1,218 1,249 1,356 1,485 1,594 492 1,420 1,717 Private Home 20.9% p 286 286 283 292 302 237 254 218 265 328 Campground 23.9% p 176 163 151 155 163 173 178 285 256 222 2nd Home -13.3% q 2,516 2,480 2,430 2,527 2,602 2,745 2,744 787 1,396 2,040 Day Travel 46.2% p 10,167 TOTAL 10,542 10,839 11,466 12,062 11,854 11,859 4,989 9,004 11,393 26.5% p Visitor Spending by Commodity Purchased ($Million) 2,446 2,675 2,908 3,146 3,288 3,588 3,472 1,729 3,026 4,315 Accommodations 42.6% p 2,767 2,843 2,907 3,136 3,330 3,045 3,080 1,337 2,374 2,558 Food Service 7.8% p 430 467 506 518 528 472 472 205 437 473 Food Stores 8.3% p 571 510 458 436 484 477 480 162 422 442 Local Tran. & Gas 4.7% p 1,633 1,613 1,584 1,672 1,729 1,610 1,588 589 1,010 1,151 Arts, Ent. & Rec. 14.0% p 1,636 1,687 1,686 1,757 1,873 1,788 1,837 684 1,270 1,473 Retail Sales 16.0% p 684 747 789 801 831 873 930 282 465 981 Visitor Air Tran. 110.9% p 10,167 TOTAL 10,542 10,839 11,466 12,062 11,854 11,859 4,989 9,004 11,393 26.5% p
Direct Travel Impacts 2013-2022p
The Economic Impact of Travel in California / 2022p / Prepared by Dean Runyan Associates 204
San Diego County / Detail Trend
Details may not add to totals due to rounding. Percent change calculated on unrounded figures.
*Other Travel includes ground transportation and air travel impacts for travel to other California visitor destinations, travel arrangement services and convention/trade shows services.
**Retail includes gasoline station employment and earnings.
Economic impacts are attributed to visitor trips which are defined as trips taken by individuals that stay overnight away from home, or travel more than 50 miles one-way on a non-routine trip, as defined by the California Tourism Marketing Act
2013 2014 2015 2016 2017 2018 2019 2020 2021 2022 2021-2022 Travel Industry Earnings ($MIllion) 2,085 2,198 2,326 2,635 2,823 2,704 2,769 1,958 2,344 3,112 Accom. & Food Serv. 32.8% p 828 818 878 908 891 859 872 519 600 818 Arts, Ent. & Rec. 36.2% p 261 275 288 304 313 291 293 299 323 344 Retail** 6.5% p 53 47 43 49 56 67 70 21 23 24 Ground Tran. 4.8% p 49 50 56 71 79 84 94 91 88 97 Visitor Air Tran. 9.8% p 174 174 195 249 269 295 331 278 272 339 Other Travel* 24.8% p 3,448 TOTAL 3,563 3,785 4,216 4,432 4,299 4,429 3,166 3,650 4,734 29.7% p Travel Industry Employment (Jobs) 63,210 64,230 64,410 68,900 69,940 64,480 63,520 45,740 50,160 60,640 Accom. & Food Serv. 20.9% p 23,860 23,210 22,690 24,320 24,830 22,600 21,490 13,330 15,780 19,970 Arts, Ent. & Rec. 26.5% p 8,490 8,750 8,790 9,050 9,090 8,240 8,130 7,620 7,770 7,750 Retail** -0.4% q 1,410 1,220 1,060 1,130 1,180 1,290 1,380 880 920 1,050 Ground Tran. 14.4% p 830 860 920 1,170 1,370 1,400 1,690 1,460 1,380 1,430 Visitor Air Tran. 3.4% p 3,560 3,390 3,640 4,550 4,830 4,870 5,300 4,330 4,130 5,200 Other Travel* 26.1% p 101,360 TOTAL 101,670 101,510 109,110 111,240 102,890 101,500 73,360 80,140 96,040 19.8% p
Direct Travel Impacts 2013-2022p
The Economic Impact of Travel in California / 2022p / Prepared by Dean Runyan Associates 205
San Diego County / Detail Trend
Direct Travel Impacts 2013-2022p
Details may not add to totals due to rounding. Percent change calculated on unrounded figures. Local tax receipts include transient occupancy taxes, sales taxes, and airport passenger facility charges paid by visitors, and the property tax payments and sales tax payments attributable to the travel industry income of employees and businesses. State tax receipts include sales tax payments and motor fuel tax payments of visitors, and the income tax payments and sales tax payments attributable to the travel industry income of employees and businesses.
Economic impacts are attributed to visitor trips which are defined as trips taken by individuals that stay overnight away from home, or travel more than 50 miles one-way on a non-routine trip, as defined by the California Tourism Marketing Act
2013 2014 2015 2016 2017 2018 2019 2020 2021 2022 2021-2022 Tax Receipts Generated by Travel Spending ($Millions) 445 474 509 547 570 606 602 342 521 690 Local Tax Receipts 32.5% p 468 479 479 492 501 482 496 267 398 452 State Tax Receipts 13.3% p 913 TOTAL 952 987 1,040 1,070 1,089 1,097 609 919 1,142 24.2% p Local Tax Receipts Generated by Travel Spending ($Millions) 327 354 383 413 434 473 464 212 370 520 Visitor 40.7% p 118 119 125 135 136 133 137 130 151 170 Business or Employee 12.5% p 445 TOTAL 474 509 547 570 606 602 342 521 690 32.5% p State Tax Receipts Generated by Travel Spending ($Millions) 346 352 347 354 366 359 370 155 264 293 Visitor 11.1% p 122 127 132 139 135 123 126 111 135 158 Business or Employee 17.7% p 468 TOTAL 479 479 492 501 482 496 267 398 452 13.3% p
The Economic Impact of Travel in California / 2022p / Prepared by Dean Runyan Associates 206
San Francisco County / Detail Trend
Details may not add to totals due to rounding. Percent change calculated on unrounded figures.
*Other Travel includes ground transportation and air travel impacts for travel to other California visitor destinations, travel arrangement services and convention/trade shows services.
Economic impacts are attributed to visitor trips which are defined as trips taken by individuals that stay overnight away from home, or travel more than 50 miles one-way on a non-routine trip, as defined by the California Tourism Marketing Act
Travel Impacts 2013-2022p 2013 2014 2015 2016 2017 2018 2019 2020 2021 2022 2021-2022 Direct Travel Spending ($Million) 8,860 10,267 10,895 10,875 10,758 11,114 11,294 3,449 5,059 8,929 Destination Spending 76.5% p 1,812 2,001 2,098 2,318 2,645 2,792 2,863 1,595 2,031 3,222 Other Travel* 58.6% p 10,672 TOTAL 12,269 12,992 13,192 13,404 13,906 14,156 5,044 7,090 12,151 71.4% p Visitor Spending by Type of Traveler Accommodation ($Million) 6,673 7,895 8,463 8,461 8,292 8,590 8,703 2,682 3,541 6,690 Hotel, Motel, STVR 88.9% p 816 864 879 871 899 936 965 231 563 837 Private Home 48.5% p 3 4 4 4 4 5 5 4 5 7 Campground 28.1% p 37 38 38 39 42 47 48 75 68 89 2nd Home 31.6% p 1,331 1,465 1,510 1,500 1,522 1,536 1,573 457 882 1,307 Day Travel 48.2% p 8,860 TOTAL 10,267 10,895 10,875 10,758 11,114 11,294 3,449 5,059 8,929 76.5% p Visitor Spending by Commodity Purchased ($Million) 2,250 2,884 3,200 3,209 3,080 3,179 3,361 1,005 1,040 2,435 Accommodations 134.0% p 2,257 2,545 2,719 2,773 2,807 2,934 2,961 982 1,571 2,399 Food Service 52.7% p 186 210 221 216 212 214 214 73 135 208 Food Stores 53.6% p 524 586 561 520 548 607 610 161 334 544 Local Tran. & Gas 63.0% p 1,230 1,387 1,448 1,447 1,432 1,462 1,437 459 721 1,060 Arts, Ent. & Rec. 47.0% p 1,274 1,426 1,478 1,454 1,443 1,475 1,469 471 777 1,169 Retail Sales 50.5% p 1,139 1,231 1,268 1,254 1,237 1,244 1,241 300 480 1,114 Visitor Air Tran. 132.0% p 8,860 TOTAL 10,267 10,895 10,875 10,758 11,114 11,294 3,449 5,059 8,929 76.5% p
Direct
The Economic Impact of Travel in California / 2022p / Prepared by Dean Runyan Associates 207
San Francisco County / Detail Trend
Direct Travel Impacts 2013-2022p
Details may not add to totals due to rounding. Percent change calculated on unrounded figures.
*Other Travel includes ground transportation and air travel impacts for travel to other California visitor destinations, travel arrangement services and convention/trade shows services.
**Retail includes gasoline station employment and earnings.
Economic impacts are attributed to visitor trips which are defined as trips taken by individuals that stay overnight away from home, or travel more than 50 miles one-way on a non-routine trip, as defined by the California Tourism Marketing Act
2013 2014 2015 2016 2017 2018 2019 2020 2021 2022 2021-2022 Travel Industry Earnings ($MIllion) 1,514 1,800 2,046 2,167 2,243 2,365 2,504 1,468 1,558 1,965 Accom. & Food Serv. 26.1% p 802 921 1,031 1,052 937 990 980 742 828 1,013 Arts, Ent. & Rec. 22.3% p 188 215 229 230 246 248 246 232 251 238 Retail** -5.3% q 67 77 83 90 99 137 144 33 37 49 Ground Tran. 32.7% p 205 238 244 312 405 431 455 371 424 500 Other Travel* 18.1% p 2,776 TOTAL 3,252 3,634 3,851 3,929 4,171 4,329 2,848 3,097 3,765 21.5% p Travel Industry Employment (Jobs) 33,530 38,530 41,400 41,250 41,760 42,000 40,980 23,130 23,120 29,530 Accom. & Food Serv. 27.8% p 12,740 14,220 15,570 15,540 15,380 15,170 15,420 10,380 10,530 13,290 Arts, Ent. & Rec. 26.2% p 3,990 4,510 4,530 4,610 4,520 4,320 4,020 3,460 3,440 3,540 Retail** 2.8% p 1,810 2,020 2,080 2,090 2,100 2,660 2,830 1,410 1,540 2,220 Ground Tran. 44.5% p 2,470 2,470 2,630 3,110 3,220 3,270 3,320 2,600 1,940 2,270 Other Travel* 16.9% p 54,540 TOTAL 61,750 66,200 66,600 66,970 67,420 66,580 40,990 40,570 50,850 25.4% p
The Economic Impact of Travel in California / 2022p / Prepared by Dean Runyan Associates 208
San Francisco County / Detail Trend
Direct Travel Impacts 2013-2022p
Details may not add to totals due to rounding. Percent change calculated on unrounded figures.
Local tax receipts include transient occupancy taxes, sales taxes, and airport passenger facility charges paid by visitors, and the property tax payments and sales tax payments attributable to the travel industry income of employees and businesses. State tax receipts include sales tax payments and motor fuel tax payments of visitors, and the income tax payments and sales tax payments attributable to the travel industry income of employees and businesses.
Economic impacts are attributed to visitor trips which are defined as trips taken by individuals that stay overnight away from home, or travel more than 50 miles one-way on a non-routine trip, as defined by the California Tourism Marketing Act
2013 2014 2015 2016 2017 2018 2019 2020 2021 2022 2021-2022 Tax Receipts Generated by Travel Spending ($Millions) 468 572 629 634 614 649 679 281 316 529 Local Tax Receipts 67.4% p 335 380 398 393 382 394 402 189 257 350 State Tax Receipts 35.9% p 803 TOTAL 952 1,026 1,027 996 1,043 1,081 470 573 879 53.3% p Local Tax Receipts Generated by Travel Spending ($Millions) 366 455 500 503 486 512 537 158 181 387 Visitor 113.6% p 102 117 129 131 128 137 142 123 135 143 Business or Employee 5.6% p 468 TOTAL 572 629 634 614 649 679 281 316 529 67.4% p State Tax Receipts Generated by Travel Spending ($Millions) 241 269 277 272 267 280 284 95 152 226 Visitor 48.6% p 95 111 121 121 115 114 118 94 105 124 Business or Employee 17.6% p 335 TOTAL 380 398 393 382 394 402 189 257 350 35.9% p
The Economic Impact of Travel in California / 2022p / Prepared by Dean Runyan Associates 209
San Joaquin County / Detail Trend
Details may not add to totals due to rounding. Percent change calculated on unrounded figures.
*Other Travel includes ground transportation and air travel impacts for travel to other California visitor destinations, travel arrangement services and convention/trade shows services.
Economic impacts are attributed to visitor trips which are defined as trips taken by individuals that stay overnight away from home, or travel more than 50 miles one-way on a non-routine trip, as defined by the California Tourism Marketing Act
Travel Impacts 2013-2022p 2013 2014 2015 2016 2017 2018 2019 2020 2021 2022 2021-2022 Direct Travel Spending ($Million) 658.8 676.4 690.4 721.1 758.3 800.4 847.5 488.3 896.0 1,081.7 Destination Spending 20.7% p 130.7 133.0 119.4 106.6 120.0 140.4 145.9 53.3 86.0 121.2 Other Travel* 41.0% p 789.5 TOTAL 809.4 809.8 827.7 878.3 940.8 993.4 541.6 982.0 1,202.9 22.5% p Visitor Spending by Type of Traveler Accommodation ($Million) 215.2 228.0 247.8 275.3 285.2 294.3 311.6 301.3 478.5 505.0 Hotel, Motel, STVR 5.5% p 202.7 204.3 197.0 195.7 214.0 236.2 255.4 71.6 237.4 285.5 Private Home 20.3% p 7.5 8.2 8.3 8.4 8.8 9.2 9.9 8.3 10.4 13.3 Campground 28.1% p 11.5 11.8 11.6 11.8 12.5 13.3 13.6 46.8 42.3 28.6 2nd Home -32.4% q 221.8 224.0 225.7 229.8 237.8 247.4 257.1 60.2 127.5 249.3 Day Travel 95.6% p 658.8 TOTAL 676.4 690.4 721.1 758.3 800.4 847.5 488.3 896.0 1,081.7 20.7% p Visitor Spending by Commodity Purchased ($Million) 73.4 80.6 91.7 105.4 112.1 117.8 124.3 126.6 208.9 214.1 Accommodations 2.5% p 187.4 190.4 202.2 217.6 225.0 232.5 246.1 144.7 262.6 317.2 Food Service 20.8% p 30.9 31.8 33.1 33.8 33.7 34.0 35.1 19.5 39.3 48.5 Food Stores 23.6% p 170.8 174.0 162.0 153.2 165.4 184.0 192.6 69.4 149.4 208.2 Local Tran. & Gas 39.3% p 90.9 92.5 95.9 101.2 102.3 103.3 106.4 60.9 104.9 124.0 Arts, Ent. & Rec. 18.2% p 105.0 106.2 104.6 109.1 118.7 127.7 141.9 66.7 130.4 169.0 Retail Sales 29.6% p 0.5 1.0 0.8 0.9 1.0 1.2 1.1 0.5 0.5 0.7 Visitor Air Tran. 28.8% p 658.8 TOTAL 676.4 690.4 721.1 758.3 800.4 847.5 488.3 896.0 1,081.7 20.7% p
Direct
The Economic Impact of Travel in California / 2022p / Prepared by Dean Runyan Associates 210
San Joaquin County / Detail Trend
Details may not add to totals due to rounding. Percent change calculated on unrounded figures.
*Other Travel includes ground transportation and air travel impacts for travel to other California visitor destinations, travel arrangement services and convention/trade shows services.
**Retail includes gasoline station employment and earnings.
Economic impacts are attributed to visitor trips which are defined as trips taken by individuals that stay overnight away from home, or travel more than 50 miles one-way on a non-routine trip, as defined by the California Tourism Marketing Act
2013 2014 2015 2016 2017 2018 2019 2020 2021 2022 2021-2022 Travel Industry Earnings ($MIllion) 112.5 117.4 128.8 146.4 158.6 172.9 186.4 165.7 206.0 265.1 Accom. & Food Serv. 28.7% p 45.4 49.7 51.3 59.6 61.4 64.1 67.3 42.7 52.6 69.1 Arts, Ent. & Rec. 31.4% p 19.8 20.7 21.4 22.8 23.9 25.1 26.5 27.0 31.4 34.4 Retail** 9.3% p 13.3 14.0 15.1 17.1 19.0 25.2 27.8 13.4 17.0 18.5 Ground Tran. 9.2% p 0.4 0.6 0.5 0.7 4.6 5.1 6.6 6.5 0.4 0.4 Visitor Air Tran. 12.3% p 7.1 7.6 8.2 9.2 23.5 24.6 31.0 31.8 10.7 11.2 Other Travel* 4.7% p 198.5 TOTAL 209.9 225.3 255.9 291.2 317.0 345.6 287.1 318.1 398.8 25.4% p Travel Industry Employment (Jobs) 4,410 4,440 4,540 4,760 4,990 5,100 5,250 4,450 5,040 6,080 Accom. & Food Serv. 20.8% p 2,120 2,360 2,220 2,340 2,350 2,380 2,430 1,380 1,680 2,220 Arts, Ent. & Rec. 31.9% p 700 720 720 740 760 760 770 720 790 830 Retail** 4.2% p 350 360 370 390 400 490 540 450 570 680 Ground Tran. 19.7% p <10 <10 <10 <10 50 50 70 60 <10 <10 Visitor Air Tran. 5.8% p 210 230 240 250 400 400 470 470 270 270 Other Travel* -1.9% q 7,800 TOTAL 8,110 8,100 8,500 8,940 9,190 9,540 7,540 8,360 10,090 20.6% p
Direct Travel Impacts 2013-2022p
The Economic Impact of Travel in California / 2022p / Prepared by Dean Runyan Associates 211
San Joaquin County / Detail Trend
Direct Travel Impacts 2013-2022p
Details may not add to totals due to rounding. Percent change calculated on unrounded figures.
Local tax receipts include transient occupancy taxes, sales taxes, and airport passenger facility charges paid by visitors, and the property tax payments and sales tax payments attributable to the travel industry income of employees and businesses. State tax receipts include sales tax payments and motor fuel tax payments of visitors, and the income tax payments and sales tax payments attributable to the travel industry income of employees and businesses.
Economic impacts are attributed to visitor trips which are defined as trips taken by individuals that stay overnight away from home, or travel more than 50 miles one-way on a non-routine trip, as defined by the California Tourism Marketing Act
2013 2014 2015 2016 2017 2018 2019 2020 2021 2022 2021-2022 Tax Receipts Generated by Travel Spending ($Millions) 18.3 19.3 21.0 23.3 26.4 29.5 31.6 27.5 41.0 45.4 Local Tax Receipts 10.8% p 49.4 51.1 49.5 48.6 50.2 58.3 62.6 33.8 52.4 64.2 State Tax Receipts 22.6% p 67.7 TOTAL 70.4 70.5 71.9 76.6 87.8 94.2 61.3 93.4 109.6 17.4% p Local Tax Receipts Generated by Travel Spending ($Millions) 11.4 12.2 13.5 15.0 17.1 19.3 20.5 15.1 27.2 30.5 Visitor 11.9% p 6.9 7.1 7.5 8.3 9.3 10.2 11.1 12.4 13.8 15.0 Business or Employee 8.5% p 18.3 TOTAL 19.3 21.0 23.3 26.4 29.5 31.6 27.5 41.0 45.4 10.8% p State Tax Receipts Generated by Travel Spending ($Millions) 42.4 43.7 41.7 40.3 41.9 49.9 53.5 24.5 41.2 51.5 Visitor 25.0% p 7.0 7.4 7.8 8.3 8.3 8.5 9.1 9.3 11.1 12.7 Business or Employee 13.8% p 49.4 TOTAL 51.1 49.5 48.6 50.2 58.3 62.6 33.8 52.4 64.2 22.6% p
The Economic Impact of Travel in California / 2022p / Prepared
Runyan Associates 212
by Dean
San Luis Obispo County / Detail Trend
Details may not add to totals due to rounding. Percent change calculated on unrounded figures.
*Other Travel includes ground transportation and air travel impacts for travel to other California visitor destinations, travel arrangement services and convention/trade shows services.
Economic impacts are attributed to visitor trips which are defined as trips taken by individuals that stay overnight away from home, or travel more than 50 miles one-way on a non-routine trip, as defined by the California Tourism Marketing Act
2013 2014 2015 2016 2017 2018 2019 2020 2021 2022 2021-2022 Direct Travel Spending ($Million) 1,510 1,562 1,607 1,623 1,716 1,837 1,935 1,321 1,846 2,077 Destination Spending 12.5% p 77 67 62 57 66 78 83 28 45 75 Other Travel* 67.6% p 1,586 TOTAL 1,629 1,669 1,680 1,782 1,915 2,019 1,349 1,891 2,152 13.8% p Visitor Spending by Type of Traveler Accommodation ($Million) 926 967 1,002 1,015 1,077 1,147 1,202 954 1,341 1,332 Hotel, Motel, STVR -0.7% q 92 92 96 97 108 121 131 56 126 142 Private Home 12.5% p 130 135 137 139 146 153 165 137 171 220 Campground 28.2% p 39 40 41 41 45 51 52 61 55 66 2nd Home 21.0% p 323 328 331 330 341 366 385 112 153 318 Day Travel 107.3% p 1,510 TOTAL 1,562 1,607 1,623 1,716 1,837 1,935 1,321 1,846 2,077 12.5% p Visitor Spending by Commodity Purchased ($Million) 375 407 435 453 477 506 528 474 706 765 Accommodations 8.4% p 422 430 447 460 487 519 552 356 472 510 Food Service 8.0% p 66 68 71 71 72 74 78 57 83 105 Food Stores 26.1% p 192 197 181 165 183 210 222 114 164 212 Local Tran. & Gas 29.4% p 195 199 202 204 211 220 228 138 180 190 Arts, Ent. & Rec. 5.9% p 248 251 258 256 270 289 305 173 228 267 Retail Sales 17.0% p 11 11 13 14 16 19 22 8 14 28 Visitor Air Tran. 100.9% p 1,510 TOTAL 1,562 1,607 1,623 1,716 1,837 1,935 1,321 1,846 2,077 12.5% p
Direct Travel Impacts 2013-2022p
The Economic Impact of Travel in California / 2022p / Prepared by Dean Runyan Associates 213
San Luis Obispo County / Detail Trend
Direct Travel Impacts 2013-2022p
Details may not add to totals due to rounding. Percent change calculated on unrounded figures.
*Other Travel includes ground transportation and air travel impacts for travel to other California visitor destinations, travel arrangement services and convention/trade shows services.
**Retail includes gasoline station employment and earnings.
Economic impacts are attributed to visitor trips which are defined as trips taken by individuals that stay overnight away from home, or travel more than 50 miles one-way on a non-routine trip, as defined by the California Tourism Marketing Act
2013 2014 2015 2016 2017 2018 2019 2020 2021 2022 2021-2022 Travel Industry Earnings ($MIllion) 315 335 357 386 439 472 509 410 498 596 Accom. & Food Serv. 19.5% p 96 98 105 111 124 128 139 99 132 154 Arts, Ent. & Rec. 16.7% p 45 47 49 50 52 55 57 58 65 69 Retail** 6.9% p 17 17 18 20 23 33 36 17 14 13 Ground Tran. -4.5% q 4 4 5 4 6 6 29 31 13 14 Visitor Air Tran. 2.2% p 12 9 9 8 10 11 44 40 17 19 Other Travel* 10.3% p 488 TOTAL 510 544 580 654 705 815 655 740 865 16.9% p Travel Industry Employment (Jobs) 10,900 11,010 11,080 11,460 12,580 12,910 13,410 10,640 11,810 13,250 Accom. & Food Serv. 12.2% p 5,390 5,410 5,280 5,300 5,650 5,910 6,340 4,140 5,090 6,600 Arts, Ent. & Rec. 29.7% p 1,470 1,470 1,470 1,480 1,520 1,560 1,590 1,500 1,530 1,560 Retail** 1.8% p 450 460 460 470 490 640 720 730 590 640 Ground Tran. 9.2% p 70 60 70 70 100 100 300 290 170 160 Visitor Air Tran. -3.7% q 250 170 170 150 210 220 500 410 250 260 Other Travel* 3.6% p 18,520 TOTAL 18,580 18,530 18,930 20,550 21,340 22,860 17,710 19,440 22,480 15.6% p
The Economic Impact of Travel in California / 2022p / Prepared
Runyan Associates 214
by Dean
San Luis Obispo County / Detail Trend
Direct Travel Impacts 2013-2022p
Details may not add to totals due to rounding. Percent change calculated on unrounded figures.
Local tax receipts include transient occupancy taxes, sales taxes, and airport passenger facility charges paid by visitors, and the property tax payments and sales tax payments attributable to the travel industry income of employees and businesses. State tax receipts include sales tax payments and motor fuel tax payments of visitors, and the income tax payments and sales tax payments attributable to the travel industry income of employees and businesses.
Economic impacts are attributed to visitor trips which are defined as trips taken by individuals that stay overnight away from home, or travel more than 50 miles one-way on a non-routine trip, as defined by the California Tourism Marketing Act
2013 2014 2015 2016 2017 2018 2019 2020 2021 2022 2021-2022 Tax Receipts Generated by Travel Spending ($Millions) 62 66 70 72 77 84 91 81 108 116 Local Tax Receipts 6.6% p 75 77 77 75 78 85 92 66 81 90 State Tax Receipts 11.1% p 136 TOTAL 142 147 148 154 169 183 147 189 206 8.5% p Local Tax Receipts Generated by Travel Spending ($Millions) 45 49 52 54 57 63 66 55 78 85 Visitor 8.6% p 16 17 18 18 20 22 25 27 30 31 Business or Employee 1.4% p 62 TOTAL 66 70 72 77 84 91 81 108 116 6.6% p State Tax Receipts Generated by Travel Spending ($Millions) 57 59 58 56 58 65 70 42 54 61 Visitor 14.0% p 17 18 19 19 20 20 23 23 27 29 Business or Employee 5.4% p 75 TOTAL 77 77 75 78 85 92 66 81 90 11.1% p
The Economic Impact of Travel in California / 2022p / Prepared by Dean Runyan Associates 215
San Mateo County / Detail Trend
Details may not add to totals due to rounding. Percent change calculated on unrounded figures.
*Other Travel includes ground transportation and air travel impacts for travel to other California visitor destinations, travel arrangement services and convention/trade shows services.
Economic impacts are attributed to visitor trips which are defined as trips taken by individuals that stay overnight away from home, or travel more than 50 miles one-way on a non-routine trip, as defined by the California Tourism Marketing Act
2013 2014 2015 2016 2017 2018 2019 2020 2021 2022 2021-2022 Direct Travel Spending ($Million) 3,096 3,258 3,427 3,518 3,662 3,984 4,059 1,483 2,253 3,632 Destination Spending 61.2% p 244 261 303 294 336 374 433 198 154 225 Other Travel* 46.4% p 3,340 TOTAL 3,519 3,730 3,813 3,997 4,357 4,492 1,681 2,407 3,857 60.3% p Visitor Spending by Type of Traveler Accommodation ($Million) 2,163 2,309 2,463 2,549 2,638 2,869 2,911 1,161 1,488 2,617 Hotel, Motel, STVR 75.8% p 304 309 314 316 347 382 406 88 370 365 Private Home -1.4% q 30 30 31 31 33 35 37 31 39 50 Campground 28.1% p 19 19 19 19 21 23 24 40 36 43 2nd Home 20.1% p 580 591 600 602 622 675 681 162 320 558 Day Travel 74.1% p 3,096 TOTAL 3,258 3,427 3,518 3,662 3,984 4,059 1,483 2,253 3,632 61.2% p Visitor Spending by Commodity Purchased ($Million) 677 777 874 920 948 1,051 1,080 387 461 729 Accommodations 58.1% p 818 836 881 917 966 1,049 1,075 407 654 1,017 Food Service 55.6% p 88 90 94 94 95 99 100 40 76 109 Food Stores 43.5% p 620 645 642 639 663 718 721 265 427 816 Local Tran. & Gas 91.2% p 453 463 477 487 501 531 530 191 306 456 Arts, Ent. & Rec. 49.0% p 440 447 459 461 490 535 554 194 329 505 Retail Sales 53.3% p 3,096 TOTAL 3,258 3,427 3,518 3,662 3,984 4,059 1,483 2,253 3,632 61.2% p
Direct Travel Impacts 2013-2022p
The Economic Impact of Travel in California / 2022p / Prepared by Dean Runyan Associates 216
San Mateo County / Detail Trend
Details may not add to totals due to rounding. Percent change calculated on unrounded figures.
*Other Travel includes ground transportation and air travel impacts for travel to other California visitor destinations, travel arrangement services and convention/trade shows services.
**Retail includes gasoline station employment and earnings.
Economic impacts are attributed to visitor trips which are defined as trips taken by individuals that stay overnight away from home, or travel more than 50 miles one-way on a non-routine trip, as defined by the California Tourism Marketing Act
2013 2014 2015 2016 2017 2018 2019 2020 2021 2022 2021-2022 Travel Industry Earnings ($MIllion) 557 588 654 700 768 867 907 578 658 828 Accom. & Food Serv. 25.9% p 194 207 221 237 249 273 282 206 245 289 Arts, Ent. & Rec. 17.6% p 72 75 79 81 83 92 92 89 98 94 Retail** -4.1% q 85 93 104 111 116 135 145 70 74 133 Ground Tran. 79.7% p 677 692 747 1,008 1,151 1,192 549 511 331 367 Visitor Air Tran. 10.9% p 652 674 783 1,053 1,229 1,311 678 651 438 457 Other Travel* 4.3% p 2,236 TOTAL 2,330 2,588 3,191 3,596 3,870 2,652 2,106 1,844 2,168 17.6% p Travel Industry Employment (Jobs) 15,710 16,030 16,540 16,580 17,390 18,600 18,500 12,330 12,890 14,950 Accom. & Food Serv. 16.0% p 7,430 7,560 7,970 8,250 8,590 9,020 8,670 5,890 6,390 7,340 Arts, Ent. & Rec. 14.9% p 1,810 1,830 1,760 1,700 1,710 1,800 1,770 1,580 1,600 1,540 Retail** -4.0% q 1,990 2,070 2,240 2,260 2,270 2,510 2,650 1,580 1,590 2,570 Ground Tran. 61.8% p 8,150 8,360 8,710 9,590 9,860 9,880 6,200 5,160 3,700 3,860 Visitor Air Tran. 4.5% p 8,040 8,310 9,340 10,410 10,850 11,130 7,570 6,530 4,990 4,910 Other Travel* -1.6% q 43,130 TOTAL 44,160 46,560 48,790 50,680 52,940 45,350 33,060 31,160 35,180 12.9% p
Direct Travel Impacts 2013-2022p
The Economic Impact of Travel in California / 2022p / Prepared by Dean Runyan Associates 217
San Mateo County / Detail Trend
Direct Travel Impacts 2013-2022p
Details may not add to totals due to rounding. Percent change calculated on unrounded figures.
Local tax receipts include transient occupancy taxes, sales taxes, and airport passenger facility charges paid by visitors, and the property tax payments and sales tax payments attributable to the travel industry income of employees and businesses. State tax receipts include sales tax payments and motor fuel tax payments of visitors, and the income tax payments and sales tax payments attributable to the travel industry income of employees and businesses.
Economic impacts are attributed to visitor trips which are defined as trips taken by individuals that stay overnight away from home, or travel more than 50 miles one-way on a non-routine trip, as defined by the California Tourism Marketing Act
2013 2014 2015 2016 2017 2018 2019 2020 2021 2022 2021-2022 Tax Receipts Generated by Travel Spending ($Millions) 210 234 255 280 294 335 297 166 180 246 Local Tax Receipts 36.3% p 194 198 205 216 221 231 208 116 140 196 State Tax Receipts 40.0% p 404 TOTAL 432 460 497 516 566 505 282 320 442 37.9% p Local Tax Receipts Generated by Travel Spending ($Millions) 130 150 162 170 175 203 206 71 96 160 Visitor 66.0% p 80 85 93 110 119 133 91 95 84 86 Business or Employee 2.2% p 210 TOTAL 234 255 280 294 335 297 166 180 246 36.3% p State Tax Receipts Generated by Travel Spending ($Millions) 122 125 126 125 127 140 144 55 85 136 Visitor 58.9% p 73 73 79 91 94 91 64 61 55 60 Business or Employee 10.5% p 194 TOTAL 198 205 216 221 231 208 116 140 196 40.0% p
The Economic Impact of Travel in California / 2022p / Prepared by Dean Runyan Associates 218
Santa Barbara County / Detail Trend
Details may not add to totals due to rounding. Percent change calculated on unrounded figures.
*Other Travel includes ground transportation and air travel impacts for travel to other California visitor destinations, travel arrangement services and convention/trade shows services.
Economic impacts are attributed to visitor trips which are defined as trips taken by individuals that stay overnight away from home, or travel more than 50 miles one-way on a non-routine trip, as defined by the California Tourism Marketing Act
Travel Impacts 2013-2022p 2013 2014 2015 2016 2017 2018 2019 2020 2021 2022 2021-2022 Direct Travel Spending ($Million) 1,608 1,714 1,774 1,775 1,818 1,832 1,977 955 1,730 1,924 Destination Spending 11.2% p 137 139 131 129 135 151 164 65 102 154 Other Travel* 50.5% p 1,745 TOTAL 1,853 1,906 1,904 1,953 1,983 2,141 1,021 1,832 2,078 13.4% p Visitor Spending by Type of Traveler Accommodation ($Million) 1,000 1,086 1,135 1,139 1,143 1,126 1,229 642 1,233 1,237 Hotel, Motel, STVR 0.3% p 148 151 155 152 170 188 206 83 190 213 Private Home 12.1% p 55 58 59 60 63 66 71 59 74 94 Campground 28.2% p 33 34 34 35 38 43 44 57 51 49 2nd Home -3.3% q 372 386 391 388 405 409 428 115 183 331 Day Travel 81.0% p 1,608 TOTAL 1,714 1,774 1,775 1,818 1,832 1,977 955 1,730 1,924 11.2% p Visitor Spending by Commodity Purchased ($Million) 385 435 468 481 485 464 523 335 631 742 Accommodations 17.6% p 452 473 497 507 520 529 561 256 451 452 Food Service 0.3% p 52 55 57 57 57 57 59 34 57 69 Food Stores 21.3% p 209 220 205 187 200 218 230 85 161 184 Local Tran. & Gas 14.9% p 209 219 225 225 226 224 232 98 172 169 Arts, Ent. & Rec. -1.4% q 267 278 290 286 296 303 322 133 232 253 Retail Sales 8.9% p 33 34 33 32 35 37 51 15 28 56 Visitor Air Tran. 98.5% p 1,608 TOTAL 1,714 1,774 1,775 1,818 1,832 1,977 955 1,730 1,924 11.2% p
Direct
The Economic Impact of Travel in California / 2022p / Prepared by Dean Runyan Associates 219
Santa Barbara County / Detail Trend
Direct Travel Impacts 2013-2022p
Details may not add to totals due to rounding. Percent change calculated on unrounded figures.
*Other Travel includes ground transportation and air travel impacts for travel to other California visitor destinations, travel arrangement services and convention/trade shows services.
**Retail includes gasoline station employment and earnings.
Economic impacts are attributed to visitor trips which are defined as trips taken by individuals that stay overnight away from home, or travel more than 50 miles one-way on a non-routine trip, as defined by the California Tourism Marketing Act
2013 2014 2015 2016 2017 2018 2019 2020 2021 2022 2021-2022 Travel Industry Earnings ($MIllion) 351 380 415 426 457 470 514 400 482 596 Accom. & Food Serv. 23.7% p 95 104 105 104 114 117 127 100 119 139 Arts, Ent. & Rec. 16.5% p 43 46 49 50 50 50 52 54 59 62 Retail** 5.4% p 19 21 22 24 26 34 38 14 16 14 Ground Tran. -14.6% q 11 4 5 4 4 5 6 6 8 9 Visitor Air Tran. 10.1% p 24 17 19 20 19 21 22 19 22 26 Other Travel* 18.6% p 543 TOTAL 571 616 627 672 698 758 592 706 846 19.7% p Travel Industry Employment (Jobs) 10,210 10,640 11,070 10,970 11,120 11,040 11,810 9,090 10,080 11,640 Accom. & Food Serv. 15.5% p 4,110 4,330 4,400 4,330 4,580 5,230 5,590 4,060 4,600 5,440 Arts, Ent. & Rec. 18.3% p 1,240 1,270 1,360 1,350 1,310 1,300 1,320 1,260 1,310 1,300 Retail** -0.9% q 510 530 540 550 550 670 750 540 600 580 Ground Tran. -3.6% q 160 90 90 60 60 60 80 60 80 90 Visitor Air Tran. 3.7% p 420 340 360 360 340 350 370 290 330 370 Other Travel* 13.1% p 16,660 TOTAL 17,210 17,820 17,630 17,970 18,650 19,910 15,290 16,990 19,410 14.2% p
The Economic Impact of Travel in California / 2022p / Prepared
Runyan Associates 220
by Dean
Santa Barbara County / Detail Trend
Direct Travel Impacts 2013-2022p
Details may not add to totals due to rounding. Percent change calculated on unrounded figures.
Local tax receipts include transient occupancy taxes, sales taxes, and airport passenger facility charges paid by visitors, and the property tax payments and sales tax payments attributable to the travel industry income of employees and businesses. State tax receipts include sales tax payments and motor fuel tax payments of visitors, and the income tax payments and sales tax payments attributable to the travel industry income of employees and businesses.
Economic impacts are attributed to visitor trips which are defined as trips taken by individuals that stay overnight away from home, or travel more than 50 miles one-way on a non-routine trip, as defined by the California Tourism Marketing Act
2013 2014 2015 2016 2017 2018 2019 2020 2021 2022 2021-2022 Tax Receipts Generated by Travel Spending ($Millions) 68 74 79 82 85 86 95 66 108 122 Local Tax Receipts 13.0% p 82 87 87 84 84 89 95 53 79 85 State Tax Receipts 6.8% p 150 TOTAL 161 167 166 169 175 190 120 188 207 10.4% p Local Tax Receipts Generated by Travel Spending ($Millions) 49 55 59 62 64 64 72 42 79 92 Visitor 16.4% p 19 19 20 20 21 22 23 24 29 30 Business or Employee 3.8% p 68 TOTAL 74 79 82 85 86 95 66 108 122 13.0% p State Tax Receipts Generated by Travel Spending ($Millions) 63 66 66 63 64 69 74 33 54 57 Visitor 6.5% p 19 20 21 21 20 20 21 21 26 28 Business or Employee 7.5% p 82 TOTAL 87 87 84 84 89 95 53 79 85 6.8% p
The Economic Impact of Travel in California / 2022p / Prepared by Dean Runyan Associates 221
Santa Clara County / Detail Trend
Details may not add to totals due to rounding. Percent change calculated on unrounded figures.
*Other Travel includes ground transportation and air travel impacts for travel to other California visitor destinations, travel arrangement services and convention/trade shows services.
Economic impacts are attributed to visitor trips which are defined as trips taken by individuals that stay overnight away from home, or travel more than 50 miles one-way on a non-routine trip, as defined by the California Tourism Marketing Act
2013 2014 2015 2016 2017 2018 2019 2020 2021 2022 2021-2022 Direct Travel Spending ($Million) 4,466 4,794 5,041 5,220 6,018 6,173 6,214 2,256 3,363 4,914 Destination Spending 46.1% p 925 975 1,049 1,084 1,203 1,272 1,414 734 906 1,317 Other Travel* 45.3% p 5,391 TOTAL 5,769 6,090 6,304 7,221 7,446 7,629 2,989 4,269 6,231 46.0% p Visitor Spending by Type of Traveler Accommodation ($Million) 2,960 3,236 3,480 3,651 4,340 4,367 4,305 1,681 2,073 3,276 Hotel, Motel, STVR 58.0% p 590 609 609 610 673 733 804 232 672 723 Private Home 7.5% p 42 49 49 49 52 54 59 49 61 78 Campground 28.1% p 24 24 25 25 27 29 30 42 38 36 2nd Home -5.1% q 851 875 878 884 926 990 1,018 251 518 800 Day Travel 54.4% p 4,466 TOTAL 4,794 5,041 5,220 6,018 6,173 6,214 2,256 3,363 4,914 46.1% p Visitor Spending by Commodity Purchased ($Million) 999 1,181 1,368 1,469 1,753 1,739 1,728 591 631 1,237 Accommodations 96.2% p 1,243 1,289 1,343 1,410 1,631 1,682 1,692 692 1,092 1,422 Food Service 30.2% p 141 149 153 153 165 166 167 69 131 174 Food Stores 32.4% p 568 594 561 538 621 669 671 216 400 577 Local Tran. & Gas 44.4% p 621 644 655 674 757 765 751 292 458 576 Arts, Ent. & Rec. 25.8% p 634 652 659 668 768 799 819 304 525 677 Retail Sales 29.0% p 260 285 302 307 323 355 386 92 127 251 Visitor Air Tran. 97.9% p 4,466 TOTAL 4,794 5,041 5,220 6,018 6,173 6,214 2,256 3,363 4,914 46.1% p
Direct Travel Impacts 2013-2022p
The Economic Impact of Travel in California / 2022p / Prepared
Runyan Associates 222
by Dean
Santa Clara County / Detail Trend
Direct Travel Impacts 2013-2022p
Details may not add to totals due to rounding. Percent change calculated on unrounded figures.
*Other Travel includes ground transportation and air travel impacts for travel to other California visitor destinations, travel arrangement services and convention/trade shows services.
**Retail includes gasoline station employment and earnings.
Economic impacts are attributed to visitor trips which are defined as trips taken by individuals that stay overnight away from home, or travel more than 50 miles one-way on a non-routine trip, as defined by the California Tourism Marketing Act
2013 2014 2015 2016 2017 2018 2019 2020 2021 2022 2021-2022 Travel Industry Earnings ($MIllion) 829 894 970 1,082 1,143 1,173 1,196 815 905 1,193 Accom. & Food Serv. 31.8% p 290 315 323 346 379 396 444 260 282 357 Arts, Ent. & Rec. 26.6% p 100 105 109 113 114 116 115 111 119 119 Retail** 0.0% p 64 70 75 82 99 124 131 48 53 67 Ground Tran. 26.7% p 24 25 27 26 25 26 22 21 20 22 Visitor Air Tran. 10.4% p 135 146 186 205 217 219 251 220 244 276 Other Travel* 13.2% p 1,441 TOTAL 1,555 1,692 1,854 1,977 2,054 2,160 1,476 1,623 2,034 25.4% p Travel Industry Employment (Jobs) 25,160 25,850 26,360 27,490 27,700 26,640 25,390 17,310 17,910 21,650 Accom. & Food Serv. 20.9% p 6,910 7,150 7,560 7,790 7,860 7,820 8,410 4,960 5,980 8,410 Arts, Ent. & Rec. 40.6% p 2,380 2,470 2,420 2,570 2,490 2,430 2,410 2,140 2,210 2,180 Retail** -1.4% q 1,640 1,710 1,760 1,810 2,030 2,370 2,510 1,540 1,660 2,090 Ground Tran. 25.6% p 340 360 380 360 350 350 390 330 310 330 Visitor Air Tran. 4.0% p 2,010 2,080 2,150 2,430 2,660 2,770 3,770 2,370 2,640 2,830 Other Travel* 7.2% p 38,440 TOTAL 39,610 40,630 42,450 43,090 42,380 42,880 28,650 30,720 37,480 22.0% p
The Economic Impact of Travel in California / 2022p / Prepared by Dean Runyan Associates 223
Santa Clara County / Detail Trend
Direct Travel Impacts 2013-2022p
Details may not add to totals due to rounding. Percent change calculated on unrounded figures.
Local tax receipts include transient occupancy taxes, sales taxes, and airport passenger facility charges paid by visitors, and the property tax payments and sales tax payments attributable to the travel industry income of employees and businesses. State tax receipts include sales tax payments and motor fuel tax payments of visitors, and the income tax payments and sales tax payments attributable to the travel industry income of employees and businesses.
Economic impacts are attributed to visitor trips which are defined as trips taken by individuals that stay overnight away from home, or travel more than 50 miles one-way on a non-routine trip, as defined by the California Tourism Marketing Act
2013 2014 2015 2016 2017 2018 2019 2020 2021 2022 2021-2022 Tax Receipts Generated by Travel Spending ($Millions) 193 215 239 262 285 319 323 153 181 265 Local Tax Receipts 46.1% p 225 236 236 235 250 267 276 134 189 237 State Tax Receipts 25.6% p 417 TOTAL 451 475 497 535 587 599 287 370 502 35.6% p Local Tax Receipts Generated by Travel Spending ($Millions) 140 160 180 199 219 250 251 87 109 186 Visitor 70.9% p 52 55 59 63 66 69 73 66 72 79 Business or Employee 8.8% p 193 TOTAL 215 239 262 285 319 323 153 181 265 46.1% p State Tax Receipts Generated by Travel Spending ($Millions) 175 183 179 176 194 212 218 86 134 173 Visitor 28.9% p 49 53 57 59 57 55 58 48 55 64 Business or Employee 17.5% p 225 TOTAL 236 236 235 250 267 276 134 189 237 25.6% p
The Economic Impact of Travel in California / 2022p / Prepared by Dean Runyan Associates 224
Santa Cruz County / Detail Trend
Direct Travel Impacts 2013-2022p
Details may not add to totals due to rounding. Percent change calculated on unrounded figures.
*Other Travel includes ground transportation and air travel impacts for travel to other California visitor destinations, travel arrangement services and convention/trade shows services.
Economic impacts are attributed to visitor trips which are defined as trips taken by individuals that stay overnight away from home, or travel more than 50 miles one-way on a non-routine trip, as defined by the California Tourism Marketing Act
2013 2014 2015 2016 2017 2018 2019 2020 2021 2022 2021-2022 Direct Travel Spending ($Million) 816 849 880 903 976 1,025 1,020 483 1,081 1,535 Destination Spending 42.0% p 53 55 48 42 47 53 55 21 32 45 Other Travel* 40.8% p 870 TOTAL 904 928 946 1,023 1,078 1,075 503 1,113 1,580 42.0% p Visitor Spending by Type of Traveler Accommodation ($Million) 424 448 475 499 549 567 546 212 718 1,031 Hotel, Motel, STVR 43.7% p 69 70 69 68 75 81 86 31 87 94 Private Home 8.7% p 64 67 69 70 73 77 83 69 86 111 Campground 28.2% p 89 91 93 94 100 109 111 110 99 94 2nd Home -5.1% q 170 173 173 173 180 191 194 61 91 204 Day Travel 125.7% p 816 TOTAL 849 880 903 976 1,025 1,020 483 1,081 1,535 42.0% p Visitor Spending by Commodity Purchased ($Million) 205 226 249 265 285 297 292 139 330 439 Accommodations 32.7% p 229 233 244 256 277 287 286 139 327 472 Food Service 44.5% p 40 41 43 43 44 45 46 30 53 73 Food Stores 37.2% p 114 116 106 97 108 123 125 49 95 155 Local Tran. & Gas 62.2% p 116 118 120 124 130 132 129 60 134 189 Arts, Ent. & Rec. 40.9% p 113 114 117 119 131 141 142 66 141 208 Retail Sales 47.2% p 816 TOTAL 849 880 903 976 1,025 1,020 483 1,081 1,535 42.0% p
The Economic Impact of Travel in California / 2022p / Prepared by Dean Runyan Associates 225
Santa Cruz County / Detail Trend
Direct Travel Impacts 2013-2022p
Details may not add to totals due to rounding. Percent change calculated on unrounded figures.
*Other Travel includes ground transportation and air travel impacts for travel to other California visitor destinations, travel arrangement services and convention/trade shows services.
**Retail includes gasoline station employment and earnings.
Economic impacts are attributed to visitor trips which are defined as trips taken by individuals that stay overnight away from home, or travel more than 50 miles one-way on a non-routine trip, as defined by the California Tourism Marketing Act
2013 2014 2015 2016 2017 2018 2019 2020 2021 2022 2021-2022 Travel Industry Earnings ($MIllion) 162 174 190 210 225 239 244 175 222 250 Accom. & Food Serv. 12.8% p 55 60 68 76 82 86 87 52 65 75 Arts, Ent. & Rec. 15.1% p 21 22 23 24 24 24 24 25 27 26 Retail** -5.2% q 9 9 9 11 13 18 19 6 8 9 Ground Tran. 22.8% p 5 5 5 4 5 5 5 4 4 4 Other Travel* 5.7% p 252 TOTAL 270 296 325 348 371 378 263 326 365 11.9% p Travel Industry Employment (Jobs) 5,670 5,860 6,060 6,190 6,360 6,460 6,400 4,550 5,240 5,490 Accom. & Food Serv. 4.7% p 2,940 3,100 3,350 3,410 3,680 3,670 3,390 1,860 2,250 2,720 Arts, Ent. & Rec. 20.5% p 700 720 700 730 720 700 690 650 670 610 Retail** -9.4% q 240 240 240 250 270 340 370 300 360 520 Ground Tran. 42.4% p 120 130 120 110 120 110 110 90 90 80 Other Travel* -3.2% q 9,680 TOTAL 10,060 10,470 10,690 11,140 11,280 10,960 7,460 8,620 9,420 9.2% p
The Economic Impact of Travel in California / 2022p / Prepared by Dean Runyan Associates 226
Santa Cruz County / Detail Trend
Direct Travel Impacts 2013-2022p
Details may not add to totals due to rounding. Percent change calculated on unrounded figures.
Local tax receipts include transient occupancy taxes, sales taxes, and airport passenger facility charges paid by visitors, and the property tax payments and sales tax payments attributable to the travel industry income of employees and businesses. State tax receipts include sales tax payments and motor fuel tax payments of visitors, and the income tax payments and sales tax payments attributable to the travel industry income of employees and businesses.
Economic impacts are attributed to visitor trips which are defined as trips taken by individuals that stay overnight away from home, or travel more than 50 miles one-way on a non-routine trip, as defined by the California Tourism Marketing Act
2013 2014 2015 2016 2017 2018 2019 2020 2021 2022 2021-2022 Tax Receipts Generated by Travel Spending ($Millions) 30 33 36 40 44 48 47 26 54 70 Local Tax Receipts 29.0% p 42 43 43 43 44 48 49 28 47 64 State Tax Receipts 34.3% p 72 TOTAL 76 79 82 88 96 97 53 101 133 31.4% p Local Tax Receipts Generated by Travel Spending ($Millions) 21 23 26 29 33 36 35 14 40 56 Visitor 40.3% p 9 9 10 11 11 12 12 11 14 14 Business or Employee -2.9% q 30 TOTAL 33 36 40 44 48 47 26 54 70 29.0% p State Tax Receipts Generated by Travel Spending ($Millions) 33 34 33 32 34 38 39 19 36 51 Visitor 42.6% p 9 9 10 10 10 10 10 9 12 13 Business or Employee 9.2% p 42 TOTAL 43 43 43 44 48 49 28 47 64 34.3% p
The Economic Impact of Travel in California / 2022p / Prepared by Dean Runyan Associates 227
Shasta County / Detail Trend
Details may not add to totals due to rounding. Percent change calculated on unrounded figures.
*Other Travel includes ground transportation and air travel impacts for travel to other California visitor destinations, travel arrangement services and convention/trade shows services.
Economic impacts are attributed to visitor trips which are defined as trips taken by individuals that stay overnight away from home, or travel more than 50 miles one-way on a non-routine trip, as defined by the California Tourism Marketing Act
Travel Impacts
2013 2014 2015 2016 2017 2018 2019 2020 2021 2022 2021-2022 Direct Travel Spending ($Million) 383.8 395.4 395.9 409.7 428.4 472.7 505.0 295.3 441.6 457.6 Destination Spending 3.6% p 35.1 34.7 32.1 29.7 32.4 36.9 39.7 13.7 24.3 36.9 Other Travel* 52.0% p 418.9 TOTAL 430.1 428.0 439.4 460.9 509.7 544.7 308.9 465.9 494.5 6.1% p Visitor Spending by Type of Traveler Accommodation ($Million) 162.4 166.5 171.9 183.4 192.5 216.9 234.8 147.6 236.6 185.4 Hotel, Motel, STVR -21.7% q 45.2 45.4 43.1 42.9 46.2 51.6 55.6 16.4 50.5 57.2 Private Home 13.1% p 35.5 39.4 39.5 40.0 41.9 44.0 47.4 39.7 49.5 63.4 Campground 28.1% p 39.2 39.8 38.5 39.2 40.7 43.3 44.4 55.4 50.0 61.5 2nd Home 23.0% p 101.6 104.3 102.9 104.3 107.1 116.9 122.8 36.2 55.0 90.2 Day Travel 64.0% p 383.8 TOTAL 395.4 395.9 409.7 428.4 472.7 505.0 295.3 441.6 457.6 3.6% p Visitor Spending by Commodity Purchased ($Million) 83.8 87.0 91.2 97.8 102.7 114.7 123.2 103.2 135.5 139.3 Accommodations 2.9% p 100.6 103.3 106.9 113.9 118.3 128.8 138.1 74.5 118.9 111.9 Food Service -5.9% q 21.7 23.0 23.6 23.9 24.0 24.8 26.1 19.0 27.7 33.1 Food Stores 19.5% p 67.5 69.8 63.0 58.3 63.7 74.6 79.0 30.1 52.3 64.7 Local Tran. & Gas 23.8% p 51.0 52.5 53.1 55.4 56.2 59.7 62.3 33.4 49.7 46.5 Arts, Ent. & Rec. -6.5% q 56.7 58.0 55.6 57.3 60.2 67.0 71.8 33.7 54.2 56.3 Retail Sales 3.9% p 2.5 1.9 2.6 3.3 3.3 3.1 4.5 1.4 3.4 5.7 Visitor Air Tran. 70.3% p 383.8 TOTAL 395.4 395.9 409.7 428.4 472.7 505.0 295.3 441.6 457.6 3.6% p
Direct
2013-2022p
The Economic Impact of Travel in California / 2022p / Prepared by Dean Runyan Associates 228
Shasta County / Detail Trend
Details may not add to totals due to rounding. Percent change calculated on unrounded figures.
*Other Travel includes ground transportation and air travel impacts for travel to other California visitor destinations, travel arrangement services and convention/trade shows services.
**Retail includes gasoline station employment and earnings.
Economic impacts are attributed to visitor trips which are defined as trips taken by individuals that stay overnight away from home, or travel more than 50 miles one-way on a non-routine trip, as defined by the California Tourism Marketing Act
2013 2014 2015 2016 2017 2018 2019 2020 2021 2022 2021-2022 Travel Industry Earnings ($MIllion) 70.9 73.7 78.0 86.4 91.7 92.9 103.6 96.2 116.4 125.4 Accom. & Food Serv. 7.7% p 22.9 23.9 24.3 26.8 24.7 26.1 29.5 22.4 26.9 31.9 Arts, Ent. & Rec. 18.6% p 11.8 12.5 12.6 13.2 13.7 14.1 14.9 16.5 17.9 19.3 Retail** 7.6% p 5.2 5.5 5.7 6.4 7.4 10.9 12.1 4.1 4.1 3.7 Ground Tran. -11.6% q 1.3 1.2 1.3 2.5 2.8 2.8 2.9 2.8 3.3 3.2 Visitor Air Tran. -0.9% q 2.7 3.0 3.3 5.1 5.5 5.8 5.7 5.6 6.8 7.9 Other Travel* 16.5% p 114.8 TOTAL 119.7 125.2 140.5 145.8 152.7 168.7 147.7 175.4 191.4 9.1% p Travel Industry Employment (Jobs) 2,810 2,840 2,820 2,900 2,960 2,870 2,940 2,610 2,920 3,050 Accom. & Food Serv. 4.2% p 1,050 1,050 1,090 1,160 1,100 1,160 1,290 960 1,100 1,230 Arts, Ent. & Rec. 12.6% p 400 410 400 420 420 420 430 440 450 460 Retail** 2.6% p 140 150 150 150 160 210 240 190 200 200 Ground Tran. 2.5% p 20 20 20 30 40 40 40 30 40 30 Visitor Air Tran. -6.6% q 70 80 80 110 120 120 120 110 120 130 Other Travel* 12.7% p 4,490 TOTAL 4,550 4,560 4,770 4,800 4,820 5,050 4,350 4,820 5,110 6.0% p
Direct Travel Impacts 2013-2022p
The Economic Impact of Travel in California / 2022p / Prepared by Dean Runyan Associates 229
Shasta County / Detail Trend
Direct Travel Impacts 2013-2022p
Details may not add to totals due to rounding. Percent change calculated on unrounded figures.
Local tax receipts include transient occupancy taxes, sales taxes, and airport passenger facility charges paid by visitors, and the property tax payments and sales tax payments attributable to the travel industry income of employees and businesses. State tax receipts include sales tax payments and motor fuel tax payments of visitors, and the income tax payments and sales tax payments attributable to the travel industry income of employees and businesses.
Economic impacts are attributed to visitor trips which are defined as trips taken by individuals that stay overnight away from home, or travel more than 50 miles one-way on a non-routine trip, as defined by the California Tourism Marketing Act
2013 2014 2015 2016 2017 2018 2019 2020 2021 2022 2021-2022 Tax Receipts Generated by Travel Spending ($Millions) 11.6 11.9 12.4 13.4 13.9 15.9 17.4 14.6 19.7 19.1 Local Tax Receipts -2.9% q 21.8 22.6 21.8 21.6 21.8 25.1 27.1 16.3 22.7 23.5 State Tax Receipts 3.7% p 33.4 TOTAL 34.5 34.2 35.0 35.7 41.0 44.4 31.0 42.4 42.6 0.6% p Local Tax Receipts Generated by Travel Spending ($Millions) 7.9 8.1 8.5 9.2 9.7 11.5 12.4 8.9 12.8 12.6 Visitor -1.4% q 3.7 3.8 3.9 4.2 4.2 4.5 5.0 5.8 6.9 6.5 Business or Employee -5.6% q 11.6 TOTAL 11.9 12.4 13.4 13.9 15.9 17.4 14.6 19.7 19.1 -2.9% q State Tax Receipts Generated by Travel Spending ($Millions) 17.5 18.1 17.2 16.7 17.2 20.5 22.0 10.8 15.9 16.9 Visitor 6.0% p 4.3 4.5 4.6 4.8 4.6 4.6 5.0 5.5 6.7 6.6 Business or Employee -1.8% q 21.8 TOTAL 22.6 21.8 21.6 21.8 25.1 27.1 16.3 22.7 23.5 3.7% p
The Economic Impact of Travel in California / 2022p / Prepared by Dean Runyan Associates 230
Sierra County / Detail Trend
Details may not add to totals due to rounding. Percent change calculated on unrounded figures.
*Other Travel includes ground transportation and air travel impacts for travel to other California visitor destinations, travel arrangement services and convention/trade shows services.
Economic impacts are attributed to visitor trips which are defined as trips taken by individuals that stay overnight away from home, or travel more than 50 miles one-way on a non-routine trip, as defined by the California Tourism Marketing Act
Travel Impacts 2013-2022p 2013 2014 2015 2016 2017 2018 2019 2020 2021 2022 2021-2022 Direct Travel Spending ($Million) 18.2 17.9 17.3 16.4 17.7 17.8 18.9 13.3 19.0 19.8 Destination Spending 4.3% p 0.5 0.5 0.5 0.4 0.5 0.5 0.5 0.2 0.3 0.4 Other Travel* 42.3% p 18.8 TOTAL 18.4 17.7 16.8 18.2 18.3 19.4 13.5 19.3 20.3 4.9% p Visitor Spending by Type of Traveler Accommodation ($Million) 10.5 10.3 9.8 9.1 9.8 9.4 10.1 5.7 10.4 9.8 Hotel, Motel, STVR -5.3% q 1.6 1.6 1.5 1.4 1.6 1.7 1.9 0.6 1.9 2.1 Private Home 10.2% p 0.6 0.6 0.6 0.6 0.7 0.7 0.7 0.6 0.8 1.0 Campground 28.1% p 2.7 2.7 2.8 2.8 3.0 3.3 3.4 5.2 4.7 4.7 2nd Home -0.8% q 2.7 2.6 2.5 2.4 2.5 2.6 2.7 1.2 1.2 2.2 Day Travel 81.7% p 18.2 TOTAL 17.9 17.3 16.4 17.7 17.8 18.9 13.3 19.0 19.8 4.3% p Visitor Spending by Commodity Purchased ($Million) 4.9 4.9 4.8 4.6 4.9 4.7 5.1 4.2 6.2 7.0 Accommodations 12.1% p 5.5 5.4 5.3 5.2 5.6 5.5 5.9 4.1 5.7 5.5 Food Service -3.9% q 0.7 0.7 0.7 0.7 0.7 0.7 0.7 0.5 0.9 1.0 Food Stores 14.5% p 2.1 2.0 1.8 1.6 1.8 1.9 2.0 1.0 1.5 1.7 Local Tran. & Gas 14.6% p 2.9 2.8 2.7 2.6 2.7 2.7 2.8 2.0 2.5 2.4 Arts, Ent. & Rec. -4.2% q 2.1 2.0 1.9 1.8 2.0 2.2 2.4 1.6 2.2 2.2 Retail Sales 1.9% p 18.2 TOTAL 17.9 17.3 16.4 17.7 17.8 18.9 13.3 19.0 19.8 4.3% p
Direct
The Economic Impact of Travel in California / 2022p / Prepared by Dean Runyan Associates 231
Sierra County / Detail Trend
Details may not add to totals due to rounding. Percent change calculated on unrounded figures.
*Other Travel includes ground transportation and air travel impacts for travel to other California visitor destinations, travel arrangement services and convention/trade shows services.
**Retail includes gasoline station employment and earnings.
Economic impacts are attributed to visitor trips which are defined as trips taken by individuals that stay overnight away from home, or travel more than 50 miles one-way on a non-routine trip, as defined by the California Tourism Marketing Act
2013 2014 2015 2016 2017 2018 2019 2020 2021 2022 2021-2022 Travel Industry Earnings ($MIllion) 2.7 2.7 2.9 2.8 3.1 3.1 3.3 3.8 4.6 5.0 Accom. & Food Serv. 7.2% p 0.6 0.6 0.6 0.6 0.6 0.6 0.7 0.6 0.6 0.6 Arts, Ent. & Rec. 1.7% p 0.4 0.4 0.4 0.3 0.4 0.4 0.4 0.4 0.4 0.4 Retail** -8.5% q 0.2 0.2 0.2 0.2 0.2 0.3 0.3 0.2 0.1 0.1 Ground Tran. -17.1% q 0.0 0.0 0.0 0.0 0.0 0.0 0.0 0.0 0.0 0.0 Other Travel* 13.6% p 3.8 TOTAL 3.9 4.1 4.0 4.4 4.4 4.7 5.0 5.8 6.1 5.0% p Travel Industry Employment (Jobs) 170 160 190 170 180 190 220 220 240 250 Accom. & Food Serv. 3.0% p 20 20 20 20 20 20 20 20 20 20 Arts, Ent. & Rec. 28.4% p 20 20 20 10 20 20 20 20 10 10 Retail** -14.7% q <10 <10 <10 <10 <10 <10 <10 <10 <10 <10 Ground Tran. -3.9% q <10 <10 <10 <10 <10 <10 <10 <10 <10 <10 Other Travel* 3.6% p 210 TOTAL 200 240 210 220 240 270 270 280 290 3.7% p
Direct Travel Impacts 2013-2022p
The Economic Impact of Travel in California / 2022p / Prepared by Dean Runyan Associates 232
Sierra County / Detail Trend
Direct Travel Impacts 2013-2022p
Details may not add to totals due to rounding. Percent change calculated on unrounded figures.
Local tax receipts include transient occupancy taxes, sales taxes, and airport passenger facility charges paid by visitors, and the property tax payments and sales tax payments attributable to the travel industry income of employees and businesses. State tax receipts include sales tax payments and motor fuel tax payments of visitors, and the income tax payments and sales tax payments attributable to the travel industry income of employees and businesses.
Economic impacts are attributed to visitor trips which are defined as trips taken by individuals that stay overnight away from home, or travel more than 50 miles one-way on a non-routine trip, as defined by the California Tourism Marketing Act
2013 2014 2015 2016 2017 2018 2019 2020 2021 2022 2021-2022 Tax Receipts Generated by Travel Spending ($Millions) 0.5 0.5 0.5 0.5 0.5 0.5 0.6 0.5 0.7 0.8 Local Tax Receipts 6.0% p 0.7 0.7 0.6 0.6 0.6 0.6 0.7 0.5 0.7 0.7 State Tax Receipts -0.3% q 1.2 TOTAL 1.2 1.2 1.1 1.1 1.2 1.3 1.0 1.4 1.5 2.9% p Local Tax Receipts Generated by Travel Spending ($Millions) 0.4 0.4 0.4 0.4 0.4 0.4 0.4 0.3 0.5 0.6 Visitor 13.1% p 0.1 0.1 0.1 0.1 0.1 0.1 0.1 0.2 0.2 0.2 Business or Employee -9.0% q 0.5 TOTAL 0.5 0.5 0.5 0.5 0.5 0.6 0.5 0.7 0.8 6.0% p State Tax Receipts Generated by Travel Spending ($Millions) 0.5 0.5 0.5 0.4 0.5 0.5 0.5 0.3 0.5 0.5 Visitor 1.9% p 0.2 0.2 0.2 0.1 0.1 0.1 0.1 0.2 0.2 0.2 Business or Employee -4.4% q 0.7 TOTAL 0.7 0.6 0.6 0.6 0.6 0.7 0.5 0.7 0.7 -0.3% q
The Economic Impact of Travel in California / 2022p / Prepared by Dean Runyan Associates 233
Siskiyou County / Detail Trend
Details may not add to totals due to rounding. Percent change calculated on unrounded figures.
*Other Travel includes ground transportation and air travel impacts for travel to other California visitor destinations, travel arrangement services and convention/trade shows services.
Economic impacts are attributed to visitor trips which are defined as trips taken by individuals that stay overnight away from home, or travel more than 50 miles one-way on a non-routine trip, as defined by the California Tourism Marketing Act
Travel Impacts 2013-2022p 2013 2014 2015 2016 2017 2018 2019 2020 2021 2022 2021-2022 Direct Travel Spending ($Million) 159.2 162.5 164.9 168.3 179.5 184.5 197.6 139.1 205.4 195.7 Destination Spending -4.7% q 7.9 7.9 7.0 6.3 7.0 8.1 8.4 3.0 4.8 6.8 Other Travel* 41.5% p 167.2 TOTAL 170.4 171.9 174.6 186.5 192.6 206.0 142.1 210.2 202.6 -3.6% q Visitor Spending by Type of Traveler Accommodation ($Million) 70.2 73.2 76.4 79.2 84.7 84.4 91.6 59.0 105.1 77.5 Hotel, Motel, STVR -26.2% q 23.6 23.7 22.1 22.1 24.1 25.5 27.9 9.2 28.2 31.1 Private Home 10.1% p 16.1 16.0 15.9 16.0 16.8 17.7 19.0 15.9 19.9 25.5 Campground 28.2% p 24.9 25.0 25.9 26.4 28.0 30.5 31.3 44.5 39.8 41.7 2nd Home 4.7% p 24.4 24.6 24.6 24.6 25.9 26.4 27.8 10.4 12.3 19.9 Day Travel 61.8% p 159.2 TOTAL 162.5 164.9 168.3 179.5 184.5 197.6 139.1 205.4 195.7 -4.7% q Visitor Spending by Commodity Purchased ($Million) 37.4 39.2 41.5 43.7 46.4 46.8 51.1 45.2 62.8 61.1 Accommodations -2.8% q 47.6 48.2 50.2 52.4 55.3 55.9 59.6 40.2 61.9 54.5 Food Service -12.0% q 9.5 9.6 9.8 9.8 10.0 9.9 10.5 7.2 11.9 13.7 Food Stores 15.1% p 21.9 22.2 20.2 18.5 20.5 22.7 24.1 11.8 18.6 20.8 Local Tran. & Gas 11.4% p 25.1 25.4 25.8 26.4 27.2 26.9 27.9 18.9 26.6 23.5 Arts, Ent. & Rec. -11.7% q 17.7 17.9 17.4 17.6 20.0 22.3 24.3 15.8 23.6 22.3 Retail Sales -5.3% q 159.2 TOTAL 162.5 164.9 168.3 179.5 184.5 197.6 139.1 205.4 195.7 -4.7% q
Direct
The Economic Impact of Travel in California / 2022p / Prepared
Runyan Associates 234
by Dean
Siskiyou County / Detail Trend
Direct Travel Impacts 2013-2022p
Details may not add to totals due to rounding. Percent change calculated on unrounded figures.
*Other Travel includes ground transportation and air travel impacts for travel to other California visitor destinations, travel arrangement services and convention/trade shows services.
**Retail includes gasoline station employment and earnings.
Economic impacts are attributed to visitor trips which are defined as trips taken by individuals that stay overnight away from home, or travel more than 50 miles one-way on a non-routine trip, as defined by the California Tourism Marketing Act
2013 2014 2015 2016 2017 2018 2019 2020 2021 2022 2021-2022 Travel Industry Earnings ($MIllion) 43.6 47.7 53.1 58.0 62.5 58.0 63.7 52.3 60.0 72.1 Accom. & Food Serv. 20.2% p 9.4 6.3 5.6 5.7 7.1 3.9 4.1 4.0 4.9 4.8 Arts, Ent. & Rec. -1.2% q 4.3 4.4 4.5 4.7 4.8 5.2 5.6 6.2 6.4 6.8 Retail** 6.4% p 1.8 1.9 2.0 2.2 2.5 3.5 3.9 1.7 1.6 1.2 Ground Tran. -20.4% q 0.3 0.4 0.4 0.5 0.5 0.5 0.5 0.5 0.5 0.6 Other Travel* 25.9% p 59.5 TOTAL 60.7 65.5 71.0 77.4 71.0 77.9 64.6 73.3 85.6 16.7% p Travel Industry Employment (Jobs) 1,390 1,430 1,450 1,440 1,490 1,380 1,390 1,150 1,260 1,410 Accom. & Food Serv. 11.9% p 580 360 280 290 340 200 190 170 190 170 Arts, Ent. & Rec. -10.2% q 170 170 160 150 160 160 170 170 180 180 Retail** -0.3% q 50 50 50 50 50 70 80 80 70 70 Ground Tran. -7.8% q 10 20 20 20 20 20 20 10 20 20 Other Travel* 21.5% p 2,200 TOTAL 2,020 1,960 1,960 2,060 1,820 1,840 1,580 1,720 1,850 7.4% p
The Economic Impact of Travel in California / 2022p / Prepared by Dean Runyan Associates 235
Siskiyou County / Detail Trend
Direct Travel Impacts 2013-2022p
Details may not add to totals due to rounding. Percent change calculated on unrounded figures.
Local tax receipts include transient occupancy taxes, sales taxes, and airport passenger facility charges paid by visitors, and the property tax payments and sales tax payments attributable to the travel industry income of employees and businesses. State tax receipts include sales tax payments and motor fuel tax payments of visitors, and the income tax payments and sales tax payments attributable to the travel industry income of employees and businesses.
Economic impacts are attributed to visitor trips which are defined as trips taken by individuals that stay overnight away from home, or travel more than 50 miles one-way on a non-routine trip, as defined by the California Tourism Marketing Act
2013 2014 2015 2016 2017 2018 2019 2020 2021 2022 2021-2022 Tax Receipts Generated by Travel Spending ($Millions) 5.0 5.1 5.4 5.7 6.1 6.2 6.8 5.9 8.2 7.9 Local Tax Receipts -3.4% q 8.3 8.5 8.4 8.3 8.6 8.9 9.7 7.0 9.4 9.2 State Tax Receipts -2.0% q 13.3 TOTAL 13.6 13.8 14.0 14.7 15.1 16.5 12.9 17.6 17.1 -2.7% q Local Tax Receipts Generated by Travel Spending ($Millions) 3.0 3.2 3.4 3.6 3.9 4.1 4.5 3.4 5.3 5.0 Visitor -5.9% q 1.9 1.9 2.1 2.1 2.2 2.1 2.3 2.5 2.9 2.9 Business or Employee 1.1% p 5.0 TOTAL 5.1 5.4 5.7 6.1 6.2 6.8 5.9 8.2 7.9 -3.4% q State Tax Receipts Generated by Travel Spending ($Millions) 6.2 6.3 6.1 5.9 6.2 6.9 7.5 4.6 6.6 6.3 Visitor -3.6% q 2.1 2.2 2.3 2.3 2.3 2.0 2.2 2.4 2.8 2.9 Business or Employee 1.8% p 8.3 TOTAL 8.5 8.4 8.3 8.6 8.9 9.7 7.0 9.4 9.2 -2.0% q
The Economic Impact of Travel in California / 2022p / Prepared by Dean Runyan Associates 236
Solano County / Detail Trend
Details may not add to totals due to rounding. Percent change calculated on unrounded figures.
*Other Travel includes ground transportation and air travel impacts for travel to other California visitor destinations, travel arrangement services and convention/trade shows services.
Economic impacts are attributed to visitor trips which are defined as trips taken by individuals that stay overnight away from home, or travel more than 50 miles one-way on a non-routine trip, as defined by the California Tourism Marketing Act
Travel Impacts 2013-2022p 2013 2014 2015 2016 2017 2018 2019 2020 2021 2022 2021-2022 Direct Travel Spending ($Million) 619.0 633.2 632.1 665.7 693.0 714.7 735.0 284.7 656.4 717.3 Destination Spending 9.3% p 76.6 78.0 72.3 65.1 73.4 85.1 88.5 32.4 51.0 71.9 Other Travel* 40.8% p 695.6 TOTAL 711.2 704.4 730.8 766.4 799.7 823.5 317.1 707.4 789.1 11.5% p Visitor Spending by Type of Traveler Accommodation ($Million) 189.3 201.9 209.3 229.5 234.9 238.3 241.2 156.7 228.4 223.7 Hotel, Motel, STVR -2.1% q 179.3 179.0 171.7 176.8 191.0 204.5 218.3 50.6 246.2 243.6 Private Home -1.1% q 3.6 4.5 4.5 4.6 4.8 5.0 5.4 4.5 5.7 7.3 Campground 28.2% p 6.1 6.2 6.8 6.9 7.5 8.3 8.5 20.0 17.8 15.2 2nd Home -14.3% q 240.6 241.6 239.9 247.9 254.9 258.5 261.6 52.9 158.4 227.5 Day Travel 43.6% p 619.0 TOTAL 633.2 632.1 665.7 693.0 714.7 735.0 284.7 656.4 717.3 9.3% p Visitor Spending by Commodity Purchased ($Million) 68.4 76.8 83.4 94.4 98.0 100.6 103.9 64.3 90.5 95.4 Accommodations 5.4% p 192.1 194.0 199.3 214.0 221.3 226.1 232.0 92.2 228.9 242.4 Food Service 5.9% p 31.1 31.9 32.4 33.1 33.1 32.9 33.3 10.6 35.0 38.4 Food Stores 9.7% p 77.8 78.7 71.0 66.7 72.8 80.9 82.8 18.6 57.7 71.9 Local Tran. & Gas 24.6% p 131.2 132.6 133.1 140.1 141.6 141.3 141.2 50.0 120.5 129.9 Arts, Ent. & Rec. 7.8% p 118.3 119.2 112.8 117.4 126.2 132.8 141.8 48.9 123.8 139.3 Retail Sales 12.6% p 619.0 TOTAL 633.2 632.1 665.7 693.0 714.7 735.0 284.7 656.4 717.3 9.3% p
Direct
The Economic Impact of Travel in California / 2022p / Prepared by Dean Runyan Associates 237
Solano County / Detail Trend
Details may not add to totals due to rounding. Percent change calculated on unrounded figures.
*Other Travel includes ground transportation and air travel impacts for travel to other California visitor destinations, travel arrangement services and convention/trade shows services.
**Retail includes gasoline station employment and earnings.
Economic impacts are attributed to visitor trips which are defined as trips taken by individuals that stay overnight away from home, or travel more than 50 miles one-way on a non-routine trip, as defined by the California Tourism Marketing Act
2013 2014 2015 2016 2017 2018 2019 2020 2021 2022 2021-2022 Travel Industry Earnings ($MIllion) 120.9 122.7 126.9 142.3 150.8 163.3 172.4 144.5 169.5 198.6 Accom. & Food Serv. 17.1% p 71.5 69.0 61.0 67.4 61.3 66.5 67.7 34.1 44.6 62.1 Arts, Ent. & Rec. 39.1% p 19.1 19.6 19.5 20.6 21.2 22.5 23.3 22.9 26.0 27.1 Retail** 4.2% p 6.8 7.0 7.3 8.3 9.5 13.2 14.1 3.2 5.7 5.2 Ground Tran. -7.8% q 2.9 3.4 4.8 5.3 5.6 6.0 6.3 5.4 4.4 4.1 Other Travel* -7.3% q 221.2 TOTAL 221.8 219.4 244.0 248.5 271.5 283.7 210.1 250.3 297.1 18.7% p Travel Industry Employment (Jobs) 4,600 4,520 4,400 4,600 4,620 4,770 4,700 3,790 4,090 4,620 Accom. & Food Serv. 13.0% p 3,660 3,560 3,400 3,510 3,540 3,520 3,530 1,720 2,160 3,000 Arts, Ent. & Rec. 39.1% p 670 680 630 650 670 690 680 610 650 650 Retail** -1.1% q 190 190 190 200 200 260 280 150 270 290 Ground Tran. 6.9% p 120 140 150 150 160 160 160 130 90 90 Other Travel* -4.3% q 9,240 TOTAL 9,090 8,760 9,110 9,200 9,400 9,350 6,410 7,260 8,640 19.1% p
Direct Travel Impacts 2013-2022p
The Economic Impact of Travel in California / 2022p / Prepared by Dean Runyan Associates 238
Solano County / Detail Trend
Direct Travel Impacts 2013-2022p
Details may not add to totals due to rounding. Percent change calculated on unrounded figures.
Local tax receipts include transient occupancy taxes, sales taxes, and airport passenger facility charges paid by visitors, and the property tax payments and sales tax payments attributable to the travel industry income of employees and businesses. State tax receipts include sales tax payments and motor fuel tax payments of visitors, and the income tax payments and sales tax payments attributable to the travel industry income of employees and businesses.
Economic impacts are attributed to visitor trips which are defined as trips taken by individuals that stay overnight away from home, or travel more than 50 miles one-way on a non-routine trip, as defined by the California Tourism Marketing Act
2013 2014 2015 2016 2017 2018 2019 2020 2021 2022 2021-2022 Tax Receipts Generated by Travel Spending ($Millions) 18.8 20.0 20.7 22.6 23.1 25.5 26.6 17.6 25.8 27.2 Local Tax Receipts 5.4% p 38.7 39.3 37.5 37.5 38.0 42.0 44.0 20.4 37.3 41.3 State Tax Receipts 10.7% p 57.5 TOTAL 59.3 58.1 60.2 61.1 67.5 70.6 38.0 63.1 68.5 8.5% p Local Tax Receipts Generated by Travel Spending ($Millions) 11.3 12.5 13.3 14.8 15.4 17.0 17.6 8.8 15.2 16.3 Visitor 7.2% p 7.6 7.5 7.3 7.9 7.7 8.5 8.9 8.8 10.5 10.8 Business or Employee 2.8% p 18.8 TOTAL 20.0 20.7 22.6 23.1 25.5 26.6 17.6 25.8 27.2 5.4% p State Tax Receipts Generated by Travel Spending ($Millions) 30.8 31.5 29.9 29.6 30.5 34.4 36.2 13.4 28.2 31.6 Visitor 12.0% p 7.8 7.8 7.6 8.0 7.5 7.6 7.9 7.0 9.1 9.7 Business or Employee 6.6% p 38.7 TOTAL 39.3 37.5 37.5 38.0 42.0 44.0 20.4 37.3 41.3 10.7% p
The Economic Impact of Travel in California / 2022p / Prepared by Dean Runyan Associates 239
Sonoma County / Detail Trend
Details may not add to totals due to rounding. Percent change calculated on unrounded figures.
*Other Travel includes ground transportation and air travel impacts for travel to other California visitor destinations, travel arrangement services and convention/trade shows services.
Economic impacts are attributed to visitor trips which are defined as trips taken by individuals that stay overnight away from home, or travel more than 50 miles one-way on a non-routine trip, as defined by the California Tourism Marketing Act
2013 2014 2015 2016 2017 2018 2019 2020 2021 2022 2021-2022 Direct Travel Spending ($Million) 1,630 1,698 1,752 1,832 1,926 2,024 2,054 1,161 1,816 2,127 Destination Spending 17.1% p 126 130 124 143 158 176 183 89 121 172 Other Travel* 42.0% p 1,756 TOTAL 1,828 1,876 1,975 2,084 2,200 2,237 1,250 1,938 2,299 18.7% p Visitor Spending by Type of Traveler Accommodation ($Million) 834 886 931 984 1,054 1,112 1,113 722 1,138 1,239 Hotel, Motel, STVR 8.9% p 157 158 152 156 165 179 190 60 207 209 Private Home 1.0% p 50 55 55 56 59 61 66 56 69 89 Campground 28.1% p 85 86 94 95 102 114 117 143 127 122 2nd Home -3.8% q 505 514 520 541 545 558 568 181 275 467 Day Travel 70.0% p 1,630 TOTAL 1,698 1,752 1,832 1,926 2,024 2,054 1,161 1,816 2,127 17.1% p Visitor Spending by Commodity Purchased ($Million) 330 367 400 435 473 510 505 299 576 657 Accommodations 14.0% p 460 471 491 519 542 563 580 355 502 567 Food Service 13.0% p 61 64 66 67 67 67 69 39 70 83 Food Stores 19.3% p 165 170 157 149 161 179 184 81 130 173 Local Tran. & Gas 33.3% p 316 323 329 343 348 353 354 195 264 306 Arts, Ent. & Rec. 15.9% p 292 297 302 310 323 340 348 187 262 319 Retail Sales 21.5% p 6 7 7 9 11 12 14 5 12 21 Visitor Air Tran. 79.4% p 1,630 TOTAL 1,698 1,752 1,832 1,926 2,024 2,054 1,161 1,816 2,127 17.1% p
Direct Travel Impacts 2013-2022p
The Economic Impact of Travel in California / 2022p / Prepared by Dean Runyan Associates 240
Sonoma County / Detail Trend
Direct Travel Impacts 2013-2022p
Details may not add to totals due to rounding. Percent change calculated on unrounded figures.
*Other Travel includes ground transportation and air travel impacts for travel to other California visitor destinations, travel arrangement services and convention/trade shows services.
**Retail includes gasoline station employment and earnings.
Economic impacts are attributed to visitor trips which are defined as trips taken by individuals that stay overnight away from home, or travel more than 50 miles one-way on a non-routine trip, as defined by the California Tourism Marketing Act
2013 2014 2015 2016 2017 2018 2019 2020 2021 2022 2021-2022 Travel Industry Earnings ($MIllion) 299 328 347 373 415 437 456 335 415 514 Accom. & Food Serv. 24.0% p 162 161 176 185 205 215 221 156 181 240 Arts, Ent. & Rec. 33.2% p 45 47 49 52 55 59 59 60 66 68 Retail** 3.5% p 17 18 19 21 24 33 35 15 14 15 Ground Tran. 2.2% p 3 3 3 14 20 22 32 31 34 34 Visitor Air Tran. 0.8% p 15 16 17 39 47 49 60 55 54 60 Other Travel* 12.4% p 540 TOTAL 573 612 684 767 815 863 653 763 931 22.1% p Travel Industry Employment (Jobs) 9,950 10,410 10,580 10,690 11,310 11,320 11,210 8,280 9,290 10,990 Accom. & Food Serv. 18.3% p 7,320 7,190 7,500 7,580 8,310 8,000 7,860 5,000 5,650 7,390 Arts, Ent. & Rec. 30.8% p 1,420 1,450 1,420 1,460 1,490 1,510 1,480 1,410 1,440 1,430 Retail** -0.6% q 460 470 470 490 510 630 690 630 570 650 Ground Tran. 13.9% p 20 20 30 100 210 220 330 280 160 150 Visitor Air Tran. -5.1% q 290 300 310 560 690 690 790 670 500 530 Other Travel* 6.4% p 19,460 TOTAL 19,830 20,300 20,880 22,510 22,380 22,360 16,290 17,610 21,150 20.1% p
The Economic Impact of Travel in California / 2022p / Prepared by Dean Runyan Associates 241
Sonoma County / Detail Trend
Direct Travel Impacts 2013-2022p
Details may not add to totals due to rounding. Percent change calculated on unrounded figures.
Local tax receipts include transient occupancy taxes, sales taxes, and airport passenger facility charges paid by visitors, and the property tax payments and sales tax payments attributable to the travel industry income of employees and businesses. State tax receipts include sales tax payments and motor fuel tax payments of visitors, and the income tax payments and sales tax payments attributable to the travel industry income of employees and businesses.
Economic impacts are attributed to visitor trips which are defined as trips taken by individuals that stay overnight away from home, or travel more than 50 miles one-way on a non-routine trip, as defined by the California Tourism Marketing Act
2013 2014 2015 2016 2017 2018 2019 2020 2021 2022 2021-2022 Tax Receipts Generated by Travel Spending ($Millions) 67 73 78 84 97 108 110 74 115 130 Local Tax Receipts 13.1% p 80 83 83 84 85 91 95 61 80 93 State Tax Receipts 15.7% p 147 TOTAL 155 160 168 182 199 204 135 195 223 14.2% p Local Tax Receipts Generated by Travel Spending ($Millions) 47 52 56 61 72 81 81 45 81 94 Visitor 16.1% p 20 20 22 23 25 27 29 29 34 36 Business or Employee 5.9% p 67 TOTAL 73 78 84 97 108 110 74 115 130 13.1% p State Tax Receipts Generated by Travel Spending ($Millions) 62 64 63 63 64 70 73 40 55 65 Visitor 18.1% p 18 19 20 21 21 21 22 21 25 28 Business or Employee 10.5% p 80 TOTAL 83 83 84 85 91 95 61 80 93 15.7% p
The Economic Impact of Travel in California / 2022p / Prepared by Dean Runyan Associates 242
Stanislaus County / Detail Trend
Details may not add to totals due to rounding. Percent change calculated on unrounded figures.
*Other Travel includes ground transportation and air travel impacts for travel to other California visitor destinations, travel arrangement services and convention/trade shows services.
Economic impacts are attributed to visitor trips which are defined as trips taken by individuals that stay overnight away from home, or travel more than 50 miles one-way on a non-routine trip, as defined by the California Tourism Marketing Act
Direct Travel Impacts 2013-2022p 2013 2014 2015 2016 2017 2018 2019 2020 2021 2022 2021-2022 Direct Travel Spending ($Million) 441.5 450.3 471.1 487.0 500.1 531.9 565.5 269.8 516.8 518.6 Destination Spending 0.4% p 96.6 96.7 86.3 77.1 87.1 101.2 105.3 37.3 60.6 85.8 Other Travel* 41.6% p 538.2 TOTAL 547.0 557.4 564.0 587.2 633.0 670.8 307.1 577.4 604.4 4.7% p Visitor Spending by Type of Traveler Accommodation ($Million) 159.2 165.4 186.4 204.2 200.7 211.9 227.7 174.3 263.2 203.1 Hotel, Motel, STVR -22.8% q 130.7 131.7 128.3 125.5 136.8 151.1 162.6 48.6 151.0 168.3 Private Home 11.5% p 4.1 4.3 4.3 4.3 4.6 4.8 5.2 4.3 5.4 7.0 Campground 28.7% p 6.9 7.1 6.9 7.1 7.4 7.9 8.1 5.5 4.9 6.6 2nd Home 32.9% p 140.6 141.8 145.2 145.9 150.7 156.2 162.0 37.0 92.2 133.7 Day Travel 44.9% p 441.5 TOTAL 450.3 471.1 487.0 500.1 531.9 565.5 269.8 516.8 518.6 0.4% p Visitor Spending by Commodity Purchased ($Million) 53.7 57.7 67.3 75.5 76.3 81.4 88.2 80.7 99.6 104.5 Accommodations 5.0% p 125.6 127.2 138.5 147.7 149.6 155.9 165.2 75.6 159.6 148.6 Food Service -6.9% q 20.1 20.6 21.9 22.0 21.8 22.0 22.7 9.8 23.3 25.2 Food Stores 8.2% p 111.2 113.1 107.3 100.3 106.8 119.5 124.9 36.5 89.9 99.3 Local Tran. & Gas 10.5% p 60.8 61.6 65.5 68.5 67.8 69.0 71.3 31.1 63.2 57.6 Arts, Ent. & Rec. -8.9% q 69.3 69.8 70.6 72.9 77.8 84.0 93.2 36.0 81.2 83.3 Retail Sales 2.6% p 440.7 TOTAL 450.1 471.1 487.0 500.1 531.9 565.5 269.8 516.8 518.6 0.4% p
The Economic Impact of Travel in California / 2022p / Prepared by Dean Runyan Associates 243
Stanislaus County / Detail Trend
Details may not add to totals due to rounding. Percent change calculated on unrounded figures.
*Other Travel includes ground transportation and air travel impacts for travel to other California visitor destinations, travel arrangement services and convention/trade shows services.
**Retail includes gasoline station employment and earnings.
Economic impacts are attributed to visitor trips which are defined as trips taken by individuals that stay overnight away from home, or travel more than 50 miles one-way on a non-routine trip, as defined by the California Tourism Marketing Act
2013 2014 2015 2016 2017 2018 2019 2020 2021 2022 2021-2022 Travel Industry Earnings ($MIllion) 71.8 77.0 84.0 95.4 97.8 104.9 114.1 99.2 123.0 141.4 Accom. & Food Serv. 15.0% p 28.4 31.0 34.6 38.0 41.3 40.2 43.8 26.4 30.9 40.1 Arts, Ent. & Rec. 30.0% p 13.2 13.7 14.5 15.3 16.8 17.7 18.7 18.9 22.1 23.2 Retail** 4.6% p 8.7 9.1 10.1 11.3 12.4 16.6 18.2 6.6 9.6 7.6 Ground Tran. -20.4% q 6.6 7.4 4.7 5.3 6.5 6.9 7.4 8.5 7.9 9.2 Other Travel* 16.8% p 128.7 TOTAL 138.1 147.9 165.3 174.8 186.2 202.2 159.7 193.5 221.6 14.5% p Travel Industry Employment (Jobs) 3,050 3,170 3,250 3,400 3,380 3,480 3,600 3,050 3,450 3,860 Accom. & Food Serv. 11.8% p 1,650 1,790 1,850 1,890 2,030 1,990 2,070 1,170 1,310 1,620 Arts, Ent. & Rec. 23.0% p 480 480 490 500 540 570 570 530 590 580 Retail** -1.2% q 230 230 250 260 260 320 360 240 340 320 Ground Tran. -4.6% q 210 220 190 200 230 260 260 300 250 270 Other Travel* 7.1% p 5,610 TOTAL 5,900 6,030 6,260 6,440 6,620 6,870 5,270 5,950 6,650 11.8% p
Direct Travel Impacts 2013-2022p
The Economic Impact of Travel in California / 2022p / Prepared by Dean Runyan Associates 244
Stanislaus County / Detail Trend
Direct Travel Impacts 2013-2022p
Details may not add to totals due to rounding. Percent change calculated on unrounded figures.
Local tax receipts include transient occupancy taxes, sales taxes, and airport passenger facility charges paid by visitors, and the property tax payments and sales tax payments attributable to the travel industry income of employees and businesses. State tax receipts include sales tax payments and motor fuel tax payments of visitors, and the income tax payments and sales tax payments attributable to the travel industry income of employees and businesses.
Economic impacts are attributed to visitor trips which are defined as trips taken by individuals that stay overnight away from home, or travel more than 50 miles one-way on a non-routine trip, as defined by the California Tourism Marketing Act
2013 2014 2015 2016 2017 2018 2019 2020 2021 2022 2021-2022 Tax Receipts Generated by Travel Spending ($Millions) 10.3 10.8 11.9 13.0 14.5 16.1 17.4 14.8 20.0 20.0 Local Tax Receipts 0.1% p 34.0 35.1 34.4 33.4 33.8 39.4 42.2 20.2 33.6 35.2 State Tax Receipts 4.6% p 44.3 TOTAL 45.9 46.2 46.4 48.3 55.4 59.6 35.0 53.6 55.2 2.9% p Local Tax Receipts Generated by Travel Spending ($Millions) 6.0 6.4 7.2 8.0 9.2 10.4 11.2 8.3 12.0 12.2 Visitor 1.1% p 4.2 4.4 4.6 5.0 5.3 5.7 6.2 6.5 8.0 7.9 Business or Employee -1.3% q 10.3 TOTAL 10.8 11.9 13.0 14.5 16.1 17.4 14.8 20.0 20.0 0.1% p State Tax Receipts Generated by Travel Spending ($Millions) 29.1 29.9 28.9 27.7 28.4 34.0 36.4 14.6 26.5 27.8 Visitor 5.2% p 4.9 5.3 5.4 5.7 5.4 5.4 5.8 5.6 7.2 7.3 Business or Employee 2.3% p 34.0 TOTAL 35.1 34.4 33.4 33.8 39.4 42.2 20.2 33.6 35.2 4.6% p
The Economic Impact of Travel in California / 2022p / Prepared by Dean Runyan Associates 245
Sutter County / Detail Trend
Details may not add to totals due to rounding. Percent change calculated on unrounded figures.
*Other Travel includes ground transportation and air travel impacts for travel to other California visitor destinations, travel arrangement services and convention/trade shows services.
Economic impacts are attributed to visitor trips which are defined as trips taken by individuals that stay overnight away from home, or travel more than 50 miles one-way on a non-routine trip, as defined by the California Tourism Marketing Act
Direct Travel Impacts 2013-2022p 2013 2014 2015 2016 2017 2018 2019 2020 2021 2022 2021-2022 Direct Travel Spending ($Million) 71.1 74.4 74.2 74.8 82.0 91.9 95.9 39.0 84.2 87.4 Destination Spending 3.9% p 17.0 17.1 15.2 13.5 15.1 17.5 18.3 6.4 10.5 14.8 Other Travel* 41.8% p 88.1 TOTAL 91.5 89.4 88.4 97.1 109.4 114.2 45.4 94.6 102.3 8.1% p Visitor Spending by Type of Traveler Accommodation ($Million) 20.1 22.1 23.5 24.8 28.9 32.9 35.0 22.3 39.1 31.0 Hotel, Motel, STVR -20.9% q 23.2 23.8 22.4 21.9 24.0 26.9 28.3 8.5 26.3 29.3 Private Home 11.5% p 1.7 1.7 1.7 1.7 1.8 1.9 1.9 1.6 1.4 2.0 2nd Home 45.3% p 26.1 26.8 26.5 26.4 27.4 30.2 30.7 6.6 17.4 25.1 Day Travel 44.9% p 71.1 TOTAL 74.4 74.2 74.8 82.0 91.9 95.9 39.0 84.2 87.4 3.9% p Visitor Spending by Commodity Purchased ($Million) 8.3 9.3 10.2 11.0 12.9 14.6 15.6 11.7 16.8 17.8 Accommodations 5.9% p 20.5 21.3 22.1 23.1 24.8 27.2 28.3 11.2 26.5 25.6 Food Service -3.4% q 3.3 3.4 3.5 3.5 3.6 3.7 3.8 1.4 3.8 4.2 Food Stores 10.4% p 17.4 17.9 16.1 14.6 16.2 19.1 19.6 4.5 12.6 15.1 Local Tran. & Gas 20.0% p 10.0 10.4 10.5 10.8 11.3 12.1 12.3 4.6 10.5 10.0 Arts, Ent. & Rec. -5.3% q 11.7 12.1 11.7 11.8 13.3 15.2 16.5 5.6 13.9 14.7 Retail Sales 6.0% p 71.1 TOTAL 74.4 74.2 74.8 82.0 91.9 95.9 39.0 84.2 87.4 3.9% p
The Economic Impact of Travel in California / 2022p / Prepared by Dean Runyan Associates 246
Sutter County / Detail Trend
Details may not add to totals due to rounding. Percent change calculated on unrounded figures.
*Other Travel includes ground transportation and air travel impacts for travel to other California visitor destinations, travel arrangement services and convention/trade shows services.
**Retail includes gasoline station employment and earnings.
Economic impacts are attributed to visitor trips which are defined as trips taken by individuals that stay overnight away from home, or travel more than 50 miles one-way on a non-routine trip, as defined by the California Tourism Marketing Act
2013 2014 2015 2016 2017 2018 2019 2020 2021 2022 2021-2022 Travel Industry Earnings ($MIllion) 13.3 13.7 14.8 15.6 16.5 19.8 21.2 19.3 24.3 28.1 Accom. & Food Serv. 15.7% p 6.0 6.7 7.2 7.4 7.3 7.3 7.5 5.3 6.4 8.0 Arts, Ent. & Rec. 24.1% p 2.4 2.6 2.6 2.7 3.0 3.3 3.5 3.5 4.2 4.5 Retail** 7.7% p 1.2 1.3 1.3 1.5 1.7 2.5 2.7 0.7 1.0 0.9 Ground Tran. -11.8% q 0.6 0.7 0.8 0.9 1.0 1.0 1.1 1.4 1.3 1.7 Other Travel* 32.2% p 23.6 TOTAL 25.0 26.7 28.0 29.5 34.0 36.0 30.2 37.2 43.2 16.0% p Travel Industry Employment (Jobs) 570 580 580 560 580 660 670 590 670 750 Accom. & Food Serv. 11.6% p 570 610 640 620 610 570 550 360 400 470 Arts, Ent. & Rec. 17.9% p 90 90 90 100 100 110 110 100 110 120 Retail** 2.4% p 30 30 30 30 40 50 50 30 50 50 Ground Tran. 2.3% p 30 30 30 40 50 50 50 50 50 60 Other Travel* 19.5% p 1,290 TOTAL 1,350 1,370 1,350 1,380 1,440 1,430 1,130 1,280 1,440 12.7% p
Direct Travel Impacts 2013-2022p
The Economic Impact of Travel in California / 2022p / Prepared by Dean Runyan Associates 247
Sutter County / Detail Trend
Direct Travel Impacts 2013-2022p
Details may not add to totals due to rounding. Percent change calculated on unrounded figures.
Local tax receipts include transient occupancy taxes, sales taxes, and airport passenger facility charges paid by visitors, and the property tax payments and sales tax payments attributable to the travel industry income of employees and businesses. State tax receipts include sales tax payments and motor fuel tax payments of visitors, and the income tax payments and sales tax payments attributable to the travel industry income of employees and businesses.
Economic impacts are attributed to visitor trips which are defined as trips taken by individuals that stay overnight away from home, or travel more than 50 miles one-way on a non-routine trip, as defined by the California Tourism Marketing Act
2013 2014 2015 2016 2017 2018 2019 2020 2021 2022 2021-2022 Tax Receipts Generated by Travel Spending ($Millions) 1.7 1.8 2.0 2.1 2.3 2.7 2.9 2.3 3.4 3.4 Local Tax Receipts 2.0% p 5.8 6.1 5.8 5.5 5.7 6.9 7.3 3.4 5.8 6.2 State Tax Receipts 7.2% p 7.5 TOTAL 7.9 7.7 7.5 8.0 9.6 10.2 5.7 9.2 9.6 5.3% p Local Tax Receipts Generated by Travel Spending ($Millions) 1.0 1.1 1.1 1.2 1.4 1.7 1.8 1.2 1.9 2.0 Visitor 3.3% p 0.8 0.8 0.8 0.8 0.8 1.0 1.0 1.2 1.5 1.5 Business or Employee 0.3% p 1.7 TOTAL 1.8 2.0 2.1 2.3 2.7 2.9 2.3 3.4 3.4 2.0% p State Tax Receipts Generated by Travel Spending ($Millions) 4.9 5.1 4.8 4.5 4.8 5.9 6.2 2.3 4.4 4.7 Visitor 8.4% p 0.9 0.9 1.0 1.0 0.9 1.0 1.1 1.1 1.4 1.5 Business or Employee 3.5% p 5.8 TOTAL 6.1 5.8 5.5 5.7 6.9 7.3 3.4 5.8 6.2 7.2% p
The Economic Impact of Travel in California / 2022p / Prepared by Dean Runyan Associates 248
Tehama County / Detail Trend
Details may not add to totals due to rounding. Percent change calculated on unrounded figures.
*Other Travel includes ground transportation and air travel impacts for travel to other California visitor destinations, travel arrangement services and convention/trade shows services.
Economic impacts are attributed to visitor trips which are defined as trips taken by individuals that stay overnight away from home, or travel more than 50 miles one-way on a non-routine trip, as defined by the California Tourism Marketing Act
Travel Impacts
2013 2014 2015 2016 2017 2018 2019 2020 2021 2022 2021-2022 Direct Travel Spending ($Million) 113.8 116.1 118.7 120.4 124.5 137.5 149.0 88.5 147.2 153.3 Destination Spending 4.2% p 11.0 11.0 9.8 8.5 9.7 11.2 11.7 4.0 6.7 9.6 Other Travel* 42.3% p 124.8 TOTAL 127.1 128.5 129.0 134.2 148.7 160.7 92.6 153.9 162.9 5.8% p Visitor Spending by Type of Traveler Accommodation ($Million) 32.0 34.2 38.0 39.8 38.6 44.4 50.4 34.7 61.8 44.3 Hotel, Motel, STVR -28.2% q 33.4 33.4 31.6 31.1 33.8 37.4 39.9 13.3 40.8 44.9 Private Home 10.1% p 12.8 12.8 12.7 12.8 13.5 14.1 15.2 12.7 15.8 20.2 Campground 28.2% p 15.0 15.1 15.7 16.0 17.0 18.6 19.0 20.7 18.5 23.8 2nd Home 28.7% p 20.6 20.7 20.8 20.7 21.7 23.0 24.5 7.2 10.4 20.1 Day Travel 93.6% p 113.8 TOTAL 116.1 118.7 120.4 124.5 137.5 149.0 88.5 147.2 153.3 4.2% p Visitor Spending by Commodity Purchased ($Million) 19.6 20.7 22.6 23.9 23.8 26.5 29.8 25.5 33.6 33.5 Accommodations -0.3% q 35.0 35.5 37.8 39.4 40.1 43.3 46.4 26.2 48.3 47.6 Food Service -1.5% q 8.8 8.9 9.2 9.1 9.2 9.4 9.8 5.9 10.7 12.7 Food Stores 18.9% p 19.0 19.1 17.6 16.0 17.5 20.3 21.6 8.5 15.4 19.3 Local Tran. & Gas 25.7% p 18.2 18.4 19.2 19.6 19.5 20.5 21.4 11.9 20.1 20.0 Arts, Ent. & Rec. -0.7% q 13.2 13.4 12.2 12.4 14.3 17.5 20.0 10.4 19.1 20.3 Retail Sales 6.1% p 113.8 TOTAL 116.1 118.7 120.4 124.5 137.5 149.0 88.5 147.2 153.3 4.2% p
Direct
2013-2022p
The Economic Impact of Travel in California / 2022p / Prepared by Dean Runyan Associates 249
Tehama County / Detail Trend
Direct Travel Impacts 2013-2022p
Details may not add to totals due to rounding. Percent change calculated on unrounded figures.
*Other Travel includes ground transportation and air travel impacts for travel to other California visitor destinations, travel arrangement services and convention/trade shows services.
**Retail includes gasoline station employment and earnings.
Economic impacts are attributed to visitor trips which are defined as trips taken by individuals that stay overnight away from home, or travel more than 50 miles one-way on a non-routine trip, as defined by the California Tourism Marketing Act
2013 2014 2015 2016 2017 2018 2019 2020 2021 2022 2021-2022 Travel Industry Earnings ($MIllion) 22.1 23.1 27.1 28.2 29.1 31.8 35.1 31.8 39.0 43.1 Accom. & Food Serv. 10.4% p 6.6 6.7 7.2 7.3 7.1 7.0 7.7 6.6 8.0 9.1 Arts, Ent. & Rec. 14.9% p 3.2 3.3 3.3 3.4 3.7 4.1 4.4 4.8 5.0 5.2 Retail** 5.6% p 1.4 1.4 1.5 1.7 2.0 2.9 3.2 1.2 1.3 1.1 Ground Tran. -10.0% q 0.3 0.3 0.4 0.4 0.4 0.5 0.5 0.5 0.5 0.6 Other Travel* 24.9% p 33.6 TOTAL 34.9 39.5 41.0 42.3 46.1 50.9 44.8 53.7 59.2 10.2% p Travel Industry Employment (Jobs) 970 960 1,030 1,060 1,120 1,130 1,150 1,010 1,130 1,200 Accom. & Food Serv. 6.1% p 380 430 420 400 390 380 390 340 370 390 Arts, Ent. & Rec. 4.5% p 110 110 110 110 120 120 130 130 130 140 Retail** 0.5% p 40 40 40 40 40 60 60 60 60 60 Ground Tran. 4.4% p 10 20 20 20 20 20 20 20 20 20 Other Travel* 14.8% p 1,510 TOTAL 1,560 1,610 1,630 1,680 1,700 1,750 1,550 1,720 1,810 5.4% p
The Economic Impact of Travel in California / 2022p / Prepared by Dean Runyan Associates 250
Tehama County / Detail Trend
Direct Travel Impacts 2013-2022p
Details may not add to totals due to rounding. Percent change calculated on unrounded figures.
Local tax receipts include transient occupancy taxes, sales taxes, and airport passenger facility charges paid by visitors, and the property tax payments and sales tax payments attributable to the travel industry income of employees and businesses. State tax receipts include sales tax payments and motor fuel tax payments of visitors, and the income tax payments and sales tax payments attributable to the travel industry income of employees and businesses.
Economic impacts are attributed to visitor trips which are defined as trips taken by individuals that stay overnight away from home, or travel more than 50 miles one-way on a non-routine trip, as defined by the California Tourism Marketing Act
2013 2014 2015 2016 2017 2018 2019 2020 2021 2022 2021-2022 Tax Receipts Generated by Travel Spending ($Millions) 2.8 2.9 3.2 3.3 3.3 3.9 4.4 3.9 5.4 5.1 Local Tax Receipts -4.8% q 6.7 6.8 6.7 6.5 6.6 7.7 8.3 5.2 7.7 8.2 State Tax Receipts 5.4% p 9.5 TOTAL 9.8 10.0 9.8 9.9 11.6 12.7 9.1 13.1 13.3 1.2% p Local Tax Receipts Generated by Travel Spending ($Millions) 1.7 1.8 2.0 2.1 2.1 2.5 2.9 2.2 3.3 3.1 Visitor -4.9% q 1.1 1.1 1.2 1.2 1.2 1.4 1.5 1.8 2.1 2.0 Business or Employee -4.5% q 2.8 TOTAL 2.9 3.2 3.3 3.3 3.9 4.4 3.9 5.4 5.1 -4.8% q State Tax Receipts Generated by Travel Spending ($Millions) 5.4 5.5 5.3 5.1 5.3 6.3 6.8 3.5 5.7 6.1 Visitor 7.7% p 1.2 1.3 1.4 1.4 1.3 1.4 1.5 1.7 2.1 2.1 Business or Employee -1.0% q 6.7 TOTAL 6.8 6.7 6.5 6.6 7.7 8.3 5.2 7.7 8.2 5.4% p
The Economic Impact of Travel in California / 2022p / Prepared by Dean Runyan Associates 251
Trinity County / Detail Trend
Details may not add to totals due to rounding. Percent change calculated on unrounded figures.
*Other Travel includes ground transportation and air travel impacts for travel to other California visitor destinations, travel arrangement services and convention/trade shows services.
Economic impacts are attributed to visitor trips which are defined as trips taken by individuals that stay overnight away from home, or travel more than 50 miles one-way on a non-routine trip, as defined by the California Tourism Marketing Act
Travel Impacts 2013-2022p 2013 2014 2015 2016 2017 2018 2019 2020 2021 2022 2021-2022 Direct Travel Spending ($Million) 49.2 49.6 48.0 51.0 54.0 54.2 58.4 50.8 60.1 63.3 Destination Spending 5.3% p 2.4 2.3 2.0 1.7 1.9 2.2 2.3 0.8 1.3 1.8 Other Travel* 42.3% p 51.6 TOTAL 51.9 50.0 52.8 55.9 56.4 60.7 51.5 61.4 65.1 6.0% p Visitor Spending by Type of Traveler Accommodation ($Million) 12.8 12.4 11.4 13.7 14.8 13.0 14.4 14.3 17.1 12.7 Hotel, Motel, STVR -25.7% q 7.2 7.0 6.4 6.6 6.9 7.1 8.0 2.6 7.9 8.7 Private Home 10.1% p 11.7 12.8 12.7 12.8 13.4 14.1 15.2 12.7 15.9 20.4 Campground 28.4% p 11.2 11.0 11.3 11.5 12.1 13.2 13.5 18.4 16.5 15.6 2nd Home -5.7% q 6.3 6.4 6.2 6.5 6.7 6.8 7.3 2.7 2.7 5.9 Day Travel 118.8% p 49.2 TOTAL 49.6 48.0 51.0 54.0 54.2 58.4 50.8 60.1 63.3 5.3% p Visitor Spending by Commodity Purchased ($Million) 10.7 10.9 10.9 12.1 12.7 12.1 13.1 14.9 16.0 15.8 Accommodations -1.5% q 13.8 13.6 13.6 14.9 15.5 15.2 16.4 14.0 16.9 16.8 Food Service -0.7% q 4.5 4.8 4.8 4.9 5.0 4.9 5.3 4.2 5.9 7.3 Food Stores 23.2% p 7.9 8.1 7.1 6.7 7.4 8.1 8.7 5.3 7.0 9.0 Local Tran. & Gas 28.0% p 7.5 7.5 7.3 7.8 7.9 7.6 8.0 6.8 7.6 7.5 Arts, Ent. & Rec. -1.1% q 4.7 4.7 4.4 4.7 5.5 6.2 6.9 5.5 6.6 6.9 Retail Sales 4.2% p 49.2 TOTAL 49.6 48.0 51.0 54.0 54.2 58.4 50.8 60.1 63.3 5.3% p
Direct
The Economic Impact of Travel in California / 2022p / Prepared by Dean Runyan Associates 252
Trinity County / Detail Trend
Details may not add to totals due to rounding. Percent change calculated on unrounded figures.
*Other Travel includes ground transportation and air travel impacts for travel to other California visitor destinations, travel arrangement services and convention/trade shows services.
**Retail includes gasoline station employment and earnings.
Economic impacts are attributed to visitor trips which are defined as trips taken by individuals that stay overnight away from home, or travel more than 50 miles one-way on a non-routine trip, as defined by the California Tourism Marketing Act
2013 2014 2015 2016 2017 2018 2019 2020 2021 2022 2021-2022 Travel Industry Earnings ($MIllion) 11.0 10.8 10.3 11.4 11.8 10.5 11.8 11.3 13.6 13.7 Accom. & Food Serv. 1.0% p 3.8 3.6 3.4 3.7 3.8 3.8 4.2 4.7 5.5 7.5 Arts, Ent. & Rec. 37.0% p 1.6 1.6 1.6 1.8 1.9 1.4 1.8 2.0 2.1 2.2 Retail** 7.3% p 0.6 0.6 0.6 0.7 0.8 1.1 1.3 0.7 0.5 0.5 Ground Tran. -6.6% q 0.1 0.1 0.1 0.1 0.1 0.1 0.1 0.1 0.1 0.1 Other Travel* 24.6% p 17.0 TOTAL 16.8 16.1 17.7 18.4 17.0 19.2 18.8 21.7 24.0 10.6% p Travel Industry Employment (Jobs) 490 460 420 450 430 380 420 370 420 410 Accom. & Food Serv. -0.8% q 210 200 180 180 170 190 200 220 250 310 Arts, Ent. & Rec. 26.5% p 70 70 60 60 60 50 60 60 70 70 Retail** 3.6% p 20 20 20 20 20 20 30 30 20 30 Ground Tran. 8.3% p <10 <10 <10 <10 <10 <10 <10 <10 <10 <10 Other Travel* 13.3% p 790 TOTAL 750 690 710 680 650 710 690 760 830 8.8% p
Direct Travel Impacts 2013-2022p
The Economic Impact of Travel in California / 2022p / Prepared by Dean Runyan Associates 253
Trinity County / Detail Trend
Direct Travel Impacts 2013-2022p
Details may not add to totals due to rounding. Percent change calculated on unrounded figures.
Local tax receipts include transient occupancy taxes, sales taxes, and airport passenger facility charges paid by visitors, and the property tax payments and sales tax payments attributable to the travel industry income of employees and businesses. State tax receipts include sales tax payments and motor fuel tax payments of visitors, and the income tax payments and sales tax payments attributable to the travel industry income of employees and businesses.
Economic impacts are attributed to visitor trips which are defined as trips taken by individuals that stay overnight away from home, or travel more than 50 miles one-way on a non-routine trip, as defined by the California Tourism Marketing Act
2013 2014 2015 2016 2017 2018 2019 2020 2021 2022 2021-2022 Tax Receipts Generated by Travel Spending ($Millions) 1.0 1.0 0.9 1.0 1.1 1.1 1.2 1.3 1.6 1.5 Local Tax Receipts -2.2% q 2.3 2.3 2.1 2.1 2.2 2.3 2.5 2.2 2.5 2.7 State Tax Receipts 5.7% p 3.3 TOTAL 3.3 3.1 3.2 3.2 3.4 3.7 3.5 4.1 4.2 2.7% p Local Tax Receipts Generated by Travel Spending ($Millions) 0.4 0.5 0.4 0.5 0.5 0.6 0.6 0.6 0.7 0.7 Visitor 0.3% p 0.5 0.5 0.5 0.5 0.5 0.5 0.6 0.7 0.9 0.8 Business or Employee -4.3% q 1.0 TOTAL 1.0 0.9 1.0 1.1 1.1 1.2 1.3 1.6 1.5 -2.2% q State Tax Receipts Generated by Travel Spending ($Millions) 1.7 1.7 1.5 1.5 1.6 1.8 2.0 1.5 1.7 1.8 Visitor 8.8% p 0.6 0.6 0.6 0.6 0.6 0.5 0.6 0.7 0.8 0.8 Business or Employee -0.6% q 2.3 TOTAL 2.3 2.1 2.1 2.2 2.3 2.5 2.2 2.5 2.7 5.7% p
The Economic Impact of Travel in California / 2022p / Prepared by Dean Runyan Associates 254
Tulare County / Detail Trend
Details may not add to totals due to rounding. Percent change calculated on unrounded figures.
*Other Travel includes ground transportation and air travel impacts for travel to other California visitor destinations, travel arrangement services and convention/trade shows services.
Economic impacts are attributed to visitor trips which are defined as trips taken by individuals that stay overnight away from home, or travel more than 50 miles one-way on a non-routine trip, as defined by the California Tourism Marketing Act
Impacts
2013 2014 2015 2016 2017 2018 2019 2020 2021 2022 2021-2022 Direct Travel Spending ($Million) 348.3 368.9 344.9 317.9 404.6 426.4 451.2 255.0 477.5 477.1 Destination Spending -0.1% q 83.6 84.3 74.4 66.0 74.4 85.7 89.2 31.6 51.3 72.7 Other Travel* 41.6% p 431.9 TOTAL 453.2 419.3 383.9 478.9 512.1 540.5 286.6 528.9 549.7 3.9% p Visitor Spending by Type of Traveler Accommodation ($Million) 157.8 171.2 159.9 136.8 204.5 209.7 220.8 153.2 285.5 237.5 Hotel, Motel, STVR -16.8% q 100.6 102.5 93.8 91.3 104.7 113.4 122.6 39.6 113.4 126.5 Private Home 11.5% p 17.6 20.8 20.6 20.9 21.9 23.0 24.8 20.7 25.8 33.0 Campground 27.9% p 26.2 26.7 26.0 26.4 27.7 29.4 30.2 28.6 25.8 35.8 2nd Home 38.6% p 46.0 47.6 44.7 42.4 45.8 50.8 52.9 12.9 27.1 44.3 Day Travel 63.5% p 348.3 TOTAL 368.9 344.9 317.9 404.6 426.4 451.2 255.0 477.5 477.1 -0.1% q Visitor Spending by Commodity Purchased ($Million) 73.1 81.4 79.4 72.6 101.2 104.7 109.7 91.3 136.0 147.9 Accommodations 8.8% p 94.1 98.3 95.4 90.7 113.3 116.8 123.6 66.8 139.0 124.4 Food Service -10.5% q 19.1 20.4 20.1 19.4 21.2 21.2 22.1 13.6 25.0 28.4 Food Stores 13.6% p 74.1 77.0 66.3 57.8 69.7 78.6 82.4 26.2 60.4 68.9 Local Tran. & Gas 14.1% p 45.0 47.1 44.7 41.7 50.8 51.2 52.8 28.1 55.1 48.1 Arts, Ent. & Rec. -12.6% q 42.9 44.8 39.0 35.6 48.5 53.9 60.5 29.0 62.1 59.4 Retail Sales -4.3% q 348.3 TOTAL 368.9 344.9 317.9 404.6 426.4 451.2 255.0 477.5 477.1 -0.1% q
Direct Travel
2013-2022p
The Economic Impact of Travel in California / 2022p / Prepared by Dean Runyan Associates 255
Tulare County / Detail Trend
Direct Travel Impacts 2013-2022p
Details may not add to totals due to rounding. Percent change calculated on unrounded figures.
*Other Travel includes ground transportation and air travel impacts for travel to other California visitor destinations, travel arrangement services and convention/trade shows services.
**Retail includes gasoline station employment and earnings.
Economic impacts are attributed to visitor trips which are defined as trips taken by individuals that stay overnight away from home, or travel more than 50 miles one-way on a non-routine trip, as defined by the California Tourism Marketing Act
2013 2014 2015 2016 2017 2018 2019 2020 2021 2022 2021-2022 Travel Industry Earnings ($MIllion) 74.5 83.3 86.2 84.3 112.6 118.2 126.5 118.3 137.1 160.1 Accom. & Food Serv. 16.8% p 15.9 16.1 16.3 14.4 18.9 20.6 22.1 13.5 16.8 23.9 Arts, Ent. & Rec. 41.8% p 9.7 10.5 9.9 9.6 11.3 11.8 12.4 13.0 15.2 16.2 Retail** 7.2% p 5.5 5.9 5.8 6.0 8.0 11.2 12.2 3.9 5.3 4.5 Ground Tran. -15.9% q 3.6 3.9 3.9 4.3 4.8 4.9 5.3 6.1 6.0 7.6 Other Travel* 26.4% p 109.2 TOTAL 119.7 122.0 118.6 155.5 166.7 178.6 154.8 180.3 212.2 17.7% p Travel Industry Employment (Jobs) 2,930 3,090 3,000 2,770 3,520 3,540 3,580 3,170 3,600 4,020 Accom. & Food Serv. 11.5% p 840 840 820 780 990 1,060 1,110 620 790 1,080 Arts, Ent. & Rec. 35.8% p 370 400 380 350 390 400 410 390 440 440 Retail** 0.8% p 150 160 150 140 170 220 240 190 250 240 Ground Tran. -2.5% q 140 160 160 160 170 170 180 200 190 220 Other Travel* 16.7% p 4,440 TOTAL 4,650 4,510 4,200 5,260 5,390 5,520 4,570 5,270 6,000 13.8% p
The Economic Impact of Travel in California / 2022p / Prepared by Dean Runyan Associates 256
Tulare County / Detail Trend
Direct Travel Impacts 2013-2022p
Details may not add to totals due to rounding. Percent change calculated on unrounded figures.
Local tax receipts include transient occupancy taxes, sales taxes, and airport passenger facility charges paid by visitors, and the property tax payments and sales tax payments attributable to the travel industry income of employees and businesses. State tax receipts include sales tax payments and motor fuel tax payments of visitors, and the income tax payments and sales tax payments attributable to the travel industry income of employees and businesses.
Economic impacts are attributed to visitor trips which are defined as trips taken by individuals that stay overnight away from home, or travel more than 50 miles one-way on a non-routine trip, as defined by the California Tourism Marketing Act
2013 2014 2015 2016 2017 2018 2019 2020 2021 2022 2021-2022 Tax Receipts Generated by Travel Spending ($Millions) 11.3 12.4 12.1 11.0 15.1 16.4 17.4 15.2 22.3 22.8 Local Tax Receipts 2.1% p 25.6 26.9 24.5 22.0 25.6 30.0 32.2 17.6 27.8 28.7 State Tax Receipts 3.5% p 36.9 TOTAL 39.3 36.6 33.0 40.7 46.4 49.6 32.8 50.0 51.5 2.9% p Local Tax Receipts Generated by Travel Spending ($Millions) 7.6 8.4 8.0 7.2 10.3 11.2 11.9 8.8 14.7 15.1 Visitor 2.5% p 3.7 4.0 4.0 3.8 4.8 5.2 5.5 6.4 7.5 7.6 Business or Employee 1.4% p 11.3 TOTAL 12.4 12.1 11.0 15.1 16.4 17.4 15.2 22.3 22.8 2.1% p State Tax Receipts Generated by Travel Spending ($Millions) 21.7 22.7 20.4 18.2 21.0 25.4 27.3 12.3 21.2 21.9 Visitor 3.2% p 3.8 4.2 4.2 3.8 4.6 4.6 4.9 5.2 6.5 6.8 Business or Employee 4.5% p 25.6 TOTAL 26.9 24.5 22.0 25.6 30.0 32.2 17.6 27.8 28.7 3.5% p
The Economic Impact of Travel in California / 2022p / Prepared by Dean Runyan Associates 257
Tuolumne County / Detail Trend
Details may not add to totals due to rounding. Percent change calculated on unrounded figures.
*Other Travel includes ground transportation and air travel impacts for travel to other California visitor destinations, travel arrangement services and convention/trade shows services.
Economic impacts are attributed to visitor trips which are defined as trips taken by individuals that stay overnight away from home, or travel more than 50 miles one-way on a non-routine trip, as defined by the California Tourism Marketing Act
Travel Impacts
2013 2014 2015 2016 2017 2018 2019 2020 2021 2022 2021-2022 Direct Travel Spending ($Million) 178.8 181.6 196.5 215.5 241.1 244.5 262.0 172.4 234.2 242.1 Destination Spending 3.4% p 10.5 10.4 9.1 8.1 9.1 10.6 11.1 4.1 6.5 9.1 Other Travel* 40.8% p 189.3 TOTAL 192.0 205.6 223.6 250.3 255.1 273.1 176.5 240.7 251.2 4.4% p Visitor Spending by Type of Traveler Accommodation ($Million) 78.0 77.9 91.8 108.9 128.9 124.3 134.8 82.0 121.8 110.6 Hotel, Motel, STVR -9.2% q 28.4 28.4 27.2 27.2 28.9 30.9 34.1 11.2 34.3 37.8 Private Home 10.2% p 12.9 15.4 15.4 15.6 16.4 17.2 18.5 15.5 19.3 24.8 Campground 28.1% p 38.1 38.3 39.5 40.2 42.7 46.6 47.7 54.1 48.4 49.3 2nd Home 2.0% p 21.4 21.6 22.5 23.6 24.2 25.5 26.9 9.7 10.4 19.6 Day Travel 89.4% p 178.8 TOTAL 181.6 196.5 215.5 241.1 244.5 262.0 172.4 234.2 242.1 3.4% p Visitor Spending by Commodity Purchased ($Million) 45.6 47.3 54.2 63.3 73.8 72.3 78.3 60.1 76.4 83.2 Accommodations 8.8% p 53.3 53.2 58.8 65.2 71.2 71.2 76.2 49.0 68.6 65.6 Food Service -4.4% q 9.6 10.2 10.8 11.0 11.2 11.2 11.8 7.8 13.4 15.7 Food Stores 17.8% p 24.0 24.5 23.4 22.4 25.4 27.9 29.7 13.8 20.5 23.6 Local Tran. & Gas 14.9% p 28.1 28.1 30.2 32.7 34.7 34.0 35.4 22.8 29.3 27.8 Arts, Ent. & Rec. -5.1% q 18.3 18.3 19.2 20.8 24.8 28.0 30.5 19.0 26.0 26.3 Retail Sales 0.9% p 178.8 TOTAL 181.6 196.5 215.5 241.1 244.5 262.0 172.4 234.2 242.1 3.4% p
Direct
2013-2022p
The Economic Impact of Travel in California / 2022p / Prepared by Dean Runyan Associates 258
Tuolumne County / Detail Trend
Direct Travel Impacts 2013-2022p
Details may not add to totals due to rounding. Percent change calculated on unrounded figures.
*Other Travel includes ground transportation and air travel impacts for travel to other California visitor destinations, travel arrangement services and convention/trade shows services.
**Retail includes gasoline station employment and earnings.
Economic impacts are attributed to visitor trips which are defined as trips taken by individuals that stay overnight away from home, or travel more than 50 miles one-way on a non-routine trip, as defined by the California Tourism Marketing Act
2013 2014 2015 2016 2017 2018 2019 2020 2021 2022 2021-2022 Travel Industry Earnings ($MIllion) 42.7 43.2 47.3 56.1 65.2 64.1 71.0 57.5 73.6 80.1 Accom. & Food Serv. 8.8% p 7.7 6.6 6.6 6.9 7.2 5.7 6.3 5.1 5.5 7.4 Arts, Ent. & Rec. 35.0% p 4.1 4.3 4.6 5.0 4.9 5.2 5.5 6.0 6.5 7.3 Retail** 12.2% p 2.0 2.1 2.3 2.7 3.3 4.5 5.0 2.1 1.7 1.4 Ground Tran. -17.0% q 0.7 0.7 0.6 0.7 0.7 0.8 0.8 0.7 0.8 1.1 Other Travel* 48.3% p 57.2 TOTAL 56.8 61.4 71.4 81.3 80.3 88.7 71.4 88.2 97.4 10.5% p Travel Industry Employment (Jobs) 1,570 1,530 1,560 1,680 1,830 1,780 1,860 1,490 1,740 1,950 Accom. & Food Serv. 12.2% p 400 350 320 350 340 260 280 210 240 300 Arts, Ent. & Rec. 27.2% p 160 160 160 180 160 170 170 170 180 190 Retail** 6.6% p 60 60 60 60 70 90 100 100 80 80 Ground Tran. -3.7% q 30 20 20 30 30 30 30 20 20 30 Other Travel* 38.9% p 2,200 TOTAL 2,120 2,120 2,290 2,430 2,320 2,430 2,000 2,260 2,550 13.0% p
The Economic Impact of Travel in California / 2022p / Prepared by Dean Runyan Associates 259
Tuolumne County / Detail Trend
Direct Travel Impacts 2013-2022p
Details may not add to totals due to rounding. Percent change calculated on unrounded figures.
Local tax receipts include transient occupancy taxes, sales taxes, and airport passenger facility charges paid by visitors, and the property tax payments and sales tax payments attributable to the travel industry income of employees and businesses. State tax receipts include sales tax payments and motor fuel tax payments of visitors, and the income tax payments and sales tax payments attributable to the travel industry income of employees and businesses.
Economic impacts are attributed to visitor trips which are defined as trips taken by individuals that stay overnight away from home, or travel more than 50 miles one-way on a non-routine trip, as defined by the California Tourism Marketing Act
2013 2014 2015 2016 2017 2018 2019 2020 2021 2022 2021-2022 Tax Receipts Generated by Travel Spending ($Millions) 5.4 5.5 6.3 7.3 8.6 8.7 9.5 7.5 10.1 10.5 Local Tax Receipts 3.8% p 8.9 9.0 9.3 9.6 10.3 10.9 11.9 8.2 10.7 10.8 State Tax Receipts 1.0% p 14.3 TOTAL 14.5 15.5 17.0 18.9 19.6 21.4 15.7 20.8 21.3 2.4% p Local Tax Receipts Generated by Travel Spending ($Millions) 3.6 3.7 4.3 5.2 6.2 6.3 6.9 4.7 6.6 7.1 Visitor 8.0% p 1.9 1.8 1.9 2.2 2.4 2.4 2.6 2.8 3.5 3.3 Business or Employee -4.2% q 5.4 TOTAL 5.5 6.3 7.3 8.6 8.7 9.5 7.5 10.1 10.5 3.8% p State Tax Receipts Generated by Travel Spending ($Millions) 6.8 7.0 7.1 7.2 7.8 8.6 9.3 5.5 7.3 7.5 Visitor 2.0% p 2.1 2.1 2.2 2.4 2.5 2.3 2.6 2.7 3.4 3.3 Business or Employee -1.1% q 8.9 TOTAL 9.0 9.3 9.6 10.3 10.9 11.9 8.2 10.7 10.8 1.0% p
The Economic Impact of Travel in California / 2022p / Prepared by Dean Runyan Associates 260
Ventura County / Detail Trend
Direct Travel Impacts 2013-2022p
Details may not add to totals due to rounding. Percent change calculated on unrounded figures.
*Other Travel includes ground transportation and air travel impacts for travel to other California visitor destinations, travel arrangement services and convention/trade shows services.
Economic impacts are attributed to visitor trips which are defined as trips taken by individuals that stay overnight away from home, or travel more than 50 miles one-way on a non-routine trip, as defined by the California Tourism Marketing Act
2013 2014 2015 2016 2017 2018 2019 2020 2021 2022 2021-2022 Direct Travel Spending ($Million) 1,343 1,381 1,437 1,462 1,508 1,568 1,597 886 1,403 1,570 Destination Spending 11.9% p 207 212 197 183 199 224 229 111 142 193 Other Travel* 36.1% p 1,550 TOTAL 1,593 1,634 1,645 1,707 1,793 1,827 997 1,545 1,763 14.1% p Visitor Spending by Type of Traveler Accommodation ($Million) 616 652 693 720 727 739 731 434 700 676 Hotel, Motel, STVR -3.4% q 261 261 270 268 294 322 347 156 356 385 Private Home 8.1% p 53 53 54 55 57 60 65 54 68 87 Campground 28.1% p 43 43 44 45 49 55 56 119 107 103 2nd Home -3.9% q 370 372 375 375 381 393 398 122 172 319 Day Travel 85.5% p 1,343 TOTAL 1,381 1,437 1,462 1,508 1,568 1,597 886 1,403 1,570 11.9% p Visitor Spending by Commodity Purchased ($Million) 233 256 283 307 308 317 319 218 345 400 Accommodations 15.8% p 413 418 438 453 465 478 486 275 429 458 Food Service 6.7% p 54 55 57 56 56 56 58 39 57 70 Food Stores 22.0% p 230 235 220 204 217 236 238 102 174 202 Local Tran. & Gas 16.2% p 192 194 199 201 202 203 201 101 161 169 Arts, Ent. & Rec. 5.4% p 222 224 240 241 259 278 295 152 238 272 Retail Sales 14.3% p 1,343 TOTAL 1,381 1,437 1,462 1,508 1,568 1,597 886 1,403 1,570 11.9% p
The Economic Impact of Travel in California / 2022p / Prepared by Dean Runyan Associates 261
Ventura County / Detail Trend
Direct Travel Impacts 2013-2022p
Details may not add to totals due to rounding. Percent change calculated on unrounded figures.
*Other Travel includes ground transportation and air travel impacts for travel to other California visitor destinations, travel arrangement services and convention/trade shows services.
**Retail includes gasoline station employment and earnings. Economic impacts are attributed to visitor trips which are defined as trips taken by individuals that stay overnight away from home, or travel more than 50 miles one-way on a non-routine trip, as defined by the California Tourism Marketing Act
2013 2014 2015 2016 2017 2018 2019 2020 2021 2022 2021-2022 Travel Industry Earnings ($MIllion) 256 264 284 294 334 351 364 290 344 423 Accom. & Food Serv. 23.0% p 93 93 95 100 99 103 102 75 78 81 Arts, Ent. & Rec. 3.9% p 37 39 42 43 47 49 51 50 54 57 Retail** 6.0% p 21 22 24 26 28 35 37 18 20 18 Ground Tran. -12.0% q 35 37 39 40 42 44 44 42 34 41 Other Travel* 20.2% p 442 TOTAL 454 484 503 549 582 599 475 529 619 17.0% p Travel Industry Employment (Jobs) 9,610 9,640 9,870 9,810 10,610 10,750 10,660 8,510 9,240 10,480 Accom. & Food Serv. 13.5% p 3,940 3,860 3,860 3,800 3,430 3,560 3,420 2,280 2,250 2,600 Arts, Ent. & Rec. 15.5% p 1,240 1,260 1,310 1,310 1,390 1,430 1,410 1,320 1,340 1,340 Retail** 0.1% p 530 540 560 570 570 670 720 630 640 630 Ground Tran. -0.9% q 760 800 800 820 800 820 830 780 650 680 Other Travel* 4.6% p 16,080 TOTAL 16,090 16,400 16,320 16,800 17,230 17,040 13,510 14,110 15,730 11.5% p
The Economic Impact of Travel in California / 2022p / Prepared by Dean Runyan Associates 262
Ventura County / Detail Trend
Direct Travel Impacts 2013-2022p
Details may not add to totals due to rounding. Percent change calculated on unrounded figures.
Local tax receipts include transient occupancy taxes, sales taxes, and airport passenger facility charges paid by visitors, and the property tax payments and sales tax payments attributable to the travel industry income of employees and businesses. State tax receipts include sales tax payments and motor fuel tax payments of visitors, and the income tax payments and sales tax payments attributable to the travel industry income of employees and businesses.
Economic impacts are attributed to visitor trips which are defined as trips taken by individuals that stay overnight away from home, or travel more than 50 miles one-way on a non-routine trip, as defined by the California Tourism Marketing Act
2013 2014 2015 2016 2017 2018 2019 2020 2021 2022 2021-2022 Tax Receipts Generated by Travel Spending ($Millions) 42 44 48 51 52 56 57 42 60 66 Local Tax Receipts 10.5% p 84 87 86 83 85 93 97 58 79 87 State Tax Receipts 10.3% p 127 TOTAL 131 134 134 137 149 154 100 139 153 10.4% p Local Tax Receipts Generated by Travel Spending ($Millions) 28 30 33 36 36 39 39 24 39 45 Visitor 15.4% p 14 14 15 15 16 17 18 19 21 21 Business or Employee 1.4% p 42 TOTAL 44 48 51 52 56 57 42 60 66 10.5% p State Tax Receipts Generated by Travel Spending ($Millions) 68 69 68 66 67 76 79 40 59 66 Visitor 12.0% p 17 17 18 18 18 18 18 18 21 22 Business or Employee 5.5% p 84 TOTAL 87 86 83 85 93 97 58 79 87 10.3% p
The Economic Impact of Travel in California / 2022p / Prepared by Dean Runyan Associates 263
Yolo County / Detail Trend
Details may not add to totals due to rounding. Percent change calculated on unrounded figures.
*Other Travel includes ground transportation and air travel impacts for travel to other California visitor destinations, travel arrangement services and convention/trade shows services.
Economic impacts are attributed to visitor trips which are defined as trips taken by individuals that stay overnight away from home, or travel more than 50 miles one-way on a non-routine trip, as defined by the California Tourism Marketing Act
Travel Impacts 2013-2022p 2013 2014 2015 2016 2017 2018 2019 2020 2021 2022 2021-2022 Direct Travel Spending ($Million) 309.9 320.0 321.7 324.8 378.1 418.2 411.7 236.7 348.4 384.7 Destination Spending 10.4% p 39.7 39.1 34.7 30.5 34.7 40.6 42.7 15.0 24.0 34.0 Other Travel* 41.7% p 349.6 TOTAL 359.1 356.3 355.3 412.8 458.8 454.3 251.7 372.4 418.7 12.4% p Visitor Spending by Type of Traveler Accommodation ($Million) 139.8 145.6 148.6 151.7 191.8 208.4 200.5 168.7 195.8 186.3 Hotel, Motel, STVR -4.9% q 63.1 63.5 62.8 62.7 70.1 77.6 80.6 25.6 83.8 87.3 Private Home 4.2% p 6.4 8.3 8.2 8.3 8.7 9.1 9.9 8.3 10.3 13.2 Campground 28.1% p 3.4 3.5 3.4 3.5 3.7 3.9 4.0 4.3 3.8 3.8 2nd Home -0.5% q 97.2 99.2 98.6 98.5 103.9 119.2 116.7 29.8 54.7 94.1 Day Travel 72.1% p 309.9 TOTAL 320.0 321.7 324.8 378.1 418.2 411.7 236.7 348.4 384.7 10.4% p Visitor Spending by Commodity Purchased ($Million) 44.3 48.2 50.9 53.6 68.4 74.8 72.7 55.9 69.8 73.0 Accommodations 4.5% p 96.7 98.7 101.9 105.6 121.2 132.7 130.8 79.0 115.5 124.4 Food Service 7.7% p 12.0 12.8 13.1 13.0 13.9 14.6 14.4 8.3 14.1 16.6 Food Stores 18.3% p 52.0 53.4 48.2 43.9 50.9 60.5 59.9 21.3 39.3 50.7 Local Tran. & Gas 28.9% p 57.2 58.4 58.9 59.9 66.8 71.5 68.7 39.5 56.9 59.6 Arts, Ent. & Rec. 4.9% p 47.7 48.4 48.7 48.8 56.9 64.1 65.1 32.6 52.8 60.3 Retail Sales 14.2% p 309.9 TOTAL 320.0 321.7 324.8 378.1 418.2 411.7 236.7 348.4 384.7 10.4% p
Direct
The Economic Impact of Travel in California / 2022p / Prepared
Runyan Associates 264
by Dean
Yolo County / Detail Trend
Direct Travel Impacts 2013-2022p
Details may not add to totals due to rounding. Percent change calculated on unrounded figures.
*Other Travel includes ground transportation and air travel impacts for travel to other California visitor destinations, travel arrangement services and convention/trade shows services.
**Retail includes gasoline station employment and earnings.
Economic impacts are attributed to visitor trips which are defined as trips taken by individuals that stay overnight away from home, or travel more than 50 miles one-way on a non-routine trip, as defined by the California Tourism Marketing Act
2013 2014 2015 2016 2017 2018 2019 2020 2021 2022 2021-2022 Travel Industry Earnings ($MIllion) 56.3 58.6 63.1 68.8 81.7 86.1 86.5 72.8 85.0 101.0 Accom. & Food Serv. 18.9% p 22.8 23.7 24.8 26.4 30.1 30.7 30.1 18.3 25.0 35.9 Arts, Ent. & Rec. 43.8% p 8.2 8.6 8.9 9.2 9.7 10.6 11.0 11.4 12.5 12.7 Retail** 1.4% p 4.0 4.2 4.3 4.8 6.0 8.9 9.1 3.3 3.3 3.1 Ground Tran. -5.7% q 2.3 2.1 1.9 1.9 2.1 2.3 2.6 2.4 2.3 2.6 Other Travel* 13.8% p 93.5 TOTAL 97.1 103.1 111.1 129.5 138.6 139.3 108.2 128.1 155.4 21.3% p Travel Industry Employment (Jobs) 2,380 2,450 2,470 2,500 2,870 2,910 2,810 2,290 2,450 2,750 Accom. & Food Serv. 12.2% p 1,520 1,500 1,590 1,560 1,810 1,820 1,880 1,030 1,300 1,830 Arts, Ent. & Rec. 40.4% p 240 250 250 260 270 290 290 280 290 290 Retail** -0.9% q 110 110 110 110 130 170 180 150 160 170 Ground Tran. 9.4% p 60 60 60 60 60 70 70 70 60 70 Other Travel* 6.8% p 4,310 TOTAL 4,370 4,470 4,480 5,140 5,270 5,230 3,820 4,260 5,110 19.7% p
The Economic Impact of Travel in California / 2022p / Prepared by Dean Runyan Associates 265
Yolo County / Detail Trend
Direct Travel Impacts 2013-2022p
Details may not add to totals due to rounding. Percent change calculated on unrounded figures.
Local tax receipts include transient occupancy taxes, sales taxes, and airport passenger facility charges paid by visitors, and the property tax payments and sales tax payments attributable to the travel industry income of employees and businesses. State tax receipts include sales tax payments and motor fuel tax payments of visitors, and the income tax payments and sales tax payments attributable to the travel industry income of employees and businesses.
Economic impacts are attributed to visitor trips which are defined as trips taken by individuals that stay overnight away from home, or travel more than 50 miles one-way on a non-routine trip, as defined by the California Tourism Marketing Act
2013 2014 2015 2016 2017 2018 2019 2020 2021 2022 2021-2022 Tax Receipts Generated by Travel Spending ($Millions) 8.6 9.0 9.9 10.7 13.7 14.9 15.0 12.3 15.6 16.5 Local Tax Receipts 5.6% p 19.2 19.9 19.3 18.7 20.4 23.8 24.2 14.0 19.5 21.9 State Tax Receipts 12.6% p 27.8 TOTAL 28.9 29.2 29.4 34.0 38.8 39.2 26.3 35.1 38.4 9.5% p Local Tax Receipts Generated by Travel Spending ($Millions) 5.4 5.8 6.5 7.2 9.6 10.7 10.6 7.8 10.3 10.9 Visitor 6.0% p 3.2 3.2 3.4 3.5 4.0 4.3 4.3 4.5 5.3 5.6 Business or Employee 5.0% p 8.6 TOTAL 9.0 9.9 10.7 13.7 14.9 15.0 12.3 15.6 16.5 5.6% p State Tax Receipts Generated by Travel Spending ($Millions) 15.8 16.3 15.6 15.0 16.5 19.8 20.2 10.0 14.6 16.7 Visitor 13.9% p 3.4 3.6 3.7 3.7 3.9 4.0 4.0 3.9 4.8 5.2 Business or Employee 8.8% p 19.2 TOTAL 19.9 19.3 18.7 20.4 23.8 24.2 14.0 19.5 21.9 12.6% p
The Economic Impact of Travel in California / 2022p / Prepared by Dean Runyan Associates 266
Yuba County / Detail Trend
Details may not add to totals due to rounding. Percent change calculated on unrounded figures.
*Other Travel includes ground transportation and air travel impacts for travel to other California visitor destinations, travel arrangement services and convention/trade shows services.
Economic impacts are attributed to visitor trips which are defined as trips taken by individuals that stay overnight away from home, or travel more than 50 miles one-way on a non-routine trip, as defined by the California Tourism Marketing Act
Travel Impacts
2013 2014 2015 2016 2017 2018 2019 2020 2021 2022 2021-2022 Direct Travel Spending ($Million) 73.5 73.1 66.7 66.8 81.7 91.3 98.8 47.1 81.2 103.7 Destination Spending 27.7% p 12.9 12.9 11.5 10.2 11.7 13.7 14.3 4.9 8.2 11.6 Other Travel* 42.3% p 86.4 TOTAL 86.1 78.2 77.0 93.4 105.0 113.0 52.0 89.4 115.3 29.0% p Visitor Spending by Type of Traveler Accommodation ($Million) 10.7 6.9 3.1 2.9 12.0 13.1 15.6 10.7 18.1 14.4 Hotel, Motel, STVR -20.1% q 18.2 18.1 17.3 17.1 19.8 22.3 23.8 7.1 22.1 24.6 Private Home 11.4% p 12.8 16.5 16.4 16.6 17.4 18.3 19.7 16.6 20.7 26.5 Campground 28.1% p 4.3 4.4 4.3 4.3 4.6 4.9 5.0 4.4 3.9 8.7 2nd Home 121.3% p 27.6 27.3 25.7 25.9 27.9 32.7 34.5 8.3 16.5 29.5 Day Travel 79.0% p 73.5 TOTAL 73.1 66.7 66.8 81.7 91.3 98.8 47.1 81.2 103.7 27.7% p Visitor Spending by Commodity Purchased ($Million) 8.6 8.1 6.9 7.1 11.1 11.7 13.0 10.7 13.5 16.8 Accommodations 24.7% p 19.6 19.0 18.1 19.0 22.9 25.3 27.4 12.2 23.3 28.3 Food Service 21.3% p 6.1 6.9 7.0 7.0 7.4 7.7 8.1 5.5 8.2 10.7 Food Stores 30.9% p 17.5 18.0 15.7 14.3 16.9 20.2 21.5 7.3 14.4 20.2 Local Tran. & Gas 40.8% p 10.0 9.7 9.1 9.3 10.9 11.8 12.4 5.4 9.7 11.8 Arts, Ent. & Rec. 21.2% p 11.7 11.3 10.0 10.1 12.5 14.6 16.3 6.0 12.2 15.9 Retail Sales 30.6% p 73.5 TOTAL 73.1 66.7 66.8 81.7 91.3 98.8 47.1 81.2 103.7 27.7% p
Direct
2013-2022p
The Economic Impact of Travel in California / 2022p / Prepared by Dean Runyan Associates 267
Yuba County / Detail Trend
Direct Travel Impacts 2013-2022p
Details may not add to totals due to rounding. Percent change calculated on unrounded figures.
*Other Travel includes ground transportation and air travel impacts for travel to other California visitor destinations, travel arrangement services and convention/trade shows services.
**Retail includes gasoline station employment and earnings.
Economic impacts are attributed to visitor trips which are defined as trips taken by individuals that stay overnight away from home, or travel more than 50 miles one-way on a non-routine trip, as defined by the California Tourism Marketing Act
2013 2014 2015 2016 2017 2018 2019 2020 2021 2022 2021-2022 Travel Industry Earnings ($MIllion) 12.5 11.4 10.7 11.8 14.7 15.5 17.1 15.7 19.7 23.5 Accom. & Food Serv. 19.4% p 4.9 4.5 4.3 4.4 5.0 6.7 6.8 4.9 7.2 10.0 Arts, Ent. & Rec. 38.5% p 2.7 2.9 2.8 2.9 3.5 3.8 3.8 4.2 4.7 5.0 Retail** 7.2% p 1.2 1.2 1.2 1.4 1.7 2.6 2.9 0.9 1.1 1.1 Ground Tran. 4.5% p 0.4 0.4 0.4 0.5 0.6 0.6 0.6 0.7 0.7 0.9 Other Travel* 24.9% p 21.7 TOTAL 20.5 19.4 20.9 25.6 29.1 31.2 26.3 33.3 40.5 21.5% p Travel Industry Employment (Jobs) 670 590 510 530 640 630 640 570 650 750 Accom. & Food Serv. 14.6% p 290 280 250 260 290 400 400 260 380 580 Arts, Ent. & Rec. 53.9% p 100 100 100 100 120 120 120 120 130 140 Retail** 5.0% p 30 30 30 30 40 50 60 40 50 60 Ground Tran. 21.2% p 20 20 20 20 20 20 20 20 20 30 Other Travel* 13.6% p 1,120 TOTAL 1,030 910 950 1,110 1,230 1,230 1,020 1,240 1,560 25.9% p
The Economic Impact of Travel in California / 2022p / Prepared
Runyan Associates 268
by Dean
Yuba County / Detail Trend
Direct Travel Impacts 2013-2022p
Details may not add to totals due to rounding. Percent change calculated on unrounded figures.
Local tax receipts include transient occupancy taxes, sales taxes, and airport passenger facility charges paid by visitors, and the property tax payments and sales tax payments attributable to the travel industry income of employees and businesses. State tax receipts include sales tax payments and motor fuel tax payments of visitors, and the income tax payments and sales tax payments attributable to the travel industry income of employees and businesses.
Economic impacts are attributed to visitor trips which are defined as trips taken by individuals that stay overnight away from home, or travel more than 50 miles one-way on a non-routine trip, as defined by the California Tourism Marketing Act
2013 2014 2015 2016 2017 2018 2019 2020 2021 2022 2021-2022 Tax Receipts Generated by Travel Spending ($Millions) 1.6 1.5 1.3 1.4 1.9 2.2 2.4 2.1 2.9 3.1 Local Tax Receipts 9.6% p 5.4 5.5 4.9 4.7 5.3 6.5 7.0 3.6 5.5 6.7 State Tax Receipts 21.4% p 7.0 TOTAL 7.0 6.2 6.1 7.2 8.7 9.5 5.7 8.3 9.8 17.4% p Local Tax Receipts Generated by Travel Spending ($Millions) 0.9 0.9 0.7 0.7 1.2 1.4 1.5 1.1 1.5 1.8 Visitor 13.3% p 0.7 0.6 0.6 0.6 0.7 0.8 0.9 1.0 1.3 1.4 Business or Employee 5.2% p 1.6 TOTAL 1.5 1.3 1.4 1.9 2.2 2.4 2.1 2.9 3.1 9.6% p State Tax Receipts Generated by Travel Spending ($Millions) 4.6 4.7 4.2 3.9 4.5 5.6 6.1 2.6 4.2 5.2 Visitor 24.6% p 0.8 0.8 0.7 0.8 0.8 0.9 1.0 1.0 1.3 1.4 Business or Employee 11.2% p 5.4 TOTAL 5.5 4.9 4.7 5.3 6.5 7.0 3.6 5.5 6.7 21.4% p
The Economic Impact of Travel in California / 2022p / Prepared by Dean Runyan Associates 269
Glossary
Term Definition
2nd Home Homes under private ownership for personal use as a seasonal property where a lodging tax is not collected. Only includes spending during trip.
Day Travel
Destination Spending
Greater than 50 miles traveled non-routine to the destination.
Interchangeable with Visitor Spending. Direct spending made by visitors in a destination.
STVR Short Term Vacation Rental, private and semi-private lodging rented by owners or property management companies (e.g. Airbnb, VRBO).
State Taxes
Local Taxes
State taxes generated by travel spending.
City and county taxes generated by travel spending.
Direct Employment Employment generated by direct spending; includes full time, part time, seasonal, and proprietors.
Direct Earnings
Other Spending
Visitor Spending
Hotel, Motel, STVR
Total after-tax net income for travel. It includes wages and salary disbursements, proprietor income, and other earned income or benefits.
Spending by residents on travel arrangement services, or spending for convention activity.
Direct spending made by visitors in a destination.
Accommodation types that house transient lodging activity.
Direct Spending Expenditures made by consumers, combination of Visitor Spending and Other Spending.
Other Overnight Combination of other overnight visitors who stay in campgrounds or 2nd homes.
Private Home
NAICS
Personal residences used to host visiting friends and family overnight.
North American Industry Classification System.
Seasonal Home Homes under private ownership for personal use as a seasonal property where a lodging tax is not collected. Only includes spending during trip.
Person Trips
Individual trips to the destination for all age groups.
Vacation Home Rental Accommodation types that house transient lodging activity.
The Economic Impact of Travel in California / 2022p / Prepared by Dean Runyan Associates 270
Methodology
Travel Impacts Methodology
Primary travel impact analysis will make use of the Regional Travel Impact Model (RTIM), prepared and maintained by Dean Runyan Associates and used for most of our travel impact analysis since 1985. This model was developed to provide robust impact findings at small geography without reliance on annual survey research. This is a “bottom up” approach whereby analysis is conducted at the county level, then aggregated to regions and the state, allowing us to use the most detailed tax, employment, wages, and other data that are available. Our clients have selected this approach to provide particularly detailed and defendable findings for all parts of their constituency.
Because the model does not rely on annual survey research for its primary inputs, we work in other states with a variety of other visitor profile providers, including national panel managers or those making use of intercept or regional web methodology. Analysis is conducted separately by type of visitor lodging, making use of data and modeling appropriate to each. Impact analysis associated with visitors staying in commercial lodging makes use of lodging tax data to calculate lodging sales, then employs expenditure distribution data for these types of visitors to calculate total sales and the distribution among expenditure categories. We maintain our own expenditure distribution database for each state we work in, but also make use of historic and current expenditure data, as available. Rental cabins, condos and other property are included in this category if lodging tax has been applied to sales.
Earnings, employment, and tax receipts are calculated using employment and wage data by business category, for each county, plus the applicable taxes on each type of expenditure. Tax impacts, such as for restaurant, fuel, and retail purchases, are calculated from spending amounts; totals will be checked against data from state sources.
Sales attributed to campers are calculated from campground inventory (separately for public and commercial campgrounds), camping occupancy data and average expenditures for camping parties. Expenditure data will be from expenditure databases that we maintain, augmented by visitor survey data available for California, as available.
Other impacts are calculated in a manner like those for commercial accommodation travelers. Sales attributable to travelers staying in their own second homes, or in rented condo, cabin, and other accommodations, are calculated from inventories of these types of lodging and the associated utilization and expenditure data. Findings are made consistent if some of these sales have been subject to lodging tax. Second home inventories are from US Census sources and any local/regional data available. Other impacts are calculated in a manner like those for commercial accommodation travelers.
(Continued on next page)
The Economic Impact of Travel in California / 2022p / Prepared by Dean Runyan Associates 271
Methodology / Continued
Travel Impacts Methodology
Day travel spending is calculated as a factor of overnight spending, with the proportions based on visitor data for California travelers. This analysis will rely the most on visitor profile data provided by the profile contractor. Other impacts are calculated in a similar way as those for commercial accommodation travelers.
All spending estimates are summed for each county and separately for each business category with applicable data then used to calculate earnings, employment, and tax receipts. County totals will be mapped to regions using address and other location data for lodging, camping, and other rental accommodations using separate methods for each type of lodging.
In all cases, our data and methodology are transparent, allowing for reliable error trapping and effective review of findings. All findings are also checked against available comparable data, such as county-level employment data by industry from the US Bureau of Labor Statistics and lodging sales data from STR and Key Data.
Butte County is now assigned to the Shasta Cascade region. In previous years, it was assigned to the Central Valley region. All historical data for the affected regions have been revised in this report.
Please note that data released in April are preliminary estimates, and estimates are updated the following year. In other words, the numbers shown in this report as “2021” are the final revised estimates, which replace the “2021p” (preliminary estimates) shown in last year’s report.
At the state level, the revision between 2021p and 2021 was only 1.9%. Some regional and county revisions to the 2021 preliminary estimates were larger than the historical average. The reason for this greater revision is attributed to the enormous changes in travel behavior during the COVID pandemic, which made economic impacts from travel less predictable than in a typical year. Changes in where people traveled and the type of accommodation in which they stayed were leading drivers of the larger variations in the 2021 final estimates.
The Economic Impact of Travel in California / 2022p / Prepared by Dean Runyan Associates 272
Methodology / Continued
RTIM Industries mapped to NAICS
The following categorization is intended as a high level overview of how our reported industries map to the North American Industry Classification System. It should be noted the NAICS codes are based on responses from individual organizations and are not always a perfect 1:1 alignment with our analysis.
Travel Impact Industry
Accommodation & Food Service
NAICS Industry Code
Accommodation (721)
Food Services and Drinking Places (722)
Residential Property Managers (531311)
Breweries, Wineries, Distilleries (312120, 312130, 312140)**Notes on next page
Arts, Entertainment & Recreation
Retail
Transportation
Air Transportation
Others
Arts, Ent., Recreation (71)
Scenic and Sightseeing Transportation (487)
Motion picture and video exhibition (51213)
Recreational goods rental (532292)
Tour operators (56152)
Food & Beverage Stores (445)
Gasoline Stations (447)
Clothing and Clothing Accessories (448)
Sporting Goods, Hobby, Book and Music Stores (451)
General Merchandise Stores (452)
Miscellaneous Store Retailers (453)
Rail Transportation (482114)
Water Transportation (4831)
Urban transit systems (4851)
Interurban and rural bus transportation (4852)
Taxi and limousine service (4853)
Charter bus industry (4855)
Passenger car rental (532111)
Truck, trailer, and RV rental and leasing (53212)
Parking Lots and Garages (812930)
Scheduled passenger air transportation (481111)
Support activities for air transportation (4881)
Travel agencies (56151)
Convention and Trade Show Organizers (56192)
The Economic Impact of Travel in California / 2022p / Prepared by Dean Runyan Associates 273
**Travel spending on breweries (312120), wineries (312130) and distilleries (312140) are included within the Food Service, Retail, Food Stores, and Recreation industries. It is likely that the bulk of travel-related spending on these alcohol-related NAICS codes occurs within the Food Service category. However, because experiences at breweries, wineries, and distilleries often include a significant experiential component, as well as opportunities for retail purchases, we are unable to allocate exact percentages to the above travel impact categories.
The Economic Impact of Travel in California / 2022p / Prepared by
Runyan Associates 274
Dean
