5 minute read
Distribution of service contact across the cohort


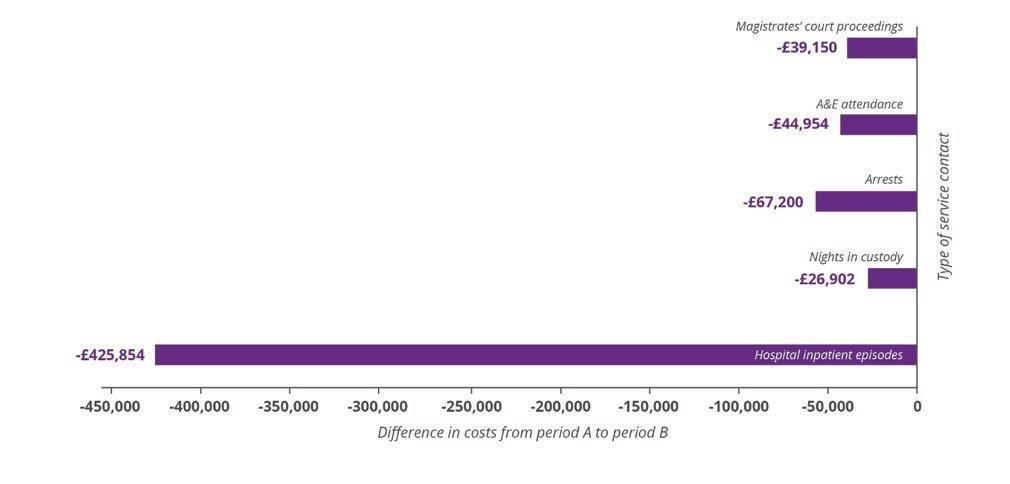
Figure 4. Diff erence in the cost of service contact for the whole cohort (n=116) between period A and period B
5.4 Distribution of service contact across the cohort
Advertisement
Table 3 shows that for each indicator, during the fi rst 12 months of VOICES support, some customers reduced their use of services, some were unchanged and some customers increased service contact. For contact with the criminal justice system, a higher proportion of customers reduced contact (31-37% of the 116) than increased contact (23-25% of 116) across all services. Conversely, for health service contact, the pattern was reversed: A&E episodes increased in 41% of customers and reduced in 28%; inpatient episodes increased in 36% of customers and reduced in 18%. Given the overall reductions for both outcomes observed in Figure 1, these data
of customers reduced contact
across all services
suggest that a small number of customers with extremely frequent contact had reduced their use of services, leading to a reduction in episodes, despite more customers engaging with health care. This raises two points. Firstly, this should not be considered as a means of reducing attendances and associated costs of hospital inpatients, but secondly, this increase might refl ect a positive change toward someone taking better taking care of hitherto neglected health problems.


Table 3. Distribution of static, increased and reduced service interactions, average change and range of change for whole cohort (12 months of data, n=116), cohort with 24 months (n=60) and 36 months (n=27) of data
Increased Unchanged Reduced
Zero interactions Average Change Rate of change
n % n % n %
Year 1
Arrests 29 25.0 9 7.8 43 37.1 13 -0.59 -20 to +20
Nights in custody 28 24.1 4 3.4 37 31.9 25 -0.55 -26 to +17
Magistrates' court proceedings 27 23.3 7 6.0 42 36.2 18 -1.23 -24 to +20
A&E attendance 47 40.5 11 9.5 32 27.6 16 0.67 -44 to +32
Hospital inpatient episodes 42 36.2 5 4.3 21 18.1 39 0.20 -84 to +26
Year 1 and 2
Arrests 21 35.0 3 5.0 18 30.0 6 0.27 -20 to +20
Nights in custody 20 33.3 2 3.3 18 30.0 8 -0.06 -26 to +17
Magistrates' court proceedings 20 33.3 2 3.3 19 31.7 7 -0.75 -23 to +20
A&E attendance 34 56.7 1 1.7 14 23.3 3 3.43 -15 to +32
Hospital inpatient episodes 24 40.0 3 5.0 11 18.3 16 1.35 -29 to +24
Year 1 and 3
Arrests 12 44.4 2 7.4 6 22.2 2 0.41 -20 to +16
Nights in custody 12 44.4 0 0.0 6 22.2 4 0.41 -26 to +15
Magistrates' court proceedings 11 40.7 0 0.0 8 29.6 3 -0.82 -23 to +20
A&E attendance 18 66.7 0 0.0 7 25.9 0 4.88 -15 to +32
Hospital inpatient episodes 14 51.9 2 7.4 3 11.1 6 5.00 -6 to +24
Over years 1 and 2 (in the 60 customers with available data), the proportion of customers who increased versus reduced contact with the criminal justice system was approximately equal (30-32% reduced contact, 33-35% increased contact). The proportion of customers who reported A&E and inpatient episodes was, again, higher than the proportion who reduced use of these services, with a greater discrepancy than observed for the overall cohort (Table 3). Over three years, this changing pattern continued. Among of the 27 customers with 36 months of data, there was a clear pattern of more customers increasing (rather than decreasing) contact with the criminal justice system (41-44% increased, 22-29% reduced) and with health services, emergency and planned (52-67% increased, 11-26% reduced). Figures 5-7 shows that the use of services varies widely across the cohort, with a relatively small number of customers accounting for large increase and decreases. Of note, there were reductions in costs of more than £10,000 in 18 customers and increases of more than £10,000 in nine customers (Figure 5). These cost changes were largely explained by changes in healthcare costs (Figure 6), particularly hospital inpatient stays, given the large unit cost. There was no evidence of an association between customer changes in costs of contact with health care and criminal justice systems (rho=-.005). Possible explanations for increased hospital inpatient episodes include customers engaging with health problems that were previously hidden or ignored. Moreover, 54% of this sample of 116 were aged 60 years or over. The cumulative health eff ects of potentially many years of neglected health needs and unhealthy lifestyles and living conditions, is likely to manifest in chronic and acute health conditions requiring hospital care. Consistent with previous Hard Edges analysis of VOICES, the apparent reductions in off ending (as indicated by reduced contact with the criminal justice system) have much lower impact on costs than health indicators (particularly inpatient episodes). Nevertheless, the consistency of this pattern gives confi dence of sustained benefi t and reduced costs that, over time, will represent marked reductions in the indicators measured and the subsequent and far more costly prison sentences that occur in some cases (but were not measured here). The reduction in crime perpetrated by the cohort also results in fewer victims and lower social and fi nancial costs associated with the consequences of crime.
amongst 27 customers


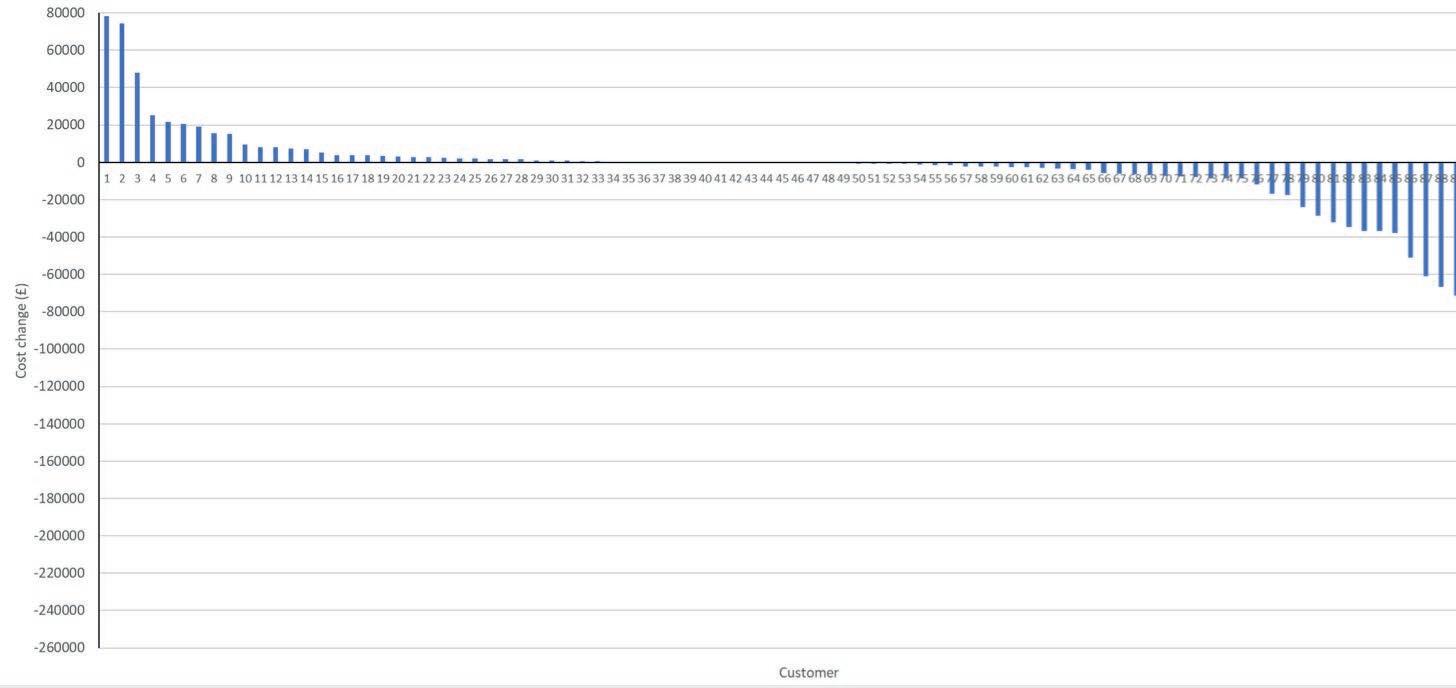
Figure 5. Increase/decrease in the combined cost of service contact for healthcare and criminal justice indicators, by case


