
5 minute read
Housing First


Service contact and associated cost changes from pre-VOICES to the fi rst year of VOICES support were examined by sex (n=36 women, n=80 men). Overall, the service contact cost reduction for women was substantially smaller than for men (-£475 vs. -£7,258 per customer; Table 4). The largest contributor to this discrepancy was the respective change in hospital inpatient episodes: a 9-episode increase in women costing a total of £26,802 (£745 per female customer) and 152-episode reduction in men costing a total of -£452,656 (-£5,658 per male customer). This modest increase in planned hospital care, combined with a reduction in A&E episodes in women suggests an improvement in women’s health care.
However, as Figure 8 illustrates, the per customer average cost of service contact was higher in men than women for all outcomes, except for arrests, which were similar.
Advertisement
Table 4. Change in service contact and cost from 12 months pre-VOICES (period A) to 12 months of VOICES support (Period B), by sex
Women Period A Period B Diff erence between A and B Cost per event / episode £ Overall cost change £ % Change
Arrests 97 36 -61 £336 -£20,496 -62.9
Nights in custody 77 34 -43 £152 -6,536 -55.8
Magistrates' court proceedings 123 64 -59 £150 -£8,850 -48.0
A&E attendance 151 107 -44 £182 -£8,008 -29.1
Hospital inpatient episodes
Total 94 103 9 £2,978 £26,802 9.6
542 -£17,088
Change per customer
Men
-£475
Arrests 320 184 -136 £336 -£45,696 -42.5
Nights in custody 247 126 -121 £152 -£18,392 -49.0
Magistrates' court proceedings 348 160 -188 £150 -£28,200 -54.0
A&E attendance 440 244 -196 £182 -£35,672 -44.5
Hospital inpatient episodes
Total 398 246 -152 £2,978 -£452,656 -38.2
1,753 -£580,616

Figure 8. Changes in the cost of service contact from period A to B, by sex
5.5 Housing First
A key part of the VOICES systems change legacy is the introduction of Housing First, a housing-led approach that off ers unconditional tenancies and support to people experiencing homelessness for as long as they want it. Earlier Hard Edges reports examined service use and costs among VOICES customers who were referred to the former ‘proto–Housing First’ approach. This model drew on Housing First principles but deviated in areas such as use of self-contained supported housing (rather than independent tenancy) and possible withdrawal of support following progress (rather than ongoing availability of support). In 2018, VOICES funded a three-year Housing First programme (then extended funding for another 12 months), which is managed by Brighter Futures, and is truer to the principles outlined by Housing First England. The Centre for Health and Development (CHAD) recently completed an independent evaluation of the post-2018 Housing First Stoke-onTrent. The report can be accessed for more details10 . Here, we summarise data on changes in service use and associated costs for the 18 individuals in the VOICES CRM who received at least 12 months of VOICES support prior to their Housing First referral, 11 of whom were housed.

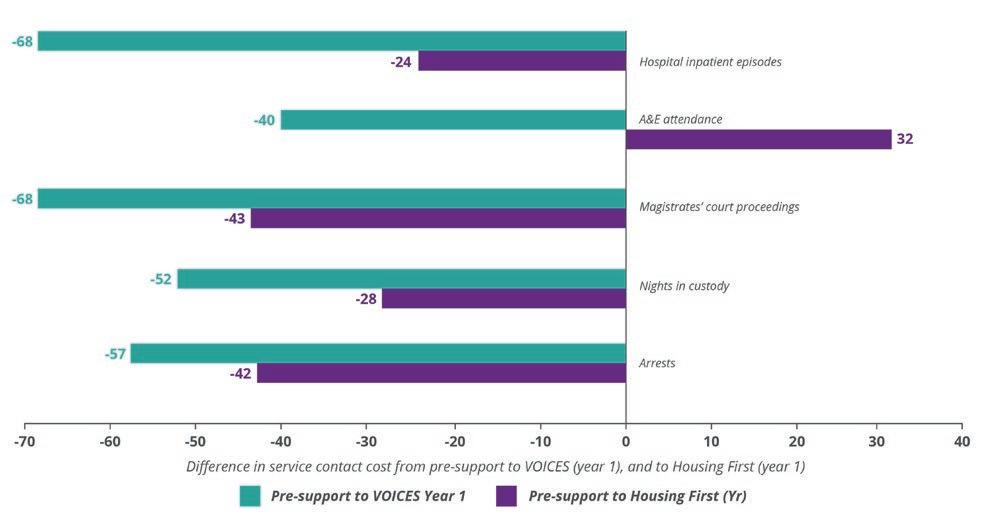
Figure 9. Changes in service use from 12 months before any support (pre-support), to the first 12 months of VOICES, to the first 12 months of Housing First for all 18 Housing First customers
Figure 9 illustrates the large reductions in service use from pre-support to the first 12 months of VOICES among those referred to Housing First, followed by increases in service use during the first 12 months in Housing First. This pattern was similar for most outcomes, but most marked for A&E attendances, which rose during the period of Housing First support to higher levels than those recorded prior to support. However, as above, some of these 18 customers did not get a tenancy within this period. To better understand the impact on service use of receiving a Housing First tenancy, it is more useful to examine changes in service use in the 11 customers who were housed. Table 5 and Figure 10 illustrate that for criminal justice system outcomes, the reduction from pre-support to VOICES was sustained to Housing First, and actually reduced further for criminal justice system use. Again, patterns were less clear for health service use outcomes: A&E episodes increased during VOICES support, then reduced during Housing First to presupport levels; hospital inpatient episodes increased from preVOICES to Year 1 of VOICES support, then increased during Year 1 of Housing First tenancy. The latter could reflect those housed through Housing First were taking better planned care of their health (with concurrent reduction in A&E attendance). Both patterns could also indicate that VOICES customers referred to Housing First were particularly complex, with greater health needs that were better met once in Housing First.

Figure 10.Changes in service use from 12 months before any support (pre-support), to the fi rst 12 months of VOICES, to the fi rst 12 months of Housing First for 11 Housing First customers who were housed
In terms of costs, this reduced service contact in the 11 housed Housing First customers equated to a per customer cost reduction of £11,085, more than twice the reduction in per customer service costs than the £5,207 observed in the wider cohort of VOICES customers (Table 2). The fi ndings are limited by the small number of customers, and we recommend that the full Housing First evaluation report is accessed for more detail.
11 customers


Table 5. Change in service contact and cost in Housing First customers from 12 months pre-VOICES (period A) to 12 months of VOICES support (Period B)
Arrests Service Use
Pre Support VOICES Housing First Pre-VOICES to VOICES Y1 Pre-VOICES to Housing First Y1 VOICES Y1 Housing First Y1 Cost per event / Episode £ Pre-VOICES to VOICES Y1 Pre-VOICES to Housing First Y1
Cost of Service Use
47 20 7 -27 -40 -13 £336 -£9,072 -£13,440
Nights in custody 34 31 6 -3 -28 -25 £152 -£456 -£4,256
Magistrates 61 27 5 -34 -56 -22 £150 -£5,100 -£8,400
A&E attendance 35 49 32 14 -3 -17 £182 £2,548 -£546
Inpatient episodes 65 14 33 -51 -32 19 £2,978 -£151,878 -£95,296
Total change 242 141 83 -101 -159 -58 -£163,958 -£121,938
Change per customer -£14,905 -£11,085


