NATURE OF PLACE SOUTHERN GATEWAY PUBLIC GREEN discovering the potential of holistic design INTEGRATION COMMUNITY ECOLOGY WATER ECONOMY ENERGY WELLNESS RESOURCES CHANGE DISCOVERY


Recognizing the need for and value of sharing resources and maintaining a basic level of consistency across our industry, the HKS Nature of Place content is organized in alignment with the AIA COTE Top ten measures for design. Developed by the AIA Committee on the Environment (COTE), over the last 25 years, these measures have become the de facto standards for evaluating high performance, holistic, architectural projects.
Purpose Statement:
To explore the nature of this place, to reveal its unique character and to seek holistic design solutions. To create places that enhance the human experience. To collaborate, integrate and craft a shared purpose. This project is an opportunity for regeneration, fiscal value, and design excellence.
Uncovering the Nature of Place is where we start. project assessment tool
02NATURE OF PLACE

01 | Integration Design Approach Site History and Context Vernacular Architecture Integration with the Dallas Zoo Regional Visioning and Mobility Network 02 | Community ECultureLPopulationandUsexistingNeighborhoods and Walkability CEducationommunity Services Parks & Open Space Regional Trail Network 03 | Ecology UChainEcoregionsofWetlandsrbanHeatIsland Mitigation Contents 04 | Water Waterways, Floodplain, and Watersheds 05 | Economy Dallas Economic Opportunity Zones Economic Development Opportunities Design and Performance Analyses 06 | Energy Regional Power Mix Building Energy Efficiency Incentives 07 | Wellness Dallas Climate Indicators Urban Heat Island Mitigation Techniques Food Desert Air Quality & Asthma Fitness & Active Design Ozone Pollution 08 | Resources Regionally manufactured materials 09 | Change Future Climate: Temperature Future Climate: Precipitation & Flooding Transportation Trends COVID-19 & Public Space Technology 03NATURE OF PLACE
Sustainability is good design, and good design is sustainable. Integration revolves around how a project is going to uniquely provide beauty in performance. Specifically, how chosen design strategies will positively impact social, economic, and environmental values.
01 | INTEGRATION

01 | INTEGRATION Design Methodology EngagementPublic Outreach & InvolvementCommunity NCTCOG,CityTxDOTofDallasDART Municipal Plans Project Vision Goals & Objectives StakeholdersEngagement DevelopmentEquitablePlan CoordinationwithDallasZooNaturePlaceof INTEGRATION COMMUNITY ECOLOGY WATER ECONOMY WELLNESS RESOURCES DISCOVERYCHANGEENERGY


The Southern Gateway Public Green Foundation aspires to build a green space that is both accessible to the local community and destination for the city The Foundation will measure its success by the economic mobility of the population within a one-mile radius of the park. However, the full scale of this project includes major renovations to I-35E, countless connectivity enhancements, a major addition to the footprint of the Dallas Zoo, and hundreds of millions of dollars in projected economic development.
01 | INTEGRATION Integrated Process Vision EconomicValueINTEGRATIONSocialValueEnvironmentalValue
06NATURE OF PLACE Design Approach
A Public Engagement process led by K-Strategies, and an Equitable Development Plan framework led by C-Suite shall enable community engagement and input for the Park. Public Engagement & Equitable Development Plan
The Southern Gateway Park is a transformative project directly addressing the chronic problem of the city’s north-south divide. Construction on the deck, which will support the park, has begun over I-35E between Ewing Avenue and Marsalis Avenue in Southern Dallas adjacent to the Dallas Zoo.

Those who lost businesses and homes scattered to new neighborhoods, further destabilizing the community.
The nucleus of the Tenth Street neighborhood formed in the 1880s and 1890s south of the floodplains of the Trinity River and on the eastern side of Oak Cliff—a place where the black community could actually own property during Reconstruction and its aftermath. Across generations, the neighborhood grew and nurtured business leaders, artists, and families. Tenth Street is only one of many Dallas neighborhoods eviscerated by highway and infrastructure construction in the 1950s and 1960s. The construction of R.L. Thornton Freeway directly through the middle of the neighborhood in the early 1950s. The highway construction demolished thriving businesses, undercutting its economic heart. The highway also cut Oak Cliff in half, destroying homes and separating neighbors from each other, disrupting the social networks that make neighborhoods thrive.
Source: AIA Dallas, The Road to Disinvestment, Kathryn Holliday, PhD
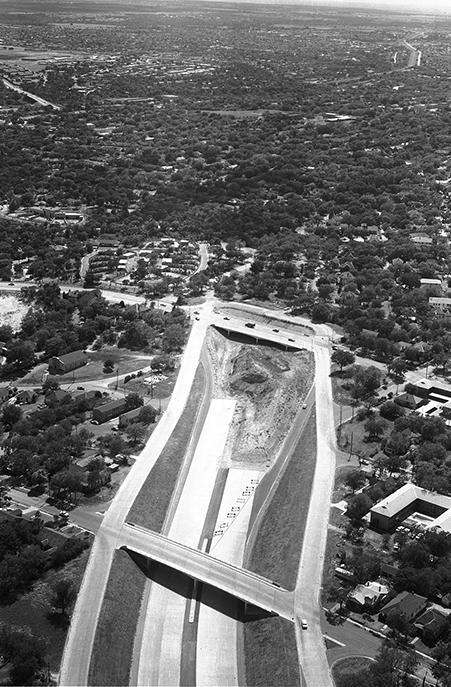
Site History and Context Oak Cliff was once an integrated and connected neighborhood which fostered a vibrant community among its residents. The construction of R.L. Thornton Freeway (I-35E) cut directly through the heart of the Tenth Street neighborhood, demolishing homes and businesses. This view facing south shows that by 1959, construction had proceeded as far as the intersection with Marsalis Avenue, severing connections to Oak Cliff to the east.
01 | INTEGRATION 1930s Pre I-35 1950s I-35 Construction 2000s Post I-35 Source: AIA Dallas Photo by Squire Haskins Photography, courtesy Special Collections, The University of Texas at Arlington StreetTenthDistrict 07NATURE OF PLACE
Neighborhoods/pt/Disinvestment-How-Highways-Divided-the-City-and-Destroyed-https://www.aiadallas.org/v/columns-detail/The-Road-toTenth Street is one of Dallas’ oldest neighborhoods, and it is deeply important to the history of AfricanAmerican culture and life in the city. It is one of the city’s Freedman’s towns, established after the Civil War when freed slaves founded their own neighborhoods.


01 | INTEGRATION TheaterTexas Jefferson Boulevard, looking west from Zang Boulevard 1920 1950 1970 2000 2022
Oak Cliff is a vibrant community with parks, schools, and entertainment
During its zenith, Jefferson Boulevard, Oak Cliff's main street, had retail sales second only to Downtown Dallas. Some of the main businesses included Sears, JCPenney, Rick's Furniture, Western Auto, Baptist Book Store, Top Ten Records, and Lamar & Smith Funeral Homes.
Small-scale redevelopment begins in the Belmont Hotel, Jefferson Blvd, Davis St, and Bishop Arts District Forest Park Zoo, renamed the Dallas Zoo at Marsalis Park in 1925 (left) The Boswell Family, 1912 (right)
Source: AIA ArlingtonSpecialPhotoTenth-Street-is-Bleeding/12g/https://www.aiadallas.org/v/columns-detail/DallasbySquireHaskinsPhotography,courtesyCollections,TheUniversityofTexasat
Southern Gateway Public Green is a firstof-its-kind Oakspaceaccessiblecreatesconnectionphysicalthatapublicly-greenintheheartofCliff
The construction of I-35E divides Oak Cliff's community fabric and creates a strong physical, social, and economic separation Community continues to suffer from systemic disinvestment and is viewed as a lessdesirable neighborhood in the Dallas area
Source: AIA UniversitycourtesyPhotodetail/Tenth-Street-is-Bleeding/12g/https://www.aiadallas.org/v/columns-DallasbySquireHaskinsPhotography,SpecialCollections,TheofTexasatArlington
08NATURE OF PLACE
Site History and Context


Local Material Texture - Neighborhoods and Religious Buildings 09NATURE OF PLACE 01 | INTEGRATION


Local Material Texture - Commercial and Multi-Family Buildings 10NATURE OF PLACE 01 | INTEGRATION


Local Material Texture - Educational Buildings 11NATURE OF PLACE 01 | INTEGRATION


Transportation Corridor - I-35E North-bound I-35E Texas U-Turn on Marsalis Ave North-bound Frontage RoadSouth-bound I-35E 12NATURE OF PLACE 01 | INTEGRATION


13NATURE OF PLACE 01 | INTEGRATION Vernacular Architecture - Dallas Zoo


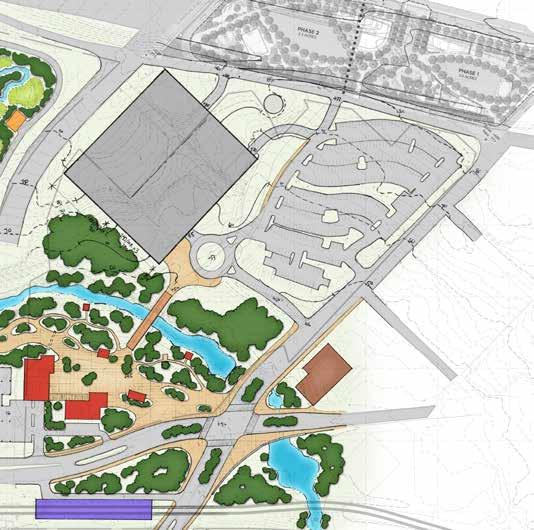
01 | INTEGRATION Source: CLR Design, Dallas Zoo Conceptual Plan, June 2020 Dallas Zoo Master Plan NORTH GARAGE LANDSCAPEBUFFER VEHICULARSITEACCESS DECK PARK CEDARECOLOGYCREEK CEDARECOLOGYCREEK ZOOVILLAGEENTRY ZOO CORRIDORCROSSINGLINK landscapeexternalstandsmuststation,This20 N 200’0’100’ 400’ 2019PLAN SGPG NORTH CONFIDENTIAL; FOR INTERNAL USE ONLY
Parking Garage
Source: CLR Design, Dallas Zoo Master Plan, April 2019 14NATURE OF PLACE
The Dallas Zoo Masrer Plan aims to influence its neighboring community by establishing and enhancing vital landscape corridors, promoting economic growth, and community engagement. A key goal of the Southern Gateway Public Green is to coordinate with the Dallas Zoo, to create a unique, seamless, and prominent connection between the green spaces.
Integration with the Dallas Zoo


Source: 2017 Bond Program by Proposition https://gis.dallascityhall.com/bond/ index.htm
15NATURE OF PLACE
The Capital Improvement Program (CIP) identifies how the City of Dallas spends previously approved bond program funds to invest in City infrastructure such as roads, libraries, parks, recreation centers, police and fire stations, and other facilities. Capital Improvement Program
01 | INTEGRATION
Regional Visioning and Mobility Network
The NCTCOG plan shows the extension of the Street Car system along Marsalis Avenue and its proposed connection to the Dallas Zoo DART Station. Ewing Avenue is a Public Works Capital Improvement project and will include a dedicated bike lane


02 | COMMUNITY
How is the project going to benefit the surrounding community? Designing to human scale has the power to affect a community inside and outside the project through considerations such as walkability, design engagement, social equity, and transportation.
Source: page.aspxpnv/Pages/The-Bottoms-area-plan-landing-https://dallascityhall.com/departments/
The Vision represents a resilient path forward for this community engaged initiative, allowing for growth and maintained character, as well as design guidance for connectivity to future and existing park amenities, walkable streets and a recommended residential architectural form that speaks to reinforcing a sense of community. The urban structure and guidelines area plan was developed using a collaborative, communitybased process under the guidance of the Dallas Citydesign Studio. The plan proposes a set of goals for stakeholders of the Bottom. The plan includes detailed guidance for development of public areas to help foster private development as well as priorities for these public realm improvements.
Land Use Policy Plans
Area plans focus on specific areas of the City that include multiple properties, and provide policies, programs, detailed plans, regulations or incentives. These plans establish land use and development policy in specific areas, and are intended to guide future zoning and development decisions.
The Wynnewood Urban Design Guide (adopted in April 2015) is located in Council District 1. The project area includes the Parks at Wynnewood, an apartment home community, and Wynnewood Village Shopping Center, located in Central Oak Cliff. The study area extends between Zang Boulevard to the north, S. Vernon Street to the west, I-35 to the east, and W. Illinois Ave to the south. The vision of the urban design guide is to serve community stakeholders to shape future development, and for the planning of market-rate Thedevelopment.DallasCity Design Studio proposed recommendations to facilitate the redevelopment of the community to include affordable multi-family and low-income senior housing. Within 20 years, 400 lowincome units would be developed in phases, and additional development would include market rate housing, retail and office.
The Bottom Urban Structure & Guidelines Area Plan (adopted in April 2015) is located in Council District 4. 'The Bottom' is a 126-acre neighborhood, located between Interstate-35E to the west, Corinth Street to the east, Eighth Street to the south and the Trinity River Floodplain to the north.
The BottomWynnewoodDallas Zoo
1mi 02 | COMMUNITY
Source:
Source: Landing-Page.aspxpnv/Pages/Dallas-Zoo-Area-Land-Use-Study-https://dallascityhall.com/departments/ aspxpnv/Pages/Wynnewood-Urban-Design-Guide.https://dallascityhall.com/departments/
The 360 Plan Trinity River Corridor Comprehensive Land Use Study Dallas TOD Area Plans Dallas Zoo Land Use Study The Bottom Urban Structure and Guidelines Wynnewood Urban Design Guide Cedars Area Plan West Davis Land Use Study UNT-Dallas Area Plan I-20 Freeway Corridor Land Use Plan Tenth Street Neighborhood Historic District Lake Cliff Historic District Winnetka Heights Historic District Historic & Conservation DistrictsLand Use Policy Plans 321 1 2 3
The Landmark Historic Districts are zoning areas with special regulations and incentives designed to preserve their historical character.
Recommendations included: discouraging residential hotels as these were deemed an incompatible compatible land use and encouraging additional single-family housing on vacant land, as well as community service oriented, retail and restaurant uses. Economic areadebrisandfrompedestrianinfrastructureRecommendedconcentrationrecommendationsdevelopmentincludedonBeckleyAvenue.transportationandimprovementsincludedandbicycleconnectionsEwingandBeckleyAvenuesalongClarendonDrive,periodicremovalforCedarCreekandwidesidewalkimprovements.
The Dallas Zoo Area Land Use Study (adopted in December 2001) is located in Council District 4. The study area is bounded by R.L. Thornton Freeway (I-35E) to the north and west, Cedar Creek and Fernwood Ave. to the east and Winters Street and Cedar Creek to the south. An analysis of land use and conditions revealed revitalization is linked to the stability of uses in the area and growth requires supportive land use and zoning compatibility.

Single InstitutionalFamily/ Semi-PublicCommercialIndustrialVacantTransitParkingCemeteriesParksFloodWaterEducationControl/Recreation-Retail Office HotelMulti-Family/Motel Source: http://data-nctcoggis.opendata.arcgis.com/datasets/2015-land-use 1mi 02 | COMMUNITY Land Use
The map depicts the distribution of different land uses within a 1-mile radius of the project location. A significant concentration of retail, education, and multi-family uses are located north of the site, while single-family uses are located towards the south.
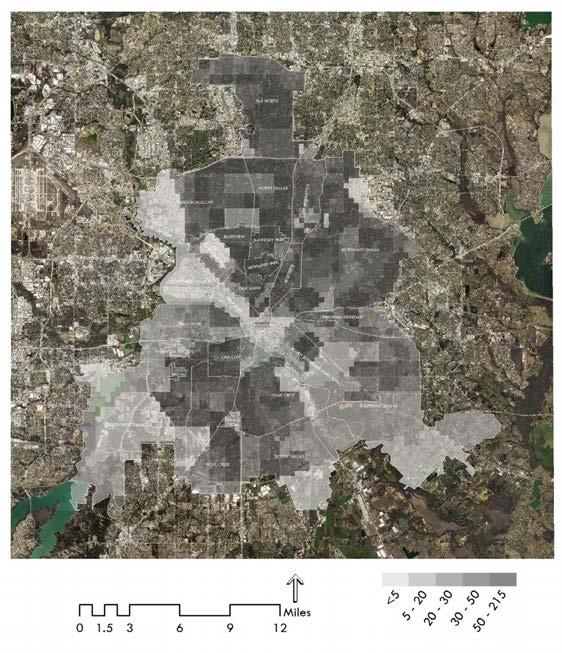
693 947 516 396 635 547 857 934 917 852 1255 765 654 936 1671 1752 1082 1146 1044 1174 651 585 637 1446 1788 1659 625 1191 1315 2016 1551 767 1590 770 162 3 635 1130 1279 747 415 1098 776 1194 305 1201 823 893 473 1071 1123 1964 1800 486 1703 1708 853 573 135 8 776 763 1454 439 1064 2384 8251265 1507 781 89 5 132 1127 776 410 8255 90317191222 1181 1291 11723189377961268501873 1254 413 Source: Dallas Urban Heat Island Management Study, Texas Trees Foundation, 2017 Source: Population data is based on the 2010 US Census Bureau data, published by NCTCOG in 2011Dallas Urban Heat Island Management Study 51 Figure 4.2 Distribution of total population by ½ km2 grid cell in Dallas Figure 4.3 Distribution of population over 65 by ½ km2 grid cell in Dallas Total Population by 1/2 km2 grid cell Dallas Urban Heat Island Management Study 51 Figure 4.2 Distribution of total population by ½ km2 grid cell in Dallas Figure 4.3 Distribution of population over 65 by ½ km2 grid cell in Dallas Population over 65 by 1/2 km2 grid cell 1mi 02 | COMMUNITY Population The map depicts estimates of population counts per Block Group according to the 2010 US Census Bureau. Within a 1-mile radius of the park location, an estimated 7,000 people reside south, while an estimated 13,000 people reside north.

greater
site,
providers,
2019 Population Density 2019 Median Age Broadband2019 Average Household Income My Map 0.6mi My Map 0.6mi Texas Parks & Wildlife, Esri, HERE, Garmin, INCREMENT P, USGS, METI/NASA, EPA, USDA | Esri, US Census Bureau, Infogroup | Esri, HERE, Garmin, INCREMENT P, NGA, USGS My Map 0.6mi Texas Parks & Wildlife, Esri, HERE, Garmin, INCREMENT P, USGS, METI/NASA, EPA, USDA | Esri, US Census Bureau, Infogroup | Esri, HERE, Garmin, INCREMENT P, NGA, USGS My Map 0.6mi Texas Parks & Wildlife, Esri, HERE, Garmin, USGS, NGA, EPA, USDA, NPS | Esri, US Census Bureau, Infogroup | Connected Nation SGPG_Community & USGS, US Esri, HERE, INCREMENT 0.6mi 02 | COMMUNITY Population The maps below depict the block groups and the 2019 population density, median age, average household income, and access to broadband service.
A population of the along with a younger population with an indication of lower household income. service a large population south of the site does not have access to internet
density is found north
service.
In addition, despite broadband availability in this area by


•
02 | COMMUNITY Culture
. This typology should not be confused with the boundaries of Downtown Dallas, as only a portion of Downtown falls within this category (The Dallas Arts District, specifically). This area has primarily commercial, industrial, and multifamily land uses, have high concentrations of publicly-identified cultural assets, public funded public art and cultural experiences, and have the best access to dedicated arts venues in the city.
•
Residential Opportunities for Arts
•
Many of the city’s neighborhoods do not fall neatly into the typologies identified above. These neighborhoods provide Opportunities for Arts in Non-traditional Spaces due to their varied landscapes — apartment complexes, industrial areas, and warehouse districts all fall into
Examples of this type of neighborhood include: Arts District, Cedars, Deep Ellum, Design District, Exposition Office of Cultural Affairs, City of Dallas Cultural Plan Craft Civil Rights House Arts and culture are created and experienced in all corners of the city, but some neighborhoods are hubs of activity for different types of artistic expression or cultural representation while others see considerably less activity than others.
In order to understand how similar, or dissimilar, Dallas neighborhoods are when it comes to accessing cultural assets, the Dallas Cultural Plan team used data to create the Cultural Plan typologies (a set of categories, classifications, or types of information based on commonalities or shared traits.)
Mixed Urbanism Arts to Explore
Many of the city’s older neighborhoods, especially those closer to downtown, have a variety of land-uses, ranging from single family residential, multi-family residential to commercial retail, office buildings, and industrial uses. These neighborhoods have a high density of publicly identified cultural assets, good access to dedicated arts venues, and high concentrations of publicly funded cultural performances and public art.
Less than 2% of the city land area, this typology represents a high concentration of OCA funded arts and cultural experiences, access to public art, and have a large share of the city’s arts and culture-oriented
• Percent
Source: ArcMap,
Examples of this type of neighborhood include: Bachman, Bonton/Ideal, Cadillac Heights, Vickery Meadow rban-Core Arts Destinations
The Cultural Neighborhood Typologies were identified by buildingcommunityWORKSHOP to support the development of the Office of Cultural Affairs 2018 Dallas Cultural Plan process. Four types of neighborhoods were identified across the City of Dallas at the Census Block Group level. The purpose was to identify the level of cultural services available within each block group to help with the OCA's planning process.
Examples of this type of neighborhood include: Bishop Arts District, Lakewood, Frazier, Singing Hills, Valley View, Elm Thicket, Fair Park, La L’Aceate
http:// dallasculturalplan.com/typologies/ Oak Cliff Coalition for the Arts Casa Guanajuato Dallas-Mexico Kessler Park United Methodist Maroches Bakery Dallas Indian Mission UMC Better Block W.E. Greiner Exploratory Arts Academy Oswald Rooming HouseDallasMuseumZooMighty Fine Arts Juanita
Residential neighborhoods make up the majority of Dallas’ developed area, many of which are primarily made up of collections of single family homes, small strip centers, and apartment complexes. Neighborhoods in this typology are mostly single family in nature, with limited access to dedicated arts venues, low concentrations of publicly-identified cultural assets, and fewer OCA-funded public art experiences.
Source: Dallas' Arts & Culture Ecosystem d=true&disable_scroll=false&theme=lighthttp://bcworkshop.maps.arcgis.com/apps/Embed/index.html?webmap=93f369a864de488f82d29a21ca0a1e3d&extent=-97.1888,32.572,-96.2845,33.0458&zoom=true&scale=true&legenhttp://dallasculturalplan.com/cultural-ecosystem-map/Map 0.5mi
The primary data used to identify the four typologies, based on access to cultural resources, are: Concentrations of cultural venues identified through the Dallas Cultural Plan 2018 ecosystem mapping process Access to dedicated arts venues Access to city-funded public art Concentrations of OCA funded performances in FY 2016-2017 of single family residential properties
•
Examples of this type of neighborhood include: Brettonwoods, Casa View, Cedar Crest, Glen Oaks, Lake Highlands Estates, Los Altos, Pleasant Grove, Pleasant Mound, Walnut Hill, White tunities for Arts in Non-Traditional Spaces


on foot
a car) Somewhat Walkable
Sites with inexpensive community-driven design interventions like colorful crosswalks and greenery in concrete lanes may be associated with higher levels of happiness, more trust in strangers, and greater sense of environmental stewardship as compared to typically-designed urban sites. According to this study of participant perception of six urban sites in Vancouver, simple design interventions may increase subjective well-being and sociability among residents
on foot) 75208 75203 75216 75224 Social Value of Parks Walk Score Walk42Score Walk51Score Walk67ScoreWalk51Score
Source:34.2018.1548257Takano,Takehito, Keiko Nakamura, and Masafumi Watanabe. (2002). Urban residential environments and senior citizens’ longevity in megacity areas: The importance of walkable green spaces. Journal of Epidemiology and Community Health, 56(12), 913-918. Senior citizens in urban areas have a higher longevity when the environment around their home includes walkable green spaces, less noise from traffic, and when their homes have more hours of sunlight. Living near parks and tree-lined streets has the greatest effect, adding over 3 years to seniors' lives, while having the space available to take walks was the second-most important of the factors studied, adding 2.7 years to seniors' lives.
0.5mi 22NATURE OF PLACE
Several neighborhoods are located within a 10-minute walking radius of the Southern Gateway Public Green. The park will serve as a community for Lake Cliff, Botello, Tenth St Historic District, Brentwood Trinity Heights, and Bishop Hills. 50-6970-8925-490-24 (most errands can be accomplished Car-Dependent (most errands require a (almost all errands require (some errands can be accomplished
and Walkability
Very Walkable
car) Car-Dependent
Existing Neighborhoods
Source: Walkscore https://www.walkscore.com/TX/Dallas
amenity
02 | COMMUNITY SITE
Source: Negami, Hanna R., Robin Mazumder, Mitchell Reardon, and Colin G. Ellard. “Field Analysis of Psychological Effects of Urban Design: a Case Study in Vancouver.” Cities & Health 2, no. 2 (2018): 106–15. https://doi.org/10.1080/237488


Existing Neighborhoods and Walkability
0.5mi SITE High Walk Score Low Walk Score 0.5mi SITE Source: walkscore.comSource: ArcMap StoryMap, Bishop Dunne Catholic School Geotec Research Lab 23NATURE OF PLACE
A sidewalk inventory indicates that the segment of Marsalis Avenue south of the site has the least pedestrian-friendly infrastructure. Walk Score measures the walkability of any address using a patented system. For each address, Walk Score analyzes hundreds of walking routes to nearby amenities. Points are awarded based on the distance to amenities in each category.
02 | COMMUNITY


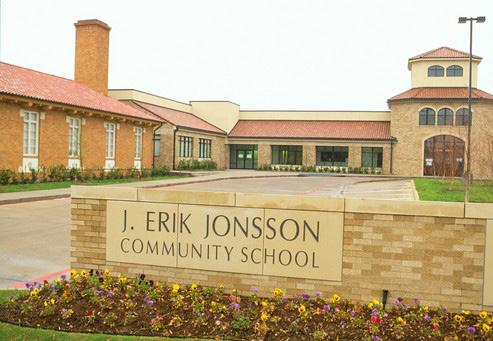
1 2 3 4 5 25 Felix Botello Elementary School School of Liberal Arts/Science W. H. Adamson High School Momentous Elementary School Hector P. Garcia Middle School John H Reagan Elementary School Yvonne A. Ewell Townview Magnet Center Dallas Can Academy John Peeler Elementary School N.W. Harllee Early Childhood Center Franklin D. Roosevelt High School Cedar Crest Elementary School Albert S. Johnston Elementary School Roger Q. Mills Elementary School Golden Rule Charter School Southwest Adventist Jr Academy William B. Miller Elementary School Gremer Junior High School Winnetka Elementary School Margaret B Henderson Elementary School Academy of Dallas Charter School Uplift Pinnacle Preparatory Bud Harrell Elementary School KIPP Truth Elementary School Colorado Institute College Trinity Basin Preparatory Oliver W. Holmes Humanities/Communications Academy2010432156789111213141516171819212223242526 6 7 10 11 12 13 14 15 16 8 91718 19 2021 22 23 24 SITE 26 0.5mi 24NATURE OF PLACE 02 | COMMUNITY Education A number of schools and transit options are located within the immediate context of the Southern Gateway Public Green. A higher distribution of civic and educational facilities are located north of the park.

Southside Economic & Community Development Corporation 71 15 22 13 Youth & Family Health Service Center Oak Cliff Municipal Center North Oak Cliff Branch Library Paul Laurence Dunbar Lancaster-Kiest Branch Library Little Free Library Tyler Street Community Service Outreach The Well Community Center The New Tejas Project Community Center Senior Case Management Center, Trauma Resolution Center AIDS Services of Dallas 1st Choice Adult Day Center Momentous Institute Dallas County Family Resources Superb Assisted Living Home Sweet Home Care Destiny Rose Residential Care Lazarus House Initiative Charity Buckner Family Hope Center at Wynnewood Elmwood Senior Citizen Center Oak Cliff Methodist Church Cliff Temple Baptist Church Blessed Sacrament Catholic Church Greater St James Baptist Church New Comforter Church of God Beckley-Saner Recreation Center Eloise Lundy Recreation Center Recreation Center MunicipalChurch Building Social & Community Services Library13121043321112567891114151238712 1 1 1 02 | COMMUNITY Community Services A large number of social and community services are concentrated north of the site. 4 5 6 8 14 13 3 9 10 11 12 SITE 3 2 2 8 7 0.5mi 25NATURE OF PLACE
02 | COMMUNITY Parks & Open Space Across the United States, 100 million residents don't have a park within a 10-minute walk of their home. Residents of the area surrounding the project site currently do not have access to a neighborhood park within a 0.5-mile walking distance. 1 5 7 8 9 10 15 16 11 12 13 6 Dallas Zoo Turner Plaza Lake Cliff Park Kidd Springs Park Gannon WynnewoodPark Parkway Ruthmeade Park Herndon Park West Trinity Heights Park Tama BonnieRennerParkParkView Park Moore CadillacParkHeights Park Wonderview Park Elmwood Parkway Trinity River Greenbelt Cedar Crest Golf Course NeighborhoodBikeMajorPlaygroundTrailRoute Trail Trail Connection 1 1365271610438911121518 1417 2 4 3 14 Source: ArcMap, City of Dallas Source: The Trust for Public Land, https://parkserve.tpl.org/mapping/index.html?CityID=4819000ParkServe® GolfConservationCourse Special NeighborhoodParks & Community Parks Medians & Parkways 17 18 0.5mi 0.5mi 26NATURE OF PLACE According to The Trust for Public Land's mapping platform of Dallas' existing parks and accessibility, the eastern and southern areas of Oak Cliff have a very high need for parks.


Offer
Regional Trail Network
THE NEXT BIG THING FOR DALLAS: THE LOOP
The LOOP project aims to leverage public and private resources to create a premier urban trail network surrounding the core of Dallas. The Southern Gateway Public Green is situated within a 1.5-mile radius from the southern segment of the Trinity Skyline Trail.
THE VISION THE LOOP will leverage public and private resources to create a premier urban trail network surrounding the core of Dallas that is linked together by a 50-mile dedicated hike and bike loop.
CIRCUIT TRAIL CONSERVANCY - 501(C)(3) The Circuit Trail Conservancy (CTC) will serve as an umbrella organization to lead fundraising and outreach efforts for The Dallas Integrated Trail Circuit. The Board of Trustees include:
Circuit Trail Connection Name Projected Project Cost Amenities / Maintenance City PrivateSourcesSources $20 Million $13 Million Projected 2017 Dallas Bond Program Architectural Upgrades / Maintenance Projected Private Funding Leveraging Combined City/Private Funds Projected Cost of The Loop $10 Million $13 Million $43 Million Private Sources Other Public Sources 1 Miles$21 Million $18 Million $2 Million $2 Million $43 Million LengthProjected Cost Trinity Forest Spine Trail8.7 Miles Trinity Skyline Trail Link0.5 Miles Baker Pump Station Gateway0.5 Miles WHAT DOES IT COST OUR GOAL
Connect people to
LOOPTHECIRCUITTRAILCONSERVANCY
“Dallas is home to beautiful natural open spaces and destination spots which draw residents and visitors to our active and vibrant city. We must connect these city jewels with our neighborhoods and most importantly, our neighborhoods to one another, through a truly contiguous trail
Over a decade ago, the city of Dallas set out to design and build a master trail system that would link neighborhoods to transportation hubs and economic centers – making Dallas more livable and pedestrian friendly. Many miles have been constructed, but budget and time constraints delayed important connectors. By constructing these strategic connectors, we will: Link existing trails to one another, thereby connecting our neighborhoods Leverage our current trail system that creates a contiguous 50-mile recreation opportunity
By forming a strong public-private partnership we will build a strong framework for a premier urban trail network linking our city. By constructing four key connection trails, we will: Create a contiguous 50-mile urban trail Unite neighborhoods and enrich daily life Stimulate economic development a safe, green, healthy transportation option new residents to Dallas nature city and regional pride
Increase tourism Attract
Create a safe and alternative transportation mode
02 | COMMUNITY
Mayorsystem.”Mike Rawlings Jeff Ellerman Linda Owen Larry Dale Mike Terry Joseph Pitchford Rick Perdue Philip Henderson For More Information about The Loop Paula Blackmon 214.352.0900 paula@davisadvocates.com circuittrailconservancy.org Source: https://theloopdallas.org/ Source: https://theloopdallas.org/ SITE Trail Status PlannedFundedCompleted 1.5mi 27NATURE OF PLACE
Capture our


Doing proper research about the native habitat of the site is imperative to creating a symbiotic relationship between ecosystems and human development. Ideally, a project doesn't aim to simply avoid disrupting an ecosystem, but works to enhance the biodiversity of the habitat.
03 | ECOLOGY
Source: Chapman, Cameron, and Richard R. Horner. (2010). Performance assessment of a street-drainage bioretention system. Water Environment Research, 82(2),109-119. Source: McPherson, Greg, James R. Simpson, Paula J. Peper, Scott E. Maco, and Qingfu Xiao. (2005). Municipal forest benefits and costs in five U.S. cities. Journal of Forestry 103(8), 411-416. Event-based sampling on a street-side bioretention facility in Seattle found that over a 2.5-year period, 48-74% of the incoming runoff was infiltrated or evaporated. Outlet pollutant concentrations were significantly lower than those at the inlet for total suspended solids (TSS), total nitrogen, total phosphorus, copper, zinc, and lead. Motor oil was removed most effectively, with 92-96% removal
03 | ECOLOGY Ecoregions Dallas lies between the Piney Woods of east Texas and the Great Plains in the Blackland Prairie. Rolling grasslands are laced with bottomland forests along rivers and creeks. The Trinity River runs through the city, and just south of Downtown is the 6,000-acre Great Trinity Forest, home to an estimated 1,300 plant and animal species.
Theefficiency.monetary benefits of urban trees outweigh their maintenance and other associated costs. In a study of five U.S. cities, each dollar invested in urban trees returned between $1.37 and $3.09 in benefits. Benefits measured include energy savings, atmospheric CO2 absorption, air quality benefits, stormwater runoff reduction, and aesthetic and other benefits gauged by measuring increases in real estate values. Environmental Value of Parks
Source: Vineyard, Donald, Wesley W. Ingwersen, Troy R. Hawkins, Xiaobo Xue, Bayou Demeke, and William Shuster. (2015). Comparing Green and Grey Infrastructure Using Life Cycle Cost and Environmental Impact: A Rain Garden Case Study in Cincinnati, OH. Journal of the American Water Resources Association (JAWRA) 1–19. In a Cincinnati, Ohio watershed, rain gardens were found to cost 42% less over their life cycle and reduce environmental impact by 62-98% when compared with conventional infrastructure to mitigate combined sewer overflows. 1mi NATURE OF PLACE
29


Cedar CreekSource:
Wetlands Estuarine and Marine Deepwater Estuarine and Marine Wetland Freshwater Emergent
Esri, Maxar, GeoEye, Earthstar Geographics, CNES/Airbus DS, USDA, USGS, AeroGRID, IGN, and the GIS User Community Wetland Wetland
Wetlands Estuarine and Marine Deepwater Estuarine and Marine Wetland Freshwater Emergent Wetland Freshwater Forested/Shrub Wetland Freshwater Pond RiverineOtherLake 23, 2020 2 41 mi 31.5 km 1:115,483
Chain of Wetlands Included as a major part of the Dallas Floodway Extension Project is the development of a series of wetland ponds built to reduce flooding and provide ecosystem restoration. When both the Upper and Lower Chain of Wetlands are complete, the two wetland areas will work together to provide heightened flood protection for Dallas and they will encompass a four-mile area from Cedar Creek in the north to Loop 12.
Cedar CreekSource:
03 | ECOLOGY 1mi
Freshwater Forested/Shrub
Freshwater Pond RiverineOtherLake June 23, 2020 0 2 41 mi 0 3 61.5 km 1:115,483
This page was produced by the NWI mapper National Wetlands Inventory (NWI) This map is for general reference only. The US Fish and Wildlife Service is not responsible for the accuracy or currentness of the base data shown on this map. All wetlands related data should be used in accordance with the layer metadata found on the Wetlands Mapper web site. National Wetlands
Source:
https://www.fws.gov/wetlands/data/Mapper.htmlInventory 30NATURE OF PLACE
Esri, Maxar, GeoEye, Earthstar Geographics, CNES/Airbus DS, USDA, USGS, AeroGRID, IGN, and the GIS User Community
This page was produced by the NWI mapper National Wetlands Inventory (NWI) This map is for general reference only. The US Fish and Wildlife Service is not responsible for the accuracy or currentness of the base data shown on this map. All wetlands related data should be used in accordance with the layer metadata found on the Wetlands Mapper web site.

COMBINATION OF TREE CANOPY AND NATURAL TURFS IN URBAN PARKS RESULTS IN 5-10˚C (41-50˚F) COOLER RADIANT TEMPERATURES AND 1-2˚C(3335˚F) AIR TEMPERATURE REDUCTION. 03 | ECOLOGY
Urban Heat Island Mitigation
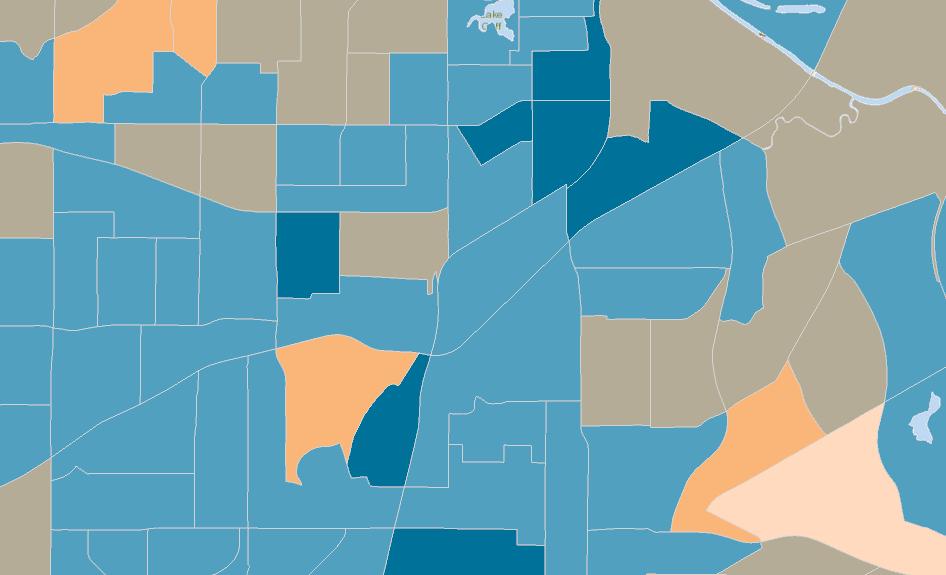
The northern edge of the site has a sparse distribution of tree canopy due to commercial and parking land uses, while the southern edge of the site has a significantly higher distribution of tree canopy due to the Cedar Creek ecology, the Dallas Zoo, and a high concentration of residential neighborhoods. City Texas
Source: Guide to Urban Cooling Strategies, Low Carbon Living CRC, attachments/rp2024_guide_to_urban_cooling_strategies_2017_web.pdfhttp://www.lowcarbonlivingcrc.com.au/sites/all/files/publications_file_2017 Native landscape, Streetscape, and Bioswales Green Walls Green Roofs Source: ArcMap,
of Dallas,
Several strategies for urban heat island mitigation can be implemented on site and within its immediate context. These techniques have a direct correlation to improved microclimate at the human scale as well as on a local neighborhood scale.
Trees Foundation Shapefiles 1mi Urban Vegetation • Evapotranspiration • Shade • Microclimate • Solar energy for photosynthesis 31NATURE OF PLACE


Understanding the water resources available in context to the project site can help design building systems that conserve water. Consider the site's relation to regional watershed to determine the path of drainage.
04 | WATER
04 | WATER 402' 502'452'422' 434' Turtle TrinityCreekRiverWatershed TurtleHeadwatersCreekWatershedFive-MileCreekTrinityRiverWatershed 552' 552' 538' 552' 550' 602' 584' 502' 470'
Waterways, Floodplain, and Watersheds Cedar Creek rises in the Oak Cliff subdivision of Dallas in south central Dallas County, and runs northeast for five miles to its mouth on the Trinity River, a quarter mile southeast of the Atchison, Topeka and Santa Fe line. It runs through Wynnewood, Marsalis, and Moore parks on the back slope of the Austin chalk formation. Most of the area around the creek was subdivided for residential and commercial use by 1923. Where development permits, the stream's banks are wooded, with sugarberry and American elms, cedar elm, Osage orange, ash, red cedar, and various oaks.
33NATURE OF PLACE


Sustainability includes doing the research to make cost-effective design decisions. At the core of sustainability is the question: how do provide more with less? This question encompasses many aspects of economics such as how first-cost investments will improve life-cycle costs, lasting economic performance, notable return-on-investment, appropriate sizing of a project in consideration of intended program, and economic equity strategies.
05 | ECONOMY
GATEWAYSOUTHERN CLUSTER 4 OVERVIEW: SOUTHERN GATEWAY 05 | ECONOMY Dallas Economic Opportunity Zones Opportunity Zones are low income census tracts nominated by governors and certified by the U.S. Department of the Treasury into which investors can now put capital to work financing new projects and enterprises in exchange for certain federal capital gains tax advantages. Dallas has 15 Opportunity Zones located in 9 Dallas neighborhood clusters. Source: Dallas Economic Development, Opportunity Zone Prospectus, September 2019 35NATURE OF PLACE The 15 zonestouch 9 Dallas City Council Districts OZ Cluster Hensley Field West CedarsDallas&Fair Park Southern ForestGarlandBucknerBucknerLancasterGatewayCorridorStation&I30Road&Audelia Council District District 3 District Districts62 & 7 Districts 1 & 4 Districts 3 & 4 District 5 District 7 District 9 District 10 The 15 zonestouch 9 Dallas City Council Districts OZ Cluster 213456789 Hensley Field West CedarsDallas&Fair Park Southern ForestGarlandBucknerBucknerLancasterGatewayCorridorStation&30Road&Audelia Council District District 3 District Districts62 & 7 Districts 1 & 4 Districts 3 & 4 District 5 District 7 District 9 District 10 SOUTHERN GATEWAY


Source: Overview of Texas Enterprise Zone Program, February Dallasenterprise-zone-program_combined_020617.pdfhttps://dallascityhall.com/government/Council%20Meeting%20Documents/eco_2_overview-of-texas-2017EconomicDevelopment,Research&InformationDivision,2016 The Enterprise Zones Program offers state tax benefits for new and expanding businesses in economically distressed areas. A Texas Enterprise Zone is any block group with a poverty rate of 20% or more, as determined by the 2010 Census. Texas Enterprise Zone Program Eligible Areas Enterprise Zones DAVISLEDBETTERSINGLETONCAMP WISDOM HAMPTON SIMPSON STUARTPOLK CENTRAL VIEW CANADA SAMUELL MILITARY2ND CEDARCREST FERGUSONGARLANDABRAMSSKILLMANGREENVILLEHARRYHINES MOCKINGBIRDLEMMON LINEBELT COLLINSGALLOWAY TOWNEAST PRADALA 20 35E 1753012 12 342 310 7805 | ECONOMY Economic Development Opportunities Public / Private Partnership Program (P/PPP) assists for-profit companies and developers with project or operational costs through a number of economic development incentives. Projects located in a Target Area are given special consideration. Target areas have high poverty rates city-identified priorities. The Opportunity Zones incentive is a new community investment tool City of Dallas Public/Private Partnership Program Source: Dallas Economic Development, Research & Information Division, 2019 Source: Neighborhood Revitalization Plan for Dallas, 2015 Target Area Non-Target Area Dallas Economic Opportunity Zones Texas Parks & Wildlife, Esri, HERE, Garmin, SafeGraph, INCREMENT P… + Find address or place ꤆ Too many communities in our great nation feel passed over by economic growth and forgotten by our political private sectors to work together to generate new investments, new businesses, and new good paying Opportunity Act will harness much-needed private capital to flow to more American communities and empower future. Americans of all political stripes should unite behind this critical priority, and its congressional leaders and Kind — demonstrate there is hope for the type of bipartisan action that can provide The Honorable Andrew Young Chair of the Andrew J. Young Foundation, former U.S. Ambassador to the United Nations, Census Tract Census Tract Census20Tract 41 54 Census Tract 54 Census Tract 41 Census Tract 20 Total population: 6,239 Median family income: $42,143 Poverty Rate: 17% Bachelor's Degree Plus Holders: 12% Total Jobs: 426 Total Businesses: 66 Total population: 1,377 Median family income: $24,444 Poverty Rate: 42% Bachelor's Degree Plus Holders: 7% Total Jobs: 989 Total Businesses: 62 Total population: 6,286 Median family income: $39,082 Poverty Rate: 24% Bachelor's Degree Plus Holders: 30% Total Jobs: 1,214 Total Businesses: 119 36NATURE OF PLACE


2011 This broad analysis attempts to place an economic value on the numerous benefits provided by green infrastructure. The report brings together current research on green infrastructure performance and presents methods for calculating related benefits. It offers simple equations to quantify water, energy, air quality, climate change benefits for green roofs, tree planting, bioretention and infiltration, permeable pavement, and water harvesting.
05 | ECONOMY
Throughout the design process, designers may utilize analyses tools that inform our planning, performance & benefits, and maintenance framework. These tools provide a platform for testing various scenarios that result in different outcomes and support the decision-making process.
37NATURE OF PLACE
https://www.cnt.org/sites/default/files/publications/CNT_Valueof-Green-Infrastructure.pdf
The Value of Green Infrastructure: A Guide to Recognizing Its Economic, Environmental and Social Benefits American Rivers and Center for Neighborhood Technology
Design and Performance Analyses
Pathfinder: Landscape Carbon Calculator Climate Postive Design, 2019 This web-based application allows users to estimate the carbon footprint and time to carbon neutral for landscape projects based on site design and management. The only required inputs are project type, site boundaries, and percentage of impervious and pervious surface. Designers may enter information on maintenance including gas- and electric-powered equipment and fertilizer. The output is the Climate Positive Design Scorecard, which includes estimated years to carbon neutral for the project, amount of carbon sequestered and net impact over time up to 100 years, and embodied carbon profile. The site also provides design suggestions to help designers reduce the carbon footprint in the design http://app.climatepositivedesign.com/phase.
Rainwater Harvesting Calculator
State of Washington Department of Ecology
Rainwater-collectionWater-supply/Water-recovery-solutions/https://ecology.wa.gov/Water-Shorelines/use.
i-Tree Eco USDA Forest Service, 2016 i-Tree Eco uses detailed field data from complete inventories or randomly sampled plots to quantify urban forest structure, environmental effects, and value to communities. Eco provides accurate estimates of air pollutant removal and human health impacts, carbon storage and sequestration, and effects of trees on building energy use and emissions. The air quality model includes improved simulations, updated monetary values, and charts and tables that display yearly, monthly, or hourly http://www.itreetools.org/eco/index.phpresults.
2010 This calculator was developed to size and test scenarios for rain water harvesting systems based on the typical climate. Ouputs include monthly cistern carryover and overflow volumes and estimated monthly volumes of captured rainwater for indoor and outdoor


Predicting building energy usage from analyzing building type, intensity of use, and hours of operation can help determine appropriate systems that could be used to conserve energy while improving building performance.
06 | ENERGY
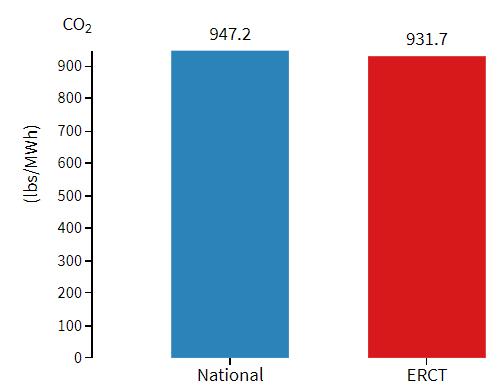
06 | ENERGY 321 Key Takeaways Use Klyde Warren Park as Benchmark and set an Energy Use Intensity (EUI) goal. Electric Reliability Council of Texas (ERCT) regional grid use more more gas than National Average Incentives for building energy efficiently
"
39NATURE OF PLACE
The burning of fossil fuels to provide energy for buildings is a major component of global greenhouse gas emissions, driving climate change. Sustainable design conserves energy while improving building performance, function, comfort, and enjoyment. "


06 | ENERGY
This chart compares the average emission rates (lbs/MWh) in the selected eGRID subregion to the national average emission rates (lbs/MWh) for carbon dioxide (CO2), sulfur dioxide (SO2), and nitrogen oxide (NOX).
Electricity is produced by many different sources of energy, including, but not limited to, wind, solar, nuclear, and fossil fuels. The type and amount of emissions produced depend on how electricity is generated in your region. Type in your zip code (or select a region) to view your power profile.
This chart compares fuel mix (%) of sources used to generate electricity in the selected eGRID subregion to the national fuel mix (%).
EmissionMix
EPA Power https://www.epa.gov/energy/power-profiler#/ERCTProfiler40
Regional Grid Power Profile Electric Reliability Council of Texas (ERCT) regional grid Fuel Rates
Regional
NATURE OF PLACE
Power Mix


• Up to $200,000 for sustainable building strategies or community programs • Examples include solar PV, green roof, green wall, EV charging stations, rainwater harvesting, community garden, etc. • Applications are submitted for approval twice per year (next round is December 2020) Texas Theater • $30,000 donation • 4-kW solar energy array Perot MuseumGreen Mountain Energy (GME) Sun Club Grant • $100,000 donation • 3 large solar hot water systems 06 | ENERGY Building Energy Efficiency Incentives 41NATURE OF PLACE


• Incentives paid = $2,751,901 • 54 projects completed • Average size = 38.98 kW and 140,601 kWh • Average incentive = $50,961 Oncor Solar Incentive Oncor Commercial Standard Offer Program 06 | ENERGY Building Energy Efficiency Incentives 42NATURE OF PLACE


Design strategies that work to increase the comfort, health, and wellness of occupants of the space may include daylight optimization, connections to the outdoors, indoor air quality, and/or thermal, visual, and acoustical comfort. Other strategies include opportunities for occupants to have access to healthy food, activity or exercise, and design decisions around healthy material selections.
07 | WELLNESS
" Understand micro-climatic conditions in outdoor urban spaces and the comfort implications for the people using them.
source: Low Carbon Living CRC 44NATURE OF PLACE
07 | WELLNESS 52134 Key Takeaways
Understanding the micro-climate of the site is key to applying outdoor passive cooling strategies Urban Heat Island Mitigation includes Cool Materials, Urban Vegetation, Water, Shading The site is located in a food desert Air quality is especially bad around the DallashighwayCounty got an "F" grade in the State of the Air 2020 report.
The underlying hypothesis is that these conditions influences people’s behavior and usage of outdoor spaces. "


07 | AVERAGEWELLNESSSUNHOURS AND SUN DAYS AVERAGE RAINFALL AVERAGE UV INDEX MAX, MIN AND AVE TEMPERATURE
monthly
and reliance
comfort
humid subtropical climate. Dallas
rainfall of 23inches. The prevailing wind
maximum temperature
daily sunshine and
Dallas has a experiences a mean of 95F, an average of 9.5 hours highest monthly mean is coming from south to southeast direction the on existing for consumption of modern technology to compensate the level for
in
summer months. source: Worldweatheronline.com Dallas is hot in the summer! Increase outdoor thermal comfort from urban heat mitigation initiatives Decrease demand
its patrons Promote outdoor activities, public life and health Increase resilience to shock and stress events due to climate change 45NATURE OF PLACE
electric grid
energy


DALLAS HAS A HOT AND HUMID SUB-TOPICAL CLIMATE • Maximize operable openings • Maximize North-South facade opening for across ventilation • Create shade for Outdoor spaces • Summer wind comes from South-West director Summer Wind PREVAILING WINDS: SPEED AND DIRECTION source: weather analytics (DFW International Airport) and Ecotect January June AVERAGE AND MAX WIND SPEED 07 | WELLNESS Dallas has a humid subtropical climate. Dallas experiences a monthly mean maximum temperature of 95F, an average of 9.5 hours of daily sunshine and highest monthly mean rainfall of 23 inches. The prevailing wind is coming from south to southeast direction in the summer months. Dallas is hot in the summer! source: Worldweatheronline.com 46NATURE OF PLACE


07 | WELLNESS Urban Heat Island Mitigation Techniques for Dallas' Climate Cool Materials1 LowPaving:Heat Conductivity Low Heat capacity Cool Paving with Permeable featuresCool Paving with high solar Reflectance HighRoof: Solar Reflectance 0.5 mile radius SITE Higher concentration of Impervious pavement north of the site, almost twice as much as south of the side. Source: City of Dallas source: Low Carbon Living CRC source: Worldweatheronline.com 47NATURE OF PLACE


North of the site has significantly less tree canopy due to commercial land use with parking lot. South of the site has significantly more tree canopy due to Cedar creek, the Zoo high concentration of
07 | WELLNESS Urban Vegetation2
and
residential neighborhoods. • Evapotranspiration • Shading • Act as cooler material • Use solar energy for photosynthesis "Combination of tree canopy and natural turfs in urban parks results in 10F-20F cooler radiant temperature and 2F-4F air temperature reduction" Green Roofs Green Walls Native landscape and bioswales Urban Heat Island Mitigation Techniques for Dallas' Climate 48NATURE OF PLACE


07 | WELLNESS Water3 source: Low Carbon Living CRC • Multi Stage (adjustable) Cooling system • Misting Fans Most effective in humid regions Multi Stage cooling system Misting system Urban Heat Island Mitigation Techniques for Dallas' Climate 49NATURE OF PLACE


07 | WELLNESS Shading4 • Using sun angle calculations to maximize shading areas • Pergola with greenery • Shading structure with PV panels source: Low Carbon Living CRC Nasher Sculpture Garden. Detail of the cast aluminum solar shades that create even daylight within the gallery whilst protecting the artwork from the intense sun of Texas Austin City Hall Stanford University Central Energy Facility Urban Heat Island Mitigation Techniques for Dallas' Climate 50NATURE OF PLACE


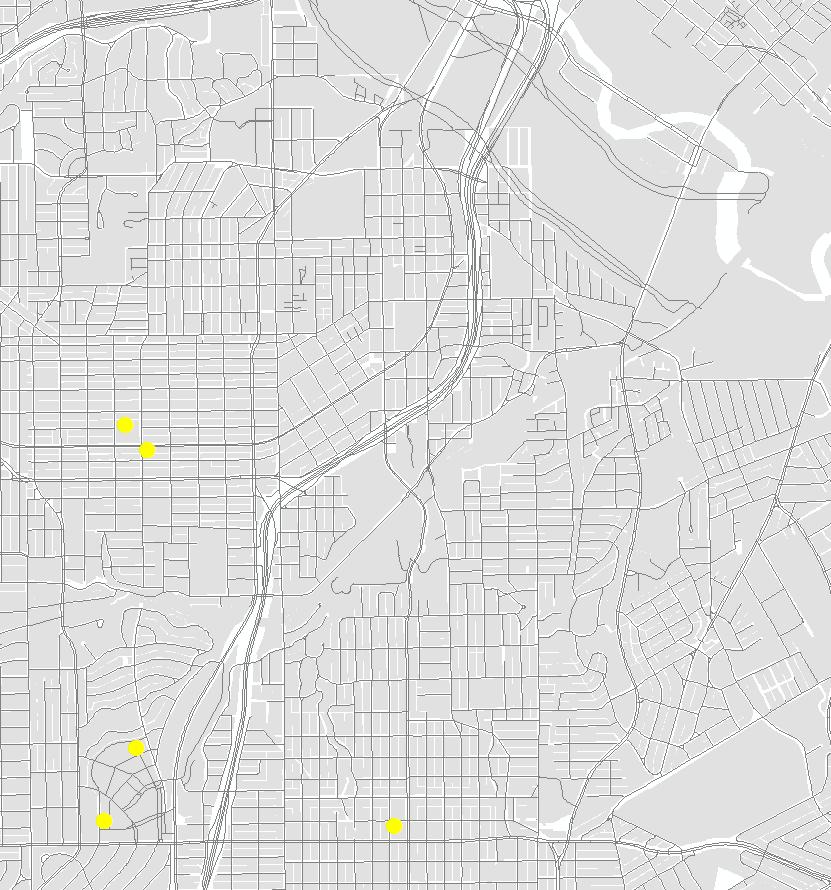
SITE1 4 2 5 3 43215 Fiesta Mart, LLC 1 mile radius Jerry Supermarkets Inc Food KrogerRiteElRancho Supermercado 07 | WELLNESS Food Desert Some low-income communities in the United States lack stores that sell healthy and affordable food. The lack of store access in these communities--sometimes called food deserts--may contribute to poor diet, obesity, and other diet-related illnesses. SITE 1 mile radius Low-income: a poverty rate of 20 percent or greater, or a median family income at or below 80 percent of the statewide or metropolitan area median family income; Low-access: at least 500 persons and/or at least 33 percent of the population lives more than 1 mile from a supermarket or large grocery store. Source: USDA Source: City of Dallas LI and LA at 1 miles (2015) LI and LA at 1/2 miles (2015) 51NATURE OF PLACE


Air Quality and Asthma
07 | WELLNESS
Toxicity Zone (300-500') Elevated Toxicity zone (500-1000')
ElevatedToxicityzone
HighToxicityZone
Children living in this zone have 8x higher incidence of leukemia, 6x incidence of other cancers, significant rate of asthma. Pm levels return to normal levels outside of 1,500'
Highest concentrations of autoemission pollutants
Peak area of small pm that are more lethal in profound health effects, due to deeper penetration into the lungs & body. Pregnant women living in this zone are prone to birth complications, residents have earlier mortality rates from a variety of illnesses.
A MIT study suggests that in the US, 53,000 people a year die prematurely because of automobile pollution, compared to 34,000 people a year who die in traffic accidents.
According to the EPA, studies have found that people who live, work or go to school close to major roads “appear to be more at risk for a variety of short- and long-term health effects, including asthma, reduced lung function, impaired lung development in children, and cardiovascular effects in adults.” The EPA also cites connections between traffic pollution and low birth weights, and impaired lung development in infants. nearly 25 times
0.5 mile radius SITE 52NATURE OF PLACE
greater than baseline particulate matter (pm) exposure. Exposure is 4 times higher inside vehicles not recirculation ventilation with windows up. Ground Zero (0-300')GroundZeroHigh


07 | WELLNESS
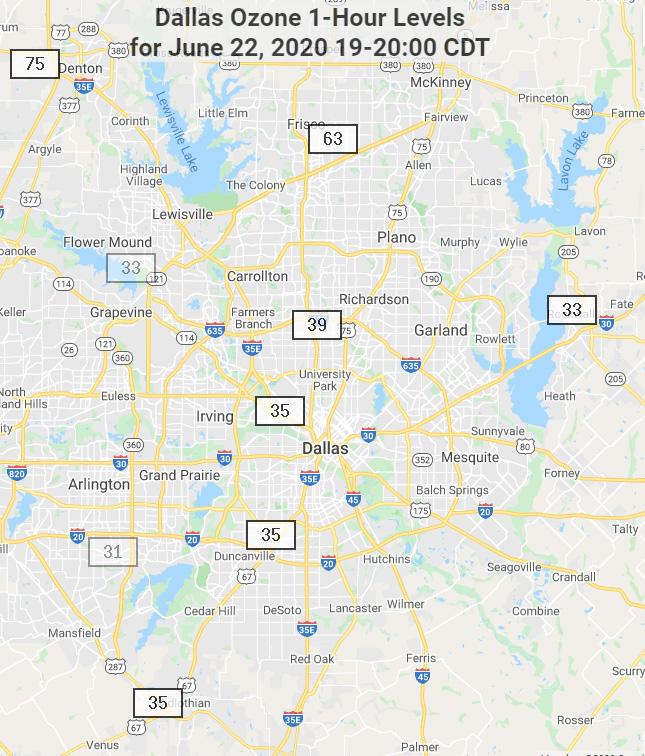
Ozone Pollution
Ozone pollution is a larger problem during warmer months, when weather conditions necessary to form groundlevel ozone normally occur. Pollution from traffic, industry, and other sources, combined with high temperatures and stagnant air conditions of the summer months, make North Central Texas an ideal incubator for ground-level ozone. map shows the latest 1-hour ozone average for each monitoring site in the Dallas Metropolitan Area measured in parts per billion (ppb).
Other
The
include: • Difficulty
• Increased
• Chronic
Dallas County got an "F" grade in the State of the Air 2020 report. levels of ozone can lead to increased respiratory ailments, especially in young children, the elderly, asthma sufferers, and those with chronic conditions. Evidence also indicates a strong correlation between chronic obstructive pulmonary disease (COPD) and ozone in the environment. health effects of high levels of ozone breathing of breath susceptibility to respiratory infection coughing and sore throat of existing conditions such as bronchitis and emphysema Good Up High, Bad Nearby
• Aggravation
Impacts Elevated
Ozone:
Source: https://www.tceq.texas.gov/cgi-bin/compliance/monops/select_curlev.pl http://greendallas.net/air-quality/challenges/ 53NATURE OF PLACE
• Shortness


Responsible material selection starts with life cycle analysis. Selections should be made that consider extraction, manufacturing, and transportation methods as well as durability, disassembly, reuse potential, and end of life deterioration. 08 | RESOURCES

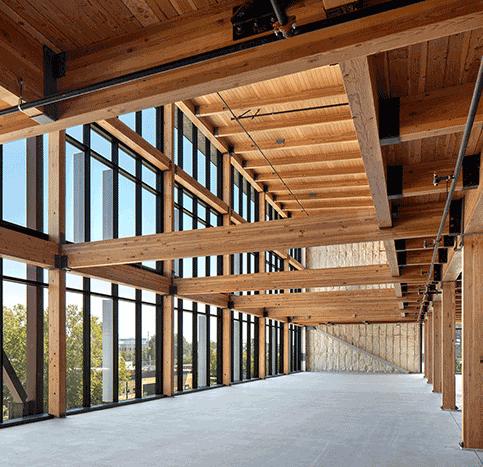
08 | RESOURCES Key Takeaways Mass Timber Benefits include Reduced Carbon footprint, lighter weight for easier transport, faster construction schedule, code tested fire resistance, sofer for construction workers, direct connection to Nature and Thermal resistance 55NATURE OF PLACE


Seek to maintain and enhance usability, functionality, and value over time. 09 | CHANGE
Future Climate - Urban Heat Island Effect Heat island effect can exacerbate impacts of extreme heat effects on vulnerable populations.
Future Climate - Precipitation Longer dry spells, more intense droughts and increases in extreme precipitation events are projected Transportation trends Upward trends in use of ride-hailing services and public transportation.
432156 09 | CHANGE Key Takeaways
Augmented Reality Upward trends in use of ride-hailing services and public transportation. will the current pandemic shape the future of public spaces.
57NATURE OF PLACE
COVID-19 Our
Future Climate - Temperature Unprecedented warming is projected for Texas by the end of the 21st century, with associated increases in extreme heat events.


09 | CHANGE Future Climate By understanding future climate the design team can anticipate changes to building systems demands, energy expenditures, loads, and occupant comfort. Mean annual temperature in Texas has increased by approximately 1˚F since the first half of the 20th century. By 2055, an estimated increase of 20–30 days over 95°F is projected. In 2011, Dallas-Fort Worth area endured 40 consecutive days in excess of 100˚F, which was the second longest streak on record (1898–2011). • Unprecedented warming by the end of the 21st century • Increases in extreme heat events • Increase in intense rainfall • Longer dry spells TEXAS Future Climate 1°F days40 days30 Source: State Climate Summary by DoC and NOAA, 2017 https://statesummaries.ncics.org/ 2035 2070 5°F 20702035INCREASE BYBY8°FINCREASEDiagram Below: Observed and projected changes (compared to the 1901–1960 average) in near-surface air temperature for Texas. Design team should assume 5 °F increase in temperature for mechanical systems design since these systems typically have a 15 years service life. 58NATURE OF PLACE


09 | CHANGE Future Climate - Temperature Source: Right: Climate change to bring North Texas longer droughts, heavy rains, 120-degree temps within 25 years , Dallas Morning News, November 28, 2018 Below: Climate Change Report Projects Bleak Outlook For Texas Economy, San Antonio current, July 28, 2015 Dallas County DFW August TemperaturesTexas: Average Summer Temperature Between 2041 and 2050, Dallas-Fort Worth may see August temperatures rise from a mean of 86 degrees Fahrenheit at the end of the 20th century to 94 degrees, with extremes rising above 120. 59NATURE OF PLACE


10°F35%15°F
Source: Urban Heat Island Management Study, Dallas 2017, by Texas Tree Foundation
09 | CHANGE
Dallas is heating up faster than any other large city in the country, except for Louisville, Kentucky, and Phoenix, Arizona.
There is a potential for lessened heat risk through the adoption of cool materials, vegetative, and integrated strategies.
Future Climate Urban Heat Island Effect: The warming trends reported by climate science often do not reflect the impact of the urban heat island effect, and the magnitude of warming that urban populations are confronting is profoundly underestimated because of the urban heat island effect.
Warm season (May through September) average daily high temperature (°F) in Dallas Distribution of heat deaths during May to September 2011 by ½ km2 grid cell in Dallas
More than 35% impervious surfaces in the city Dallas is 10° F warmer than its surrounding rural areas
The benefit of greening strategies can be as high as 15°F of cooling on hot summer days.
Tree canopy cover across Dallas as percentage of ½ km2 grid cell Surface paving area across Dallas as percentage of ½ km2 grid cell
60NATURE OF PLACE
Planting trees are two times more effective at mitigating the challenges of urban heat than other identified strategies.


Projected changes (%) in annual precipitation for the middle of the 21st century compared to the late 20th century under a higher emissions pathway. Hatching represents areas where the majority of climate models indicate a statistically significant change. Texas is part of a large area in the southwestern and central United States with projected decreases in annual precipitation, but most models do not indicate that these changes are statistically significant. CICS-NC and NOAA NCEI.
09 | CHANGE Future Climate - Precipitation
Higher temperatures increase the rate of soil moisture loss and thus naturally occurring droughts will likely be more intense. Heat makes water reservoirs prone to evaporation. demand for limited water supplies due to rapid population growth, especially in urban areas, may increase Texas’ vulnerability to naturally occurring droughts.
Source:
StateSource:Climate Summary by DoC and NOAA https://statesummaries.ncics.org/ • Less overall rainfall • Increases in extreme precipitation events • Enhanced feat or famine cycles •
The prediction that North Texas will have longer and more severe droughts is based on multiple factors, including the relationship between high temperatures and soil dryness and the presence of more frequent and longer lasting highpressure systems in summer that suppress rainfall and deflect storms away from our area.
PrecipitationDrought DALLAS 61NATURE OF PLACE
•
• Increased
Projected Change in Annual Precipitation for 2050


09 | CHANGE Transportation Trends TIMELINE dallas ridesharing Uber launches in Dallas Lyft launches in Dallas DART rolls out first mile/last mile partnership Electric scooters arrive in Dallas2018201520132012 Source: DART reference book 2020, 2018 4038363432302826 20152016201720182019 (million)RidershipAnnual DART Annual System Ridership By 2021, it’s projected that nearly 540 million people worldwide will use ridesharing apps. Today, about 2.5 billion people worldwide have smartphones. So roughly 18% of all smartphone users across the world are using ridesharing apps in 2019. DART reversed its downward ridership trend by reporting 38.7 million rides in 2019. Current and Projected Number of Ridesharing Users, Globally Source: Uber Revenue and Usage Statistics (2019), Ian Blair, buildfire 62NATURE OF PLACE


09 | CHANGE COVID-19 & Public Space
Public spaces are having a moment amid pandemic fears. Parks are being seen as essential infrastructure.
Source: After COVID-19, What’s Next for Landscape Architecture? By Rebecca Greenwald, Metropolis, June 17, 2020 63NATURE OF PLACE
New focus on expanding safe social interaction afforded by parks and public plazas
In the May 2020, Oakland, Seattle, Los Angeles, and Milwaukee have all announced ambitious new open streets programs to create more recreational space and facilitate safe social distancing. There is new interest in more expansive spaces that are large enough to safely accommodate many functions and people while social distancing.

09 | CHANGE Technology Augmented Reality Augmented reality entertainment market is growing at a compound annual growth rate of 24.4% Projector-based displays and smart-glasses are two of the key technologies enabling augmented reality experiences in the out-of-home entertainment industry today. Augmented experiences will be just as common and ubiquitous as the 55” LED screen. We need to be prepared to design and plan for how this effects our interior layouts and premium ARproducts. 24.4%growthannual rate = Source: AR's Not Dead by John Koetsier, Forbes 64NATURE OF PLACE


NEXT STEPS Process Overview 66NATURE OF PLACE