International Journal of Advanced Trends in Computer Science and Engineering
Available Online at http://www.warse.org/IJATCSE/static/pdf/file/ijatcse021162022.pdf https://doi.org/10.30534/ijatcse/2022/021162022

Available Online at http://www.warse.org/IJATCSE/static/pdf/file/ijatcse021162022.pdf https://doi.org/10.30534/ijatcse/2022/021162022
Abdelkaderboukaroura1,MohammedAmroune2
1Department of Electrical Engineering, University of Kasdi Merbah, Ouargla 30000, Algeria, boukaroura.abdelkader@univ-ouargla.dz
2
Department of Electrical Engineering, University of Ferhat Abbas Setif 1, Setif 19000, Algeria, mohammed_amroune@univ-setif.dz
Received Date:October 17,2022
AcceptedDate:November22,2022 Published Date: December 06, 2022
The optimal placement of distributed generation (DG) in power distribution systems involves identifying the best locations for the generators to be installed and sizing them appropriately, to optimize the performance of the system. In this paper, the recently proposed nature-inspired optimization algorithm namely: Dandelion Optimizer (DO) has been used for the optimal placement and sizing of DG in the radial distribution network The objectives are to minimize active power loss and voltage deviation and to enhance the voltage stability of the distribution network. The efficiency of the proposed method has been verified over the IEEE 33-bus and Algerian112-busdistributionsystems. The result comparisons indicated that the proposed method can obtain higher quality solutions than many other methods for the considered scenarios from the test systems. Therefore, the DO algorithm can be a very effective method for solving the optimal allocation of the DG problem.
Key words: Distribution network, Distributed generation, Dandelion optimizer, Power losses, Voltage deviation, Voltage stability.
The electric power system can be divided into four major components; generation, transmission, distribution and utilities. Amongst these four components, the distribution network is the final and most critical link in the power system [1]. It is a more complex network and has a higher power loss as compared to a transmission network due to the high R/X ratio. Previous literature studies show that losses in the distribution network are high and can exceed 13% [2].
The integration of distributed generation (DG) in the distribution networks has several benefits such as reducing power losses, improving voltage profile along feeders and increasing the maximum transmitted power in cables and transformers [3]. However, the installation of DG in the distribution systems requires consideration of their

appropriate locations and sizes. A non-optimal location with an optimal size or a non-optimal size with an optimal location can result in an increase in system losses and costs, and degradation in voltage profile, protection and stability. Thus, the simultaneous optimizationoflocation and sizing of DGs in distribution systems can be very useful for the distribution power system [4].
Inrecent years, several meta-heuristic optimization techniques have been employed for solving the optimal placement and size of DG sources connected to the distribution network These methods applyan iterative procedure to find the optimal solution or sub-optimal solutions to an optimization problem. Some of the methods that adopt meta-heuristics notions include Genetic Algorithm (GA), Simulated Annealing (SA), Tabu Search (TS), Particle Swarm Optimization (PSO), Ant Colony Optimization (ACO), Non-dominated Sorting GA-II (NSGA-II), Plant Growth Simulation Algorithm (PGSA), Artificial Bee Colony Algorithm (ABC), Bacterial Foraging Algorithm(BFA),CatSwarmOptimization(CSO),GreyWolf Optimization (GWO), Krill Herd Algorithm (KHA) and Invasive Weed Optimization (IWO) [6, 7, 8].
In this paper, the recently proposed met-heuristic method named Dandelion Optimization (DO) algorithm [9] has been adopted for multiple DG allocation and sizing to minimize active power loss, voltage deviation, and voltage stability improvement in the distribution network. Case studies with standard IEEE 33-bus and Algerian 112-bus distribution networks are performed. The obtained results have indicated that the proposed algorithm provides higher-quality solutions than several other algorithms in the literature for the considered scenarios.
The rest of this paper is organized as follows: Section 2 deals withtheformulationofthe optimal placement and sizingofthe DG problem. The general framework of the employed Dandelion optimization (DO) algorithm is presented in Section 3, whereas Section 4 and 5 illustrates the numerical simulations to investigate the performance of the solutions obtained by the optimization algorithm. Finally, conclusions are drawn in Section 6.
Objective functions can be classified as single-objective or multi-objective. The single objective functions are such as minimizing system power losses, cost, or enhancing voltage profile or system stability, etc. and multi-objective functions would be the combination of two or more single objective functions by considering suitable parameters and constituting the objective function [10].
problem.
The power flow equations are defined as equality constraints in the optimal allocation of DGs problem. The mathematical model is given by [12]: ,, 1 cos busN Giliiijjijij j PPVYV (6) ,, 1 sin busN Giliiijjijij j QQVYV
(7)
The main objective of DG siting and sizing in the distribution network is to minimize network active power losses while satisfying some operating constraints. The objective function for the minimization of active power loss is described as: 1 min lossFP (1) where Ploss is the total active power loss of the system expressed as follows: 2 1
brN lossi i PRI
(2) where Ii and Ri are the current magnitude and the resistance of the ith branch, respectively, Nbr is the number of branches.
To represent all the objectives in a combined mathematical expression, we divide every single objective function by its base value and link them together by coefficients. The use of weighting coefficients helps transform three single objective functions into one objective function, and the whole fitness function is given by: 1 2123 1 min loss lossbasebase base
where PG,i is the active power output of the generator at bus i; PL,i is the active power of load at bus i; QG,i is the reactive power output of the generator at bus i; QL,i is the reactive power ofload at bus i; and Yij and θij are the modulus and angle of ith element in the admittance matrix of the system related to bus i and bus j, respectively. The inequality constraints subjected to DG setting and sizing problems include [12]: minmax 1,2,..., ibus VVViN (8) where Vmin and Vmax are taken as 0.95 and 1.05 (p.u), respectively. max 1,2,..., iibr IIiN (9) minmax DGDGiDG PPP (10) 2 busbusDGN (11) where DGbus is the bus number of the DG installation, Vi is the bus voltage, Ii is the current of the DG at branch i, PDG is the total power of DG, Nbr is the total number of branches.
Dandelion optimization (DO) is a new swarm intelligence bioinspiredoptimizationalgorithmwas proposed byZhao et al in 2022 [9]. DO simulates the process of dandelion seed long-distance flight relying on wind. The mathematical modelling of the DO can be summarized as follows:
busN irated i VDVV
P VDVSI Fwww PVD VSI (3) VD is the total voltage deviation given by: 2 1
(4) where Vi is the voltage magnitude at bus i, Vrated is the rated voltage (1.0 p.u.) and Nbus is the number of buses in the distribution network. VSI is the voltage stability index given by the following equation [11]:
where VSIj is the voltage stability index of bus j, xij is the reactance of the line connected between buses i and j w1, w2 and w3 are penalty factors. These factors are attuned based on the significance of the objective function. In this paper, w1, w2 and w3 are taken as 0.6, 0.3 and 0.1, respectively
2.2Constraints
Two types of constraints, which include equality and inequality constraints, are considered in the optimization
3.1Initialization
Similar to other natured-inspired metaheuristic algorithms, DO fulfils population evolution and iterative optimization on the basis of population initialization. In the proposed DO algorithm, it is assumed that each dandelion seed represents a candidate solution, whose population is expressed as:
(12)
Where pop denotes the population size and Dim is the dimension of the variable. Each candidate solution is randomly generated between the upper bound (UB) and the lower bound (LB) of the given problem, and the expression of the ��th individual ���� is:
i XrandUBLBLB (13)
where �� is an integer between 1 and ������ and �������� denotes a randomnumber between 0 and 1. ���� and U�� are expressed as: 1,..., DimLBlblb (14) 1,..., DimUBubub (15)
During initialization, DO regards the individual with the optimalfitnessvalueastheinitialelite,whichis approximately considered the most suitable position for the dandelion seed to flourish. Taking the minimum value as an example, the mathematical expression of the initial elite Xelite is: min(())besti ffX (16) ((()))elitebesti XXfindffX (17) Where find () denotes two indexes with equal values.
In the rising stage, dandelion seeds need to reach a certain height before they can float away from their parent. Under the influence of wind speed, air humidity, etc., dandelion seeds rise to different heights. Here, the weather is divided into the following two situations.
Case1: On a clear day, wind speeds can be regarded to have a lognormal distribution ln ��∼��(��, ��2). Under this distribution, random numbers are more distributed along the �� -axis, which increases the chance for dandelion seeds to travel to far regions. Therefore, DO emphasizes exploration in this case. In the search space, dandelion seeds are blown randomly to various locations by the wind. The rising height of a dandelion seed is determined by wind speed. The stronger the wind is, the higher the dandelion flies and the farther the seeds scatter. Affected by wind speed, the vortexes above the dandelion seeds are constantly adjusted to make them rise in a spiral form. The corresponding mathematical expression in this case is: 1 ln() ttxyst XXvvYXX
(18) Where Xt represents the position of the dandelion seed during iteration t. Xs represents the randomly selected position in the search space during iteration t. Eq. (19) provides the expression for the randomly generated position. (1,)()
In Eq. (20), �� denotes the standard normal distribution N (0, 1). �� is an adaptive parameter used to adjust the search step length, and the mathematical expression is: 2 2 12 ()(1)randt T T (21)
r e vr vr
(22)
�� is a random perturbation between [0, 1] in the process of a nonlinear decrease that approaches 0. Such fluctuations make the algorithm pay much attention to the global search in the earlystage and turnto a local search in the later stage, which is beneficial to ensure accurate convergence after a full global search. ���� and ���� represent the lift component coefficients of a dandelion due to the separated eddyaction. Eq. (22) is utilized to calculate the force on the variable dimension. 1 cos sin x y
where ��is a random number between [ ��, ��]. Case 2: On a rainy day, dandelion seeds cannot rise appropriatelywiththe wind because ofair resistance, humidity and other factors. In this case, dandelion seeds are exploited in their local neighbourhoods, and the corresponding mathematical expression is: 1 tt XXk (23)
where �� is used to regulate the local search domain of a dandelion, and Eq. (24) is used to calculate the domain. 2 222 121 1 212121 qttTTTTTT
(24) Where k=1-rand()×q In conclusion, the mathematical expression of dandelion seeds in the rising stage is 1 ln()randn<1.5 else txyst t t
XvvYXX X Xk
Where randn() is the randomnumber that follows the standard normal distribution. Figure 1 shows the behaviour of dandelion seeds flying under different weather conditions. The approximate regeneration locations of dandelion seeds are given in the figure. First, when the weather is clear, dandelion seeds are updated based on randomly selected location information to emphasize the exploration process. The eddy above the seed acts on the moving vector by multiplying the �� and �� components to correct the direction of the dandelion’s movement in a spiral. In the second case, dandelion seeds are exploited in all directions in the local community. The normal distribution of random numbers is used to dynamically control exploitation and exploration. To make the algorithm more global search-oriented, the cut-off point is set to 1.5. This setting makes dandelion seeds traverse the entire search space as much as possible in the first stage to provide the correct direction for the next stage of iterative optimization.
Figure 3 shows the process of the search agent gradually updating to the global optimal solution in the final phase. To accurately converge to the global optimum, the linear increasingfunctionis applied to individuals to avoid excessive exploitation. In this stage, the Levyflight coefficient is used to simulate the individual movement step size. The reason is that the Levy flight coefficient can be used by agents to stride to other positions with a large probability under a Gaussian distribution, which develops more local search domains with a limited number of iterations.
Figure 1: Schematic diagram of the rising stage of dandelion seeds.
In this stage, the proposed DO algorithm also emphasizes exploration. Dandelion seeds descend steadily after rising to a certain distance. In DO, Brown motion is used to simulate the moving trajectory of dandelions. It is easy for individuals to traverse more search communities in the process of iterative updating because Brownian motion obeys a normal distribution at each change. To reflect the stability of dandelion descent, the average position information after the rising stage is employed. This facilitates the development of the population as a whole towards promising communities. The corresponding mathematical expression is 1_() tttmeanttt XXXX
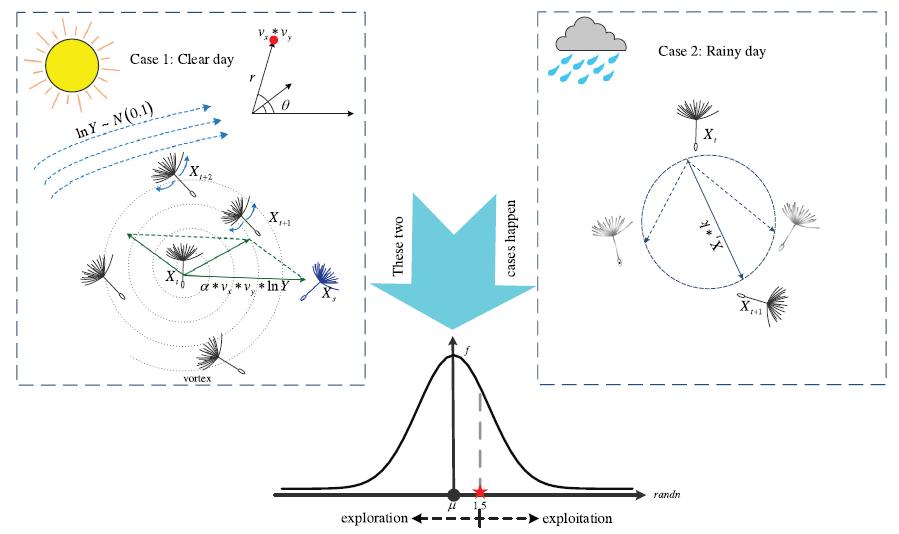
Figure 3: Schematic diagram of the dandelion seed landing stage 3.4Landingstage
where ���� denotes Brownian motion and is a random number from the standard normal distribution. Xmean_t denotes the average position of the population in the ��th iteration, and its mathematical expression is 1
1 pop
Figure 2 shows the regeneration process of dandelion seeds during descent. According to this figure, the average position information of the population is essential for the iterative updating of individuals, which directly determines the evolution direction of individuals. The trajectory of Brownian motion, which is based on a global search, is also presented in the figure. The irregular movement causes the search agents to escape the local extremum with a high probability during the iterative update and then pushes the population to seek the region near the global optimum.

In this part, the DO algorithm focuses on exploitation. Based on the first two stages, the dandelion seed randomly chooses where to land. As the iterations gradually progress, the algorithm will hopefully converge to the global optimal solution. Therefore, the obtained optimal solution is the approximate position where dandelion seeds will most easily survive. To accurately converge to the global optimum, search agents borrow the eminent information of the current elite to exploit in their local neighbourhoods. With the evolution of the population, the global optimal solution can eventually be found. This behaviour is expressed in Eq. (28) 1 ()()teliteelitet XXlevyXX
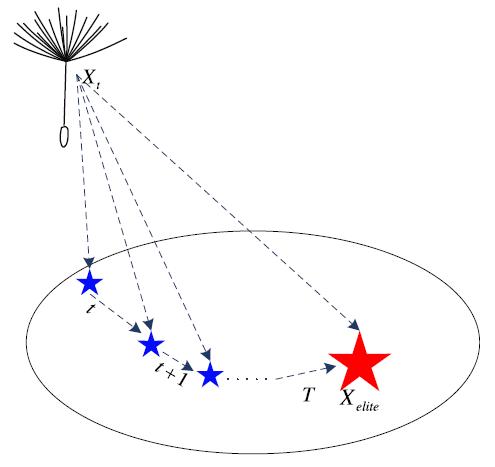
(28) where Xelite represents the optimal position of the dandelion seed in the ��th iteration. Levy (��) represents the function of Levy flight and is calculated using Eq. (29) [13].
(29) In Eq. (29),
is a random number between [0, 2] (��= 1 5 in this paper).
is a fixed constant of 0.01. ��and ��are random numbers between [0, 1]. The mathematical expression of ��is:
(30)
Figure 2: Schematic diagram of the descending stage of dandelion seeds
where ��is fixed at 1.5. ��is a linearly increasing function between [0, 2] and is calculated by Eq. (31) 2t
(31)
The flowchart of the optimal allocation and sizing of DG for power loss reduction, voltage deviation minimization and voltage stabilityimprovement, using the DO algorithm, can be summarized in the following steps
Step 1: Read the bus and branch data of the considered network.
Step2: Read DG data (DG power limits).
Step3: Set the parameters of the DO algorithm and the limits of decision variables (locations and sizing of DG).
Step 4: Generate the initial population for the decision variables (DG locations and sizes).
Step 5: Run backwards and forward to sweep power flow, incorporating DG.
Step 6: Compute the active power loss (Ploss), voltage deviation (VD), and voltage stability index (VSI).
Step 7: Compute the objective functions represented by Eq. (1) and Eq. (3).
Step8: Update the fitness of the objective function.
Step 9: Repeat steps 5–8 until the maximum number of iterations is reached.
Step 10: Print the optimal solution (optimal location and sizing of DG).
Theproposed algorithmistested onIEEE33-bus and Algerian 112-bus radial distribution networks taking into account the following cases
Case 1: in this case, a single objective function of minimizing active power loss (Ploss) is considered.
Case 2: in this case, a multi-objectives function is considered. This function includes the minimization of active power loss (Ploss), the minimization of voltage deviation (VD) and the enhancement of voltage stability (VSI).
The setting parameters of DO have been taken as follows: Population size=50, the maximum number of iterations=200 Whilethe generated power fromthe DG unitsis inthe range [0 3] MW.
The IEEE 33-bus test system consists of 33 buses, and 32 branches along with a total load of 3.72 MW and 2.30 MVAr. The substationvoltage is 12.66 kV. The single-line diagram of the IEEE 33-bus system is shown in Figure 4 and the overall data of this system is available in [14].
Figure 4: Single-line diagram of the IEEE 33-bus system
A. Case 1: Active power loss minimization
The performance of the DO algorithm is tested, firstly, for active power loss minimization.

Figure 5 shows the convergence track of the DO algorithm. The convergence of the DO algorithm occurs on the first iterations, showing the algorithm's ability to explore the search space quickly.
Figure 6 shows how the voltage profile was improved in the IEEE 33-bus system after DG units integration at buses 14, 24 and 30. Table 1 shows the best solutions obtained by DO, algorithm and the comparison with other optimization techniques in the literature. From these tables, it can be seen that the proposed algorithm has greatlyreduced the real power loss and improved the voltage deviation and voltage stability of the distribution network Moreover, this algorithm has shown high performance compared to competitive optimization algorithms in the literature.
Figure 5: DO convergence characteristic for 33-bus system (Case 1)
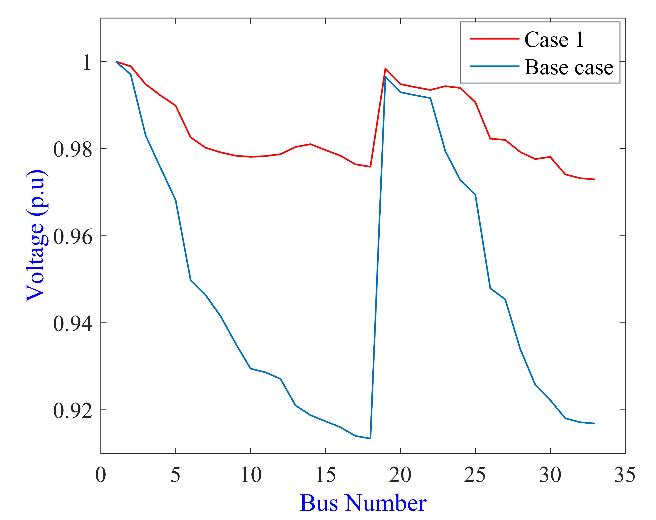
Figure 6: Voltage profile of 33-bus system (Case 1)
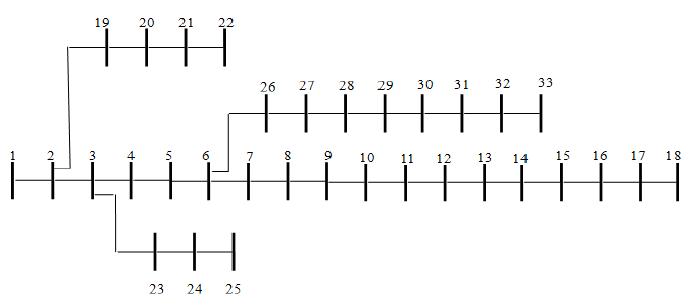
Table 1: Results for installing DGs in the 33-bus system (Case 1)
Algorithm PL without DG (kW)
DO
QOGWO [15]
QOCSOS [16]
OTCDE [17]
CMSFS [18]
MRFO [19]
CBGA-VSA [20]
201.8925 210.98
With DGs Bus no. DG size (kW) PL (kW) PL reduction (%)
14 24 30 14 24 30
759.08 1071.1 1099.9 801.81 1091.29 1053.01
69.3833 72.784
65.6335 65.5019
As can be seen from Table 2, the active power losses and the voltage deviation were severely reduced by proper DG allocation. It can be seen also that the voltage stability was improved. The results shown in this case reveal that the DO algorithmis effective insite DG units in distribution networks, finding better solutions and presenting lower losses, lower voltage deviation as well as higher voltage stability index when compared to the other metaheuristics.
210.99 210.98 210.98
210.98 210.98
13 24 30 13 24 30 13 24 30
13 24 30 13 24 30
HHO [21] 210.98 14 24 30
IHHO [21] 210.98 14 24 30
DA [22] 201.89 14 24 30
CSCA [23] 202.68 13 24 30
CTLBO [24] 210.99 13 24 30
SFSA [12] 210.988 13 24 30
801.7 1091.3 1053.7 801.8 1091.31 1053.6 802 1091 1054
788.27 1017.1 1035.3 801.8 1091.3 1053.6
745.69 1022.69 1135.78
757.54 1080.83 1066.69
760 1070 1100
871.00 1091.47 954.08
801.7 1091.3 1053.6
802.0 1092.0 1053.7
72.7869 72.785 72.785
72.876 72.785
65.5000 65.5000 65.50
65.4583 65.50
72.98 65.40
72.79 65.50
69.3833 65.6335
71.94 64.5056
72.79 65.5007
72.785 65.50
Figure 7: DO convergence characteristic for 33-bus system (Case 2)
In this sub-section, the proposed DO algorithm was employed to site three DG units in the IEEE 33-bus system, aiming to minimize the active power loss and voltage deviation and to improve voltage stability
The convergence characteristic of the DO algorithm for the best solution found is given in Figure 7.
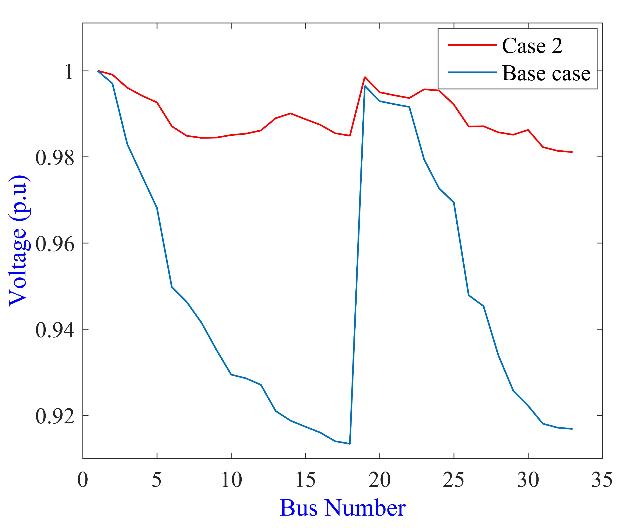
The voltage profiles of the IEEE 33-bus test system with and without DG are given in Figure 8. In comparison to the base case, the voltage profile with DG units has significantly improved.
Figure 8: Voltage profile of 33-bus system (Case 2)
The Algerian 112-bus radial distribution system, shown in Figure 9, has a total active load of 3.36 MW and, a total reactive load of 3.72 MVAr. The rest of the system data is available in [25].
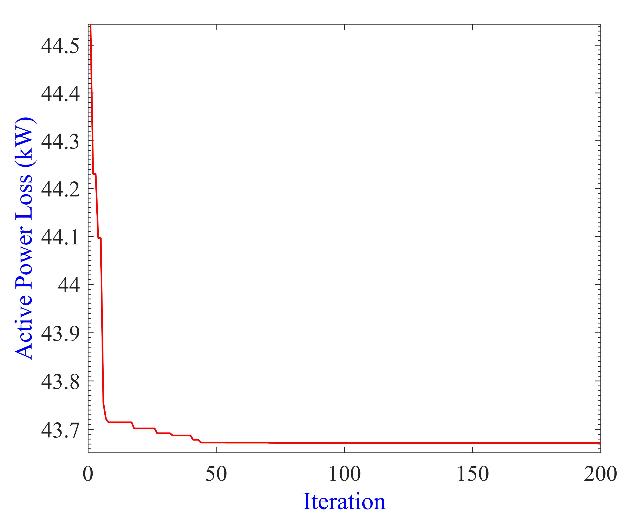
In this sub-section, the effectiveness of the proposed DO for solving optimal allocation of DG problem considering active power loss minimization is demonstrated. The convergence characteristic for the best fitness obtained after applying DO is shown in Figure 10
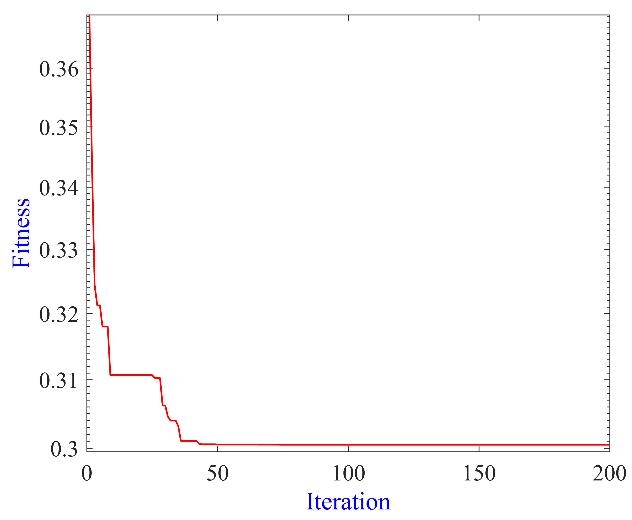
Table 2: Results for installing DGs in the 33-bus system (Case 2)
Algorithm Without DG With DG
PL (kW) VD (p.u.) VSI Bus no. Size(kW) PL (kW) PL reduction (%) VD (p.u.) VSI DO 201.89 0.1164 0.69 14 24 30
QOCSOS [16] 210.99 0.1338 0.67 13 24 30
879.4796 1096.7 1281.0
956.4 1030.9 1293.5
71.7686 64.4521 0.0047 0.93
77.0414 63.4857 0.0065 0.91
SCA [23] 202.68 0.1337 0.67 13 1247.61 89.92 55.6344 0.0023 0.95
25 32 1061.68 1023.50
CSCA [23] 202.68 0.1373 0.67 13 24 30
SFSA [12] 210.98 0.1338 0.67 13 24 30
CTLBO [24] 210.99 - 0.67 13 25 30
An enhanced voltage profile is obtained with DG integration in the Algerian network, as shown in Figure 11 The final results of real power losses and the optimal allocation of DGs obtained by the DO algorithm are shown in Table 3. The best objective function value of 43.6717 kW is obtained via the integration of DGs at buses 15, 24, and 94 with sizes in kW, 1533.9, 1129.4 and 488.7845.
1098.02 986.57 1584.90
964.7 1133.7 1301.8
1192.6 870.6 1629.6
88.43 56.3796 0.0016 0.96
77.41 63.31 0.0062 0.92
96.17 54.41 0.0009 0.96
Figure 9: Single-line diagram of the Algerian 112-bus system
Figure 11: Voltage profile of 112-bus system (Case 1)
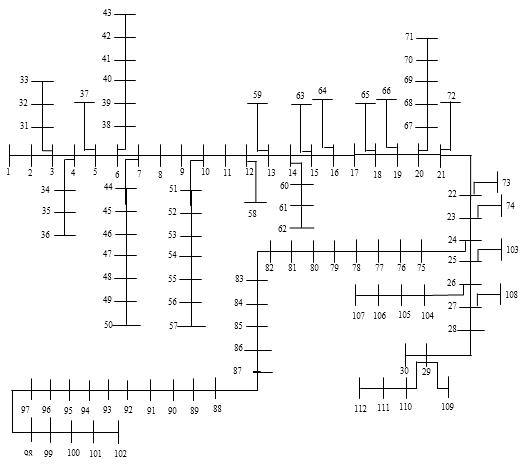
Figure 10: DO convergence characteristic for 112-bus system (Case 1)

Table 3: The best solution obtained by the DO algorithm for the 112-bus system (Case 1) PL without DG (kW) With DGs Bus no. DG size (kW) PL (kW) PL reduction (%) 77.9423 15 24 94
1533.9 1129.4 488.7845
43.6717 43.9708
In this case, the DO algorithm is applied to optimize the multi-objective function of active power loss, voltage deviation plus voltage stability index via optimally simultaneous allocation of three DGs in the system.
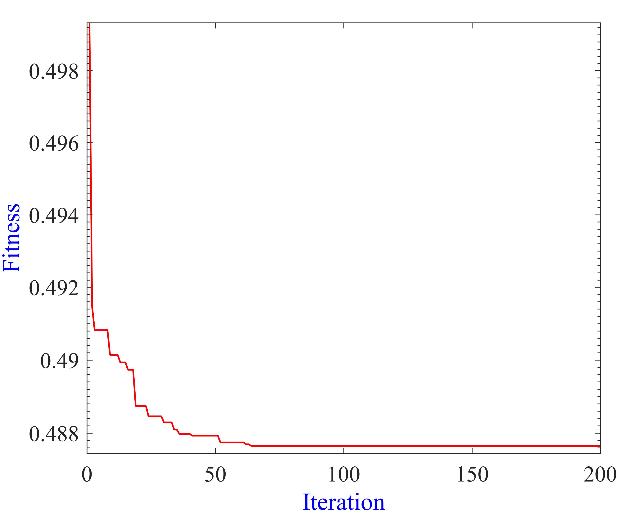
Figure 12 shows the convergence curve for the objective function over the iterations of the DO algorithm.
The voltage profiles of the test system in the base case and with DGs are given in Figure 13. It is clear that the voltage profile of the Algerian network is improved when DGs are installed
The power loss reduction, the percentage power loss reduction, the voltage deviation and the minimum voltage stability index are presented in Table 4.
As shown in this table, the best locations for DGs units installation are buses 15, 75 and 94, and the best sizes in kW are 1829.9, 1420.0 and 624.5237, respectively.
Figure 12: DO convergence characteristic for 112-bus system (Case 2)
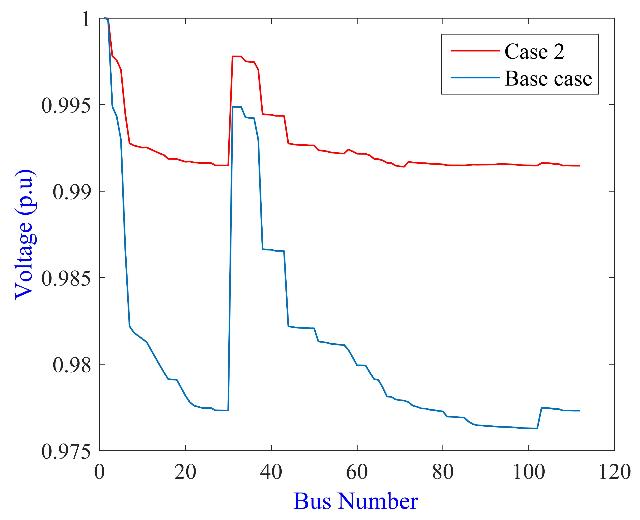
Figure 13: Voltage profile of 112-bus system (Case 2)
Table 3: The best solution obtained by the DO algorithm for the 112-bus system (Case 2)
Without DG With DG
PL (kW) VD (p.u.) VSI Bus no. Size (kW)
77.9423 0.1164 0.69 15 75 94
1829.9 1420.0 624.5237
In this paper, optimal allocation and sizing of DGs are determined ina radial distribution network through Dandelion Optimizer (DO) to achieve the benefits of power loss reduction along with improvement of bus voltage profile and voltage stability. The DO algorithm is tested with the optimal location and sizing of three DGs in IEEE 33-bus and Algerian 112-bus systems. A comparative study has been carried out to evaluate the performance of the DO algorithm among other algorithms in the literature The obtained results reveal that the DO algorithm outperforms other existing methods such as SCA, HHO, DA, QOGWO, CTLBO and SFSA.
1. T. Yuvaraj and K. Ravi. Multi-objective simultaneous DG and D-STATCOM allocation in radial distribution networks using cuckoo searching algorithm, Alexandria Engineering Journal, vol. 57, no. 4, pp. 2729-2742, Jan. 2018.
2. A. A. EI-Fergany. Optimalcapacitorallocationsusing evolutionaryalgorithms, IETGeneration,Transmission &Distribution, vol. 7, no. 6, pp. 593-601. Feb. 2013.
3. R. Sirjani, A. Mohamed and H. Shareef. Heuristic optimization techniques to determine optimal capacitor placement and sizing in radial distribution networks: A Comprehensive Review, Przegląd Elektrotechniczny, 2012, vol. 7, no. 12, pp. 1-7, 2012.
4. O. Amanifar and M. E. Hamedani Golshan. Optimal distributed generation placement and sizing for loss andTHDreductionandvoltageprofileimprovement in distribution systems using particle swarm optimization and sensitivity analysis, International Journal on Technical and Physical Problems of Engineering, vol. 3, no. 2, pp. 47-53, Jun. 2011.
PL (kW) PL reduction (%) VD (p.u.) VSI
45.4798 41.6511 0.0065 0.96
5. A. Aida Fazliana, M. Azah, H. Sharee, A. Asrul Ibrahim, T. Khatib and W. Elmenreich. An improved gravitationalsearchalgorithmforoptimalplacement and sizing of renewable distributed generation units in a distribution system for power quality Enhancement, Journal of renewable and sustainable energy, vol. 6, no. 3, pp. 1-17. 2014
6. V. Rajkumar and D. K. Khatod. Optimal planning of distribute d generation system s in distribution system: A review, Renewable and Sustainable Energy Reviews, vol. 16, pp. 5146 -5165. 2012
7. P. Prakash and D. K. Khatod. Optimalsizingandsiting techniques for distributed generation in distribution systems: A review, Renewable and Sustainable Energy Reviews, vol. 57, pp. 111-130. 2016.
8. W.L.Theo,J.S.Lim,W.S.Ho,H.HashimandC.T. Lee. Review of distributed generation (DG) system planningandoptimisationtechniques:Comparisonof numerical and mathematical modelling methods, Renewableand Sustainable Energy Reviews, vol. 67, pp. 531-573. 2017.
9. S. Zhao, T. Zhang, S. Ma and M. Chen. Dandelion Optimizer: A nature-inspired metaheuristic algorithm for engineering applications, Engineering Applications of Artificial Intelligence, vol. 144, 105075. 2022.
10. P. Prakash and K. K. Dheeraj. Optimalsizingandsiting techniques for distributed generation in distribution systems: A review, Renewable and Sustainable Energy Reviews, vol. 57, pp. 111–130. 2016.
11. M. Chakravorty and D. Das. Voltage stability analysis of radial distribution networks, International Journal of Electric Power and Energy Systems, vol. 23, pp. 129–135. 2001
12. T. P. Nguyen and D. N. Vo. ANovelStochasticFractal Search Algorithm for Optimal Allocation of Distributed Generators in Radial Distribution
Systems, Applied Soft Computing Journal, vol. 70, pp. 773-796. 2018.
13. R. Klages, G. Randos and I. Sokolov. Anomalous Transport Foundations and Applications Wiley-VCH Verlag GmbH & Co. KGaA, Weinheim, 2008, pp. 129-159.
14. A. Khodabakhshian and M. H. Andishgar. Simultaneous PlacementandSizingofDGsandShuntCapacitorsin Distribution Systems by Using IMDE algorithm, Electrical Power and Energy Systems, vol. 82, pp. 599-607. 2016.
15. S. Kumar, K. Mandal and N. Chakraborty Optimal placement of different types of DG units considering various load models using a novel multiobjective quasi-oppositional grey wolf optimizer, Soft Computing, vol. 25, pp. 4845–4864 2021.
16. H. Truong, P. Nallagownden, I. Elamvazuthi and N. Vo. A Quasi-Oppositional-Chaotic Symbiotic Organisms Search algorithm for optimal allocation of DG in radial distribution networks, Applied Soft Computing Journal, vol. 88, 106067.2020.
17. S. Kumar, K. Kamal and N. Chakraborty. A novel opposition-based tuned-chaotic differential evolution technique for techno-economic analysis by optimal placement of distributed generation, Engineering Optimization, vol. 52, no. 2, pp. 303–324.2020.
18. T. Duong, P. Nguyen, N. Vo and M. Le. A newly effectivemethodto maximize power lossreductionin distribution networks with highly penetrated distributed generations, Ain Shams Engineering Journal, vol. 12, no. 2, pp.1787−1808. 2021
19. G. Hemeida, A. Ibrahim, A. Mohamed, S. Alkhalaf and M. Bahaa El-Dine Optimal allocation of distributed generators DG based Manta Ray Foraging Optimization algorithm (MRFO), Ain Shams Engineering Journal, vol. 12, pp. 609−619. 2021.
20. O. Montoya, W. Gil-González and C. Orozco-Henao. Vortex search and Chu-Beasley genetic algorithms for optimal location and sizing of distributed generators in distribution networks: A novel hybrid approach, Engineering Science and Technology, an International Journal, vol. 23, pp.1351–1363. 2020
21. A. Selim, S. Kamel, S. Alghamdi and F. Jurado Optimal Placement of DGs in Distribution System Using an Improved Harris Hawks Optimizer Based on SingleandMulti-ObjectiveApproaches, IEEE Access, vol. 8, pp. 52815−52829. 2020.
22. A. Boukaroura, L. Slimani and T. Bouktir. Optimal Placement and Sizing of Multiple Renewable Distributed Generation Units Considering Load Variations Via Dragonfly Optimization Algorithm, Iranian Journal of Electrical and Electronic Engineering, vol. 16, pp. 353–362. 2020.
23. A. SelimS, Kamel and F. Jurado. Efficientoptimization technique for multiple DG allocation in distribution networks, Applied Soft Computing Journal, vol. 86, 105938 2019.
24. A. Quadri, S. Bhowmick and D. Joshi Acomprehensive techniqueforoptimalallocationofdistributedenergy resources in radial distribution systems Applied Energy, vol. 211, pp.1245–1260. 2018.
25. A. Boukaroura. Contribution à la modélisation et à l’optimisation des réseaux de distribution sous incertitudes, Thèse de doctorat sciences, Université Larbi Ben M’hidi-Oum El Bouaghi, Algérie, 2021