Volume 12, No.1, January - February 2023
International Journal of Advanced Trends in Computer Science and Engineering
Available Online at http://www.warse.org/IJATCSE/static/pdf/file/ijatcse041212023.pdf

https://doi.org/10.30534/ijatcse/2023/041212023
Healthy-State and Time-To-Failure Assessment of Induction Motors and Pumps for Maintenance Scheduling Using Cloud-Enabled Fault Prediction and Reporting System with Machine Learning Scheme
G.PiusAgbulu1,TakudzwaNgwerume2,E.Kapuya3,S.Gunasekar4
1 Department of Electronics and Instrumentation Engineering, SRM Institute of Science and Technology, SRM Nagar, Kattankulatur, Kancheepuram, Chennai, TN, India.gpagbulu@gmail.com
2Department of Mechatronic Engineering, School of Engineering Sciences & Technology, Private Bag 7724, Chinhoyi University of Technology, Chinhoyi, Zimbabwe. Takudzwangwerume98@gmail.com
3Department of Mechatronic Engineering, School of Engineering Sciences & Technology, Private Bag 7724, Chinhoyi University of Technology, Chinhoyi, Zimbabwe. Egelbert.kapuya@gmail.com
4 Department of Artificial Intelligence and Machine Learning, New Horizon College of Engineering, Bangalore, India.gunasekars.nhce@newhorizonindia.edu
Received Date December 21, 2022
ABSTRACT
Accepted Date: January 23, 2023
Every industry relies heavily on electrical machines. When these machines fail without giving a signal or warning, there is unplanned downtime and unanticipated deployment of maintenance staff which may affect or lower production if machines are serving as important assets. Some failures can lead to greater damage, instead of one machine or item being replaced a lot of resources will be needed to repair once a machine fails and assets will have a shorter life expectancy. There are also safety issues associated with running a machine to failure. Running a machine to failure also increases labour costs and safety costs. Therefore, this paper proposes a Cloud-Enabled Fault Prediction and Reporting System with Machine scheme for Healthy-State and Time-To-Failure Assessment of Induction Motors and Pumps for Maintenance Scheduling. This system uses sensors to extract data (current, speed, temperature, vibrations). The extracted data is then conditioned and compared to the values related to the healthy state of the equipment using machine learning algorithms, manufacturer specifications, and historical readings to identify performance non-conformities or items that require action and display the asset health report which will help schedule a proper maintenance procedure based on analysis.
Keywords: Fault Prediction, Induction Motors, Maintenance Scheduling, Sensors , Machine Learning, Pumps
1.INTRODUCTION
Condition-based maintenance strategy is one solution to run-to-fail consequences. It may lead to significant
Published Date: February 06, 2023
improvements in the availability, quality, and productivity of production lines [1]. Identifying or detecting faults at an early stage is very important since functional failures may quickly and easily occur after the initial development of one fault [2]. Trend monitoring is a type of condition-based maintenance strategy which uses historical data and manufacturer specifications. Trend monitoring is usually used to frequently check airplane engine data, to monitor and diagnose abnormalities in engine performance, hopefully preventing secondary and even more costly damage. The system will extend its trend-monitoring capabilities to plant machines or equipment [3].
Mainly, 95 % of all electric motors are induction motors, which also account for 40 to 50 % of all produced electricity [4]. Induction motors have been employed in several applications, including petroleum, nuclear power, chemical processing, paper industries, mills, and the mining sector [5-11]. Induction motors likewise have been utilized in more widespread contexts, such examples include compressors, robotics, fans, lifts, air conditioners, pumps, crushers, fans, tractions, etc. [12-13] Induction motors, like other types of motors, may malfunction despite having low failure rates and only needing the most minimal maintenance.
Characteristically, when pumps and motors malfunction suddenly, there is unanticipated downtime and unanticipated personnel deployment, which may impact reduction if the motors are acting as critical assets [14]. Byperforming routine inspections on equipment a process known as preventative maintenance many organizations aim to stop failure before it starts. The biggest challenge in preventative maintenance is knowing when to perform maintenance because it is
impossible to predict when a machine will fail. Scheduling maintenance too early will reduce the life of the machine and increase costs. It is also important to be conservative and schedule maintenance early for equipment that is essential for safety.
Since motors are the primary movers of many industries, this will help the industries to increase productivity and cut cost. By cutting the number of preventative maintenance exercises which sometimes are unnecessary and cause unnecessary downtime and loss of production and also by avoiding unanticipated failure. The power generation utilities in Zimbabwe, which rely on motors and pumps for their operations, cannot afford to lose hours of production owing to downtime that can be avoided [15]. They can arrange downtime for maintenance with the aid of the system. The system will also aid in avoiding accidents that might occur if motors falter while in use, endangering both people and other equipment.
Hence, this paper proposes a Cloud-Enabled Fault Prediction and Reporting Systemwith Machine scheme for Healthy-State and Time-To-Failure assessments of Induction Motors and Pumps for Maintenance Scheduling. This system uses sensors to extract data (current, speed, temperature, vibrations). The extracted data is then conditioned and compared to the values related to the healthy state of the equipment using machine learning algorithms, manufacturer specifications, and historical readings to identify performance non-conformities or items that require action and display the asset health report which will help schedule a proper maintenance procedure based on analysis. the system's reports will be easy to read and do not require technical analysis because they indicate the best times to plan maintenance. As the plant operates, the system will assist in visualizing field parameters, which will be available in real time due to its online nature.
2.PROPOSED CLOUD-ENABLED FAULT PREDICTION AND REPORTING SYSTEM WITH MACHINE LEARNING SCHEME
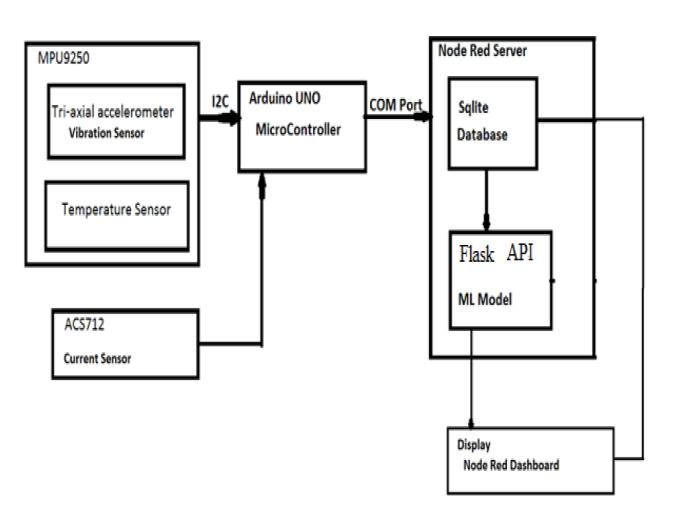
The system is broken down into 4 major parts to be designed separately and integrated later as shown in Fig.1, the Data Acquisition domain (for acquiring raw sensor data from machines), Storage domain (for storage of rawsensor data in a database) and the Processing and Analysis domain (Machine learning Model) and the Display (Web Dashboard). Each domain executes a particular objective
Vibration, current and temperature are the parameters to be measured. Thisisbecauseit is easyto analyze their patterns or signatures as a machine begins to fail. Vibration sensors, current sensors, temperature sensors and the control system make up the data acquisition of the system to be designed. Below is a list of sensors and a controller that were selected in order to come up with the data acquisition domain of the system. The system's hardware consists of the ACS 712 sensor, MPU 9250, and Arduino. Only one of the ACS712's outputs is connected to the Arduino's analog inputs. The associated power connections were connected to ground and 5 volts. To establish an I2C connection, the MPU 9250 is linked to the SDA and SDLC pins. A piezoelectric vibration harvester is used to power the microcontroller and the sensors. Piezoelectric vibration harvesters derive energy from rotating equipment and convert it to electrical energywhich is stored in a supercapacitor and the sensors only draw energy from them when sufficient energy has been stored. Micro-batteries like lithium and zinc could have been used in place of the stated energy harvester but batteries have a finite life and are not idealforcontinuousequipmentmonitoring.Figure2shows the system block diagram.
3.CONCLUSIONCLOUD-DATABASEANDDATA ANALYSISSCHEME
3.1.Node-Red
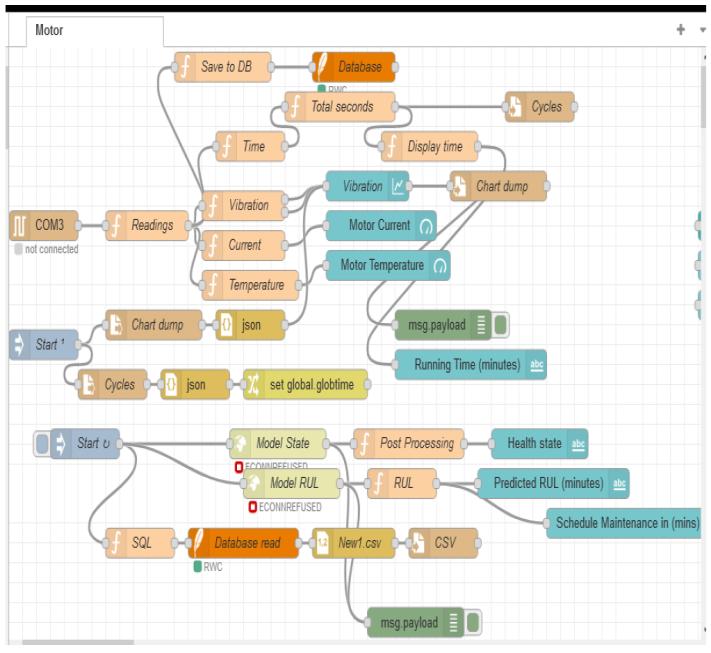
Figure 3 shows the Nodes Red. Precisely, Node-RED is an open-source flow-based programming tool for wiring together IoT devices. To carry out the activities and connect the nodes, JavaScript code is written in the nodes. For the purpose of

storing the unprocessed sensor data, we employed SQLite. Node-SQLite Red's C library offers a disk-based database that can be queried using a non-standard SQL query language and does not need a separate server process. In comparison to the other databases, it is a quick, easy, and scalable database management solution. After the system's various parts are constructed, they are combined, with node-red serving as the hub. A serial COM port connects the data acquisition or sensing component to the node red server. After training, the machine learning model is saved as a pickle object, deployed using a flask API, and coupled to node-red via an http request node, which provides data to the server from the database and the model evaluates the data and returns predictions. The node-red server is also linked to an SQLite database. Node Red has nodes for displayingto a dashboard, and the display is developed from there.
3.2MachineLearningModel
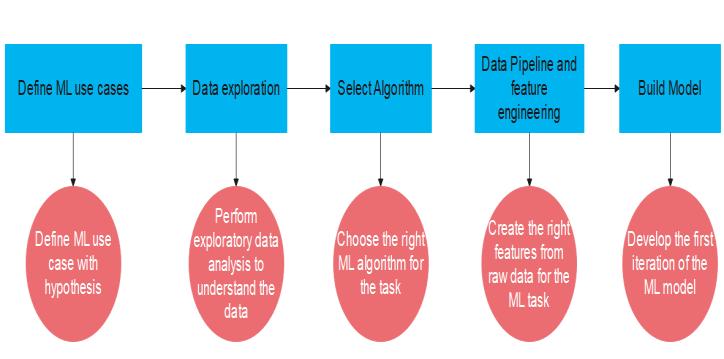
In this case, the motor's current health will be predicted using the Hidden Markov method. Figure 4 shows the Steps in building the model. For classification, other models like LSTMs with memory and recurrent neural networks may be utilized[16]. The Markov model just requires the present state and prior state to infer the next state, hence a memory-less Markov model is utilized since there is not enough training data. The programming language that was chosen is python, this is because it has all the necessary libraries required to build and train the model. One of the objectives was to build a machine-learning model that analyzes sensor data and reports motor healthy when failure is likely to occur. A left-to-right hidden Markov Model was selected. The following steps were used in the development of the model.
3.3.DatasetandDataExploration
The next step will be to gather and comprehend data. Labeled run-to-fail data is needed to create and train the model because the use case is to predict the machine's health condition. The three datasets that were used in the project were obtained from a website called Kaggle and the description of the datasets is given below. This case best suits the objective which requires the researcher to acquire and process vibration and current datasets indicating healthy and faulty motors for building and training the model. Kaggle was used to acquire the dataset below, which contains run-to-fail testing of motor bearings. This dataset only contains vibrational data. The shaft had four bearings attached to it. A steady 2000 RPM rotation was
maintained by an AC motor that was attached to the shaft with rubber belts. A spring mechanism placed a 6000 lb rial strain on the shaft and bearing. Every bearing received forced lubrication. All failures happened after the Rexnord ZA-2115 double bearing had reached the end of its specified life, which is greater than 100 million revolutions. After deciding on an algorithm and having a dataset at hand, the next step in building a model is data exploration. EDA makes it simpler to analyze data and generate descriptive and graphical summaries of it. The open-source, BSD-licensed Pandas library is accessible in Pycham. The fundamental unit of pandas is the data frame. It represents data with rows and columns (tabular or excel spreadsheet-like data).
3.4Datasetstructure
There are three datasets in the data packet. Each dataset has a test-to-failure experiment description. Each dataset is made up of unique files that contain snapshots of 1-second vibration signals taken at predetermined intervals. Each file contains 20,480 points with sampling rates set to 20 kHz. The date the data was collected is included in the file name. Each of the entries(rows)inthedatafileareindividualdatapoints. Longer timestampintervalsinthe subsequent experiment indicate that the experiment was continued the followingworkingday(seen in file names). Below are brief summaries of each dataset: Set1: Is made up of2156 files fromchannels recorded from4 bearings with 2 channels for each for the vibration in the x-axis.


Description: At the end of the test-to-failure experiment, an inner race defect occurred in bearing 3 and a roller element defect in bearing 4.
Set 2: Is made up of 984 files from channels recorded from 4 bearings with 1 channel for each vibration in the x-axis.
Description: At the end of the test-to-failure experiment, outer race failure occurred in bearing1.
Set 3: Is made up of 4448 from 4 channels recorded from 4 bearings with 1 channel for each for vibration in the x-axis.
Description: At the end of the test-to-failure experiment, outer race failure occurred in bearing 3.
3.5.FeatureExtraction
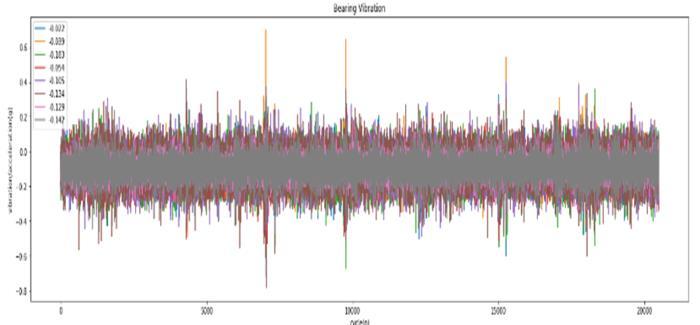
Figure 5 shows the raw signal plot. Feature Engineering and EDA work hand in hand. A thorough understanding of the dataset is essential for effective feature engineering. Feature extraction identifies the most discriminating characteristics in signals, which a machine learning algorithm can more easily consume. Due to information redundancy and the high data rate, training machine learning on raw signals frequently producespoorresultsasthereis no clear patternonthe bearing degradation as they fail from the raw signals and they cannot be used as they are. Features were already available on the extracted dataset.
Definition and formula of the time features:
Absolute mean,
(1)
standard deviation
(2)
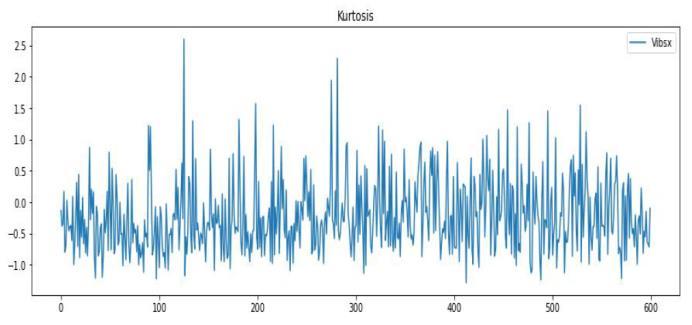
kurtosis: the length of a signal distribution's tails, or alternatively, how prone an outlier-prone the signal is. Thenumberofoutliersmightriseasa result ofdeveloping flaws, raising the kurtosis metric's value.
(3)
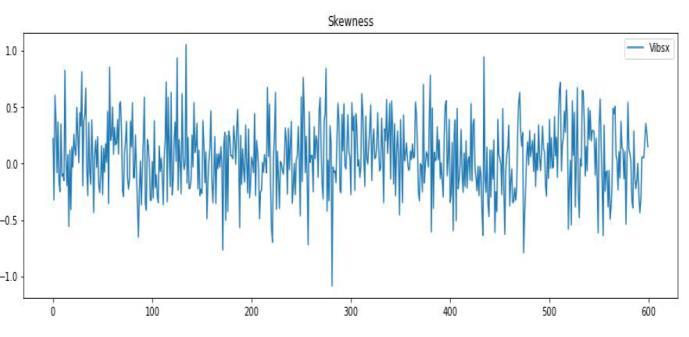
Skewness: Dispersion of signals with asymmetries. Faults can affect the symmetry of the distribution, which raises the skewness.
4 RESULTSANDDISCUSSION
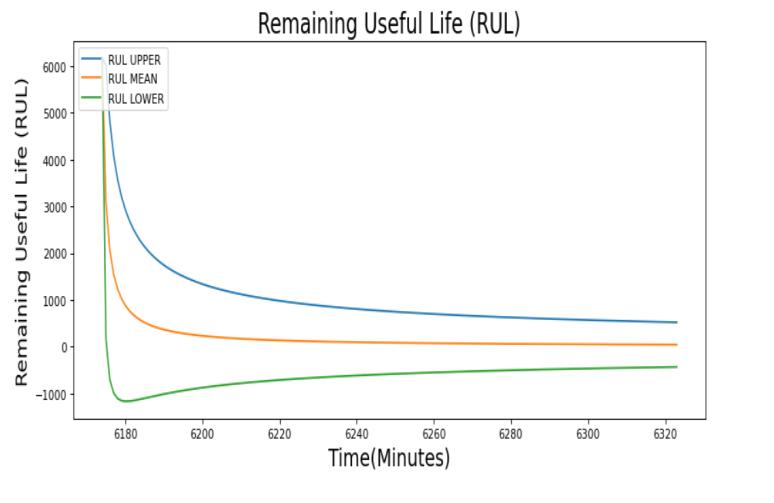
This section presents results from the integrated tests of the entire system. For the developed subsystems most tests were carried out through simulation and modelling. Figure 6 shows the RUL Plot. Figure 7 (a) shows the prototype view 1, while Figure 7 (b)shows the prototype view 2. The states decoded are sent to the dashboard from the API and converted to their respective health labels with:0: for healthy state; 1-for faulty state; 2- failure imminent.; Additionally, the remaining useful life is revealed, and to ensure accuracy, it is calculated and updated every 30 minutes.
(b)
while Figure 8 (b) decoded state sequence of bearing 1The decoded stated sequences are shown on an RMS plot. The obtained data features were consumed by the model for training. Parameters such as the sequence data for each bearing, log probabilities, start probability and the transition matrix are also highlighted for each bearing to clearly show how the states are being decoded. The start or initial probabilities obtained from training were showing that the bearing can start in any state since a used motor will be used for testing. The start of the initial probability could have been forced to start in the(health) state1 for a motor.
4.2.TestingandModelSelection
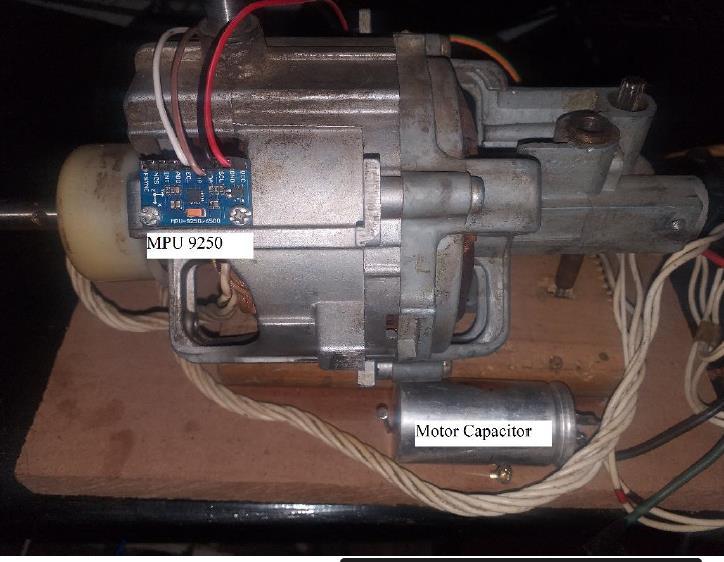
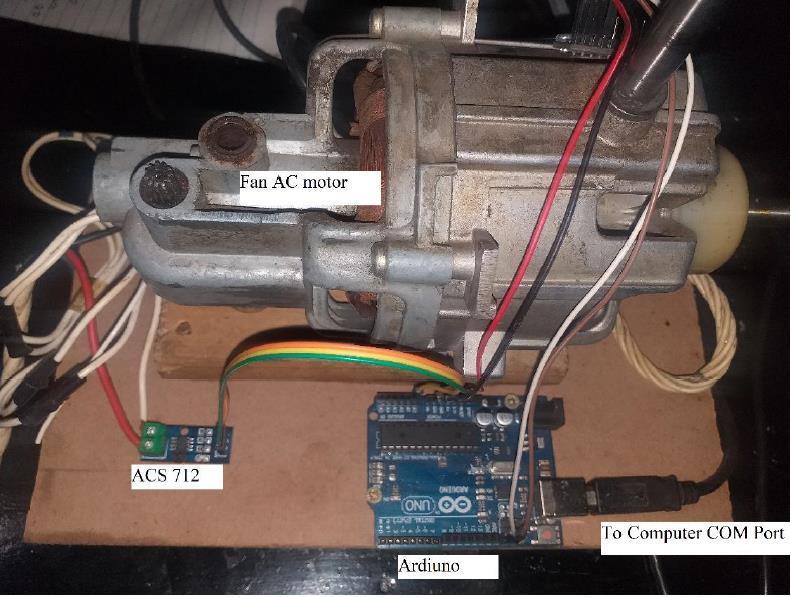
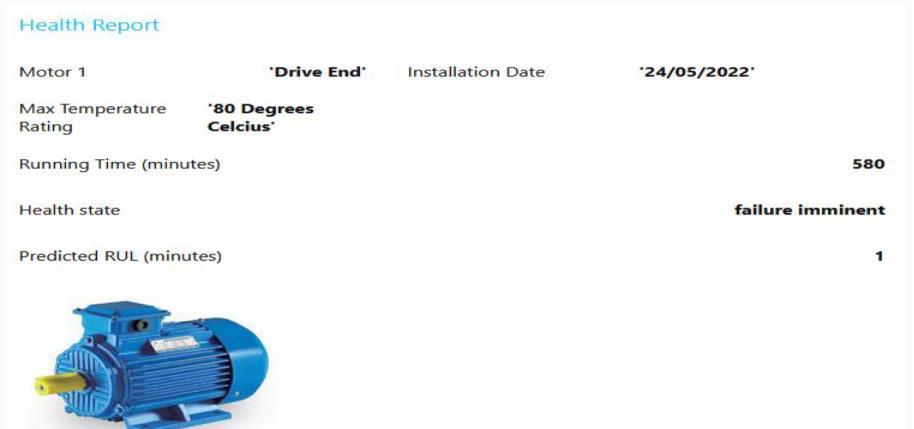
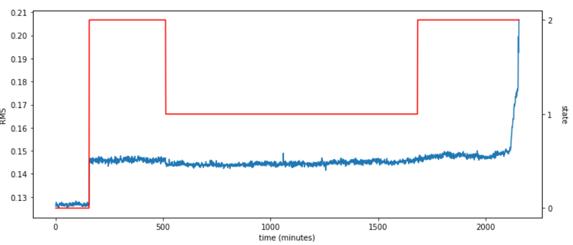
Figure 9 shows the output for model from S1_B1. Model from S1_B1 decodes the system states in the given order: State 0(Healthy); State2(Failure imminent); State 1 (Degrading). The trained models are tested to decode sequences which was reserved for testing out the model. The decoded states are illustrated as follows. The blue line in the graphs given below denotes the degradation pattern of bearing 2 fromset 3 and the red line denotes the decoded states from bearing 3 from set 3. The Y-axis from the graph denotes the RMS for bearings as they degrade, and the X-axis highlights the time it takes for each bearing to degrade.

(a)
(b)
The log probabilities for all the models are displayed in the table inTable 1. The log probabilityis a number that is used to evaluate the performance of a model, that is the more negative the value of the probability, the better the performance of that model. The model from S1_B1 with log probability -21625910.260216523 is the best among the others, according to theory. Despite having lower log probabilities than the others, S1_B4, S2_ B1, and S3_B1 produce the best results due to a better state decoding (for the system being monitored). The S2_B1 model is chosen as the best model because it can decode the states in the desired order. It has a -124385.7422104653-log probability. The model is saved as a pickle object and put in production.
4.3.RemainingUsefulLifePrediction
Figure 10 show the RUL plot from the model. The best model is used to estimate RUL on the bearing. It should be observed that as the predicted failure time approaches, the estimated RUL's accuracy rises. A 95% confidence interval is used to calculate the upper, lower, and mean RUL values.
4.4.
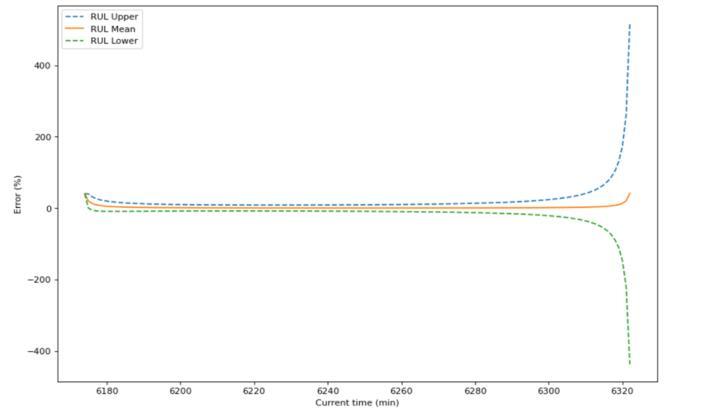
Figure 11 shows the Error in RUL. The RUL improves in accuracy as the bearing nears failure, which is acceptable because it can be used to plan maintenance before the equipment breaks down. As the real failure time draws near, the mean percentage error decreases from roughly 60% to about 3% before stabilizing.
S1_B1 -21625910.260216523
S1_B2 -15741931.288018757
S1_B3 -243170.91978825524
S1_B4 -428826.7856630708
S2_B1 -44063.25022806876
S2_B2 -124385.7422104653
S2_B3 -469507.64837242395
S2_B4 -28031.281687931256
S3_B1 -106197.65557323382
S3_B2 -61992.239269823
S3_B3 -6930.4202
S3_B4 -61992.23
4.5.VisualizationofFeatures
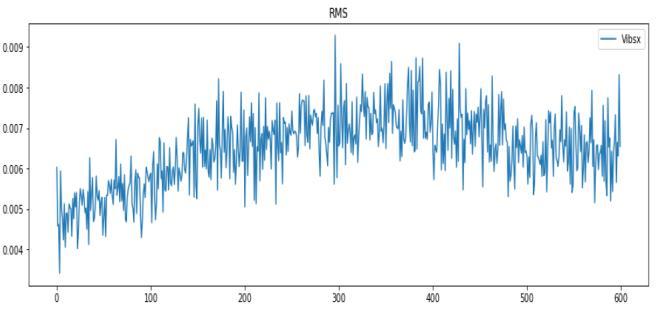
The results are as shown in Figure 12,13,14 and 15, the Mean, RMS, Skewness, and Kurtosis features were extracted from the raw sensor data. The displayed features are shown below. The red line highlights the decoded state sequence and the
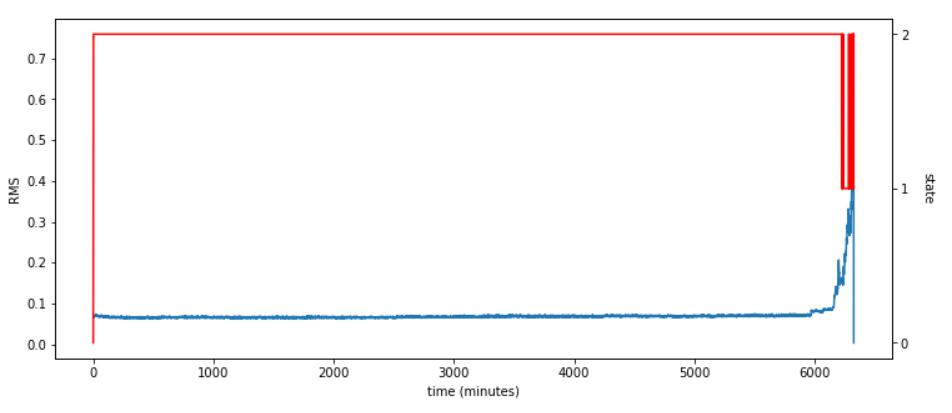
blue-line highlights the RMS values from, healthy to faulty to degrading. Decoded state sequence: Healthy, degrading and Failure.

5 CONCLUSION
Most industrydepend on heavily on electrical machines. Once these machines fail without giving a signal or warning, there is unplanned downtime and unanticipated deployment of maintenance staff which may affect or lower production if machines are serving as important assets. Some failures can lead to greater damage, instead of one machine or item being replaced a lot of resources will be needed to repair once a machine fails and assets will have a shorter life expectancy. There are also safety issues associated with running a machine to failure. Running a machine to failure also increases labour costs and safety costs. This paper proposes a Cloud-Enabled Fault Prediction and Reporting System with Machine scheme for Healthy-State and Time-To-Failure Analysis of Induction Motors and Pumps for Maintenance Scheduling. This system uses sensors to extract data (current, speed, temperature, vibrations). The extracted data is then conditioned and compared to the values related to the healthy state of the equipment using machine learning algorithms, manufacturer specifications, and historical readings to identify performance non-conformities or items that require action and display the asset health report which will help schedule a proper maintenance procedure based on analysis.
REFERENCES
1. Drakaki, M., Karnavas, Y.L., Tzionas, P. and Chasiotis, I.D. Recent Developments Towards Industry 4.0 Oriented Predictive Maintenance in Induction Motors. Procedia computer science, 180, pp.943-949,2021.
2. Zhang, W., Yang, D. and Wang, H. Data-driven methods for predictive maintenance of industrial equipment: A survey. IEEE Systems Journal, 13(3), pp.2213-2227,2019.
3. Nikfar, M., Bitencourt, J. and Mykoniatis, K.A. Two-Phase Machine Learning Approach for
Predictive Maintenance of Low Voltage Industrial Motors. Procedia Computer Science, 200, pp.111-120,2022.
4. Cakir, M., Guvenc, M.A. and Mistikoglu, S. The experimentalapplicationofpopularmachinelearning algorithms on predictive maintenance and the design ofIIoTbasedconditionmonitoringsystem. Computers & Industrial Engineering, 151, p.106948,2021
5. Kumar, G., Agbulu, G.P., Rahul, T.V., Natarajan, A.V. and Gokul, K A cloud-assisted mesh sensor network solution for public zone air pollution real-time data acquisition. Journal of Ambient Intelligence and Humanized Computing, pp.1-15,2022.
6. Abdalla, R., Samara, H., Perozo, N., Carvajal, C.P. and Jaeger, P.Machine Learning Approach for Predictive Maintenance of the Electrical Submersible Pumps (ESPs). ACS omega,2022.
7. Agbulu, G., Retna Kumar, G.J. And Juliet, A.V. AERAA-DAR: Algorithm for Energy-Resourceful Attribute-aware Data Aggregation and Routing In Wireless Sensor Networks. Adhoc & Sensor Wireless Networks 46,2020.
8.
9. Phan, T.L.J., Gehrhardt, I., Heik, D., Bahrpeyma, F. and Reichelt, D. A Systematic Mapping Study on Machine Learning Techniques Applied for Condition Monitoring and Predictive Maintenance in the ManufacturingSector.Logistics, 6(2), p.35,2022.
10. Chen, L., Wei, L., Wang, Y., Wang, J. and Li, W. Monitoringandpredictivemaintenanceofcentrifugal pumps based on smart sensors. Sensors, 22(6), p.2106,2022.
11. Xia, L., Zheng, P., Li, X., Gao, R.X. and Wang, L. Toward cognitive predictive maintenance: A survey of graph-based approaches. Journal of Manufacturing Systems, 64, pp.107-120,2022.
12. Agbulu, G.P., Kumar, G.J.R., Juliet, V.A. et al. PECDF-CMRP:APower-EfficientCompressiveData Fusion and Cluster-Based Multi-hop Relay-Assisted Routing Protocol for IoT Sensor Networks. Wireless Pers Commun 127, 2955–2977,2022. https://doi.org/10.1007/s11277-022-09905-6
13. Falekas, G. and Karlis, A.Digital twin in electrical machine control and predictive maintenance: State-of-the-art and future prospects. Energies, 14(18), p.5933,2021.
14. Abidi, M.H., Mohammed, M.K. and Alkhalefah, H. Predictive Maintenance Planning for Industry 4.0 Using Machine Learning for Sustainable Manufacturing. Sustainability, 14(6), p.3387,2022.
15. Hafeez, T., Xu, L. and Mcardle, G. Edgeintelligencefor data handling and predictive maintenance in IIOT. IEEE Access, 9, pp.49355-49371,2021.
16. Arena, S., Florian, E., Zennaro, I., Orrù, P.F. and Sgarbossa, F. A novel decision support system for managing predictive maintenance strategies based on machine learning approaches. Safety science, 146, p.105529,2022.
17. Zhai, S., Gehring, B. and Reinhart, G. Enabling predictive maintenance integrated production scheduling by operation-specific health prognostics with generative deep learning. Journal of ManufacturingSystems, 61, pp.830-855,2021.
18. Gunasekar, S., Kumar, G.J.R. and Agbulu, G.P Air Quality Predictions in Urban Areas Using Hybrid ARIMA and Metaheuristic LSTM. Comput. Syst. Sci. Eng., 43(3), pp.1271-1284.
