International Journal of Emerging Trends in Engineering Research
Available Online at http://www.warse.org/IJETER/static/pdf/file/ijeter041112023.pdf https://doi.org/10.30534/ijeter/2023/041112023

Available Online at http://www.warse.org/IJETER/static/pdf/file/ijeter041112023.pdf https://doi.org/10.30534/ijeter/2023/041112023
Abbas F.G. Mohmmedali1, Messaoud Hamouda 2, Ghaitaoui Touhami 3
1Laboratoire de Développement Durable et Informatique LDDI, UniversitéAhmed Draia, Algeria, abbasrex70@gmail.com
2 Laboratoire de Développement Durable et Informatique LDDI, UniversitéAhmed Draia, Algeria, jhamouda@yahoo.fr
3Laboratoire de Développement Durable et Informatique LDDI, UniversitéAhmed Draia, Algeria, touhami.eln@gmali.com
Received Date: December 8, 2022 Accepted Date: December 29, 2022 Published Date : January 07, 2023
Recently, the rise in consumption of electrical energy and power transmission between various utilities has resulted in the emergence of anxieties about the power system's network voltage stability.Additionally, the necessityforpowersystems to perform in a secure condition has increased due to an increase in load demand globally. Therefore, the use of renewable energy-based distributed generation is growing quickly to help meet electrical demand and disrupt environmental issues caused by the use of fossil fuels. This type of generation can have a positive or negative influence on the stability of the power system. This paper analyzes the effects of distributed PVpower integration on the power grid's voltage stability using static techniques. In order to improve efficacy and accuracy, give a complete and in-depth understanding of the problem of voltage stability, and identify the causes of instability, a combination of four different techniques is employed for analysis. Analysis methodologies include modalanalysis,sensitivityanalysis,PVcurve,andQV curve. The analysis of voltage stability is carried out on an IEEE 14-bus system by using NEPLAN software. The simulation results showed that the integration of a renewable energy resource-based distributed solar PV power system into the test system led to a noticeable improvement in stability degree, a decrease in sensitivity of buses, a significant improvement in system MW loading, an enhancement in voltage profile, and a perceptible increase in reactive power margin.
words: Voltage Stability, Modal Analysis, Sensitivity analysis, Solar PV, distributed generation

Currently, it is vital to take into account renewable energybased generation in power system grid due to rising electrical energy consumption around the world, declining fossil fuel supply, and environmental concerns. Amongst the various kinds of renewable energy, solar PV power is one of the most extensively utilized technologies for power generation [1]. Compared to other sources of energy, PV solar is one of the
cleanest, easiest to install, and requires less maintenance [2]. Recently, the integrationofsolar photovoltaics generationinto power network has increased. The intermittent nature of PV, however, might have an impact on the electrical power network. One of the significant problems with PV's intermittent nature is how it influences the power system stability[3]. Besides that, a quick rise in penetration level may have an effect on the performance of power system, which influences the system stability, quality, voltage profile, and flow of power. Among these issues, the issue of stability of voltage is a significant one [4].
Voltage stability problems are one of the main issues in planning and operation of power system. The ability of a system to sustain acceptable voltages at all system nodes both under ordinary circumstances and following a disturbance is known as voltage stability [5]. On the contrary, voltage instability is the failure of system to sustain adequate voltages in all or some of its nodes when it is operating normally and following disturbances like progressive load rises or failures of critical lines or units of generating. It may also be caused by a mismatch between reactive power generation and demand, which happens when a power system cannot supply enough reactive power [6]. Aconsiderable decrease in system voltage results from significant reactive power losses if corrective actions to stop voltage instability are not taken. As a result, voltage collapse takes place. Voltage collapse represents to the procedure by which a series of circumstances resulting from voltage instability cause an unacceptable low voltage situation in a sizable portion of a power system network [6], [7]. Voltage collapse issues have become one of the most critical anxieties in the power sector during the last two decades, as theyhave been the primarycause ofnumerous main blackouts around the world. As a result, for various systems, evaluation of voltage stability and prediction of voltage collapse or instability have become the highly important forms of assessment carried out as part of system planning and operation. [8].
For analytical purposes, static or dynamic analysis canbe used to measure voltage stability. Differential equations that
analyze the change of bus voltages with changing system operating parameters provide the basis of dynamic voltage stability. Bifurcation analysis, small signal stability analysis, time domain simulations, and the energy function method are among the techniques used to examine dynamic voltage stability. Power flow equations serve as the foundation for static voltage stability, which can identify the mechanisms of voltage collapse under various operating circumstances. The majority of the necessary data regarding the system's voltage stability is obtained using this method, which requires less processing time [9].
Different works on static voltage stability analysis are carried out utilizing a variety of methods.Authors in [10] used modal analysis and CPF to find the correct allocation of PVand wind generation in power system to improve stability of voltage. Authors in [11] used CPF method to analyze voltage stability of incorporation a utility scale PV generation in Bangladesh national grid. CPF analysis used in [12] to figure out maximum loading limit, which is employed as a metric for evaluating the voltage stability of system. The authors of [13] employed the power flow solution to analyze how the distributed generator (DG) affected the voltage profile and power loss of the sub-transmission network. Modal analysis and CPF are used in [14] for voltage stability analysis of connected DG at Mandalay City. Critical Voltage Sensitivity Index (CVSI) and critical reactive power sensitivity index (CQSI) are used in [15] to assess voltage instability of power system to intensification in renewable energy (RE) penetration. Modal analysis and CPF are used in [16] to investigate the stability of voltage in heavily stressed power system with large-scale PV integration. Authors in [17] used modal analysis and CPF to study the influence of large-scale PV penetration on power system voltage stability.
This paper's main contribution is the presentation of four different static techniques for analyzing the voltage stability of a power grid integrated with a distributed solar PV power system. A combination of four methods (modal analysis, sensitivity analysis, CPF, and Q-V curve) is utilized in order to improve the analyses' efficacy and accuracy, give a complete and in-depth grasp of the issue of voltage stability, and pinpoint the causes of instability. The impact analysis of PV power on voltage stability is carried out on an IEEE 14bus system. Firstly, modal analysis is utilized to assess the voltage stability status of the test system network and to determine the weakest bus appropriate to connect distributed PV unit. Then, sensitivity analysis is employed to measure the impact of the integration PV unit on the sensitivity of the system's buses. In addition, the Q-V curve is determined to determine the reactive power margin of system buses. Finally, the P-V curve is plotted using CPF to find out the maximum loading percentage of the system as well as the bus critical voltage.
The paper is organized in the following manner: Section 1 introduction. Section 2 distributed generation based solar PV power system. Section 3 presents analysis techniques. Section 4 the test system description. Section 5 simulation results and discussion. Section 6 conclusion. Section 7 references
Small-scale generatingthatproduceselectricityclose to where the customers are located is known as distributed generation (DG), whichis based onrenewable energytechnologies. It can be very helpful in remote areas where grid extension is challenging or where central generating is impractical. The distribution networks can benefit from distributed generation technology in a number of ways; decreasing electric power losses, improving voltage profile of the network, and reducing greenhouse emissions. However, prior to establishing DG at the distribution network, it is important to comprehend the potential effects of DG on the stability of the power network. [13].Therefore,thispaperanalysistheinfluenceofintegrating 70 MW distributed PV power operating at unity power factor into distribution grid.
For distributed solar PV generation system, solar cells are the cornerstones of photovoltaic arrays, which harness solar energy to produce electricity. Many cells are linked together in series for the purpose of creating a greater voltage across the terminal, and they are linked together in parallel to form a module. Modules are connected in parallel and series to make up an array for solar PV generation on a large scale. Solar irradiation and temperature affect a PV array's performance.A DC link is used to connect the PV array to the DC/AC converter. In order to deliver the system with the necessary active and reactive power, voltage source converters are used to convert input DC voltage into output AC voltage [18].
Magnitude of voltage variation versus variation of reactive power t in particular bus can used for voltage stability evaluation. In terms of voltage stability, the system is considered to be stable if the V Q sensitivity is positive for each bus. In contrast, it is unstable [9],[19].
Power system reduced Jacobian matrix can be represented as follows,
Jacobian elements of power flow
By taking into account the gradual change relationship between voltage and reactive power, voltage stability is evaluated. So, letting
���� =�������� (3) where ���� =[������ ������������ 1������] is the system's reduced Jacobian matrix equation (3) can be written as, �� =���� 1�� (4)
Solving the (4) gives the V-Q sensitivity. A positive V-Q sensitivity indicates stable operation, and the more stable the system, the smaller the sensitivity. An unstable operation is represented by a negative sensitivity [9],[19].
Modal analysis technique is one of the techniques to predict the collapse of a power system voltage. It was proposed by Gao et al [20].
The eigenvalues and eigenvectors of reduced Jacobian matrix, JR, are computed to determine a system's voltage stability characteristics. The J R is written in the equation (5), ���� =��Λ�� (5) where �� = right eigenvector matrix of JR �� = left eigenvector matrix of JR Λ = diagonal eigenvalues matrix of JR equation (5) can be written as, ���� 1 =����Λ 1 (6) replacing (6) in (4) gives Δ�� =����Λ 1Δ�� (7) Or Δ�� =∑�� �������� ���� Δ�� (8) Where ���� = ��th eigenvalue ���� = ��th column right eigenvector ���� = ��th row left eigenvector matrix of JR
Considering that �� 1 =��, equations (7) can be written as ��Δ�� =��∧ 1 Δ�� (9) or �� =Λ 1�� (10) Where �� =��Δ�� = modal voltage change vector �� =��Δ�� = modal reactive power change vector
The equivalent ��th voltage variation modal is given by ���� = 1 ���� ���� (11)
The related modal voltage collapses if ���� is equal to zero because any change in reactive power causes an endless fluctuation in the bus voltage. A system that has all positive eigenvalues for JR is said to be stable, whereas the system is unstable if any of the eigenvalues is negative [9],[19].
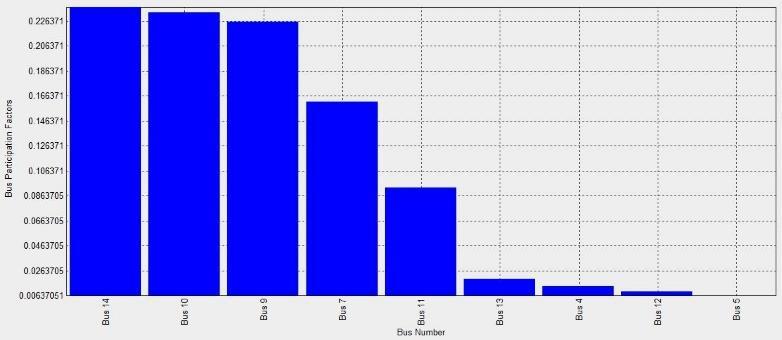
Bus Participation Factors. The bus participation factor determines the relative participation of bus k in mode I
������ =������������ (12)
Weak buses and sections of the power system close to voltage instability can be identified using the bus participation factors of the small eigenvalues [9].
This CPF is regarded as a crucial method for figuring out the maximum loading factor of the suggested system, which can help establish system stability that cannot be directly calculated by the modal analysis [21].
In order to determine the voltage profile of the system up to a critical point where the Jacobian matrix becomes inconvergent, a continuation load flow uses the following solutions. This distance between the base point and collapse point is known as the voltage stability margin. [21]. In the consecutive process, the power is increased gradually at all loads by λ which is defined as a scaling factor as shown below ���� =����0(1+��) (13) ���� =����0(1+��) (14)
Where ����0 and ����0 are loads active and reactive power at an initial condition. ���� and ���� represent the new active and reactive loads power that result from increasing load by λ factor.
The margin of stability or separation from collapse of voltage at a particular bus can be calculated using this curve. The bus voltage sensitivity and variation in response to reactive power injectionsorabsorptionsarerepresentedbytheQVcurve[22]. The distance between the axis of voltage and the minimum MVAr point on the Q-V curve is employed to calculate the reactive power margin. Reactive supply's negative values signify a growing reactive load. Reactive power margin, then, shows how much more load can be placed on a given bus before it reaches its limit of loading and collapses of voltage [23]. Figure 1shows Q-V curve.
Figure 1: Common Q -V curve [23]
Figure 2 illustrates the IEEE-14 -bus test power system. It consists of a 615 MVA main generator (SG) connected to bus 1, a 40 MW generator connected to bus 2, three compensators connected to buses 3, 6, and 8, twenty branches, and eleven load buses.The total power loads are 259 MW and 81.3 MVAr [24].
Bus no
Table 1: Power flow results
V [p.u] V ang P gen MW Q gen Mvar PL MW QL Mvar
Bus 1 1.06 0 232.5 96 0 0 14.89 2
Bus 2 1.045 -5 40 49.114 21.7 12.7
Bus 3 1.01 -12.8 0 27.552 94.2 19
Bus 4 1.012 -10.2 0 0 47.8 3.9
Bus 5 1.016 -8.7 0 0 7.6 1.6
Bus 6 1.07 -14.4 0 22.957 11.2 7.5
Bus 7 1.048 -13.2 0 0 0 0
Bus 8 1.087 -13.2 0 24 0 0
Bus 9 1.032 -14.8 0 0 29.5 16.6
Bus10 1.031 -15 0 0 9 5.8
Bus11 1.047 -14.8 0 0 3.5 1.8
Bus12 1.053 -15.28 0 0 6.1 1.6
Bus13 1.047 -15.31 0 0 13.5 5.8
Bus14 1.02 -16.1 0 0 14.9 5
The voltage stability of the system is examined using a model analysis technique to measure the system's stability and identify the weakest bus that would be appropriate location to incorporate a distributed PV unit. If any eigenvalues are negative, the systemis said to have an unstable voltage.Azero eigenvalue, indicates that voltage instability is imminent. demonstrates that a tinychange in the reactive power injection maycause a huge change in the voltage magnitude. Moreover, the small eigenvalues reveal the degree of instability of the system voltage.

All analysis results are performed using the NEPLAN software package. Before studying the effect of integrating renewable energy source-based distributed solar photovoltaic power onthe stabilityofthe voltage of an IEEE 14-bus system using the above methods, load flow is performed using the Newton–Raphson method to demonstrate the operating conditions of the test system. The total active and reactive powers are 13.597 MW and 27.434 Mvar, respectively. Table 1 illustrates power flow results The reactive power (QL) in bus 1 represents absorbed reactive power by the swing generator.
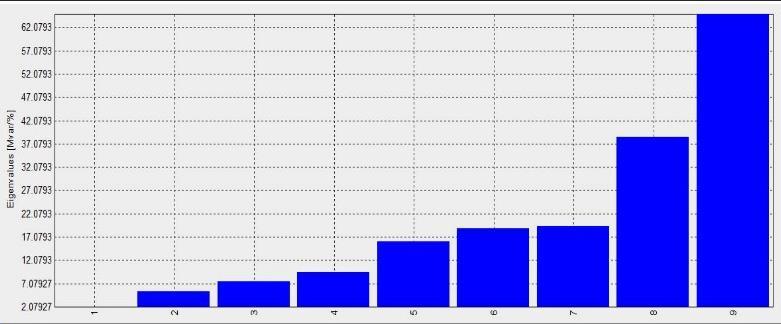
For the test system, it contains nine eigenvalues as shown in figure 3. This is because the system includes 14 buses, one representing the swing bus and four representing the PV bus. It can be noted that all of the eigenvalues are positive, demonstrating that the test system is stable, and the smallest one is = 2.0792, whichsignifies the critical mode and provides an indication of how close the system is to instability. Based on the lowest eigenvalue, the bus participation factors can be seen in figure 4. From figure 4, it can be noticed that the load buses 14, 10, and 9 are most close to the collapse of voltage, and bus 14 has the largest bus participation factor of 0.2374, meaning that it represents the weakest bus in the test system, followed by buses 10 and 9. So, it's an appropriate location to integrate the PV system unit.
Figure 3: Eigenvalues of 14-bus system
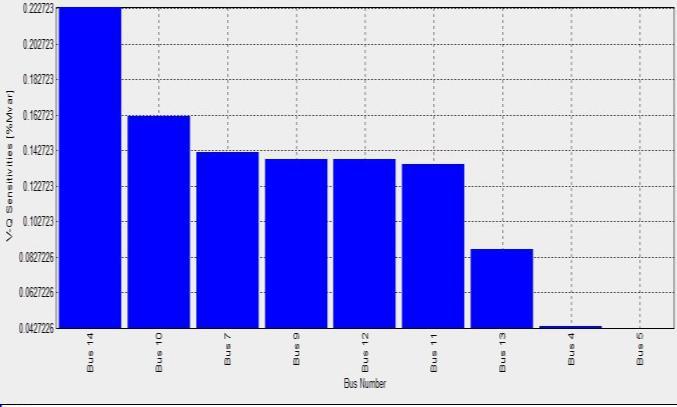
as shownin figure 5. The smaller the amplitudes of sensitivity, the more stable the system. As a result, bus 5 is the most powerful bus among all system load buses, followed by bus 4. This means that these two buses have a lower voltage change and are less dangerous for voltage instability. The amplitude of sensitivity grows as the system's stability declines. A negative sensitivity value, on the other hand, denotes an unstable operation.
Figure 4: Bus participation factors of 14- bus system
5.2 Impact of integration of a distributed solar PV power system
5.2.1 Influence on the status of the stability of the voltage
The impact of integrating 70 MW of distributed solar PV power generation operating at unity p.f. into the test system network via bus 14 on the stabilityof voltage is shown in table 2. The four smallest eigenvalues are taken into account to provide a sufficient assessment of the system's stability. From table 2, it can be noted that the stability status of the test system improved when incorporating distributed PV power; the smaller eigenvalue's amplitude increased by 31.7%.
Table 2: Four smallest eigenvalues with and without solar PV power Base case With PV power Eigenvalues [Mvar / %] Eigenvalues [Mvar / %] 2.0792 2.7389 5.3877 5.6029 7.5987 7.7551 9.4942 11.3257
5.2.2 Effect on the sensitivity of system buses
The IEEE 14-node system is examined using sensitivity analysis technique. It determines the relationship between voltage and reactive power change. It is found that bus 14 is the most sensitive bus, with a sensitivity amplitude value equal to 0.2233, followed by buses 10, and 9. The lowest sensitivity value observed is 0.0427, and it belonged to bus 5,
A sensitivity analysis of the test system with the addition of distributed PV power is carried out, and the results of the analysis are presented in table 3. From table 3, it can be seen that the sensitivity of the buses has decreased slightly, indicating that the test system has become more stable than it was. As can be seen, the sensitivity of buses 14, 10, and 9 decreased by 9.54%, 13.20%, and 22.37%, respectively.
Table 3: IEEE-14 bus sensitivity with and without solar PV power Bus no V-Q Sensitivities [%/Mvar] Base case
5.2.3
Change % 14 0.2233 0.202 9.54 10 0.1621 0.1407 13.20 12 0.1377 0.137 0.51 11 0.1353 0.1295 4.29 9 0.1377 0.1069 22.37 13 0.0872 0.0857 1.72 5 0.0427 0.0407 4.68 4 0.044 0.0401 8.86
V-Q Sensitivities [%/Mvar] with Solar PV power
The QV curve is drawn to identify the reactive power margin of the test system load buses, as shown in Figure 6. From figure 6, it can be noticed that bus 14 has the lowest reactive power among all buses, followed by buses 12, 13, 11, 10, and 9. This means that the possibility of increasing the reactive power load on these buses before reaching the loading limit and before voltage collapse occurs is low. On the other hand,
it can be noticed that buses 5 and 4 have a high reactive power margin, which indicates that they are very stable buses.
Figure 6: QV curves of 14-bus system network (bas case)
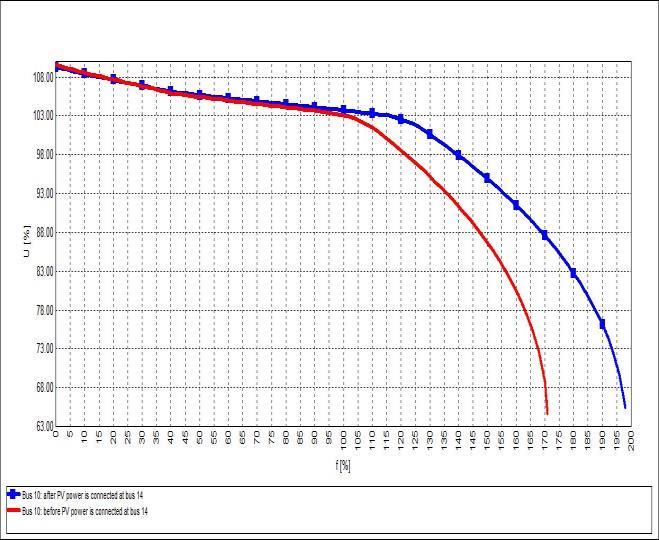
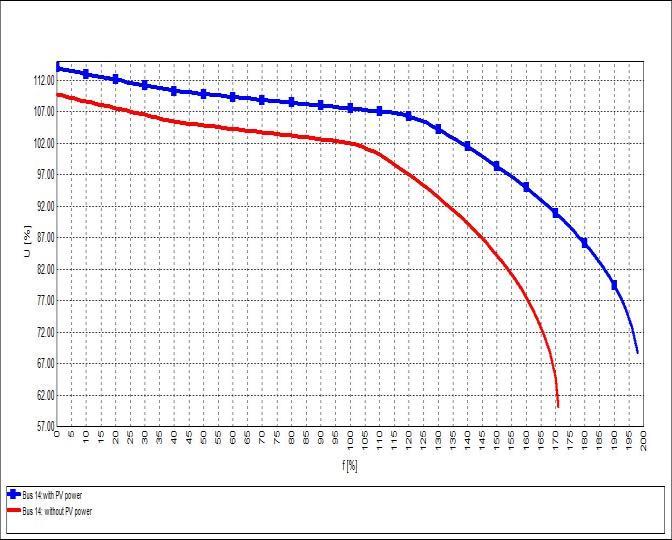
It is well known that a system's abilityto keep its voltage from collapsing depends on how high its reactive power margin is. However, the closer the system operates to the critical point and the more likely a voltage collapse is, the smaller the margin is. Table 4 shows the obvious improvement in the reactive power margin and its improvement rate for system buses, thus increasing the degree of safety of the system against collapse as a result of integrating distributed solar PV power into a test system through bus 14. It can be noted that the reactive power margins of buses 14, 10, and 9 improved by 12.03%, 8.99%, and 8.58%, respectively. As previously observed, these buses have the largest contribution to voltage collapse. Figure 7 shows the Q-V curve for the weakest buses before and after integrating PV power at bus 14.
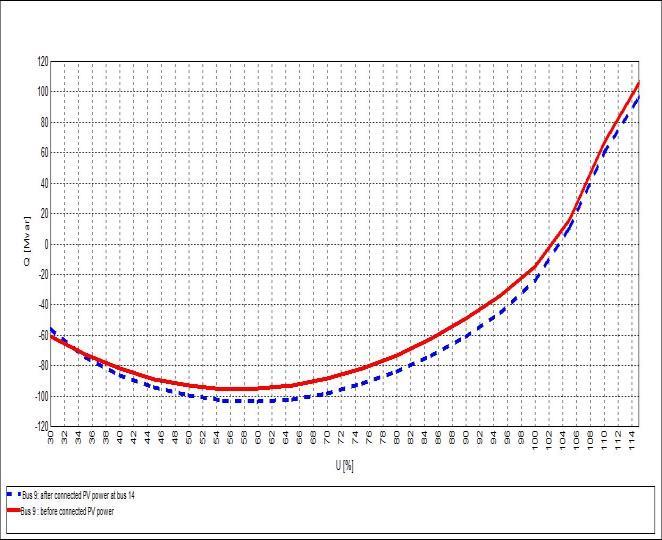
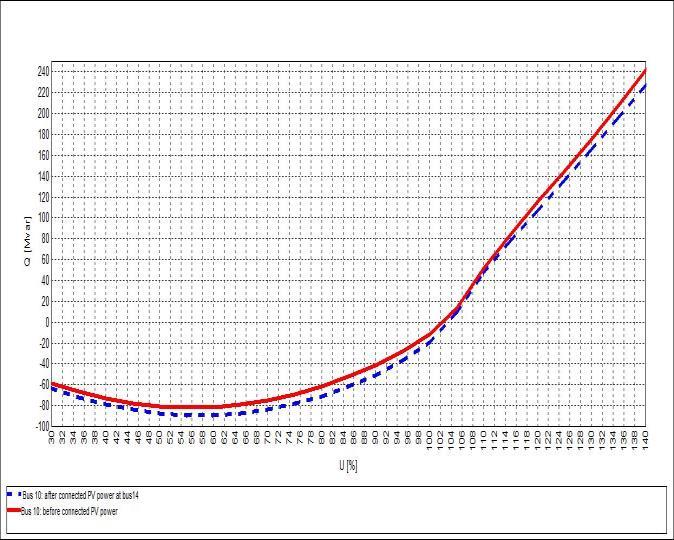
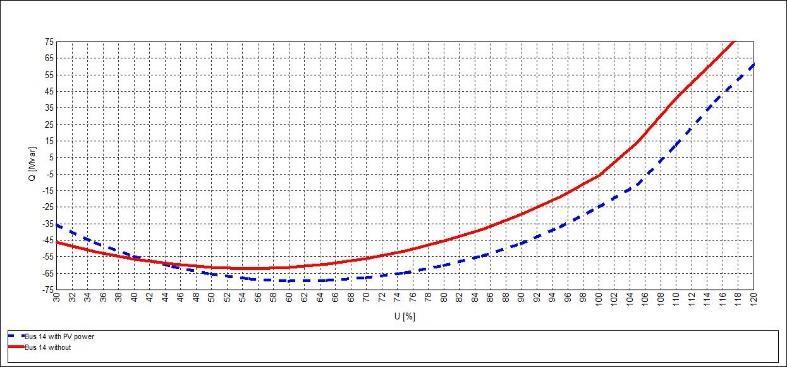
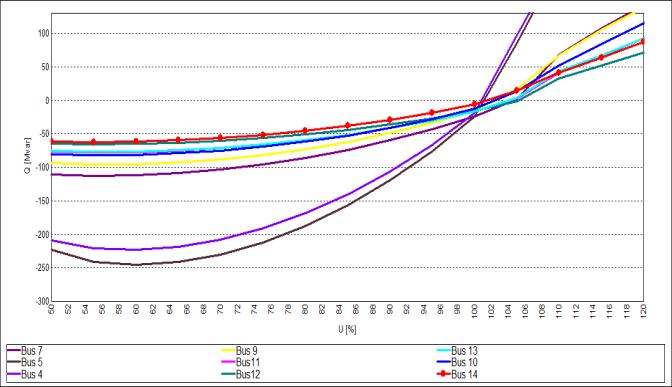
Table 4: Reactive power margin with and without solar PV power Bus no Reactive power margin [Mvar]
Reactive power margin [Mvar] with PV power
Improvment rate [%] Base case
Bus14 62.083 69.552 12.03
Bus13 76.865 84.440 9.85
Bus12 65.334 71.184 8.95
Bus11 77.503 84.463 8.98
Bus10 81.820 89.177 8.99
Bus9 95.374 103.553 8.58
Bus5 245.682 281.445 14.56
Bus4 223.156 254.299 13.96
(a) (b) (c)
Figure 7: Q-V curves for the weakest buses before and after PV integration. (a) Bus 14. (b) bus 10. (c) bus9
5.2.4 Impact on the maximum loading percentage and critical voltage
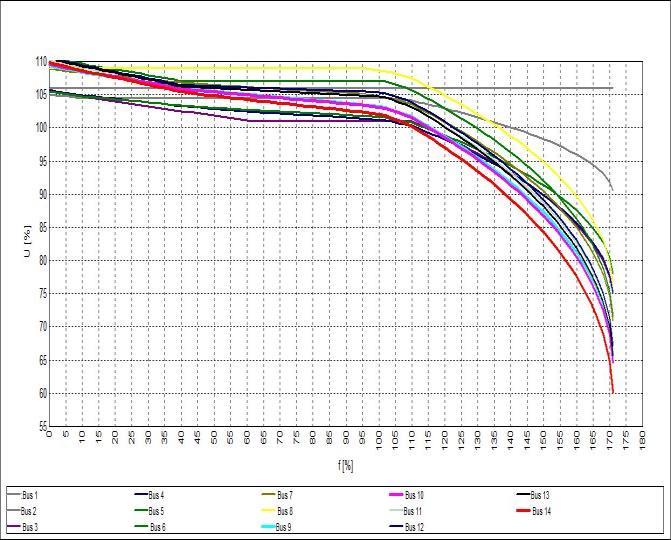
In CPF analysis, the PV curve is plotted to identify the maximum loading percentage of the test system as well as the bus critical voltage, after which voltage collapse occurs. Figure 8 depicts the system's P-V curve. From figure 8, it can
be noticed that the voltage on bus 14 is the lowest voltage among all system buses, followed by bus 10. The effect of integrating distributed PV power through bus 14 on the buses' critical voltage is shown in Table 5. Table 5 depicts the positive response of the voltage at system buses as well as their proclivity to improve. Figure 9 illustrates PV curves for the weakest buses in the test system with and without PV power.
Figure 8.: P-V curves of the 14-bus system (bas case)
Table 5: Critical voltage with and without solar PV power Bus number Bas Case With PV power
V critial [%] V critial [%]
Bus 1 106.00 106.00
Bus 2 90.49 90.49 Bus 3 74.99 74.99 Bus 4 75.19 75.82 Bus 5 78.07 79.03 Bus 6 71.54 72.79 Bus 7 71.04 72.35 Bus 8 76.56 77.78 Bus 9 65.66 66.68
Bus 10 64.64 65.42
Bus 11 67.09 68.00
Bus 12 67.19 68.58
Bus 13 65.63 68.33
Bus 14 60.18 68.75
(a) (b) (c)
Figure 9: shows the PV curves for the weakest buses before and after integrating PV power. (a) bus 14, (b) bus 10, (c) bus 9.
The effect of integrating distributed solar PV power generation on a test system's maximum power and loading percentage are shown in table 6. From Table 6, it can be seen that the loading percentage increased and improved significantly when solar PV power was integrated into the test system and that the maximum loading reached 198 % of the basic load. In other words, the system becomes less prone to
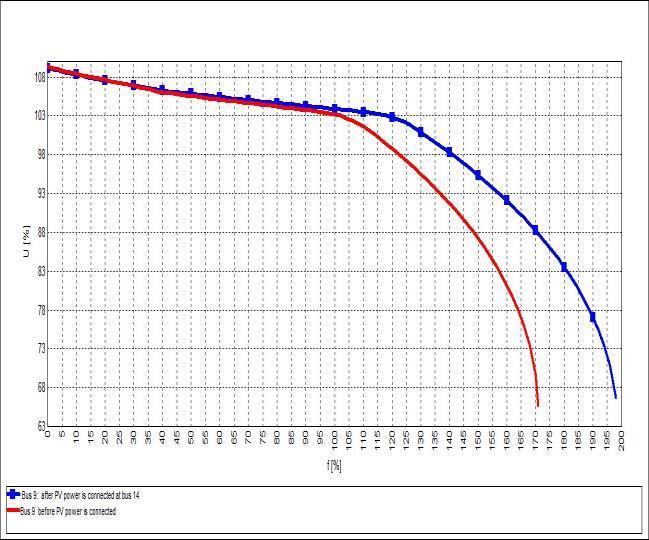
collapse with the presence of solar PV power. The incorporation of a solar PV power system into a test system increased the system load margin; therefore, additional loads can be added without there being a need to replace the equipment of the power system with capacities commensurate with the added loads. So, this represents a great economic benefit for planning and operating officials.
Table 6: Maximum power of 14-bus with and without PV power Grid status Maximum power (MW) Loading percentage (%)
Base Case 443.214 171.125
With PV power at bus 14
512.820 198.000
6. O. Mogaka, R. Orenge, and J. Ndirangu. Static Voltage Stability Assessment of the Kenyan Power Network, Journal of Electrical and Computer Engineering, vol. 2021, pp .1-16 ,2021.
7. Wondie, T. T., and Tella, T. G. Voltage Stability Assessments and Their Improvement Using Optimal Placed Static Synchronous Compensator(STATCOM), Journal of Electrical and Computer Engineering vol .2022, pp.1-12, 2022.
8. K. Z. Heetun, S. H. E. Abdel Aleem, and A. F. Zobaa. Voltage stability analysis of grid-connected wind farms with FACTS: Static and dynamic analysis, Energy and Policy Research, vol. 3, no. 1, pp. 1–12, Jan. 2016.
9. Serem, N., L. K. Letting, and J. Munda. Voltage Profile and Sensitivity Analysis for a Grid Connected Solar, Wind and Small Hydro Hybrid System, Energies 2021, 14, 3555, pp.1-26, 2021.
In this paper, the voltage stability of a power network connected to distributed solar PV is examined. Four different analysis techniques are employed to analyze the voltage stabilityofa 14-bus systemnetworkusingNEPLAN software. The impact of integrating PV power into a system network is analyzed and discussed for each technique. Modal analysis is utilized to investigate the voltage stability status of the test system and reveal the reasons for instability. Sensitivity analysis is performed to pinpoint buses with higher sensitivity in the test system. PV curves using CPF are drawn to illustrate the voltage profile at the critical point and to determine the MW loading of the test system. QV curves are further plotted to determine the reactive power margin of the IEEE 14-bus system network. The results demonstrated that the integration of distributed solar PV power into the test system led to an obvious improvement in voltage stability, a decrease in the sensitivity of buses, a significant improvement in the system MW loading, an enhancement in the voltage profile, and a noticeable increase in the reactive power margin of identified buses.
1. B. B.Adetokun, J. O. Ojo andC. M. Muriithi. Application of large-scale grid-connected solar photovoltaic system for voltage stability improvement of weak national grids, Scientific Reports 11, no.1 ,pp. 1-15, 2021.
2. J. Mohtasham. Review Article-Renewable Energies, in Energy Procedia, vol. 74, pp. 1289–1297, 2015.
3. S. Rahman et. al. Analysis of Power Grid Voltage Stability with High Penetration of Solar PV Systems, in IEEE Transactions on Industry Applications, vol. 57, no. 3, pp. 2245-2257, May-June 2021, doi: 10.1109/TIA.2021.3066326.
4. L. van Dai, N. Minh Khoa, and L. Cao Quyen. An Innovatory Method Based on Continuation Power Flow to Analyze Power System Voltage Stability with Distributed Generation Penetration, Complexity, vol. 2020, pp.1-15, 2020.
5. P. Kundur. Power System Stability and Control, McGraw-Hill, NewYork, NY, USA, 1994.
10.Z. H. Al-Tameemi, K. M. Abuwaleda, H. M. Almukhtar, and M. K. Abbas. Voltage stability enhancement based on DG units, Electrical Engineering, vol. 100, no. 4, pp. 2707–2716, Dec. 2018.
11.M. A. Kabir, M. S. Alam, Nahid-Al-Masood and M. K. Alam. Voltage Performance Analysis with Integration of Utility Scale Solar PV Plant in Bangladesh National Grid, 2020 IEEE Region 10 Symposium (TENSYMP), pp. 682-685, 2020.
12.C. Dondariya and D. K. Sakravdia. Voltage Stability Assessment and Improvement in Power Systems with Solar Photovoltaic Penetration, 2021 IEEE 2nd International Conference on Electrical Power and Energy Systems (ICEPES), pp. 1-4, 2021.
13.A.S.O. Ogunjuyigbe, T.R. Ayodele, and O.O. Akinola. Impact of distributed generators on the power loss and voltage profile of sub-transmission network, Journal of Electrical Systems and InformationTechnology, vol .3, no. 1, pp. 94-107,2016.
14.A. K. Min and Y. A. Oo. Voltage stability assessment of power system with distributed generation in free and open-source software, American Academic Scientific Research Journal for Engineering, Technology, and Sciences vol. 26, no. 2, pp. 283-300, 2016.
15.B. B. Adetokun, J. O. Ojo and C. M. Muriithi. Reactive power-voltage-based voltage instability sensitivity indices for power grid with increasing renewable energy penetration, in IEEE Access, vol. 8, pp. 8540185410, 2020.
16.R. Shah, N. Mithulananathan, R. Bansal, K.Y. Lee, andA. Lomi Influence of Large-scale PV on Voltage Stability of Sub-transmission System, International Journal on Electrical Engineering and Informatics, Volume 4, Number 1,pp 148-161, March 2012.
17.R. Shah, N. Mithulananthan, R. C. Bansal, K. Y. Lee, and A. Lomi. Power system voltage stability as affected by large-scale PV penetration, Proceedings of the 2011 International Conference on Electrical Engineering and Informatics, pp. 1-6, 2011.
18.D. R. K and J. P. Impact of Solar Photovoltaic Penetration on Voltage Stability of Power Network, 2021 International Conference on Communication,
Control and Information Sciences (ICCISc), pp. 1-6, Jun. 2021.
19.N. Hosseinzadeh, A. Aziz, A. Mahmud, A. Gargoom, and M. Rabbani. Voltage Stability of Power Systems with Renewable-Energy Inverter-Based Generators: A Review, Electronics, vol. 10, no.2, p.115, 2021.
20.B. Gao, G. K. Morison, and P. Kundur. Voltage Stability Evaluation Using ModalAnalysis, IEEE Transactions on Power Systems, vol. 7, no. 4, pp. 1529–1542, 1992.
21.Al-Tameemi, Zaid H., et al. Voltage stability enhancement based on DG units, Electrical Engineering 100, no.4, pp. 2707-2716, 2016.
22.P. Chawla, and B Singh. Voltage Stability Assessment and Enhancement Using STATCOM - A Case Study, World Academy of Science, Engineering and Technology, Open Science Index 84, International Journal of Electrical and Computer Engineering, Vol.7, no.12, pp. 1759-1764, 2013.
23.N. K. Roy, H. R. Pota andA.Anwar. Anew approach for wind and solar type DG placement in power distribution networks to enhance systems stability, 2012 IEEE International Power Engineering and Optimization Conference Melaka, Malaysia, pp. 296-301, 2012.
24.Federico Milano. Power System Modelling and Scripting, Springer, ETSII, University of Castilla - La Mancha 13071, Ciudad Real Spain 2010.