International Journal of Emerging Trends in Engineering Research
Available Online at http://www.warse.org/IJETER/static/pdf/file/ijeter061112023.pdf https://doi.org/10.30534/ijeter/2023/061112023


Available Online at http://www.warse.org/IJETER/static/pdf/file/ijeter061112023.pdf https://doi.org/10.30534/ijeter/2023/061112023
Muh.NurkoyimKustanto1,SantosoMulyadi2,GagukJatisukamto3,YuniHermawan4 , MuhammadAlwiKurniawanGuhardiputra5 1,2,3,4,5University of Jember, Indonesia, nurkoyin@unej.ac.id
Received Date: December 10, 2022 Accepted Date: December 20, 2022 Published Date : January 07, 2023
Inthe race conditions of the EnergySaving Car Contest, urban concept vehicles must comply with the special rules that have been set, namely 'stop & go driving'. Therefore, the designed car must have the toughness to accelerate and decelerate safely. Chassis is a fundamental part of the vehicle that functions to support the overall load that works on the car, keeps the car's condition rigid, does not experience excessive deformation and is safe when used. For that chassis design planningmust be considered. The selection of a strong but still lightweight material was carried out, using 6061 aluminum material. In this research, an analysis will be carried out on the design of the TITEN EV-2 car chassis. TITEN itself is the name of the Jember University research team that focuses on developing energy-efficient electric vehicles. In this study the analysis is focused on the chassis that experiences dynamic loading when braking with variations in the shape of the chassis profile, namely profiles in the shape of a square and hollowrectangle and the braking distance is varied. from20m, 15m, 10m. By using the Finite Element Method (FEM), the strength analysis of the chassis structure design can be determined by looking at the maximum stress and total deformationactingonthe chassis. Fromthe simulation results, the rectangular hollow chassis profile has a mass of 7.6 kg which is lighter than the square hollow chassis which has a mass of 9.4 kg. Rectangular hollow chassis has a maximum stress that is superior to square hollow chassis at loading distances of 20 m and 15 m, but at a braking distance of 10 m, square hollow chassis is superior in terms of total deformation and maximum stress.
Key words: Chassis, Finite Element Method, Aluminum 6061.
Highlight a section that you want to designate with a certain style, then select the appropriate name on the style menu. The style will adjust your fonts and line spacing. Data from the Central Statistics Agency noted that in 2020 the growth of passenger cars reached 15,797,746, increasing 2-fold in just 9
years since 2008 which only reached 7,489,852 cars [1]. Energy demand in the transportation sector is still dominated by materials from unsustainable sources. The highest demand for energy in the transportation sector is fuel (96%), the remainder is supplied by biodiesel and natural gas, while electric car users are not too influential because the number of electric cars assumed is still small compared to conventional vehicles [2].
The 2021 Energy-Saving Car (KMHE) is a national-level economical car competition organized by the National Achievement Center (Puspresnas) of the Ministry of Education, Culture, Research and Technology (Kemdikbudristek) of the Republic of Indonesia in collaboration with university hosts. This activity aims to test students' ability to build and design vehicles that are safe, economical and environmentally friendly. The KMHE competition requires each team to design, build and test vehicles that can travel long distances with the least energy consumption [3].
In the conditions of the urban concept vehicle race must complywith special regulations set byKMHE. namely 'stop & go driving'. This requires the vehicle to stop every lap. Therefore, the designed car must have the toughness to accelerate and be able to decelerate safely. Chassis is one importantcomponentthatfunctionsasasupportfor the overall load acting on the vehicle, so that the manufacture and design of a chassis is the most important factor in a vehicle.
Finite Element Method is a numerical method for obtaining solutions to differential problems, both ordinary differential equations (Ordinary Differential Equation) and partial differential equations (Partial Differential Equation). The principle of the finite element method is to divide the problem domain, be it the spatial domain or the time domain, into smaller sub domains or elements [4].
Vehicle weight reduction is one of the most effective means of reducing fuel consumption and greenhouse gases for vehicles.
It has been estimated that for every 10% weight removed from the total vehicle weight, fuel economy increases by 7%. To achieve lightweight construction, without compromising rigidity, automakers have investigated replacing steel with aluminum, magnesium, composites and foam [5].
From this background it is important to study and analyze the design of the TITEN Ev-2 urban car chassis under dynamic loading when braking. The material used in this research is aluminum 6061 series with the variation used in this research is the Chassis profile shape variation, namely square and rectangular hollow profiles. The purpose of this study is to determine the effect and optimal conditions of the design parameters in the form of a profile on an electric car chassis using the Finite Element Method and to obtain a chassis that is light yet safe when used.
Aluminum is a light metal and the use of aluminum offers considerable potential for reducing the weight of a car specifically on the chassis. Aluminum 6061 has an alloy of magnesiumsilicon (Al-Mg-Si) belonging to the group that can be heat-treated (heat treble) Aluminum offers the fastest, safest, most environmentally friendly, and value added way to reduce massand improve vehicle performance, increasing fuel efficiency, extending batteryrange and reducing emissions [6] Inmore detail the characteristics ofthis material canbe seen in Table 1. namely the value of the material properties of aluminum 6061.
Table 1 Aluminum 6061 Material Properties Properties Value
Ultimate Tensile Strength 310 Mpa
Tensile Yield Strenght 276 MPa
Modulus of Elasticity 68,9 GPa Density 2,7 g/cc
Shear Modulus 26 GPa
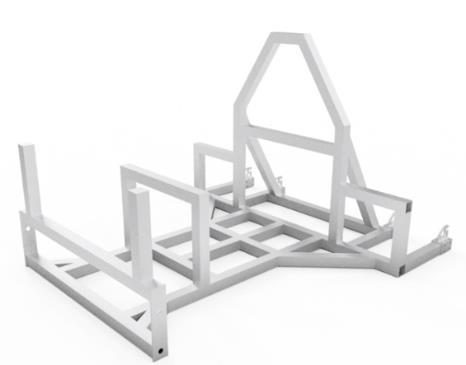
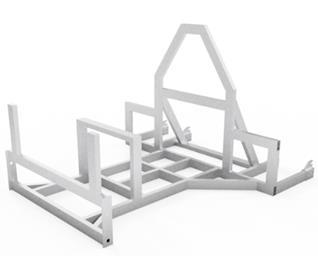
As a basis for the design of the chassis, in addition to the main dimensions of the chassis must be determined. Chassis dimensions refer to competition regulations for the Energy-Saving Car Contest (KMHE) and shell eco marathon [7]. In this study, two profile shape variations were used, namely a chassis with a rectangular hollow profile and a chassis with a square hollow profile with a thickness of 1.2 mm. which is shown in Figure 1.
(a) (b) Figure 1. (a) Rectangular Profile Chassis Design, (b) Square Profile Chassis Design
In race conditions, the car is assumed to be able to decelerate (brake) within a distance of 20 meters, 15 meters and 10 meters at a speed of 50 km/hour. Then the value of deceleration(deceleration)canbe obtained fromeach distance t by calculating using equation (1) as shown in Table 2.
(1)
Where:
s = Distance (m)
vo = Initial Speed (m/s)
vt = Final Speed (m/s)
t = Time (Sekon)
a = Acceleration (m/s2)
Table 2. Calculation of Deceleration With Variation of Braking Distance
Distance 20 m Distance 15 m Distance 10 m
At the time of braking there is a load in the vertical and horizontal directions which is supported bythe chassis. With a gravity value of 9.81 m/s2 and a known deceleration due to braking. then the load data during braking is obtained as shown in Table 3 and Table 4 below:
Table 3. Load When Braking On Chassis Vertical loading Braking Load (a = 4,822 1. 1. 2. 2. 3. 3. 4. 4. 5. 5. 6. 6. 7. 7.
Table 4. Load When Braking On Chassis Braking Load (a = 6,43 Braking Load (a = 9,64 1. 1. 2. 2. 3. 3. 4. 4. 5. 5. 6. 6. 7. 7.
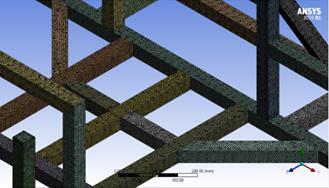
Determination of frame structure domain discretization refers to the validation model, which is based on the type of meshing and the quality of the meshing used. The type of meshing used is completely uniform using a tetrahedron element [8]. The size of the elements used is 4.5 mm as shown in Figure 2
(a) (b)
Figure 2. Tetrahedron Element Mesh (a) Chassis Rectangular hollow, (b) Chassis Square Hollow
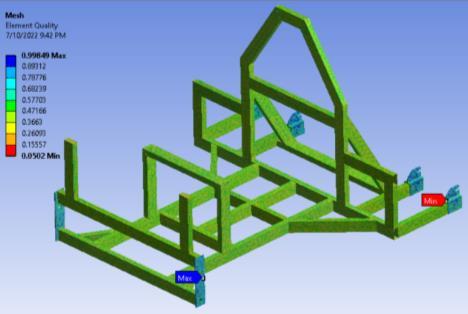
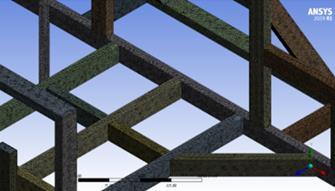
Based on these parameters the quality of the mesh structure of the chassis can be determined. From the discretization results shown in Figure 3. The quality of the formed mesh has a good majority value as shown in uniform colors and good element quality values. The discretization in this model has a good distributionofelementqualityso that the difference inelement quality between the formed parts occurs uniformly or does not contrast.
(a)
Figure 3. Average Element Quality (a) Chassis Rectangular Hollow, (b) Chassis Square Hollow

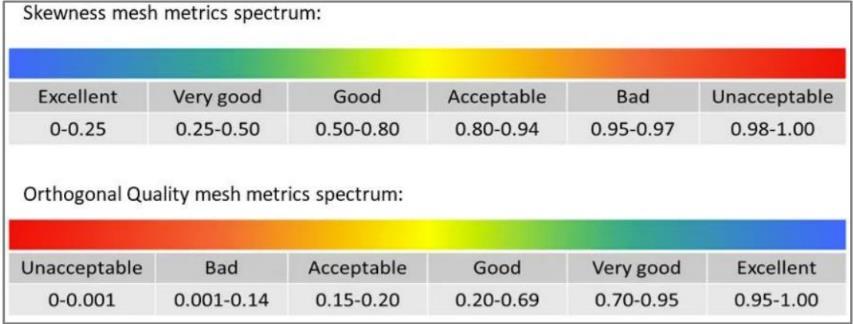
The chassis structure modeled in this study has the discretization results shown in Table 5. By using uniform parameters during the meshing process, the results obtained in the geometric discretization process between chassis models are also uniform. The resulting mesh values used in modeling the two chassis models used show average skewness and orthogonal quality in the range of good meshing quality.
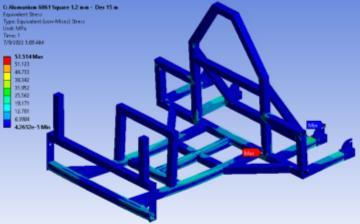
shown in Table 7. The simulation results show the magnitude of the maximum stress value and the total deformation that occurs in the chassis. The location of this value can be known by visualization which is shown by the color gradation in the simulation results in the Ansys software, starting fromthe blue color to show the result of the smallest stress or deformation up to the largest value which is shown by the red color.
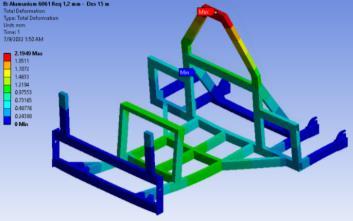
Table 6. Maximum Stress of Rectangular Hollow Profile Chassis Structure
Braking Distance (m)
Maximum Stress (MPa) Visual Image 20 53,9 15 56,37 10 67,81
The results of discretization can be seen in the spectrum contained in Figure 4. The average meshing quality produced shows results in the good range based on the skewness parameter values and orthogonal quality output from the discretization process.
Test results for the design of the rectangular hollow profile chassis structure when simulated in the Ansys Workbench R1 software with variations in braking distance loading (20m, 15m, 10m). This simulation produces maximum stress data and total deformation that occurs in the rectangular profile chassis structure. The data is shown in Table 6 for the maximum stresses and for the total deformation of the chassis
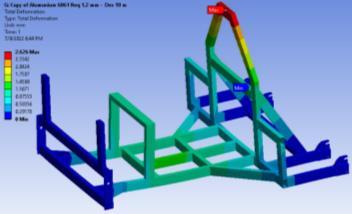

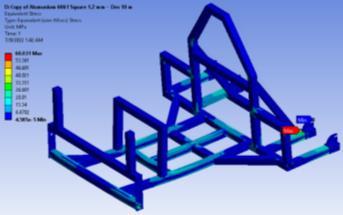
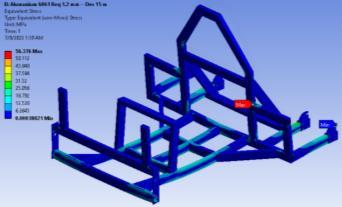
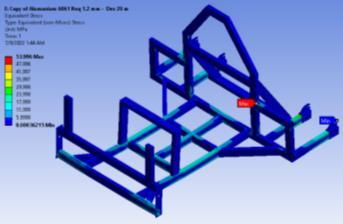
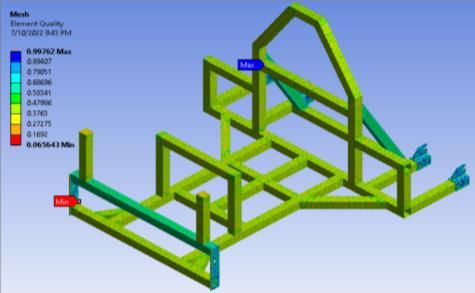
Table 7. Total Deformation Chassis Structure Rectangular Hollow Profile
Braking Distance (m)
Total Deformation (Mpa) Visual Image 20 1,97 15 2,1 10 2,6
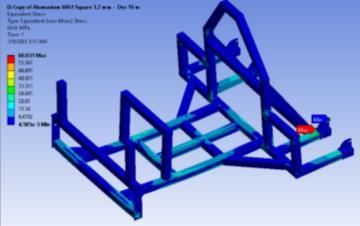
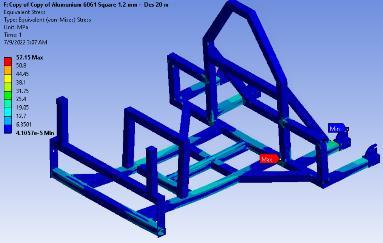
The results of testing the design of the square hollow profile chassis structure with the same method produce the maximum data stress and total deformation that occurs in the square profile chassis structure. The data is shown in Table 8 for the maximum stresses and for the total deformation of the chassis shown in Table 9. The simulation results show the magnitude of the maximum stress value and the total deformation that occurs in the chassis.
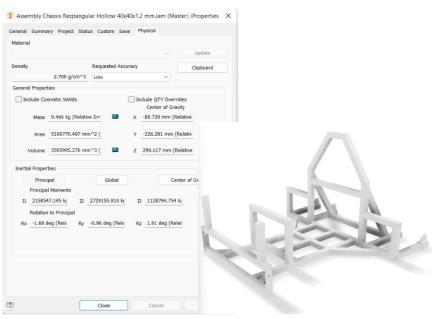
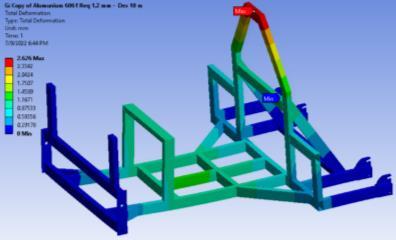

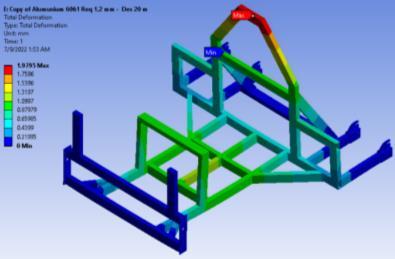
Table 8. Maximum Stress of Rectangular Hollow Profile Chassis Structure
Braking Distance (m)
Maximum Stress (MPa) Visual Image 20 53,9 15 56,37 10 67,81
10 2,6
Table 9. Total Deformation Chassis Structure Square Hollow Profile
Braking Distance (m)
Total Deformation (MPa) Visual Image 20 1,97 15 2,1
With the material properties, namely the density of the 6061 aluminum material used in the chassis structure, the mass of the chassis with rectangular and square hollow profiles can be known. Following is the mass of the chassis with rectangular and square hollow profiles after the design process is carried out according to the dimensions of the chassis and the material parameters used are shown in Table 10.
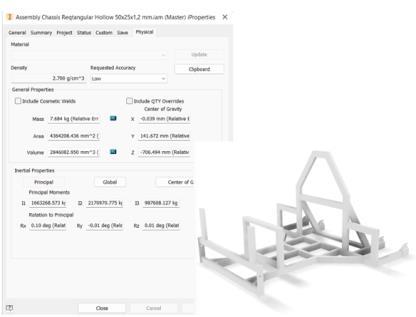
Table 10. Mass Comparison of Chassis Rectangular Hollow and Square Hollow Chassis Massa Chassis Visual Image Rectang ular Hollow 7,6 kg Square Hollow 9,4 kg
Based on the research and analysis, it can be concluded that the chassis with a rectangular hollow profile has a maximum stress to braking loading with a distance of 15 m, which is 56.37 MPa, which is smaller than the square hollow profile, which is 57.51 MPa. The rectangular hollow chassis has a mass of 7.6 kg which is lighter than the square hollow chassis which has a mass of 9.4 kg.
1. Transport Studies Circle. 2018. Number of Vehicles in Indonesia Period 1949-2018 https://transportologi.org/data-kita/nomor-kendaraan-di-i ndonesiaperiod-1949-2018/ [Accessed February 16, 2022].
2. Ministry of Energy and Mineral Resources of the Republic ofIndonesia. 2019. IndonesiaEnergyOutlook (OEI)2019. Jakarta: National Energy Council.
3. Synta, A. R., (2021). Analysis and Manufacturing of the Ladder Frame Type Chassis of the Kmhe Urban ConceptCarUsingSimulationMethodsandPahland Beitz. ENOTEK: Journal of Energy and Technology Innovation, 1(01), 14–18.
4. Tsirogiannis, E. C., Stavroulakis, G. E., & Makridis, S. S. (2019). Electric car Chassis for Shell Eco Marathon competition: Design, modeling and finite element analysis. World Electric Vehicle Journal, 10(1), 1–13.
5. Ghassemieh, E., 2011. Materials in Automotive Application, State of the Art and Prospects, New Trends Developments in Automotive Industry, Chiaberge, M., 978-953-307-999-8.
6. The Aluminum Association, AluminumAlloys101,The Aluminum Association https://www.aluminum.org/sites/default/files/2021-09/A A-Infographic-Alloys-v5_0.jpg. [accessed July 3, 2022]
7. Shell Eco Marathon, S. (2022). Shell Eco-Marathon 2022 Official Rules. Chapter I. Shell Eco Marathon, 10–27.
8. Prasetiyo, A. B., Azmi, A. A., Pamuji, D. S., & Yaqin, R. (2018). TheInfluenceofStructuredandUnstructured MeshDifferencesontheSimulationofCoolingSystem for Injection Molding of Plastic Products. National Proceedings of Industrial and Information Technology Engineering XIV Year 2019 (ReTII), 2018(November), 400–406