Volume 11. No.1, January 2023
International Journal of Emerging Trends in Engineering Research
Available Online at http://www.warse.org/IJETER/static/pdf/file/ijeter071112023.pdf https://doi.org/10.30534/ijeter/2023/071112023


Volume 11. No.1, January 2023
Available Online at http://www.warse.org/IJETER/static/pdf/file/ijeter071112023.pdf https://doi.org/10.30534/ijeter/2023/071112023
Yaddarabullah1 , Angga Eka Prasetya2 , Ade Syahputra3 , Silvester Dian Handy Permana4
1Department of Informatics, Universitas Trilogi, Indonesia, yaddarabullah@trilogi.ac.id
2Department of Informatics, Universitas Trilogi, Indonesia, anggaprasetya@trilogi.ac.id
3Department of Informatics, Universitas Trilogi, Indonesia, adesyahputra@trilogi.ac.id
4Department of Informatics, Universitas Trilogi, Indonesia, handy@trilogi.ac.id
Received Date: December 11, 2022 Accepted Date: December 23, 2022 Published Date : January 07, 2023
Pamijahan is one ofthe sub-districts located in Bogor regency, West Java. Pamijahan has a variety of tourist destinations, one of which is the Cigamea waterfall, Cikuluwung waterfall, and the Seribu watering problem when visiting tourists, one of them is the weather factor such as rainy weather where Bogor has a highland area so very big influence on the variation of rain there and visitors have difficulty in choosing tourist sites with sunny conditions, the solution to the problem above is to predict the weather during rainy weather in the tourist areas of Cigameawaterfall,Cikuluwungwaterfall,and Seribuwaterfall usingthe Autoreggressive Integrated Moving Average method as weather prediction process uses Time Series data with the help ofthe Internet ofThings tool indata retrieval, the weather prediction testing process uses the Autoreggressive Integrated Moving Average method by calculating the value of MSE (Mean Square Error) and MAPE (Mean Absolute Presentage Error) as minimum as possible to see the level of accuracy of the weather prediction process at each designated tourist site. The results of this study indicate that weather forecasting in Cigamea, Cikuluwung and Seribu waterfalls shows the smallest MSE (Mean Square Error) value, the waterfall that has the smallest MSE value, the Seribu waterfall with the Mean Square Error value of the temperature sensor 0.06, Air Humidity 0.59, and Light Intensity 13.30, so that tourist attractionsthatcanbeused as tourist attractions for visitors are the Seribu Waterfall.
Key words : Pamijahan, Autoreggressive Integrated Moving Average, Internet of Things.
The development in the world of tourism is very important to pay attention to, efforts in developing sustainable and
environmentally friendly tourism, it is necessary to maintain the authenticity, beautyand uniqueness oftourist attractions as a form of offering to tourists for tourism [1] Bogor City, which is about 60 km from Jakarta, is one of the cities in Indonesia buffer of West Java Province. Besides directly adjacent to the city of Jakarta as the capital city of Indonesia which is also the center of government, the City of Bogor is also directly adjacent to the cities of Depok, Tangerang and Bekasi strategic and easily accessible from various directions either via ordinary highways or freeway. The city of Bogor is famous as a rainy city with its cool air relatively cool and rich in various natural, artificial and cultural tourist attractions, so that it attracts a lot of attention from domestic tourists as well as tourists foreign countries [2] Pami jahan is a sub-district located in Bogor Regency, West Java, the Pamijahan sub-district has several villages including Pasarean Village, Pamijahan, Mount Bunder 1, Mount Bunder 2, Ciasihan, Cibitung, and Gunung Sari. Pamijahan is an area with many tourist attractions, one of which is Curug Cigamea, Curug Cikuluwung, and Curug Seribu.
The factor that influences the intention of tourists to visit is the rainy weather factor where the impact of rainy weather is the decrease in the interest of tourists to visit along with weather conditions. This condition can affect the comfort of tourists to enjoy the natural resources of the tourist area and the difficulty of finding tourist attractions with favorable weather conditions [3]
Based on the problems above, a weather forecasting system will be developed to recommend Cigamea waterfalls, Cikuluwung waterfalls, and a thousand waterfalls in the Pamijahan area based on the Internet of Things using several sensors including temperature sensors, light intensity, and humidity, from each Each of these sensors will be used in samplingdatafor10daysfromOctober7, 2019 to October 17, 2019, from the data that has been obtained it will produce weather forecasts for the next 10 days until October 27 2019 [4]. The prediction results will be used as weather forecast solutions and provide weather recommendations for tourist
attractions that have sunny weather in tourist attractions that are useful in the Pamijahan area. as a reference for tourists in visiting and choosing tourist attractions that are in accordance with the wishes of visitors [5]
The method used in forecasting the weather is the Autoreggressive Integrated Moving Average method, the Autoreggressive Integrated Moving Average method functions for weather forecasting based on data collection for 9 days and 3 days for data collection from each waterfall via the Internet of Things tool media and as an output to display tourist attractions that have good weather according to the wishes of visitors [6].
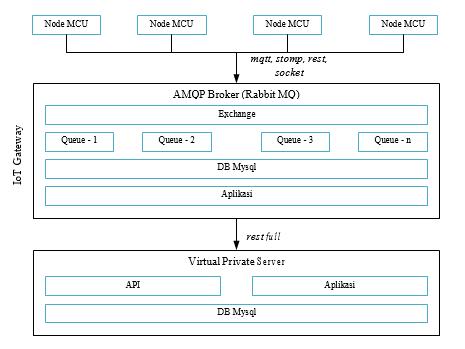
The research methodology used in this study consisted of five stages. The initial stage begins with data acquisition as data retrieval and collection. The second stage is the stage of the process of making data prediction models and weather forecasting fromthe data that has been collected [7]. The third stage is the stage of the weather prediction process from the data obtained. The fourth stage is the stage of the weighting process for weather factors through interview media. The fifth stage is testingto find out the smallest MSE and MAPE results from the Autoreggressive Integrated Moving Average method as a recommendation for tourist attractions in the Pamijahan area based on weather conditions [8]. The methodologyof this research can be seen in Figure 1 below:
light intensity. working process of the Internet of Things tool to get weather data in real time through sensors that have been installed onthe Internet ofThings tool after getting data in real time through the Internet of Things then the data will pass through the Rasberry pi as a Gateway to receive data from several sensors that have been installed will then enter the Cloud Server as a place to store data that has been previously retrieved through the Internet of Things tool [9]. The data that has been obtained will be displayed through the website that has been created.
At this stage, it is a process for predicting the weather using the Time Series method with the Autoreggressive Integrated Moving Average model [10], in the stage of making the prediction model the author uses several data including temperature data, light intensity data, and wind speed data that have been obtained on Monday, October 7, 2019 as a simulation of the weather prediction process and will be predicted in the next 10 days according to the amount of data.
The first step in predicting the weather is to create a model for the next prediction using Microsoft Excel Software, then determine the Beta 1 and Beta 2 values that contain the Coefficient Estimate value that have been obtained previously through the Minitab Software [11]
The Coefficient Estimation Value that has been obtained will be used to calculate the Autoreggressive value of each data. Then calculate the First Iteration to the 10th Iteration according to the amount of data obtained to get the Autoreggressive, Moving Average, MSE, and MAPE values on each data [12]. Data on temperature, light intensity, and humidity can be seen in table 1 below:
Table 1: Data temperature, light intensity, and humidity.
No. TempoC Light Intensity Cd Humidity Rh 1 30 907 90 2 30 911 90 3 29 916 90 4 29 909 88 5 29 1024 89 6 28 871 89 7 29 940 89 8 30 944 90 9 30 939 89 10 30 923 89
Figure 1: Research Methodology.
The data acquisition system of this research is to retrieve datathroughamediadevicecalled the Internet ofThings using temperature sensors, air humidity sensors, wind speed, and
At this data prediction analysis stage, a calculation process willbecarriedouttodeterminethevalueofForecastingfor the next 10 days according to the amount of data obtained previously, the data prediction stage uses the 11th iteration to the 20th iteration of Forecasting for the next 10 days [13] The analysis values of the predicted temperature data can be seen in the following table 2 below:
Table 2: Value of Temperature prediction data analysis.
No. Temp oC AR(1) MA(1) MSE MAPE
1 30 30 0.00 0 0.0
2 30 29.70 0.30 0.09 0.9
3 29 29.72 0.72 0.52 5.2
4 29 28.75 0.25 0.06 0.6
5 29 28.72 0.28 0.08 0.8
6 28 28.73 0.73 0.53 5.3
7 29 27.76 1.24 1.53 15.3
8 30 28.78 1.22 1.48 14.8
9 30 29.77 0.23 0.05 0.5
10 30 29.71 0.29 0.08 0.8
Intheprocessofweightingthe predictionresults, interviews will be conducted with visitors at three tourist attractions including Curug Cigamea, Curug Cikuluwung, and Curug Seribu. Temperature, humidity and light intensity. The summation of the results of each tourist attraction will be compared with the sum results of each tourist attraction with a small summation value as a recommendation for tourist attractions for visitors [14] The table of weighting results on each waterfall can be seen in the following tables 3, 4, and 5 below:
Table 3: Weighting of curug cikuluwung.
Curug Cikuluwung
Weight Value Y
Temp 5 28.58 142.9
Light Intensity 4 365.74 1462.96 Humidity 3 105.25 315.75 Results 1922
Table 4: Weighting of curug cigamea.
Curug Cigamea
Weight Value Y
Temp 5 26.34 131.7
Light Intensity 4 432.12 1728.48
Humidity 3 100.45 301.35 Results 2161.53
Table 5: Weighting of curug seribu.
Curug Seribu
Weight Value Y
Temp 5 26.39 131.95
Light Intensity 4 374.11 1496.44 Humidity 3 80.53 241.59 Results 1869.98
An explanation of the weighting table above is the weight on each data different for temperature has a weight of 5, light intensity has a weight of 4, and humidity has a weight of 3, then the results of the predictions on each data will be multiplied bythe weight of each data that has been determined previously to determine the value of Y on tourist attractions, the last stage calculate the overall value of the Y value in each
data then the results that have been obtained then choose which result has the smallest value of the three waterfall, the result of the weighted prediction is a thousand waterfalls because it has the smallest value of the 3 waterfalls overall.
Calculates the MSE (Mean Square Error) value and the MAPE (Mean Absolute Presentage Error) value from the 9-day sample data of each tourist spot to see the magnitude of the accuracy of the forecasts generated from each tourist spot studied so that the error value obtained is minimized [15] maybe, the calculation of MSE and MAPE values is carried out on each data that has calculated the Autoreggressive and MovingAveragevaluesthenfromeachMSEandMAPEvalue in each data it will be averaged so as to produce MSE and MAPE values with a small percentage.
After analyzing and simulating the design contained in the previous chapter, the results and discussion of the system being built are obtained. This is based on the Autoreggressive Integrated Moving Average method used in this study.
The series of sensors used in the Internet of Things consist of several sensors for data retrieval including temperature, air humidity,lightintensity. TheDHT11 sensor ( Air temperature and humidity) is used to retrieve data from two parameters namely air temperature and humidity. The results obtained from the DHT11 sensor have output and are processed by Arduino and ESP8266. Proses works DHT11 where the DHT11 sensor will take data to be channeled to Arduino and for ESP8266 as an intermediary medium to channel data to raspberry Pi which is a place to store data to be used online or offline. The ESP8266 has interconnected pins including + 5 volts to + DHT11 sensor, Ground (GND) to – (minus) sensor and digital (D1) which is connected to the output with a voltageof10000ohms,whileSCl,toSCL, SDAto SDA, VCC to + 5 volts as a link for display on the screen.
The Light Dependent Resistor sensor is used to retrieve data about sunlight where the resistance value onthe resistor is affected by light. The value of the data will rise and fall as the exposure to light hits the sensor. Data results that have been obtained throughthe light intensitysensor then the data will be processed through Arduino and ESP8266 to produce output.
The working p roses of the sensor The light intensity of the data that has been obtained is then channeled to Arduino and ESP8266 as a data distribution medium to the Raspberry Pi as a place to store data, so that the data that has been entered can be accessed online or offline. The pin circuit on the sensor connected to the ESP8266 includes Analog0 (A0) to Analog0 (A0) which functions as a signal taker, VCC enters + 5 volts, and Ground (GND) to Ground (GND) functions as voltage, while for the appearance on the LCD screen the pin circuit includes SCL to SCL, SDA to SDA, VCC to + 5 volts and Ground (GND) to 44 Ground (GND).
The data transmission system on the Internet of Things consists of sensors, gateways, and servers. Each sensor consists ofa microcontroller connected to the sensor. Then the sensor module will send sensor data to the IoT gateway every 15 seconds via wireless communication media (WiFi) which will be stored by the IoT gateway into RabbitMQ. Data on RabbitMQ will be logged into DBMysql.
Table 6: Prediction Model Values.
No. Temp oC AR(1) MA(1) MSE MAPE
1 30 30 0.00 0 0.0
2 30 29.70 0.30 0.09 0.9
3 29 29.72 0.72 0.52 5.2
4 29 28.75 0.25 0.06 0.6
5 29 28.72 0.28 0.08 0.8
6 28 28.73 0.73 0.53 5.3
7 29 27.76 1.24 1.53 15.3
8 30 28.78 1.22 1.48 14.8
9 30 29.77 0.23 0.05 0.5
10 30 29.71 0.29 0.08 0.8
11 29.40 29.72 0.32 0.10 1.0
12 29.40 29.13 0.27 0.08 0.8
13 29.35 29.12 0.22 0.05 0.5
14 29.29 29.07 0.22 0.05 0.5
15 29.31 29.01 0.31 0.09 0.9
16 29.34 29.04 0.30 0.09 0.9
17 29.37 29.07 0.31 0.09 0.9
18 29.50 29.10 0.40 0.16 1.6
19 29.54 29.23 0.32 0.10 1.0
20 29.50 29.26 0.23 0.06 0.6
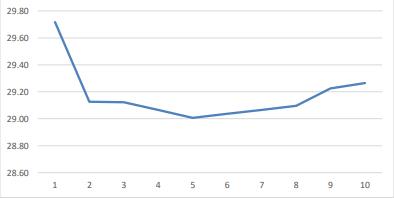
Average 29.17 0.26 2.6
Temp Prediction 29.44
The results of the calculation above obtained the predicted results, namely 29.44, an average of 29.17. The results of the forecasting calculation are then used as a graph where the forecasting chart for temperature data has a fairly regular pattern
At the data access stage, it is a way of accessing data using an API to retrieve data that has been previously obtained through sensors, accessing data consisting of Raspberry Pi to the Cloud Server and Cloud Server to the Website for data processing. Sending data from the Raspberry Pi to the Cloud Server uses an internet connection to distribute the data.
Raspberry Pi is also a data storage place that can be accessed online and offline. The use of this data access is in order to facilitate data retrieval to be managed on the Website system. Accessing data from the cloud server to the website is as data retrieval for each sensor that has been stored on the cloudservertobe called to the website. There are several APIs for each data such as data on temperature, air humidity, light intensity, and soil humidity. Each API above contains a record of each sensor and has been stored on the cloud server for data processing on the website.
In this data prediction analysis stage, a calculation process will be carried out to determine the Forecasting value for the next 10 days according to the amount of data obtained previously, the data prediction stage uses the 11th iteration to the 20th iteration of Forecasting for the next 10 days, the first step inthe data predictionstage is to calculate data for the 11th data to the 20th data.
The results of the next prediction value in the Implementation of aforecasting interface menu display to see the prediction results obtained by displaying the results of the graph from the results of the prediction processing of each data. In the Forecasting menu display has several views including the menu of each waterfall including a table of data graphs obtained and a table of prediction data graphs, the Forecasting menu also displays the value of the average of the data and the Mean Square Error (MSE) value from the results of the prediction data.
3.4.
Figure 4: Forecasting view.
Weighting testing is the predicted value will be multiplied bythe weight oneach sensor then the multiplication results are added up, after that the system will read the results of what waterfall calculation has the smallest value which will later be used as a recommendation for tourists in visiting tourist attractions.
The results of the Mean Square Error (MSE) test are carried out to find out how big the error value is in the Forecasting stage, based on the results of Forecasting data on temperature, air humidity, and light intensityin each waterfall, the MSE value of each waterfall can be seen as follows:
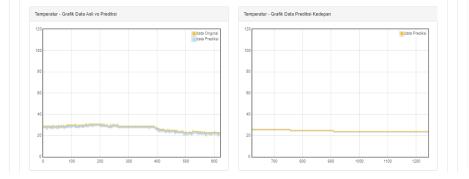
Table 7: Weighting of Curug Cikuluwung
No Data Mean Square Error (MSE)
1. Temperature 0.07
2. Humidity 0.59
3. Light Intensity 1.71
Table 8: Weighting of Curug Cigamea.
No. Data Mean Square Error (MSE)
1. Temperature 0.06
2. Humidity 0.59
3. Light Intensity 21.13
Table 9: Weighting of Curug Seribu.
No. Data Mean Square Error (MSE)
1. Temperature 0.06
2. Humidity 0.59
3. Light Intensity 13.30
The testing process of calculating the Error or error value is used to find out the error value from the calculation of the prediction carried out, based on the error value in each predicted data including temperature, air humidity, and light intensity, then the RESULTS of MSE errors from each tourist attraction are obtained, and weighting to find out which waterfall tourist attractions can be used as recommendations for tourists to visit based on weather conditions.
1. N. N. A. Wiratini M, N. D. Setiawan, and N. N. Yuliarmi, "Analysis of Factors Influencing Tourist Re-Visit Intentions in Badung Regency," E-Jurnal Ekon. and Business Univ. Udayana, vol. 1, p. 279, 2018, doi: 10.24843/eeb.2018.v07.i01.p10.
2. D. Mayasari and S. Rahardjo, "The Role of the Economic Aspects of Bogor City Tourism on Regional Original Income," Natl. Conf. Creat. Ind. , September no. 5–6, 2018, doi: 10.30813/ncci.v0i0.1196.
3. A. P. Desvina and D. Anggraini, "Rainfall Forecasting in West Bangkinang District, Kampar Regency Using the Box-Jenkins Method," vol. 3, no. 1, pp. 53–63, 2017.
4. L. J. Sinay, T. Pentury, and D. Anakotta, “Rainfall Forecasting in Ambon City using Metode holt-winters exponential smoothing rainfall forecasting in ambon city using holt- winter exponential smoothing method,” vol. 11, pp. 101–108, 2017.
5. M. Y. Darsyah, "Seasonal Data Pattern Forecasting With Winter's Model & ARIMA Seasonal Data Pattern Forecasting With Winter's & ARIMA Model," no. April 2015, 2016.
6. M. Metode and S. Arima, "Forecasting Foreign Tourists to Riau Province Through Pekanbaru City Forecasting Foreign Tourists to Riau Province Through Pekanbaru City Using the ARIMA Seasonal Method," november, 2017.
7. U. Andi and D. Kota, "Estimated Surge in the Number of Tourist Visits in North Toraja Regency in 2021 with the Application of the ARIMA Method Forecasting of Total Tourism Visit in North Toraja Regency in 2021 with Applied of ARIMA Method," vol. VII, no. 2, pp. 153–162, 2021.
8. T. Safitri, N. Dwidayati, T. Safitri, N. Dwidayati. “Forecasting Using Exponential Smoothing Holt-Winters And Arima Method Info Article How to Cite," vol. 6, no. 1, pp. 48–58, 2017.
9. N. Ulinnuha and Y. Farida, "Surabaya City Weather Prediction Using Autoregressive Integrated Moving Average (Arima) BoxJenkins and Kalman Filter," J. Mat. "MANTIK," vol. 4, no. 1, pp. 59–67, 2018, doi: 10.15642/mantik.2018.4.1.59-67.
10. R. Fried, “International Encyclopedia of Statistical Science,” Int. Encycl. Stat. Sci., no. June, 2011, doi: 10.1007/978-3-642-04898-2.
11. M. Costa, A. M. Gonçalves, and J. Silva, “Forecasting time series combining Holt-Winters and bootstrap approaches,” AIP Conf. Proc., vol. 1648, no. May, pp. 1–6, 2015, doi: 10.1063/1.4912411.
12. H. Bajric, E. Kadric, M. Pasic, and I. Bijelonja, “A comparison of two parameter same slope seasonality and holt-winters exponential smoothing models,” Ann. DAAAM Proc. Int. DAAAM Symp., no. January 2018, pp. 101–108, 2017, doi: 10.2507/28th.daaam.proceedings.013.
13. [13] D. T. Wiyanti and R. Pulungan, "Time Series Forecasting Using Radial Base Function Models (Rbf) And Auto Regressive Integrated Moving Average (Arima)," J. MIPA Unnes,vol.35, no. 2, p. 114402, 2012.
14. C. Premila and R. Ponnusamy, “Evaluating and Forecasting Room Demand in Tourist Spot using Holt-Winters Method,” Int. J. Comput. Appl., vol. 172, no. 2, pp. 22–25, 2017, doi: 10.5120/ijca2017915072.
15. Y. E. Özger, M. Akpınar, Z. Musayev, and M. Yaz, “Electrical Load Forecasting Using Genetic Algorithm Based Holt-Winters Exponential Smoothing Method,” Sak. Univ. J. Comput. Inf. Sci., no. August, pp. 108–123, 2019, doi: 10.35377/saucis.02.02.600620.