1 minute read
Why this Catchment?
Overview
Why this Catchment?
The micro-catchment was selected in the GIS modelling step because it contains a large number of properties in Ashburton that are
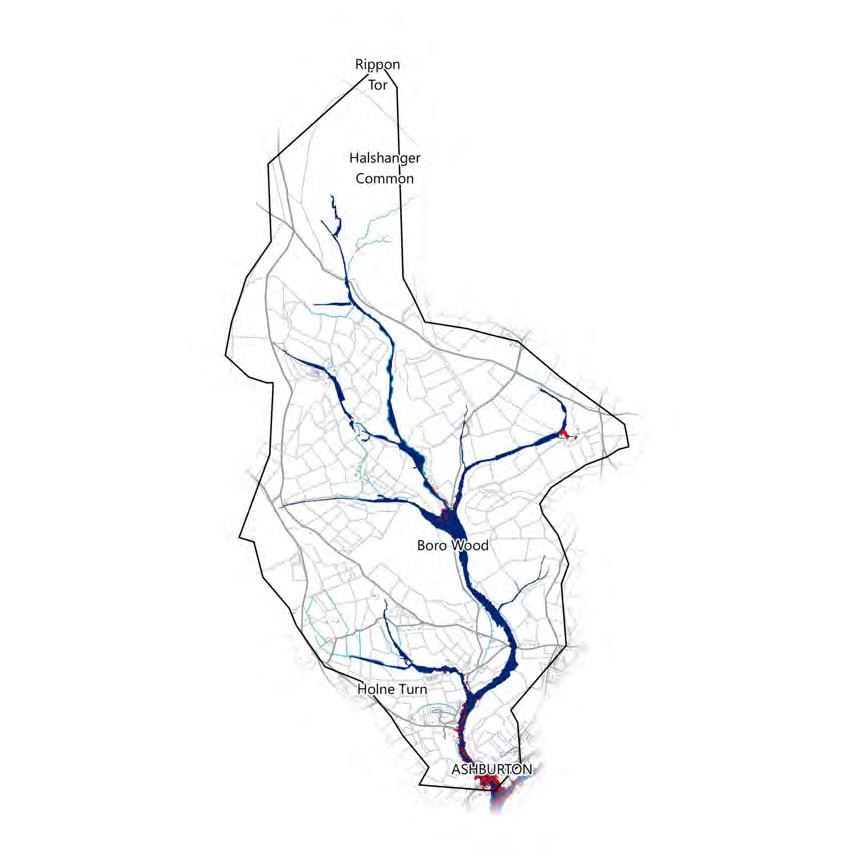
potentially at flood risk. The map below shows which buildings overlap with the EA’s modelled “Flood Zone 2” area, specifically areas at risk of flooding from rivers, as identified during the micro-catchment mapping process.
There are 91 buildings potentially at risk out of 448 in the catchment, approximately 20.31% of them. The catchment’s size of 9.2km2 gives an area of 0.10km2 per building at risk.
The water framework directive (WFD) status in the wider River Ashburn catchment is Failing If property owners are willing to work with landowners and vice versa, then small-scale NFM measures upstream in the catchment have the potential to benefit a large number of properties and improve water quality.

Micro-catchment Overview
Topography
The micro-catchment covers the southwestern urban area of the town of Ashburton as well as several farms and some open moorland. The micro-catchment forms the watershed for the river Ashburn that flows south southeast through Ashburton where it is joined by its tributary, the Balland Stream. The total river length present in the catchment is approximately 19.7km. Overall, the micro-catchment falls within the Ashburton County Parish and is administered by Ashburton Town Council.
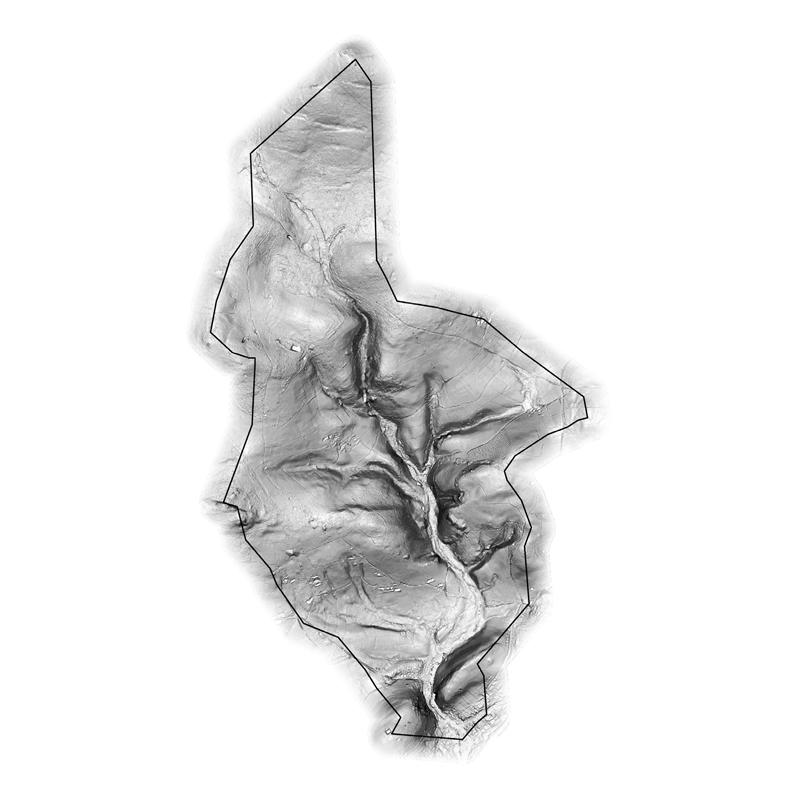
The map on the right shows the steepness of slopes. The river Ashburn lies at the bottom of a steep-sided valley that begins on the edge of the moorland and runs all the way to Ashburton. The valley sides become significantly flatter just before reaching the urban area. There is a gap in between the hills on the edge of Ashburton where the valley and the river Ashburn pass through at the catchment outlet.


