18 minute read
FACING CLIMATE CHANGE IN THE WHITE MOUNTAINS
FACING CLIMATE CHANGE
IN THE WHITE MOUNTAINS
By Brian Fitzgerald and Eric Kelsey, Mount Washington Observatory
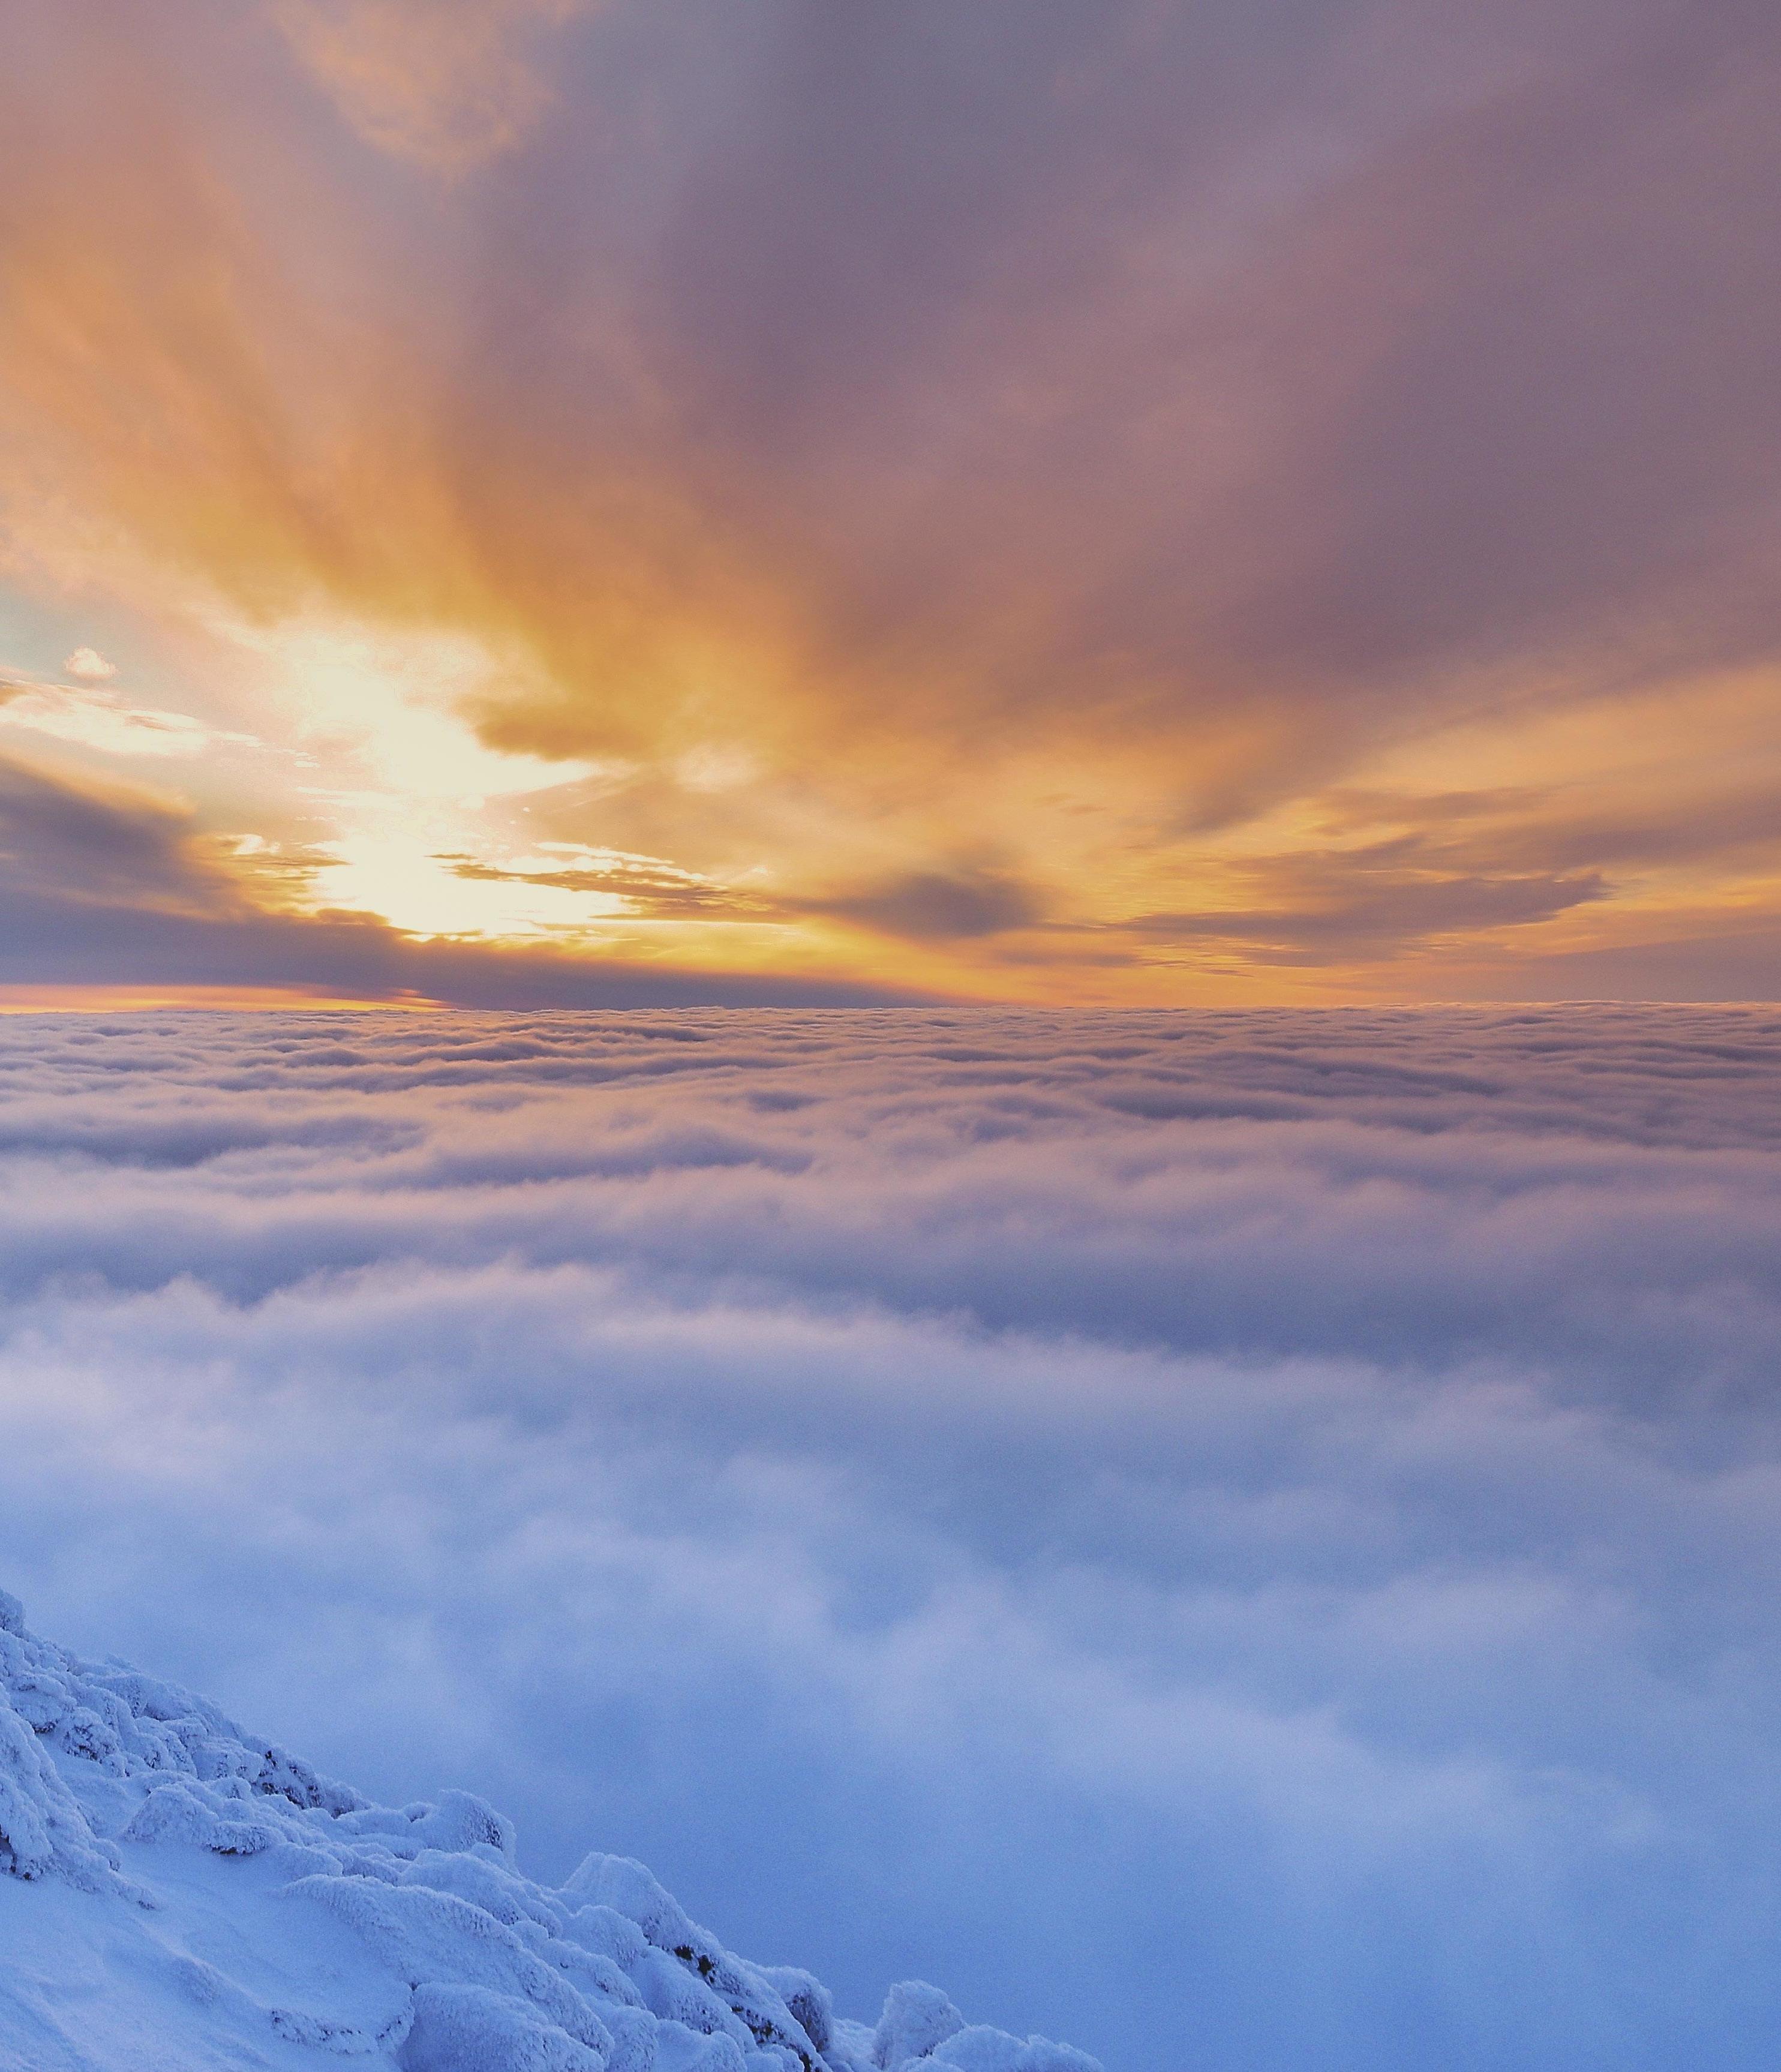

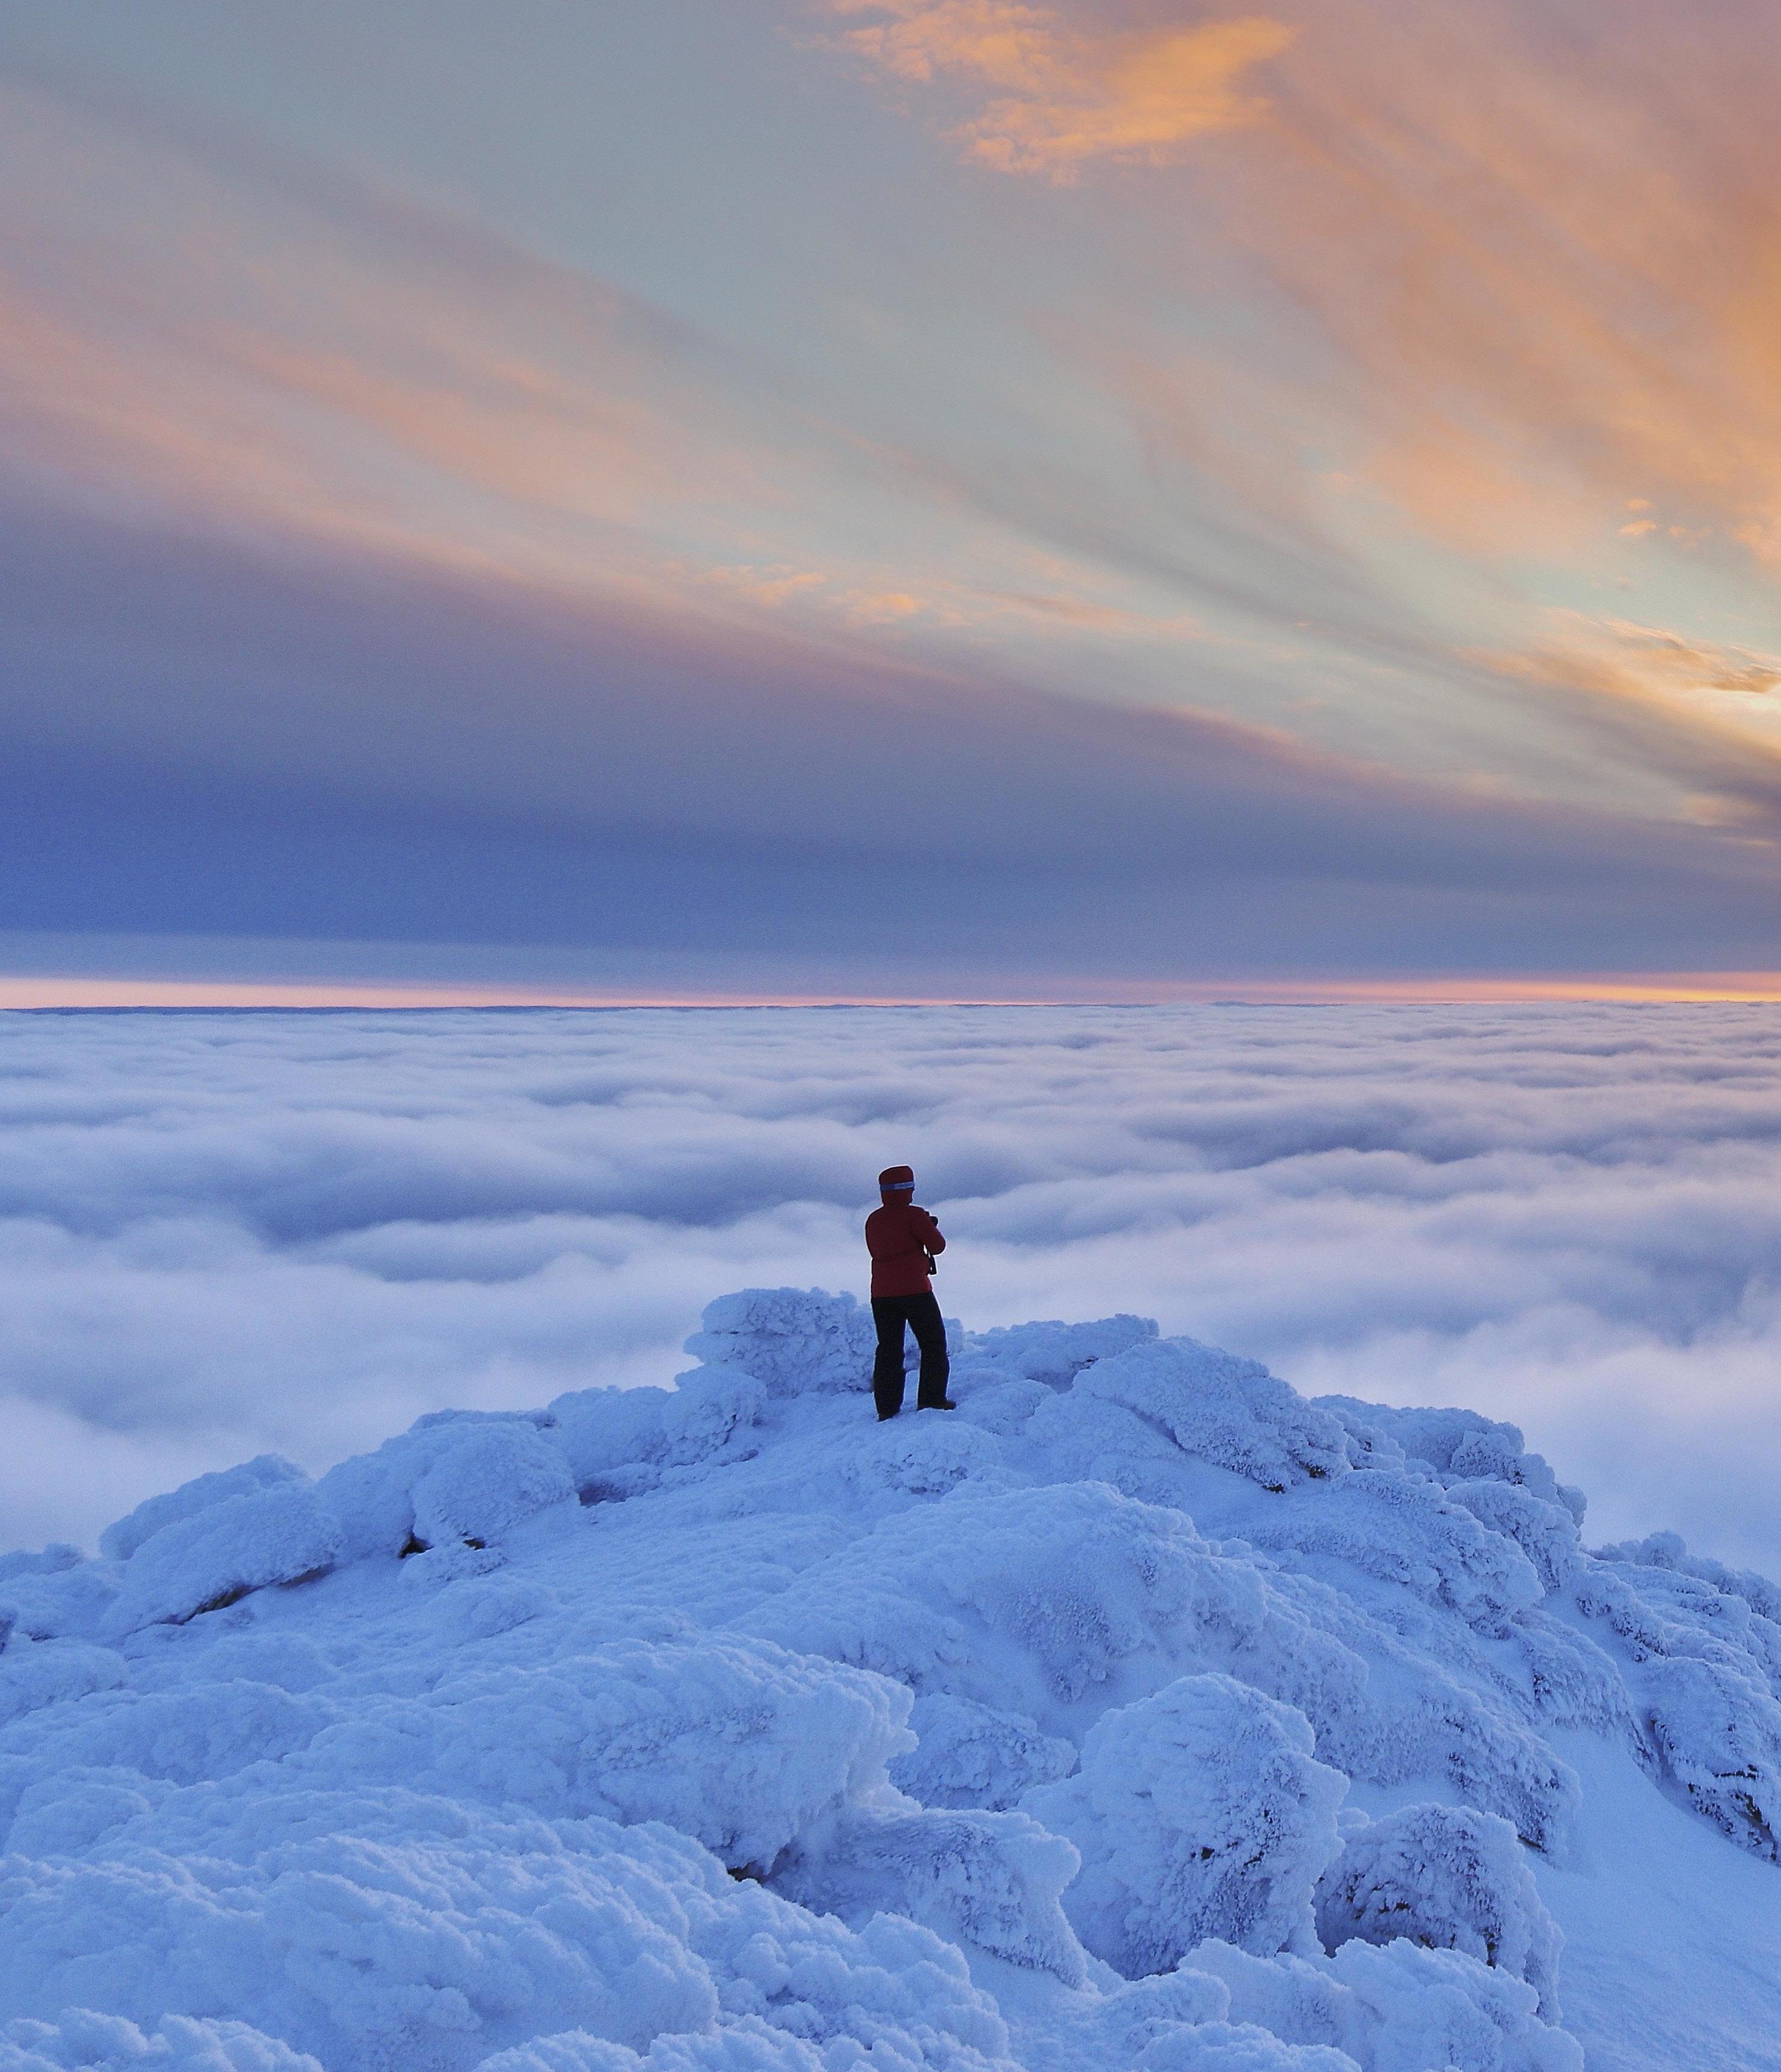
HOW THE MOUNT WASHINGTON OBSERVATORY AIMS TO ADVANCE OUR UNDERSTANDING OF THE IMPACT OF CLIMATE CHANGE IN THE WHITE MOUNTAIN REGION
On a seasonably mild mid-February day, Zach extends his arms over the undisturbed snowpack, holding the top of a 2-inch diameter, 4-foot aluminum tube. He allows gravity to help him ensure he is holding the tube vertically. With a steady push, he plunges the tube down through the snowpack. His arms and tube abruptly stop. Somewhat reluctantly, he slowly lifts the tube vertically out of the new hole but sees nothing but a conglomerate of rounded 1-2 mm diameter snow grains. With another plunge of the tube about a foot away from the first hole, Zach repeats his motions. This time he finds several brown fir needles stuck to the bottom of the snow core. Satisfied that he captured a full core of the snowpack, a quick calculation shows that this snowpack contains 10 inches of water.
At some point within the next two months, most of this snow will melt, percolate into the ground, and displace a near-equal amount of ground water into nearby streams and rivers. If the snow melts quickly and/or is combined with falling rain, flooding may result downstream, posing a serious risk to people and infrastructure. These types of flooding events have become more frequent in recent years across northern New England in response to human-caused climate change and are likely to be a major problem for decades to come.
Zach Butler and Stephen Baron are graduate students at Plymouth State University (PSU) in the M.S. in applied meteorology program. Zach was also a Mount Washington Observatory (MWO) intern during the summer and fall of 2018. They are a part of the Snowpack Sensing Project team, including PSU graduate students Sophia Adams, Ben Bleiman, and Francis Tarasiewicz, a research project led by Dr. Eric Kelsey, MWO lead research scientist and research associate professor of meteorol
Earth’s climate is changing. We know through investigations of ice cores that the Earth’s climate has always changed; however, recent and unprecedented amounts of greenhouse gases emitted from human activities have caused a rapid warming of our planet. Evidence for this recent, rapid change is found across a variety of places globally, including but not limited to: rising air and ocean temperatures, shrinking ice sheets and glaciers, sea level rise, reduced snow cover throughout the
ogy at PSU. The long-term goal of the project aims to measure how much water is locked up in the snowpack in the White Mountains to improve flooding predictions by hydrologic models. It is one of two significant research projects run by MWO that aims to advance our understanding of how climate change is impacting the White Mountain Region.
northern hemisphere, ocean acidification, declining sea ice and an increase in the frequency and severity of certain extreme weather events.
Across the United States, impacts from sea level rise in places like Boston and Miami are being felt, while heatwaves, flooding, and—conversely—drought in some regions have
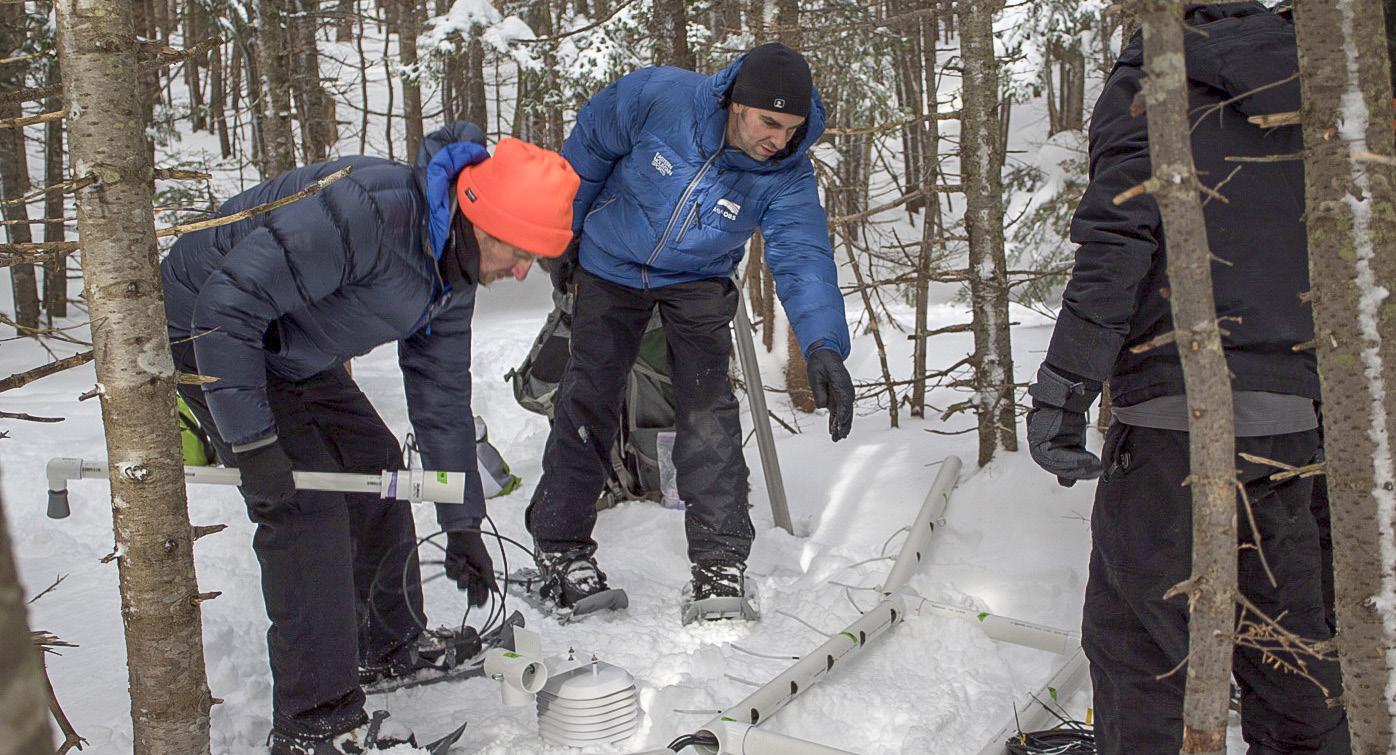
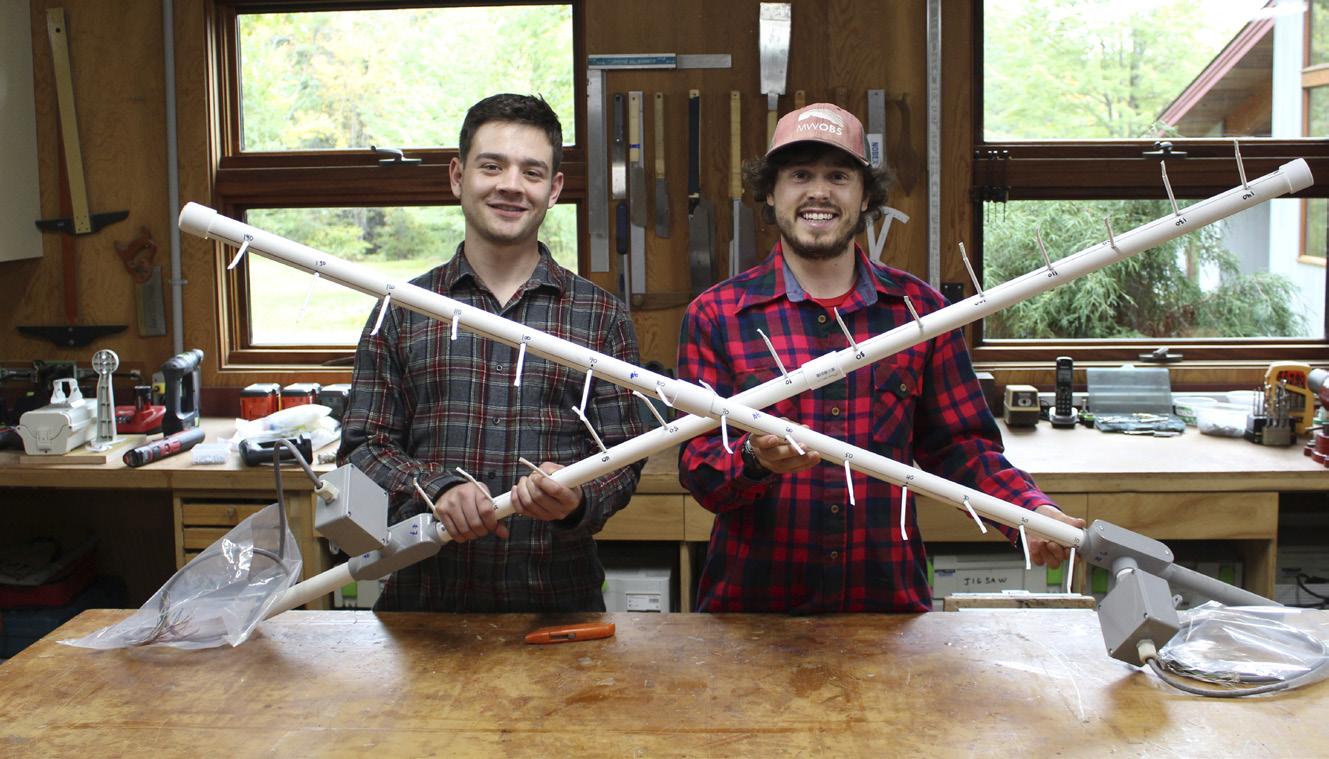
ABOVE LEFT: Graduating students from Plymouth State University, Benjamin Bleiman (left) and former MWO intern, Zach Butler (right), are a part of the Snowpack Sensing Project team, also including PSU graduate students Sophia Adams, Ben Bleiman, Stephen Baron, and Francis Tarasiewicz (not shown). RIGHT: Dr. Eric Kelsey (black hat), MWO lead research scientist and research associate professor of meteorology at PSU, and hydrologist/technician Dan Evans, also of PSU (orange hat), work with the snowpack team to assemble a snowpack sensing station near Hermit Lake.
grown more problematic. For coastal communities and islands in the tropics, stronger hurricanes in recent years have had historic and devastating effects. When we zoom in even further to examine the impacts from climate change across New Hampshire and in particular, the White Mountains, there are many flavors of local change.
Atop the summit of Mount Washington at 6,288 feet sits the non-profit Mount Washington Observatory’s weather station, which began weather observation in 1932. With data records creeping toward a century of collection, the summit of the Northeast’s tallest peak is warming significantly over time; however, more slowly than most locations throughout the region. Additionally, warming is not consistent across the seasons, with winter warming the fastest on the Rockpile. With significant snowpacks that get built up across the White Mountains, an increase in the number and severity of rain-on-snow events leads to more frequent and severe flooding.
One effort at Mount Washington Observatory that is attempting to quantify, and even predict, these flooding events is the Snowpack Sensing Project. This project, being led by Dr. Eric Kelsey, is aiming to measure how much water is locked up in the snowpack in the White Mountains to improve flooding predictions by hydrologic models. It is one of two significant research projects run by MWO that aims to advance our understanding of how climate change is impacting the White Mountain Region.
The means to achieving the long-term goal of this snowpack research project is by developing a network of low-cost snowpack sensing platforms to increase the spatial coverage of snowpack observations. The key variables that need to be measured are snowpack temperature, snow depth, and snow water equivalent (SWE)—the amount of water locked up in the snowpack.
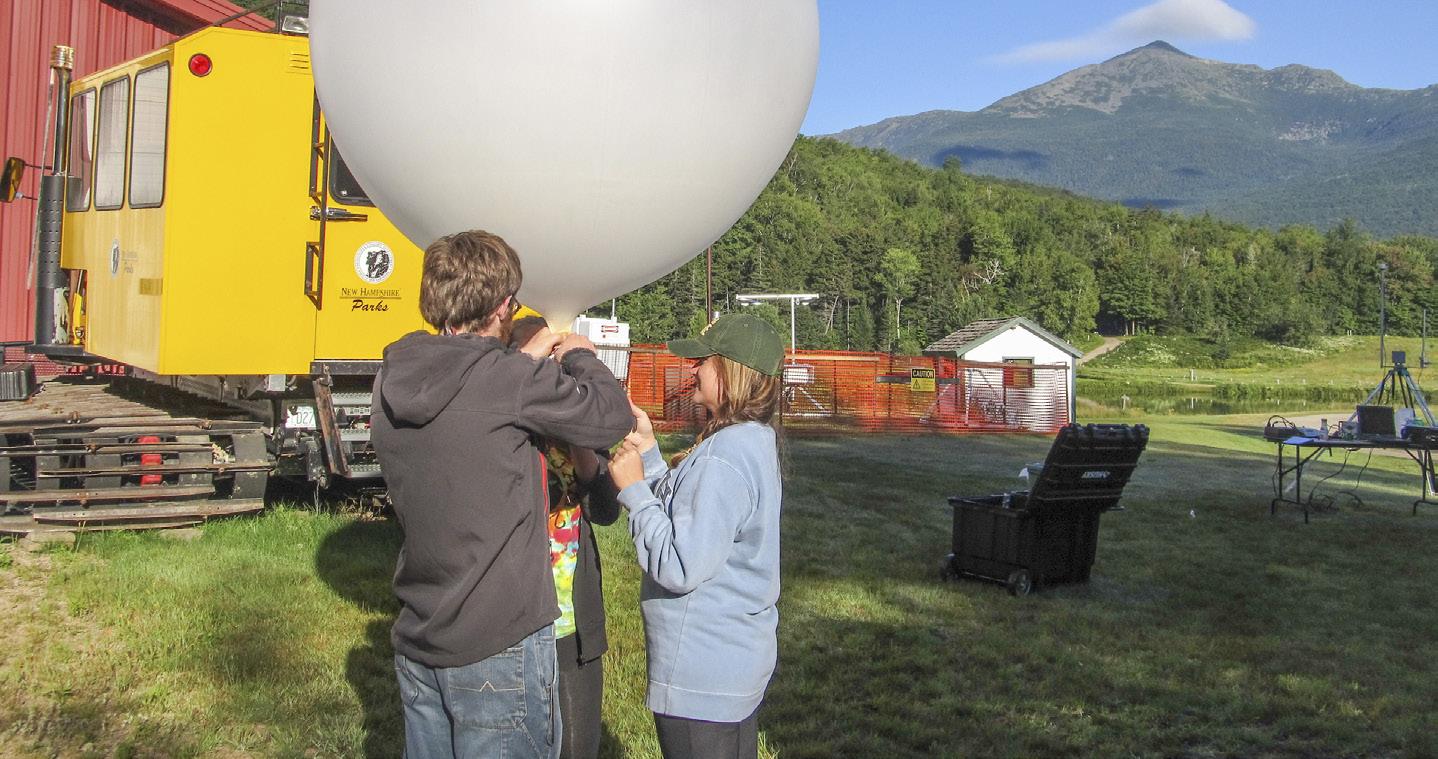
The goals of the first winter of the project, 2018-19, were to demonstrate that a low-cost open-source datalogger, called a Mayfly by EnviroDIY, could perform the same functions as a commercial datalogger that costs 15 times more and endure a full winter on Mount Washington. Snowpack sensing stations were built to measure a profile of snowpack, ground temperature, and snow depth, and were powered by a small lithium battery and 2W solar panel. Understanding snowpack temperature gives a measure of how close the snowpack is to melting.
Stations were deployed along the Tuckerman Ravine and Sherburne Trails on Mount Washington, and students, along with Dr. Kelsey, made regular trips to maintain the stations and take SWE measurements before and after significant precipitation events. This data was sent regularly to the National Weather Service to put into their snow and hydrologic models. The stations performed to satisfaction and logged data throughout the winter and spring with few interruptions.
During the second winter, 2019-20, two improved sensor platforms were installed on Mount Washington near Hermit Lake and at Hubbard Brook Experimental Forest (HBEF) in Thornton, New Hampshire. The station at HBEF is co-located with an identical station that is being run on a commercial data

LEFT: The goals of the first winter of the project, 2018-19, were to demonstrate that a low-cost open-source datalogger, called a Mayfly by EnviroDIY, could perform the same functions as a commercial datalogger that costs 15 times more and endure a full winter on Mount Washington. Snowpack sensing stations were built to measure a profile of snowpack, ground temperature, and snow depth, and were powered by a small lithium battery and 2W solar panel. RIGHT: In August and September 2016, MWO, Plymouth State University, and collaborators from the Appalachian Mountain Club and Dartmouth College tested a novel methodology to determine summit air mass type and the processes driving boundary layer height changes on and around Mount Washington.
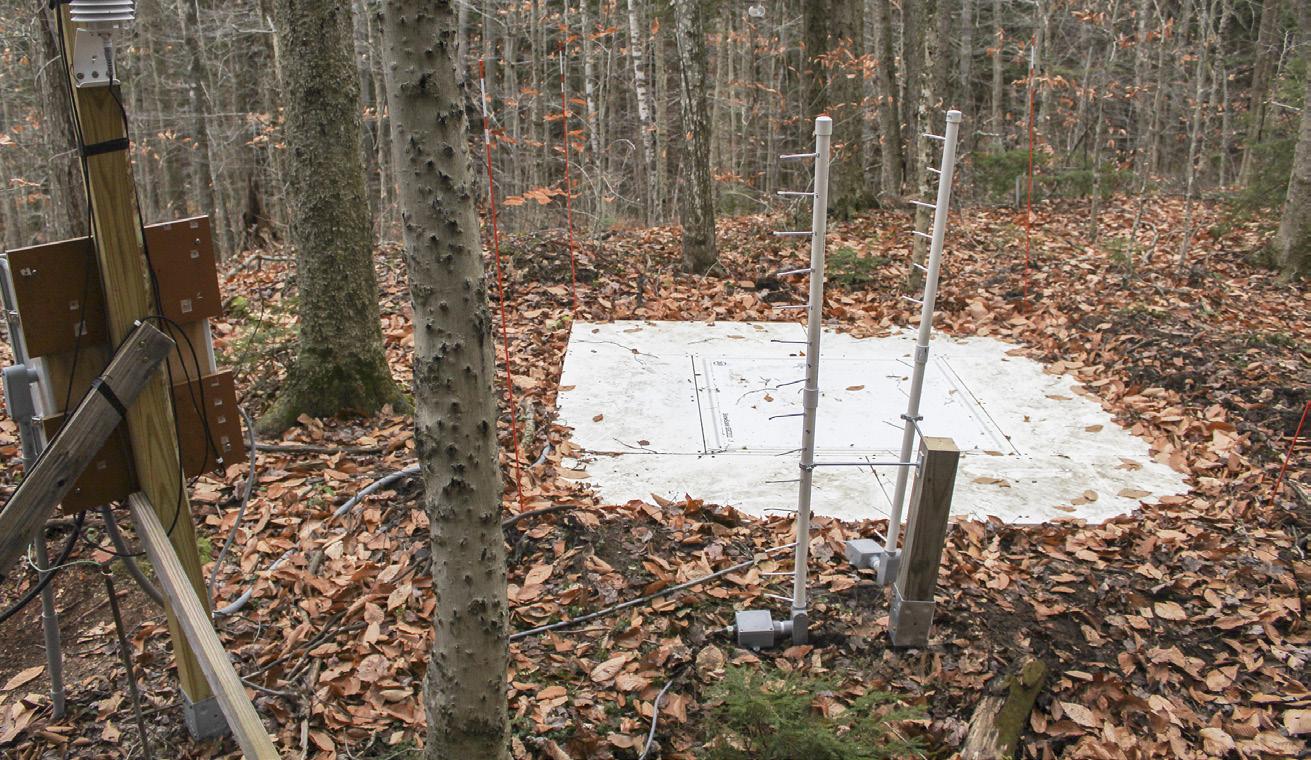
logger. The two temperature profiles will be compared to validate that the Mayfly can log research-grade temperatures comparable to the industry standard.
The snowpack station near Hermit Lake is being used to test radios to transmit the data. This station has a LoRa radio that transmits the snowpack temperature data to MWO servers for display on the internet. The LoRa radio is low-power (great for battery-solar powered stations) and long range (over 5 miles). Hourly data transmissions are occurring with few problems. The real-time data can be viewed on the MWO Research webpage.
The automated stations measure temperature and snow depth with relative ease, but measuring SWE accurately is challenging, to say the least. Automated instruments are expensive and can have large errors in certain conditions. Measurements by aircraft are expensive, can be inaccurate in rugged and forested terrain, and the spatial coverage is limited. The scientific standard for accuracy is still manual measurements, which involves extracting a core of snow, from surface to the ground, with a metal tube. Weighing the snow core and knowing the diameter of the tube, one can calculate the SWE. The method is simple, relatively quick, and can be repeated several times in a location to find an average SWE for that area. The biggest downside is that it is labor intensive if one wants to measure SWE across a large, rugged area, such as the White Mountains. However, if a set of spatially dense observations can provide a detailed picture of how SWE varies across a rugged landscape, one can use that spatial variability to interpolate between a relatively few number of carefully selected SWE measurements taken periodically throughout the winter. Per
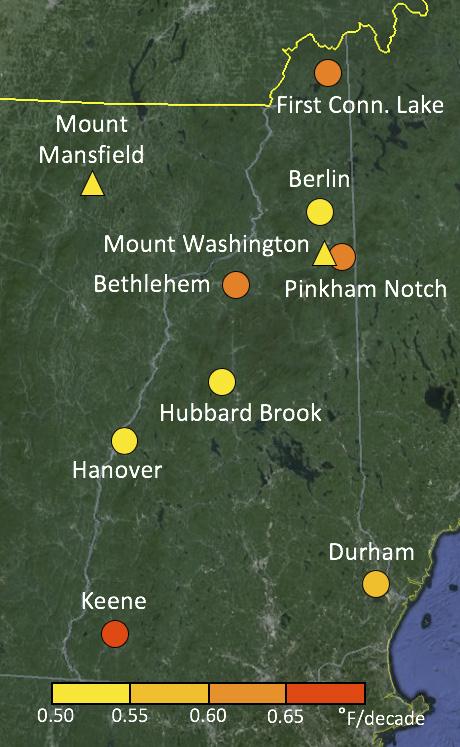
ELEVATION-DEPENDENT WARMING TRENDS PER DECADE FOR 1970-2012 IN DEGREES FAHRENHEIT
Mount Washington* +0.52 Mount Mansfield** +0.50 Pinkham Notch* +0.61 Berlin +0.50 Bethlehem +0.63 First Connecticut Lake +0.61 Hanover +0.50 Hubbard Brook +0.52 Durham +0.56 Keene +0.72 Trends are for *1970-2018, **1970-2016
forming this work is another long-term goal of this research.
In additional to more frequent snowmelt flooding, warming temperatures throughout the White Mountains also pose many unknown risks to the fragile alpine zone and other lower-elevation ecosystems. The rate of warming will be a critical determinant of the changes that occur in the mountains. In the Northeast, the rate of warming varies with elevation: since 1970, the high elevations of Mount Washington and Mount Mansfield (Vermont) have warmed at about half as fast as the surrounding lower elevations (~0.3 vs. ~0.6 degrees C per decade, respectively). What makes this observation intriguing is that most other mountain ranges around the world are experiencing faster warming rates at higher elevations than nearby lower elevations. Furthermore, nearly all climate model projections indicate higher elevations will warm faster during the 21st century. Why is the Northeast bucking recent global trends and climate models?
The answer may lie in the variable air masses the higher elevations experience that the lower elevations do not. As early as 1941, MWO scientist Victor Conrad recognized that for part of the year, the summit of Mount Washington experiences an air mass different from the air mass lowest to the ground. This lowest air mass that is always in contact with the ground at lower elevations is called the boundary layer. In 2005, MWO scientist Andrea Grant and her collaborators estimated that the summit is above the boundary layer, in an air mass called the free troposphere, roughly 50 percent
of the year. The boundary layer and the free troposphere are two distinct air masses, often with large differences in temperature, moisture, and clouds. (If you have ever had the pleasure of hiking above treeline and noticed cloud tops below you, then you hiked into the free troposphere.) It makes sense, then, that if the summit of Mount Washington spends roughly half of the year in an air mass different from the low elevations, this could cause a different warming rate—often referred to as “elevationdependent warming.”
A team of researchers, including Dr. Adriana Bailey (researcher with the National Center for Atmospheric Research), Georgia Murray (senior researcher at the Appalachian Mountain Club), and Kelsey are the first to propose this idea and aim to put it to the test. A key first step is to develop a robust method to diagnose the type of air mass at the summit at any given time. From other research, it is evident that no single meteorological variable measured on a mountain will always tell you the set out to capture the changes in boundary layer depth from prior-to-sunrise to just-after-sunset using several weather variables. During two days in August and September, they measured vertical profiles of water vapor at intervals along the Auto Road from the base to the summit by driving a water vapor analyzer up and down the mountain in a pick-up truck. Kelsey, Bailey, and Murray performed these measurements about eight times on each of the two days. These along-slope measurements supplemented the continuous measurements of temperature, humidity, and wind at the summit and at six MWO weather stations along the Mount Washington Auto Road. Meanwhile, PSU meteorology students launched weather balloons from the base of the Auto Road to obtain temperature, humidity, and wind profiles over the valley away from the direct influence of the mountain slopes.
air mass type. However, several variables are good indicators some of the time, and combining these variables may help piece together a more complete timeline of summit air mass type.
In 2016, the research team tested the idea that several weather variables must be measured to state definitively what air mass is at the summit most of the time. In 2016, the team
This approach to determine boundary layer height worked—the team was able to use the along-slope data to
determine, with confidence, when the boundary layer was at the summit. The most interesting result, however, occurred on August 19 when comparing the along-slope weather data to the free air data collected by the weather balloons. The height of the boundary layer over the valley was 400 feet lower than its height along Mount Washington during the morning. Why? Lo
Celebrating 26 Years!
Maple Syrup Penny Candy Snacks & Munchies Beverages Apparel Home & Kitchen Soaps, Scrubs & Lotions Toys & Games Maple Candy Specialty Foods Gift Baskets

With over 87 years of data collected on the summit of Mount Washington, there is a seemingly never-ending opportunity to ask questions and seek answers about the physical and natural environment. Along with those research opportunities is the chance to educate the public about Earth’s weather and climate.
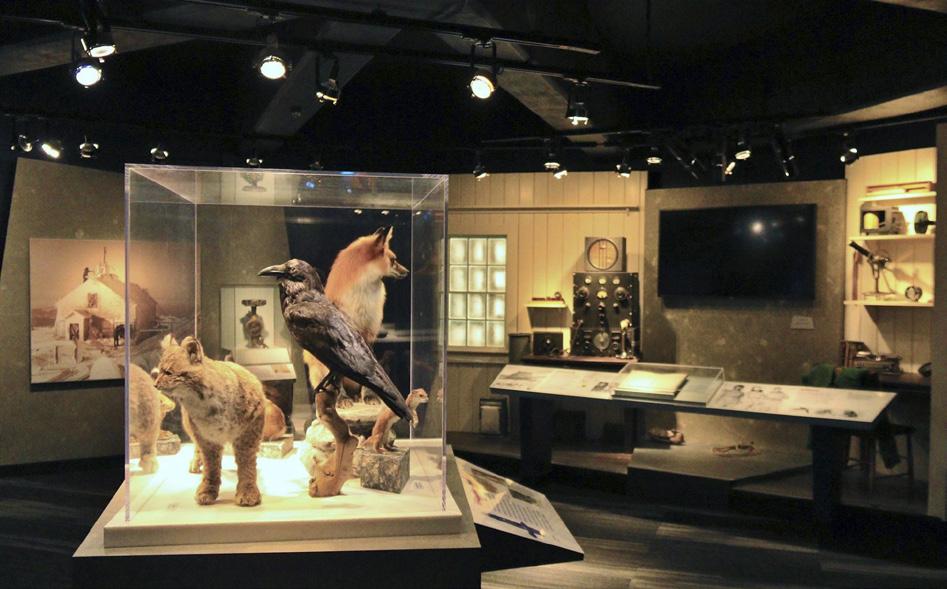
It’s likely that many people have never visited a weather station before, let alone taken an official weather observation or compiled climate statistics; however, at MWO, it’s possible for people to either physically visit the summit weather station or learn about the basics of its operation through a variety of educational formats. For those fortunate enough to visit the summit of Mount Washington, MWO offers the Extreme Mount Washington museum during the summer months (free admission is included in a round-trip ticket for those traveling on the Mt. Washington Auto Road or Cog Railway), and tours of the weather station itself for members of the nonprofit MWO. In summer and winter, themed-overnight and day edu-programs allow visitors to stay at the weather station and learn about climate recording in a more intimate way.
Off the mountain, there are still more ways to connect with the summit’s weather and climate, including at the Weather Discovery Center in North Conway Village, traveling educator programs, distance learning videoconference programs live from the summit weather station, lecture series, and workshops. Last but not least, MWO is partnering with educators at the University of Maine, the University of Washington, Concord Consortium, and the Education Development Center to create rural middle-school-focused curriculum for students using extreme weather data collected from MWO and from the National Centers for Environmental Information (NCEI).
Spring update: While the Observatory enjoys sharing its weather and climate mission with visitors, the Discovery Center and some in-person offerings may be temporarily unavailable. You can keep in touch with what is happening at the Observatory on its website and participate in free virtual classroom lessons at www.facebook.com/MWObs and online at www.mountwashington.org/classroom.
cal effects caused by the mountain explain this difference. The wind at the summit was 30 to 40 miles per hour from the west in the morning, which means that the wind was likely pushed upslope from a lower elevation to the summit. Indeed, the morning weather balloon temperature and humidity profiles tion layer between the boundary layer and the free troposphere, called the entrainment zone, was able to descend upon the summit. Because the lower free troposphere is associated with warmer and drier air, the summit temperature warmed a couple of degrees and the humidity varied wildly between high humidi
confirm that the air at the summit originated from about 400 feet below the summit and that the air was from the boundary layer. The presence of a cloud covering the summit was also an indicator of upslope flow. In contrast, the weather balloon profiles indicated that warmer and drier free troposphere air was present at the summit elevation over the valley.
Between 11 a.m. and 1 p.m., the summit wind decreased to only 5 to 15 miles per hour and was not strong enough to push boundary layer air to the summit. As a consequence, the transi
ty (boundary layer air) and very low humidity (free troposphere air). The period of time in the entrainment zone might have continued if it were not for the strong August sunshine warming and expanding the boundary layer upward past the summit elevation by about 400 feet between 1 and 5 p.m. The observations suggest that for this entire period (11 a.m. to 5 p.m.), the boundary layer height on the mountain and over the valleys was about the same because of the light winds.
This event and other cases support high elevation exposure to different air masses as a possible cause for the summit to be witnessing a slower warming trend than the surrounding low elevations that are always in the boundary layer. If true, the implications are varied and important:
• First, all mountains of a certain prominence above surrounding valleys may spend a significant amount of time above the boundary layer, and therefore have a different temperature trend than surrounding lower elevations.
• Second, the height of the boundary layer as measured by the twice-daily weather balloon launches at nearly 100 National Weather Service (NWS) offices cannot be used to infer the boundary layer height in nearby mountain ranges under many atmospheric patterns. Instead, mountains must be outfitted with a vertical profile of weather stations in order to determine definitively the height of the boundary layer on the mountain slopes.
• Third, since most poor air quality days in the White Mountains occur when the mountain slopes are in the free troposphere, future changes in the frequency of free troposphere exposure have important health consequences for humans and sensitive alpine ecosystems.
• Lastly, if the amount of time the summit spends in the boundary layer changes in the future, the summit could see its slow warming trend change—most likely to a faster warming rate. This could have huge ramifications for the White Mountain region winter recreation industry, local mountain economies, and the mountain ecosystems that, up until this point, have benefitted from slower high-elevation warming.
It’s vital to continue this research—and other like it—so we can document baselines for data allowing us to anticipate, indicate, and predict notable events, especially those that can impact our lives on many levels.
As Mount Washington Observatory looks ahead toward 100 years of observation, the motivation to learn more about the Earth’s weather and climate will continue to grow stronger and stronger. Given the complexities of weather and climate systems, high-quality data from the summit of Mount Washington and nearby remote stations will add to our collective understanding of how a shifting climate in the broad sense may impact our region in a locally informed way. In the shortterm, of course, we’ll continue to marvel at the extremes of Mount Washington, and the raw power of Mother Nature.
The hands-on research experience of the snowpack project is educating and inspiring college students like Zach and Stephen to pursue research and forecasting careers. By taking snowpack measurements themselves, they gain an intimate understanding of the importance of high-quality data in understanding local climate changes. They are learning the numerous environmental factors and extraction methods that can influence the weight of the snow cores that they extract, such as canopy interception of snow, snow drifting, slope, and how they push the aluminum tube through the snowpack. They know that their measurements can have a significant impact on what happens downstream.

Serving our Valley for 20 Years
Business & Home Technology IT Systems & Tech Support Smarthome Integration

VOICE, DATA, & VIDEO COMMUNICATIONS
VoIP Phone Systems featuring Voicemail to Email • Smartphone & Computer Apps • Mobile Office
NORTHLEDGE TECHNOLOGIES INC. (603) 383-4030 • www.northledge.com


