Making the European Green Deal Work for People
The Role of Human Development in the Green Transition

Javier Sanchez-Reaza
Diego Ambasz
Predrag Djukic
Public Disclosure Authorized Public Disclosure Authorized Public Disclosure Authorized Public Disclosure Authorized
Making the European Green Deal Work for People
The Role of Human Development in the Green Transition
Javier Sanchez-Reaza
Diego Ambasz
Predrag Djukic
© 2023 International Bank for Reconstruction and Development/The World Bank. 1818 H Street NW, Washington, DC 20433, USA. Telephone: 202–473–1000; Internet: www.worldbank.org.
Some rights reserved
This work is a product of the staff of The World Bank with external contributions. The findings, interpretations, and conclusions expressed in this work do not necessarily reflect the views of The World Bank, its Board of Executive Directors, or the governments they represent.
The World Bank does not guarantee the accuracy of the data included in this work. The boundaries, colors, denominations, and other information shown on any map in this work do not imply any judgment on the part of The World Bank concerning the legal status of any territory or the endorsement or acceptance of such boundaries.
Rights and Permissions
This work is available under the Creative Commons Attribution 3.0 IGO license (CC BY 3.0 IGO) http://creativecommons.org/licenses/by/3.0/igo. Under the Creative Commons Attribution license, you are free to copy, distribute, transmit, and adapt this work, including for commercial purposes, under the following conditions:
Attribution—Please cite the work as follows: Sanchez-Reaza, Javier, Diego Ambasz, and Predrag Djukic. 2023. “Making the European Green Deal Work for People: The Role of Human Development in the Green Transition.” Washington, DC: World Bank Group. License: CC BY 3.0 IGO.
Translations—If you create a translation of this work, please add the following disclaimer along with the attribution: This translation was not created by The World Bank and should not be considered an official World Bank translation. The World Bank shall not be liable for any content or error in this translation.
Adaptations—If you create an adaptation of this work, please add the following disclaimer along with the attribution: This is an adaptation of an original work by The World Bank. Views and opinions expressed in the adaptation are the sole responsibility of the author or authors of the adaptation and are not endorsed by The World Bank.
Third‑party content—The World Bank does not necessarily own each component of the content contained within the work. The World Bank therefore does not warrant that the use of any third-party-owned individual component or part contained in the work will not infringe on the rights of those third parties. The risk of claims resulting from such infringement rests solely with you. If you wish to re-use a component of the work, it is your responsibility to determine whether permission is needed for that re-use and to obtain permission from the copyright owner. Examples of components can include, but are not limited to, tables, figures, or images.
All queries on rights and licenses should be addressed to World Bank Publications, The World Bank Group, 1818 H Street NW, Washington, DC 20433, USA; fax: 202–522–2625; e-mail: pubrights@ worldbank.org.
Cover image: stock.adobe.com.
iv MAKING THE EUROPEAN GREEN DEAL WORK FOR PEOPLE
v Contents Preface ix Acknowledgments x Abbreviations xii Overview: A Human-Centered Green Transition .................................................................. 1 The European Green Deal 4 Net-zero emissions and decoupling economies from natural resource consumption 4 Financing the EGD 7 The EGD can avoid previous transitions’ increased income disparities............................... 7 HD policies to enable the transition: leaving no person or place behind 9 HD policies to mitigate the costs of the transition 9 Skills to prevent further regional disparities 9 Public employment services will play a crucial role 11 Social assistance and health services can mitigate some of the transition costs 12 HD policies to adapt individuals and households to a sustainable economy 13 Workers will need strong foundational skills to seize the opportunities created by the EGD .......... 13 Through research and innovation education can produce the technology needed to curb emissions 14 Education can create awareness and shift consumer demand for green products 15 The focus of the EGD should be the wellbeing of people 16 1. The European Green Deal .............................................................................................. 19 The EGD can avoid previous transitions’ increased income disparities 20 The EGD can avoid the increased income disparities of previous transitions 20 Two Questions, One Challenge 22 The European Green Deal 22 Enabling the Green Transition and Addressing the EGD’s Unintended Consequences 23 The Circular Economy 25 Asymmetric Impacts of the EGD ........................................................... 27 Exacerbated regional inequality 27 Skills and income inequality 28 2. Economic Dynamics and Potential Impacts .................................................................... 30 Economic Dynamics in the EGD 31 System Dynamics to Simulate the Changes in the HTGEM 35 Potential Impacts 36 Policy Consequences 43 3. Human Development Policies and the Green Transition ................................................ 46 The Enabling Role of HD Policies to Reduce GHG Emissions and Support a Circular Economy 47 Adapting to the Green Transition 52 Mitigating the Impact of the Green Transition ................................................ 56 Skills and training 56 A regional perspective will be important 64 Health 66 Social protection and jobs 67 Policy Coverage and Preparedness in Strategic Documents: EU and Case-Study Countries 70 4. Adapting to a Circular Economy..................................................................................... 72 Economic Growth, Material Consumption, and Productivity 73 Human Development and Pressure on Planetary Boundaries 78 The EU’s Transition to the Circular Economy .................................................. 80 The transition to the circular economy, essential elements, and benefits 80
vi MAKING THE EUROPEAN GREEN DEAL WORK FOR PEOPLE Risks related to the transition to the CE 84 Monitoring performance on the circular economy 85 HD Policies for Ensuring a Just Transition to the CE 89 5. Addressing the Unintended Consequences.................................................................... 92 Regional Impacts 93 The nexus between the EGD and territorial imbalances 93 The regional impacts of the EGD in the context of territorial polarization 94 Other factors determining regional winners and losers 99 The green transition and the geography of discontent ...................................... 101 The relevance of place-sensitive policies 102 Individual Impacts—Skills Transition Pathways 104 Skills mismatches between green and brown jobs 105 Returns to skills in green and brown jobs 108 Transition pathways 109 6. Enabling a Human-Centered Green Transition.............................................................. 116 Making it Effective: Policy preparedness 117 Making it Efficient: Financing the green and human transitions 118 Making it Sustainable: Addressing discontent ............................................. 119 Making it Attainable: Behavioral change 120 References ........................................................................................................................ 122 Endnotes 130 Annexes ............................................................................................................................ 133 Annex A. The Human Transitions General Equilibrium Model (HTGEM) 134 Annex B. The HTGEM in a System Dynamics Model (SDM) perspective 138 Annex C. Calibration Strategy for the SDM 144 Annex D. Scenarios in the SDM 146 Annex E. SDM Additional Results 148 Annex F. Methodology and Data Used in Defining Clusters in Principal Components Analysis 155 Annex G. Heat Maps Methodology and Results for Country Policy Analysis ........................ 168 Annex H. Green Jobs Methodology 170 Endnotes 172 Boxes 1 The EGD’s Three Objectives and Five Policy Levers 2 2.1 SDM Literature 35 3.1 The Compatibility of Infrastructure and Buildings with EGD goals 49 3.2 China’s Guizhou Aged Care System Develop Program Project 51 3.3 HD Infrastructure and the Green Transition in Croatia 51 3.4 Investments in Quality Education Can Enable Green Technological Innovation and Adaptation . 53 3.5 Educational Policy and Climate Change Opinions in Poland 53 3.6 Common Challenges in Improving the Efficiency of Transportation 57 3.7 Education and Training in Poland and the Slovak Republic 60 4.1 Pollution Challenges across EU Countries 74 4.2 Restoring Ecosystems and Biodiversity in the EU 83 4.3 The Circularity Index 88 5.1 The Distribution of Fossil Fuels versus Renewable Energy .............................. 97 5.2 Place-Sensitive Strategies: Combining Efficiency and Equity in the EGD’s Implementation 102 5.3 Regional Peer-Learning: Addressing EGD’s Trade-offs through Policy Learning 103 5.4 Identifying Transition Pathways 110
vii Contents Figures O.1 Human Development and Human Capital Indices Adjusted by Environmental Pressure 4 O.2 Nine Rs for the Circular Economy 5 O.3 Annual Change Rate of GDP and DMC in EU Member States, 2000–2020 (%) 6 O.4 Change in Income Inequality in EU, 1993–2019 (Gini Coefficient) 8 O.5 Density Plots Green vs. Brown Jobs 10 O.6 Green Job Transitions Example from Poland 11 O.7 Difference in Socioeconomic Status and Learning Outcomes in EU Member States, TVET versus non-TVET Students 14 1.1 Change in Manufacturing Employment and Chinese Import Competition in OECD Countries, 1999–2007 (%) 21 1.2 Change in Income Inequality in the EU, 1993–2019 (Gini Coefficient) 21 1.3 EGD’s Objectives, Actions, and Policies 23 1.4 Green Job Transition Example from Poland 29 2.1 SDM Approach to Modelling the Brown Economy .................................... 37 2.2 SDM Approach to Modelling the Green Economy 37 2.3 SDM Approach to Modelling the Natural Resource Consumption 38 2.4 SDM Approach to Modelling Skills and the Labor Market 38 2.5 Simulation Results for EU Brown Production under the EGD 39 2.6 Simulation Results for EU Green Production under the EGD 40 2.7 Simulation for Capital in the EU under the EGD 40 2.8 Simulated Capital-Labor Ratios in the EU under the EGD ............................... 41 2.9 Simulated Productivity in the EU under the EGD 41 2.10 Simulated Productivity at the Country Level under the EGD ............................. 42 2.11 Simulation for Skills’ Demand and Supply in the EU under the EGD 43 2.12 Skilled-Unskilled Workers’ Wage Differentials in the EU with the EGD 44 3.1 The Human Transitions Policy Framework: Enabling, Adapting, and Mitigating 47 3.2 Human Development Stakeholder Action Matrix 48 B3.1.1 Building and Renovation in an Energy and Resource Efficient Way 50 B3.6.1 Accelerating the Shift to Sustainable and Smart Mobility 57 3.3 Difference in Socioeconomic Status and Learning Outcomes in EU Member States, TVET versus non-TVET Students 63 3.4 Europe and Central Asian Countries’ Social Protection Spending 68 3.5 Social Protection’s Impact on Poverty (ECA Region) 68 4.1 Source of (a) Global GHG Emissions and (b) the Nine Planetary Boundaries 73 B4.1.1 A Net-Zero Pollution Ambition for a Toxic-Free Environment 75 4.2 Domestic Materials Consumption in the EU by Material, 2000 (internal ring) and 2020 (external ring), Thousand Tons .................................................... 76 4.3 DMC and Non-energy DMC Per Capita in the EU and Selected Member States, 2000–2020 77 4.4 Annual Change Rate of GDP and DMC in EU Member States, 2000–2020 (%)............... 77 4.5 Non-energy Materials Productivity (GDP/Non-energy DMC), 2000, 2010, 2020 78 4.6 Countries’ HDI Ranking, CO2 Emissions, and Material Footprint Per Capita 78 4.7 Human Development and Human Capital Indices Adjusted by Environmental Pressure 79 4.8 Social Shortfalls and Ecological Overshoot in Case-study Countries 80 4.9 The “Butterfly Diagram” for the Circular Economy (panel a) and the Nine Rs Framework (panel b) 81 B4.2.1 Preserving and Restoring Ecosystems and Biodiversity 83 4.10 Share of Manufacturing in Total GDP and Employment in the EU, 2018 .................... 85 4.11 Participation Rate in Education and Training, 2010 and 2020 86 4.12 Circular Economy in the EU, 2018 87 4.13 Recycling Rate of E-waste in the EU, 2018 87 4.14 The Calculation of the Circularity-adjusted Human Capital Index 88
MAKING THE EUROPEAN GREEN DEAL WORK FOR PEOPLE
viii
B4.3.1 Bi-plots of the Three Indices: Waste Management Index, Consumption and Production Index, and Secondary Raw Materials Index .......................................... 89 4.15 Comparison of EU Country HCI Indicators, Adjusted for Circular Economy Performance 90 5.1 Development Traps across EU Regions by GDP Per Head, 2001–2019 94 5.2 Cumulative Jobs at Risk by 2030 due to Phasing Out of Coal Energy Production 95 5.3 CO2 Emissions from Fossil Fuels Per Head, 2018 96 B5.1.1 Increasing the EU’s Climate Ambition for 2030 and 2050 97 5.4 Regional Innovation Scoreboard, 2021 100 5.5 European Quality of Government Index, 2021 ...................................... 101 5.6 Density Plots Green vs. Brown Jobs 105 5.7 Density Plots Green vs. Brown Jobs in EU 106 5.8 Skills Advantage—Green vs. Brown Jobs across the Distribution 107 5.9 Example of a Question Measuring Numeracy Skills Usage at Work 107 5.10 Example of a Question Measuring Numeracy Skills Usage at Work 108 5.11 Green Job Transitions for Renewable Energy Engineers 111 5.12 Green Job Transitions for Environmental Inspectors .................................. 112 5.13 Green Job Transitions for Environmental Engineers 113 5.14 Brown-to-Green Jobs Transitions for Geophysical Engineer–Mining Geophysics ............ 114 5.15 Brown-to-Green Jobs Transitions for Oil and Gas Processing Controller 115 A.E.1 Simulation Results for Croatian Brown Production under the EGD 148 A.E.2 Simulation Results for Croatian Green Production under the EGD 148 A.E.3 Simulation for Capital in Croatia under the EGD 148 A.E.4 Simulation for Capital-Labor Ratios in Croatia under the EGD 149 A.E.5 Simulation for Unskilled Labor Supply and Demand in Croatia under the EGD 149 A.E.6 Simulation for Skilled Labor Demand in Croatia under the EGD ......................... 149 A.E.7 Simulation for Skilled-Unskilled Wage Gap in Croatia under the EGD 150 A.E.8 Simulation Results for Polish Brown Production under the EGD 150 A.E.9 Simulation Results for Polish Green Production under the EGD 150 A.E.10 Simulation for Capital in Poland under the EGD 151 A.E.11 Simulation for Capital-Labor Ratios in Poland under the EGD 151 A.E.12 Simulation for Unskilled Labor Demand in Poland under the EGD 151 A.E.13 Simulation for Skilled Labor Demand in Poland under the EGD ......................... 152 A.E.14 Simulation for Skilled-Unskilled Wage Gap in Poland under the EGD 152 A.E.15 Simulation Results for Slovak Brown Production under the EGD 152 A.E.16 Simulation Results for Slovak Green Production under the EGD 153 A.E.17 Simulation for Capital in the Slovak Republic under the EGD 153 A.E.18 Simulation for Capital-Labor Ratios in the Slovak Republic under the EGD 153 A.E.19 Simulation for Unskilled Labor Demand in the Slovak Republic under the EGD 154 A.E.20 Simulation for Skilled Labor Demand in the Slovak Republic under the EGD 154 A.E.21 Simulation for Skilled-Unskilled Wage Gap in the Slovak Republic under the EGD 154 Tables 1 Policies for a Human-Centered Green Transition 3 3.1 Role of TVET in Green Transition 62 3.2 HD Policy Analysis Matrix 70 3.3 Multi-Country Human Development Policy .......................................... 71 5.1 Log Hourly Wages in Green and Brown Jobs Explained by Skills, Age, Gender, and Sector 109 6.1 Heat-Map Policy Analysis for the Slovak Republic, Croatia, and Poland 118 A.F.1 Variables Identified and Used for the Statistical Profiling 157 A.F.2 Tables for the Clustering 165 A.H.1 Log Hourly Wages in Green and Brown Jobs Explained by Skills, Age, Gender, and Sector 171
Preface
The damage to the environment caused by human activity in the last decades is an issue that involves people and entities across borders, and addressing this challenge requires the commitment and buy-in of all stakeholders. The European Green Deal (EGD) represents a massive effort by the international community to adopt more environmentally sustainable practices at a scale that can make a difference for current and future generations.
A human-centered approach is fundamental to achieving a just transition to the more sustainable environment envisioned under the EGD. This report discusses how human development policies will play a key role in achieving this goal. First, human development policies are indispensable to enable the green transition. For example, training the workforce for greener jobs require higher skills compatible with technology to make the transition feasible. Second, human development policies are also needed to help society adapt to a green economy. Third, the level and size of the actions proposed in the EGD could imply unintended consequences with adverse effects, particularly for low-skilled workers and lagging regions. Appropriate changes to social protection programs, education and training systems, and health services can reduce the hardships involved and help people and regions adjust successfully.
This report offers an analysis of the challenges for the European Union (EU) posed by the EGD and highlights the essential role that human development will play in making the transition attainable and sustainable. The research in this report provides an in-depth analysis of the implications for the region and the potential of human development sectors to drive changes in our society towards more environmentally conscious actions. In addition, the report analyzes important topics, such as equipping people with green skills, monitoring and strengthening labor market conditions, and improving the health sector, that can help Europeans take advantage of the opportunities offered by the transition and incites further research.
The report team and multiple expert reviewers of this report have collaborated to make this document a catalyzer for further research and through policy dialogue, the development of purposeful strategies and policies by governments and other stakeholders. Based on the Human Transitions General Equilibrium Model, as well as the use of econometrics, available literature, and focused country notes, the report provides analyses with important implications for a topic critical for European, and global, welfare. We hope that the report will contribute to shaping the policy agenda in the diverse contexts of the EU.
ix Preface
Acknowledgments
This report is part of the ASA “Advancing the Human Development Agenda within the EU’s Green Deal.” The ASA was led by a team including Diego Ambasz, Predrag Djukic, Karla McEvoy, and Javier Sanchez-Reaza, under the supervision of Harry Patrinos (who also contributed some of the background work and causal evidence), Rita Almeida, Cem Mete, and Tanya Dmytraczenko. The team is grateful for guidance throughout the process to Fadia Saadah and Gallina Andronova Vincelette. Rafael de Hoyos provided key constant guidance.
This report was prepared by a Human Development team led by Javier Sanchez-Reaza and coordinated by Diego Ambasz, Predrag Djukic and Karla McEvoy under the supervision of Harry Patrinos, Cem Mete, Tanya Dmytraczenko and Rafael de Hoyos, and the guidance from Fadia Saadah and Gallina Andronova Vincelette. The core team that produced inputs for this report includes: Noam Angrist (Oxford University and Youth Impact), María del Carmen Barrón Esper (Georgetown University), Federico Bartalucci (London School of Economics), Stephen Geoffrey Dorey, Moulay Driss Zine Eddine
El Idrissi, Tomasz Janusz Gajderowicz (University of Warsaw), Maddalena Honorati, Zohar Ianovici, Maciej Jakubowski (University of Warsaw), Anshuman Kamal Gupta, Kevin Alan David Macdonald, Gustavo Nicolás Paez Salamanca, Lucian Bucur Pop, Domagoj Račić, Andres Rodriguez-Pose (London School of Economics), Nadima Sahar, William Shaw, María Alejandra Torres Cuello (Pontificia Universidad Javeriana), and Sara Umaña (Universidad Nacional de Colombia).
The report benefited from the findings stemming from four case studies. In the Croatia Green Buildings case study, Adrien Arnoux Dozol led a team including Diego Ambasz, Ana-Maria Boromisa, Lucia Brajkovic, Stephen Geoffrey Dorey, Jure Kotnik, Danijel Marasovic, Danica Ramljak, Tigran Shmis, and Maria Ustinova. The Research and Innovation case study for Poland led by Anna Koziel with a team that included Diego Ambasz, Jeremie Amoroso, Aleksandra Marta Kononiuk, Anna Gizela Krol-Jankowska, Marek Kwiek, Domagoj Račić, and Pluvia Zuñiga. The Slovak Republic skills case study was prepared
by a team led by Husein Abdul-Hamid and included Diego Ambasz, Maciej Jakubowski, and Domagoj Račić. Finally, Poland’s just transition case study was led by Lucian Bucur Pop with a team comprised by Tomasz Janusz Gajderowicz, Maddalena Honorati, Maciej Jakubowski, and Sylwia Michalina Wrona.
In the process of creating a new outlook on the green transition, the report implied formulating innovative frameworks for analysis, rethinking the role of human development policy and the unintended consequences of climate action policy. In that learning journey, exchange of knowledge and ideas with World Bank staff through authors’ workshops, bilateral meetings across HD and with colleagues from SD and EFI, as well as with other leading institutions, was crucial. To ensure that this exchange was documented and produced a tangible effect on the regional report and the four case studies, the team created and carried out the Human Development Transitions Seminar Series where the ideas at the forefront of the debate were presented and discussed with the participation from Circle Economy, Chatham House, the Doughnut Economics Lab, the Milken Institute, the European Commission, the OECD, among other institutions and scholars.
Key to the knowledge exchange efforts was the creation of an Advisory Group comprised of World Bank staff and partner institutions. The team is grateful for knowledge exchange, guidance and suggestions to the Advisory Group members that include: Jack Barrie (Chatham House), Enrico Botta (OECD), Esther Goodwin Brown (Circle Economy), Stephen Hammer (Adviser, SCCDR, WBG), Andrew Fanning (Doughnut Economics Action Lab), Thomas Farole (Lead Economist, SCADR, WBG), Matthew Fraser (Circle Economy), Tillman Heidelk (European Commission), Rafael de Hoyos (Program Leader, HECDR, WBG), Kumi Kitamori (OECD), Kevin Klowden (Milken Institute), Elisa Lanzi (OECD), Jean-Francois Lengelle (OECD), Timea Moreau-Tepliczky (European Commission), Jamele Rigolini (Program Leader, HECDR, WBG), Patrick Schroder (Chatham House), Frank Siebern-Thomas (European Commission).
The report benefited from the wisdom, guidance and suggestions of our peer reviewers. At concept stage, the team is grateful to Thomas Farole, Tazeen
x MAKING THE EUROPEAN GREEN DEAL WORK FOR PEOPLE
Fasih, and Truman G. Packard. For the decision meeting, the team is indebted to Thomas Farole, Tazeen Fasih, Stephen Alan Hammer, Jamele Rigolini, and Tamer Samah Rabie. The team is also grateful for suggestions made by peer reviewers for each of the case studies during their quality enhancement reviews. For Croatia Green Buildings, we thank Enrique Alasino, Olena Doroshenko, Jas Singh, and Zuzana Stanton-Geddes; for the Polish Research and
Innovation, Lukasz Marek Marc; for the Slovak Republic skills case study, James Gresham, Iordan Petrov Iossifov, and Romina Miorelli; and for the Polish Just Transition, Aylin Isik-Dikmelik and Nithin Umapathi. A team at Communications Development—led by Bruce Ross-Larson and including Meta de Coquereaumont, Joe Caponio, and Mike Crumplar—edited the report. Michael Alwan provided design and typesetting services.
xi
Acknowledgments
Abbreviations
ALMP Active labor market programs
ACF Aged Care Facilities
AWU Annual Work Unit
BMI Body Mass Index
BAU Business as usual
CNE Carbon-neutral economy
CLD Causal Loop Diagrams
CPC Central Product Classification
CEAP Circular Economic Action Plan
CE Circular Economy
CAI Collective Action Initiatives
CCB Compliance Certification Board
CGE Computable General Equilibrium models
DRT Demand-responsive training
DMC Domestic material consumption
DICE Dynamic Integrates Climate-Change Economy
ETS Emission Trading System
ESG Environmental, Social and Governance
EFI Equitable Growth, Finance and Institutions
ECA Europe and Central Asia
EC European Commission
EEA European Environmental Agency
EGD European Green Deal
EUGD European Green Deal
EIB European Investment Bank
EU European Union
FTE Full-time equivalents
GE Green economy
GTI Green training and involvement
GHG Greenhouse gases
GDP Gross Domestic Produce
HCF Health care facilities
HUS Household Utility Subsidy
HCI Human Capital Index
HD Human Development
HDI Human Development Index
HTGEM Human Transitions General Equilibrium Model
IAP Individual Action Plan
ICT Information and Communication Technology
IT Information Technology
IDB Inter-American Development Bank
IPCC Intergovernmental Panel on Climate Change
ILO International Labour Organization
JRC Joint Research Centre
LSI Latent semantic indexing
LAC Latin America and Caribbean
MWM Medical waste management
MFF Multiannual Financial Framework
NRRP National Resilience and Recovery Plan
NSRD National Strategy of Regional Development 2030
NLP Natural Language Processing
NGEU Next Generation EU plan
NUTS Nomenclature of Territorial Units for Statistics
OECD Organisation for Economic Co-operation and Development
PHCI Planetary pressure adjusted Human Capital Index
PHDI Planetary pressure-adjusted Human Development Index
PISA Programme for International Student Assessment
PIAAC Programme for the International Assessment of Adult Competencies
PILRS Progress in International Reading Literacy Study
RCT Randomized Control Trials
SRM Secondary Raw Materials
SRMI Secondary Raw Materials Index
SVD Singular value decomposition
SBCC Social and behavioral change communication
SP Social Protection
SPJ Social Protection and Jobs
SSC Stomspar Check
SDG Sustainable Development Goals
SDM System Dynamics Model
TIMSS Trends in International Mathematics and Science Study
UN United Nations
UNDP United Nations Development Programme
UNESCO United Nations Educational, Scientific and Cultural Organization
UNEP United Nations Environmental Programme
VET
Vocational Training
WLE Warm likelihood estimates
WEEE Waste from electric and electronic equipment
WHO World Health Organization
xii MAKING THE EUROPEAN GREEN DEAL WORK FOR PEOPLE
Abbreviations
European countries’ abbreviations
AT Austria
BE Belgium
BG Bulgaria
CY Cyprus
CZ Czech Republic
DK Denmark
DE Germany
EE Estonia
EL Greece
ES Spain
FI Finland
FR France
HR Croatia
HU Hungary
IE Ireland
IS Iceland*
IT Italy
LV Latvia
LT Lithuania
LU Luxembourg
MT Malta
NL Netherlands
NO Norway*
PL Poland
PT Portugal
RO Romania
SE Sweden
SI Slovenia
SK Slovak Republic
UK United Kingdom*
xiii
Note: */Non-EU member
OVERVIEW: A Human-Centered Green Transition
Climate change is the single most import ant existential threat of our times. Mounting average global temperature contributes to rising sea levels, more frequent extreme weather events, deteriorating biodiversity, and shifts in the sustainability of agriculture and aquaculture (Thompson 2020). By the end of the decade, up to 132 million people could become poor (Jafino et al. 2020), and 80 million full-time jobs could be lost due to climate change (ILO 2019a). A further increase in global temperatures beyond 1.5 degrees Celsius would have calamitous implications for human welfare (IPCC 2021b).
The European Green Deal (EGD) is the response of the European Union (EU) to the climate challenge. It will establish regulations and incentives to nudge European society toward a more sustainable economy. It puts together policies, investments, subsidies, and regulations to achieve three core objectives: (i) net-zero emissions of greenhouse gas (GHG) emissions by 2050, (ii) decoupling the economy from natural resource consumption, and (iii) leaving no person or place behind during the transition (Box O.1).
To achieve these ambitious goals the EGD com bines a wide range of regulations, policies, and in terventions. The policy levers of the EGD can be classified into five broad categories: (i) improve the size and effectiveness of the EU emissions trading system, (ii) promote energy efficiency of households and firms (including the renovation of buildings), (iii) increase the use of renewable energy, (iv) expand the circular economy, and (v) regulate land use and increase organic agricultural production.
But a green transition is only possible with an enabling human transition—and only with the
proper human development (social) policies to support this transition. In other words, to achieve the objectives of the EGD, EU member states (MS) must implement the right education, health, and social protection policies to make sure that the transition out of carbon leaves no one behind, particularly disadvantaged households. The EGD must be mindful of the short-term costs of the transition, addressing potential discontent in regions or groups of the society that will be negatively affected. Providing labor market opportunities and access to social safety nets to individuals and families bearing the costs of the transition is a necessary condition for a successful implementation of the EGD. Otherwise the EGD could exacerbate the already high levels of income inequality and political polarization, jeopardizing the continuity and sustainability of the green transition. In the long term, the EGD must support behavioral changes in consumers’ preferences that favor sustainable and green production processes and help avoid slipping back into old, environmentally unsustainable consumption patterns. Therefore, human development policies—including education, health, and social protection—should be at the core of the EGD.
This report identifies the human development (HD) policies needed to enable the green transi tion in Europe. From an economic point of view, the EGD policies will impact the economy’s relative prices to favor “green” over “brown” production and consumption. For instance, capping the amount of carbon emission increases the price of carbon-intensive goods, shifting consumption to environmentally sustainable consumer goods. In turn, this demand shift increases the price of “green”
Box O.1: The EGD’s Three Objectives and Five Policy Levers
The European Green Deal (EGD) aims at addressing climate change by transforming the European Union (EU) into a modern, resource-efficient, and competitive economy with:
1. Net-zero greenhouse gas (GHG) emissions by 2050
2. Economic growth decoupled from natural resource consumption
3. No person or place left behind.
The EGD is organized around five broad policy levers:
1. Emission trading system
2. Circular economy
3. Energy efficiency in households and firms
4. Investing and subsidizing renewables
5. Regulate land use and increase organic agricultural production.
Source: EC 2022a.
2 MAKING THE EUROPEAN GREEN DEAL WORK FOR PEOPLE
goods, creating incentives to boost production. Increasing “green” production must be followed by reallocating workers to those industries and out of “brown” ones. The general equilibrium effect of the EGD creates winners and losers—as is the case with any other transition. Two transmission mechanisms link EGD policies with household well-being, both operating through price channels. The first is a direct price effect, whereby the price of energy rises, reducing household well-being, particularly vulnerable ones that devote a significant share of income to cover energy bills. The second is a labor market channel with workers in carbon-intensive “brown” industries losing jobs and/or wages and workers in green industries benefiting.
This report identifies the HD policies that would enable the transition, mitigate the unintended con sequences or costs of the transition, while adapting workers and households to a new reality where environmental sustainability is prioritized. Since the transition from a carbon-based (brown)
economy to a green economy impacts people, HD policies are necessary for the transition to materialize (Table O.1).
In the short run, social protection policies will be critical to mitigate the costs of the transition. Workers in shrinking carbon-intensive industries must get training opportunities. Training and reskilling programs must be closely linked to the needs of the growing green industries and work in collaboration with Public Employment Services (PES) to provide labor market opportunities to displaced workers. But even assuming a very effective reskilling program and an efficient PES, some workers would need social assistance (income support) to mitigate the transition costs, and in some cases, adapt to the new equilibrium through early retirement (pensions).
When a coal miner loses the only job he or she has ever had, more than a cash transfer and a train ing program is needed. Previous transitions show that mental health support is needed to mitigate the
A green transition
only possible with an enabling human transition
3 Overview: A Human-Centered Green Transition
is
Table O.1:
Source: Authors. Enable Adapt Mitigate Education Foundational skills Fungible skills R&D+Innovation TVET (e.g. upskilling) Behavioral change & Lifelong learning Health Mental health support Physical health protection systems SPJ Public Employment Services (e.g. reskilling) Active Labor Market Policies (ALMPs) PES orientation to new occupations Early retirement & bridge pensions Social registries & assistance (e.g. cash transfers)
Policies for a Human-Centered Green Transition
cost of switching career paths (Hollingsworth, Ruhm, and Simon 2017). In addition, preventive health policies and services will be needed during the adaptation phase for workers in the growing waste management industries and the circular economy.
E ducation systems must act now to produce long ‑ term improvements in foundational skills (numeracy, literacy, and socio emotional skills), develop the technologies to cut emissions, and change consumer preferences. People with strong foundational skills will be more capable of learning new skills and reinventing themselves into the new occupations created by the green transition. Education systems can also contribute to designing and implementing a research and innovation agenda to produce the technologies required to curb emissions and decouple economic growth from resource consumption. Finally, reformed education curricula can increase awareness of man-made climate change, generate and maintain a sense of urgency in addressing environmental damages, and create interest in common well-being. All these changes can encourage behaviors that contribute to reducing GHG emissions and the use of natural resources.
The European Green Deal
The EGD calls for policies that provide incentives for change, but that also restrict the actions of workers and firms. Reducing GHG emissions and decoupling the economy from natural resource consumption requires an effective emission trading
system, enabling a circular economy; improvements in the energy efficiency of housing and consumer products; much greater use of renewable energy; and reduced emissions from road transport, agriculture, and land use. There will be transition costs as firms adapt their mix of factors of production and workers acquire the necessary skills for the green economy to reach a new equilibrium.
Net-zero emissions and decoupling economies from natural resource consumption
Global growth over the past century relied heavily on natural resource consumption. Every 1 percent increase in global GDP was associated with a 0.8 percent increase in the consumption of natural resources. The extraction and processing of resources accounted for about half of global GHG emissions and more than 90 percent of biodiversity loss.
Countries with high or very high human devel opment have also exerted significant pressure on planetary boundaries. Adjusting the UNDP’s Human Development Index (HDI) to account for the use of natural resources and GHG emissions, considerably reduces the ranking of countries at the top in the HDI (Figure O.1, panel a). Similarly, adjusting the World Bank’s Human Capital Index (HCI) for each country’s contribution to global environmental pressure, consistently shows diminished rankings (Figure O.1, panel b). This relationship underlines the importance of new economic models that shift
Figure O.1: Human Development and Human Capital Indices Adjusted by Environmental Pressure
Source: Author’s elaboration based on UNDP (2020) (panel a), authors’ calculations using the World Bank (2020) (panel b).
Note: 1. PHDI stands for Planetary-adjusted Human Development Index; PHCI stands for Planetary-adjusted Human Capital Index.
2. Planetary-adjusted indices takes into account a country’s level of carbon dioxide emissions and material footprint.
3. Relative to standard HDI/HCI (y-axes in both panels), countries above the 45-degree line show a higher level of HDI/HCI if environmental pressure is taken into account. The reverse is also true: countries under the 45-degree line have lower HCI/HCI when those environmental pressures are included.
4. Yellow dots represent EU member states.
4 MAKING THE EUROPEAN GREEN DEAL WORK FOR PEOPLE
US ECA 0.300 0.400 0.500 0.600 0.700 0.800 0.900 1.000 0.300 0.400 0.500 0.600 0.700 0.800 0.900 1.000 HDI (2019) Planetary pr essur es adjusted HDI (2019) Austria Belgium Bulgaria Croatia Estonia Finland France Germany Greece Hungary Poland Portugal Romania Slovakia Sweden 0.50 0.55 0.60 0.65 0.70 0.75 0.80 0.85 0.50 0.55 0.60 0.65 0.70 0.75 0.80 0.85 HCI Planetary pr essur e-adjusted HC I a. HDI and PHDI b. HCI and PHCI
New economic models need to shift the focus from economic growth alone to include its impact on human welfare
the focus from economic growth alone to accounting for growth’s impact on human welfare, as well as the need to mitigate and adapt to climate change.
In the last 20 years, Europe has made significant progress in decoupling growth from consumption, but more is needed. Between 2000 and 2020, the EU economy grew 22.5 percent, while domestic material consumption dropped from 6.5 gigatons to a little over 6 gigatons, slightly more than 6 percent of total global domestic material consumption. During this period, renewable energy consumption more than doubled as a share of total energy consumption, rising from 9 percent in 2000 to 22 percent in 2020. The 30 percent decline in fossil fuel consumption accounted for more than 90 percent of total domestic material consumption reduction. In contrast, the consumption of metal ores rose by 4 percent, and the consumption of biomass and nonmetallic ores decreased only slightly.
One of the most critical policy actions within the EGD to achieve net‑zero emissions by 2050 and
decouple economic growth from the consumption of natural resources is the transition to a circular economy. The circular economy is the systematic recovery and reuse of products and natural resources that minimize the extraction, consumption, and disposal of natural resources and maximizes resource efficiency (World Bank 2022a). The ecological benefits of embracing a circular economy model include reduced dependence on primary raw materials and a considerable reduction in GHG emissions and externality costs related to manufacturing, transportation, and built environment systems, with annual savings of €600 million in primary raw materials costs (EEA et al. 2016). The reduced dependence on primary raw material extraction will also reduce EU countries’ dependence on imports and exposure to supply chain disruptions (EC 2018).
Though the circular economy model has various applications, the nine Rs framework is a widely accepted benchmark for strategies to enable the transition to the circular economy . The circular
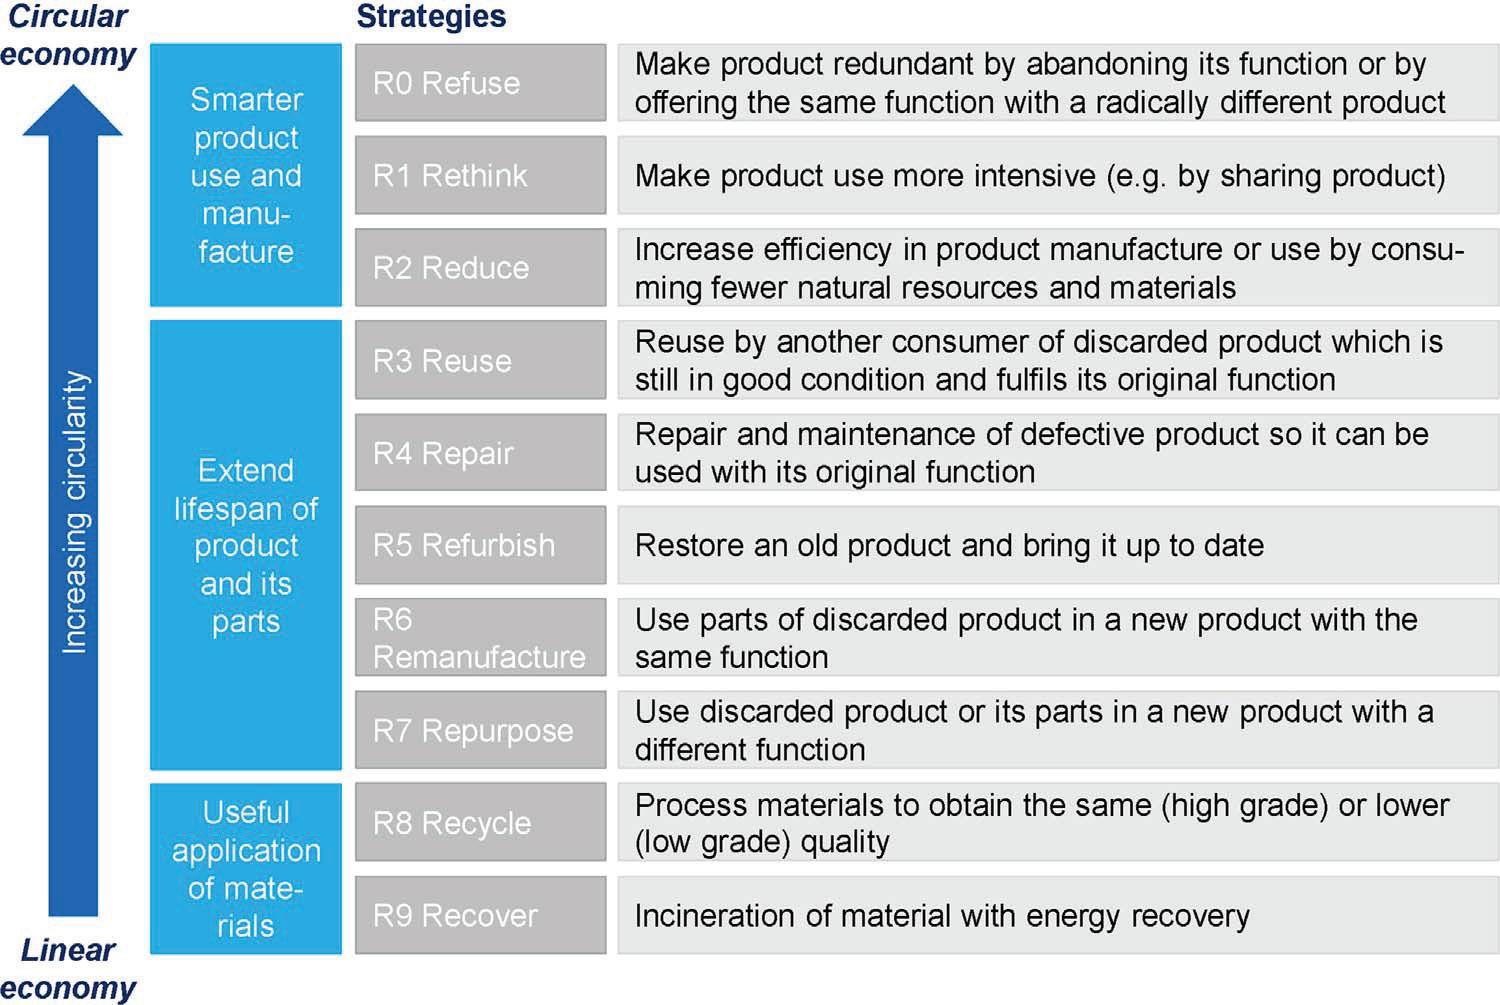
5 Overview: A Human-Centered Green Transition
Figure O.2: Nine Rs for the Circular Economy
Source: Kirchherr 2017.
Europe has a comprehensive plan to
to a circular economy based on maximizing resource efficiency


economy model has a biological cycle, in which natural resources are returned to nature, and a technical cycle, in which products, components, or natural resources are designed and marketed to reduce waste significantly (Figure O.2).
But the transition to a circular economy has been slow and uneven. Since 2000, only a few EU countries have achieved an absolute decoupling of economic growth from non-fossil fuel consumption (negative growth or absolute decline in non-energy domestic material consumption). The annual rate of change of non-fossil fuel domestic material consumption surpassed the average annual economic growth rate in 10 of the 27 EU countries. Absolute decoupling occurred in only six countries (France, Italy, the Netherlands, Portugal, Spain, and Sweden). The other countries have achieved relative decoupling—an annual economic growth rate higher than
domestic material consumption growth (see Figure O.3). Relative decoupling is observed in Austria, Cyprus, the Czech Republic, Finland, Luxembourg, Malta, Poland, and the Slovak Republic. But no decoupling is observed in Bulgaria, Croatia, Estonia, Greece, Hungary, Latvia, Lithuania, Romania, and Sweden. The circular economy is promising, but its im plementation still needs to be improved. Circular economy sectors and activities account for less than 1 percent of EU GDP and less than 2 percent of employment, with moderate variations across EU MS. Although the EU outperforms all other regions in e-waste management, only three MS met the electric/electronic waste collection target for 2019: 65 percent. Three countries have yet to meet the 2016 target: 45 percent. Part of the reason for the slow transition is that firms still find it cheaper to use raw materials than to reuse waste materials (World Bank
6 MAKING THE EUROPEAN GREEN DEAL WORK FOR PEOPLE
transition
Figure O.3: Annual Change Rate of GDP and DMC in EU Member States, 2000–2020 (%)
EU BE BG CZ DK DE EE IE EL ES FR HR IT CY LV LT LU HU MT NL AT PL PT RO SI SK FI SE −4.5 −2.5 −0.5 1.5 3.5 5.5 7.5 9.5 −1.0 0.0 1.0 2.03.0 4.0
Source: Authors’ elaboration using Eurostat data.
Annual change rate of DMC (%) Annual change rate of GDP (%) No decoupling Relative decoupling Absolute decoupling
Only a few MSs achieved absolute decoupling of GDP growth and non-energy DMC in the past two decades, implying that the latter are increasing in the majority of the EU
2022a). The implementation of the circular economy— waste management, production and consumption, and trade and use of secondary materials—is still emerging in Europe.
Financing the EGD
To make the green transition viable and equitable, it must be congruent with economic and social needs in regions and sectors that rely heavily on car bon and fossil fuel related industries.1 To that end, the European Commission (EC) established a Just Transition Mechanism mobilizing up to €150 billion from the Just Transition Fund, InvestEU, and the European Investment Bank (EIB) to support regions and individuals most adversely affected by the green transition through worker reskilling, enterprise development, and circular economy projects (Más Rodriguez 2021).
Making the green and human transitions effi cient in Europe requires adequate financing. The EC plans to direct at least €1 trillion (about 7.2 percent of the EU’s 2020 GDP) over the next 10 years to support the EGD (EC 2020). Nearly half of the funding will come from the EU budget. National co-financing will contribute around 10 percent, while development banks will contribute around 27 percent. The Just Transition Mechanism will contribute around 14 percent of funding; some of those funds are a combination of Invest EU with national co-financing.
Even with record amounts of public funds allo cated to the green transition, there is an estimated gap of at least €2.5 trillion for the 2021–2027 period, which the private sector will need to fill by funding environmental, social, and governance efforts (Brühl 2021). Mechanisms that redirect public funding, taxation, and consumption to green economy projects can leverage private sector capital for the green transition.
1. See chapter 5.
The EGD can avoid previous transitions’ increased income disparities
Every transition towards a new equilibrium in the economy generates winners and losers, and, if not complemented with the right HD policies, the EGD won’t be an exception. The asymmetric impact of previous transitions such as globalization or technological progress increased income disparities in high-income countries. Between 1970 and 2016, the share of employment in occupations requiring mid-level skills in the United States (such as office clerks, sales associates, and production workers) declined, while the number of high- and low-skilled occupations rose or remained largely unchanged (Autor 2019). A similar pattern is observed in Europe between the 1990s and early 2010s, with the number of occupations involving routine tasks decreasing throughout the period (Bussolo et al. 2018). This process of hollowing the middle can be partly explained by the transitions triggered by trade and technology; for instance, OECD countries that traded more with China also lost more jobs in the manufacturing sector, which are typically mid-level skills—and middle-income—occupations. The loss of manufacturing jobs contributed to the increase in per capita household income inequality—measured by the Gini coefficient—observed in 19 of the 27 EU member states between 1993 and 2019 (Figure O.4).
Low and middle class workers bore the highest costs of the trade and technological transitions in the United States and the EU, partly explained by insufficient or ineffective HD policies. This, in turn, had adverse political consequences. The rise in income disparities increased political polarization, promoted mistrust in institutions, and strengthened the support for protectionist and populist policies (Autor et al. 2020; Rodrik 2021). The emergence of
7 Overview: A Human-Centered Green Transition
To make the green transition viable and equitable, it must be congruent with economic and social needs in regions and sectors that rely heavily on carbon- and fossil fuel-related industries
Figure O.4: Change in Income Inequality in the EU, 1993–2019 (Gini Coefficient)
political polarization in the United States and the EU can be traced back to the erosion of labor market opportunities for middle-skilled workers in manufacturing industries caused by trade liberalization and automation in the manufacturing sector (Autor et al. 2020; Rodrik 2021; Klein and Winkler 2019).
A more gradual phase in of the trade and tech nological transitions would have provided enough time for adjustment or a proper design of the right HD policies to protect the well being of at risk workers. But gradualism is not an option for a green
transition that must be done. Therefore, education, health, and social protection systems, particularly in lagging EU MS and regions, must receive the resources and technical support needed to mitigate the impact of the transition on disadvantaged households. The remainder of this overview describes the HD policies that will enable the green transition, mitigate its short-term adjustment costs, and adapt households to a new, environmentally sustainable, equilibrium in the economy.
8 MAKING THE EUROPEAN GREEN DEAL WORK FOR PEOPLE
The EDG, like every transition towards a new equilibrium in the economy, generates winners and losers, and must be complemented with the right social policies
Estonia Ir eland Hungar y Netherlands Gr eece Cr oatia Belgium Finland Latvia Bulgaria Luxembour g Romania Slovak Republic Sweden Czech Republic Cyprus Denmar k Ger many Austri a Lithuania Italy Slovenia Spain Portugal Poland France 15 10 5 0 −5 −10 −15 Gini Coe ff icient
Source: World Bank.
HD policies to enable the transition: leaving no person or place behind
HD policies can enable the green transition through the provision of the technology and solutions needed to address climate change and the educa tion to change behaviors. HD is also paramount in mitigating the unintended consequences of the transition, particularly job losses and declining relative wages among low-skilled workers. HD policies can also help individuals and households adapt their core skills, the focus of their education, and their consumption patterns in ways that support the green transition and the emergence of an environmentally sustainable equilibrium in the economy.
The EGD could have a significant impact on the distribution of income across regions and individ uals. Regions that rely heavily on exploiting fossil fuels, energy-intensive production, or the linear production model, many of which already have lower-than-average incomes, could be left behind. And shifts in demand for skills, driven by the green transition, could lead to job losses and declines in the relative income of lower-skilled workers.
HD policies to mitigate the costs of the transition
The EGD will have asymmetrical impacts across individuals and regions. Prosperous, innovative regions with a highly skilled workforce will benefit while marginalized places could be left behind. Unskilled workers in carbon-intensive industries will need significant support in reskilling, cash transfers, and job placement services to seize potential job opportunities.
The EGD will reshape the geography of jobs and wealth between individuals and across the EU. Some individuals and regions are set to tap into the opportunities offered by regional diversification and
specialization in the green economy. Employment growth and capital investments related to green innovations will likely cluster in a few core, prosperous regions, as has been the case for other leading-edge innovations (Atkinson et al. 2019). Meanwhile, other regions—often plagued by pre-existing economic, social, and institutional bottlenecks—risk falling further behind (McCann and Soete 2020; Moreno and Ocampo-Corrales 2022). Ignoring the differential regional impact of the EGD will jeopardize its inclusiveness and long-term sustainability and could even derail the transition to a low-carbon equilibrium.
Skills to prevent further regional disparities
High levels of carbon intensive economic activity in some vulnerable EU regions are a vital determi nant of the negative externalities expected with the green transition. Regions with carbon-intensive economies will bear additional costs and price increases stemming from carbon taxes. Three additional factors increase a region’s vulnerability to the negative externalities of the EGD: low technological relatedness, weak regional innovative potential, and deficiencies in local governance. Vast differences in the technological relatedness of local industrial capabilities, innovation potential, and quality of governance will increase the concentration of green investment and skilled labor in leading regions beyond those related to agglomeration and brain drain effects. In addition, without fair and adequate mitigation policies, higher energy prices will lead to declining consumption and incomes in the hardest-hit regions and among disadvantaged households.
Skilled labor will flow from lagging regions to more prosperous ones. Achieving regional specialization in green technologies and sustainable economic activities is likely to require preconditions that need to be put in place everywhere, including a qualified workforce, specialization in related economic
9 Overview: A Human-Centered Green Transition
Decisive social policy action is needed to implement a green transition that must not be delayed
fields, and adequate infrastructure and facilities (Moreno and Ocampo-Corrales 2022). The inability of lagging regions to profit from the opportunities offered by the development and production of green technologies—reflecting a mismatch between the skills supplied by the labor force, and those demanded by firms in the local economy—may lead to job losses, dissatisfaction, and possibly a brain drain (Fratesi and Rodríguez-Pose 2016).
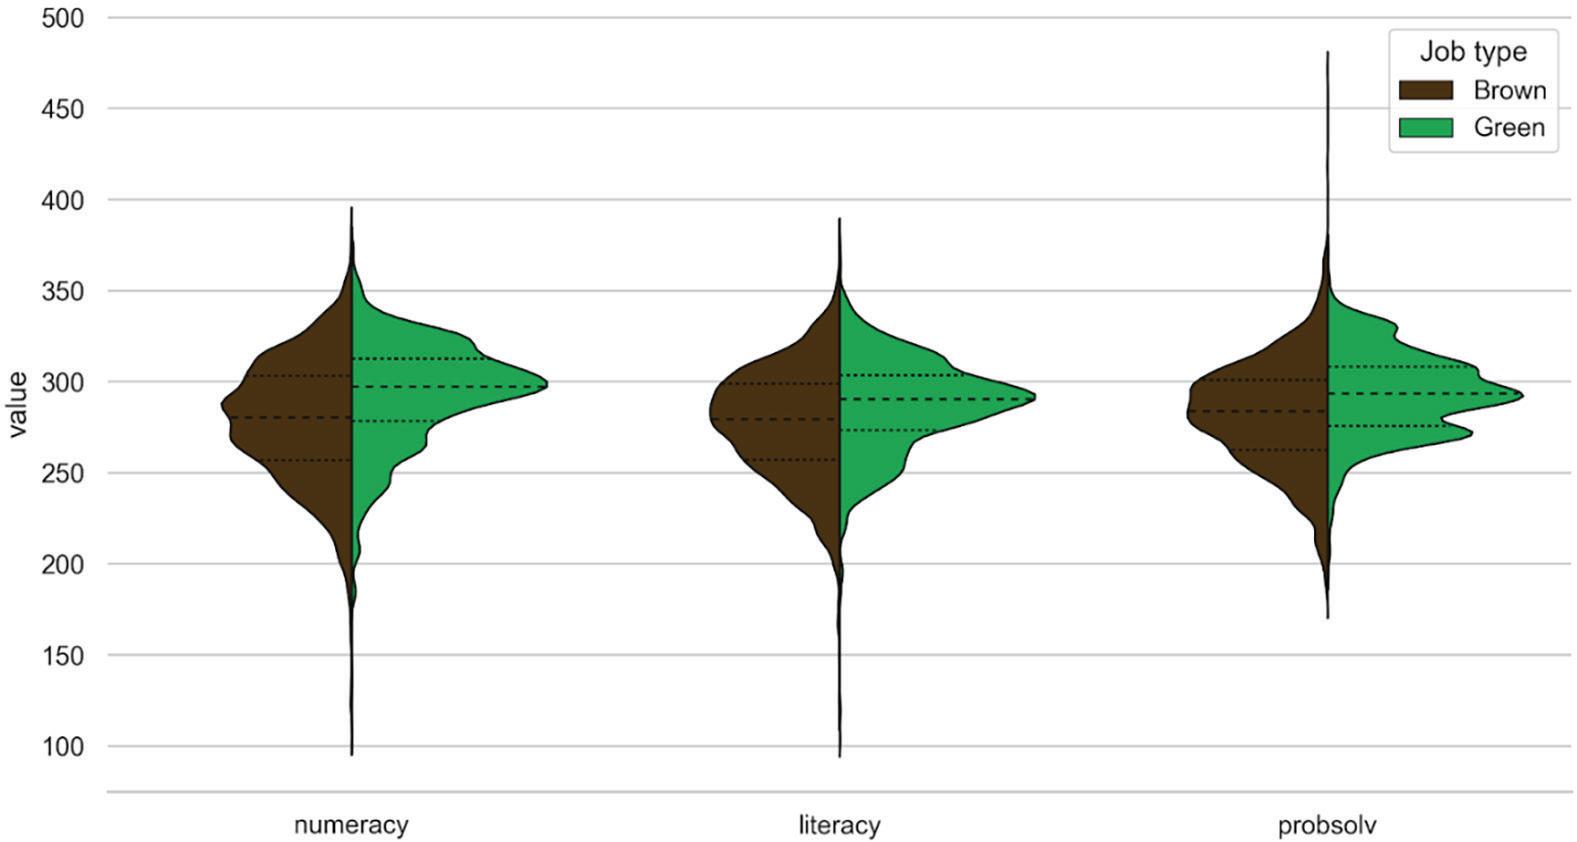
Just as the poorest regions are likely to experi ence the most adverse impacts from the EGD, lower skilled workers are likely to experience a decline in earnings relative to higher skilled work ers. Green jobs tend to be more skill-intensive than brown jobs and to require higher proficiency in all types of skills than brown jobs, captured by differences in learning outcomes in numeracy, literacy, and problem-solving (Figure O.5). These differences
in learning outcomes are more significant among low-skilled workers. The lowest-skilled workers in green jobs have much higher skills than those in brown jobs. Workers in green jobs use skills at work and home more often than do workers in brown jobs.
The skill gap between green and brown jobs is related mostly to differences in years of schooling and partly to the use of skills. On average, half of the difference in numeracy skills between workers in green jobs and those in brown jobs is explained by differences in schooling. People in green jobs have higher numeracy because they are better educated and use these skills more frequently. For low-skilled workers, the skills gap between green and brown jobs is almost entirely explained by years of schooling and skill use intensity. For the high-skilled workers, years of schooling explain most of the gap, while the use of skills is less strongly related.
The EGD will reshape the geography of jobs and wealth between individuals and across countries
Figure O.5: Density Plots Green vs. Brown Jobs
10 MAKING THE EUROPEAN GREEN DEAL WORK FOR PEOPLE
For major adult skills covered in the PIAAC survey
Source: Authors based on PIAAC data.
Mitigating the transition costs will require ac tive labor market programs (ALMPs) for retraining workers whose skill sets are ill‑matched to the re‑ quirements of green jobs, and support for training new and potential workers in appropriate skills. Many countries have developed retraining strategies, at times linked to income support, for workers displaced by economic transitions (including trade liberalization), privatization, and energy transitions.
But countries must also work on demand. They should provide companies with information and financial support to invest more profoundly in their workers’ foundational and task-specific skills. Firms are unlikely to offer the more demanding and longterm training that focuses on foundational skills (numeracy, literacy, and socio-emotional skills) without subsidies to cover additional training costs. Several countries have competence centers to encourage companies and individuals to participate in adult education and training and provide more formal recognition of achieved qualifications.
Public employment services will play a crucial role
Job matching by government programs and labor market agencies will require a shift in approach to support workers in finding jobs during the green transition. Green and brown jobs also differ in
return to skills. In Poland, for example, returns to skills are 5 percent higher in green jobs than in brown jobs. Current tools focus on boosting labor demand and matching workers with companies based on existing skills. Innovative tools are required. Tools that focus on measurable skills necessary for green and brown jobs, along with specific information on what is required for transitioning to green jobs. An effective transition thus requires a deeper evaluation of workers’ skillsets and the potential for green transition pathways.
Identifying the transition paths with the small est differences between the skills required for brown versus green jobs would reduce the invest‑ ment required to move from a brown to a green job. Using similarity indices (task level) along with the PIAAC data (skills level) allows for pinpointing the occupations with the most feasible brown-togreen transition. Poland provides an example of brown-to-green job transitions (Figure O.6). Environmental engineers tend to possess higher or similar skills than workers occupying similar jobs and at the same time are paid less. This mismatch would make it very difficult to meet the growing demand for environmental engineers by retraining workers from similar occupations. Instead, the skills gap could be narrowed by applying a policy mix aimed at human resources development and wage subsidies (for example, by recycling carbon tax income).
11 Overview: A Human-Centered Green Transition
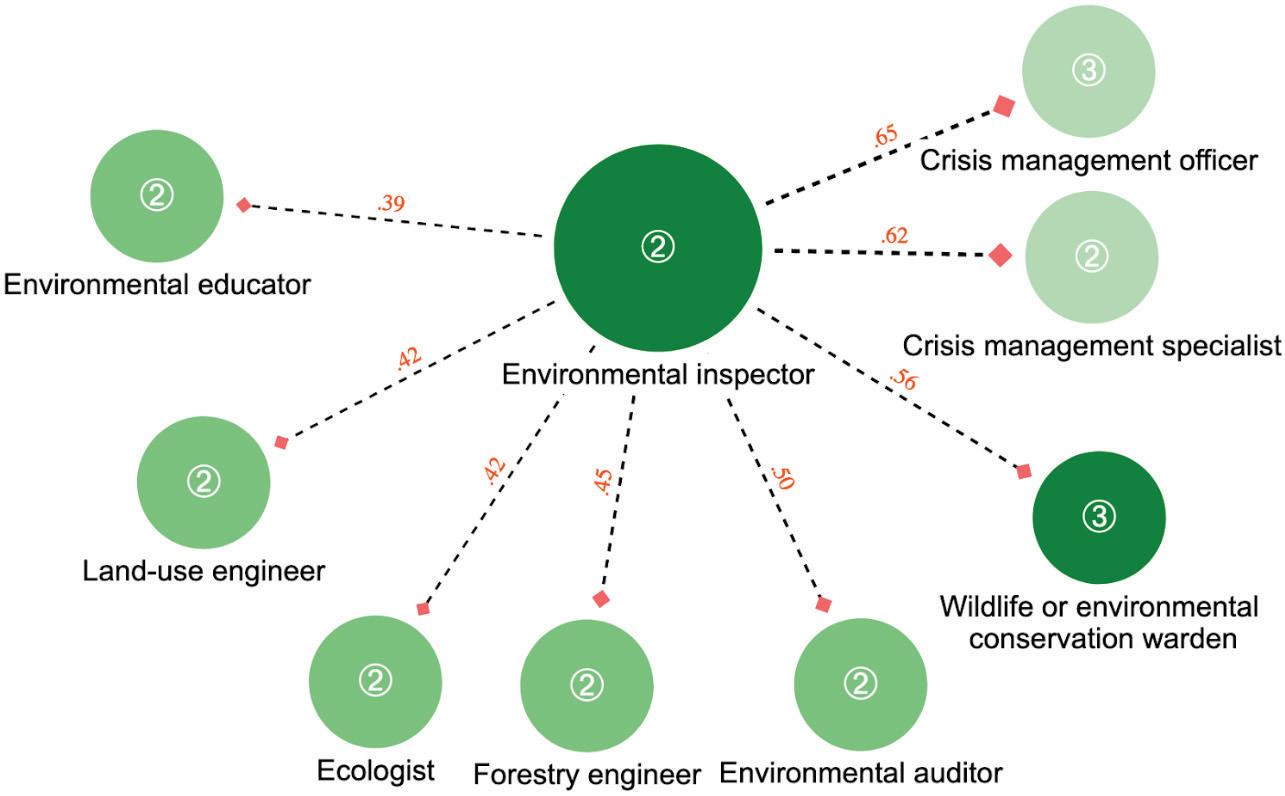
Figure O.6: Green Job Transitions Example from Poland
Note: Color represents green core index (0.1: e.g. Crisis management officer, 1: e.g. Wildlife or environmental conservation warden), values on edges reflect similarity scores, numbers in bubbles refer to major occupation groups.
Skill and wage analysis can yield important in sights for green employment policy. Enabling engineers to start a career in the renewable energy sector might require ALMPs, such as offering hiring subsidies to firms and institutions seeking to retrain renewable energy engineers. For the green job of environmental inspector, skill and wage gaps across related jobs are less prominent, suggesting the potential for transitions from several current occupations, such as crisis management officer or forestry engineer (see Figure O.6). But because upskilling would still be required, targeted supply-side measures such as vocational training would be necessary. In a third example, workers in the greener occupation of environmental engineer possess on average similar or higher skills than workers in similar current jobs but are paid less. This mismatch would make it difficult to meet the growing demand for environmental engineers simply by retraining workers from similar occupations. Such job transfers could be encouraged by policies for human resource development combined with wage subsidies.
Social assistance and health services can mitigate some of the transition costs
Social protection programs will be important in identifying and assisting the many vulnerable households adversely affected by the rise in energy
prices during the green transition. Information systems need upgrading to improve the effectiveness and efficiency of social protection programs. Better social registries can more accurately identify vulnerable individuals to ease the impact of energy price rises on the poor without encouraging greater fossil fuel consumption. Temporary income support will be required for workers who lose jobs and cannot transition to new jobs or attain new skills for their current job. Conditional or unconditional cash transfer programs may also have a role during the green transition. Early retirement and bridge pensions could assist those who lose jobs, though they must be carefully designed and targeted to avoid disincentivizing work.
Mental and physical health services are needed to respond to the labor market disruptions during the green transition and to help workers cope with weaker employability and a loss of employment. Ensuring that everyone has access to adequate health protection and psychological support is essential to prevent catastrophic and impoverishing health expenditures and to encourage the use of appropriate health services. This may require government financing of healthcare or public health protection systems intended for the most vulnerable—for example, subsidies that even cover contributions for social health protection.
12 MAKING THE EUROPEAN GREEN DEAL WORK FOR PEOPLE
Mitigating the transition costs will require Active Labor Market Policies for retraining workers for the requirements of green jobs, and support for training new and potential workers in appropriate skills
Skilled labor will flow from lagging regions to more prosperous ones
HD policies to adapt individuals and households to a sustainable economy
Households and workers must adapt to an equilib rium characterized by low carbon emissions and a significantly larger circular economy. This long-term process starts by recognizing man-made climate change and the damage we have done to our planet. This is the starting point for transitioning toward more sustainable behaviors and consumption patterns. Education at all levels should incorporate information on climate change and sustainable behavior. In addition, the education sector can contribute with research and innovation focused on generating the technology needed to eliminate carbon emissions, reduce the consumption of natural resources, and find clean alternatives to energy production.
Workers will need strong foundational skills to seize the opportunities created by the EGD
In the medium term, education systems should pro vide all students with fungible skills to enable life long learning to perform different tasks in an increasingly dynamic labor market. Foundational skills will prepare the workforce to take on emerging occupations. ILO (2018a) asserts that skill development and training are essential for appropriately implementing adaptation strategies, such as changes in infrastructure that contribute to the netzero emissions goal of the EGD. Furthermore, the case study for the Slovak Republic, which accompanies this report, finds that education will play an essential role in preparing the workforce to take on green jobs, primarily through the development of foundational skills and attitudes. The study discusses that regardless of changes in labor demand, core skills
such as learning ability, effective communication, leadership, and decision-making are soon expected to be critical for occupational mobility.
People with strong foundational skills will be more capable of learning new skills and thus ob taining green jobs. Recent evidence shows the importance of foundational skills—numeracy, literacy, and socio-emotional skills—as the basic pillars enabling life-long learning. Lack of foundational skills dampens individuals’ capacity to acquire or upgrade their professional competencies, preventing them from adapting to changing labor market conditions. PISA 2018 results indicate that around one in five 15-year-olds in the EU are low achievers (21.7 percent in reading, 22.4 percent in mathematics, and 21.6 percent in science) even though there are considerable differences among EU member states. In this context, the demand for foundational skills is set to increase with the greening of the economy, technological progress, and further integration of international markets (World Bank 2018).
A growing literature shows that there are cost effective interventions to improve foundation skills. Early childhood education interventions targeting children ages 0–3 and providing them with the necessary nutrition, early stimulation, and meaningful interaction are highly effective, especially among disadvantaged children. Providing information about the benefits associated with years of schooling and learning has proven to change behaviors and improve students’ efforts and learning outcomes. Selecting, training, and incentivizing teachers and school directors within a coherent and transparent teacher career path improves student learning. Finally, using technology to personalize the learning experience can also be a highly cost-effective intervention (World Bank 2018, 2020).
To ensure foundational skills for all students, EU MS must modernize their technical, vocational education, and training (TVET) systems. Half of all
13 Overview: A Human-Centered Green Transition
Job matching by government programs and labor market agencies will require a shift in approach to support workers in finding jobs during the green transition
students enrolled in upper secondary education in the EU in 2019 (17.5 million), were enrolled in a vocational track; and at least 2 million of them, were enrolled in work-based programs. Therefore, TVET institutions are central in the skill-formation process in EU countries. Identifying the professional competencies that will be demanded in the future and adjusting the provision of TVET services accordingly is poised to become more challenging, making many training programs ineffective (Kluve et al. 2019; McKenzie 2017).
TVET graduates with professional competen cies might enjoy favorable labor market outcomes in the short term but having more robust founda‑ tional skills seems to produce better results (Hanushek et al. 2017). According to PISA, TVET students perform significantly worse than general education students in reading, math, and science (Figure O.7). Moreover, exam-based placements into general versus vocational secondary education (tracking), common in Europe, introduce an equity angle of TVET. In many EU MS, vocational systems do not provide a labor market advantage over general education graduates. Therefore, the tracking system that usually complements TVET in the European education systems could reproduce or even exacerbate existing inequalities, dampen social mobility, and weaken the social contract, particularly in changing market conditions. This is particularly important, as TVET students often come from disadvantaged backgrounds compared to their peers in general education (Figure O.7).
Through research and innovation education can produce the technology needed to curb emissions
Universities are a unique place for experimenta tion and learning and generating new knowledge and technological solutions for the green transi tion. Universities can support green innovation and technology development in different ways: through knowledge (from research) and new skills; by engaging in R&D and innovation partnerships with industry or public actors; and by supporting the transferring of new knowledge and technologies to industry and society (McCowan et al. 2021; Radinger-Peer and Pflitsch 2017).
Fostering academic entrepreneurship and the acceleration of spinoffs (from science and research institutions) is also an important channel through which universities can support green technology development and diffusion. Improving funding opportunities for technology development and early-stage funding for clean tech startups as well as incentives for academics to participate in such activities are key to this development.
In deploying R&D partnerships, new approaches and new mindset are required, notably regarding inter disciplinarity in research and strengthened collaboration with non academic actors (Trencher et al. 2014) and foreign organizations (Kwieck 2021). Delivering green innovation solutions often requires mobilizing a large range of competences and disciplines.
14 MAKING THE EUROPEAN GREEN DEAL WORK FOR PEOPLE
Source:
0 .1 .2 .3 .4 .5 De nsit y −10−50 5 Index of economic, social and cultural status 2018 General trackVocational track 0 .001 .002 .003 .004 .005 De ns it y 0200 400 600 800 PISA Math score 2018 General trackVocational track
Figure O.7: Difference in Socioeconomic Status and Learning Outcomes in EU Member States, TVET versus non-TVET Students
World Bank computations using PISA 2018.
Another way through which universities can support green technology development is through testing and demonstration of new solutions. By serving as “living laboratories” or test beds for new green technologies (for example, in renewable energy, sustainable construction, electric mobility, and urban smart grids, among others), universities can help assess the feasibility of innovations and their potential scalability to cities or industries.
The green transition requires improvements in skills training for technology adoption and ensur ing advanced human capital in future R&D proj ects and demands. In addressing these challenges, delivering the pool of STEM graduates is central. Likewise, a strategy for advanced human capital (MSc and PhDs) is critical in deploying and implementing large new research and development projects. Finally, enhancing international cooperation in education and research will be central for EU countries to fulfill new national and European policy commitments.
Universities play a crucial role in conducting research activities and transferring knowledge and new technologies to industry and public actors. As such, they can contribute meaningfully to addressing green innovation and transformation needs. Specifically, universities can contribute to green innovation through education (new skills); by creating new knowledge (from research); and by engaging in innovative partnerships with public, private, and civil society actors.
Finally, public research actors—both universi ties and public research organizations—have a ma jor role in facilitating the adoption of new green and sustainable technologies through social inno vation projects. This means supporting people and organizations to co-create, learn, adapt, and scale green solutions to social problems, such as working conditions, health, transport, and heating.
Education can create awareness and shift consumer demand for green products
Cultural barriers, particularly a lack of consumer interest and awareness, are significant barriers to advancing the circular economy in Europe (Eckert 2020). A high percentage of the population with only primary or lower secondary education is associated with a lower waste recycling rate. In contrast, tertiary education positively influences the recycling rate (Pelau and Chinie 2019). Improved education can facilitate the adoption of green technologies in multiple ways.
For instance, in Poland, the broad consensus of the need to reduce GHG emissions has been sup ported by teaching in schools. Climate change issues have been integrated into pre-primary, primary, and secondary school curricula, and higher education. The national report “Climate Education in Poland” (Education 2021) discusses tools used to present climate change issues in schools and analyzes basic requirements in education related to climate change. At the university level, the Warsaw-based Collegium Civitas offers an MBA course in climate and energy policy management, which presents the EGD as a long-term EU project. Climate education is provided in modern science centers, such as the Copernicus Science Center in Warsaw. And the national environmental strategy provides a comprehensive environmental climate and energy policy management. A 2021 opinion poll conducted by a national Center for Public Opinion Polls in Poland found that 74 percent of the population supported the goal of gradually leaving the coal-based energy sector, while only 19 percent felt that energy production should be based mostly on coal.
Incorporating issues related to climate change and green behavior into school curricula is a neces sity for all EU countries. While some related topics
15 Overview: A Human-Centered Green Transition
Universities play a crucial role in conducting research activities and transferring knowledge and new technologies to industry and public actors
are already included in most countries’ learning programs, they do not provide a sufficient basis for understanding complex global challenges. For EU students, the understanding of climate change, can be hampered by their understanding of science. While EU students report that the environment is critical, they also feel they cannot do much about it. For example, in PISA 2018 nearly 70 percent of 15-yearolds in Germany said that looking after the global environment is essential for them. Still, only around 40 percent said they could do something about the world’s problems. In Hungary, more than 80 percent of 15-year-olds worry about the global environment, but less than half feel they can do something about it. Thus, students will greatly benefit from learning about the green transition and global environmental challenges and being provided with tools to affect issues at the local, national, and global levels.
This underlines the importance of ensuring that students have a basic understanding of the science of climate change, of steps to encourage discus‑ sions and exchanges of opinions—together with fact checking—and of facilitating students taking local actions related to the environment. Education should be used to build ecology awareness in new generations. Learning about sustainable behavior should be incorporated across subjects and grades of study. After regular classes, the school infrastructure can serve as the cultural center for promoting a sustainable lifestyle and green transition for the broader society. This practical usage of assets demonstrates a sustainable way of thinking.
Efforts by educational programs to increase awareness of behavioral consequences, perception of environmental issues, and collective interest for common well being can encourage behaviors that contribute to reducing GHG emissions. Incorporating an increase in awareness of behavioral consequences in education programs can influence the adoption of green behavior (Minelgaitė and Liobikienė 2021). The value-belief-norm theory holds that values influence attitudes and responsibility toward environmental issues and pro-environmental
behavior (Minelgaitė and Liobikienė 2021). In addition, the literature shows that self-interest and interest in the well-being of others can influence green behavior, the latter positively and the former negatively. Environmental concerns have a positive and significant relationship with pro-environmental behavior (Mayekar and Sankaranarayanan 2019). Minelgaité and Liobikienė (2021) find that for Lithuania that in 2011, concern over others’ welfare and perception of environmental problems were the most positively influential on pro-environmental behavior. In 2020, self-interest and awareness of behavioral consequences showed a negative and significant impact. Similarly, Al Mamun et al. (2018) find that in low-income households, eco-literacy and self-efficacy influence attitudes toward green product consumption, and attitude and perceived behavior control influence intention towards green products. Tanner and Wölfing Kast (2003) find that proper knowledge to identify pro-environmental versus harmful products influences green consumerism. Furthermore, evidence shows that education related to environmental sustainability is related to substantial reductions in carbon emissions. If education that empowers students with knowledge and agency is not expanded to the millions of girls out of school in developing countries, society loses out on their valuable contributions (Kwauk and Winthrop 2021). Information dissemination and citizen involvement in green economy transition policy design are necessary to achieve long-term success and contribute to the fulfillment of EGD policies.
The focus of the EGD should be the wellbeing of people
Making the green transition sustainable requires addressing sources of household and worker dis‑ content. The EGD will reshape the spatial location of firms and jobs, and thus the concentration of wealth across European regions. This reconfiguration will have deep social implications, especially in the
16 MAKING THE EUROPEAN GREEN DEAL WORK FOR PEOPLE
Incorporating issues related to climate change and green behavior into school curricula is a necessity for all EU countries
context of the rising territorial polarization across Europe in the last decade or so. The interplay between inadequate local endowments and exogenous global trends could exacerbate this territorial polarization.
The EGD can accelerate the trend of increasing spatial divides. In the absence of the proper complementary HD policies, people in lagging regions can become increasingly reluctant to support environmental policies needed to reduce GHG emissions and decelerate climate change. In vulnerable regions, there is already evidence of a backlash against measures to save the planet. Therefore, the best approach for limiting the negative impacts in lagging regions is to apply place-sensitive measures that leverage each region’s socioeconomic potential for contributing to the achievement of environmental targets (Iammarino et al. 2019).
A just and successful transition to a greener economy will require substantial upskilling and reskilling of the current labor force. Policy actions are required in two primary areas to provide more effective career guidance. One is to strengthen the teaching and upgrading of foundational skills with a priority on socio-emotional skills, and another is to provide data-driven career guidance and targeted upskilling through ALMPs that facilitate transitions
between brown and green jobs and focus on increasing workers’ capacities and connecting workers to jobs (Bulmer et al. 2021).
Making the EGD effective requires laying the proper policy groundwork. While top-down approaches are necessary, the EGD alone cannot take EU countries through to a circular and more sustainable economy. A sustained and just transition requires national and subnational policies to be aligned and ready to support climate actions and human development measures in education, health, and social protection. Much more work needs to be done. There is ample evidence that the current fragmented human development policy frameworks in many high income countries—which consider, in a separate way, the needs of vulnerable groups, local risks, and funding and evaluation timelines—are inadequate to prepare societies for climate action (Panic and Ford 2013).
To restate this report’s central message: A sus tainable green transition is impossible without a successful human transition. Therefore, human development policies must be at the core of decoupling economies from natural resources, adapting individuals and societies for the new green economy, and mitigating the transition’s unintended consequences for everyone, especially the poor and vulnerable.
17 Overview: A Human-Centered Green Transition
THE EUROPEAN GREEN DEAL
1
This report is an attempt to explore human development’s role in making the green transition possible and at the same time serve to adapt society for a green econ omy and mitigate the unintended consequences of the European Green Deal (EGD). The report uses an analytical framework grounded on a general equilibrium model (GEM) to guide the discussion on possible EGD outcomes. It is structured in a way that addresses the three core objectives of the EGD. Throughout the report, data-driven evidence, simulations, policy analysis and best practices are employed to make a narrative in which the EGD represents opportunities that may not appear to everyone or in every region in Europe. To better inform policy dialogue, the report benefits from the evidence and discussion in four case studies on skills, research and development (R&D), green buildings and just transition in three selected countries: Croatia, Poland, and the Slovak Republic.1
The EGD can avoid previous transitions’ increased income disparities
The EGD can avoid the increased income disparities of previous transitions
Every transition towards a new equilibrium in the economy generates winners and losers, and, if not complemented with the right HD policies, the EGD won’t be an exception. The asymmetric impact of previous transitions such as globalization or technological progress increased income disparities in high-income countries. Between 1970 and 2016, the share of employment in occupations requiring mid-level skills in the United States (such as office clerks, sales associates, and production workers) declined, while the number of high- and low-skilled occupations rose or remained largely unchanged (Autor 2019). A similar pattern is observed in Europe
between the 1990s and early 2010s, with the number of occupations involving routine tasks decreasing throughout the period (Bussolo et al. 2018). This process of hollowing the middle can be partly explained by the transitions triggered by trade and technology; for instance, OECD countries that traded more with China also lost more jobs in the manufacturing sector, which are typically mid-level skills—and middle-income—occupations (Figure 1.1). The loss of manufacturing jobs contributed to the increase in per capita household income inequality—measured by the Gini coefficient—observed in 19 of the 27 EU member states between 1993 and 2019 (Figure 1.2).
Low‑ and middle‑class workers bore the highest costs of the trade and technological transitions in the United States and the EU, partly explained by insufficient or ineffective HD policies. This, in turn, had adverse political consequences. The rise in income disparities increased political polarization, promoted mistrust in institutions, and strengthened the support for protectionist and populist policies (Autor et al. 2020; Rodrik 2021). The emergence of political polarization in the United States and the EU can be traced back to the erosion of labor market opportunities for middle-skilled workers in manufacturing industries caused by trade liberalization and automation in the manufacturing sector (Autor et al. 2020; Rodrik 2021; Klein and Winkler 2019).
A more gradual phase in of the trade and tech nological transitions would have provided enough time for adjustment or a proper design of the right HD policies to protect the well being of at risk workers. But gradualism is not an option for a green transition that must be done. Therefore, education, health, and social protection systems, particularly in lagging EU MS and regions, must receive the resources and technical support needed to mitigate the impact of the transition on disadvantaged households. The remainder of this overview describes the HD policies that will enable the green transition, mitigate its short-term adjustment costs, and adapt households to a new, environmentally sustainable, equilibrium in the economy.
20 MAKING THE EUROPEAN GREEN DEAL WORK FOR PEOPLE
There is no green transition without proper human development policies that enable it

21
1. The European Green Deal
Figure 1.1: Change in Manufacturing Employment and Chinese Import Competition in OECD Countries, 1999–2007 (%)
Source: Dorn and Levell (2021).
Figure 1.2: Change in Income Inequality in the EU, 1993–2019 (Gini Coefficient)
Estonia Ir eland Hungar y Netherlands Gr eece Cr oatia Belgium Finland Latvia Bulgaria Luxembour g Romania Slovak Republic Sweden Czech Republic Cyprus Denmar k Ger many Austri a Lithuania Italy Slovenia Spain Portugal Poland France 15 10 5 0 −5 −10 −15 Gini Coe ff icient
Source: World Bank.
Two Questions, One Challenge
The planet faces a crisis. According to the Intergovernmental Panel on Climate Change (IPCC), the average global surface temperature has increased continuously each of the last four decades, with an estimated increase from 1850-1900 to 2010–2019 of 1.07 degrees Celsius likely caused by human activity (IPCC 2021a). Climate change is contributing to sealevel rise, an increased frequency of extreme weather events, encroachment on natural habitats that threatens a deterioration of biodiversity, and shifts in the sustainability of agriculture and aquaculture that threaten the livelihoods of a significant share of the world’s population. Due to climate change, by 2030 an additional 32 to 132 million people are likely to be poor (Jafino et al. 2020), global productivity is expected to be lower by an amount equivalent to 80 million full time jobs (ILO 2019a), and global health costs are expected to increase by US$2–4 billion (WHO 2021).2 In addition, the Climate Vulnerability monitor estimates that about 400,000 lives will be lost in the year 2030 due to climate related events (Thompson 2020). The expected further rise in global temperatures beyond 1.5 and 2 degrees Celsius above pre-industrial levels, with temperatures in Europe expected to rise by more than the global average (IPCC 2021b), has calamitous implications for human welfare.
This report addresses the role of human devel opment in enabling the green transition. The challenge imposed by climate change triggers two questions. Climate change is a challenge that is increasingly driving the development agenda. The policy discussions, and more importantly, the decisions that supra-national entities, international agreements, and individual countries take, represent a most needed climate action. That is the first question that climate change triggers: what to do about it? This report aims at addressing that question from the perspective of human development. The green transition can be described as a move towards an economy that results in human well-being, social equity, efficient use of natural resources, and reduction of environmental risks (United Nations Environment Programme [UNEP] 2011). There is no green transition without proper human development policies that enable it. Human development policies are needed to develop an education system that is linked to labor market needs to provide the skills needed for a green transition. And human development policies are also needed to support an innovation system that delivers the indispensable technology to curb emissions or reduce waste and resource consumption.
Just as importantly, the report also addresses the second question: how to deal with the green transi tion’s unintended consequences. Climate action in general, and the EGD in particular, impose on society a number of policies that while providing an incentive for change, also restrict both firms’ and workers’ actions. Curbing emissions through carbon caps is one example in which restrictions will induce change. At the same time, the European Union’s (EU) financing mechanisms and policies aim at reducing the impact on individuals and lagging regions. There is, however, a transition cost while firms adapt their mix of factors of production, and workers acquire the necessary skills for the green economy. Some firms, unable to adapt, and some workers vulnerable to labor market demand changes, will probably lose in the transition. This report also addresses the second question: what to do about those unintended consequences? These unintended consequences stemming from a much-needed green transition, can only be addressed through human development policies. Upskilling and reskilling of workers, technology transfer and absorption, social assistance and safety nets, active labor market policies, and support for mental health will all be vital for the transition to be sustainable in the long run. Costly transitions can lead to widespread discontent. In as much as the EGD depends on member countries’ willingness to act and comply, the green transition depends on tackling that discontent.
The European Green Deal
The European Union established the EGD to ad dress climate change. The goals of the EGD are to: (i) reduce green-house gas (GHG) emissions to no more than 55 percent compared to 1990 levels, (ii) decouple the economy from natural resource consumption, while (iii) leaving no person or place behind (see more details on objectives, actions, and policies in Figure 1.3). Reducing GHG emissions requires an effective EU emissions trading system, improvements in the energy efficiency of consumer products and of housing, more use of renewable energy, and reduced emissions from road transport, agriculture, and land use. Achieving a circular economy will mean reducing waste and finding new uses for it. Leaving no person or place behind will require policies to redress the adverse impacts of rising energy prices, restrictions on fossil fuels, and shifts in the demand for skills for some households and regions.
22 MAKING THE EUROPEAN GREEN DEAL WORK FOR PEOPLE
Figure 1.3: EGD’s Objectives, Actions, and Policies
Human development sectors will play a critical role in supporting the EGD and reacting to changes in economy and society as a consequence of EGD policies. The green transition implied by the EGD would require massive efforts to improve skills (discussed in the parallel case study for the Slovak Republic), to bolster R&D (exemplified in the parallel case study for Poland), to effect changes in consumption habits and supporting infrastructure (e.g., retrofitting buildings for energy efficiency, the subject matter of the parallel case study for Croatia), to facilitate job transitions (see Poland’s Just Transition case study), to provide income support for workers adversely affected, and to address the challenges faced by lagging regions.
Enabling the Green Transition and Addressing the EGD’s Unintended Consequences
HD sectors can contribute to the green transition by reducing the use of fossil fuels and of waste in their own operations. Reductions in the use of energy and greater reliance on renewables in schools and health facilities can make a substantial contribution to meeting emissions targets while improving health and creating jobs. Adopting green medical waste management (MWM) and digitizing HD delivery systems could increase the efficiency of use of materials. Improvements in the sustainability of water systems, including the management of

23 1. The European Green Deal
Cor e Objectives Actions Policies Climate Energy Agriculture Zero net GHG emissions by 2050 Decouple economic growth Leave no person or place behind Industry Environment & Oceans Transport Finance & Regional Development Research & Innovation
Source: Based on European Commission’s information and EC (2022).
rainwater and stormwater, could help to mitigate climate change risks.
HD policies can play an important role in shift ing demand to green products. Education at all levels, including the training of HD professionals, should incorporate information on climate change and sustainable behavior into curricula. Accreditation requirements should promote health providers that are aligned with the EGD. Green behavior, referred to as actions that avoid harm to the environment as much as possible or benefit the environment (European Commission [EC] 2012), in adults can be encouraged through social assistance programs and investments in communications networks, coupled with labor regulations that provide for flexible work arrangements. Procurement policies could prioritize EGD-compliant suppliers and lower social health protection co-payments could be charged if providers are aligned with the EGD.
Transition to a carbon neutral economy (CNE) will have unintended effects that will adversely affect the poor and vulnerable. Increasing the price of fossil fuels will increase the prices of food, heating and transport services, which will particularly affect the poor. Land-based mitigation policies like reforestation can reduce land available for food production, threatening the food security of poor households and the livelihoods of poor workers. Many workers in energy-intensive industries could lose their jobs. The green transition will increase the returns to skills, as explained above, thus reducing the relative earnings of low-skilled, and predominantly low income, workers.
Strengthening education and training at all lev els is essential to moderate the adverse effects of the green transition. Improving foundational skills through basic education makes it easier to learn new tasks, which will be critical for the green transition.3 Adult learning of foundational skills should focus on correcting gaps in particular skills, rather than providing general education classes. Government
support for training will have to expand to meet increased demand, particularly since employer-funded training typically focuses on the skills required for the current job, while many workers will require new skills applicable to green jobs. Young workers with low skills and experience will face particular challenges. Combining apprenticeships with some traditional courses can help them gain practical experience and strengthen foundational skills. Lessons for active labor market programs for the green transition may be gleaned from programs targeted to workers displaced by other economic shocks, for example trade liberalization.
Government provision of job‑matching services will play an important role in mitigating the ad verse impact on low skilled workers. Such programs will need to undertake in-depth evaluations of workers’ skills, provide information on the skills required for transition to green jobs, facilitate access to required training, and cooperate closely with training providers and employers. Monitoring activities, for example analysis of job trends by region, could identify skill gaps, which would be taken into account in developing training programs and guide workers’ expectations on emerging jobs.
Training and support for workers adversely af fected by the green transition should consider the problems affecting lagging regions, which the green transition is likely to worsen (see below). Addressing large scale job loss may require a coordinated package of cash assistance, employment and training schemes, and community-driven development projects. Surveys of the skills composition of workers would be helpful in allocating training resources across lagging regions. Investments in distance learning and technologies to facilitate cooperation between innovation centers and lagging regions, complemented by in-person research exchanges, can help increase capacity in lagging regions. Training in digital skills and improving access to digital technology in lagging regions would facilitate work at a distance.
24 MAKING THE EUROPEAN GREEN DEAL WORK FOR PEOPLE
HD sectors can contribute to the green transition by reducing the use of fossil fuels and of waste in their own operations
Disruptions to people’s lives due to the green transition will require changes in health services. Organized screening programs and new technology that will make personal health monitoring more effective can improve preventive medicine and make treatment timelier. Changes of profession and/or residence, perhaps coupled with reduced incomes, will increase the need for physical and mental health support. And employment disruptions will increase the importance of government support in ensuring that everyone has adequate social health protection. Climate change will exacerbate health problems and increase the frequency and severity of weather-related shocks that could degrade health infrastructure. Agile technology can play a role in helping the health care industry to cope with environmental changes. The urgent need to finance even EGD policies should not come at the cost of reducing resources to essential health services.
The green transition will present considerable challenges to social assistance programs. Substantial investments in information systems, for example social registries, will be necessary to identify vulnerable households. Assistance to households who cannot adequately heat or cool their dwelling should not encourage greater consumption of fossil fuels, which can be achieved by providing unconditional cash assistance rather than direct subsidies to utility bills and helping poor households to achieve energy savings or increase reliance on renewables. The funds generated by the removal of fossil-fuel subsidies and the imposition of carbon taxes could be used to offset the disproportionate burden of these policies on the poor. Addressing massive layoffs may require combinations of unemployment insurance, severance or other forms of termination payments, early retirement incentives and social assistance. Such programs need to be carefully designed and targeted to avoid work disincentives effects. Finally, paying individuals to provide environmental services, for example cash assistance tied to land use and conservation, and directing public works programs to
environmental goals, can both support vulnerable households and contribute to the green transition. The EGD will require substantial funding. Overall, the EGD is estimated to represent EUR 1 trillion (around US$1.1 trillion) in investments, which represents around 7.2 percent of the EU’s 2020 GDP. The Next Generation EU (NGEU) plan, which will provide an anticipated allocation of EUR 806.9 billion for recovery from the pandemic, will allocate a portion of these funds to achieve EGD goals. Each EU member state was required to designate at least 37 percent of the planned investment towards the green transition, and 30 percent of the NGEU funds will be allocated as green bonds. Funds will be made available to assist regions and sectors that now rely on carbon-intensive and fossil fuel related industries, including through the Just Transition Fund, the Modernisation Fund, and the European Investment Bank. Nevertheless, private sector support will be essential to fill the estimated financing gap of €2.5 trillion. Private sector green finance could be increased by strengthening the knowledge of government regulatory bodies to facilitate green project implementation and informing local financial actors on the opportunities in climate-resilient sectors.
The Circular Economy
Global growth over the past century has relied heavily on the consumption of materials. Every one percent increase in global GDP was associated with a 0.8 percent rise in the consumption of materials, and the extraction and processing of materials accounted for about half of global GHG emissions and over 90 percent of biodiversity loss. By contrast, economic growth in the EU over the last two decades was decoupled from material consumption: between 2000 and 2020, the EU economy expanded by 22.5 percent while domestic material consumption (DMC) dropped from 6.5 gigatons to a little over 6. This was mainly due to the decreased
25 1. The European Green Deal
The report also addresses a second question: how to deal with the green transition’s unintended consequences
consumption of fossil fuels, as non-fossil energy materials per capita decreased only marginally in the EU and increased in several EU member states.
Countries that achieved high and very high hu man development also exert greater pressure on planetary boundaries. Countries that have ranked high and very high (above 0.7) on the United Nations Development Program’s Human Development Index (HDI) also have relatively high CO2 emissions and material footprint per capita. Adjusting the HDI to account for the use of materials and CO 2 emissions considerably reduces the ranking of those previously at the top. This underlines the importance of new economic models that aim to shift the focus away from economic growth to take into account its impact on human welfare and the need to mitigate and adapt to climate change.
The European Commission has adopted a com prehensive plan to transition to a circular economy. The circular economy (CE) refers to the systematic recovery and reuse of products and materials by minimizing the extraction, consumption and disposal of natural materials and maximizing resource efficiency. The transition to a circular economy is projected to significantly reduce greenhouse gas emissions and externality costs related to manufacturing, mobility, and built environment systems; reduce European countries’ dependency on imports, making them less exposed to potential disruptions to supply chains; generate a net employment increase of about 0.3 percent in the EU by 2030 (the impact on employment differs across sectors, however); and improve both mental and physical health by assisting to regulate local climate, noise, air and water pollution, as well as creating spaces that encourage active and healthy lifestyles.
Transition to a CE also will entail risks, with varying impact across communities and house holds. The expansion of waste treatment will expose more workers to hazardous materials, such as chemicals of concern (common in e-waste), food packaging fire retardants, and bio-waste compost. Communities and individuals that rely on products and
industries that will be subject to higher taxes or stricter regulation may suffer job losses. The circular economy will entail changes in demand for skills, and the variance in adult participation in education and training between member states may indicate varying capacity in supporting workers to adjust.
The adoption of the CE has been slow and var‑ ies across member states. CE sectors and economic activities account for less than one percent of the EU’s GDP and less than two percent of total employment, with moderate variations across member states. Despite outperforming all other regions in the world with regards to e-waste management, only three EU countries met the 2019 target of collecting 65 percent of waste from electric and electronic equipment while 3 countries have yet to meet the 2016 target of 45 percent. Part of the problem in transitioning to a CE, lies in relative prices: firms still find it cheaper to use raw materials than to reuse waste materials (World Bank, 2022a).
Principal components analysis can be used to gain insight into the relative progress of EU coun tries in meeting the requirements of the circular economy. Indices are calculated to represent performance on three categories of the CEAP monitoring framework: waste management, production and consumption, and the trade and use of secondary materials. Adjusting rankings on the human capital index, where EU countries score quite high, by these three indices reduces the relative ranking of EU countries to near the bottom of the scale.
A Just Transition to CE in the EU requires simi‑ lar changes in education, social safety nets and health monitoring as discussed above. Educating students of all ages about environmental objectives, individual material footprint, and the need to shift away from the linear mode of consumption would encourage behavior consistent with the circular economy. An expansion of social safety nets and incorporation of climate-vulnerability in health financing risk pooling processes will be necessary to ensure that the burden of efforts to promote circularity will not fall on the poor through worsening
26 MAKING THE EUROPEAN GREEN DEAL WORK FOR PEOPLE
Human development policies can play an important role in shifting demand to green products
working conditions and shifting health impacts, reduced livelihoods, or job losses. And efforts are necessary to monitor the potential health risks associated with the transition to the CE, particularly for communities close to recycling centers or landfills, and to strengthen occupational health and safety measures, particularly in waste management, working practices and energy generation. Finally, higher education institutions should be encouraged to undertake research to support the transition to the CE, particularly quantification of the impact of the transition, means of extending the life of products, circular design manufacturing, and disposing of materials.
Asymmetric Impacts of the EGD Exacerbated regional inequality
The EGD could have a significant impact on the distribution of income across regions and individ uals. Regions that rely heavily on the exploitation of fossil fuels, energy-intensive production or on the linear production model, many of which already have lower-than-average incomes, could fall further behind. And shifts in demand for skills driven by the green transition could lead to job losses and declines in the relative income of lower-skilled workers.
The significant differences in per capita in comes and growth across EU regions could be exac erbated by the green transition. The phasing out of brown energy will adversely affect regions dependent on coal production, which tend to be located in lagging and poorer regions in the EU. Employment reductions in steel and other industries dependent on coal, or more broadly of high energy intensity, will further erode incomes in vulnerable regions. Perhaps even more seriously, the green transition will accentuate the locational advantages of richer, more dynamic regions with large pools of highly skilled workers, specialization in related economic fields, and high-quality infrastructure and facilities. Rising demand for skilled workers driven by the green
transition will lead to large flows of skilled workers to these favored regions, reducing the supply of skills in lagging regions and rendering the adoption of climate mitigation policies and cutting-edge green technologies even more challenging.
Women and girls are key players in facilitating the transition to low carbon economic growth, however they face challenges that could reduce their potential contributions. Kwauk and Braga (2017) discuss how weather-related extreme events affect women and girls in particular ways such as diverging them from education when needing to spend time getting water or leading them to premature marriage in order to reduce household resource scarcity. These situations impact girls’ skill-building and can negatively affect their important role as change agents towards an environmentally sustainable economy. Furthermore, IRENA (2019) suggests that greater participation of women in growing sectors adept to the policies in the EGD, such as the renewable energy sector, represent an opportunity to promote fair distribution of socio-economic benefits arising from the green economy transition. If women and their perspectives are excluded from appropriate skilling and renewable energy development, their engagement and valuable contributions can be compromised. Furthermore, these challenges are further exacerbated by systems that obstruct combining work-family life.
The implications for lagging regions in the ab‑ sence of support policies are dismal. Demographic decline and brain drain could reduce local government revenues and the quality of staff, impairing the ability to design and implement development strategies. Investment could shift towards regions and cities with higher levels of infrastructure, skills and governance, further depressing the demand for workers and productivity in lagging regions. The winners from green transition policies are likely to be already prosperous urban regions, and the losers the already weaker regional economies that will suffer from outflows of capital and talent.
27 1. The European Green Deal
The significant differences in per capita incomes and growth across EU regions could be exacerbated by the green transition
The relative decline of lagging regions will be accentuated by three additional factors. The more favored regions will be better placed to specialize in green technologies and renewables because they already are more highly endowed with knowledge related to the green economy. Green technologies are frequently located on the technological frontier and tend to require a wider range of competencies that are often far from traditional know-how, while green skills normally involve a greater intensity of non-routine skills. Thus, more innovative regions, which tend to be the richer and more dynamic ones, will be in a better position to develop green technologies. And lagging regions tend to have poorer governance, which will further impair their ability to attract investment in green activities.
As incomes and opportunities deteriorate in lagging regions, support for addressing climate change could decline. Opposition to the free mobility of capital and labor, or economic integration in general, already is on the rise, particularly in regions that have experienced years of decline and perceived neglect, and among workers adversely affected by foreign competition. The rise of support for anti-establishment parties, who often champion anti-green policies, could ultimately prevent the implementation of the EGD.
Place sensitive policies are essential to address the negative impact of the green transition on lag ging regions. Such policies should take advantage of each region’s attributes, to determine how that region can benefit from green investments. Spatially blind policies would result in green investments being dominated by richer, more dynamic regions, while place-based initiatives with little central direction could run into implementation bottlenecks due to low capacity in the poorer regions. Instead, place-sensitive strategies should be differentiated by regional attributes and marked by strong coordination across governance levels (to reflect both local
knowledge and EU-wide objectives) and with integrated activities (given the multi-dimensional effects of the green transition). It is critical to tailor the mix of incentives and regulations used in furthering the green transition to local contexts. Given the novel challenges in implementing the EGD, learning from regional peers will be crucial to identify best practices. And investments in institutional capacity, particularly in lagging regions, and coordination mechanisms that assign roles and responsibilities among stakeholders and across government levels, will be essential for effective implementation.
Skills and income inequality
Workers in green jobs tend to be more skilled com‑ pared to workers in brown jobs. Green jobs tend to require higher proficiency levels of all types of skills than brown jobs do, as indicated by significant differences between the distribution of levels of numeracy, literacy and problem solving (from the PIAAC survey) across brown and green jobs.4 Workers in green jobs tend to use skills at work and at home more often than workers in brown jobs do. The skills gap between brown and green jobs is mostly driven by the greater years of schooling among workers in green jobs, as well as the more frequent usage of skills by workers in green jobs. The return to skills tends to be higher in green jobs than in brown jobs: for the case of Poland, estimating the relationship between earnings and an index for skills, an indicator of the greenness of jobs, and an interaction term between skills and the greenness of jobs, shows that the significantly positive relationship between skills and wages is stronger in green professions.5 The shift in demand towards green jobs will therefore mean rising demand for high-skilled versus lowskilled workers, leading to a deterioration of income distribution across the EU. Training workers in higher and greener skills will be essential to help address this.
28 MAKING THE EUROPEAN GREEN DEAL WORK FOR PEOPLE
Identifying the transition paths with the smallest differences between the skills required for brown versus green jobs would reduce the investment required to move from a brown to a green job
Identifying the transition paths with the small est differences between the skills required for brown versus green jobs would reduce the invest ment required to move from a brown to a green job. Using similarity indices (task-level) along with the PIAAC data (skills-level) allows to pinpoint the occupations with the most feasible brown-to-green transition. Poland is an example of brown-to-green job transitions (Figure 1.4). Environmental engineers
tend to possess higher or similar skills than workers occupying similar jobs, and at the same time are paid less. This mismatch would make it very difficult to meet the growing demand for environmental engineers by retraining workers from similar occupations. It could be achieved by applying a policy mix aimed at human resources development and wage subsidies (e.g., by recycling carbon tax income).

29 1. The European Green Deal
Figure 1.4: Green Job Transition Example from Poland
Note: Color represents green core index (0.1: e.g., Crisis management officer, 1: e.g., Wildlife or environmental conservation warden), values on edges reflect similarity scores, numbers in bubbles refer to major occupation groups.
2
ECONOMIC DYNAMICS AND POTENTIAL IMPACTS
This chapter aims at understanding the dynamics that lead to changes in the economy that result in a green transition and human development challenges. With the objective of pinpointing the transmission mechanisms that allow for policies to move the economy from a carbon-based (‘brown’) to a carbon-neutral (‘green’), the chapter conveys the main mechanisms that produce change. To do so, the chapter’s first section highlights the key elements in the Human Transitions General Equilibrium Model (HTGEM). The HTGEM is the main analytical framework that shapes the report (see Annex A for details on the HTGEM). The salient feature is that relative prices in both, the goods and services market, and factor markets, result in asymmetrical impacts for firms, households and regions. The report then turns to translating the HTGEM to a System Dynamic Model (SDM) in order to estimate potential impacts in the economy with the premise that SDMs have a clear advantage since they, unlike Computable General Equilibrium models (CGE) do not assume that markets clear. The simulations based on the Vensim version (an SDM tool) of the HTGEM, can provide potential changes with respect to the business as usual (BAU) scenario.
Economic Dynamics in the EGD
The HTGEM model and the EGD’s objectives shape the structure and analysis in the report. In order to address climate change challenges, the EU established the EGD to (i) reduce green-house gas (GHG) emissions and (ii) decouple the economy from natural resource consumption. In doing so, the EU, aware of potential externalities, also aims to (iii) leave no person and no place behind. The EGD’s first two core objectives represent a policy-induced
shock to the economy, while the third objective targets some of the possible distributional impacts of the EGD’s reforms. These core objectives are important to understand the EGD and the shock it represents to the economy, and it is also one of the two factors that shape the structure of the report. The other shaping factor is the HTGEM model (see Annex A for details) that presents changes in the economy as a consequence of changes in relative prices.
The EGD’s first two core objectives are in fact a vector of policies organized around eight actions. Most of the changes in the economy and society as a consequence of these policies require that human development sectors are prepared to act on these changes. The green transition implied by the EGD would require: (i) skills necessary for R&D (exemplified in the parallel activity and case study for Poland); innovation, product redesign, adapting consumption (e.g., retrofitting buildings for energy efficiency, the subject matter of the parallel activity and case study for Croatia); (ii) a labor market that is able to respond to technological change; and the (iii) health perspective to implement some of the EGD actions (e.g., farm to fork). Human development emerges then as an enabling factor for the green transition. In fact, the report emphasizes, earlier in chapter 1, that there is no green transition without a human transition.
The EGD actions’ impact can lead to changes in technology, skills and behaviors that will shape consumption demand, firms’ choices, and workers’ preferences, but they can also lead to asymmetrical impacts in the population. These are the main factors that the report highlights throughout. To do so, the report’s analytical framework is based on the HTGEM to better understand the interplay between the economy adapting to a new economy, the environment’s improvement as a consequence, the changes in consumption behaviors, and the impacts
31 2. Economic Dynamics and Potential Impacts
The EGD can lead to changes in technology, skills, and behaviors that will shape consumption demand, firms’ choices, and workers’ preferences, but they can also lead to asymmetrical impacts in the population
on the skills, the labor market and the health of European Union (EU) citizens. The GEM’s main transmission mechanisms are relative prices in both the goods and services market, through ‘green’ economy prices relative to the traditional ‘brown’ (traditional) economy. Similarly, in the labor market, once technological change starts and firms change labor demand, relative prices will trigger skilling preferences by workers. The HTGEM computation strategy employs its equations in an SDM environment. The advantage of this strategy is that it avoids some of the most restrictive assumption in CGE models: that markets clear at any given time.
The SDM version of the HTGEM simulates how EGD policies can have an effect on the envi ronment, the economy and on inequality. The EGD employs six sets of policies to limit GHG emissions to 55 percent compared to 1990 levels. The so called ‘Fit for 55’, requires among other things an EU emissions trading system that works, introduction of actions to improve energy efficiency at the level of products that consumers have access to, and improvements in housing quality to make better use of energy. It also means more use of alternative energy sources, and new targets for CO2 emissions from transportation, among other actions. Taken together these actions will impose restrictions on how energy is produced and how it is consumed. But it is not only about energy. Actions under the EGD will also steer the economy into designing products in such a way that waste is avoided, finding new uses for waste, and a general move towards a circular economy. In chapter 2, the GEM-based SDM in the report will produce simulations for the effects on: (i) the environment, (ii) production, (iii) consumption, (iv) skilled vs unskilled workers, (v) the labor market, and (vi) wages. The idea is to present the reader with a set of potential challenges that HD policies can address in the following chapters (chapters 3 through 5).
On the side of the consumers, they will have a choice of products that will be restricted by
regulations on energy efficiency, and products that reduce the amount of waste, but ultimately the move to a carbon neutral and circular economy still requires that consumers’ behaviors change. Without that, as demand for products that comply with the new green and circular economy increases, their prices could also increase. As the demand for carboneconomy products wanes, their prices will also decline, and relative prices in the goods and services market may increase in a direction that will make consumers think about replacing part of their consumption with carbon-based products (see HTGEM details in Annex A). Subject to regulations, that change in relative prices can make long-run equilibria unstable, as further demand for carbon products readjusts relative prices and makes demand swing back and forth to products from the two economic models. That is particularly true if trade with other countries allows it, even with a trade policy that in theory requires trading partners to subject themselves to similar standards to those in the EU. Trading partners of the EU in the developing world may have even greater hurdles to overcome to implement the requirements imposed by the EGD’s trading policy. The level of oversight to carry out that policy may limit the number of products—or the extent to which they are—that are truly ‘green’ and circular. Thus, as later explored in this report, one of the binding constraints for long-run stable equilibrium is a change in consumer behavior.
At the same time, the EGD’s set of policies will act both as a restrictor and an enabler of behavior. On the one hand, policies aiming at curbing emissions and limiting waste will restrict firms’ production processes and product design. To reduce emissions, firms will have a decision to make: pay for the cost of their emissions through the European Trading System (ETS) or change their technology. The former will ensure that total emissions are capped and so one firm’s decision to pay for its pollution will increase the cost of other firms’ emissions—as the amount of
32 MAKING THE EUROPEAN GREEN DEAL WORK FOR PEOPLE
Technological change, and more particularly innovation, is at the heart of the solution, but it will also trigger some challenges in the labor market
concentration in space
emissions available for production wanes. The latter will confront the firm with a decision to opt for cleaner technology. For the economy as a whole, the collection of firms that decide to alter their capital-labor ratio through technology, will represent a process of capital deepening that entails productivity gains at both levels, the firm and the economy (see HTGEM details in Annex A). Cleaner technology will help achieve the EGD’s intended objective. Similarly, restrictions on material use, such as plastics, will represent another challenge for the firm; to redesign products to limit waste. For the economy as a whole, those actions at the level of the firm will contribute to the EGD’s objective of decoupling the economy from natural resource consumption.
Technological change, and more particularly in novation is at the heart of the solution, but it will also trigger some challenges in the labor market. Firms will either innovate with new technology or new and redesigned products and processes, or they will adapt to the emerging technology by absorbing it into their processes. But at the same time, these firm-level decisions will alter relative prices in the labor market. The GEM (HTGEM) employed in this report considers that market structures can differ from perfect competition. In fact, the HTGEM requires other market structures such as oligopolies and monopolistic competition so that product differentiation and the market power exerted by innovation are possible and give way to the kind of technology that is required by a green transition. The model does not require all firms to innovate, but to participate in technological change by adaptation, transfer and absorption of technology. However, the closer a firm is to the innovation frontier in the market, the more likely it is to innovate or adapt to the new technology. Those firms able to transition to the green economy are most likely to be located in leading regions in Europe where firms benefit from a pooled labor market of skilled workers, the backward and forward linkages across firms and the knowledge spillovers that yield productivity gains external to the firm. Technological change would then lead to further concentration in space. Capital in the form of technology will continue to concentrate in firms (closer to the technological frontier) located in
successful places (see HTGEM details in Annex A). Backward and forward links across firms will ensure that technological change occurs throughout these successful firm ecosystems.
As technological change occurs, labor demand will favor the employment of higher skills compat‑ ible with the new technology. The resulting widening of the wage gap between skilled and unskilled workers will provide incentives for workers to upskill and integrate into the new green economy, and for new entrants in the labor market to choose their skills/education accordingly.6 With regard to infrastructure, retrofitting buildings, among other activities, will still require some degree of unskilled workers. The model doesn’t assume that unskilled workers’ demand will fall and in fact the simulations in chapter 2, show an increase in wages stemming from labor demand, for both sets of workers; however, the wage gap continues to expand, before it actually contracts—depending on the scenario. The incentives will also be for workers in lagging regions—particularly but not exclusively for skilled workers—to migrate to leading regions where wages will rise. As workers migrate and send remittances back home, reservation wages in lagging regions will rise. Firms in lagging regions will be confronted with a dual challenge: trying to bridge the technological gap with limited available skills, and rising reservation wages. These technology-induced changes will lead to uneven distributional consequences in the form of further household and regional inequality (see HTGEM details in Annex A).
In the context described above, human develop ment policies are one key instrument that can be used to adapt individuals to the new economy. Chapter 3 of the report aims at exploring the sets of policies that can help individuals adapt to the green transition. On education, the system’s response to a new set of skills not only at the tertiary, but secondary level to meet the demand by technology will require the use of new and traditional education policies. Foundational skills and policies to ensure them will also be even more relevant in the new economy as evinced in chapter 5’s skills’ analysis. This is the discussion framed in the parallel activity and casestudy for the Slovak Republic. Quality education for
33 2. Economic Dynamics and Potential Impacts
Technological change would then lead to further
women, and especially girls, will be important as it provides the green skills necessary in order to take on jobs in emerging sectors highly dominated by men, in addition to equipping them with skills that increase their adaptive capacity for climate change (Kwauk et al. 2019). For workers already employed, the changing labor demand will require active labor market policies (ALMPs) to reskill and adapt to a green economy.
HD policies will need to intentionally address the particular challenges stemming from the EGD. The challenge is not only to use traditional ALMPs, but to do so considering occupational pathways to green jobs as stated in the occupational/task-based analysis of pathways in chapter 5. Health policies will contribute to healthier lives as air quality improves and leads to greater productivity. But challenges on the focus for health services—particularly for those who have difficulty adapting to the new economy— may remain for policy makers to address.
HD policies will also be crucial to mitigate the unintended effects of the EGD. Adaptation policies can go a long way in reducing the overall impact, but some of the negative externalities of the EGD might be unavoidable. Job losses are likely in sectors that will have to change, such as energy. Coal mine closure jobs will at least partially be compensated by gains elsewhere, such as renewable energy production. However, coal miners will likely require some adaptation to work in other energy production jobs or in non-energy sectors. Job losses will not be limited to coal production but might be more widespread. This is the discussion that the parallel activity, the Poland case-study on Just Transition, takes on. While adaptation policies will help, some
workers might be left out of the labor market. Mitigation policies involve adapting social protection systems to accommodate those workers that lose out in the transition. However, just as importantly, genuine stakeholder consultation from the outset (planning stage) and throughout the process can significantly reduce the possibility of social conflicts (World Bank 2018a). Health policies, both physical and mental health, will be paramount in helping workers cope with a transition that may impinge on their employability, family situation and potentially their access to health care. Chapter 3 also addresses these and other policies that mitigate the impact of the EGD. The chapter also includes policy analysis on preparedness for the green transition for the EU and three countries selected for case studies.
Human development is also crucial to achieve other objectives in the EGD. To decouple the economy from natural resource consumption, Europe also needs to transition from a linear to a circular economy. Chapter 4 in the Regional Report discusses why reducing waste in the first place is paramount, and how repurposing and recycling continue to be important. These activities involve innovation and skills to improve product design and limit the resulting waste from production processes. Similarly, effective recycling and repurposing requires the necessary skills and technology. Chapter 4 looks into ways in which HD is an enabler of such circular economy transition, and what can be done to mitigate the negative effects of linear-economy workers losing out in the transition.
Asymmetrical impacts will require a mix of ad aptation and mitigation policies for individuals
34 MAKING THE EUROPEAN GREEN DEAL WORK FOR PEOPLE
Labor demand will favor higher skills compatible with the new technologies. The resulting widening of the wage gap will provide incentives for upskilling and reskilling
Human development policies are one key instrument that can be used to adapt individuals to the new economy
and regions. In order to fulfill the core objective of leaving no one and no region behind, the EGD’s regional development fund and the private sector financing leveraging mechanism would provide some relief, but more will likely be needed. On the individual side, chapter 5’s analysis will shed light into occupational pathways for workers to transition to a new economy, coupled with adaptive social safety nets, so that impacts on individuals can be addressed. Regions are important not only to fulfill one of the EGD’s three core objectives, but fundamental to the EGD’s long-term sustainability. Chapter 5 documents exacerbated regional inequalities and identifies regions vulnerable to negative externalities caused by the EGD. The chapter discusses policies that can supplement compensatory mechanisms and help regions integrate in the green transition. Chapter 5 argues that failure to care for lagging regions may increase rising latent discontent, that through politics could jeopardize the EGD objectives as a whole.7
Box 2.1: SDM Literature
System Dynamics to Simulate the Changes in the HTGEM
The SDM version of the HTGEM focuses on the main elements driving the effect of green policies on the economy. The SDM simulations that will be presented are not prescriptive. The SDM, like our GEM (the HTGEM), is also based on a number of modelling assumptions that present their own limitations (see full details of the SDM in Annex B).8 Nevertheless, the SDM approach is still a reliable option to identify the problem, to model policies’ effects (see Box 2.1 for a detailed discussion on SDMs), and leading to results that can contribute to the policy discussion (UNEP n.d.).
The SDM version of the HTGEM incorporates the equations in the latter through interconnected modules. The SDM then connects all the relevant variables to two modules of production: one for the
SDMs are used for ecological economic systems and energy transition systems modelling because they avoid some of the restrictions in CGE. Uehara et al. (2015) use a SDM that starts with a GEM and uses a stock and flow diagram to model two separate forms of production that require certain amount of capital, natural capital and labor. However, this model does not consider simulations regarding changes in its variables, the introduction of variables that may favor green production forms or any form of differentiation between the types of labor that may be required in the two forms of production that it explores. On the other hand, Blumberga et al. (2021) and Wu et al. (2021) on energy transition use stocks and flows and consider two forms of production: brown and green. However, these models do not take as foundation or derive in structuring a GEM and do not consider variables related to market structures following labor types, labor mobility between countries or capital. Furthermore, efforts beyond energy transition and ecological economic systems have been made to model the green transition represented by the EGD through SDM. Such efforts are reflected mainly in the work of Bassi et al. (2021) and Barbieri et al. (2021). The first of them is based on a literature review directed towards exploring the key elements considered within EGD in order to model them through the use of Causal Loop Diagrams (CLD) in Vensim. The model considers variables related to smart mobility, employment, consumption, GDP, waste generation, among other relevant variables for the implementation of the EGD. Subsequently, the authors take the developed model to carry out simulations and structure the conceptualization of a GEM. Although the model is used to identify the main indicators of the analyzed system, conceptualize the existing interconnections among these indicators and explore emerging dynamics of change with the use of feedback loops (Bassi et al. 2021), it also has the limitation of using a CLD instead of stocks and flows. According to Aronson and Angelakis (2018), stock and flow models take the analysis to a higher level of rigor as this type of models allow to distinguish between types of variables that are stocks, flows and parameters. It is not possible to make such distinction in a CLD, deriving in an enhanced comprehension of the system when it is modelled using stocks and flows.
The work of Barbieri et al. (2021) follows the same structure as the work of Bassi et al. (2020) since it takes the same CLD as a starting point, and produce a GEM based on the results. To build their scenarios, Barbieri et al. (2021) take a BAU scenario as reference and develops scenarios with carbon tax and recycling mechanisms. Even though the model recognizes the importance of employment, it does not consider skilled or unskilled labor in its variables, labor mobility or upskilling of the available workforce as it is structured and simulated by applying its scenarios to the European case and not to a particular country. Furthermore, it does not consider differentiated production forms regarding green and brown productions, which has an impact over required green resources for each form of production, required capital investment and demanded labor for each one of them.
35 2. Economic Dynamics and Potential Impacts
green economy (Production1) and another for the brown or traditional economy (Production2). Both models result in consumption and waste but with different assumptions, while the green economy decreases waste over time, the brown does not (see Figures 2.1 and 2.2 for examples focusing on the brown and green economies respectively). These dynamics influence natural resource consumption as the EGD demands (Figure 2.3), and on skills and factor markets (Figure 2.4).9
Potential Impacts
Three scenarios were built for the SDM simula tions and calibrations at different levels were per‑ formed. Simulations using the SDM were calibrated using a three-pronged approach: (i) macroeconomic data calibration, (ii) estimated equilibria conditions and (iii) expert and literature review calibration (see full details of calibration strategy in Annex C). Similarly, three scenarios are considered for the SDM simulations. First, a business-as-usual scenario (BAU) that considers no taxation over the consumption of natural resources, preferences and consumption remain as in the traditional economy. Second, a SC1 scenario (called moderate in the results) that assumes green taxes, natural recovery rates, consumption preferences, maximum degradation rate and education cost as per the rates in Annex D.
Third, an SC2 scenario (called moderate-high in the results), which have more aggressive rates than SC1 (details in Annex D).10
One crucial aspect of the modelling in this re‑ port, is that it allows for labor mobility across countries, sectors and skill levels. For both cases (SC1 and SC2), the possibility of labor mobility between countries is assumed. However, for the European regional case, mobility is still considered local to the extent that all countries belong to the same region and therefore all workers are considered local. Another salient feature of the SDM is the possibility of transforming unskilled to skilled workers through training. While labor market signals (i.e. wages) will result in an increase in the supply of skilled workers, the SDM recognizes that the upskilling process will take time. Similarly, the SDM also removes barriers to changes in consumer preferences. Greener scenarios (SC1 and SC2) imply a preference for the consumption of greener goods. As a consequence, the increase in green production will lead to the corresponding increase in capital investments in that sector.
SDM simulation results show that the more ag gressive the green policies in the EGD, the greater is the production shift from the traditional carbon economy to a green economy. With respect to the BAU (when BAU=100), brown production contracts in both the moderate and the moderate-high scenario. The EGD imposes a significant impact on the
36 MAKING THE EUROPEAN GREEN DEAL WORK FOR PEOPLE
Asymmetrical impacts will require a mix of adaptation and mitigation policies for individuals and regions
One crucial aspect of the modelling in this report, is that it allows for labor mobility across countries, sectors and skill levels
Source: Authors, based on the equations in the HTGEM (see annex A).
Source: Authors, based on the equations in the HTGEM (see annex A).
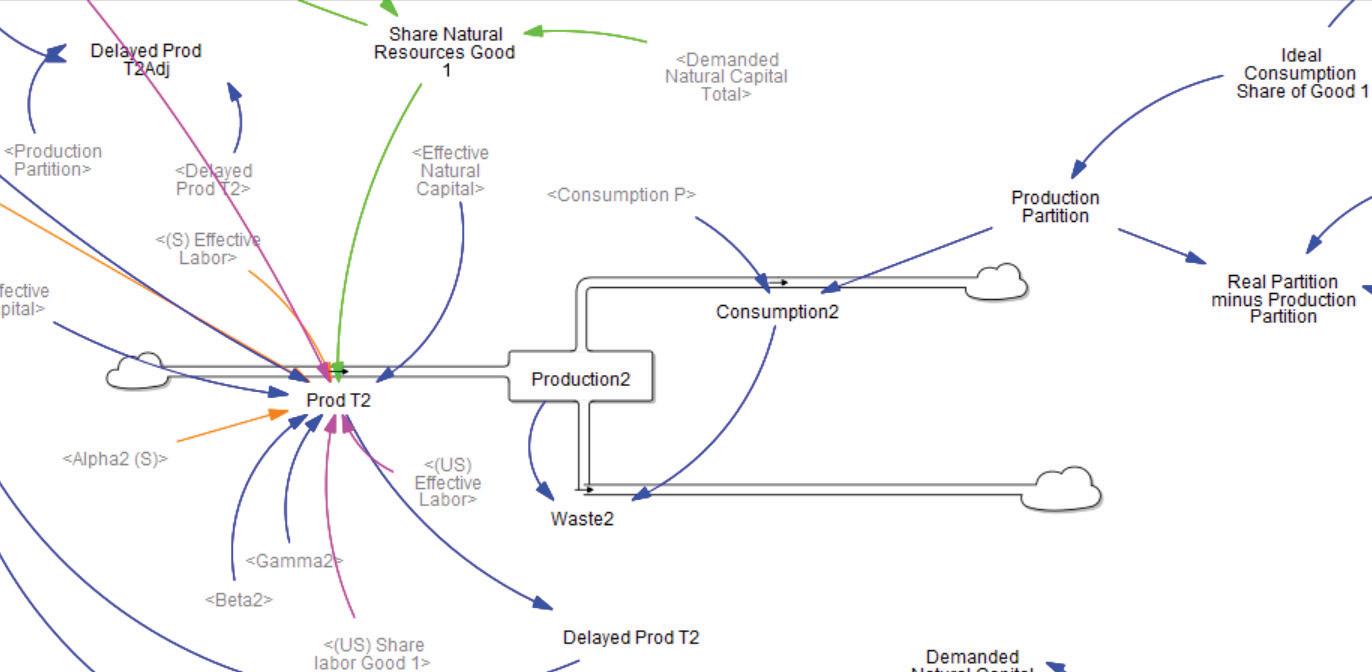
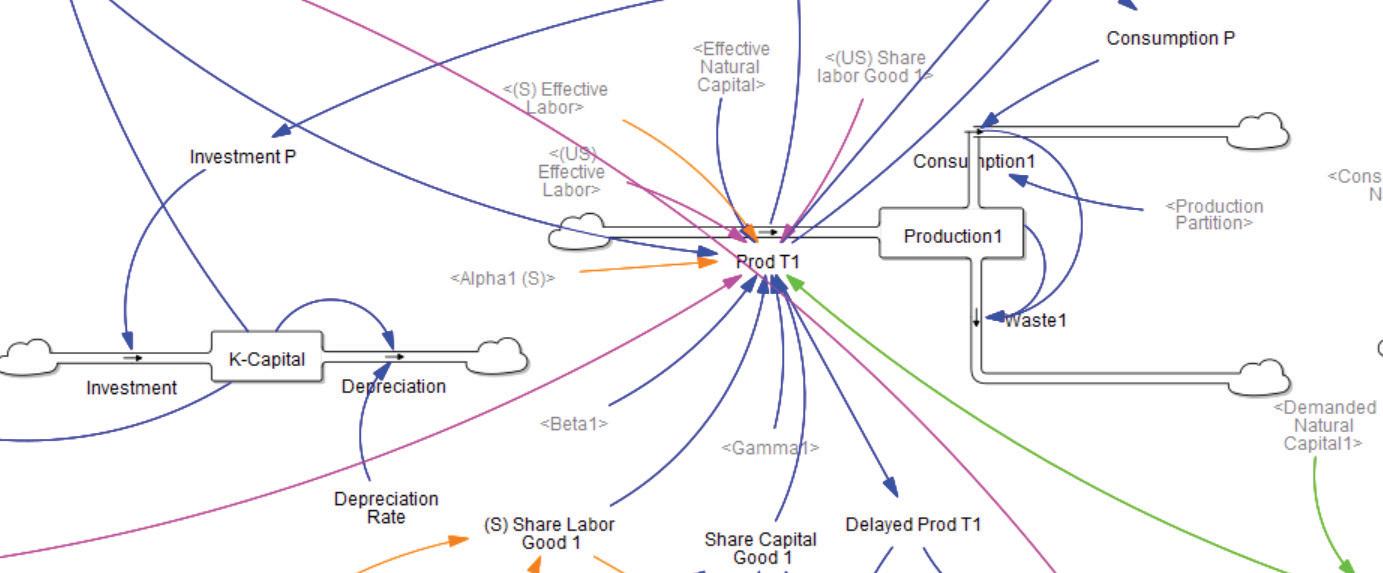
37 2. Economic Dynamics and Potential Impacts
Figure 2.2: SDM Approach to Modelling the Green Economy
The green economy decreases waste over time, the brown does not
Figure 2.1: SDM Approach to Modelling the Brown Economy
Source: Authors, based on the equations in the HTGEM (see annex A).
Source: Authors, based on the equations in the HTGEM (see annex A).
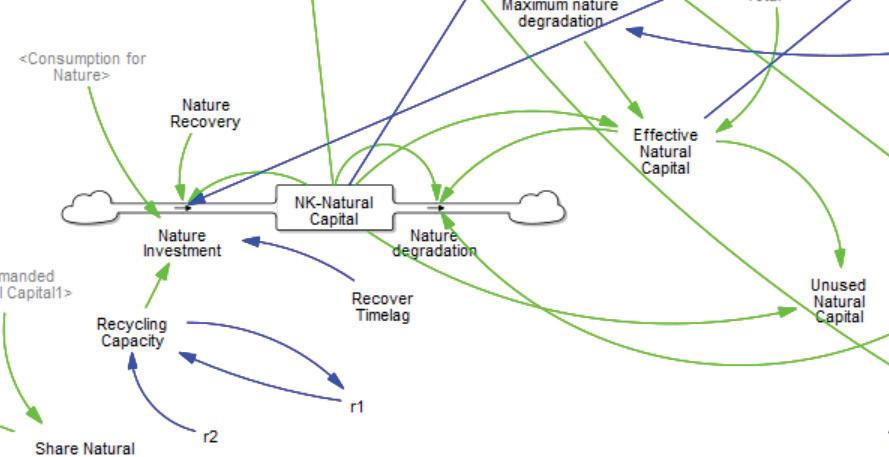
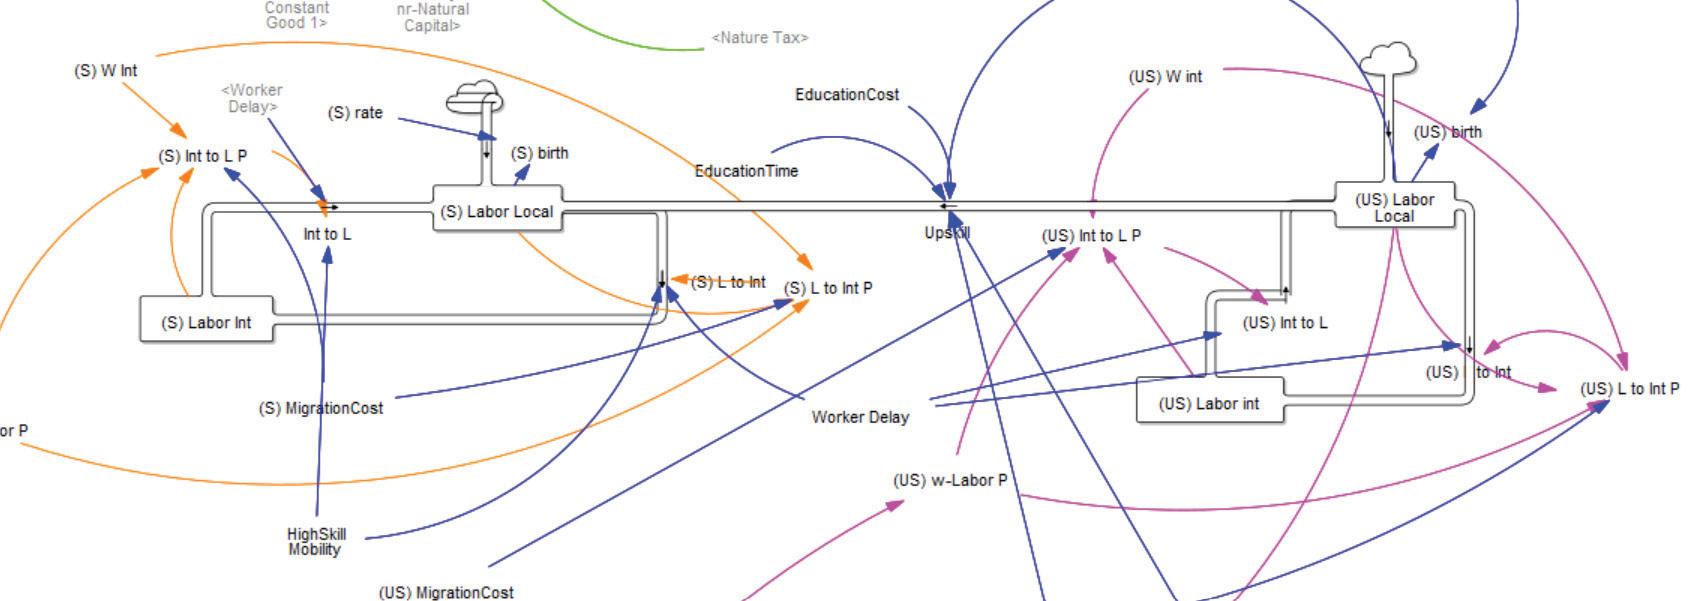
38 MAKING THE EUROPEAN GREEN DEAL WORK FOR PEOPLE
Figure 2.4: SDM Approach to Modelling Skills and the Labor Market
These dynamics influence natural resource consumption and skills and factor markets
Figure 2.3: SDM Approach to Modelling the Natural Resource Consumption
economy, and the adjustment is expected to occur in a relatively short period of time (Figure 2.5). Correspondingly, what is lost in production by traditional means is compensated for by gains in the green economy (Figure 2.6). Shifts in production are the result of changes in consumer preferences as they begin to favor goods that have been produced through green mechanisms to the extent that between the two forms of production, this is the one that uses fewer natural resources and uses more skilled labor. On the other hand, the appearance of green taxes also plays an important role in the reduction of production through brown mechanisms, as the use of natural resources is higher in this form of production this will bring higher costs for which it would be better to shift the production mechanisms to green ones. Individual country simulations show similar patterns (Annex E).
Complying with the EGD means that firms need to invest in technology, which produces capi tal deepening in the economy. Investments in capital for the EU show that the EGD represents an initial shock for firms. Some firms will be unable to adapt to a transforming green economy and have the possibility of choosing a mix of factors of production in line with the technological demands imposed by the EGD which implies a shift from low skilled workers and high investment in natural capital towards an economy with higher demands of skilled workers and lower investments in natural capital. As a result, some firms may exit the market leading to a contraction in investment in the short run (Figure 2.7). However, as firms closer to the technological frontier can innovate, adapt or absorb new technologies, surviving firms may take investment levels beyond the BAU trajectory. Higher levels of capital will lead
Source: Own calculations based on Eurostat (2022), European statistics accessed online at https://ec.europa.eu/eurostat/.
Note: Moderate scenario refers to a nature tax of 3%, a recycling capacity of 24%, a maximum degradation capacity of 5%, an ideal consumption shares of green production forms of 70% and an education cost ratio of 1.4, and moderate-high scenario refers to a nature tax of 6%, a recycling capacity of 48%, a maximum degradation capacity of 6%, an ideal consumption share of green production forms of 90% and an education cost ratio of 1.3.
39 2. Economic Dynamics and Potential Impacts
Figure 2.5: Simulation Results for EU Brown Production under the EGD System-dynamics simulations using Vensim, 2022–52
0 20 40 60 80 100 120 As pe rc entage of BAU Business as usual (BAU) Moderate scenario Moderate-high scenario 2022 2027 2032 2037 2042 2047 2052
Simulation results show that the more aggressive the green policies in the EGD, the greater is the production shift from the traditional carbon economy to a green economy
Figure 2.6: Simulation Results for EU Green Production under the EGD System-dynamics simulations using Vensim, 2022–52
Source: Own calculations based on Eurostat (2022); European statistics accessed online at https://ec.europa.eu/eurostat/.
Note: Moderate scenario refers to a nature tax of 3%, a recycling capacity of 24%, a maximum degradation capacity of 5%, an ideal consumption shares of green production forms of 70% and an education cost ratio of 1.4, and moderate-high scenario refers to a nature tax of 6%, a recycling capacity of 48%, a maximum degradation capacity of 6%, an ideal consumption share of green production forms of 90% and an education cost ratio of 1.3.
EGD implies a shift towards an economy with higher demands of skilled workers and lower investments in natural capital
Figure 2.7: Simulation for Capital in the EU under the EGD System-dynamics simulations using Vensim, 2022–52
Source: Own calculations based on Eurostat (2022); European statistics accessed online at https://ec.europa.eu/eurostat/.
Note: Moderate scenario refers to a nature tax of 3%, a recycling capacity of 24%, a maximum degradation capacity of 5%, an ideal consumption shares of green production forms of 70% and an education cost ratio of 1.4, and moderate-high scenario refers to a nature tax of 6%, a recycling capacity of 48%, a maximum degradation capacity of 6%, an ideal consumption share of green production forms of 90% and an education cost ratio of 1.3.
40 MAKING THE EUROPEAN GREEN DEAL WORK FOR PEOPLE
Business as usual (BAU) Moderate scenarioModerate-high scenario 60 80 100 120 140 160 180 200 As pe rc entage of BAU 2022 2027 2032 2037 2042 2047 2052
Business as usual (BAU) Moderate scenarioModerate-high scenario 60 2022 2027 2032 2037 2042 2047 2052 70 80 90 100 110 120 130 As percentage of BA U
to an increase in the capital-labor ratio and therefore capital deepening in the economy (Figure 2.8). Similar results were found for individual country simulations (Annex E). While capital investments are more nuanced in Croatia, they are the greatest in Poland, at least in the long run.11
The EGD’s green transition has the potential to deliver productivity growth as a consequence of technological change. As capital investments are
made by firms that put in place new technologies, productivity will increase under either scenario, relative to the BAU (Figure 2.9). However, in the case of individual country productivity trajectories, they seem to slightly differ. While Poland seems to get the greatest productivity gains as a percent of the BAU, Croatia gets a more nuanced gain initially that later accelerates. The Slovak Republic seems to have the lowest productivity gains of the three cases for
Source: Own calculations based on Eurostat (2022); European statistics accessed online at https://ec.europa.eu/eurostat/.
Note: Moderate scenario refers to a nature tax of 3%, a recycling capacity of 24%, a maximum degradation capacity of 5%, an ideal consumption shares of green production forms of 70% and an education cost ratio of 1.4, and moderate-high scenario refers to a nature tax of 6%, a recycling capacity of 48%, a maximum degradation capacity of 6%, an ideal consumption share of green production forms of 90% and an education cost ratio of 1.3.
Business as usual (BAU) Moderate scenario Moderate-high scenario
Source: Own calculations based on Eurostat (2022); European statistics accessed online at https://ec.europa.eu/eurostat/.
Note: Moderate scenario refers to a nature tax of 3%, a recycling capacity of 24%, a maximum degradation capacity of 5%, an ideal consumption shares of green production forms of 70% and an education cost ratio of 1.4, and moderate-high scenario refers to a nature tax of 6%, a recycling capacity of 48%, a maximum degradation capacity of 6%, an ideal consumption shares of green production forms of 90% and an education cost ratio of 1.3.
41 2. Economic Dynamics and Potential Impacts
Figure 2.8: Simulated Capital-Labor Ratios in the EU under the EGD System-dynamics simulations using Vensim, 2022–52
Business as usual (BAU) Moderate scenario Moderate-high scenario 2022 2027 2032 2037 2042 2047 2052 60 70 80 90 100 110 120 130 140 150 As pe rc entage of BAU
Figure 2.9: Simulated Productivity in the EU under the EGD System-dynamics simulations using Vensim, 2022–52
2022 2027 2032 2037 2042 2047 2052 80 90 100 110 120 130 140 As pe rc entage of BA U
which the exercise was carried out (Figure 2.10 Panels a and b). In fact, the Slovak Republic seems to lose productivity (under the moderate-high scenario) in the initial years of the EGD to then accrue modest gains (Figure 2.10 Panel c). Heterogeneity in productivity across countries could be the result of asymmetries in skills compatible with the new technological level. Nevertheless, the net effect for the EU is a clear gain in productivity resulting from the capital-deepening process.
The EGD will galvanize workers to upskill themselves given a growing demand to match
technologies, but in the long run, less attractive ness for unskilled work will make their salaries grow too. As firms introduce technology to comply with EGD regulations, a higher demand for skilled workers will emerge (Figure 2.11, Panel b). Technology will require the corresponding and compatible level of skills to the detriment of unskilled jobs. In the short run, demand for skilled workers will rise, while for unskilled workers will, will decline (Figure 2.11, Panel a). Demand for skilled workers will send the corresponding market signal through higher wages. Depending on each individual’s skills gap,
Source: Own calculations based on Eurostat (2022); European statistics accessed online at https://ec.europa.eu/eurostat/.
Note: Moderate scenario refers to a nature tax of 3%, a recycling capacity of 24%, a maximum degradation capacity of 5%, an ideal consumption shares of green production forms of 70% and an education cost ratio of 1.4, and moderate-high scenario refers to a nature tax of 6%, a recycling capacity of 48%, a maximum degradation capacity of 6%, an ideal consumption shares of green production forms of 90% and an education cost ratio of 1.3.
42 MAKING THE EUROPEAN GREEN DEAL WORK FOR PEOPLE
Figure 2.10: Simulated Productivity at the Country Level under the EGD System-dynamics simulations using Vensim, 2022–52
a. Croatia b. Poland Business as usual (BAU) Moderate scenario Moderate-high scenario c. Slovak Republic 90 95 100 105 110 115 120 As per centage of BAU 60 70 80 90 100 110 120 130 140 150 As per centage of BAU 90 92 94 96 98 100 102 104 106 108 110 As per centage of BAU 2022 2027 2032 2037 2042 2047 2052 2022 2027 2032 2037 2042 2047 2052 2022 2027 2032 2037 2042 2047 2052
Complying with the EGD means that firms need to invest in technology, which produces capital deepening in the economy
Figure 2.11: Simulation for Skills’ Demand and Supply in the EU under the EGD System-dynamics simulations using Vensim, 2022–52
Source: Own calculations based on Eurostat (2022); European statistics accessed online at https://ec.europa.eu/eurostat/.
Note: Moderate scenario refers to a nature tax of 3%, a recycling capacity of 24%, a maximum degradation capacity of 5%, an ideal consumption shares of green production forms of 70% and an education cost ratio of 1.4, and moderate-high scenario refers to a nature tax of 6%, a recycling capacity of 48%, a maximum degradation capacity of 6%, an ideal consumption shares of green production forms of 90% and an education cost ratio of 1.3.
The EGD’s green transition has the potential to deliver productivity growth
workers will react by trying to acquire the necessary skills. In the short to medium run, labor supply for unskilled jobs will contract as workers attempt to reskill themselves to benefit from the exacerbated wage gap (Figure 2.11, brown/beige lines). Initially that is enough to meet demand. In the medium to long run, the labor market demand fills with the skills from new entrants. As more unskilled workers are attracted to the reskilling process, there is the potential that shortages in unskilled occupations lead to a renewed demand for that segment of the labor market.12 The long run could see a convergence in demands for both, unskilled and skilled workers.13
Subject to the EGD’s astringency level, these shifts in technology and skills’ demand may lead to an increase in wage gaps between skilled and unskilled workers. Simulation results show that under the moderate scenario, a higher demand for skilled workers will lead to an amplification of the wage gap between skilled and unskilled workers (Figure 2.12). Under the most severe scenario, the wage gap will widen even faster, but in the medium to long-run, the wage gap starts to close given the higher demand for unskilled workers resulting from
a possible shortage in that segment of the market. In the long run, there is a possibility that wage inequality is even lower under a strong restriction implied by the EGD compared to the moderate scenario.14
Policy Consequences
The EGD will bring about a new green economy that delivers on growth, but the policy challenge lies in the political economy. Simulations in this chapter show that the EGD will lead to greater sustainability, will yield productivity gains as a result of capital deepening and investments in human capital. Simulations also show that there will likely be asymmetrical impacts at the individual and regional levels—and the rest of the report delves on this, particularly chapter 5. However, the aforementioned benefits will depend on the political economy of the green transition. Policy alignment and institutional readiness at the national, regional and local levels would require alignment with supranational visions and directives. Ensuring that HD systems function in a way that deliver the inputs needed for the green
43 2. Economic Dynamics and Potential Impacts
a. Unskilled labor
0 50 100 150 200 250 As per centage of BAU Business as usual Moderate scenario (Demand) Moderate-high scenario (Demand) Moderate scenario (Supply) Moderate-high scenario (Supply) 2022 2027 2032 2037 2042 2047 2052 2022 2027 2032 2037 2042 2047 2052 70 80 90 100 110 120 130 As per centage of BAU
b. Skilled labor
Figure 2.12: Skilled-Unskilled Workers’ Wage Differentials in the EU with the EGD System-dynamics simulations using Vensim, 2022–52
Note:
transition is paramount. The enabling capacity of education systems to deliver not only the skills, but the research, development and innovation (R&D+I) for technological change to take place, is an essential element to make the EGD goals attainable. Similarly, productivity gains will depend on health systems being able to serve more productive workers at the same time they cater for an ageing population. Active Labor Market Policies (ALMPs) will be required to target vulnerable workers to adapt to a green economy and contribute to a new productive model based not only on new technologies, but also on a circular approach to production and consumption.15 Without these policies and systems, and institutional alignment at multiple levels of government, growth and productivity trends may not follow the path and simulations, described in this report.
Some of the key variables triggering the EGD’s benefits, require intentionally setting the out comes. For instance, the R&D case study for Poland
shows that the country has significantly increased its investments in R&D+I. But Poland still needs to define viable models for ensuring social returns and socio-economic and environmental impacts of green R&D+I projects. Performance in green research, innovation in general and eco-innovation is still insufficient to meet the challenges of competitiveness, green transition, and sustainability. In addition to both, public and private sectors’ R&D+I capacity building, a key issue in Poland is improving the quality of public research and its role in transferring knowledge and technology solutions to industry and society. Addressing green innovation challenges in Poland, requires new approaches: (i) the use of mission-driven approaches, (ii) the promotion of innovation partnerships in funding programs, and (iii) the use of public procurement programs (precommercial procurement or PCP) are promising venues for action. But a necessary condition for it is that the research takes further steps to improve
44 MAKING THE EUROPEAN GREEN DEAL WORK FOR PEOPLE
Source: Own calculations based on Eurostat (2022); European statistics accessed online at https://ec.europa.eu/eurostat/.
Business as usual (BAU) Moderate scenario Moderate-high scenario 2022 2027 2032 2037 2042 2047 2052 80 90 100 110 120 130 140 150 160 As per centage of BAU
Moderate scenario refers to a nature tax of 3%, a recycling capacity of 24%, a maximum degradation capacity of 5%, an ideal consumption shares of green production forms of 70% and an education cost ratio of 1.4, and moderate-high scenario refers to a nature tax of 6%, a recycling capacity of 48%, a maximum degradation capacity of 6%, an ideal consumption shares of green production forms of 90% and an education cost ratio of 1.3.
The EGD will galvanize workers to upskill themselves given a growing demand to match technologies
Skilled worker demand will amplify the wage gap with unskilled workers
governance and policy frameworks for science and research institutions, and their engagement in research projects targeting green innovation and sustainability challenges.
Policy analysis should consider that EGD will represent a shock to firms and workers that will lead to capital deepening and productivity gains, but at the same time can lead to disproportionate gains for skilled workers and potentially lead to an exac erbation of inequality through salaries. Policies to curb emissions and decouple the economy from natural resources can lead to technological change and
thus, capital deepening and productivity gains. To make these gains possible, the corresponding human development policies are needed (the enabling role of HD). At the same time, changes in relative prices, notably but not exclusively wages, can lead to asymmetrical impacts across segments in the labor market and result in exacerbated inequality. To address these challenges, human development policies can help individuals adapt to a green economy and mitigate the effects of unintended consequences stemming from a much-needed green transition. These policy roles for HD, are the subject of chapter 3.
45 2. Economic Dynamics and Potential Impacts
3
HUMAN DEVELOPMENT POLICIES AND THE GREEN TRANSITION
The EGD require intentional policies to attain its goals, but also intentional adapting and mitigating actions for a hu man transition. The European Green Deal (EGD) aims at addressing the challenges posed by climate change by reaching net-zero emissions by 2050 and decoupling economic growth from natural resource consumption, while ensuring that no person or place is left behind (European Commission 2019a). The first two goals are essential to the sustainability of European, and global, societies. Since the policies necessary to reach the first two goals will have important distributional consequences, and in some cases could severely reduce the incomes of the more disadvantaged households and regions, the last goal is critical to social justice and to maintaining support for the reform program. The OECD points out that the transformation entailed by the green economy transition will need to be managed in an intentional way, including via social investments and strengthening dialogue, to avoid a disorderly transition that leaves communities left behind (OECD 2020a).
This chapter considers three ways in which hu‑ man development policies can affect the green tran sition. The first section discusses policies that can play an enabling role in contributing to a reduction in greenhouse gas (GHG) emissions and increased efficiency in the use of materials (see policy framework in Figure 3.1). The second section addresses policies that can help individuals to adapt in ways
that support the green transition. The third section addresses how human development policies can help to mitigate unintended consequences of the transition, in particular the potential for job losses and declining relative wages for low-skilled workers (see Figure 3.2 for a matrix of stakeholders involved according to the identified role of each type of policy). The fourth section reviews the coverage of these policies in recent strategy documents for three EU countries.
The Enabling Role of HD Policies to Reduce GHG Emissions and Support a Circular Economy
The EGD encourages the greening of enterprises, which will require the skills to enable it and con sequently, the appropriate mechanisms in the edu‑ cation sector. This may include producing environmental outputs or adopting environmental processes within the enterprise. Green and decent jobs are expected to require higher skill levels, be present in large part in green industry sectors, and call for skills that complement environmentally sustainable technology and innovation (Poshen 2015). Wagner (2013) comments on the relevance of education to drive a green energy transition by providing people with skills to enable the use of renewable energy resources and implement environmentally conscious practices (see below for a discussion of policies to
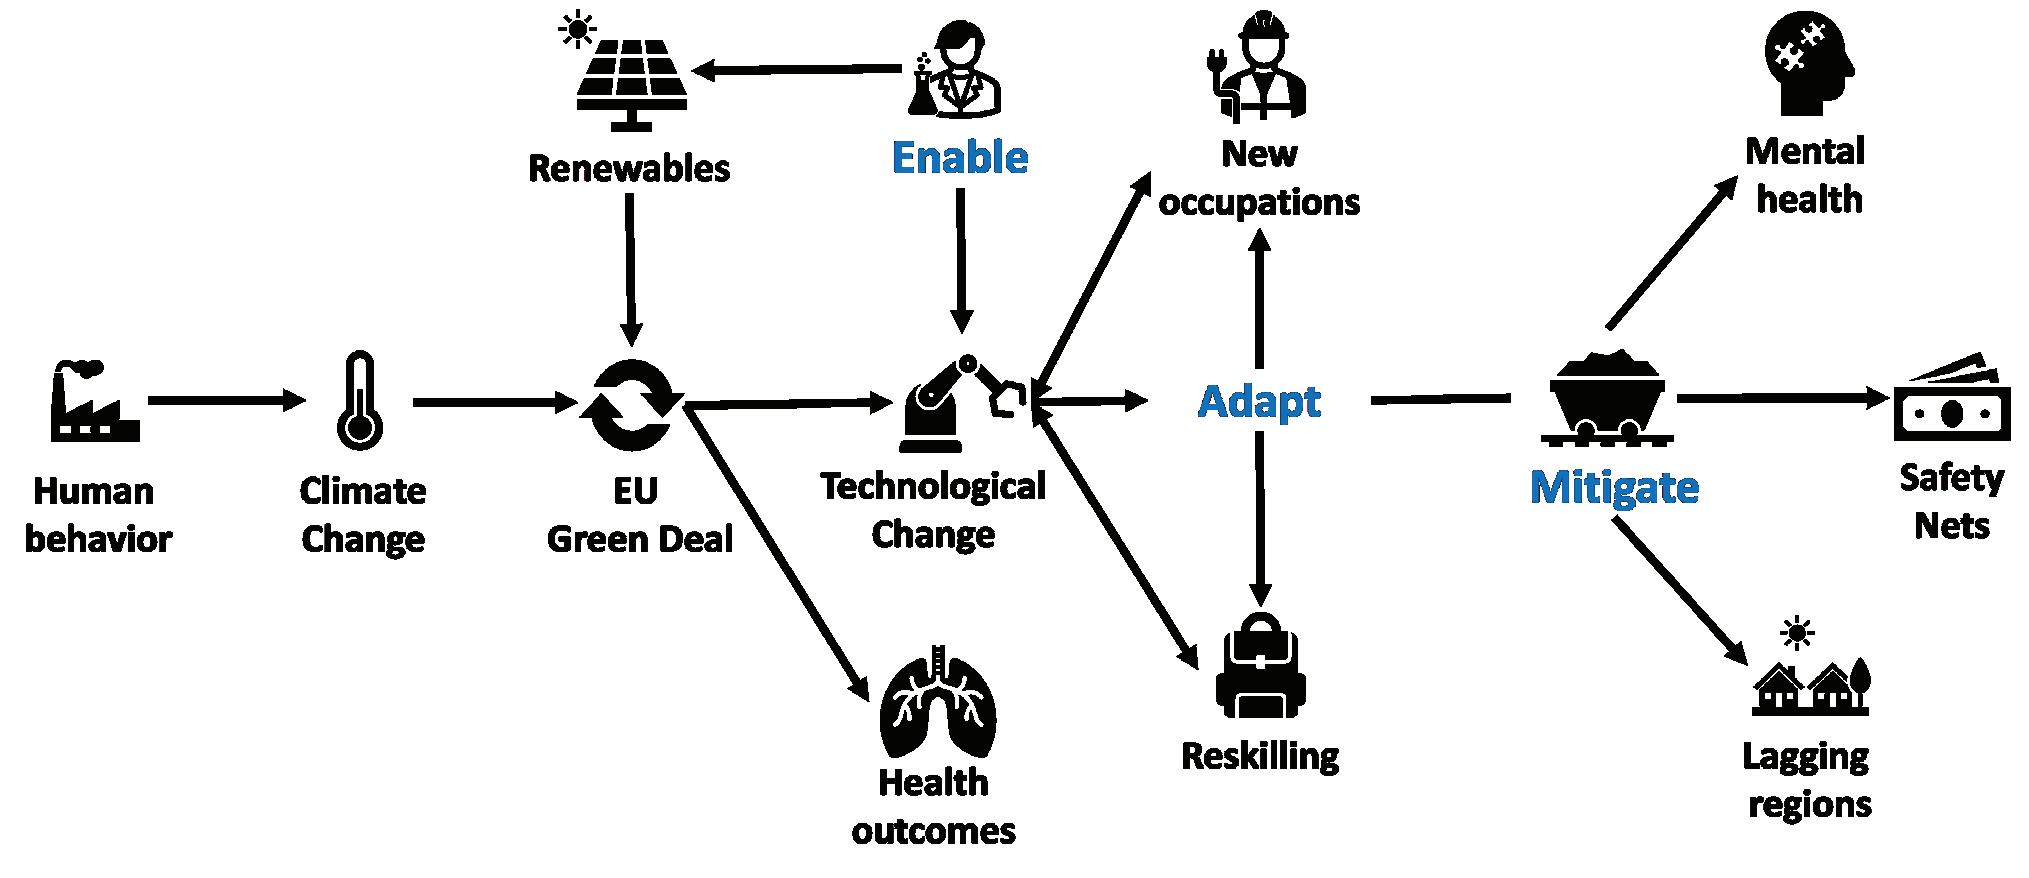
47 3. Human Development Policies and the Green Transition
Figure 3.1: The Human Transitions Policy Framework: Enabling, Adapting, and Mitigating
Source: Authors.
improve the skills required for the green transition). The author emphasizes adult learning to assist workers to transition jobs and the need for offered credentials to be accessible, valuable to employers, portable, and conducive to continued career development. For example, the Institute for Career Development in the United States coordinated green jobs training in their career development model, which focuses on portable skills, customized training, and schedules appropriate for adult learners. The author recognizes adult learning as a key element of green sector growth and local retainment of emerging jobs.
Foundational skills will be important for the preparation of the workforce to take on emerging occupations. ILO (2018a) asserts that skill development and training are important for the ability to appropriately implement adaptation strategies such
as changes in infrastructure that contribute to the net-zero emissions goal of the EGD. Furthermore, the parallel case study for the Slovak Republic finds that education will play an important role in the preparation of the workforce to take on green jobs, especially through the development of foundational skills and attitudes. The study discusses that regardless of changes in labor demand, core skills such as learning ability, effective communication, leadership, and decision-making are expected to be key for occupational mobility.
The health sector can be an enabler of the green transition through the integration of green prac‑ tices coherent with the EGD . Chakraborty et al. (2021) explore how healthcare systems constantly interact with the environment, acknowledging the importance of considering this relationship and the
48 MAKING THE EUROPEAN GREEN DEAL WORK FOR PEOPLE
Source: Authors. Enable Adapt Mitigate Stakeholders Flexible education Supra, national, regional, and local governments Civil society Non-governmental organizations Supra, national, regional, and local governments Private sector Civil society Supra, national, regional, and local governments Private sector Civil society Unions Non-governmental organizations Social assistance Compensation Education Foundational skills Education quality Educational attainment Curriculum adaptation Monitoring and evaluating impact on health Promotion of healthy lifestyles and behaviors Reskilling Labor code Public employment services orientation to new occupations Private-public cooperation Social insurance Health Mental and physical health support Strategic financing & procurement Universal Health Coverage Climate-smart health education Social Protection and Jobs Research, Development and Innovation (R&D+I) Technical and Vocational Education and Training (TVET)
Figure 3.2: Human Development Stakeholder Action Matrix
The EGD encourages the greening of enterprises, which will require the skills to enable it and consequently, the right education policies
adaptations that may be prompted from changes in the environment. The authors echo the health industry’s actions to incorporate environmental sustainability into healthcare systems which contributes to lower levels of pollution-generation and decreased operational costs.
Involving health‑sector employees in green ac‑ tivities is important to facilitating the green transi tion. Mousa and Othman (2020) report that “green hiring” and “green training and involvement” (GTI) were the most influential human resource management practices for environmental sustainability in the health sector. The benefits of employee involvement in sustainable practices in the health sector through “green training and involvement” include contributions to the reduction of pollution and improved waste management and resource use. In their analysis of the intersection between humanitarian aid and the healthcare sector, Nayna Schwerdtle et al. (2020) touch on the role of a healthcare workforce aware of the health risks associated with
climate change and the contributions of including climate-change related health challenges in health professions’ curricula. The authors argue that a more aware healthcare workforce can better prepare to address changing disease profiles influenced by climate variability. Nayna Schwerdtle et al. (2020) also point to the implications of building awareness of the contributions of the healthcare system to GHG emissions in adopting practices that will mitigate them.
Changes in infrastructure in the HD sector can make an important contribution to the achieve ment of net‑zero emissions by 2050. Key improvements include building efficiency, transportation, energy sources, waste and water systems (Cort and Esty 2020). The authors describe the implications of green infrastructure including improved health outcomes, a reduction in carbon emissions by sectors that are currently big players, and economic development. The authors also mention retrofitting of buildings as a possible area of job creation while reducing emissions (Box 3.1). Paired with these plans
Box 3.1: The Compatibility of Infrastructure and Buildings with EGD goals
EU countries face a variety of challenges in ensuring the efficiency and sustainability of infrastructure and buildings. Principal components analysis can provide some insight into these issues by grouping countries according to common problems (see Annex F for the data and methodology used). In some cases, this analysis reveals policy priorities that apply to the countries in each cluster. Except for two countries (Iceland and Malta) with atypical issues, the analysis defines four major clusters. The clustering displays a very strong geographical connectivity, meaning that the issues linked with infrastructure and building still have heavy links to the historical development of the different geographical areas in Europe.
Cluster 1, which includes Lithuania, Estonia, and Latvia, has the highest share of rail and inland waterways in total freight (63.3 percent) and is increasing its share of trains, and its recycling rates higher than the other countries. However, it is also rapidly increasing its share of air emissions and the share of the population living in deteriorated housing conditions. Moreover, this cluster’s share of EU research and development has fallen, and it has the lowest number of patent applications. Latvia’s manufacturing sector, for example, generated almost 0.84 grams of particulates (less than 2.5µm) per Euro of value added in 2019, which is the highest in the EU, while its patent applications to the European Patent Office were reported as 11.50 per million inhabitants in the same year, which is among the lowest.
(Continued next page)
49 3. Human Development Policies and the Green Transition
Foundational skills will be important to prepare the workforce for emerging occupations
Figure B3.1.1: Building and Renovation in an Energy and Resource Efficient Way Wards clustering
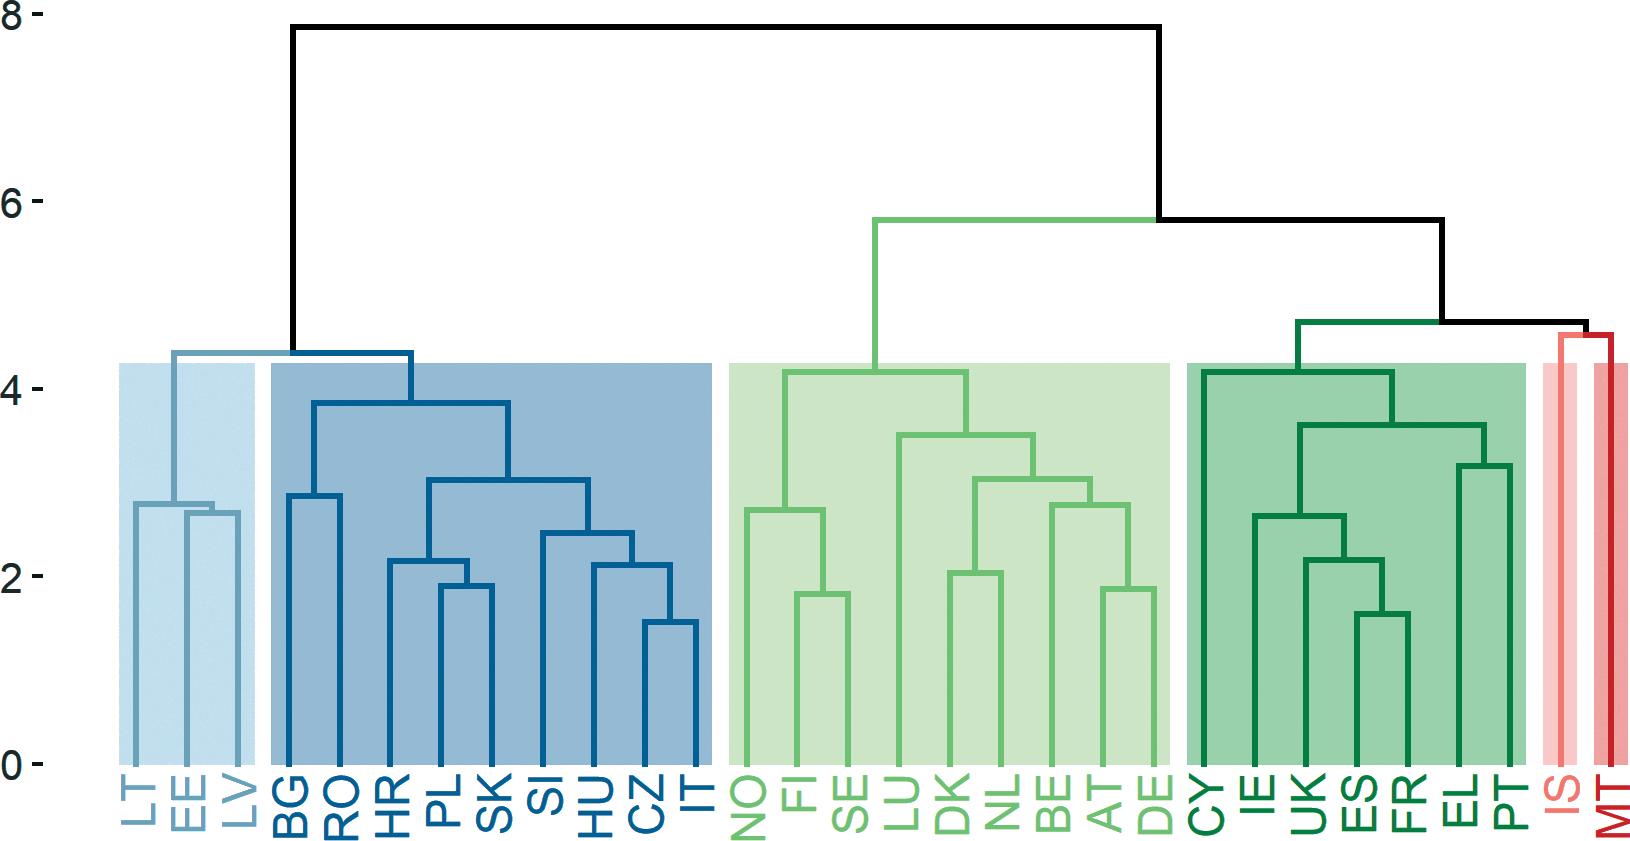
Source: Author’s calculations.
Note: Iceland, Norway and the United Kingdom, which are non-EU members, were included for benchmarking purposes only.
In cluster 2, which includes Bulgaria, Romania, Croatia, Poland, the Slovak Republic, Slovenia, Hungary, the Czech Republic, and Italy, overcrowding rates and the exposure of people to air pollution are increasing more rapidly than in any other cluster. In contrast, settlement area per capita is declining, indicating that there aren’t large urbanization processes taking place, and air emissions from the industry are falling. But the gross domestic expenditure on R&D is also decreasing at the highest rate of the region. In general, this is the cluster confronting the greatest challenges on the quality of living in the cities and the decline in research. More work is needed in these countries to improve the livelihood conditions of the urban areas, and how to do it via the strengthening of their local research and academic environments.
Cluster 3, which includes Norway, Finland, Sweden, Luxembourg, Denmark, Netherlands, Belgium, Austria, and Germany, has the highest level of patents, although the share of individuals with tertiary education is declining. Levels of noise reported by the population are increasing and the share of trains and buses is declining at the fastest rate among all the clusters.
Cluster 4, which includes Cyprus, Ireland, United Kingdom, Spain, France, Greece, and Portugal, has been increasing its recycling at a rate only second to cluster 1. Moreover, this group shows the highest decline in the share of people living under deteriorated conditions, presence of crime and noise, and other problems. This cluster seems to have the highest improvements in these indicators, and it is worth analyzing them in detail to draw lessons that can help the other clusters.
for infrastructure adaptation comes an expected increase in demand for the human capital to execute it.
The Slovak Republic parallel study offers insights into the significance of social partner involvement in the assessment for green skills demand via employer surveys and other monitoring activities, as well as the stable funding to maintain such initiatives. Furthermore, the Pact for Skills launched by the European Commission represents an opportunity for this kind of shared stakeholder engagement in skill
development. In addition, the parallel case study on Croatia discusses the need for “green buildings” training of high-skilled and low-skilled construction sector professionals to enable a transition to more environmentally friendly infrastructure.
The buildings and operational processes in HD sectors can contribute to the goals of the EGD. The use of new technologies in the design of health facilities can minimize resource use in their operation (see Box 3.2 on China’s project, and 3.3 on the
50 MAKING THE EUROPEAN GREEN DEAL WORK FOR PEOPLE
3.1 (continued)
Box
Box 3.2: China’s Guizhou Aged Care System Develop Program Project
This project is constructing energy efficient Aged Care Facilities (ACFs) with energy saving measures exceeding the regular standard requirements of the Government. The building and operation of the ACFs include climate-smart considerations such as energy-saving architecture, energy-saving materials and equipment introduced to reduce heat transmission and infiltration, installation of energy saving lighting equipment and intelligent light control systems, utilization of renewable energy such as solar energy and biogas, and energy efficiency IT infrastructure.
Box 3.3: HD Infrastructure and the Green Transition in Croatia
Croatia provides a useful example of the issues surrounding the greening of HD infrastructure. There is a need to renovate or replace aging schools and hospitals, some of which do not meet the minimum requirements in terms of mechanical stability, fire safety, and health protection, and are poorly adapted to deal with extreme weather events or disasters. The hospitals are the worst performing public buildings, and the ongoing national reforms are not adequately addressing this issue. There is a significant financial gap among infrastructure investment needs, available funding, and absorption capacity, which was exacerbated by destruction from the recent devastating earthquakes and disruptions during the COVID-19 pandemic. The vast majority of recently built schools in Croatia exceed the spatial standards by 20-100 percent, which increases the investment required, operational costs and carbon footprint. On the other hand, there is no evidence on schools that go beyond minimal requirements in terms of energy efficiency or indoor environmental quality.
Addressing all of the HD infrastructure issues in Croatia will require concerted efforts. While the Croatian regulatory framework is aligned with key EU requirements for buildings to a certain extent, further harmonization is needed. A more robust information exchange and greater policy coordination is necessary across the several Croatian institutions that play a role in setting the requirements for, or constructing, schools and medical facilities. Regulatory measures should introduce a formal obligation for building renovation and regular maintenance practices. Greater emphasis on education and training is required to impart the skills required for green construction. More broadly, the transition to a more ‘green’ and environmentally sustainable economy will require skills development for both high-skilled and low-skilled professionals, especially in building design, construction and maintenance sectors. Croatia could also benefit from learning the best international practice in construction of ‘green’ buildings in both health and education sectors.
challenges facing Croatia in reducing GHG emissions tied to HD infrastructure), while optimizing staff and patients’ experience. This includes climate-smart health facilities that (i) are resilient and adapted to anticipated climate risks to health infrastructure, and (ii) play their part in mitigating their own net GHG emissions. Indeed, construction could help to reduce emissions by sequestering carbon if the more ambitious and innovative ideas are taken on board, such as using health sector land to reforest areas or by using large health care facilities (HCFs) to generate renewable energy through solarization/ urban wind. Adopting green medical waste management (MWM) also could contribute to an efficient use of materials. Digitizing delivery systems,
such as registration, payments (through e-wallets, not just e-payments),16 and service delivery can help reduce the overall carbon footprint of programs through reducing travel to carry out each of these steps.17 One-stop-shop and social service center construction, when replacing older energy inefficient infrastructure, can reduce GHG emissions.
The participation of citizens through the acqui sition of knowledge and active involvement in the green transition strategy is key to its success. Lupi et al. (2021) explore Collective Action Initiatives (CAIs) and their use in environmentally friendly efforts, particularly in the energy sector. Interestingly, the most popular activities of Civil Society Mobilization involved in CAIs were lobbying, participation
51 3. Human Development Policies and the Green Transition
in campaigns, and making political recommendations. In addition, the authors’ research shed light on CAIs as an instrument of civil society participation via social innovation. Citizen participation occurs from the development of CAIs to a key role in the financing of such initiatives.
Universities are a unique place for experimenta‑ tion and learning and generating new knowledge and technological solutions for the green transi tion. Universities can support green innovation and technology development in different ways: through knowledge (from research) and new skills; by engaging in R&D and innovation partnerships with industry or public actors; and by supporting the transferring of new knowledge and technologies to industry and society (McCowan et al. 2021; Radinger-Peer and Pflitsch 2017).
Fostering academic entrepreneurship and the acceleration of spinoffs (from science and research institutions) is also an important channel through which universities can support green technology development and diffusion. Improving funding opportunities for technology development and early-stage funding for clean tech startups as well as incentives for academics to participate in such activities are key to this development.
In deploying R&D partnerships, new ap proaches and new mindset are required, notably regarding inter disciplinarity in research and strengthened collaboration with non‑academic ac‑ tors (Trencher et al. 2014) and foreign organizations (Kwieck 2021). Delivering green innovation solutions often requires mobilizing a large range of competences and disciplines.
Another way through which universities can support green technology development is through testing and demonstration of new solutions. By serving as “living laboratories” or test beds for new green technologies (for example, in renewable energy, sustainable construction, electric mobility, and urban smart grids, among others), universities can help assess the feasibility of innovations and their potential scalability to cities or industries.
The green transition requires improvements in skills training for technology adoption and ensur ing advanced human capital in future R&D projects and demands. In addressing these challenges, delivering the pool of STEM graduates is central. Likewise, a strategy for advanced human capital (MSc and PhDs) is critical in deploying and implementing large new research and development projects. Finally, enhancing international cooperation in education and research will be central for EU countries to fulfill new national and European policy commitments.
Finally, public research actors—both universi ties and public research organizations—have a ma jor role in facilitating the adoption of new green and sustainable technologies through social inno vation projects. This means supporting people and organizations to co-create, learn, adapt, and scale green solutions to social problems, such as working conditions, health, transport, and heating.
Monitoring and analysis of labor market dy namics are highly linked with skilling programs and represent an important factor in enabling the green transition. Camaren (2019) highlights the role of the fourth industrial revolution and green technology in job creation and economic development dynamics. He explores the idea that the introduction of new technologies in the context of the green transition will necessitate a workforce to manage the deployment, installation, operation, and maintenance of these (Camaren, 2019). The increase in demand for these activities will require a job market prepared to adopt them. Furthermore, a workforce prepared to take on green jobs has the potential to contribute to the EGD goals from the workplace. Luca et al. (2019) find a positive and statistically significant correlation between resource-efficiency actions, as defined by their resource-efficiency index which includes actions companies are taking to be more resource efficient, and green employment.
In light of the expected increase in demand for higher skills to fulfill jobs that will make the tran sition attainable, it is valuable to consider the po sition of low skilled workers that would face these dynamics. Peters (2014) highlights the need to pay attention to elements of emerging jobs such as whether these come with decent wages, good prospects, and accessibility to low-skilled workers. Moreover, Sofroniou & Anderson (2021) discuss how existing occupations that are expected to increase in demand without requiring changes in the job itself or the skills necessary to perform it might represent an opportunity to absorb low-skilled workers. However, it is important to candidly assess the remuneration level and quality of these jobs in line with the principle of a just transition outlined in the EGD.
Adapting to the Green Transition
Education can play an important role in shifting consumer demand to green products. Cultural barriers, particularly a lack of consumer interest and awareness as well as a hesitant company culture are viewed as the key barriers to advancing the circular economy in Europe (Eckert 2020). A high percentage
52 MAKING THE EUROPEAN GREEN DEAL WORK FOR PEOPLE
of the population with only primary or lower secondary education is associated with a lower waste recycling rate, while tertiary education has a positive influence on the recycling rate ( Pelau and Chinie, 2019) . Improved quality of education can facilitate adoption of ‘green’ technologies through multiple ways (see Box 3.4). In Poland, broad consensus of the need to reduce GHG emissions has been supported by teaching in schools (Box 3.5).
Incorporating issues related to climate change and green behavior into school curricula is a neces sity for all EU countries. While some related topics are already included in most countries’ learning programs, they do not provide a sufficient basis for
understanding complex global challenges. For a number of EU students, the understanding of climate change, can be hampered by their understanding of science. While many EU students report that the environment is very important to them, they also feel they cannot do much about it. For example, in PISA 2018 nearly 70 percent of 15-year-olds in Germany said that looking after the global environment is important for them, but only around 40 percent said they can do something about the problems of the world. In Hungary, more than 80 percent of 15-year-olds worry about the global environment but less than half feel they can something about it. Thus, students will greatly benefit from learning
Box 3.4: Investments in Quality Education Can Enable Green Technological Innovation and Adaptation
The importance of skills and, subsequently, the role of education in research and development is well established, and a number of studies have linked skills and human capital to the ability of firms to comply with environmental regulations and reduce pollution. Besides these, recent research shows that such investments can also have long lasting benefits in mitigating inequalities arising out of environmental policies such as carbon pricing.
Macdonald and Patrinos (2021) analyze how education quality interacts with carbon pricing’s effect on carbon emissions, output, and wage inequality, by estimating a general equilibrium, overlapping-generations model. They find that if education quality increased, a carbon tax would have a stronger impact on reducing carbon emissions and a less detrimental effect on output because a higher quality education system is better able to respond to the demand for higher skilled workers. Having higher quality education increases the elasticity of skill supply and, as a result, mitigates a carbon tax’s economic costs including output loss and wage inequity between the wealthy and poor, and enhances its effect on emissions reduction.
The research thus shows that carbon pricing that is accompanied by improvements in education quality will result in better environmental and economic outcomes when carbon pricing is used to reduce emissions.
Source: Macdonald and Patrinos 2021.
Box 3.5: Educational Policy and Climate Change Opinions in Poland
There is broad acceptance in Poland of the need to reduce reliance on coal. A 2021 opinion poll conducted by CBOS, a national Center for Public Opinion Polls, found that 74 percent of the population supported the goal of gradually leaving the coal-based energy sector, while only 19 percent felt that energy production should be based mostly on coal.
Climate change issues have been integrated into school curricula in preprimary, primary and secondary schools, and in higher education. The national report “Climate Education in Poland” (Education 2021) discusses tools used to present climate change issues in school and analyzes basic requirements in education related to climate change. At the university level, the Warsaw-based Collegium Civitas offers an MBA course in management of climate and energy policy, which presents the EGD as a long-term EU project. Climate education is provided in modern science centers, such as the Copernicus Science Center in Warsaw. And the national environmental strategy provides for a comprehensive environmental education from the earliest years.
53 3. Human Development Policies and the Green Transition
about the green transition and global environmental challenges, as well as being provided with tools to affect issues at the local, national, and global level. All of this underlines the importance of ensuring that students have a basic understanding of the science of climate change, of steps to encourage discussions and exchanges of opinions (together with fact checking), and of facilitating students taking local actions related to the environment. Education should be used to build ecology awareness in new generations. Learning about sustainable behavior should be incorporated across subjects and grades of study. After regular classes, the school infrastructure can serve as the cultural center for the promotion of a sustainable lifestyle and green transition for the broader society. This effective usage of assets demonstrates a sustainable way of thinking.
Efforts by educational programs to increase awareness of behavioral consequences, perception of environmental issues and collective interest for common well being can encourage behaviors that contribute to reducing GHG emissions and the use of materials. Incorporating an increase of awareness of behavioral consequences in education programs can influence adoption of green behavior (Minelgaitė and Liobikienė 2021). The value-belief-norm theory holds that values influence attitudes and responsibility towards environmental issues as well as pro-environmental behavior (Minelgaitė and Liobikienė, 2021). In addition, the literature shows that self-interest and interest in the well-being of others
can influence green behavior, the latter positively and the former negatively. Environmental concerns have a positive and significant relationship with pro-environmental behavior (Mayekar and Sankaranarayanan 2019). Minelgaité and Liobikienė (2021) find for Lithuania that in 2011, concern over others’ welfare and perception of environmental problems were the most positively influential on pro-environmental behavior. In 2020, self-interest and awareness of behavioral consequences showed a negative and significant impact. Similarly, Al Mamun et al. (2018) find that in low-income households, eco-literacy and self-efficacy influence attitudes toward green product consumption, and attitude and perceived behavior control influence intention towards green products. Tanner and Wölfing Kast (2003) find that proper knowledge to identify pro-environmental vs. harmful products influences green consumerism. Furthermore, evidence shows that education related to environmental sustainability is related to substantial reductions in carbon emissions. If education that empowers students with knowledge and agency is not expanded to the millions of girls out of school in developing countries, society loses out on their valuable contributions (Kwauk & Winthrop 2021). Information dissemination and citizen involvement in GE transition policy design are necessary to achieve long-term success and contribute to the fulfillment of EGD policies.
Adults also need encouragement to undertake actions to support the green transition. Györi,
54 MAKING THE EUROPEAN GREEN DEAL WORK FOR PEOPLE
Education can play an important role in shaping behaviors and shifting consumer demand to green products
Education can play an important role in shaping behaviors and shifting consumer demand to green products
Diekmann and Kühne (2021) suggest cash combined with behavioral inspired nudges and communication campaigns to promote climate friendly behavioral change. The authors point out that social and behavioral change communication (SBCC) have had a large impact on improving key health behaviors and outcomes in developing countries. 18 But to achieve persistent behavioral changes so that the decline of emissions becomes permanent, targeted investments in communication networks can be part of a green recovery package, provided measures are taken also to reduce the environmental footprint of digital technologies. Such measures may also need to be accompanied by new regulation that facilitates and encourages behavioral changes over the longer term, which may include flexible working arrangements or a right to work from home when feasible, as debated in Germany19 (Reuters 2020, 54).
Adjusting the education sector to meet the emerging needs of the labor market will be key to adapting to a more environmentally conscious economy. Government support for research in climate-related issues across formal education contexts in private and public institutions can contribute to skills adaptation (ILO 2018b). Specifically, engineering and architecture are two education sectors that have implemented climate-related adaptation training into their programs, such as in postgraduate courses.
The training of HD personnel should reflect EGD goals. EGD relevant topics (climate change, pollution management, circular economy, etc.) should be incorporated into curricula for training of new health workers (medical, nursing schools, etc.), and EGD topics should be incorporated into continuing professional development and professional accreditation structures. Accreditation requirements can be defined in ways that promote health providers that are aligned with the EGD. Purchasers could favor those providers, while authorities could
promote and support the accreditation of other providers—which would align those with EGD as well.
Procurement policies in HD sectors can assist in the green transition. Procurement should prioritize suppliers that are compliant with EGD policies. New skills will be required to apply green technologies (EGD aligned) to the design and production of pharmaceuticals, equipment and devices. Financial protection schemes are able to develop strategic purchasing arrangements where the third-party payer could, for example, favor health providers that are aligned with the EGD through lower co-payments if beneficiaries use their medical services instead of health care provided by other non-aligned facilities. Furthermore, payers could stimulate EGD policies through different provider payments schemes, (e.g., use innovative approaches like Results Based Financing or other options for contract management with healthcare providers that ensure they either alleviate negative aspects of EGD policies or facilitate the implementation of the EGD itself).
The health sector can play an important role in monitoring, research and policies in areas import‑ ant to the green transition. Strengthened epidemiological and population health status surveillance would help to direct health sector resources. Research into the health impacts of EGD policies could identify likely trends in health issues as the green transition progresses. Health experts should contribute to decisions on urbanization and urban renovation efforts (e.g., positioning and orientation of the buildings, distance between buildings, content of areas between buildings, etc.) and mass transport planning (e.g., prioritizing mass and low carbon/ carbon neutral means of transport) (Box 3.6 discusses the challenges facing EU countries in the transport sector). Novel technologies aligned with the EGD should be assessed for the potential of unintended health consequences.
55 3. Human Development Policies and the Green Transition
Adjusting the education sector to meet the emerging needs of the labor market will be key to adapting to a more environmentally conscious economy
Mitigating the Impact of the Green Transition
Transition to a carbon‑neutral economy (CNE) will have a host of consequences for growth and wel fare in the EU. Some of these effects will reduce welfare and affect the distribution of income between groups—for example when carbon taxes result in higher prices or when clean energy regulations result in job losses in a polluting sector. Carbon taxes and regulations designed to spur shifts to (more expensive) low-carbon technologies can increase the price of basic goods and services like food, heating, and transportation and so aggravate poverty (World Bank 2021c).20 The poor and middle class spend a larger share of their consumption basket on food, housing and transport services, and are thus more vulnerable to uncompensated increases in energy and food prices that could be caused by the transition to a CNE.
Policies to transition to a CNE can result in sig nificant shifts in the demand for workers and the ability to sustain livelihoods. Efforts to transition away from fossil fuel extraction can lead to job losses in energy-intensive industries, and efforts to prevent land clearance for agriculture or incentivize the production of biofuels can disrupt agriculture-based livelihoods (Costella et al. 2021).21 Policies that make livelihoods unsustainable could also prompt displacement (World Bank 2022). 22 Experience with deindustrialization, transitions away from coal, and trade liberalization show that regions experiencing significant job displacement can be affected in the long term (Cunningham 2021).23 In order to direct human capital in a strategic and intentional manner to assist the adaptation of carbon-intensive industries and other sectors where job opportunities are anticipated to decrease, stakeholders must place effort in monitoring changes in the labor market and appropriately direct skilling of workers.
Low skilled workers may experience significant job losses and a decline in their relative earnings. The growth of the green economy will raise the
demand for skills, resulting in further increases in the earnings of high-skilled relative to low-skilled workers (see chapter 2). The risk of unemployment is high during the transition to a low-carbon economy, especially for vulnerable people with lower education (World Bank 2021b).24 Although the ILO estimates a net increase in direct and indirect jobs from the green economy transition, employment in natural resource intensive and fossil-fuel related sectors is expected to decrease (ILO 2018c). In addition, employees with sector-specific skill sets in the fossil fuel industry may experience some of the stranded assets’ effect expected from the green transition (van der Ploeg and Rezai 2020, 288). While some job displacement will be compensated by employment growth in low-carbon and other industries, it will not necessarily be employment of the same skill level, which could negatively affect low-skilled displaced workers (Saget et al. 2020).25 Providing the education and training necessary for workers to move to higher-skilled jobs in the green sector will play an essential role in mitigating the impact on workers adversely affected by the green transition and in reducing the overall cost to the society, in terms of unemployment and social tensions. The parallel case study on the Slovak Republic emphasizes that labor market monitoring and skilling programs that cover the economy as a whole, rather than limiting it to specific green jobs, will be most effective in unfolding the potential of skill-matching. This highlights the importance of transversal green skills that can be applied to occupations in traditional sectors that might increase their green activity, in addition to the development of new green occupations. Vocational training hints at being a key channel to train workers with the skills identified via monitoring of the labor market.
Skills and training
Improving individual consumption and produc tion behaviors is an important cornerstone in the EGD. Individual choices such as purchasing more energy efficient appliances, choosing public
56 MAKING THE EUROPEAN GREEN DEAL WORK FOR PEOPLE
Low-skilled workers may experience significant job losses and a decline in their relative earnings
Box 3.6: Common Challenges in Improving the Efficiency of Transportation
Transportation is highly linked with GHG emissions and with energy demand. The form and magnitude of problems confronting efforts to reduce GHG emissions from the transport sector differ across EU countries. Principal components analysis can provide a snapshot of these issues by defining groups, or clusters, of countries according to common challenges (see Annex for data and methodology used). This can be helpful in presenting a summary indicator of problems that takes into account country differences, and can reveal commonalities that could be addressed by similar policy approaches. Except for two countries with atypical conditions (Iceland and Germany), the analysis generates four clusters of EU countries according to the challenges involved in reducing emissions in the transport sector (see figure B3.6.1).
Figure B3.6.1: Accelerating the Shift to Sustainable and Smart Mobility Wards
Source: Author’s calculations.
Note: Iceland, Norway and the United Kingdom, which are non-EU members, were included for benchmarking purposes only.
Cluster 1, which includes Italy, Spain, France, Netherlands and United Kingdom, has the highest values in number of passengers using air transport (with the exception of Germany) as well as highest percentage of population using cars for transportation (ranging from 82 percent for Italy to 87 percent for United Kingdom). Moreover, it also has the largest increases in most of the transport variables, showing that transport infrastructure is large and has been growing. Therefore, the focus of these countries should be on increasing the sustainability of the current transport system.
Cluster 2, which includes Romania, Estonia, Latvia, Bulgaria, Lithuania, Croatia and Slovenia, is the opposite to cluster 1. It has the lowest values of transport of passengers and goods, although the rate of increase is high. On the one hand, there is a strong need for the infrastructure to catch up with the changes in volume of trade and transport, but on the other hand there is a need, and an opportunity, to do it in a sustainable way.
Cluster 3, which includes Poland, Hungary, the Czech Republic, Austria, and the Slovak Republic, contrasts with the previous clusters as its transport indicators are declining, but it has the highest increase in motorway infrastructure and the smallest percentage of population using cars for transportation (74.8 percent). This would imply that the transport infrastructure is designed for increased trade, but the volume of goods is insufficient to use the system efficiently. Therefore, these countries need to consider whether slowing the growth of transport infrastructure would be desirable, given the environmental consequences of growth and the limited demand.
Cluster 4, which includes Portugal, Cyprus, Greece, Ireland, Malta, Lithuania, Finland, Sweden, Norway, Belgium and Denmark, has similar conditions to cluster 3, yet road infrastructure is decreasing, and the volume of goods and passengers is lower, but is declining at a lower rate than in cluster 3. Thus, this cluster should consider the same issues as for cluster 3, but as this group of countries is not so focused on increasing their road infrastructure, there is perhaps a greater opportunity to focus on the sustainability of transport infrastructure.

57 3. Human Development Policies and the Green Transition
clustering
transport over private cars, as well as individual policy preferences such as favoring taxes on fossil fuels can contribute significantly to reducing carbon emissions. While changing individual beliefs and behaviors is difficult for a number of reasons, one promising approach is through education.
Education before the individuals become adults is crucial to shape behaviors towards sustainable consumer preferences. Angrist et al. (2023) estimate the causal effect of education on a series of pro-climate beliefs and behaviors by exploiting compulsory schooling laws across multiple European countries. They combine a new harmonized dataset on compulsory schooling law changes in Europe introduced by the World Bank with the European Social Survey (ESS) data on pro-climate beliefs and behaviors as well as voting behavior. While existing literature on the causal relationship between education and environmental outcomes is mixed, the analysis suggests that there is substantial heterogeneity by country, making it possible to estimate some strong and precise effects at the reform level. The strong correlation between education and climate beliefs is in part causal.
Workers will need strong foundational skills to seize the opportunities afforded by the EGD
Foundational skills play a key role in the transition to green jobs. People with strong foundational skills will be more capable of learning new skills and thus obtaining green jobs. Workers in green jobs tend to have higher levels of foundational skills than workers in brown jobs do, and the return to skills tends to be higher in green than in brown jobs (see chapter 5). Thus, education systems should strengthen emphasis on equipping students with foundational skills, which would improve their preparation for green jobs and help to limit rising inequality caused by higher returns to skills from the green transition. This is indeed the experience shown in the Slovak Republic’s case study. However, as in the Slovak Republic, foundational skills development needs to be accompanied by a strong greening of occupational
standards and provision of skills. Similarly, in Estonia, after the implementation of education reforms that support foundational skills development such as improved teacher education, adaptation of curricula to match a changing economy, and guaranteed access to early childhood education, national learning outcomes in math, reading and science have risen to the top among EU countries. Furthermore, Estonia has the highest proportion of students in the lowest socioeconomic quartile who performed at the highest PISA quartile at the national level (see the parallel case study for the Slovak Republic). Attracting high-quality teachers to the educational system can make a critical contribution to strengthening foundational skills, an area where improvements are required in some EU countries. For example, salaries for teachers in the Slovak Republic are only around 70 percent of the average salary for those with tertiary education, and only about 4 percent of teachers believe that the profession is valued by society.26
Providing training of foundational skills for adults is a major challenge. Very few adults can go back to formal schooling, even if it is adapted to their daily schedules. According to Eurostat data, less than 2 percent of low-educated adults in the EU participated in any type of formal learning in 2016 (Eurostat TRNG_AES_102).27 Courses for adults need to be highly flexible and focus on skill gaps rather than providing full courses similar to those offered for children and youths. It is necessary to develop tools that can quickly assess levels of foundational skills in adults and develop training schemes that fill the most important skill gaps for groups of adults with similar challenges. Several European countries have established centers that recognize prior learning of adults to support them in further skills upgrading and formal recognition of their qualifications, but these are still relatively small-scale efforts (see OECD 2021).28 As reflected in the Slovak Republic parallel case study, VET is expected to be a major avenue for green occupation training for existing and new occupations using an approach of analysis of market demand. Targeted training of foundational skills followed by specific training for tasks required in green
58 MAKING THE EUROPEAN GREEN DEAL WORK FOR PEOPLE
Foundational skills play a key role in the transition to green jobs
jobs will be essential for a large number of workers who currently have little chance of landing green jobs that could guarantee similar wages as in their now-disappearing brown jobs.
Higher returns to skills in green jobs are ob served also among workers with lower formal ed ucation levels, so equipping students in vocational education with foundational skills is increasingly important. Students in vocational education tend to have much lower performance in foundational skills than students in general education do (European Commission 2019b).29 In the Slovak Republic, for example, VET students achieve lower results on standardized tests of foundational skills than general education students with similar socioeconomic backgrounds do (the difference is attributable to the relatively poor performance of VET students from higher-than-average socioeconomic backgrounds).30 Underachieving students have limited options for further education, and PIAAC data show that adults with limited skills have higher probability of unemployment, lower wages, and a greater deterioration of skills with age than workers in skills-intensive professions do (OECD 2021a). Successful education reforms in countries like Estonia and Poland demonstrate that improving teaching of foundational skills in vocational education is possible (Crato 2021).31 These countries share similar features, with the key characteristics being a relatively long period of general curricula teaching, late selection to vocational schooling, and national examinations to ensure students reach certain learning outcomes.
Training is key to the success of the EGD
Adequate training will be critical to workers taking advantage of the opportunities offered by the green transition. In a number of European countries, the provision of adult training is limited, so the devotion
of considerable additional resources might be required (EU 2021).32 Low-skilled workers find it particularly difficult, or unproductive, to take up training courses. For example, in the Slovak Republic, participation by low-skilled adults in lifelong learning is about a fourth of participation levels among those with tertiary qualifications.33 Moreover, in many cases training, and in particular on-the-job training, focuses on skills directly related to current job-related tasks. Since green jobs often require different kinds of tasks than brown jobs do (see chapter 5), workers may have difficulty in obtaining training that assists in job transitions required for the European Green Deal. Thus, the government’s role in providing or funding job-specific training may have to rise. For well-educated individuals, training should be offered depending on their specific skills set towards mastering additional tasks required in green professions that could accommodate their current skill set. In this regard, possible transition patterns for different professions should be well-understood before offering training (see chapter 5). The challenges countries face in improving their training systems differ significantly across the EU, calling for differences in policy emphasis (Box 3.7 illustrates this for the case of Poland and the Slovak Republic).
Obtaining a green job will be particularly diffi cult for young people who are neither working nor in education or training. Individuals whose skills and work experience are limited are likely to be discouraged at the growing earning gaps between lowand high-skilled workers due to the green transition. Providing flexible education and training for these groups that will recognize gaps in foundational skills is crucial. Young adults who left education are rarely interested in repeating traditional school courses, but combining apprenticeships with some traditional courses to upgrade foundational skills could encourage participation. Examples of such
59 3. Human Development Policies and the Green Transition
Higher returns to skills in green jobs are observed also among workers with lower formal education levels, so equipping students in vocational education with foundational skills is increasingly important
Box 3.7: Education and Training in Poland and the Slovak Republic
The Slovak and Polish economies both rely on manufacturing as the main provider of jobs for low-skilled workers. While in Poland the skills of adults are lower than in the Slovak Republic and participation in adult training is one of the lowest in the EU, Polish reforms of the school system increased student foundational skills to levels found in just a few EU countries. In the Slovak Republic, current student performance in math, science and reading is far below expectations, while adult numeracy skills are above averages for the OECD and EU. The two countries need to solve different issues in their education and training system, while they could learn from each other. The Slovak Republic has much to learn from the reforms of school structure, curricula, examinations, and other components of the well-functioning Polish education system. Poland can learn from the Slovak Republic on how to provide adult training more effectively to increase participation and provide more effective upskilling of workers.
institutions can be found in the Netherlands and other European countries. They require investments and proper incentives for employers to provide direct job experience for trainees. Adult education centers should also provide up-to-date career guidance and counselling services to help address other than skills-related barriers for employment. To prevent discouragement and wrong career choices, students in secondary schools also should be offered opportunities to experience different jobs and explore possible educational and professional options. PISA data show that with the exception of Germany, most 15-year-olds in European countries did not have such opportunities (OECD 2021a).34
Active labor market programs (ALMPs) can play an important role in making workers who are unem ployed or inactive as a result of the green transition more employable by adapting their skill set to green jobs. According to Card et al. (2017), ALMPs have negligible effects in the short run, but turn positive a few years after completion of the program, particularly for those that emphasize human capital accumulation. They can also support new workers in gaining the appropriate skills for the new labor market (ILO 2017).35 Many countries have developed retraining strategies, at times linked to income support, targeted to workers displaced by economic transitions,
including structural transformation, privatization, and energy transitions. These include programs in Poland (Mining Social Package) to assist with a transition from coal, in the EU (European Globalization Adjustment Fund) to assist with economic restructuring, in Canada (Industrial Adjustment Services) to assist during economic transitions likely to lead to large-scale job displacements, and in the United States (Trade Adjustment Assistance) to assist with openness to trade (Cunningham and Schmillen 2021).
Programs in some countries focus on training in the skills required for green jobs. The USA’s Civilian Climate Corps initiative aims to create ‘good jobs’ for young people and train them for environmentally friendly careers. It plans to put 1.5 million Americans through federally funded projects that help transition to a clean economy over a five-year period (Ed Markey Press Release 2021). 36
Companies should be provided with informa tion and financial support to make deeper invest ment in foundational and task specific skills of workers. Firms are unlikely to provide the more demanding and long-term training that focuses on foundational skills without subsidies or vouchers to cover the financial costs of additional training. Governments can also encourage companies and public institutions to recognize such learning, even if it
60 MAKING THE EUROPEAN GREEN DEAL WORK FOR PEOPLE
Obtaining a green job will be particularly difficult for young people who are neither working nor in education or training
does not lead to a formal degree. Several countries have established competence centers to encourage companies and individuals to participate in adult education and training, but also to provide tools for more formal recognition of achieved qualifications (OECD 2021b).
Education needs to provide students with foundational, modern, and fungible skills
In the medium term, education systems should provide all students with fungible skills to enable life long learning to perform different tasks in an increasingly dynamic labor market. Foundational skills will prepare the workforce to take on emerging occupations. ILO (2018a) asserts that skill development and training are essential for appropriately implementing adaptation strategies, such as changes in infrastructure that contribute to the net-zero emissions goal of the EGD. Furthermore, the case study for the Slovak Republic, which accompanies this report, finds that education will play an essential role in preparing the workforce to take on green jobs, primarily through the development of foundational skills and attitudes. The study discusses that regardless of changes in labor demand, core skills such as learning ability, effective communication, leadership, and decision-making are soon expected to be critical for occupational mobility.
People with strong foundational skills will be more capable of learning new skills and thus ob taining green jobs. Recent evidence shows the importance of foundational skills—numeracy, literacy, and socio-emotional skills—as the basic pillars enabling life-long learning. Lack of foundational skills dampens individuals’ capacity to acquire or upgrade their professional competencies, preventing them from adapting to changing labor market conditions. PISA 2018 results indicate that around one in
five 15-year-olds in the EU are low achievers (21.7 percent in reading, 22.4 percent in mathematics, and 21.6 percent in science) even though there are considerable differences among EU member states. In this context, the demand for foundational skills is set to increase with the greening of the economy, technological progress, and further integration of international markets (World Bank 2018).
A growing literature shows that there are cost effective interventions to improve foundation skills. Early childhood education interventions targeting children ages 0–3 and providing them with the necessary nutrition, early stimulation, and meaningful interaction are highly effective, especially among disadvantaged children. Providing information about the benefits associated with years of schooling and learning has proven to change behaviors and improve students’ efforts and learning outcomes. Selecting, training, and incentivizing teachers and school directors within a coherent and transparent teacher career path improves student learning. Finally, using technology to personalize the learning experience can also be a highly cost-effective intervention (World Bank 2018, 2020).
To ensure foundational skills for all students, EU MS must modernize their technical, vocational education, and training (TVET) systems. Of the 17.5 million students enrolled in upper secondary education in the EU in 2019, about 8.5 million of them—almost half of the total—were enrolled in a vocational track, of which at least 2 million were enrolled in work-based programs. Therefore, TVET institutions are central in the skill formation process in EU countries. Identifying the professional competencies that will be demanded in the future and adjusting the provision of TVET services accordingly is poised to become more challenging, making many training programs ineffective (Kluve et al. 2019; McKenzie 2017).
61 3. Human Development Policies and the Green Transition
Active labor market policies can play an important role in making workers who are unemployed or inactive as a result of the green transition more employable by adapting their skill set to green jobs
Table 3.1: Role of TVET in Green Transition
Domain Role of TVET
Demand Side Skills Needs Assessment
Assessing the change in demand for skills due to the green transition through employer surveys
Policy measures
Regular Industry wide assessments to identify growing sectors and track change in demand for skills
Examples/ Best Practices from Countries
The European Union initiated the DRIVES (Development and Research on Innovative Vocational Skills) project with an aim to analyze the demand for and offer of skills in the automotive industry in order to map out a dedicated skills agenda. The project involved 24 partners in the automotive sector from 11 EU Countries.
Supply Side Skills Gap Assessment
Individual skills assessment through training providers and employees
Structured skills assessment surveys for profiling the workforce and identifying their needs
In Greece, a pilot program was done to profile needs of individuals and provide in-depth counselling sessions and differentiation of recommendations. In addition, a demand-responsive training (DRT) component was introduced to make regionally relevant professional skills development training available on a continuous basis to registered unemployed participants. Profiling helped differentiate workers into appropriate channels of support (directed to training, public works, or online services, for example).
Upskilling and Reskilling
Monitoring activities to identify skill gaps, develop congruent training programs and inform the population of workers on expectations for emerging jobs.
Green occupation training for new skills as well as improving traditional skills
Job matching programs by government and labor market agencies to support workers in finding jobs during the green transition.
Targeted supply side measures for providing workers in brown jobs with the necessary skills required to transition to green jobs
In response to a mismatch between VET school’s results and labor market demand in the Slovak Republic, a project was implemented to explore regional employer needs and VET school offerings in a collaborative effort with regional Education Departments in order to develop a strategic plan for adjustment of VET schools to harmonize with labor market dynamics
The Republic of Korea reorganized some VET schools into green skills development schools with specialized courses in areas such as renewable energy, carbon reduction energy, LED applications, and the green transportation sector
Improving Foundational Skills
Industry tie-ups to introduce new skills in existing workforce
Designing and standardizing curricula for vocational training in new skills in coordination with training partners and industry
Students in vocational education generally found to have lower foundational skills than students in general education which makes obtaining green jobs more difficult, especially for graduates whose specific skill sets don’t match future demand in the green economy.
TVETs can broaden their focus from narrowly defined technical training to incorporating foundational skills in order to increase employment opportunities.
Enabling tie-ups between vocational training providers and industry for continuous skilling programs
Revamping curricula of traditional skill development courses to include new skills
Introducing lifelong learning programs with emphasis on improving foundational skills in vocational education
Creating incentives for industries to cover the costs of long-term training that focuses on foundational skills
To help students be better prepared to successfully enter a rapidly evolving workforce, Clumio (India) is actively offering tie-ups and programs with colleges to offer internship opportunities for computer science students
The Philippines Technical Education and Skills Development Authority (TESDA) has identified specific courses with green competency component and works with the private sector to standardize trainings and establish training regulations
Estonia and Poland have revamped their education system with increased focus on foundational skills in vocational schools
While examples of government incentivizing trainings in private sector are rare, Germany has seen a strong private sector involvement in skilling. Private sector companies such as Acciona (Spain) have also tied up with universities to provide employees with short and duration courses in green and environmental subjects.
62 MAKING THE EUROPEAN GREEN DEAL WORK FOR PEOPLE
TVET graduates with professional competen cies might enjoy favorable labor market outcomes in the short term but having more robust founda tional skills seems to produce better results (Hanushek et al. 2017). According to PISA, TVET students perform significantly worse than general education students in reading, math, and science (Figure 3.3). Moreover, exam-based placements into general versus vocational secondary education (tracking), common in Europe, introduce an equity angle of TVET. In many EU MS, vocational systems do not provide a labor market advantage over general education graduates. Therefore, the tracking system that usually complements TVET in the European education systems could reproduce or even exacerbate existing inequalities, dampen social mobility, and weaken the social contract, particularly in changing market conditions. This is particularly important, as TVET students often come from disadvantaged backgrounds compared to their peers in general education (Figure 3.3).
Training needs to be paired with helping people to find a job
Job matching by government programs and labor market agencies will require a shift in approach to support workers in finding jobs during the green
transition. Currently available tools focus on labor demand and matching workers with companies on the basis of existing skills. Tools are required that focus on measurable skills necessary for old and new jobs, along with specific information on what is required for transition to green jobs. Effective transition requires more in-depth evaluation of workers’ skill sets and the potential to follow the green transition pathways outlined in Chapter 5. Ready-to-use agile skills and preferences diagnostic tools can assess the cognitive and non-cognitive characteristics of the local population, providing critical information to firms interested in investing in the area. The proofof-concept diagnostic exercise was conducted as a part of World Bank technical assistance for three transforming regions in Poland (forthcoming), showing that agile research leads to valuable insights.
One approach that could be supported by EU funds involves skills centers conducting individ‑ ual skills assessments and working closely with training providers and employees. A client-centered approach should be supported by the development of a skill profile of each jobseeker. For example, in Greece a pilot program involving three ALMPs included profiling, in-depth counseling sessions and differentiation of recommendations through the elaboration of an individual action plan (IAP). In
63 3. Human Development Policies and the Green Transition
Training
needs to be paired with helping people to find a job
Figure 3.3: Difference in Socioeconomic Status and Learning Outcomes in EU Member States, TVET versus non-TVET Students
0 .1 .2 .3 .4 .5 De nsit y −10−50 5 Index of economic, social and cultural status 2018 General trackVocational track 0 .001 .002 .003 .004 .005 De ns it y 0200 400 600 800 PISA Math score 2018 General trackVocational track
Source: World Bank computations using PISA 2018.
addition, a demand-responsive training (DRT) component was introduced to make regionally relevant professional skills development training available on a continuous basis to registered unemployed participants. Profiling helped differentiate workers into appropriate channels of support (directed to training, public works, or online services, for example).
Strong evidence of what does and does not work is essential for effective policy making. The main sources of data on the quality of education are the large-scale student assessments (PISA, TIMSS and PILRS) and PIAAC data. However, these sources are limited and do not provide enough evidence about the quality of education. The most significant information gaps, that are essential for designing tailored policies are: (i) Assessment of motivation towards educational and professional pathways; (ii) assessment of the preferences toward green transition; and (iii) investigation to understand heterogeneous incentives for the green transition.
Monitoring activities could identify skill gaps, develop congruent training programs and inform the population of workers on expectations for emerging jobs. Monitoring and analysis of job trends by region can help identify the quantity and type of green jobs expected, paired with training programs to facilitate the reallocation of workers and the preparation of the labor force to take on new and emerging green jobs highly associated with renewable energy and infrastructure related activities. For example, in response to a mismatch between VET school’s results and labor market demand in the Slovak Republic, a project was implemented to explore regional employer needs and VET school offerings in a collaborative effort with regional Education Departments in order to develop a strategic plan for adjustment of VET schools to harmonize with labor market dynamics (refer to parallel case study on the Slovak Republic). Information from job monitoring activities may hint at areas of opportunity for green job creation and point to possible industries of focus for skilling and reskilling of the labor force.
Labor codes and policies can be revised to pro tect workers during the transition to a carbon
neutral, circular economy. For example, Philippines implemented efforts to promote green jobs through the adoption of the “Green Jobs Act,” which was designed to generate, sustain and incentivize green jobs to develop an environmentally friendly economy. Private businesses are incentivized to hire employees skilled in preserving the environment and to retrain their current employees. The government has also formulated human resources development roadmaps for several industries and will maintain a database of green careers, professions and skills (ILO 2019b).
A regional perspective will be important
Private sector support measures can be tailored to local economic challenges. For example, a Mines Closure and Social Mitigation project in Romania, in addition to cash-based compensation, included support of a newly created agency with the mandate to deal with the consequences of the mine closures, employment and training incentives schemes, community-driven development projects, and a micro-credit program. The project supported the creation of more than 13,000 jobs, and in project communities almost half of those affected by mine closures found other sources of employment (World Bank 2006). Encouraging public-private partnerships to support workers with the most demanding transition patterns can be an effective way to improve labor offices’ efficiency. RCT evaluation of privately provided job counselling and training in Małopolska region in Poland is an example of effective solutions that are often avoided due to limited incentives for developing public-private partnerships (Gajderowicz and Jakubowski 2021).
Strengthening skills also should have a regional focus. There are large differences across regions (within countries) in terms of education attainment, wages, and employability. The green transition is likely to accentuate recent trends of increasing returns to skills, so that these regional disparities might further enhance the economic gap between central and lagging regions (see Chapter 5). To
64 MAKING THE EUROPEAN GREEN DEAL WORK FOR PEOPLE
Private sector support can be tailored to local economic conditions
Strengthening skills also should have a regional focus
effectively allocate resources for additional training to the lagging regions, it is first necessary to understand well skills composition and possible job transition patterns in different regions. For example, analysis for Poland shows that various regions have different job opportunities, and adults in brown jobs might require different upskilling options unless they wish to migrate to other regions. Also, investments in enhancing the capacities of labor offices to strengthen their assessment capacities and improve labor demand monitoring might be more effective than providing general training grants.
Digital technologies can make an important con tribution to addressing the problems less‑developed regions will face during the green transition. Less-developed regions often suffer from brain drain and insufficient capacity to invest into R&D or create effective innovation clusters. Investments in digital technologies can increase opportunities for distant learning and facilitate cooperation and exchange of ideas. Supporting cooperation between innovation centers and less-developed regions through digital technology can provide the former with access to skilled labor and infrastructure at significantly lower costs, and the latter with growth opportunities, assuming the local potential to develop talent is not underutilized. Supporting cooperation between local and top higher education and research institutions is crucial to develop less-developed regions’ capacity to provide skilled labor and facilitate innovations in the long-term. Nevertheless,
in-person cooperation is often necessary to establish strong and productive links, so that supporting research exchanges between close regions remains important. Current exchange schemes encourage researchers to travel to leading institutions and very often, these exchanges are mainly between top universities or research institutions. Promoting exchanges between regional leaders and country-leading institutions might further enhance the potential of less-developed regions to enhance their possibilities to provide high-quality education.
Investment in digital skills to facilitate work at a distance could support incomes in lagging re gions. However, in the whole of EU more than 20 percent of adults do not possess even basic problem-solving computer skills (PIAAC data). Among older and less-educated workers this percentage is even higher, especially in countries like Poland where adult training and usage of computers is relatively low. However, lack of sufficient digital skills is also a barrier for distant work to younger adults. Developing their digital skills to solve problems using technology will enhance working opportunities also in the less-developed regions. Eurostat data show that almost 80 percent of adults in Netherlands and Finland self-report to have basic digital skills, compared to around 50 percent or less in Hungary, Italy, Poland, Romania and Bulgaria (Eurostat 2022b).37 Moreover, while nearly all households in the EU have access to the internet, the quality and speed of their connection is often not sufficient for
65 3. Human Development Policies and the Green Transition
Digital technologies can make an important contribution to addressing the problems less-developed regions will face during the green transition
work-related purposes. Also, it involves costs. Overall, differences between regions in digital skills, infrastructure and costs pose a barrier to their further development and increased reliance on distant work and services.
Health
The potential for disruption to people’s lives gen erated by the requirements of the EGD will increase the importance of monitoring individuals’ health status. For example, organized screening programs and other examinations can identify diseases in the early stage. New technologies and connectivity enable innovative ways to strengthen disease prevention and lifestyle monitoring. Telemedicine is an option of particular importance to be considered to support addressing health impacts in lagging regions. Already existing personal gadgets report on physical activity, heart rate, blood pressure, etc. With further technological advancements, almost constant monitoring of health status and behavior, through various parameters, would be possible. Significant diversions from the normal level of parameters would indicate to an individual seeking medical care—which would make preventive and treatment actions ever timelier.
The health sector will play an important role in responding to the labor market disruptions ex pected during the green transition. For many people, the EGD will result in changes of profession and/or residence, as well as reduced incomes. Increased provision of physical and mental health services will be essential for ensuring that health care delivery responds to changing circumstances. With
the increase in changes in employment, often accompanied by periods of unemployment, ensuring that all individuals have adequate social health protection is essential to moderate risks related to catastrophic and impoverishing health expenditures, and to foster access to and use of appropriate services. This would include health care that would be government financed or financed through different public health protection systems with special concern for the vulnerable (for example, that the Government’s subsidies cover even their contributions for the health insurance or co-payment).
The health sector will also be key in facilitating the green transition in its capacity to remain resil ient and ability to offer its services to the popula‑ tion as direct and indirect climate related health issues continue to arise. Ebi et al. (2018) discuss the importance of the adaptive capacity of the health sector in order to deal with the challenges of climate variability. Countries’ adaptability and strategy in the health sector may help build resilience for the many health centers and its only tertiary hospital located near the seashore. In addition, revising healthcare SPJ policies are key to address the challenges of the most vulnerable in accessing healthcare under difficult conditions brought about by climate-related events. Another approach to make the healthcare industry more adaptable and resilient to environmental changes is the use of agile technology (Chakraborty et al. 2021).
Strengthening human capital in an EGD envi‑ ronment will not be possible without adequate funding of the health sector. The increased demand for health services outlined above emphasizes the importance of sufficient funds to deliver efficient,
66 MAKING THE EUROPEAN GREEN DEAL WORK FOR PEOPLE
Better social registries improve the ability to identify vulnerable individuals more accurately
The health sector will play an important role in responding to the labor market disruptions expected during the green transition
effective, innovative and climate-smart health care despite the pressures to use resources elsewhere. Disinvesting of the health sector is not a solution to finance even EGD policies.
Social protection and jobs
Social protection programs will play a key role in identifying and assisting individuals who are harmed by the green transition. The Just Transition Fund specifies that activities backed by the fund must contribute to the alleviation of the negative impacts of the green transition, including employment loss, to help mitigate its unintended consequences (Fleming and Mauger 2021). Sabato and Frotenddu (2020) emphasize the importance of strengthening social services and income security as an important factor in the just transition, especially for sectors most negatively affected by the departure from fossil-fuels and other carbon-intensive industries.
Investment in information systems used in so cial protection programs will be important for sup porting the green transition. Better social registries improve the ability to identify vulnerable individuals more accurately. In Chile, for example, post-disaster household-level data collection tools that are integrated into the social protection system allowed for a better assessment of the level of support needed by disaster-affected households (Bowen et al. 2020). Better information also can help tailor the response to people’s profile and needs. Risks do not affect ethnic minorities, women and men, girls and boys equally; and the ability to cope with shocks also varies substantially according to people’s profile and identity.
Social protection programs will have to address the many vulnerable households adversely af fected by the rise in energy prices. For instance, hot temperatures can mean a risk to vulnerable households lacking energy-efficient cooling infrastructure in the context of the green transition. Rodriguez-Alvarez et al. (2021) find a positive relationship
between social protection expenditures and energy-poverty reduction at the country level for member states of the EU. Conscious of the challenges faced by lower-income households to access energy at affordable prices, social protection measures must be studied to assess ways to include the most vulnerable in the green transition in a sustainable manner given the long-term nature of the EGD’s goals. In addition to providing sufficient income, the analysis and proposal of appropriate alternatives to air conditioning in the context of energy-poverty and investment in such adaptation of infrastructure can help mitigate these effects (Thomson et al. 2019). Desvallées (2022) finds that housing providers adopt passive measures to provide thermal services that avoid heating and cooling appliances, nevertheless, low-income households closely monitor energy use as they struggle to cover related expenses. Programs can help poor households to insulate homes, move to solar energy, or undertake other improvements that will reduce energy costs.
The impact of energy price rises on the poor can be eased without encouraging greater fossil fuel consumption. In Ukraine, for example, the Government embarked on the re-parametrization of the household utility subsidy (HUS), aimed at reducing its coverage and improve its targeting, and to alleviate energy poverty. The reform effort strengthened incentives for HUS beneficiaries to spend less on energy-related utility services and to invest in energy efficiency. The project supports new eligibility rules for the HUS that restrict the provision of excessive energy subsidies and thus results in lower household energy consumption. In Albania, households identified as vulnerable received cash benefits intended to offset the cost of electricity. Payments are unconditional: eligible households do not need to consume a specific amount of electricity (or, in fact, any electricity at all) to receive the benefit. In 2017, the Bank provided technical assistance on targeting this assistance to better address energy poverty (World Bank 2017).
67 3. Human Development Policies and the Green Transition
Social protection programs will have to address the many vulnerable households adversely affected by the rise in energy prices
Existing and rising poverty and vulnerability in Europe can be addressed through carbon abating policies. The Europe and Central Asia (ECA) region already spends on average 9.2 percent of GDP, and some countries like Poland nearly 13 percent of GDP, in SP interventions, including social assistance measures, which in turn include targeted energy subsidies (Figure 3.4) that have a real impact in poverty reduction (Figure 3.5). However, recent pressures
stemming from energy price increases hint at potentially greater needs. Additionally, in some countries where the influx of Ukrainian refugees and displaced population groups (e.g. Poland, Bulgaria), SP needs are mounting. The EGD’s unintended consequences may place an additional burden on governments to meet growing needs. But at the same time, the EGD can be an opportunity. The savings from the removal of fossil-fuel based subsidies, as
Figure 3.4: Europe and Central Asian Countries’ Social Protection Spending
Source: SPEED (Social Protection Expenditure and Evaluation Database for Europe and Central Asia). 2022. Database, Washington, DC: World Bank. https://worldbankgroup.sharepoint.com/sites/SPL/ecaspeed/Pages/index.aspx.
3.5: Social Protection’s Impact on Poverty (ECA Region)
Source: SPEED (Social Protection Expenditure and Evaluation Database for Europe and Central Asia). 2022. Database, Washington, DC: World Bank. https://worldbankgroup.sharepoint.com/sites/SPL/ecaspeed/Pages/index.aspx.
68
EUROPEAN GREEN DEAL WORK
PEOPLE
MAKING THE
FOR
Figure
−6 −5 −4 −3 −2 −1 0 TJK2011 BIH2007 KGZ2018 MNE2015 UKR2018 MKD2017 TUR2018 ARM2018 ALB2017 POL2016 KSV2017 SRB2018 ROU2016 MDA2018 KAZ2018 BGR2007 GEO2018 Per centage point r eduction in poverty
0 2 4 6 8 10 12 14 16 18 UKR-2017ROU-2017POL-2012SRB-2019UZB-2017BGR-2017HRV-2014MKD-2019BLR-2017HUN-2016KGZ-2017MNE-2019EST-2017LVA-2017CZE-2017ALB-2019RUS-2016TUR-2016MDA-2017BIH-2017LTU-2016KSV-2017GEO-2018ARM-2017AZE-2019KAZ-2017TJK-2017SVK-2017 % of GD P General subsidies Labor market programs Social assistance Social care services Social insurance
well as carbon taxes, could be redirected to offset the disproportionate burden the poor bear through carbon taxes. Through the relocation of these funds to social protection, governments can implement these mitigation reforms without hurting the poor and vulnerable, which opens the fiscal space to strengthen social protection.
Temporary income support will be required for workers who lose jobs and cannot transition to new jobs/attain new skills for their current job. Cash transfer programs (CTPs) have been used to protect the poor and vulnerable affected by shocks. CTPs can be a useful tool to mitigate the unintended consequences of the green transition. In situations such as mine closures in Poland, where some workers, because of age, for example, will not transition to new jobs and who will need support for some time after losing their source of income, temporary income support can be channeled through: (i) severance or other forms of termination payments; (ii) unemployment insurance; (iii) social assistance payments; and (iv) early retirement incentives. The most vulnerable, i.e., younger workers with term contracts and the self-employed, will be those most in need of complete packages to cushion the impact of unemployment through social assistance programs. More generally, social insurance is an important source of support for those who temporarily lose their jobs. Early retirement schemes and bridge pensions could also assist those who lose jobs as a result of the green transition, though they have to be carefully designed and targeted to avoid work disincentives effects. Not only that, but experience shows
that in addition to SPJ policies, successful mine closures require ex-ante investment in local capacity building (World Bank 2020b). According to Cunningham and Schmillen (2021), sound management of job displacements can contribute to mitigating the social consequences, strengthen morale and productivity, and improve the efficiency of structural change. Programs also can pay individuals to support the environment. Payments for environmental services are essentially CTPs with conditionalities tied to land-use and conservation. Their main objective is to incentivize beneficiaries to conserve environmental assets or use them in a sustainable manner. These programs can, for instance, support behavioral changes to manage critical ecosystems, such as forests and small fisheries. Albania, for example, recently undertook several tasks, including the drafting of watershed payment agreements, to create the enabling framework for supporting sustainable natural resources and livelihoods through provision of ecosystem services.38 Alternatively, programs can inform households about changes in behavior that would contribute to the green transition. For example, Germany’s Stromspar Check (SSC) advisers provide free consulting services to low-income households on how to save energy and water, among other issues relevant to the green economy. The group has advised more than 382,000 households since 2008, with average cost savings per household between 100-250 euros a year Cedefop (2018c).39 Finally, public works programs used to provide temporary income support can be directed to the provision of environmental goods. For example, a
69 3. Human Development Policies and the Green Transition
Temporary income support will be required for workers who lose jobs and cannot transition to new jobs/attain new skills for their current job
The impact of energy price rises on the poor can be eased without encouraging greater fossil fuel consumption
program in Armenia paid participants to plant trees along riverbeds to protect the country from erosion and floods. More than 2 million trees had already been planted as of June 2020 (OECD 2020b).40
Policy Coverage and Preparedness in Strategic Documents: EU and Case-Study Countries
The challenges that EU countries face in support‑ ing the EGD, and the degree of progress in imple menting policies to address these challenges, var ies considerably across countries. Some insight into the extent of government involvement in the policies required to achieve the green transition can be gleaned by the coverage of relevant issues in government strategies. Of course, reading statements in strategy documents is not the same as observing programs being implemented or the allocation of budgetary resources. But at this early stage of the EGD, such statements are a useful signal of government intentions. We examined strategic documents in Croatia, Poland, and the Slovak Republic issued since the EGD to provide a snapshot of the coverage of policy areas critical to achieving the green transition that have been discussed in this chapter (the documents reviewed are listed in the Annex G). These can be divided between policies designed to mitigate the impact of the unintended consequences of the EGD on individuals and regions adversely affected, those designed to help societies adapt to the
Table 3.2: HD Policy Analysis Matrix
new policy framework, and a third set that may serve both purposes (Table 3.2). The policy statements in strategic documents from the three countries were coded by the policy areas from Table 3.1 to produce a matrix indicating the coverage area of policies in each document (Table 3.3).
The extent of policy coverage differs consider‑ ably across the three countries. None of the three mention all of the policy areas from Table 3.1 in their strategy documents. Croatia has the broadest coverage and Poland the narrowest, particularly in education and health.41 Coverage in the Slovak Republic and Croatia is similar in health and education, but coverage is much broader in Croatia for policies related to social protection and jobs. To an extent, these differences in policy coverage reflect the varying economic positions of the three countries:
• The EC found that Croatia’s Recovery and Resilience Plan addresses a significant subset of the challenges and recommendations from the European Semester. Croatia’s broad coverage is consistent with the generally positive response to the EGD (Slijepčević and Villa 2021)42—the European Investment Bank found that 85 percent of Croatians believe climate change has negative impact (one of the highest percentages in the EU) and Croatia needs to increase energy independence, as it currently imports 56 percent of its energy.
• While the Slovak Republic is one of the fastest growing countries in the EU, the country faces socio-economic challenges due to poor educational outcomes, weak health outcomes, and one
70 MAKING THE EUROPEAN GREEN DEAL WORK FOR PEOPLE
Sector Mitigating Mitigate and Adapt Adapting Education 1. Foundation skills 2. Human capital development 3. Innovation 1. Dynamic curricula 2. Involvement of private sector in curricula changes 1. Adapt schools to learning under climate change 2. Improved educational attainment will raise climate awareness Health 1. Promote healthy lives 2. Continuity of service delivery, including mental health support 3. EGD impact monitoring 4. Promote universal social protection 1. Use strategic purchasing to promote EGD aligned suppliers 1. Health-sector skills in line with EGD 2. Invest in healthy lives to improve productivity 3. Green Hospitals to progress towards carbon neutrality and Human Capital outcomes Social protection and jobs 1. Integrated social assistance 2. Compensation and retraining 1. Foster private sector cooperation 1. Adapting reskilling framework to new demand 2. Adapting PES activities to new occupation 3. Adapting labor code 4. Adapting social insurance
Table 3.3: Multi-Country Human Development Policy Analytical matrix for the Slovak Republic, Croatia, and Poland
of the lowest levels of life expectancy in the EU.43 Analysis of the Slovak Republic’s Recovery and Resilience Plan (2020) found that it has a strong focus on inclusive education, improvements to the health system, public governance and productivity-enhancing green and digital transitions. The EC notes that the Slovak Republic lacks adequate investment in the green transition: most funding is going to Cohesion Policy and public finance, with some for-environment protection and resource efficiency.
• Poland’s Recovery and Resilience Plan has still not been approved by the EC/EU and as a result, there has not yet been an EC analysis of the plan.
Poland’s path in the EGD faces internal political challenges due to its heavily coal-dependent energy sectors. The tensions between Poland and the EU over the rule of law principles, as well as tensions about burden sharing, climate energy market integration, and energy security concerns have resulted in funding from the EU to Poland being put on hold (Elkind and Bednarz 2020).44 However, the economics of the coal industry in Poland are beginning to shift (employment in the coal mining industry has dropped significantly since 1990) and there is growing public support for climate policies, particularly in light of low air quality (of the top 50 EU cities with worst air quality, 36 are in Poland).
71 3. Human Development Policies and the Green Transition
Strategy document Human development sector Education Health Social protection and jobs The Slovak Republic 1.1 1.2 1.3 2.1 2.2 3.1 3.2 4.1 4.2 4.3 4.4 5.1 6.1 6.2 6.3 7.1 7.2 8.1 9.1 9.2 9.3 9.4 Recovery and Resilience Plan, EC Working Group Response x x x x x x x x x Integrated National Energy and Climate Plan for 2021–2030 x x x x Strategy of Environmental Policy until 2030 x x x Low-Carbon Development Strategy until 2030 Croatia 1.1 1.2 1.3 2.1 2.2 3.1 3.2 4.1 4.2 4.3 4.4 5.1 6.1 6.2 6.3 7.1 7.2 8.1 9.1 9.2 9.3 9.4 Recovery and Resilience plan, EC Working Group Response x x x x x x x x x x x x x National Reform Programme, 2020 x x x x x x x x x National Development Strategy 2030 x x x x x Poland 1.1 1.2 1.3 2.1 2.2 3.1 3.2 4.1 4.2 4.3 4.4 5.1 6.1 6.2 6.3 7.1 7.2 8.1 9.1 9.2 9.3 9.4 National Strategy of Regional Development 2030 x x x x x
4
ADAPTING TO A CIRCULAR ECONOMY
Economic Growth, Material Consumption, and Productivity


The rapidly expanding extraction and con‑ sumption of materials, which propelled global economic growth in the past cen tury, is increasing the pressure on, or transgression of, planetary boundaries. Over the past century, the twenty-three-fold growth in global GDP was accompanied by a near parallel increase in material extraction; for every one percent increase in global GDP, material consumption increased by 0.8 percent. Since the beginning of this century alone, the near tripling of GDP increased global material consumption per capita by 30 percent, from approximately 9.4 to 12.27 tons.45 Notwithstanding the contribution of GDP growth to poverty reduction and human development, the linear economic model (take-make-use-dispose) it relies upon, is depleting the Earth’s finite resources and is a major contributor to climate change: extraction and processing of natural resources is responsible for approximately 50 percent of global GHG emissions and over 90 percent of biodiversity loss (UNEP 2019).46 Even with intentional actions to reduce GHG emissions, the emissions-output elasticity stood at an average of 0.6
among the largest emitters (Cohen et al. 2018). In 2021, materials management in industry and agriculture alone accounted for 27 percent of the total 47 gigatons of GHG emissions (Figure 4.1). As such, materials extraction and consumption are said to cause the transgression of several planetary boundaries (Person et al. 2022; Wang-Erlandsson et al. 2022), including biogeochemical cycles, land use, chemical pollution (novel entities), and freshwater change (see Box 4.1 for a discussion of the common challenges EU countries face in controlling pollution).
During the last two decades, economic growth in the EU has been decoupled from material con sumption, mainly due to the decreased consump tion of fossil fuel materials. Between 2000 and 2020, the EU economy expanded by 22.5 percent while domestic material consumption (DMC) dropped from 6.5 to a little over 6 Gigatons, slightly over six percent of total global DMC. This reduction marks an absolute decoupling of economic growth from material consumption. During this period, the share of renewable energy of total energy consumption more than doubled, rising from nine to 22 percent in 2020. The decrease in consumption of fossil fuel materials by over 30 percent accounted for more than 90 percent of the total reduction in DMC. In contrast,
73 4. Adapting to a Circular Economy
Figure
(Continued next page) CLIMATE CHANGE OCEAN ACIDIFICATION STRATOSPHERIC OZONE DEPLETION BIOGEOCHEMICAL FLOWS FRESHWATER USE LAND-SYSTEM CHANGE BIOSPHERE INTEGRITY ATMOSPHERIC AEROSOL LOADING (Not yet quantified) NOVEL ENTITIES P E/MSY BII (Not yet quantified) N Below boundary (safe) In zone of uncertainty (increasing risk) Beyond zone of uncertainty (high risk) a. Planetary boundaries
4.1: Source of (a) Global GHG Emissions and (b) the Nine Planetary Boundaries
Box 4.1: Pollution Challenges across EU Countries
EU countries face a variety of challenges in reducing pollution of land, water and air. Principal components analysis can provide some insight into these issues by grouping countries according to common problems (see Annex F for the data and methodology used). In some cases, this analysis reveals policy priorities that apply to the countries in each cluster. Grouping countries according to the degree of pollution they face reveals two countries that have very atypical conditions (Iceland and Malta), and four clusters with reasonable sizes.
Cluster 1, which includes United Kingdom, Germany, Spain, France and Italy, has the highest values of sewage sludge production (1289 thousand tons in 2019) and disposal as well as the highest values of water and freshwater abstraction. It also has the lowest shares of population facing problems accessing quality water and the lowest average value for the water stress index. Overall, the evidence suggests that these countries do not present social problems linked to the use of water, but as they are the largest users of the resource, they should focus on making its use more efficient and develop recycling alternatives in cases that climate change events affect the current available water resources in the area.
(Continued next page)
74 MAKING THE EUROPEAN GREEN DEAL WORK FOR PEOPLE Figure 4.1 (continued) 0 10 20 30 40 50 60 70 80 2017 2019 2021 2023 2025 2027 2029 2031 2033 2035 2037 2039 2041 2043 2045 2047 2049 2051 2053 2055 2057 2059 Global GHG emissions in Gt CO2-eq Transport
b.
End users Industry Energy supply Agriculture
Sources of emissions
Sources: Panel (a), Planetary boundaries, designed by Azote for Stockholm Resilience Centre, based on analysis in Persson et al. (2022) and Steffen et al. (2015); Panel (b), OECD (2018).
The take-make-use-dispose model of GDP growth is depleting the Earth’s finite resources and is a major contributor to climate change
Figure B4.1.1: A Net-Zero Pollution Ambition for a Toxic-Free Environment Wards clustering

Source: Author’s calculations.
Note: Iceland, Norway and the United Kingdom, which are non-EU members, were included for benchmarking purposes only.
Cluster 2, which includes Romania, Latvia, Bulgaria and Lithuania, display an opposite story. This cluster has the lowest values of sewage and sludge production (87 thousand tons) and disposal. Most of their water comes from surface sources, as they have the fewest underground sources. However, they have the highest levels of population facing water challenges (10.4 percent) with Romania having the highest percentage (21.2%) of population not having proper bath and toilet facilities. Moreover, the countries in this cluster are getting worse on this indicator, at a higher rate than in any other cluster. However, this cluster also has the highest rate of decline on nitrogen oxides and particles from transport. The countries in this group seem to have significant challenges on the social aspect of water usage and the implications this can have for health. The recommendation in this case is to focus resources in improving sustainable access.
Cluster 3, which includes Estonia, Greece, Portugal, Lithuania, Hungary, the Czech Republic, Austria, Belgium, Finland, Denmark, Sweden, Netherlands, and Norway, has average results compared with the other three clusters regarding water pollution. It has the smallest population shares connected to urban wastewater and collection systems, but has also seen rapid improvement in this area. In contrast this cluster is rapidly increasing greenhouse gas emissions by sector as well as their intensity. The cluster saw its water productivity decrease by 16.1 in purchasing power standard (PPS) per cubic meter, which is the highest among all clusters. Thus, while the focus on pollution is more linked to greenhouse gases and sectors such as energy and transport, water could become a major problem in the future.
Cluster 4, which includes Poland, Cyprus, Croatia, the Slovak Republic, Ireland and Slovenia, has a similar structure to cluster 2, but with major gaps with respect to cluster 1. It does have low values of sewage sludge production and the water abstraction is the lowest among the clusters. It also presents the highest shares of population not connected to any wastewater collection system and the highest values of the water exploitation index. Adding to the former challenges, this area has the highest increment in emission of nitrogen oxides and particles linked to transport, and while quality water is decreasing, water abstraction is increasing. Thus, there is an urgent need for policies to find alternative sustainable sources of water that would not degrade the availability and quality of the resource over the long run.
75 4. Adapting to a Circular Economy
4.1 (continued)
Box
the consumption of metal ores increased by four percent, while consumption of biomass and non-metallic ores decreased only incrementally (Figure 4.2).


Though consumption of non fossil energy ma terials decreased across the EU, it increased in mul tiple EU member states. In per capita terms, EU DMC fell from 15.4 to 13.4 tons, while non-fossil energy materials only reduced by 0.6 tons, from 11.59 to 10.9 tons a year in 2020. Yet, the decrease in the latter has not been similar across all EU member states (MS). Consumption of non-fossil energy materials increased in 11 out of the 27 EU member states, with the highest increases observed in Romania and Estonia, rising by 22 and 15 tons per capita, respectively. In Croatia, Poland, and the Slovak Republic, non-energy DMC per capita increased by 3-4 tons per capita during the same period (Figure 4.3).
Only a few EU MS achieved absolute decou pling of economic growth from non fossil material consumption. Between 2000 and 2020, the annual rate of change of non-fossil material DMC surpassed the average annual economic growth rate in ten out


of the 27 EU member states, including Croatia. Absolute decoupling, meaning negative growth or absolute decrease in non-energy DMC, occurred in only six member states (France, the Netherlands, Spain, Portugal, Italy, and Sweden). At the same time, the rest have shown relative decoupling—an annual economic growth rate higher than DMC growth (Figure 4.4).
Non fossil material productivity increased in the EU, with significant improvement in several member states. Material productivity, a measurement of economic output per amount of materials consumed, has increased across the EU, barring Romania, Hungary, Sweden, and Denmark. The lack of improvement in non-fossil material productivity in these four MS is related to the notion that DMC growth outpaced GDP growth. The more economically advanced EU member states (Belgium, the Netherlands, Germany, France, Luxemburg, Italy, Ireland) have seen the most considerable improvements in material productivity during the past two decades (Figure 4.5).
76 MAKING THE EUROPEAN GREEN DEAL WORK FOR PEOPLE
Figure 4.2: Domestic Materials Consumption in the EU by Material, 2000 (internal ring) and 2020 (external ring), Thousand Tons
24% 5% 53% 18% 23% 4% 48% 25% Biomass Metalores Non-me tallic minerals Fossil energy materials 2020 2000
Source: Authors’ elaboration using Eurostat data.
Reduced fossil fuel consumption comprised a majority of the decline in domestic natural resource consumption
Figure 4.3: DMC and Non-energy DMC Per Capita in the EU and Selected Member States, 2000–2020
Source: Authors’ elaboration using Eurostat data.
Figure 4.4: Annual Change Rate of GDP and DMC in EU Member States, 2000–2020 (%)
Only a few MSs achieved absolute decoupling of GDP growth and non-energy DMC in the past two decades, implying that the latter are increasing in the majority of the EU
Source: Authors’ elaboration using Eurostat data.
77 4. Adapting to a Circular Economy
0 2 4 6 8 13.4 10.90 11.59 15.40 10 12 14 16 18 20 2000 2001 2002 2003 2004 2005 2006 2007 2008 2009 2010 2011 2012 2013 2014 2015 2016 2017 2018 2019 2020 DMC, tons per capita EU-27 Croatia Poland Slovakia EU 27+Energy
EU BE BG CZ DK DE EE IE EL ES FR HR IT CY LV LT LU HU MT NL AT PL PT RO SI SK FI SE −4.5 −2.5 −0.5 1.5 3.5 5.5 7.5 9.5 −1.0 0.0 1.0 2.03.0 4.0
Annual change rate of DMC (%) Annual change rate of GDP (%) No decoupling Relative decoupling Absolute decoupling
Though consumption of non-fossil energy materials decreased across the EU, it increased in multiple member states
Non-energy Materials Productivity (GDP/Non-energy DMC), 2000, 2010, 2020
Human Development and Pressure on Planetary Boundaries
Countries that achieved high and very high human development also exert greater pressure on plane‑ tary boundaries. The United Nations Development Program (UNDP) Human Development Index (HDI) is a relative measurement of health, education, and income outcomes in a given country. Though a high ranking on the HDI implies greater
welfare to citizens, its impact on planetary pressures has only recently been presented. Countries that have ranked high and very high (above 0.7) on the HDI also have relatively high CO2 emissions and material footprint per capita (Figure 4.6).
Countries with a high ranking in human devel opment and human capital indices see their rank ing decline significantly if planetary pressures are taken into account. In a recent effort to demonstrate how human development outcomes relate to these two factors, the UNDP created an experimental index using the HDI and an adjustment factor that
78 MAKING THE EUROPEAN GREEN DEAL WORK FOR PEOPLE
0 1 2 3 4 5 6 7 8 9
lCroatiaLatviaHungaryLithuaniaPolandEstoniaBulgariaRomania 2020 2000 2010 Material-r esour ce use (GDP/DMC, eur os per kg)
NetherlandsLuxembourg ItalyBelgiumGermanyFranceIreland SpainMaltaEU27AustriaDenmarkGreeceSloveniaCzechiaSwedenSlovakiaCyprusFinlandPortuga
Figure 4.5:
Source: Hickel 2020. 0 5 10 15 20 25 30 35 40 0.2 0.3 0.4 0.5 0.6 0.7 0.8 0.9 1.0 CO 2 emisisons per capita (t) HDI (2019) ranking
HDI
Emissions (production) per capita 0 5 10 15 20 25 30 35 40 45 50 0.20.3 0.40.5 0.60.7 0.80.9 1.0 Materials Footprint per capita (t ) HDI (2019) ranking
per capita
Source: Authors’ elaboration using Eurostat data. Figure 4.6: Countries’ HDI Ranking, CO2 Emissions, and Material Footprint Per Capita
a.
ranking and CO2
b. HDI ranking and materials footprint
accounts for the materials footprint and CO2 emissions. Comparing countries’ planetary pressure-adjusted human development index (PHDI) to the HDI ranking reveals that countries previously ranked at the top now receive a significantly lower ranking due to the impact on the environment. Drawing on the UNDP’s adjustment factor, and the World Bank’s Human Capital Index—a measurement of the potential human capital a child born today will attain by the age of 18—we calculated the planetary pressure adjusted HCI (PHCI). Most EU member states that rank higher on the HCI, also drop significantly lower due to their relative higher pressure on planetary boundaries (Figure 4.7). Noticeably, the Slovak Republic also drops 0.1 points on the PHCI.
Alternative economic models that focus on hu‑ man welfare and environmental impact may pro vide policymakers with valuable insights . Recently, there has been a growing awareness that GDP, and thus GDP growth, may not be a suitable metric for assessing human well-being, particularly when considering the efforts required to tackle climate change (IPCC 2022b). Furthermore, there is
growing evidence that combating poverty and providing adequate living standards can be attained without significant global emissions growth (IPCC 2022b). In contrast, newly developed economic models that aim to shift the focus away from economic growth while taking account of the need to mitigate and adapt to climate change are gaining greater recognition of their potential to inform policymaking (EEA 2021). The doughnut economics framework, which measures countries’ attainment of the UN’s Sustainable Development Goals and transgressions of planetary boundaries, demonstrates how no country has managed to bring its citizens to live inside the ‘safe and just space’ (Fanning et al. 2021). Examining the performance of Croatia, the Slovak Republic, and Poland using the Doughnut Economics framework further highlights how some countries have transgressed several planetary boundaries during the past two decades while not attaining all social objectives specified by the Sustainable Development Goals (SDGs). Specifically, all three countries mentioned above did not meet their life satisfaction and employment targets (Figure 4.8).
Most EU countries with higher HCI rankings drop once their relative higher pressure on planetary boundaries is considered
4.7: Human Development and Human Capital Indices Adjusted by Environmental Pressure
79 4. Adapting to a Circular Economy
Source:
Note:
US ECA 0.300 0.400 0.500 0.600 0.700 0.800 0.900 1.000 0.300 0.400 0.500 0.600 0.700 0.800 0.900 1.000 HDI (2019) Planetary pr essur es adjusted HDI (2019) Austria Belgium Bulgaria Croatia Estonia Finland France Germany Greece Hungary Poland Portugal Romania Slovakia Sweden 0.50 0.55 0.60 0.65 0.70 0.75 0.80 0.85 0.50 0.55 0.60 0.65 0.70 0.75 0.80 0.85 HCI Planetary pr essur e-adjusted HC I a. HDI and PHDI b. HCI and PHCI
Figure
Author’s elaboration based on UNDP (2020) (panel a), authors’ calculations using the World Bank (2020) (panel b).
Yellow dots represent EU member states.
Note: The Y-axis measures the distance away from achieving the SDGs, and the X axis measures transgression of planetary boundaries. A country with no social shortfall and no transgression of planetary boundaries will thus be found on the top-left corner. As can be seen, richer nations, which achieved most of their SDGs but transgressed planetary boundaries are clustered across the upper X-axis, with Canada, the US, and Australia showing the highest levels of transgression. In contrast, poorer nations, due to their social shortfall (missing SDGs targets) and limited impact on planetary boundaries, are located on the Y-axis, depending on the average extent of their social shortfall. The bottom figures present the social shortfalls and ecological overshoot of Croatia, the Slovak Republic, and Poland 1992 vs 2015. The shaded red color represents the 2015 results.
The EU’s Transition to the Circular Economy
The transition to the circular economy, essential elements, and benefits
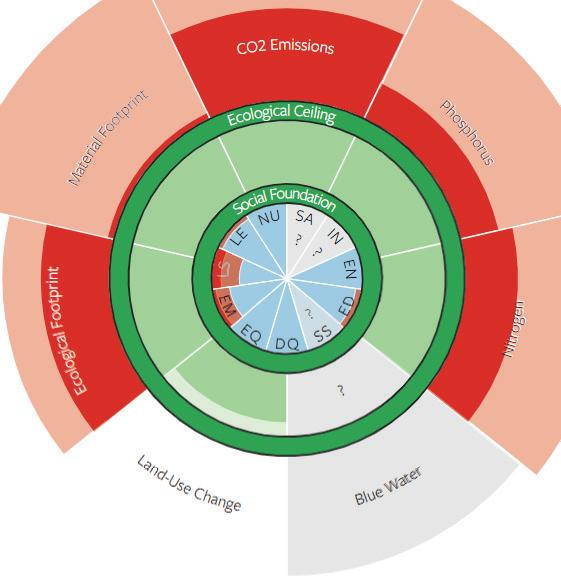
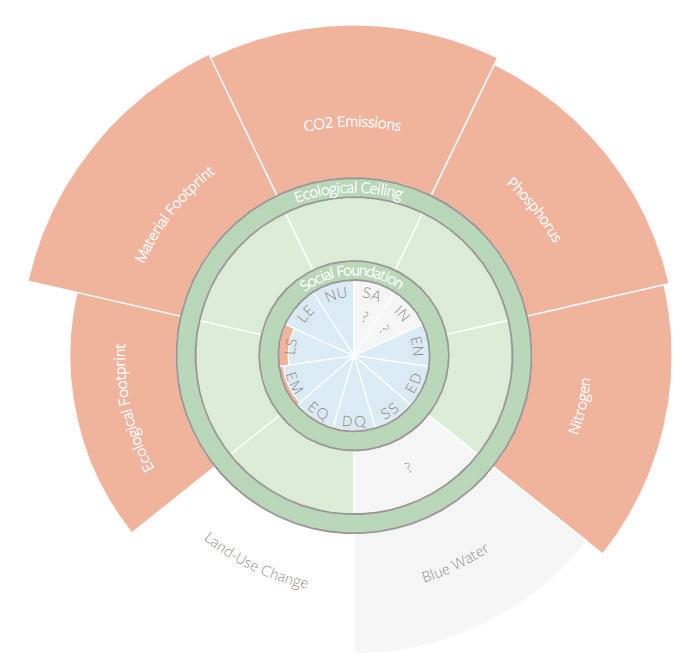
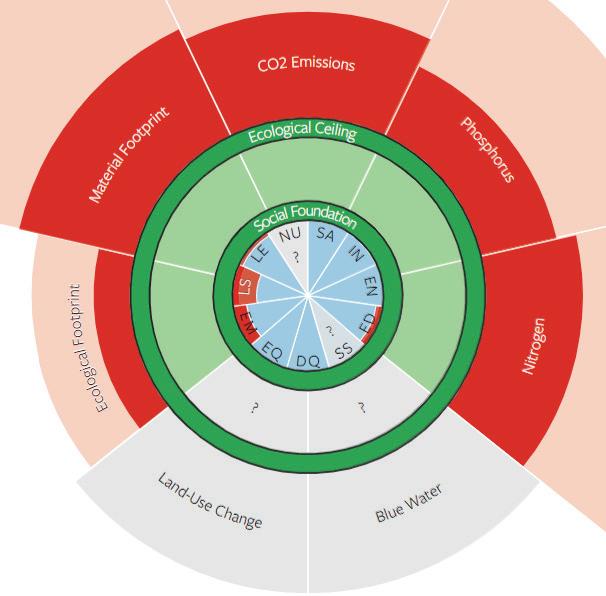
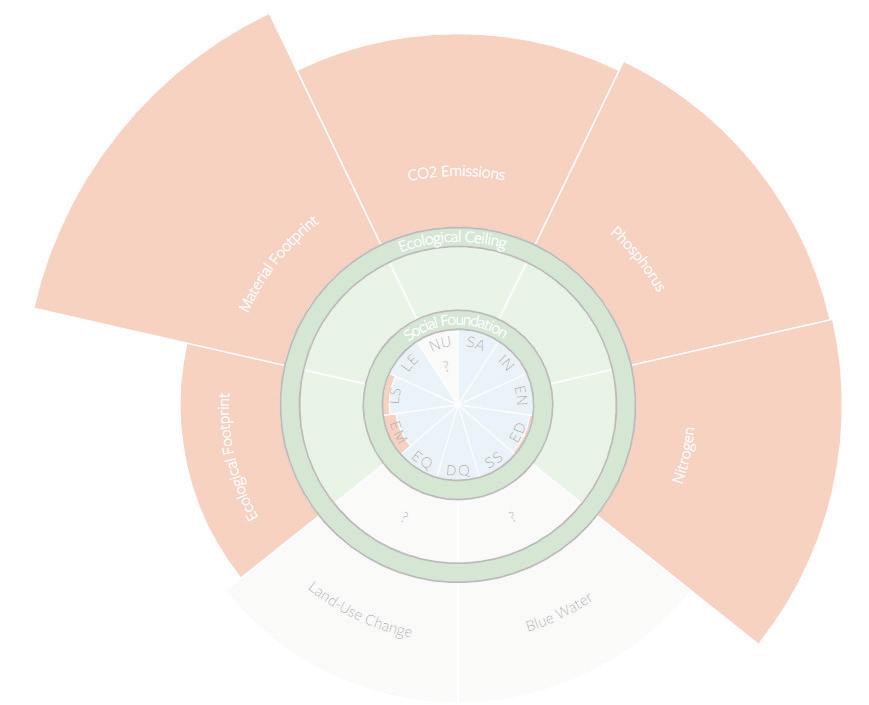
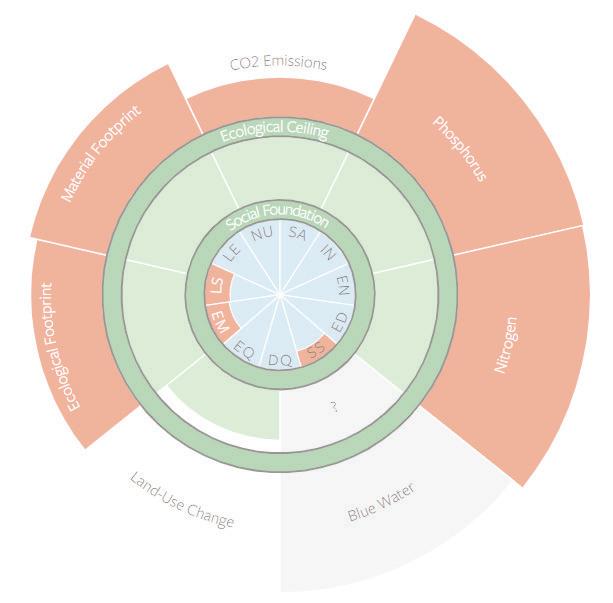
By minimizing the extraction, consumption, and disposal of natural materials and maximizing re source efficiency, the CE is regarded as a viable
option for mitigating and adapting to climate change and attaining several SDGs. The CE model advances systematic ways for the recovery and reuse of products and materials through closing production and consumption loops. The transition to the CE model is regarded as a viable instrument for meeting several SDGs, including SDG 6 (Clean Water and Sanitation), SDG 7 (Affordable and Clean Energy), SDG 8 (Decent Work and Economic Growth), SDG 12 (Responsible Consumption and
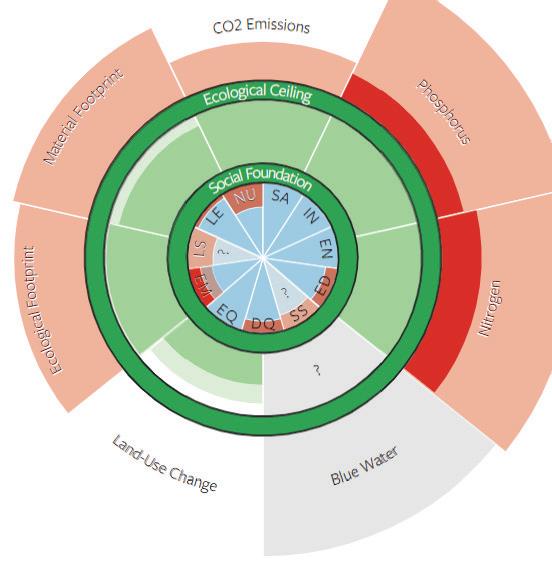
80 MAKING THE EUROPEAN GREEN DEAL WORK FOR PEOPLE
Figure 4.8: Social Shortfalls and Ecological Overshoot in Case-study Countries
a. Croatia b. Poland
c. Slovakia
Production), and SDG 15 (Life on Land). Recent country-level evidence has also shown that municipal waste management has contributed significantly to countries’ environmental, social, and economic goals, including reducing global GHG emissions and improving economic security and working conditions for lower-income urban populations (World Bank 2022b). Lastly, the IPCC (2022b) has found ‘moderate evidence that CE can reduce overall emissions, energy use, and activity levels, with medium agreement on the scale of potential saving. Though
4. Adapting to a Circular Economy
the CE model has various applications, the nine Rs framework (Potting et al. 2017), has been widely accepted as a benchmark for strategies that enable the transition to the CE (Figure 4.9). The butterfly diagram, presented by the Ellen MacArthur Foundation, provides a visual representation of two types of cycles in the CE model: a biological cycle (left), where natural materials are returned back to nature, and a technical one, where products, components, or materials are designed and marketed to significantly reduce waste.
The “butterfly diagram”
81
By minimizing the extraction, consumption, and disposal of natural materials and maximizing resource efficiency, the CE can help address climate change and attaining SDGs
(Continued
FARMING/COLLECTION1 BIOCHEMICAL FEEDSTOCK REGENERATION BIOGAS EXTRACTION OF BIOCHEMICAL FEEDSTOCK2 CASCADES COLLECTION MINIMISE SYSTEMATIC LEAKAGE AND NEGATIVE EXTERNALITIES PARTS MANUFACTURER PRODUCT MANUFACTURER SERVICE PROVIDER COLLECTION USER BIOSPHERE FINITE MATERIALS RENEWABLES RENEWABLES FLOW MANAGEMENT STOCK MANAGEMENT RECYCLE REFURBISH/ REMANUFACTURE REUSE/REDISTRIBUTE MAINTAIN/PROLONG SHARE CONSUMER ANAEROBIC DIGESTION SOURCE Ellen MacArthur Foundation Circular economy systems diagram (February 2019) www.ellenmacarthurfoundation.org Drawing based on Braungart & McDonough, Cradle to Cradle (C2C) 1 Hunting and fishing 2 Can take both post-harvest and post-consumer waste as an input
Figure 4.9: The “Butterfly Diagram” for the Circular Economy (panel a) and the Nine Rs Framework (panel b)
a.
next page)
The CE could pose significant health risks to communities and individuals that engage in waste treatment
The European Commission has adopted a com prehensive plan to transition to the circular econ omy, an integral part of the EGD. Recognizing the potential benefits of the CE model, the EU adopted a comprehensive package to support its member states in implementing it. The Circular Economic Action Plan (CEAP), adopted in 2020, includes legislative and non-legislative measures that target reducing reliance on the extraction of raw materials in seven product value chains.47 The transition to a CE model is one of the main pillars of the EGD and a prerequisite for achieving the climate neutrality and biodiversity loss objectives (Box 4.2 provides a principal components analysis that sheds light on the
biodiversity challenges the EU faces). The EC is determined to make the CE a backbone of the EU industrial strategy, including by enabling circularity in new areas and sectors, normalizing life-cycle assessments of products, and broadening eco-design as much as possible (EC 2020).
The transition to the CE is projected to include multiple benefits, though its distributional effect requires further research. Recent efforts to quantify the impact of the transition to the circular economy highlighted multiple benefits, including economic, ecological, health, and social. The increased use of secondary materials in manufacturing, mobility, and built environment systems is projected to result in
82 MAKING THE EUROPEAN GREEN DEAL WORK FOR PEOPLE
Figure 4.9 (continued)
b. The nine Rs framework
Sources: Ellen MacArthur Foundation for panel a; Kirchherr (2017) for panel b.
Box 4.2: Restoring Ecosystems and Biodiversity in the EU
EU countries face a variety of challenges in restoring ecosystems and biodiversity. Principal components analysis can provide some insight into these issues by grouping countries according to common problems (see Annex for the data and methodology used). In some cases, this analysis reveals policy priorities that apply to the countries in each cluster. Except for two countries (United Kingdom and Malta) with atypical issues, the analysis defines four major clusters.
Cluster 1, which includes Estonia, Latvia, Iceland, Norway, Finland and Sweden, has the highest share of forest area among clusters, and while it doesn’t have a large surface area under Natura 2000, it is the cluster that is increasing it the most. Also, it has the lowest soil sealing index and lowest erosion levels. This strongly suggests that nature is still significantly preserved, so that policies should aim for protection rather than recovery.
Figure B4.2.1: Preserving and Restoring Ecosystems and Biodiversity
Wards clustering
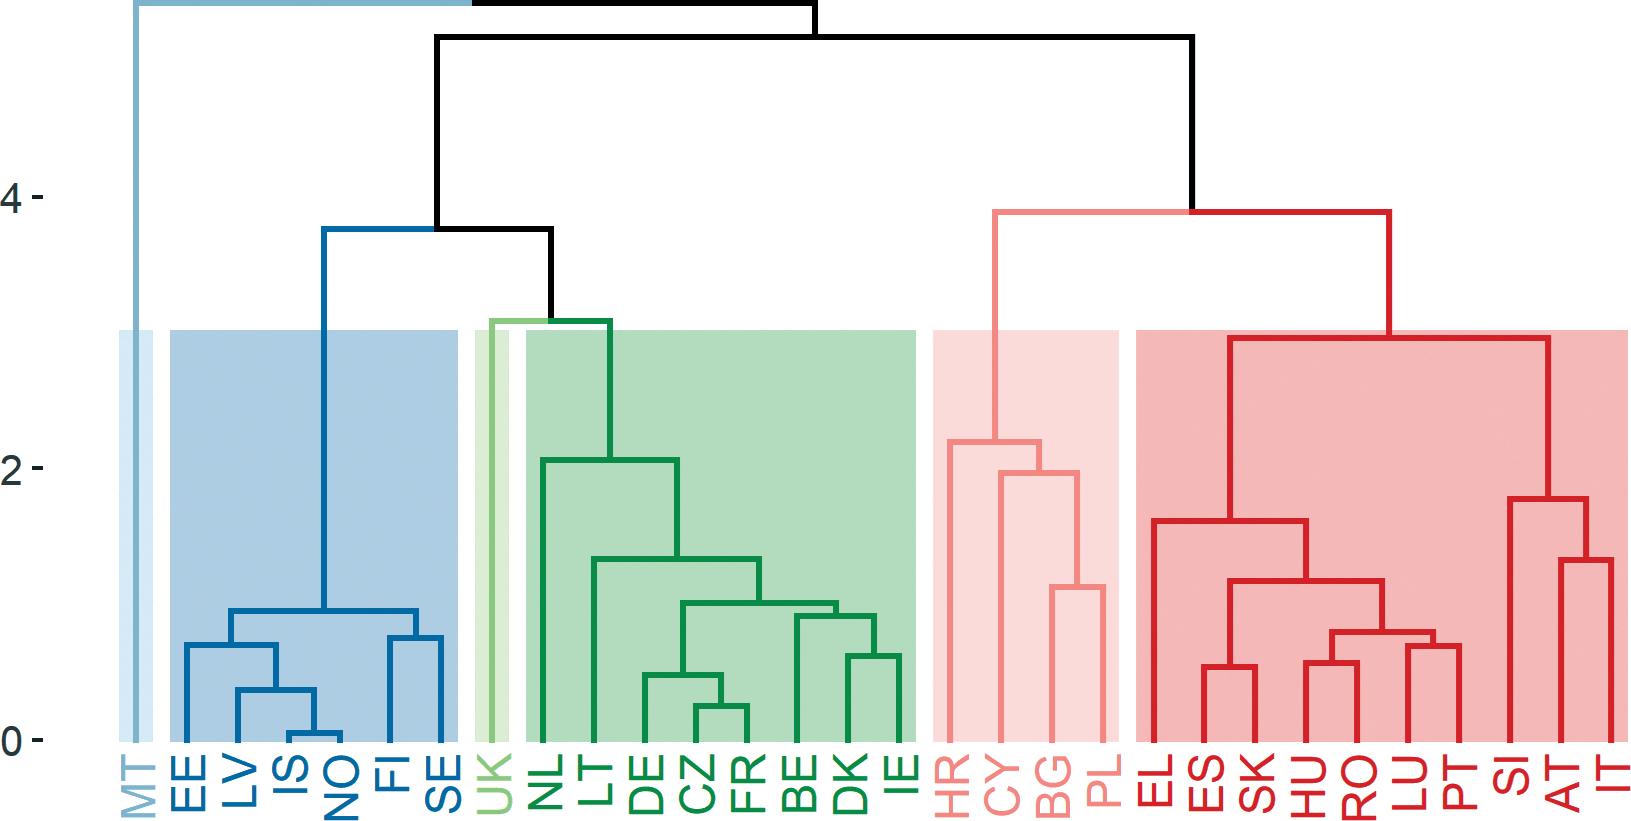
Source: Author’s calculations.
Note: Iceland, Norway and the United Kingdom, which are non-EU members, were included for benchmarking purposes only.
Cluster 2, which includes Netherlands, Latvia, German, the Czech Republic, France, Belgium, Denmark and Ireland, is an average cluster. Due to the geographical location of its members, it has a relatively high percentage of bathing sites with excellent water quality, it also has a very low soil erosion rate. However, the cluster has limited forest coverage or protected sites. In contrast to the first cluster, greater efforts are required in restoration and protection of ecosystems; it can’t only rely in conservation.
Cluster 3, which includes Croatia, Cyprus, Belgium and Poland, is doing poorly with respect to the previously mentioned indicators. It has a good share of forest and has the highest share of Natura 2000 surface area, but it also has the highest rate of deforestation of all the clusters. Indeed, three of its four countries are in the highest top 5 EU countries in terms of deforestation. Moreover, the bathing sites are the smallest (on average) of all the area. In this case the recommendation goes beyond restauration, and to develop policies to stop the processes causing the environmental damage.
Cluster 4, which includes Greece, Estonia, the Slovak Republic, Hungary, Romania, Lithuania, Portugal, Slovenia, Austria, and Italy, is mostly the Mediterranean and the Danube. This cluster has large shares of surface area designated under Natura (in average, only below cluster 3). Nevertheless, it has the highest percentage of area affected by severe soil erosion (9.9% in 2016, with Italy having the highest share of 24.9%) and there are increasing challenges in the reduction of water quality. Therefore, this cluster needs to focus strongly on the degradation of the ecosystem services (water and soil).
83 4. Adapting to a Circular Economy
annual savings of 600 million euros worth of primary raw materials in the EU (EEA 2016). Ecological benefits include the reduced dependence on extraction of primary raw materials and a significant reduction in GHG emissions and externality costs related to manufacturing, mobility, and built environment systems. The reduced dependency on primary research extraction will also reduce European countries’ dependence on imports, making them less exposed to potential disruptions to supply chains (EC 2018). Recent estimates predict that a transition to the CE can generate a net employment increase of circa 0.3 percent or between 650,000700,000 jobs in the EU by 2030 (EC 2018). Yet, these estimates include diverging impacts between sectors, with a significant increase in the waste management sector and a negative impact on employment in the construction sector of above 0.10 percent.
The transition to CE is projected to result in multiple direct and indirect health benefits. Implementing circular practices improves both mental and physical health of individuals by assisting to regulate local climate, noise, air and water pollution, as well as creating spaces that encourage active and healthy lifestyles. Furthermore, the increased availability of spare parts is projected to result in savings of about EUR 170 million for European hospitals (WHO 2018).
Risks related to the transition to the CE
The impact from the transition to the CE will vary significantly between economies and communi ties. Besides potential benefits attributed to the transition to the CE highlighted above, there are also considerable risks that need to be addressed to ensure that no communities or regions are bearing a disproportionate amount of the potential negative externalities. The risks associated with the transition to the CE include health risks and job elimination.
Yet, the distributional effect of this transition is not fully clear and is dependent on the actions that individual MSs implement in order to address it.
The CE could pose significant health risks to communities and individuals that engage in waste treatment. The transition to the CE, and specifically the increased dependence on waste treatment, poses significant health risks to communities and groups that are more represented in this sector. A World Health Organization (WHO) assessment of the potential health impact of the transition to the circular economy concluded that since vulnerable communities are disproportionally represented in lower skills sectors such as waste management, they may face greater health risks due to their exposure to hazardous materials: chemicals of concern (common in e-waste), food packaging, fire retardants and biowaste compost (WHO 2018). At the same time, vulnerable communities, specifically those residing in areas of increased environmental risks, are projected to benefit more from the reduced emissions and air pollution attributed to the CE. Though the overall distributional effect of both the negative and positive health benefits require further research, there are significant health risks that need to be addressed.
Job elimination is projected to impact commu nities and individuals that rely on industries that will be deemed obsolete and cannot be adjusted to CE. The importance of the manufacturing sector, which is central to the CE, varies significantly across EU member states. Manufacturing accounts for as high 35 percent of total employment in Ireland, and as low as 13 percent in Luxemburg. While the overall transition is projected to result in a net positive gain across the EU, member states and regions that can more easily adopt CE practices are more likely to gain jobs, while those who face greater challenges are likely to experience job elimination (Figure 4.10).48
The variance in adult participation in education and training between member states may indicate
84 MAKING THE EUROPEAN GREEN DEAL WORK FOR PEOPLE
Job elimination is projected to impact communities and individuals that rely on industries that will be deemed obsolete and cannot be adjusted to CE
varying capacity in supporting workers to adjust to change in the demand for skills. Circular activities are projected to increase demand for low-medium level skills in sectors such as remanufacturing, repair and recycling and may also replace high-skill manufacturing jobs with low-skill service jobs related to the sharing economy and digitization (World Bank 2022a). As such, facilitating the transition to CE requires enabling workers to adapt to changing demand in skills. In 2016, adult participation in training varied from below 10 percent in EU member states such as Croatia, Romania, Bulgaria, and Greece to above 50 percent in the Netherlands, Austria and Hungary. This dispersion implies that not all member states have the capacity to support adult workers in adjusting to the transition to CE and thus risk widening existing gaps (Figure 4.11).
Monitoring performance on the circular economy
The adoption of the CE varies significantly across member states, according to the monitoring frame work adopted for the CEAP. The European Commission’s monitoring framework includes ten indicators divided into four categories: production and consumption, waste management, secondary raw materials, and competitiveness and innovation. Each of the first three categories includes 11, 38, and 39 indicators. The competitiveness and innovation category consists of two sub-categories: private investments, jobs, and gross value added related to circular economy sectors and patents related to recycling and secondary materials. In 201849, across the EU, CE sectors and economic activities accounted
85 4. Adapting to a Circular Economy
Figure 4.10: Share of Manufacturing in Total GDP and Employment in the EU, 2018
EU27 LuxembourgCyprusMaltaGreeceFranceNetherlands SpainLatviaPortuga lCroatiaSwedenDenmarkEstoniaBelgiumBulgaria ItalyFinlandLithuaniaAustriaPolandRomaniaGermanyHungarySlovakRepublicSloveniaCzechRepublicIreland 0 5 10 15 20 25 30 35 40 Shar e of total (%) Value added Employment
Source: Author’s elaboration using Eurostat data.
Circular activities are projected to increase demand for low-medium level skills in sectors such as remanufacturing, repair and recycling and may also replace high-skill manufacturing jobs with low-skill service jobs related to the sharing economy and digitization
Figure 4.11: Participation Rate in Education and Training, 2010 and 2020 Percent of people aged 25–64 in the last 4 weeks 2010 and 2020
The share of adults (25–64 years old) who participated in training in the past 4 weeks increased across the EU but remains low or decreased in several members states
for less than one percent of the EU’s GDP and less than two percent of total employment, with moderate variations across member states (Figure 4.12). The share of CE-related employment in total employment is highest in Lithuania at 2.7 percent and lowest in Belgium at 1.1. The circular economy sector accounts for as high as 1.5 percent of value added in Croatia and less than 0.5 percent in Greece.
Despite ongoing efforts, the EU has not met its e waste management targets, with several member states lagging significantly behind. Despite outperforming all other regions in the world with regards to e-waste management, in 2019 the EU collected less than 50 percent of total waste from electric and electronic equipment (WEEE), well below its 2019 target of 65 percent. Bulgaria, Croatia and Poland are the only member states that met the 2019 target set by the EC directive on e-waste management, while others, including Romania, Italy and Portugal have yet to meet the 2016 target of 45 percent (Figure 4.13). 50 An assessment by the European Court of
Audits concluded that several member states lack the necessary resources to carry out the legally required controls to avoid mismanagement of e-waste (ECA 2021).51 The failure to reach targets is further hampered by the lack of reliable data on end of life of EEE, which leaves ample room for potential health risks associated with mismanagement of the WEEE. One reason may be related to market mechanisms. Firms still find it cheaper to use raw materials than reusing waste materials (World Bank 2022a).
A circularity index is calculated to measure the relative progress of MSs in three categories of the CEAP monitoring framework. The information contained in the sub-list of variables is processed via principal component analysis to obtain a single index that aims to measure the relative progress of individual member states in the first three categories of the CEAP monitoring framework (Box 4.3).52 The result of this exercise resulted in an index that (i) takes into account the variance structure of the topic variables, (ii) synthesizes the latent information
86 MAKING THE EUROPEAN GREEN DEAL WORK FOR PEOPLE
EU27 Luxembourg Cyprus Malta Greece France Netherlands Spain Latvia Portuga l Croatia Sweden Denmark Estonia Belgium Bulgaria Italy Finland Lithuania Austria Poland Romania Germany Hungary SlovakRepublic Slovenia CzechRepublic Ireland 0 5 10 15 20 25 30 35 Shar e of total (%) 2010 2020
Source: Author’s elaboration using Eurostat data.
Countries and regions that can more easily adopt circular economy practices are more likely to gain jobs
Gross value added as a share of GDP and circular employment as a share of total, 2018
87 4. Adapting to a Circular Economy
Author’s elaboration using Eurostat data
EU27 Luxembourg Greece France Netherlands Spain Latvia Croatia Sweden Denmark Estonia Belgium Bulgaria Finland Lithuania Austria PolandGermany Hungary SlovakRepublic Slovenia CzechRepublic Ireland 0 10 20 30 40 50 70 90 60 80 Rate of r ecycling (%) Share of EEE waste recycled as percentage of average weight put on the market in the preceding years 45% Target 65% Target
CE accounts for less than one
of
EU’s
employment
Figure 4.13: Recycling Rate of E-waste in the EU, 2018
Source:
(CEI_WM050).
The
percent
the
GDP and less than two percent of total
Figure 4.12: Circular Economy in the EU, 2018
Author’s elaboration using Eurostat data. EU27 Cyprus Greece France Netherlands Spain Latvia Portugal Croatia Sweden Denmark Belgium ItalyBulgariaLithuania Austria Poland Romania Germany Hungary SlovakRepublic Slovenia 0 0.5 1.0 1.5 2.0 2.5 3.0 Shar e of total (%) Value added at factor cost— percentage of gross domestic product (GDP) Employment
Source:
regarding the topic while removing idiosyncratic information for each of the variables, and (iii) allows standardized rankings between countries based on their performance. The latest available year was used for each indicator (Figure 4.14).
The relative ranking of EU countries on the Hu man Capital Index changes when performance on the three indices created by the principal
components analysis is taken into account (referred to as the scaled HCI). Relatively high performance on the WM index improves the relative HCI ranking of some countries, while others drop to the bottom of the ranking (Figure 4.15). Ranking of performance on the PCI does not change the relative ranking of countries on the HCI significantly. In contrast, relative performance on the SRMI substantially reduces
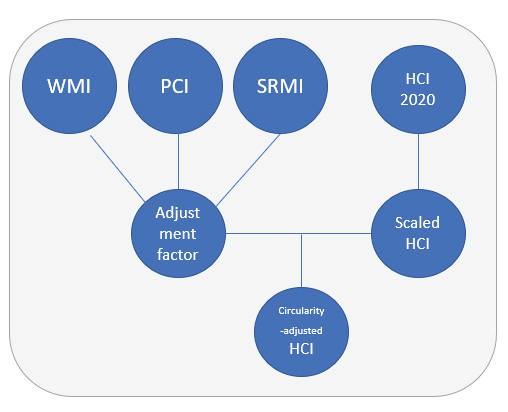
4.14: The Calculation of the Circularity-adjusted Human Capital Index
Source: Authors.
Box 4.3: The Circularity Index
Three sub-indices are constructed and then combined to calculate the human capital index adjusted for performance on the circular economy:
• The waste management (WM) index combines indicators for recycling municipal waste, packaging (which includes several sub-variables such as plastic, glass, and wood), construction and demolition, and e-waste. The essential variables due to the correlation structure are bio-waste, municipal waste, and packaging, as they have the highest weights (and therefore, they are at the core of the component).
• The consumption and production (PC) index compromises two indicators: the generation of waste (excluding major mineral wastes) (i) per GDP and (ii) per DMC. Due to the high relation of the two indicators in the consumption and production index, the generation of waste per GDP explains 72.8 percent of the full sample variance and thus, it is considered to capture the core essence of the waste generation challenge.
• The Secondary Raw Materials (SRM) index includes indicators on the trade and use of secondary materials, both imports and exports from the EU. the biplot for the secondary raw materials (SRM) index shows that all the variables are highly related and aligned with the circular material use rate. Indeed, the index alone explains 67.91 percent of the sample variance, making it ideal for the analysis.
(Continued next page)
88 MAKING THE EUROPEAN GREEN DEAL WORK FOR PEOPLE
Figure
Box 4.3 (continued)
As can be observed from the biplot in Figure B4.3.1, all the variables for all three indices present the same direction, supporting the fact that the values of the principal components follow the same logic as the variables (higher values of each index mean higher values of the components of that index). Higher values of the WM and SRM indices, and lower values of the PC index, indicate greater integration into the circular economy.
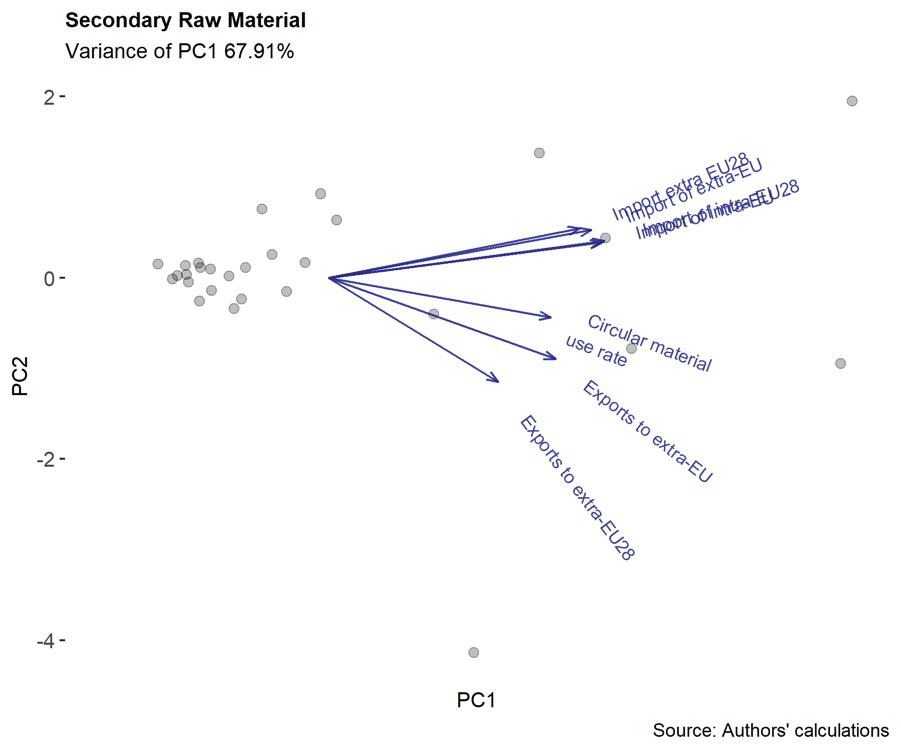
the relative ranking of most countries on the HCI. Lastly, adjusting performance on the HCI by the circularity adjustment factor that combines all three indices yields a measurement of the amount of ‘circular human capital’ a child born today accumulated by the age of 18. As can be observed in the bottom right figure, all the results of the circularity adjustment factor significantly reduce the relative ranking of EU countries to near the bottom of the scale.
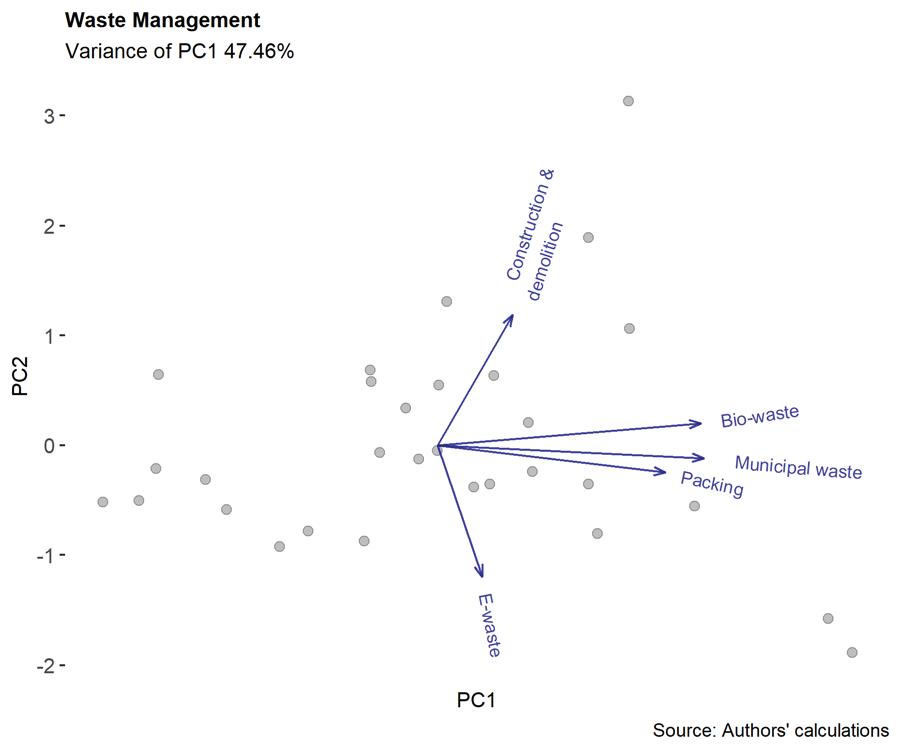
HD Policies for Ensuring a Just Transition to the CE
A Just Transition to CE in the EU requires evi dence‑based policymaking that aims to mitigate possible negative externalities and ensure both benefits and risks are distributed equally across EU regions. As highlighted above, the transition to the CE involves several risks related primarily to job
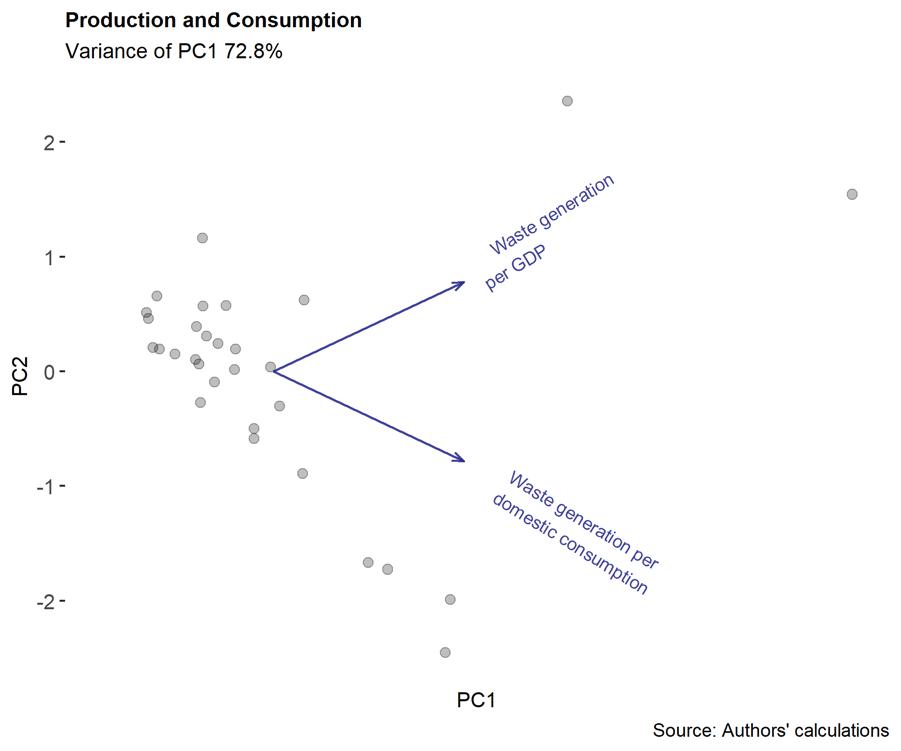
89 4. Adapting to a Circular Economy
Figure B4.3.1: Bi-plots of the Three Indices: Waste Management Index, Consumption and Production Index, and Secondary Raw Materials Index
Figure 4.15: Comparison of EU Country HCI Indicators, Adjusted for Circular Economy

loss and the health implications of increased employment in the management of hazardous materials. Also, an unequal transition to the CE may further widen economic disparities between EU member states, as linear economic modes of production become obsolete and less economically viable. Ensuring a just transition to the CE thus requires policymakers both at the national and regional level to adopt policies that will enable their citizens to avoid risks and maximize potential benefits, such as job creation and an improved environment.
As discussed in the policy agenda in chapter 3, changes in education, social safety nets and health monitoring will play an important role in achiev ing a just transition to the circular economy. Educating students of all ages about environmental objectives, individual material footprint, and the need to shift away from the linear mode of consumption is an integral part of a successful transition to the CE and ensuring that all communities may benefit equally from it. A recent assessment of the barriers to the transition to the CE in Europe found that ‘cultural
and systemic factors rather than technological ones appear to be the main barriers to the circular business transition’ (EEA et al. 2016).53 Furthermore, the IPCC concluded that changing current perceptions of production, consumption and disposal practices, and business models requires a holistic change in educational institutions to the type of education that recognizes ecological barriers and objectives and human well-being (IPCC 2022). Improved education can not only act as an effective lever to transition to pro-climatic beliefs and behaviors in certain contexts (Angrist et al. 2023) but also multiply positive effects of other environmental policies such as carbon pricing (Macdonald and Patrinos 2021).


Social safety nets are integral to ensuring that communities and regions negatively affected by the transition are not left behind. EU member states differ significantly with regard to the share of industry, construction, manufacturing, and agriculture in total GDP and employment. Combining circular economy policies with social protection measures will be necessary to ensure that the burden of efforts to
90 MAKING THE EUROPEAN GREEN DEAL WORK FOR PEOPLE
Source: Authors. 0 0.2 0.4 0.6 0.8 1 0 0.2 0.4 0.6 0.8 1 Scaled HCI WM Adjusted Scaled HCI a. HCI WM Adjusted 0 0.2 0.4 0.6 0.8 1 00.2 0.40.6 0.81 Scaled HCI PC Adjusted Scaled HCI b. HCI PC Adjusted 0 0.2 0.4 0.6 0.8 1 0 0.2 0.4 0.6 0.8 1 Scaled HCI SRM Adjuste d Scaled HCI c. HCI SRM Adjusted 0 0.2 0.4 0.6 0.8 1 00.2 0.40.6 0.81 Scaled HCI T otal Adjusted Scaled HCI d. HCI Total Adjusted
Performance
promote circularity will not fall on the poor through worsening working conditions and health impacts, reduced livelihoods, or job losses. In addition, furthering women and girls’ education will be important in order to counter the disparate levels of women’s workforce participation when compared to their male counterparts in industries such as the renewable energy sector (IRENA 2019).
The health sector in every member state should increase efforts to quantify and monitor the potential health risks associated with the transition to the CE. Specifically, health outcomes in communities that reside by recycling centers of hazardous materials or landfills of bio-waste should be monitored more closely. Furthermore, occupational health and safety measures need to be strengthened to address the health risks associated with CE transition. The waste management sector specifically requires a robust enforcement mechanism for health and safety standards.
Higher education institutions should be di rected to support the type of innovative, CE fo cused research required to facilitate the transition and measure its impact. CE-related research was found to be fragmented across various disciplines and often shows different perspectives on and interpretations of the concept and thus its potential societal and environmental impact (WHO 2018). This fragmentation may have resulted in the limited evidence found by the IPCC on the potential impact of the CE model in reducing GHG emissions and combating climate change. To address this knowledge gap, higher education institutions could be directed to support the efforts to research and quantify the impact of the transition to the CE. Furthermore, member states could make more significant efforts to utilize high education institutions as conduits for the type of innovative research required to extend the life of products, circular design manufacturing, and disposing of materials.
91 4. Adapting to a Circular Economy
5
ADDRESSING THE UNINTENDED CONSEQUENCES
The European Green Deal could have a sig nificant impact on the distribution of in come across regions and individuals. Regions that rely heavily on the exploitation of fossil fuels or on energy-intensive production, many of which already have lower than average incomes, could fall further behind. And the increased demand for skills driven by the green transition could further reduce the earnings of lower-skilled workers relative to higher-skilled workers. Ensuring that the EGD does not further impair the welfare of regions and workers who have already experienced relative declines in income is essential for social justice and to limit opposition to achieving the green transition. The chapter begins with a discussion of the differential regional impacts of the EGD, and then turns to the impact on individual workers.
Regional Impacts
The EGD will entail a radical reconfiguration of production and consumption activities across Eu ropean countries and regions. Whereas some regions are set to tap into the opportunities offered by regional diversification and specialization in the green economy, other regions—often plagued by pre-existing economic, social, and institutional bottlenecks—will risk falling further behind (McCann and Soete 2020; Moreno and Ocampo-Corrales 2022). Neglecting the differential impact, the EGD will have on different regions would jeopardize its inclusiveness and long-term sustainability, and conceivably could derail the transition to low-carbon societies.
This section discusses the interplay between achieving the targets of the EGD to enhance sustain ability on the one hand, and territorial inclusive‑ ness and cohesion on the other. The section first considers the potential for changes envisioned by the EGD to exacerbate regional polarization across European countries. This is followed by an analysis of the risks of social discontent from leaving places and regions behind during the green transition, along with a discussion of how place-sensitive strategies could facilitate the implementation of the EGD that taps into the economic potential of all regions—including those with a weaker economic potential.
The nexus between the EGD and territorial imbalances
The green transition will take place in an already polarized territorial context. There was significant convergence across European regions in the run-up to the global financial crisis (Eurostat 2022b). However, territorial inequalities widened with slow growth and recession from 2009 to 2013 and continued during the recovery from 2013 to 2019 (European Commission 2022). Having swaths of regions failing to achieve strong GDP per capita growth has contributed to create non-negligible territorial imbalances across the EU (Iammarino et al. 2019).
Three types of regions, at various levels of in come, can be viewed as in a development trap. Several regions in Italy (e.g., Calabria) and Greece (e.g., Analotiki Makedonia and Dytiki Ellada) display exceptionally low GDP per capita, receive substantial cohesion funds from the EU, but have so far failed to sustain long-term growth (Figure 5.1). A second, wider group of underperforming, development-trapped regions have GDP per capita levels that are slightly below the EU average. This club includes regions in the Italian Mezzogiorno, Portugal, Greece, and Cyprus, but also in more developed countries, such as Belgium and France. Finally, there is a group of regions with above-average GDP per head where economic dynamism has stagnated, if not declined. These regions are located in north Italy, central France, and continental Denmark, among other countries (Iammarino et al. 2020).
These three groups of regions share a number of common traits, including low human capital (often meaning a smaller share of high-skilled workers with higher education (Männasoo et al. 2018); less innovation-prone ecosystems than their more dynamic counterparts (de Dominicis et al. 2013; Kharas and Kohli 2011); lower institutional quality and weaker social capital endowments, resulting in lower government efficiency, accountability, and transparency (Rodríguez-Pose and Ketterer 2020); demographic crises reflected in higher old-age dependency ratios (Farole et al. 2018); and, in rural trapped regions, great reliance on agricultural production (European Commission 2022; Iammarino et al. 2019).
93 5. Addressing the Unintended Consequences
The green transition will take place in an already polarized territorial context
The regional impacts of the EGD in the context of territorial polarization
The negative impacts of shrinking the coal indus try on employment and economies in regions host ing coal mining activities and coal fired power plants are often overlooked. There are 103 European (NUTS-2) regions that host at least one coal-fired power plant. Forty-one regions still host at least one coal mine (JRC 2018). It is estimated that the coal sector directly employs around 240,000 workers, with an additional 215,000 jobs linked to the coal value chain. Lagging and poorer regions are more exposed
to the negative impacts of the phasing out of brown energy production (EU 2017; OECD 2019), in particular the loss of jobs (JRC 2018). Figure 5.2 shows the geographical distribution across the EU of the risk of job losses from phasing out coal production.
The transition will require more territory tar geted financial outlays of State aid and social wel fare policies. The need for additional social funds disbursed by regional governments, together with a reduced tax basis deriving from a smaller workforce, may contribute to the erosion of local and regional authorities’ budgets. The allocation of EU funds to support the finances of regional governments whose

94 MAKING THE EUROPEAN GREEN DEAL WORK FOR PEOPLE
Figure 5.1: Development Traps across EU Regions by GDP Per Head, 2001–2019
Source: Authors’ elaboration based on Iammarino et al. (2019). Note: Development traps calculated as the relationship between a region’s GDP/head change over time and GDP/head change of the country which the region belongs to and the EU average.
Three types of regions, at various levels of income, can be viewed as in a development trap
economies rely heavily on the coal industry will be essential to support local finances and social safety nets, while ensuring a just transition.
The phasing out of brown energy may nega tively impact related industrial and economic sec tors. For instance, the steel industry and the jobs associated with it may also suffer, given the reliance of these industries on coal (JRC 2018). This may further contribute to the loss of employment in vulnerable regions. The regions affected will need to face both a digital and ecological transition in places that are traditionally more carbon-intensive, polarized in terms of
employment, and dependent on external technological inputs (Muro et al. 2019; McCann and Soete, 2022).
This may exacerbate socio economic bottle necks in coal producing or dependent regions. According to their GDP index, regional economies with coal power plants and coal mines have lower per capita incomes than peers with a lower coal dependency (JPR 2018). Some coal-dependent regions already display high unemployment rates. For example, the unemployment rate in Dytiki Makedonia in Greece, where the GDP per capita level is only 75 percent of the national average, has hovered above

95 5. Addressing the Unintended Consequences
Lagging and poorer regions are more exposed to the negative impacts of
the phasing out of brown energy production
Figure 5.2: Cumulative Jobs at Risk by 2030 due to Phasing Out of Coal Energy Production
Source: Authors’ elaboration based on Joint Research Centre (2018). Note: Jobs are cumulative.
30 percent over the past decade. The transition away from brown energy could add another 3.5 percent of employment loss (Eurostat 2022).
High levels of carbon intensive economic activ ity in some vulnerable EU regions are a key deter minant of the negative externalities expected with the green transition. GHG per head vary across the EU and within countries, based on the level and composition of economic activity, the energy efficiency of production factories and buildings, the use of renewable energy, and land use (Figure 5.3). According to Känzig (2021), regions with carbon-intensive economies will bear the brunt of the additional costs and price increases stemming from the introduction of carbon taxes (Box 5.1 provides a principal
components analysis of the dependence of EU members on fossil fuels). Without adequate and fair mitigation policies, higher prices will translate into declines in consumption and overall incomes in the hardest-hit regions.
The indirect effects of the EGD, in terms of movements of labor and the reallocation of eco‑ nomic and social assets, may have an even greater impact on the distribution of wealth across EU re gions than the direct effects will. Especially during the transition period, employment growth and capital investments related to green innovations will tend to cluster in a small number of core prosperous regions, as has been the case for other leading-edge innovations in the past decades (Atkinson et al. 2019).

96 MAKING THE EUROPEAN GREEN DEAL WORK FOR PEOPLE
Skilled labor will flow from lagging- and fallingbehind regions to more prosperous ones
Figure 5.3: CO2 Emissions from Fossil Fuels Per Head, 2018
Source: Authors’ elaboration based on Crippa et al. (2019).
Box 5.1: The Distribution of Fossil Fuels versus Renewable Energy
This chapter focuses on regional analysis, a level of disaggregation where it is possible to identify areas dependent on fossil fuels or carbon-intensive production. Each EU country, however, displays a mix of dependence on fossil fuels and renewables, so it can be difficult to demonstrate efficiently the challenges facing individual countries, or to understand how these challenges are shared across the EU. Principal components analysis is one approach to addressing the second question in a summary way (see Annex for the methodology and data used). Our goal is to define groups of EU countries, or clusters, within which countries are in similar positions in terms of dependence on carbon, and where similar policies might be adopted to support the green transition. Except for three countries (Iceland, Norway and Estonia), which have quite atypical conditions, EU countries can be grouped into three clusters.
Cluster 1, which includes Luxembourg, Ireland, Netherlands, Czech Republic, Poland, Austria, Germany, Slovenia, France, the Slovak Republic and United Kingdom, has the lowest share of renewable energy in gross final consumption. Although the share is improving, it is improving quite slowly as compared to the other clusters and the atypical countries. For example, renewable energy sources contribute just 11.7 percent to the gross energy consumption in Luxembourg and 14 percent in Netherlands. Also, this group has one of the highest levels of CO2 emissions from new cars (111.5 g per kilometer). The countries in this cluster need a significant push in looking for new sources of clean energy and to control elements such as the acquisition of cars.
Figure B5.1.1: Increasing the EU’s Climate Ambition for 2030 and 2050 Wards clustering

Source: Author’s calculations.
Note: Iceland, Norway and the United Kingdom, which are non-EU members, were included for benchmarking purposes only.
Cluster 2, which includes Denmark, Finland, Malta and Sweden, has the opposite challenge as cluster 1. It has the lowest emissions of greenhouse gasses (9.7 tons of CO2 equivalent per capita), but fossil fuel sources are growing, and the increment is the highest of the three clusters. On the other side, it is reducing its share of renewable resources (which is the greatest of the three clusters) but this reduction is significantly small compare with the other clusters. The evidence suggests that the countries are doing in general very well in terms of the EGD targets, and there are several lessons that can be learned from them. Yet it is important to keep checking the increment of greenhouse gas emissions before it becomes a challenge.
Cluster 3, which includes Belgium, Portugal, Greece Spain, Italy, Cyprus, Bulgaria, Lithuania, Hungary, Romania, Croatia and Latvia, has a very high share of CO2 emissions from new cars, similar to cluster 1. The share of renewable resources is lower than cluster 2, and it does produce more greenhouse gases, but not as bad as cluster 1. For this reason, these countries are in a middle scenario where identification of new energy sources is important, but there is also a need to reduce the current sources as part of the green transition.
97 5. Addressing the Unintended Consequences
Skilled labor will flow from lagging‑ and fall‑ ing behind regions to more prosperous ones. Regional specialization in green technologies and sustainable economic activities is likely to require a range of pre-conditions, including a qualified enough workforce, specialization in related economic fields, and adequate infrastructure and facilities (Moreno and Ocampo-Corrales 2022). Disparities across regions in terms of specialization in knowledge-intensive sectors are already high. The inability of lagging regions to tap into the opportunities offered by the development and production of green technologies, such as renewables, may lead to loss of employment and a mismatch between the labor force skills level and demand within the local economy, generating dissatisfaction and possibly brain drain (Fratesi and Rodríguez-Pose 2016).
Brain drain triggers a wide array of detrimental consequences for the source region , including lower levels of human capital investment and negative demonstration effects that push students to either leave after acquiring a higher education degree or abandon high level education altogether (Brzozowski 2007). Already vulnerable regions may find themselves deprived of their brightest human capital, rendering the adoption of climate mitigation policies and cutting-edge green technologies even more challenging. For example, the emigration of workers from the Slovak Republic to other EU countries (by contrast, internal migration has been small) has contributed to shortages of both high-skilled and
low-skilled workers. More generally, however, as the movement of the less skilled is increasingly limited by barriers to mobility, including language barriers, and high living costs in prosperous regions (Diamond 2016; Giannone 2017), lagging areas will be increasingly left with lower-skilled workers and lower-productivity firms (Farole et al. 2018).
Demographic decline and brain drain may fur‑ ther reduce the quality of governance in vulnera ble regions. Demographic decline tends to reduce local government incomes and boost costs (ESPON 2020b), while the migration of talent to more prosperous regions may lower the quality of staff. Such a deterioration of governance can, in turn, inhibit the development potential of lagging and development-trapped regions, given their reduced capabilities to design and implement successful development strategies (European Commission 2017a and b).
The green transition also may redirect capital in vestments towards regions and cities where pre con ditions in terms of infrastructure, skills, and gover nance are more favorable. Across the EU, metropolitan areas account for 55 percent of expenditure and 64 percent of public investments in climate and environmental actions (OECD 2019b), due to their higher and better-trained stock of human capital, the greater potential for generating local knowledge spillovers, strong connections with global knowledge and scientific networks, significant lobbying potential, and better infrastructure and institutions (Barbieri et al. 2021b; European Commission and UN Habitat 2016).
98 MAKING THE EUROPEAN GREEN DEAL WORK FOR PEOPLE
Demographic decline and brain drain may further reduce the quality of governance in vulnerable regions
Three additional factors can increase a region’s vulnerability to the negative externalities prompted by the European Green Deal:
(i) technological relatedness; (ii) regional innovative potential; and (iii) local governance quality
All in all, the green transition and the European Green Deal are set to reshape the geography of jobs and wealth across EU regions. The winners likely will consist of already prosperous urban regions, which will experience significant increases in capital investments and inflows of skilled workers from other regions. The losers will consist of the already weaker regional economies and development-trapped societies, which will suffer from outflows of capital and talent.
Other factors determining regional winners and losers
Three additional factors can increase a region’s vul nerability to the negative externalities prompted by the European Green Deal: (i) technological relatedness; (ii) regional innovative potential; and (iii) local governance quality.
The degree of cognitive proximity between a new technology in the region and its pre existing knowledge domains, referred to as technological relatedness, is expected to make or break attempts by regions to specialize in green technologies and renewables (Boschma 2017; Hidalgo et al. 2018). Relatedness is an example of path dependence, where a region’s specialization pattern is influenced by its past economic and social performance and sectoral diversification. Past analyses of European regions show that a high endowment of regional, green-related knowledge is a key driver of green technological development (Santoalha and Boschma 2020).
An index of green technology fitness shows that EU regions’ potential to introduce green technolo gies varies enormously (Barbieri et al. 2021b). Regions with advanced capabilities in the development of green technologies are mainly located in central and western Europe, while regions in Greece, Bulgaria, Romania, and, outside the EU, Turkey, seem particularly ill-placed to diversify towards a greener economy. There is a strong correlation between regional green technologies and non-green technological capabilities, pointing to a robust complementarity and relatedness between green technologies and adjacent technological realms (Barbieri et al. 2021b).
Thus, the green transition will involve a high risk of further territorial polarization.
The quality of regional innovation systems is a key driver of the green and ecological transition. In particular, green technologies can be more complex, radical, pervasive, and impactful than most nongreen technologies. They, therefore, require a wider range of competences that are often far from traditional know-how (De Marchi 2012; Barbieri et al. 2020). Similarly, green jobs normally involve a greater intensity of non-routine skills, due to the constant reconfiguration of green occupations (Consoli et al. 2016). Green technologies are also frequently located on the technological frontier, which means that there is no established best practice and trajectory for their development and implementation.
Thus, the ex ante innovative potential of Euro pean regions, which is highly correlated to the country and region’s level of development (Euro‑ pean Commission, 2022b), will be critical for a suc cessful green transition. Data from the Regional Innovation Scoreboard shows the large geographical differences in innovation across Europe (Figure 5.4).
In most cases, the low- or high-innovative potential of a region is compounded by a similarly low or high score in the green technological fitness index.
The effectiveness of environmental policies aimed at transitioning towards low‑carbon econo‑ mies also is likely to be conditioned by the ex ante quality of local governance. Excessive bureaucracy, red tape, overregulation, corruption, and lack of transparency and independence of the judicial system may hamper the adoption of resource-efficient and environmentally friendly technologies (Rodríguez-Pose 2013). In contrast, effective institutions improve the provision of public goods, address market failures, reduce transaction costs, and facilitate the functioning of the labor market—all aspects crucial for the adoption of new technologies (North 1990; Storper 2005).
An index of the quality of governance varies greatly across Europe and within some countries Low governance quality at the local level can discourage the entry of green industries (Gwartney et al. 2006) and limit the government’s ability to
99 5. Addressing the Unintended Consequences
The green transition will involve a high risk of further territorial polarization
The Regional Innovation Scoreboard shows large geographical differences in innovation across the EU
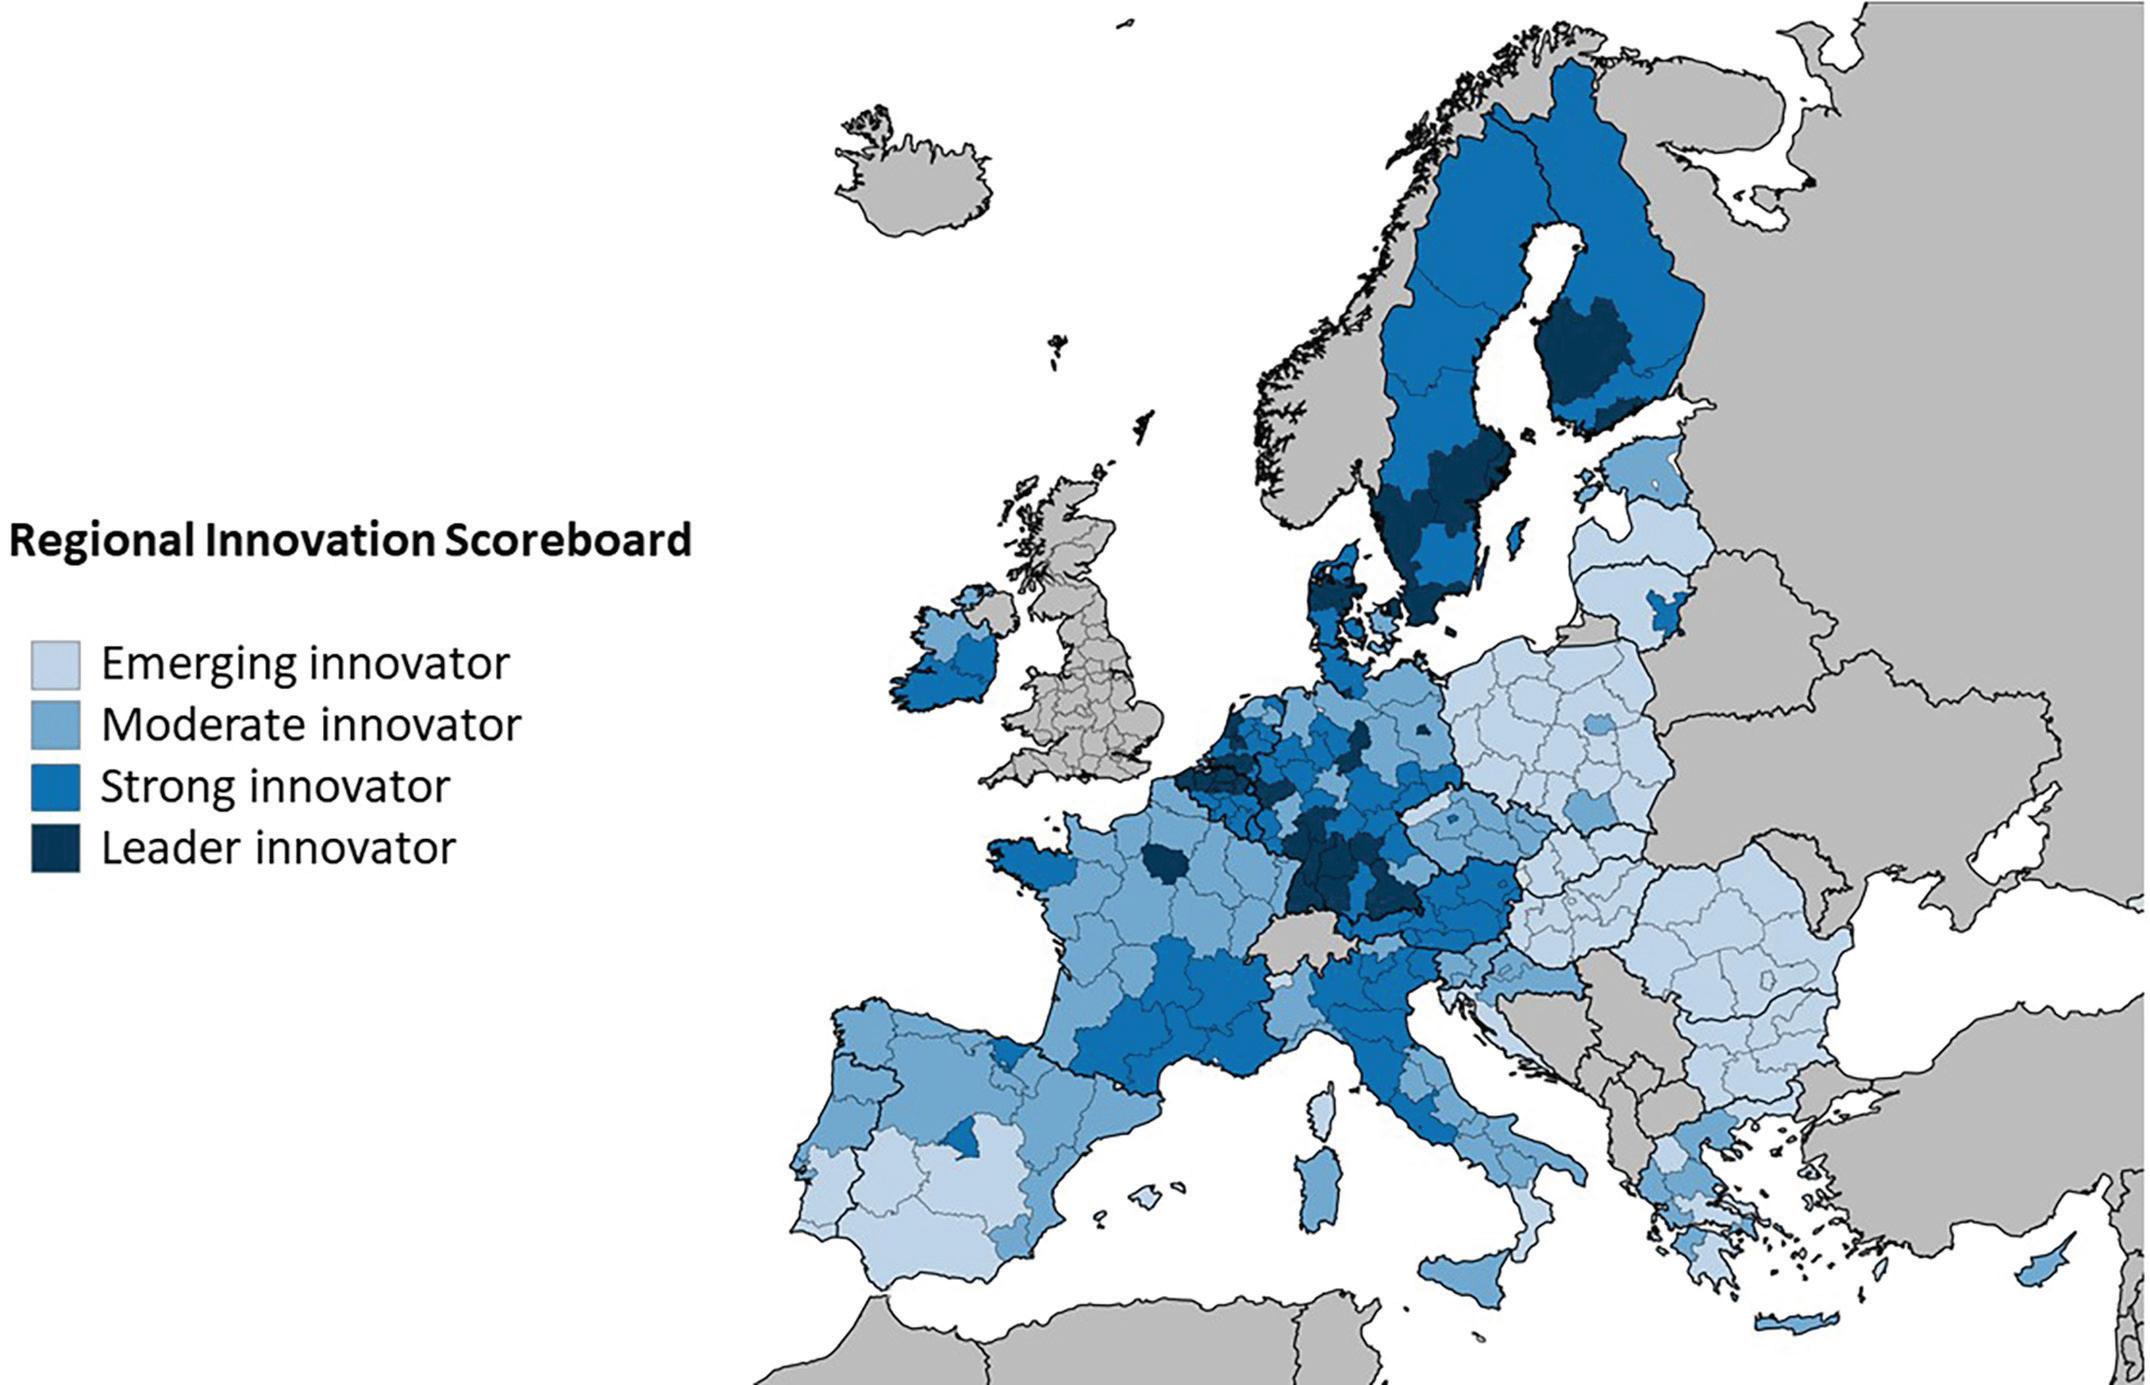
identify pathways towards regional diversification in the green economy. In the past the ability of local and regional authorities to lead bottom-up policy interventions has often determined the fortunes of development strategies (Rodríguez-Pose 2020), and more peripherical regions may experience a series of institutional backlogs during the implementation of environmental policies (Figure 5.5).
All in all, wide differences in the technological relatedness of the local industrial capabilities, the innovation potential, and the quality of gover nance will increase the concentration of green
investment and skilled labor in leading regions, beyond the agglomeration and brain drain effects discussed above. Paradoxically, poorer regions tend to be in greater need of green technologies than the cities where the bulk of green investments are located (see above). Without policy interventions, lagging regions may suffer both the adverse consequences of technological lock-in and environmental degradation, placing them at the highest risk possible for the erosion of economic, social and environmental standards and further divergence from the richer clubs of regions.
100 MAKING THE EUROPEAN GREEN DEAL WORK FOR PEOPLE
Figure 5.4: Regional Innovation Scoreboard, 2021
Source: Authors’ elaboration from European Commission—Regional Innovation Scoreboard (2021).
Low governance quality at the local level can discourage the entry of green industries
The green transition and the geography of discontent
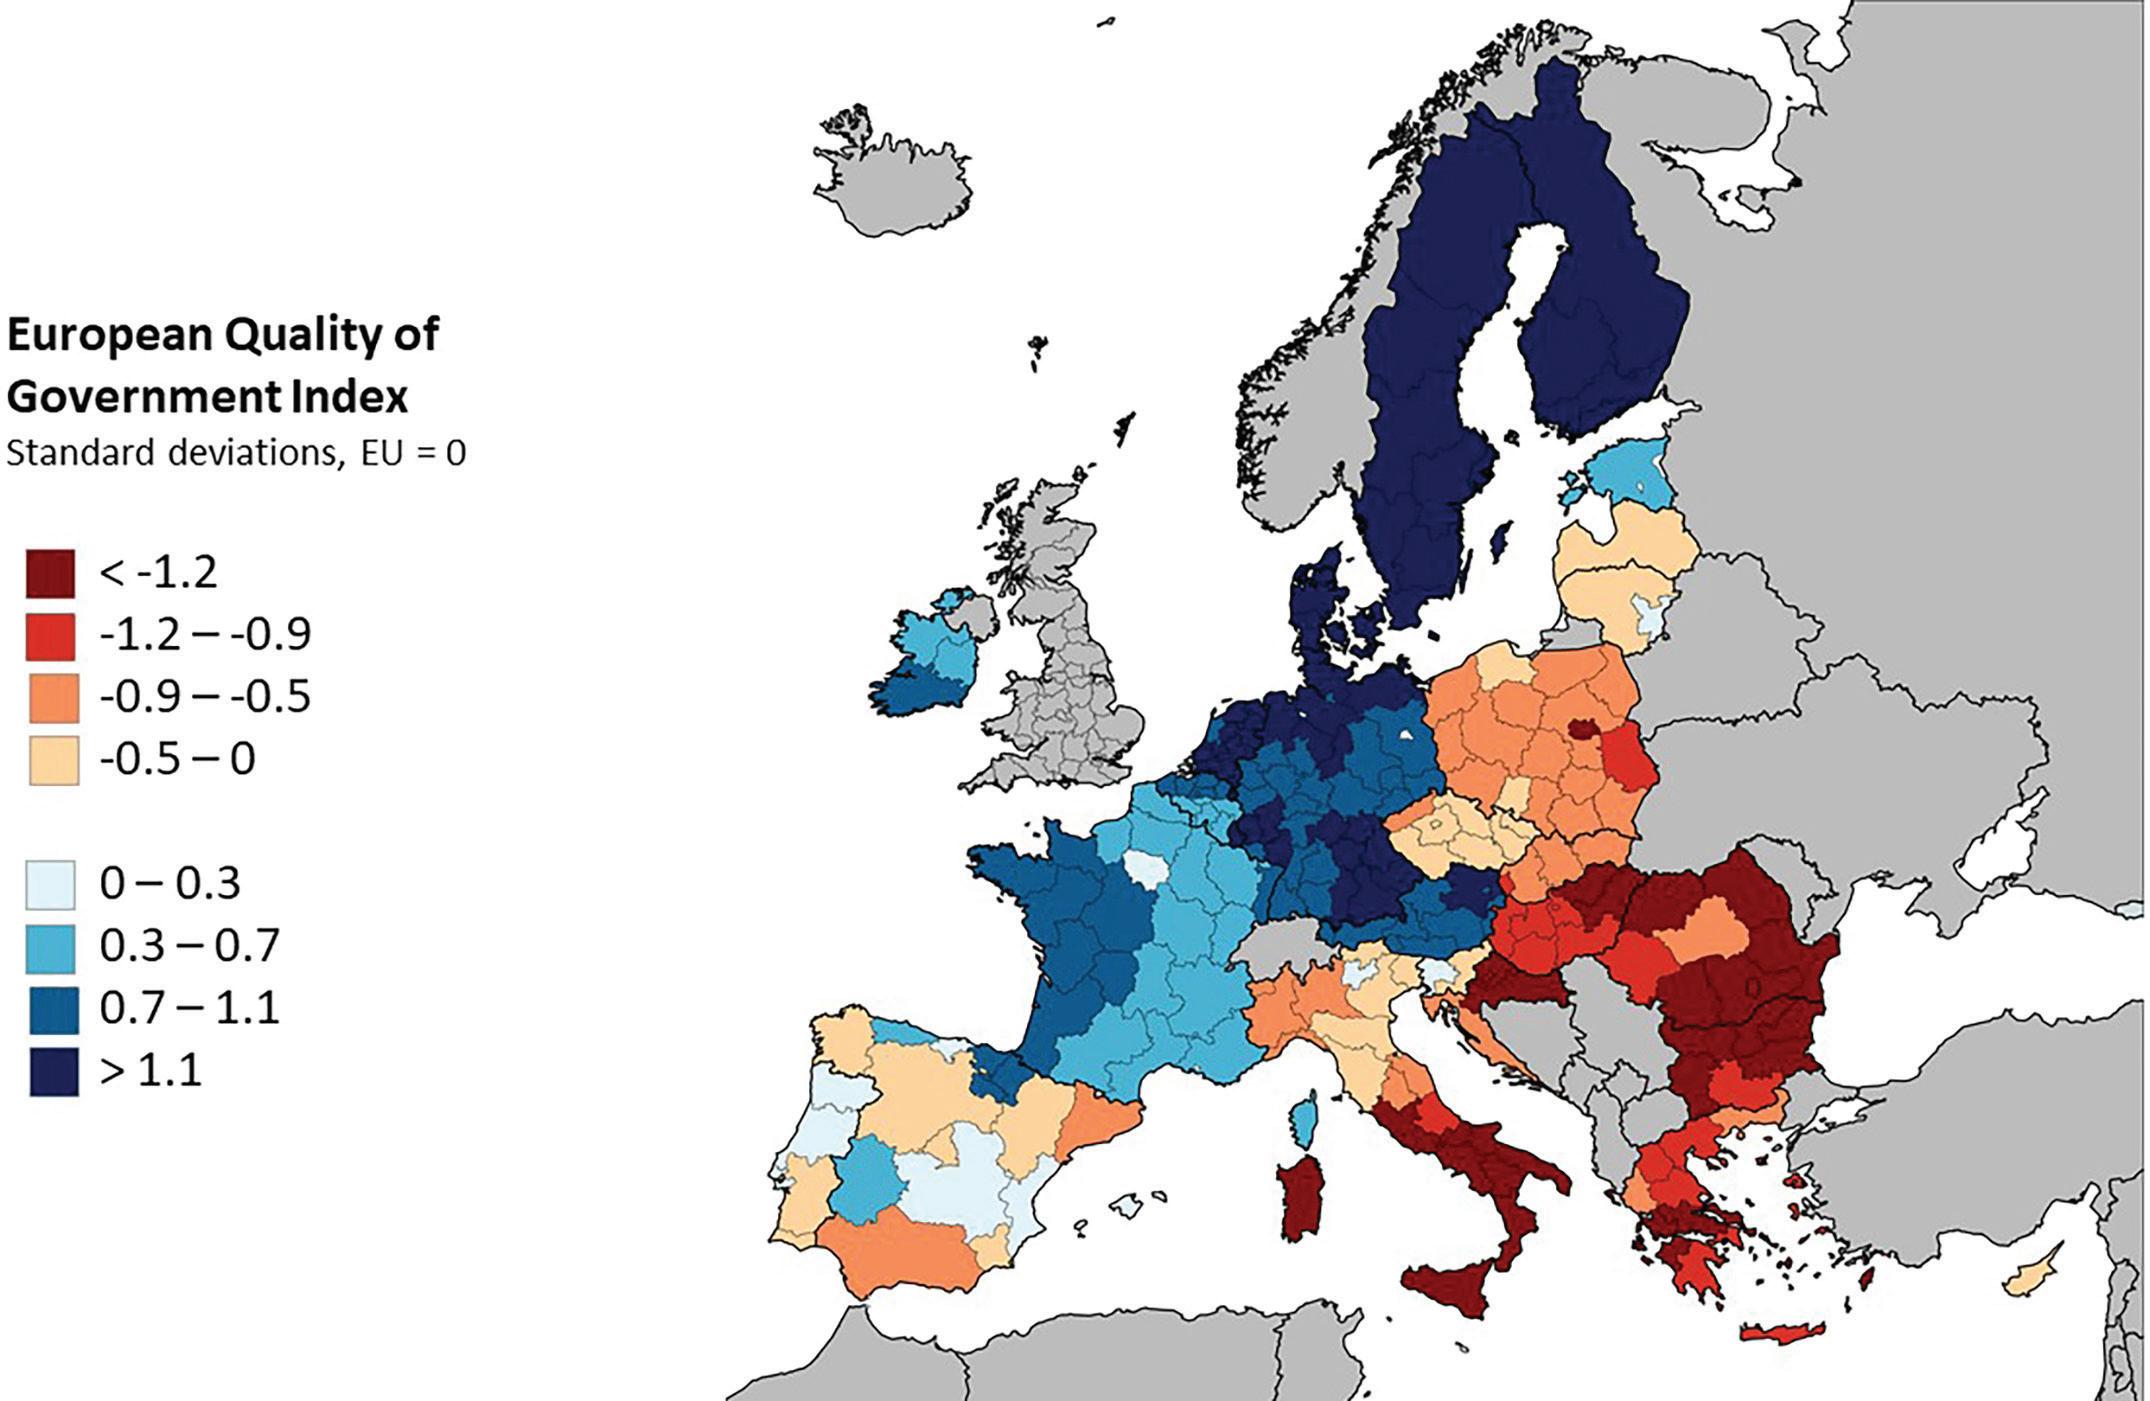
The potential for the European Green Deal to exacer bate the trend of rising regional polarization may erode support in lagging behind and development trapped regions for addressing climate change. General discontent across European regions has been on the rise in recent years, particularly in places that have struggled to benefit from the socio-economic gains of the digital transition and have suffered from negative externalities related to globalization and processes of outsourcing and offshoring. Opposition to basic EU principles, such as free mobility of capital and labor, migration within EU borders, or
economic integration and globalization has been on the rise, particularly in regions experiencing years of decline, lack of opportunities, and perceived neglect (Rodríguez-Pose 2018).
The rise of populism and support to anti estab lishment parties—the very parties that often cham‑ pion anti green policies—may prevent an EU wide implementation of the EGD and the full achieve ment of emissions targets. There is already evidence that the implementation of measures to save the planet is generating a backlash in vulnerable regions. For example, the revolt of the gilets jaunes (yellow vests) has, in part, been triggered by the drive by the French state to combat climate change.
101 5. Addressing the Unintended Consequences
Figure 5.5: European Quality of Government Index, 2021
Source: The Quality of Government Institute, University of Gothenburg.
The relevance of place-sensitive policies
Place sensitive approaches to the implementation of the EGD represents the best approach to limit its potential negative impacts in lagging behind and development trapped regions , while simultaneously leveraging each region’s socio-economic potential for a contribution towards environmental targets (Iammarino et al. 2019; Box 5.2). Aspects such as cultural and social diversity, urban and rural geography, access to water and distance to the core centers of economic activity will all need to be taken
into account when putting in place environmental policies. Regions with an abundance of sun and wind, for instance, may find themselves in an ideal spot to develop new green products, services, and growth models (McCann and Soete 2022).
Whereas the set of tools at policymakers’ disposal to drive the green agenda is well known—ranging from environmental regulation to investments in green technologies and carbon taxation—the exact mix of incentives and regulations needs to be tai lored to the local context (World Bank 2012). A framework of continuous policy learning will be
Box 5.2: Place-Sensitive Strategies: Combining Efficiency and Equity in the EGD’s Implementation
Equity-seeking approaches and the resulting place-based strategies in the EU have sought to leverage each territory’s economic and social potential by encouraging the emergence of grassroot, bottom-up policy frameworks and initiatives. Place-based approaches, nevertheless, have been by no means immune to criticism. The low institutional capacity of many lagging- and falling-behind regions often determined the failure of this type of strategies.
In the context of the EGD, adopting top-down, spatially-blind approaches—effectively channeling resources to the already more prosperous regions—or embracing purely bottom-up, place-based initiatives—hence letting regions draft climate mitigation policies with no or little top-level directionality—may encounter the type of bottlenecks experienced in previous EU-wide policy interventions such as cohesion policies and Horizon 2020.
The idea of place-sensitive distributed development policies can be a valid framework to elaborate initiatives for policy interventions around the EGD that combine efficiency and equity principles. Place-sensitive strategies entail (i) differentiation across regional development clubs, that is groups of regions which share similarities in terms of, for instance, economic structure, development trajectory, and growth constraints; (ii) coordination between different governance levels which allows to combine the localized knowledge of regions with the more holistic understanding of EU-wide objectives retained at the level of the central government; and (iii) integration between different development levers given the multi-dimensionality of the green transition affecting economic, scientific, social, and institutional models. Such an approach can be crucial to ensure that the green transition does not remain the privilege of a few, but that translates in an EU-wide opportunity for economic dynamism and enhanced regional comparative advantage.
Sources: Crescenzi and Rodríguez-Pose (2011), Pike et al. (2017), Rodríguez-Pose & Wilkie (2017), and Iammarino et al. (2019).
102 MAKING THE EUROPEAN GREEN DEAL WORK FOR PEOPLE
Wide differences in the technological relatedness of local industrial capabilities, the innovation potential, and the quality of governance will increase the concentration of green investment and skilled labor in leading regions
essential to promptly identify bottlenecks as they emerge and address potential negative regional impacts (McCann and Soete 2021). Such a framework will also aid in the formulation of evidence-based policy interventions informed by best practice and aimed at tackling some of the negative territorial impacts discussed above, such as human capital flight from lagging-behind regions or green transitions in carbon-intensive economies (Box 5.3).
The implementation of the EGD through place‑sensitive strategies will need to incorporate coordination mechanisms and institutional capac ity building elements. In particular, a multi-governance layered system, similar to that already implemented through the EU Smart Specialisation strategy, will require assigning the roles of different stakeholders and delineating responsibilities at European, national, and regional levels.
Box 5.3: Regional Peer-Learning: Addressing EGD’s Trade-offs through Policy Learning
The implementation of the European Green Deal will entail a certain degree of novelty in its approach, given its multi-dimensionality and context-dependency. As such, regions will encounter setbacks in their efforts to develop successful environmental policies. In this context, learning from regional peers will be crucial to identify best practice.
As discussed, skilled migration and human capital flight is not a new phenomenon in EU lagging- and falling-behind regions. As part of the 2014-2020 Cohesion Policy programme, regions across the EU have developed several policy interventions aimed at slowing down the loss of human capital and potentially reversing the regional brain drain trend into a brain gain one. For instance, following the 2008 financial crisis the small region of Umbria, in central Italy, suffered a major flight of skilled young workers, with over 30 percent of graduated students during the 2007-2011 period moving abroad for study and/or work reasons. The Brain Back initiative in Umbria, recognized as a regional best practice for fighting brain drain, managed to create a firstof-kind database of regional citizens who reside abroad, in addition to the creation of start-ups and research scholarships awarded to returning Umbrian citizens. Similarly, the Talent House of San Sebastian, in northern Spain, has been praised for contributing to attract 1,325 returning researchers and raising the municipality’s local R&D investment to 2.67 percent of GDP. The diaspora strategy addressed the underlying need for accommodation services by offering accommodation to returning skilled individuals as part of their regional strategy.
Loss of economic power and dynamism in coal-producing and carbon-intensive regions will also require ad-hoc policy interventions. Some of these policies have been particularly successful in transitioning regional economies away from polluting industries towards low-carbon activities. For instance, Essen in the larger Rhine-Ruhr metropolitan region in Germany has successfully turned into a green champion by creating over 13,000 jobs in the innovative green sector, expanding green urban areas—95 percent of the population now living within three hundred meters of green areas—and hosting around 400 km of bicycle lanes. Thanks to its achievement towards a low-carbon society, in 2017 the European Commission named Essen the European Green Capital, an annual award for a city at the forefront of environmentally friendly urban living. Coal mining in Essen is now history: the Zollverein Coal Mine Industrial Complex, once one of the largest mining hotspots in Europe, is now a UNESCO World Heritage Site and home to over 6,000 exhibits illustrating what used to be one of the largest industrial regions of the world.
Part of the success of these policies can also be attributed to their place-sensitive approach which adapts to the strengths and weaknesses of each territory. In Umbria, for instance, a major bottleneck for the design of diaspora strategies consisted in the lack of data on emigration flows. The regional approach built on the creation of a survey-based, tailor-made qualitative and quantitative analysis of the region’s citizens who emigrated. In Essen, the presence of a vast industrial site has been leveraged as a springboard for the tourism industry and urban regeneration.
This evidence points to the potential of policy peer-learning in the transition phase of the European Green Deal. As regions face asymmetric regional impacts, learning from regional peers and adapting successful strategies to the local context, with its opportunities and challenges, is set to be a key driver of a successful, just and inclusive green transition.
Sources: Brain Back Umbria, 2011; Cavallini et al. 2018; Fomento San Sebastian, 2018; EIB, 2020; ESPON, 2020b.
103
Consequences
5. Addressing the Unintended
Finally, key to an inclusive green transition is the strengthening of investment in institutional capacity in target regions. An improved regional institutional capacity will allow results-oriented policy design, understanding endogenous strengths and weaknesses through evidence and exogenous global transitions and trends, and their effects on local economies. In practice, this may imply expert task forces to access knowledge on green technologies and transitions; the strengthening of regional innovation agencies to coordinate the diversity of green specialization strategies; horizontal coordination structures for peer-learning and diffusion of knowledge around successful green policies; and enhanced monitoring and evaluation mechanisms to track the progress on the EGD targets and detect negative externalities (McCann and Soete 2022). The strengthening of local institutional capacity will especially apply to lagging and less prosperous regions, both for their exposure to the drawbacks of the green transitions and their existing gaps in institutional quality (McCann and Ortega-Argilés 2016).
Individual Impacts—Skills Transition Pathways
Just as the poorest regions are likely to experience the most adverse impacts from the European Green Deal, lower-skilled workers are likely to experience a decline in earnings relative to those of high-skilled workers. Assessing or estimating household or individual-level impacts as a result of the green transition are beyond the scope. However, those estimations are a crucial task that deserves attention and further research. Instead, in this section the report aims at shedding light on the extent of skills mismatches between brown and green jobs. In addition, using econometric analysis, the analysis in this section estimates the return to skills is higher in green jobs than in brown jobs. Ultimately, the section provides examples of transition pathways whereby workers in less-in-demand jobs can move to morein-demand jobs with the minimum required cost in terms of training (see Annex H for the methodology employed for green jobs).54
104 MAKING THE EUROPEAN GREEN DEAL WORK FOR PEOPLE
The potential for the EGD to exacerbate regional polarization may erode support in lagging-behind and development-trapped regions for addressing climate change
Place-sensitive approaches to EGD implementation represent the best approach to limit its potential negative regional impacts in lagging-behind and development-trapped regions
Skills mismatches between green and brown jobs
Green jobs tend to be more intensive in skills than brown jobs are. Figure 5.6 provides a visual representation of the distribution of three kinds of skills (numeracy, literacy and problem solving from the PIAAC survey) required for brown versus green jobs for the example of Poland.55 Figure 5.7 does the same for
skills from the WLE indices. For all of the skill categories, the differences between the distribution of skills are significant, according to a standard t-test. In most cases we see a right-skewed distribution (indicating a preponderance of higher skill levels) in the case of green jobs and a clearer resemblance to a normal distribution in the case of brown jobs. In other words, green jobs tend to require higher proficiency levels of all types of skills than brown jobs do. This is
Figure 5.6: Density Plots Green vs. Brown Jobs
For major adult skills covered in the PIAAC survey
105 5. Addressing the Unintended Consequences
Source: Authors based on PIAAC data.
Policymakers’ tools to drive the green agenda are well-known—ranging from environmental regulation to investments in green technologies and carbon taxation— the exact mix of incentives and regulations needs to be tailored to the local context
particularly true in the case of skills defined by such indices as “Index of use of ICT skills at home” and “Index of use of numeracy skills at work” (Figure 5.7).
These differences are larger among low skilled workers. The lowest skilled workers in green jobs in terms of numeracy are 20 points above those in brown jobs (0.40 of standard deviation), while among the most skilled workers the gap is 15 points (Figure 5.8). In problem solving using computers, the gap is 15 points for the low-skilled and decreases to 10 points for the high-skilled. Overall, people in green jobs tend to have higher skills, and the lowest-skilled workers in green jobs have much higher skills than the lowest-skilled workers in brown jobs. Workers in green jobs use skills more often at work and at home. For example, around one third of workers in green jobs use or calculate fractions or percentages every day at work, compared to less
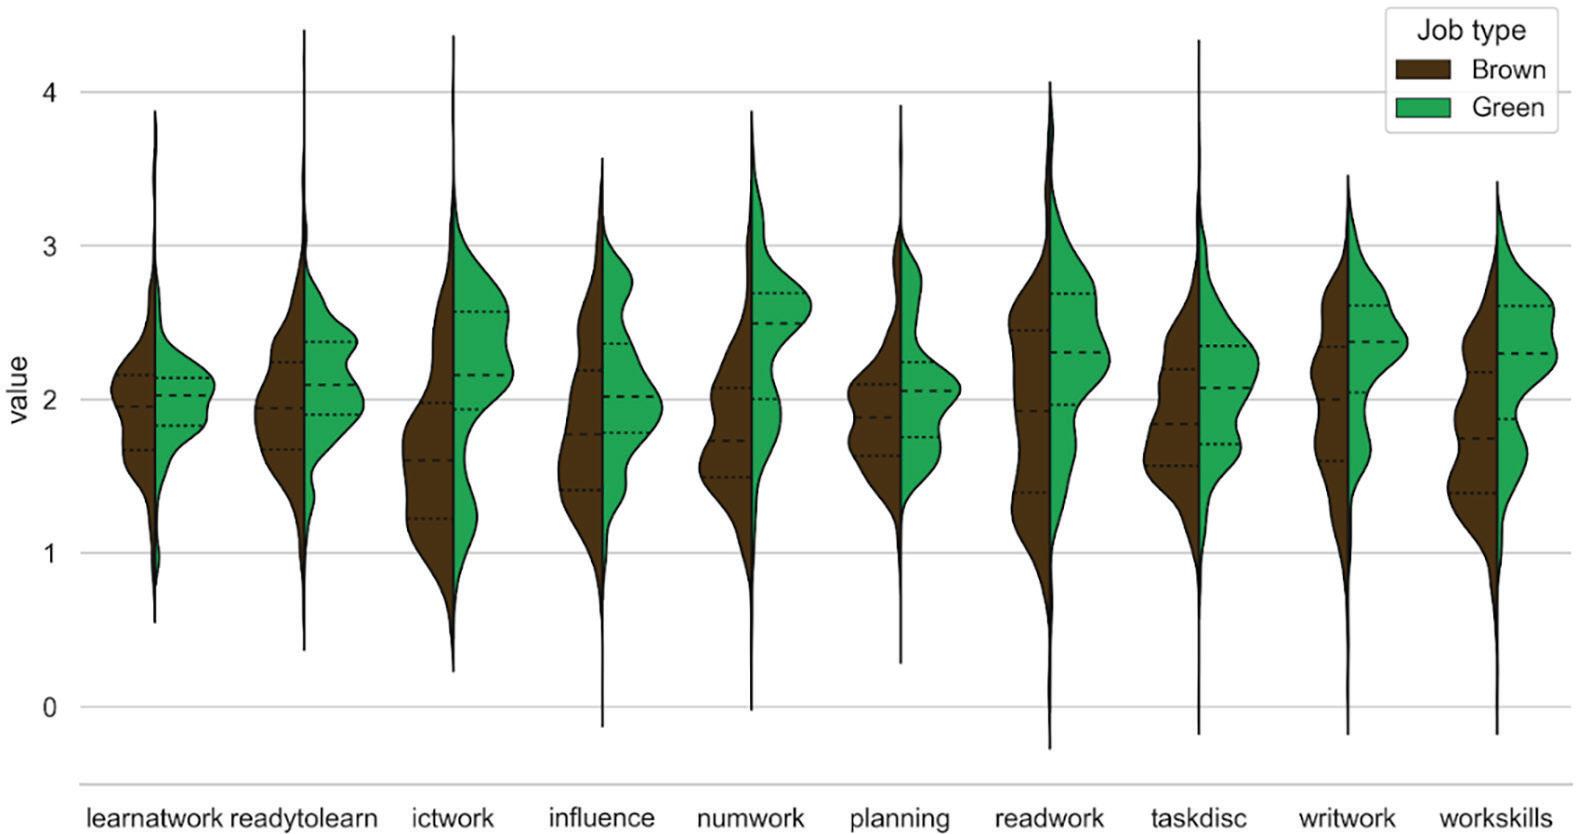
than 20 percent in brown jobs (Figure 5.9). Also, nearly 60 percent of adults in brown jobs never do such tasks at work, compared to around one third in green jobs. Similar differences are found for other questions measuring skills usage at work or at home.
People in green jobs also differ in terms of for‑ mal qualifications. On average, they have 13.4 years of schooling compared to 11.8 for people in brown jobs. In both groups most workers have around 13 years of schooling. However, in green jobs many more workers have higher qualifications, while in brown jobs more workers have relatively little schooling (Figure 5.10). Both groups are similar in terms of age, but in green jobs there are more women.
The skills gap between green and brown jobs are mostly related to years of schooling and partly related to the usage of skills. Half of the average difference in numeracy skills between green and
106 MAKING THE EUROPEAN GREEN DEAL WORK FOR PEOPLE
Figure 5.7: Density Plots Green vs. Brown Jobs in EU For WLE indices related to skills covered in the PIAAC survey
Source: Authors based on PIAAC data.
Green jobs tend to require higher proficiency levels of all types of skills than brown jobs do
Advantage—Green vs. Brown Jobs across the Distribution
107 5. Addressing the Unintended Consequences
Figure 5.8: Skills
0 5 10 15 20 25 p10 p25 mean p75p90 numeracy literacy problem solving Skills advantage (%)
Source: Authors based on PIAAC data. Note: Results represent average results across EU countries that participated in PIAAC.
Figure 5.9: Example of a Question Measuring Numeracy Skills Usage at Work
on PIAAC data. Note:
average results across EU countries that participated in PIAAC. 0 10 20 30 40 50 60 70 Never Less than once a month Less than once a week At least once a week Every day How often at work use or calculate fractions or per centage (%) brown green
Source: Authors based
Results represent
Workers in green and brown jobs are similar in terms of age, but more women work in green jobs
Figure 5.10: Example of a Question Measuring Numeracy Skills Usage at Work
brown jobs is explained by different levels of schooling in the compared groups, and one third is explained by differences in the usage of skills at home or at work. In other words, people in green jobs have higher numeracy because they are better educated, but also because they use these skills more often. The gap between the low-skilled workers in green and brown jobs is almost fully explained by years of schooling and skills usage at work or at home. For the top-skilled workers, years of schooling explain most of the gap, while usage of skills is less related.
Returns to skills in green and brown jobs
Green and brown jobs also differ in terms of re‑ turns to skills. PIAAC data provide information about hourly salaries and occupations of adult workers, in addition to different measures of skills and skills usage, for the example of Poland. Estimating the relationship between earnings and an index
for skills, an indicator of the greenness of jobs, and an interaction term between skills and the greenness of jobs, shows that skills are positively related to wages (Table 5.1). 56 This association seems to be stronger in green professions. Using a dummy variable showing whether a job is brown or green, the estimates suggest that returns to skills are 5 percent higher in green jobs. Using a continuous measure of the greenness of jobs, one standard deviation improvement in skills is related to an increase in wages of 2 percent.
A more disaggregated approach to measuring the relationship between skills and wages in green and brown jobs generates slightly different re sults. The approach is to separately estimate the effects on wages of foundational skills (numeracy, literacy and problem solving), their usage at home or at work, and soft skills. As in the analysis above, higher skills are strongly associated with better salaries. However, while the relationship between skills
108 MAKING THE EUROPEAN GREEN DEAL WORK FOR PEOPLE
Source: Authors based on PIAAC data. Note: Results represent average results across EU countries that participated in PIAAC.
510152025 0 .05 .1 .15 .2 .25 Density
of schooling
brown jobs green jobs
Years
The skills gap between green and brown jobs are mostly related to years of schooling and partly related to the usage of skills
Table 5.1: Log Hourly Wages in Green and Brown Jobs Explained by Skills, Age, Gender, and Sector
and green jobs is stronger than between skills and brown jobs, statistical tests did not confirm that the difference is significant at the 0.05 level. Only the association between years of schooling and wages is significantly stronger in green jobs when compared to brown jobs. In all regressions, the results suggest that returns to skills for women and in the private sector are higher in green jobs.
Transition pathways
The green transition is likely to have a major impact on the demand for skills. The skills required and tasks involved in existing occupations will change and shifts in relative demand for particular occupations will require job transitions and may change workers’ career paths (Bowen et al. 2018: 10). Devoting more resources to training should help some workers make the transition from lower-paying brown jobs to higher-paying green jobs. Such efforts could help to moderate the deterioration of income distribution implied by increasing demand for green jobs that are more intensive in skills compared to brown jobs (see also the modelling exercise in chapter 2).
Identifying the transition paths with the small‑ est differences between the skills required for brown versus green jobs would help workers and firms make efficient decisions on career paths. The skills mismatches and shortages preliminarily shown in this analysis might pose a major obstacle in green transitions. Reducing the investment in time and money in the training required to move from a brown job to a green job would ease this transition. This is where our methodology is especially useful. Using similarity indices (tasks level) along with the PIAAC data (skills level) we can identify occupations where the transition from brown to green is the most feasible, that is, upskilling or requalification should be easiest (Box 5.4).
Three examples of efficient transitions pathways are shown for Poland. The jobs chosen are roughly compatible in terms of skills and tasks. Essentially, this methodology can identify occupations that can be treated as talent pools for green economy development. The greenness of a job is indicated using a color scale. These examples identify a few possible transitions from a brown job (green index = 0) to a highly green one. For each transition example we
109 5. Addressing the Unintended Consequences
Log of hourly wage (including bonuses) Green vs. brown jobs (dummy indicator) Continuous indicator of green core Skills 0.23*** (0.01) 0.26*** (0.00) Green -0.02 (0.03) 0.01 (0.01) Skills*green 0.05*** (0.01) 0.02*** (0.00)
Source: Authors’ based on PIAAC micro data.
Note: Standard errors in parentheses. * p<0.05; ** p<0.01; *** p<0.001.
Identifying the transition paths with the smallest differences between the skills required for brown versus green jobs would help workers and firms make efficient decisions on career paths
Box 5.4: Identifying Transition Pathways
A crucial tool in the transitioning into the green economy proposed in the literature is the identification of linked jobs requiring similar workers characteristics and, consequently, a minimal additional preparation to transfer (Consoli et al. 2016). The literature offers various types of complementary dimensions such as job tasks, formal education requirements, work experience or routine indices to measure the distance between brown and green occupations (ibidem). We add to this literature by (i) experimenting with an original NLP model for revealing job similarities based on tasks’ descriptions and (ii) using PIAAC scores and wages as proxies for distances between occupations.
The identification of similarity scores is powered by natural language processing and network analysis. We retrieved jobs and tasks’ descriptions from the official Polish Labour Office and Labor Offices Job Postings site using Selenium web scraper. Our dataset consists of 2.7 thousand unique entries (elementary occupations at the 6-digit level). We used a semantic indexing model—latent semantic indexing (LSI)—which is an indexing and retrieval method that uses a mathematical technique called singular value decomposition (SVD) to identify patterns in the relationships between the terms and concepts contained in an unstructured collection of text. LSI is based on the principle that words that are used in the same contexts tend to have similar meanings. A key feature of LSI is its ability to extract the conceptual content of a body of texts by establishing associations between those terms that occur in similar contexts. LSI is often used to perform automated document categorization. In fact, several experiments have demonstrated that there is correlation between the way LSI and humans process and categorize text. We applied an LSI model with 100 topics (the number was established by trial and error). We can describe each document (job) in our corpus as a mixture of topics. Using standard distance metrics we can calculate similarity of all vs all pairs of documents—in other words similarity of vectors containing information about topics mixtures. We use cosine distance to create a 2.7k/2.7k (rows/columns) similarity scores matrix for all occupations.
provide data on mean proficiency in key information-processing skills (literacy, numeracy and problem solving) of workers occupying related positions along with the mean wage.
Skills and wages analysis yields important in sights for the green employment policy in Poland. Example 1 shows that renewable energy engineers in Poland tend to possess lower skills than workers in similar occupations (see skills indices along the bottom of Figure 5.11). This insight differs from the results of Consoli et al. (2016), who found that engineers have the smallest skill distance across jobs. Higher skills are related in this case to higher wages. Thus, for engineers to retrain and start a career in the renewable energy sector might require active labor market measures, such as subsidies, to hire supporting enterprises and institutions seeking to retrain renewable energy engineers. In the second example—environmental inspector—the skill and wage gaps are less prominent (Figure 5.12). We see a potential for transition from several occupations, e.g., crisis management officer or forestry engineer. However, as both would require upskilling, they call on targeted supply-side measures, e.g., vocational training. The last example shows a situation where workers in the greener occupation—environmental
engineer—possess on average higher or similar skills than workers occupying similar jobs and at the same time are paid less (Figure 5.13). This mismatch would make it very difficult to meet the growing demand for environmental engineers by retraining workers from similar occupations. It could be achieved by applying a policy mix aimed at human resources development and wage subsidizing (e.g., by recycling carbon tax income; Figure 5.11 Green job transition example 1).
Some brown to green job transitions can lead to wage decreases. ‘Geophysical engineers—mining geophysics’ (ISCO-08 code: 214608) present a relatively higher proficiency in problem-solving. According to the similarity score, a geophysical engineer working in mining will find it easier to transition to a geotechnical engineer (Figure 5.14). However, all proposed transitions are associated with a decrease in the median salary (based on LFS 2020). Still, transitioning to a geotechnical engineer ensures the lowest wage decrease.
Some other brown to green transitions may re quire substantial more upskilling and potentially wage subsidies. The transition pathways for ‘oil and gas processing controller’ (ISCO08 code 313401) show that the most similar occupations involve a
110 MAKING THE EUROPEAN GREEN DEAL WORK FOR PEOPLE
Note: Color represents green core index (0.1: e.g. Mechatronics technician, 1: e.g. Renewable energy engineer), values on edges reflect similarity scores, numbers in bubbles refer to major occupation groups.
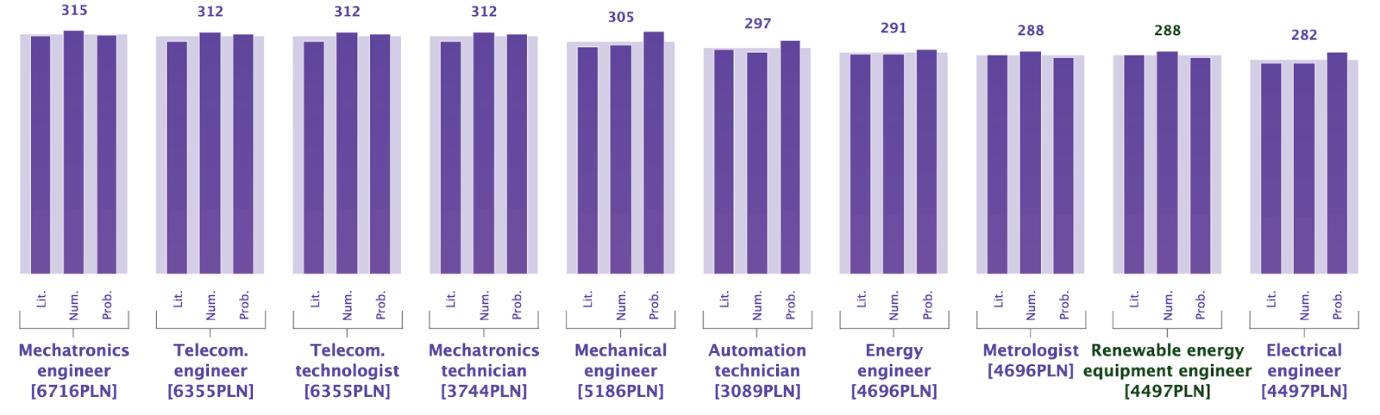
Note: Lit. - Literacy, Num. - Numeracy, Prob. - Problem solving PIAAC scores. Numbers and shadow boxes refer to the mean of three scores.
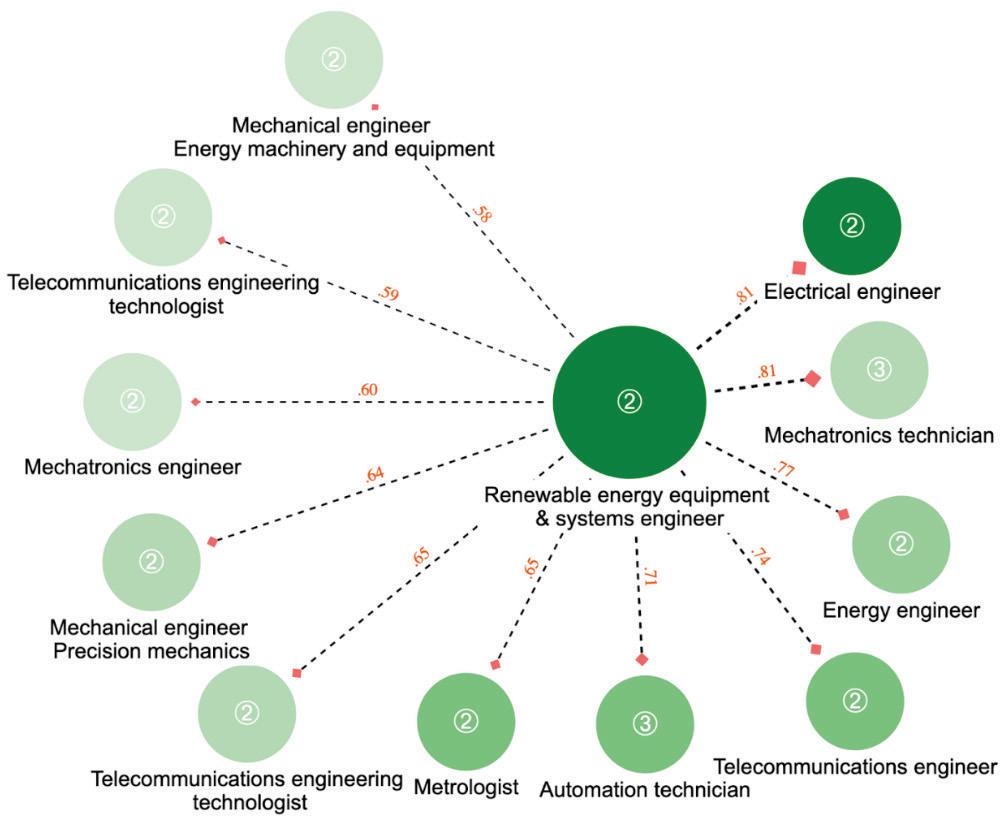
111 5. Addressing the Unintended Consequences
Figure 5.11: Green Job Transitions for Renewable Energy Engineers
ALMP and adult training policies should use existing data and evaluation tools to provide more effective career guidance and tailor skill upgrading offers for individuals
Figure 5.12: Green Job Transitions for Environmental Inspectors
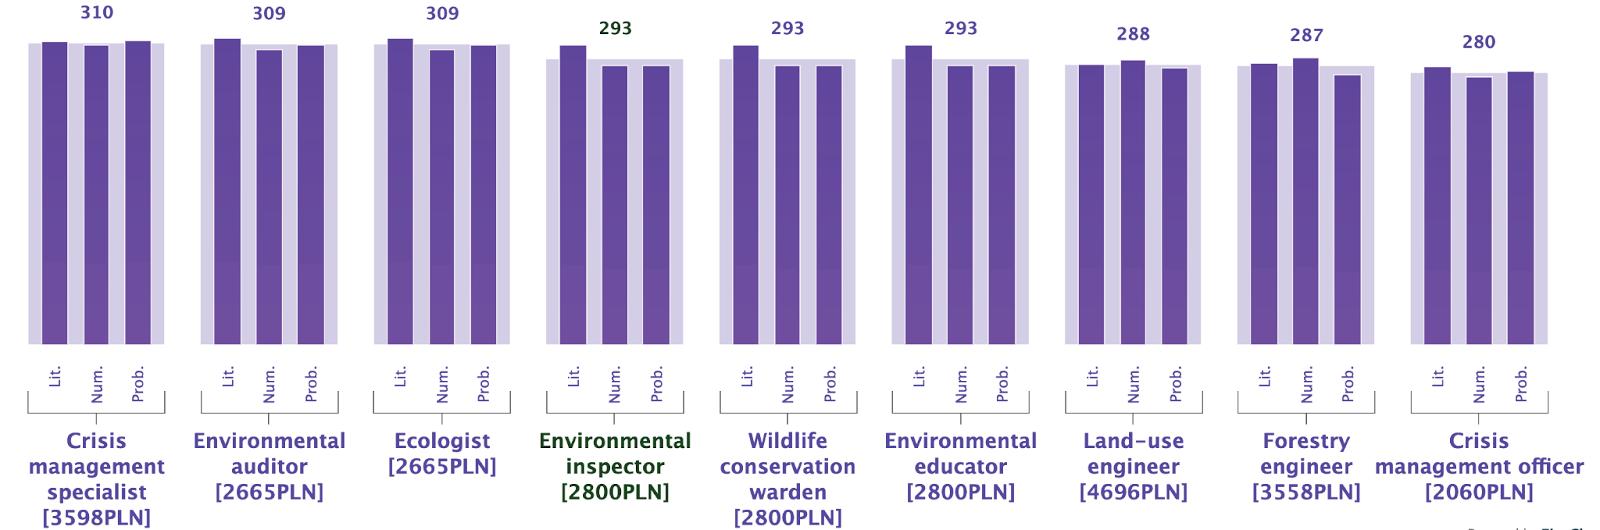
substantial skills gap that would require upskilling (Figure 5.15). But the upskilling may not translate into higher wages. While oil and gas processing controllers’ alternative occupations demand higher skills, they offer relatively lower wages. This mismatch would make meeting the growing demand for green occupations difficult to achieve by retraining workers alone. Instead, human resources development would probably need temporal wage subsidies (e.g., by recycling carbon tax income).
Clear policy recommendations can be derived from this model to ease the transition. Successful and just transition to a greener economy will require substantial upskilling of the current labor force. Workers with strong foundational skills have more green job opportunities and can expect higher
returns. Those who lack foundational skills will have difficulties moving from brown to green jobs and often will have to accept lower wages. Policies need to support acquisition and constant upgrading of skills but also provide guidance in job matching. Actions are required in two areas. One is to strengthen teaching and upgrading of foundational skills. Second is to provide data-driven career guidance and targeted upskilling to facilitate transition between brown and green jobs.
First, education and training systems should more effectively equip students and adults with foundational skills. Garrote Sanchez and Makovec (forthcoming) show that education acts as an enabler of green jobs by reducing the need for retraining for the green economy (for both, the intensive
112 MAKING THE EUROPEAN GREEN DEAL WORK FOR PEOPLE
Note: Color represents green core index (0.1: e.g. Crisis management officer, 1: e.g. Wildlife or environmental conservation warden), values on edges reflect similarity scores, numbers in bubbles refer to major occupation groups.
Note: Lit. - Literacy, Num. - Numeracy, Prob. - Problem solving PIAAC scores. Numbers and shadow boxes refer to the mean of three scores.
Figure 5.13: Green Job Transitions for Environmental Engineers
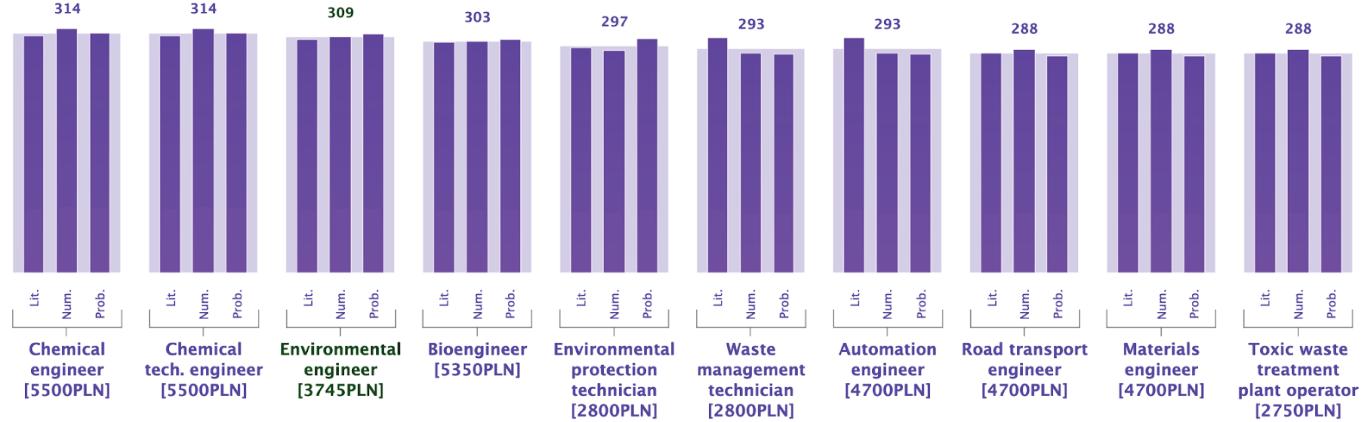
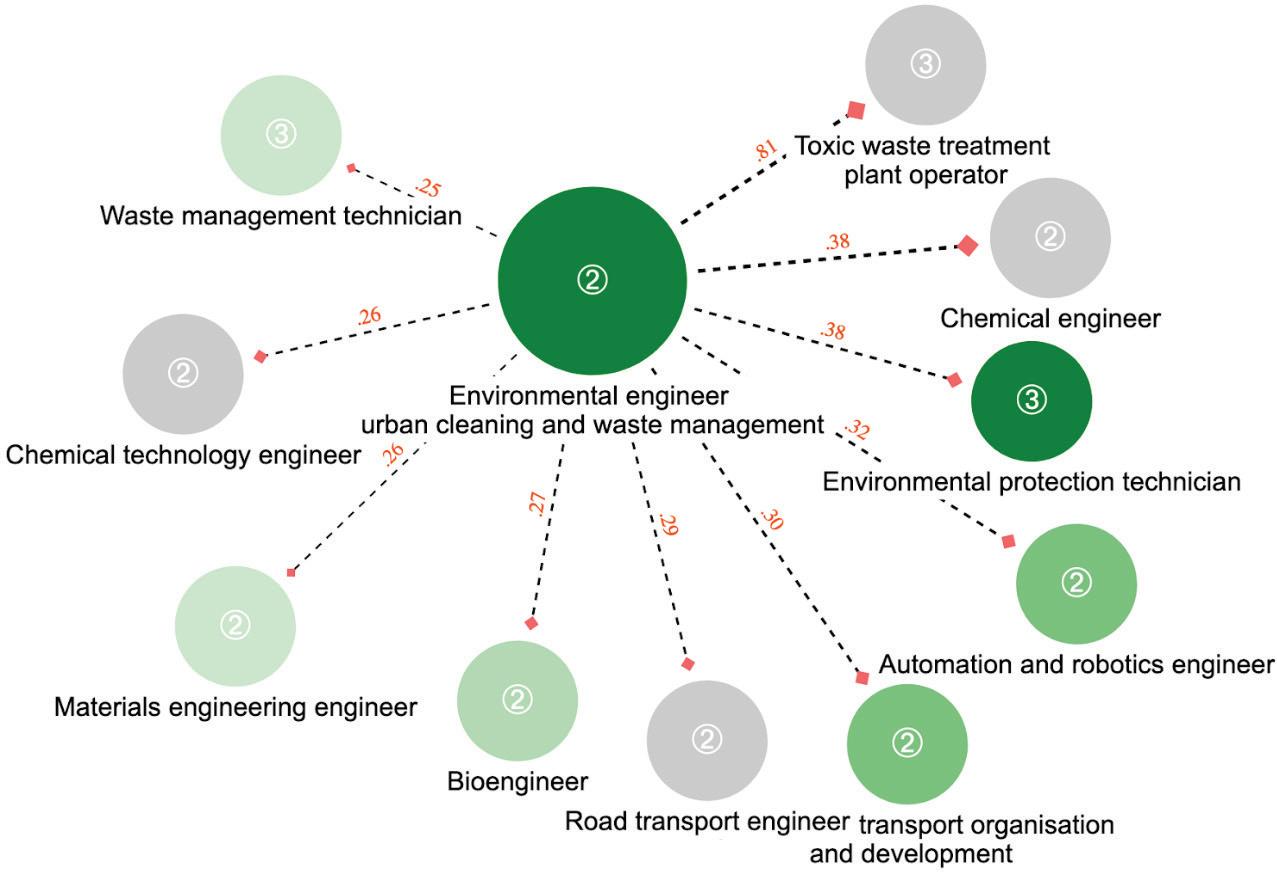
and extensive margins).57 According to PISA data a substantial number of students in EU countries do not master basic competency levels in reading, mathematics and science. According to the PIAAC survey a significant proportion of adults lack sufficient numeracy, literacy, and computer skills, to participate in the green economy or to benefit from technological change. Schools need to improve the provision of foundational skills to limit future labor market inequalities caused by the green transition. This includes vocational training (VET) as higher returns to skills in green jobs are observed also among workers with VET degrees. Focusing on narrowly defined technical training in VET systems might limit
transition opportunities for graduates whose specific skill set is not matching future demand in the green economy. School systems focus on high-quality general training that allows graduates to flexibly update their skills in the future and adapt to an ever-changing economy and labor demand. Education systems should also improve their career guidance and counselling services to prevent discouragement and wrong career choices. Students in secondary schools should be offered opportunities to experience different jobs and explore possible educational and professional options. PISA data show that in most European countries a majority of 15-year-olds do not have such opportunities (OECD 2021).
113 5. Addressing the Unintended Consequences
Note: Color represents green core index (0: e.g. Toxic waste treatment plant operator, 1: e.g. Environmental protection technician), values on edges reflect similarity scores, numbers in bubbles refer to major occupation groups.
Note: Lit. - Literacy, Num. - Numeracy, Prob. - Problem solving PIAAC scores. Numbers and shadow boxes refer to the mean of three scores.
Second, ALMP and adult training policies should use existing data and evaluation tools to provide more effective career guidance and tailor skill up grading offers for individuals. In order to foster green jobs, it is necessary to increase workers’ capacities and connect them to jobs (Bulmer et al. 2021). Similarly, this chapter argues that those capacities and those connections require a pathway with some degree of granularity. The examples provided above depict task-based quantitative analysis for different professions to identify the non-intuitive, yet
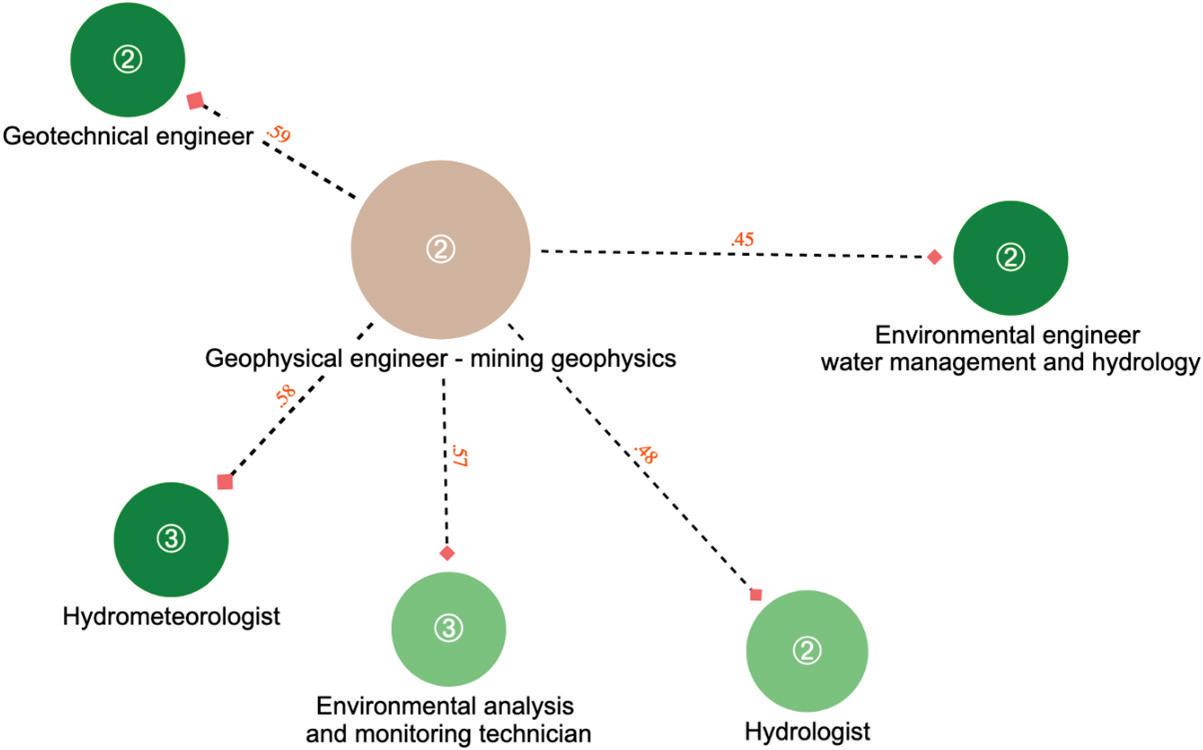
promising transition pathways in the labor market. The results in this chapter can serve as proof-of-concept and are based on the web-scraped information of tasks descriptions in different jobs in Poland, but replicating similar analyses in other countries and regions is possible (adjusting for the variety of data). Such analyses can provide individually tailored guidance for workers in brown jobs, matching their skills to green professions and pointing out gaps that must be addressed with ALMP policies or more formal training. Providing training of foundational
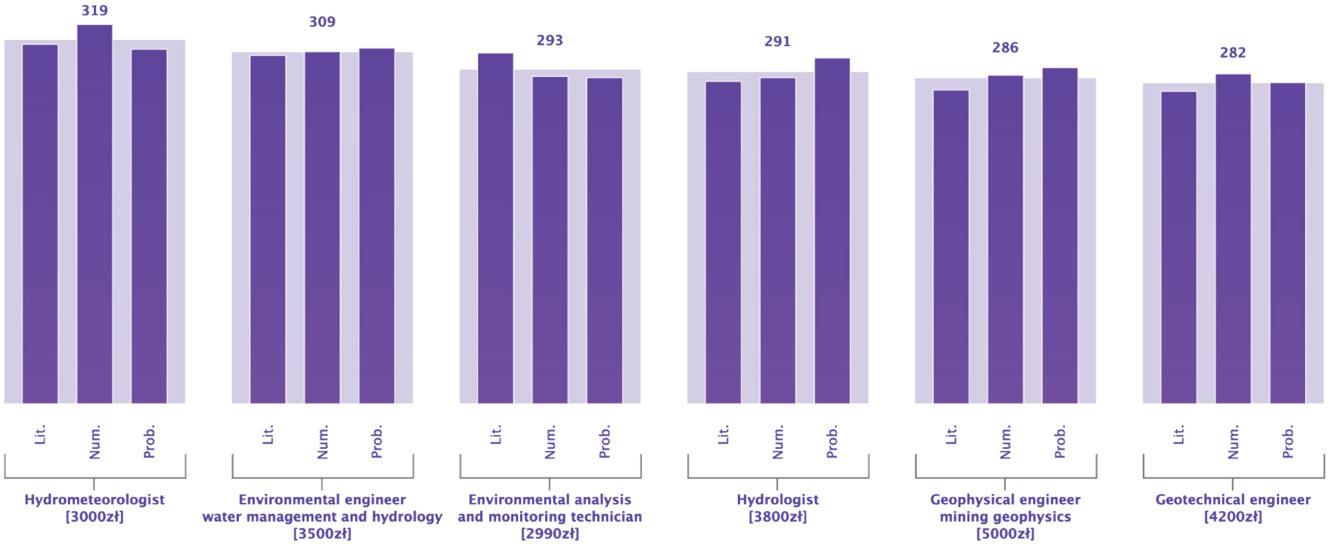
114 MAKING THE EUROPEAN GREEN DEAL WORK FOR PEOPLE
Figure 5.14: Brown-to-Green Jobs Transitions for Geophysical Engineer–Mining Geophysics
Note: Color represents green core index (scale 0–1, e.g. Hydrometeorologist: 0.75, Geophysical engineer: 0), edges values reflect the similarity index, numbers in bubbles refer to major occupational groups.
Note: Lit. - Literacy, Num. - Numeracy, Prob. - Problem-solving PIAAC scores. Numbers and shade boxes refer to the mean of three scores. Median wages are reported in square brackets.
skills for adults is a major challenge, with less than 2 percent of low-educated adults participating in any type of formal learning in the EU (Eurostat, indicator TRNG_AES_102; 2016 data). Courses for adults need to be highly flexible and focus on skill gaps (rather than providing full courses similar to those offered for children and youth). To make this process effective, it is necessary to develop tools that can quickly assess levels of foundational skills in adults and develop training schemes that fill the most important skill gaps for groups of adults with similar
challenges. These assessments together with skill matching exercises that point to the most similar green jobs in terms of tasks and skill requirements, can benefit in increasing the effectiveness of ALMPs. Several European countries established centers that recognize prior learning of adults to support them in further skills upgrading and formal recognition of their qualifications, but still, these are relatively small-scale efforts. The green transition requires large-scale solutions that offer skill evaluation tools, job
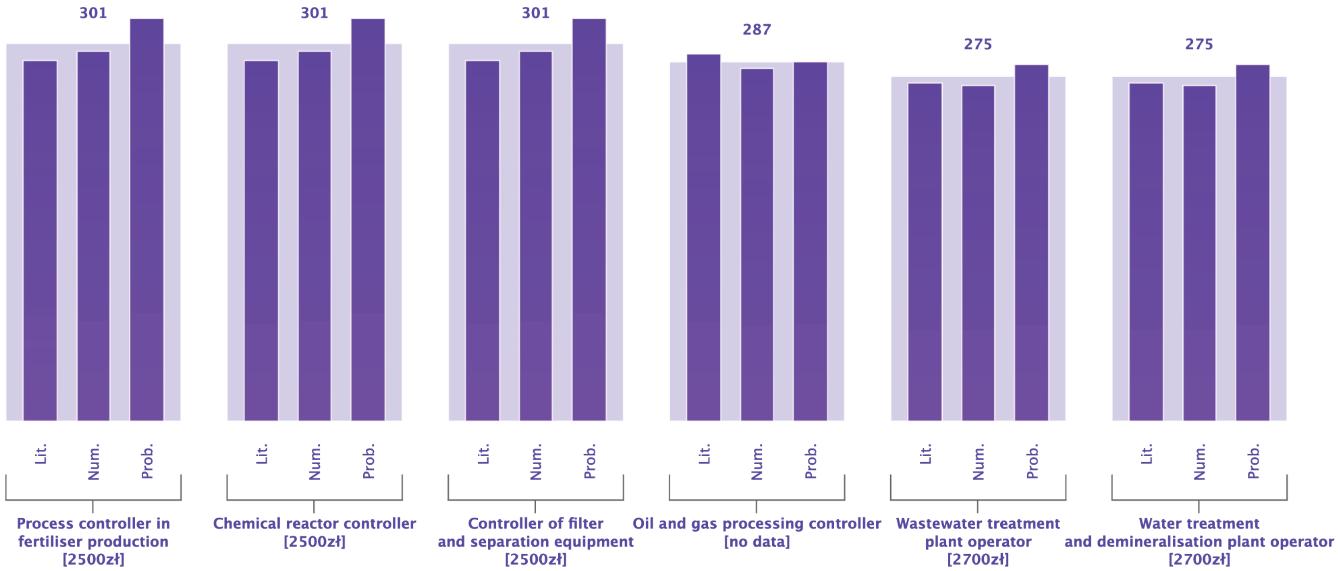
guidance,
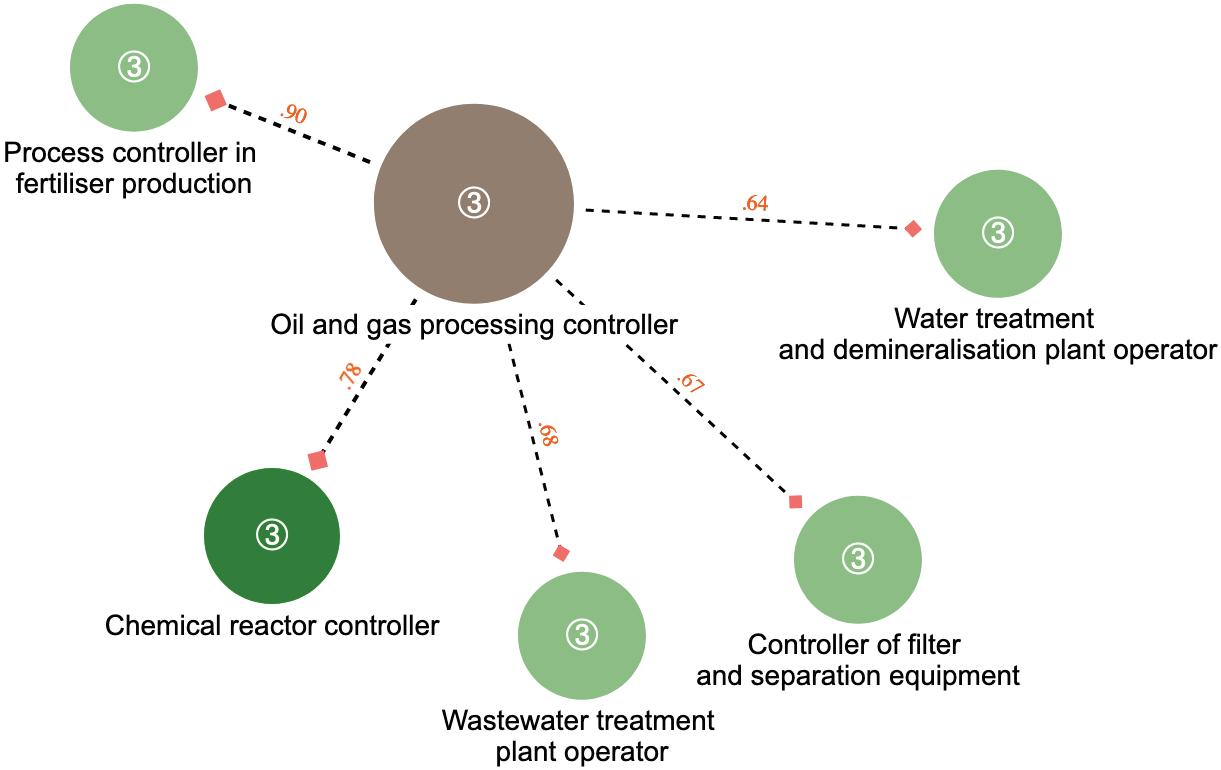
115 5. Addressing the Unintended Consequences
matching
and targeted training to close gaps and facilitate job transition.
Figure 5.15: Brown-to-Green Jobs Transitions for Oil and Gas Processing Controller
Note: Color represents the green core index (scale 0–1, e.g., Chemical reactor controller: 1, Oil and gas processing controller: 0), edges values reflect the similarity index, and numbers in bubbles refer to major occupational groups.
Note: Lit. - Literacy, Num. - Numeracy, Prob. - Problem solving PIAAC scores. Numbers and shade boxes refer to the mean of three scores. Median wages are reported in square brackets.
6
ENABLING A HUMAN-CENTERED GREEN TRANSITION
This report attempts to make the case that there is no green transition without the right human development policies to en able it. It also suggests that human development is a core element of adapting society to a new and more sustainable economy. And just as important, the potential unintended consequences of the green transition can be best addressed through human development. However, a green transition is not effective, efficient, sustainable or attainable without addressing the binding constraints. First, for the green transition to be effective, a multi-level policy and institutional framework to align supra-national, national and subnational policy making is required. Second, an efficient green transition needs sufficient and diversified sources of financing to avoid crowding out investment. Third, to make it sustainable, the green transition should be mindful of the unintended consequences and address potential discontent in lagging regions that may pose political challenges for the overall sustainability of the EGD. Finally, for the green transition to be ultimately attainable, an unavoidable behavioral change in consumption preferences and investment decisions is needed to avoid reversals into old and suboptimal equilibria.
Making it Effective: Policy preparedness
The EGD is a formidable framework to trigger the green transition. This report argues that human development policies related to climate change can play the role of enabling the green transition, adapting individuals to a green economy and mitigating the unintended consequences of such transition. The EGD represents a powerful effort to provide the regulation and incentives to nudge the European society towards a circular and more sustainable economy. Consequently, the EU has enacted a set of policies that contribute to the achievement of the three core objectives along the 8 policy actions.58
But the EGD alone won’t be sufficient for a sus tained and just transition, and national and subna tional policies must be aligned and in place. While top-down approaches for the green transition are necessary, its successful implementation requires
policies at other levels of government to be aligned and ready to support both, climate action, and the human development policies that must accompany them. Both, national and subnational policies are therefore crucial for a sustained green transition, and for a just one as well. It is possible that the level of institutional and policy preparedness across EU countries is heterogeneous. And its heterogeneity might increase when the three HD policy roles (i.e., enabling, adapting and mitigating) are related to the three sectors in HD (i.e., education, health, and social protection).
An initial assessment of policy preparedness at the HD sector level shows that preparedness is het‑ erogeneous across countries. Using visual heat maps (evidence tables that show sector-specific policy coverage for each country in a matrix, see methodology in Annex G) show that more policy preparedness needs to be done in health (Figure 6.1). Similarly, the country—among those that the report considers as case studies—Poland stands out for its relatively weaker preparedness, whereas Croatia seems to be doing the most progress across HD sectors in the last 10 years.59
The EGD requires national and subnational partners to address misaligned policy objectives, and fragmented HD policies that could prevent successful outcomes. National and subnational policy preparedness is crucial for a successful green transition and to address any unintended consequences. There is ample evidence that OECD countries suffer from fragmented policy frameworks on HD sectors to prepare societies for climate action. For instance, for a subset of 14 OECD countries, Panic and Ford (2013) found a number of limitations to health policy documents. Among the shortcomings in the health sector policy making, the authors found negligible consideration of the needs of vulnerable population groups, limited emphasis on local risks, and inadequate attention to implementation logistics, such as available funding and timelines for evaluation. While they found a similar heterogeneity as Table 6.1 in this report, they also found a bias towards mainstreaming a sectoral (health-related), rather than a multidisciplinary, approach to integrate HD.
117 6. Enabling a Human-Centered Green Transition
There is no green transition without the right human development policies to enable it
Table 6.1: Heat-Map Policy Analysis for the Slovak Republic, Croatia, and Poland
Making it Efficient: Financing the green and human transitions
The Next Generation EU Recovery Plan is intended to integrate the green transition with the coronavi rus pandemic regional recovery. To support the objectives of the EGD, the European Commission plans to direct at least EUR 1 trillion (which represents around 7.2 percent of the EU’s 2020 GDP) over the next 10 years towards these efforts (EC 2020). On an annual basis, additional investments of approximately EUR 260 billion, about 1.5 percent of 2018 GDP, are expected to be needed (EC 2019c). The Next Generation EU (NGEU) plan, which will allocate €806.9 billion as of August of 2021 towards the recovery from the COVID-19 pandemic, plans to incorporate a strategy to not only increase the EU’s GDP, but also make the region more resilient to future shocks, especially through the EGD and the digital revolution (Deloitte 2021). For approval of the disbursement of funds, each EU member state was required to develop a National Resilience and Recovery Plan (NRRP) which had to designate at least 37 percent of the outlined investment towards the green transition (Bisciari et al. 2021). Furthermore, 30 percent of the NGEU funds will be allocated as green bonds (Bisciari et al. 2021). The mechanisms incorporated into the Multiannual Financial Framework (MFF) for 2021–2027 and financing frameworks like the NGEU present an opportunity to revitalize the EU’s economy and work towards the
objectives of the EGD if the funds are managed and spent appropriately.
Mechanisms to redirect public funding, taxing, and consumption towards GE projects can mobi lize private sector capital towards the green transi tion. The private sector, with the support of the public sector, will play a key role in filling the holes in the financing needs for the green transition. Even with record amounts of funds allocated towards the green transition, there is an estimated gap of EUR 2.5 trillion, expected to be filled by private sector funding through environmental, social and governance (ESG) related projects (Brühl 2021). One area of opportunity to spur green finance via the private sector is to strengthen the knowledge of government regulatory bodies to facilitate green project implementation. In addition, local financial actors can become well informed on the opportunities of climate-resilient sectors to work with a clearer view of risks and potential gains involved with such projects (World Bank 2022d). Furthermore, the European Emission Trading System (ETS) is used as a market-based instrument to influence the reduction of GHG emissions, while environmental taxation and carbon taxes can be used to complement the ETS by allowing pollutants in sectors not included or not prominent in the ETS to absorb the costs of potentially environmentally harmful activity. An example is transportation, which is estimated to account for over 20 percent of the EU’s GHG emissions (European Commission Directorate-General for Taxation and Customs Union 2021).
118 MAKING THE EUROPEAN GREEN DEAL WORK FOR PEOPLE
Policy Heat-Map Education Health SPJ Slovak Republic 5 6 5 Croatia 10 6 11 Poland 1 1 3
Source: Own analysis based on data and methodology detailed in Annex G.
Human development is a core element of adapting society to a new and more sustainable economy
The green economy transition will have impacts on certain regions and sectors that currently rely heavily on carbon and fossil fuel related indus tries (see chapter 5). Intentional adjustments to make the transition viable and congruent with economic and social needs in those localities will be essential. The Just Transition Fund was designed to assist carbon-intensive regions in the green transition by making available approximately EUR 30 billion in addition to the EUR 19.2 billion from direct EU contributions (Emiliano et al. 2022, 1). In addition, the Modernisation Fund presents an opportunity to fund energy-efficiency projects in lower-income countries of the EU via an auctioning of up to 2 percent of the EU Emission Trading Systems allowances for 2021–2030 (Catuti and Elkerbout 2019). With a regional connotation, approximately EUR 17.5 billion in terms of 2018 constant prices will go towards regions for which the green transition entails the most adjustment and impact (Bisciari et al. 2021). The Just Transition Mechanism will mobilize up to EUR 150 billion via the Just Transition Fund, InvestEU, and the European Investment Bank (EIB) by supporting regions and people most affected by the green transition through reskilling of workers, enterprise development, and circular economy projects (Más Rodriguez 2021). In addition, the EIB will leverage EUR 10 billion in loans from the public sector loan facility for public investment on projects to assist the enabling of a just transition such as renovation of buildings, and energy and transport infrastructure (Más Rodriguez 2021).
Making it Sustainable: Addressing discontent
The EGD’s regional impacts are set to reshape the geography of jobs and regional specialization pat terns and, with it, the future concentration of wealth across European regions. The industrial and economic reconfiguration will have a significant impact on societal issues, especially in the context of rising territorial polarization, which has characterized Europe in the last decade or so. Were the green transition to accelerate an already existing trend of increasing spatial divides, citizens in lagging-behind and development-trapped regions may become increasingly reluctant to support the very environmental policies necessary for reducing greenhouse gas emissions and keep climate change at bay. Whereas an EUwide narrative is essential to create a common goal and support from the widest range of societal stakeholders, the asymmetric impacts of the EGD, especially during the transition period, will need to be addressed if the risk of having strong opposition to the implementation of environmental policies is to be avoided. Strong discontent is blowing wind into the sails of political options that are either climate change deniers or opposed to the adoption of policies to combat climate change. General discontent across European regions has been on the rise in recent years. It has affected the whole continent, but especially places that have struggled to benefit from the socio-economic gains of the digital transition and have suffered from negative externalities
119 6. Enabling a Human-Centered Green Transition
A green transition is not effective, efficient, sustainable or attainable without addressing the binding constraints
For the green transition to be effective, a multi-level policy and institutional framework to align supra-national, national and subnational policy making is required
related to globalization and processes of outsourcing and offshoring. A growing ‘geography of discontent’ has been emerging in different countries and across European regions (Dijkstra et al. 2020; McCann 2019). Many citizens—and especially those in economically more vulnerable regions—feel increasingly disenfranchised and disconnected with highlevel governance and policy-making narratives. This discontent is at the root of past failed attempts to implement top-down policy initiatives. (The Economist, 2019). At times, discontent has been driven by policy initiatives aimed at leveraging efficiency and maximization of returns, hence concentrating investment in core prosperous regions.
The existing territorial polarization is exacer bated by the interplay between inadequate endog‑ enous endowments and exogenous global trends. Opposition to basic EU principles, such as free mobility of capital and labor, migration within EU borders, or economic integration and globalization has been on the rise across the EU regions. Citizens, mostly in economically and graphically declining regions, have resorted to the ballot box—and in certain cases, revolts—to undermine the very factors on which recent economic growth and prosperity has been based (Horner et al. 2018; Rodríguez-Pose 2018). This has been referred to as the ‘revenge of the places that don’t matter’, as the roots of this antagonism are found in regions experiencing years of decline, lack of opportunities, and perceived neglect (Rodríguez-Pose 2018).
With a green transition set to create regional winners and losers, similarly to previous structural changes stemming from digital innovation and European integration, there is no reason to be lieve that the EGD will be immune from such pop‑ ular opposition in losing territories. The rise of populism and support to anti-establishment parties—the very parties which often champion anti-green policies—may prevent an EU-wide implementation of the EGD and the full achievement of emissions targets.
Making it Attainable: Behavioral change
In a context in which policies focus on decoupling the economy from material consumption and in crease efficiency, firms are faced with a choice to continue in the market by introducing capital in the form of new technologies. Overall, this process of capital deepening leads to an increase in the demand for higher skills that are compatible with the use of new technologies. Workers are therefore confronted with the choice of reskilling for new and greener activities or find other economically active occupations—among which inactivity. The short to medium-run equilibrium will exhibit changing relative prices for both the goods and services market, and the labor market. In the case of the former, the EGD acts as a carbon tax to brown industry and as a subsidy to the green economy, thereby changing relative prices in the economy. In the latter, the demand
120 MAKING THE EUROPEAN GREEN DEAL WORK FOR PEOPLE
The EGD alone won’t be sufficient for a sustained and just transition, and national and subnational policies must be aligned and in place
An efficient green transition needs sufficient and diversified sources of financing to avoid crowding out investment
for higher skills will also change relative factor prices between capital and unskilled labor, as well as capital to skilled labor.
There will likely be winners and losers in the transition. These adjustments lead to an equilibrium in which some firms and some workers in some of the regions lose vis-à-vis others that can produce for, work in, and host, respectively, greener activities. Policies aiming at providing support to firms’ technological adaptation, workers’ reskilling while providing social safety nets to affected households and support an upgrading of education and health systems will be the measures that will help with the human transition to a greener economy.
In the short run, energy challenges stemming from the war in Ukraine exemplify the vulnerabil ity of some of the EGD’s core objectives. Russia’s invasion of Ukraine triggered a series of sanctions by the USA and the EU. Russia’s reaction was to demand payments for gas exports in rubles. Supply was then cut to Europe as individual countries declined to make payments in rubles. With a significant dependence on Russian gas, European countries have tried to diversify by importing liquified natural gas (LNG) from the USA and Asia.60 However, the lack of infrastructure to transport and store LNG in a number of European countries has triggered the need for quick solutions (e.g., offshore ships converting LNG back into gas as in the case of
Germany and other countries). However, these actions could undermine the need for longer-term alternative energy solutions.
In the long run however, while most policies would have already assisted with the adjustment, two countervailing forces may determine the equi‑ libria. On the one hand, as demand for carbon-based production falls, their relative prices will follow through. Since carbon-based products could at some point become sufficiently cheap that they become once again attractive, the equilibrium in production may shift at least partially, back to carbon. Intuitively, a further equilibrium in which demand for carbon-based products increases their prices, demand for greener products may swing back. This interplay between the two types of production will continue given the relative prices and hints at the possibility of unstable equilibria.
Behavioral change is indispensable for a sus tained green transition. However, on the other hand, a change in consumers’ behaviors and preferences, may prevent a long-run escalation of unstable equilibria. In as much as consumers’ choices change in favor of cleaner products, the EGD may have produced long-lasting changes in: (i) consumption preferences, (ii) firms’ choices in the mix of factors of production, (iii) workers’ choices for human capital investment, and (iv) overall societal choice of health outcomes.
121 6. Enabling a Human-Centered Green Transition
To make it sustainable, the green transition should be mindful of the unintended consequences and address potential discontent in lagging regions that may pose political challenges for the EGD’s overall sustainability
For the green transition to be ultimately attainable, an unavoidable behavioral change in consumption preferences and investment decisions is needed to avoid reversals into old and suboptimal equilibria
REFERENCES
Al Mamun, A., M. R. Mohamad, M. R. B. Yaacob, and M.M. Mohiuddin. 2018. “Intention and behavior towards green consumption among low-income households.” Journal of Environmental Management 227: 73–86. doi:10.1016/j.jenvman.2018.08.061
Ambasz, D., A. Gupta and H.A. Patrinos. Forthcoming. “A Review of Human Development and Environmental Outcomes.” Washington, DC: World Bank.
Angrist, N., K. Winseck, H. Patrinos, and J.G. Zivin. 2023. “Human Capital and Climate Change.” World Bank Policy Research Working Paper No. 10316. Washington, DC: World Bank.
Aronson, D. and D. Angelakis. 2018. “The Systems Thinker.” In Step by Step Stocks and Flows: Improving the Rigor of Your Thinking https://thesystemsthinker.com/ step-by-step-stocks-and-flows-improving-the-rigor-ofyour-thinking/
Atkinson, R., M. Muro, and J. Whiton. 2019. The case for growth centers: How to spread tech innovation across America. Washington, DC: Brookings Metro Program.
Autor, D. 2019. “Work of the Past, Work of the Future.” AEA Papers and Proceedings 109: 1–32. DOI: 10.1257/ pandp.20191110.
Autor, D., D. Dorn, G. Hanson, and K. Majlesi. 2020. “Importing Political Polarization? The Electoral Consequences of Rising Trade Exposure.” American Economic Review 110 (10): 3139–83. DOI: 10.1257/aer.20170011
Barbieri, N., I. Beretta, V. Constantini, A. D´Amato, M. Gilli, G. Marin, and S.U. Speck. 2021. Sustainability transition and the European Green Deal: A macro-dynamic perspective. Berlin: European Topic Centre on Waste and Materials in a Green Economy.
Barbieri, N., D. Consoli, L. Napolitano, F. Perruchas, E. Pugliese, and A. Sbardella. 2021. “Regional technological capabilities and green opportunities in Europe.” LEM Working Paper Series No. 2021/31.
Barbieri, N., A. Marzucchi, and U. Rizzo. 2020. “Knowledge sources and impacts on subsequent inventions: do green technologies differ from non-green ones?” Research Policy 49(2).
Bassi, A. M., V. Costantini, and G. Sforna. 2020. Systemic modelling tools to assess the green economy transition. Berlin: European Topic Centre on Waste and Materials in a Green Economy.
Bisciari, P., P. Butzen, W. Gelade, W. Melyn, and S. Van Parys. 2021. “The EU budget and the Next Generation EU Recovery Plan: a game changer?” NBB Economic Review https://www.nbb.be/doc/ts/publications/economicreview/2021/ecorevii2021_h2.pdf
Blumberga, A., A. Gravelsins, and D. Blumberga. 2022. “Deliberation Platform for Energy Transition Policies: How to Make Complex Things Simple.” Energies 15: 90-116.
Boschma, R. 2017. “Relatedness as driver of regional diversification: a research agenda.” Regional Studies 51(3): 351-364.
Brühl, V. 2021. “Green finance in Europe—Strategy, regulation and instruments.” Intereconomics 56(6): 323-30.
Brzozowski, J. 2007. “Brain waste, educational investments and growth in transitional countries.” Working Paper, Krakow: Cracow University of Economics.
Bulmer, E. R., Pela, K., Eberhard-Ruiz, A. and J. Montoya (2021), “Global Perspective on Coal Jobs and Managing Labor Transition out of Coal”, Washington, DC: World Bank Group.
Bussolo, M., M. Dávalos, V. Peragine, and R. Sundaram. 2018. Toward a New Social Contract: Taking On Distributional Tensions in Europe and Central Asia. Europe and Central Asia Studies. Washington, DC: World Bank. doi:10 1596/978-1-4648-1353-5. License: Creative Commons Attribution CC BY 3 0 IGO.
Card, D., J. Kluve, and A. Weber. 2017. “What Works? A Meta Analysis of Recent Active Labor Market Program Evaluations.” NBER Working Paper Series No. 21431.
Camaren, P. (2019). Africa’s Green Opportunity: How African Cities Can Harness Green Technologies for Growth and Jobs. International Trade Forum , (1), 20-21. 10.18356/15645304-2019-1-9
Catuti, M. and M. Elkerbout. 2019. “The opportunities of the Modernisation Fund for the energy transition in Central and Eastern Europe.” Centre for European Policy Studies Policy Insights No. 2019-09. https:// www.ceps.eu/ceps-publications/the-opportunities-ofthe-modernisation-fund-for-the-energy-transition-incentral-and-eastern-europe/
Cavallini, S., R. Soldi, L. Di Matteo, M. Utma, and B. Errico. 2018. Addressing brain drain: the local and regional dimension. Brussels: European Committee of the Regions.
Chakraborty, S., P. Sashikala, and R. Shubhagata. 2021. “Green–Agile Practices as Drivers for Patient Satisfaction—An Empirical Study.” International Journal of Healthcare Management 1-6. doi:10.1080/20479700.2 020.1870346
Cohen, G. , Tovar Jalles, J. Loungani, P. and R. Marto (2018), “The Long-Run Decoupling of Emissions and Output: Evidence from the Largest Emitters”, IMF Working Paper 18/56.
Consoli, D., G. Marin, A. Marzucchi, and V. Francesco. 2016. “Do green jobs differ from non-green jobs in terms of skills and human capital?” Research Policy 45(5): 1046-1060. doi:10.1016/j.respol.2016.02.007
Cort, T. and D. C. Esty (eds.). 2020. Values at Work: Sustainable Investing and ESG Reporting. Springer International Publishing. doi:10.1007/978-3-030-55613-6_8
Costella, C., A. McCord, M. van Aalst, R. Holmes, J. Ammoun, and V. Barca. 2021. Social Protection and Climate Change: Scaling Up Ambition. Social Protection Approaches to COVID-19 Expert Advice Service (SPACE), DAI Global UK, United Kingdom.
Crato, N., 2021. Improving a Country’s Education: PISA 2018 Results in 10 Countries. 1st ed. Springer International Publishing.
Crescenzi, R., and A. Rodríguez-Pose. 2011. “Reconciling top-down and bottom-up development policies.” Environment and Planning 43(4): 773-780.
123 References
Crippa, M., G. Oreggioni, D. Guizzardi, M. Muntean, E. Schaaf, and E. Lo Vullo. 2019. Fossil CO2 and GHG emissions of all world countries. Luxembourg: Publication Office of the European Union.
Cunningham, W. and A. Schmillen. 2021. “The Coal Transition: Mitigating Social and Labor Impacts.” Social Protection and Jobs Discussion Paper No. 2105, World Bank, Washington, D.C.
De Marchi, V. (2012). “Environmental innovation and cooperation: empirical evidence from Spanish manufacturing firms.” Research Policy 41(3): 614-623.
Deloitte. (2021). Next Generation EU funding and the future of Europe: A unique opportunity for growth https://www2.deloitte.com/content/dam/Deloitte/ global/Documents/About-Deloitte/deloitte-nextgeneration-eu-funding-and-the-future-of-europe.pdf
Diamond, R. 2016. “The determinants and welfare implications of US workers’ diverging location choices by skill.” American Economic Review 106: 479-524.
Dijkstra, L., H. Poelman, and A. Rodríguez-Pose. 2020. “The geography of EU discontent.” Regional Science 54: 737-753.
Dominicis, L. d., R. Florax, and H. de Groot. 2013. “Regional clusters of innovative activity in Europe: are social capital and geographical proximity key determinants?” Applied Economics 45(17): 2325-2335.
Dorn, D., and P. Levell. 2021. “Trade and Inequality in Europe and the US.” IZA Discussion Papers 14914. Institute of Labor Economics (IZA), Bonn.
Ebi, K. L., P. Berry, K. Hayes, C. Boyer, S. Sellers, P.M. Enright, and J.J. Hess. 2018. “Stress Testing the Capacity of Health Systems to Manage Climate Change-Related Shocks and Stresses.” International Journal of Environmental Research and Public Health 15(11): 2370. doi:10.3390/ijerph15112370
ECA (European Court of Auditors). 2021a. “EU actions and existing challenges on electronic waste.” Review No. 04/2021. https://www.eca.europa.eu/en/Pages/DocItem.aspx?did=58526
Ed Markey Press Release. 2021. Senator Markey and Representative Ocasio-Cortez introduce Civilian Climate Corps For Jobs and Justice to rebuild America. https:// www.markey.senate.gov/news/press-releases/senatormarkey-and-rep-ocasio-cortez-introduce-civilian-climate-corps-for-jobs-and-justice-to-rebuild-america Accessed on 27 October, 2021.
EC (2022), “A European Green Deal”, European Commission, accessed online at https://ec.europa.eu/info/ strategy/priorities-2019-2024/european-green-deal_en
Eckert, S. 2021. “Varieties of Framing the Circular Economy and the Bioeconomy: Unpacking Business Interests in European Policymaking.” Journal of Environmental Policy & Planning 23(2): 181–193, DOI: 10.1080/ 1523908X.2021.1894106
EEA (European Environment Agency), M. De Schoenmakere, J. Gillabel, A. Reichel. 2016. Circular economy in Europe: developing the knowledge base, EEA Publications Office. https://data.europa.eu/doi/10.2800/51444
EEA (European Environment Agency). 2021. “Growth without economic growth.” Briefing, 11 January 2021. https://www.eea.europa.eu/publications/growth-without-economic-growth
EIB (European Investment Bank). 2020. “Coal Regions in Transition.” Luxembourg: European Investment Bank.
Elliott, R. J., W. Kuai, D. Maddison and C. Ozgen. 2021. “Eco-Innovation and Employment: A Task-Based Analysis.” Available at SSRN 3767265.
Elkind, J. and D. Bednarz. 2020. “Warsaw, Brussels, and Europe’s Green Deal: Challenges and Opportunities in 2020.” New York: Center on Energy Policy, Columbia University. https://www.energypolicy.columbia.edu/research/commentary/warsaw-brussels-and-europe-s-green-deal-challenges-and-opportunities-2020
Emiliano, M., P. Piscitelli, C. Stefanazzi, and A. Miani. 2022. “Health Benefits of Decarbonization: The Transition of Carbon Intensive Regions in the Frame of European Green Deal.” The Lancet Regional Health-Europe doi:10.1016/j.lanepe.2022.100335
European Parliamentary Research Service (EPRS). 2021. “Climate Action in Slovakia, Latest State of Play.” PE 698.767—October 2021. EU progress on climate action— How Are the Member States Doing? Briefing. European Union. https://www.europarl.europa.eu/RegData/etudes/ BRIE/2021/698767/EPRS_BRI(2021)698767_EN.pdf
ESPON. 2020b. Shrinking rural regions in Europe. Luxembourg: ESPON.
EU. 2021. Education and Training Monitor https://education. ec.europa.eu/education-and-training-monitor European Commission. 2012. Future Brief: Green Behaviour. Brussels: European Commission.
European Commission and UN Habitat. 2016. The State of European Cities 2016. Brussels: European Commission. European Commission. 2017a. Competitiveness in low-income and low-growth regions - the lagging regions report. Brussels: European Commission.
European Commission. 2017b. My Region, My Europe, Our Future: Seventh Report of Economic, Social and Territorial Cohesion . Luxembourg: DG Regional and Urban Policy.
European Commission. 2018. Directive of the European Parliament and of the Council on Renewable Energy Brussels: European Commission.
European Commission. 2019a. What is the European Green Deal? https://ec.europa.eu/commission/ presscorner/detail/en/fs_19_6714
European Commission. 2019b. PISA 2018 and the EU: Striving for social fairness through education doi:10.2766/964797
European Commission. 2019c. Communication from the Commission: The European Green Deal. Brussels: European Commission.
European Commission. 2020. Communication from the Commission to the European Parliament, the European Council, the European Economic and Social Committee and the Committee of Regions. Brussels: European Commission.
124 MAKING THE EUROPEAN GREEN DEAL WORK FOR PEOPLE
European Commission. 2021a. Commission Staff Working Document: Analysis of the recovery and resilience plan of Croatia . Brussels, 8.7.2021 SWD(2021) 197 final. https://ec.europa.eu/info/sites/default/files/com2021-401_swd_en.pdf
European Commission 2021b. Commission Staff Working Document: Analysis of the recovery and resilience plan of Slovakia. European Commission. Brussels, 21.6.2021 SWD(2021) 161 final https://ec.europa.eu/info/files/ commission-staff-working-document-analysisrecovery-and-resilience-plan-slovakia_en.
European Commission. 2021c. Taxation in support of green transition: an overview and assessment of existing tax practices to reduce greenhouse gas emissions. Directorate-General for Taxation and Customs Union, Publications Office. https://data.europa.eu/doi/10.2778/343194
European Commission. 2022. Cohesion in Europe towards 2050. Brussels: European Commission.
Eurostat. 2022b. “How many citizens had basic digital skills in 2021?” https://ec.europa.eu/eurostat/web/productseurostat-news/-/ddn-20220330-1
Fanning, A., D. O’Neill, J. Hickel, R. Nicolas, Roux. 2022. “The social shortfall and ecological overshoot of nations.” Nature Sustainability 5. doi:10.1038/s41893021-00799-z.
Farole, T., S. Goga, and M. Ionescu-Heroiu. 2018. Rethinking Lagging Regions: using Cohesion Policy to deliver on the potential of Europe’s regions. Washington, DC: World Bank.
Fleming, R. C., and R. Mauger. 2021. “Green and Just? An Update on the ‘European Green Deal’” Journal for European Environmental & Planning Law 18(1): 164-180. doi:10.1163/18760104-18010010
Fratesi, U., and A. Rodríguez-Pose. 2016. “The Crisis and Regional Employment in Europe: What Role for Sheltered Economies?” Cambridge Journal of Regions, Economy and Society 9(1): 33–57. https://EconPapers. repec.org/RePEc:oup:cjrecs:v:9:y:2016:i:1:p:33-57.
Garrote Sanchez, D. and M. Makovec (forthcoming) “Jobs, Skills, and the Green Transition in ECA”, mimeo.
Giannone, E. 2017. Skilled-biased technical change and regional convergence. Chicago: University of Chicago.
Government of the Republic of Croatia. 2022. CroatiaNational Development Strategy 2030 (summary from website) (document not in English). July 2, 2022. https://digital-skills-jobs.europa.eu/en/actions/ national-initiatives/national-strategies/croatia-nationaldevelopment-strategy-2030.
Government of the Republic of Croatia. 2020. National Reform Programme https://vlada.gov.hr/ UserDocsImages/Europski%20semestar%202020/ National%20reform%20programme%202020.pdf
Government of the Slovak Republic. 2019. Greener Slovakia: Strategy of the Environmental Policy of the Slovak Republic until 2030 https://www.minzp.sk/files/ iep/greener_slovakia-strategy_of_the_environmental_ policy_of_the_slovak_republic_until_2030.pdf.
Government of the Slovak Republic. 2020. Low–Carbon Development Strategy of the Slovak Republic until 2030 with a View to 2050 https://minzp.sk/files/oblasti/politika-zmeny-klimy/ets/lts-sk-eng.pdf.
Gwartney, J., R. Holcombe, and R. Lawson. 2006. “Institutions and the impact of investment on growth.” Kyklos 59(2): 255-273.
Györi, M., K. Diekmann, and E. Kühne. 2021. The Importance of Social Protection for Climate Change Mitigation in LMICS: Success Stories and Opportunities for the Future. GIZ.
Hanushek, E., G. Schwerdt, S. Wiederhold, and L. Woessmann. 2017. “Coping with Change: International Differences in the Returns to Skills.” Economics Letters 153: 15–19. ISSN 0165-1765. https://doi.org/10.1016/j. econlet.2017.01.007.
Hidalgo, C., P. Balland, R. Boschma, M. Delgado, M. Fieldman, K. Frenken, and F. Neffke. 2018. “The principle of relatedness.” International Conference on Complex Systems 451-457.
Horner, R., S. Schlinder, D. Haberly, and Y. Aoyama. 2018. “Globalisation, uneven development and the North–South ‘big switch’” Cambridge Journal of Regions, Economy and Society 11(1): 17-33.
Hollingsworth, A., C. J. Ruhm, and K. Simon. 2017. “Macroeconomic Conditions and Opioid Abuse.” Journal of Health Economics 56: 222–233. https://doi. org/10.1016/j.jhealeco.2017.07.009
IRENA (International Renewable Energy Agency). 2019. Renewable Energy: A Gender Perspective. Abu Dhabi: IRENA. https://www.irena.org/-/media/Files/IRENA/ Agency/ Publication/2019/Jan/IRENA_Gender_ perspective_2019.pdf
Iammarino, S., A. Rodríguez-Pose and M. Storper. 2019. “Regional inequality in Europe: evidence, theory and policy implications.” Journal of Economic Geography 19(2): 273-298.
ILO (International Labour Organisation). 2017. Green Initiative Policy Brief: Active Labor Market Policies. Geneva: ILO.
ILO (International Labour Organisation). 2018a. The Employment Impact of Climate Change Adaptation Geneva: ILO. https://www.ilo.org/wcmsp5/groups/ public/---ed_emp/documents/publication/ wcms_645572.pdf
ILO (International Labor Organization). 2019a. Working on a warmer planet: The impact of heat stress on labour productivity and decent work. Geneva: ILO. https:// www.ilo.org/wcmsp5/groups/public/---dgreports/--dcomm/---publ/documents/publication/wcms_711919. pdfILO (International Labour Organisation). 2019b. Skills for a Greener Future: Challenges and Enabling Factors to Achieve a Just Transition. Geneva: ILO.
IPCC (Intergovernmental Panel on Climate Change). 2021a. Climate Change 2021 The Physical Science Basis https://www.ipcc.ch/report/ar6/wg1/downloads/ report/IPCC_AR6_WGI_SPM_final.pdf
IPCC (Intergovernmental Panel on Climate Change). 2021b. Regional Fact Sheet - Europe. Sixth Assessment Report.
125 References
IPCC (Intergovernmental Panel on Climate Change). 2022. Climate Change 2022: Mitigation of Climate Change Contribution of Working Group III to the Sixth Assessment Report of the Intergovernmental Panel on Climate Change [P.R. Shukla, J. Skea, R. Slade, A. Al Khourdajie, R. van Diemen, D. McCollum, M. IRENA (International Renewable Energy Agency). 2019. Renewable Energy: A Gender Perspective. Abu Dhabi: IRENA.
Jafino, B. Arga, Walsh, B., Rozenberg, J., & Hallegatte S. (2020, September). Revised Estimates of the Impact of Climate Change on Extreme Poverty by 2030. (Working Paper No. 9417). https://openknowledge.worldbank. org/bitstream/handle/10986/34555/RevisedEstimates-of-the-Impact-of-Climate-Change-onExtreme-Poverty-by-2030.pdf
JRC (Joint Research Centre). 2018. EU coal regions: opportunities and challenges ahead. Brussels: Joint Research Centre.
Känzig, D. 2021. The economic consequences of putting a price on carbon. Frankfurt: European Central Bank.
Kharas, H., and H. Kohli. 2011. “What is the middle income trap, why do countries fall into it, and how can it be avoided?” Global Journal of Emerging Market Economies 281-289.
Kirchherr, J., D. Reike and M.P. Hekkert. 2017. “Conceptualizing the Circular Economy: An Analysis of 114 Definitions.” SSRN Electronic Journal . doi:10.2139/ ssrn.3037579.
Klein, M., and R. Winkler. 2019. “Austerity, Inequality, and Private Debt Overhang.” European Journal of Political Economy 57: 89–106. ISSN 0176-2680. https://doi.org/10.1016/j. ejpoleco.2018.08.003.
Kluve, J., S. Puerto, D. Robalino, J. Romero, F. Rother, J. Stöterau, F. Weidenkaff, and M. Witte. 2019. “Do Youth Employment Programs Improve Labor Market Outcomes? A Quantitative Review.” World Development 114: 237–253. 10.1016/j. worlddev.2018.10.004.
König, A., and J. Evans. 2013. “Introduction: Experimenting for Sustainable Development? Living Laboratories, Social Learning, and the Role of the University.” In Regenerative Sustainable Development of Universities and Cities: The Role of Living Laboratories, edited by A. König, pp.1–26. Edward Elgar: Cheltenham. ISBN 1781003637
Kotarski, Kristijan. 2022. “European Green Deal: Opportunities and Challenges of Croatia’s Green Transition.” Faculty of Political Science, University of Zagreb. https://www.emerics. org:446/issueFileDownload.es?brdctsNo=325267& brdctsFileNo=82419.
Kwauk, Christina, and Amanda Braga. 2017. Three Platforms for Girl’s Education in Climate Strategies. Washington, DC: Brookings Global Economy and Development Program.
Kwauk, Christina, Jessica Cooke, Elisa Hara, and Joni Pegram. 2019. Girls’ Education in Climate Strategies: Opportunities for improved policy and enhanced action in Nationally Determined Contributions. Washington, DC: Brookings Global Economy and Development Program.
Kwauk, Christina, and Rebecca Winthrop. 2021. Unleashing the creativity of teachers and students to combat climate change: An opportunity for global leadership. Washington, DC: Brookings Center for Universal Education.
Kwiek, M. 2021. “What Large-Scale Publication and Citation Data Tell Us about International Research Collaboration in Europe: Changing National Patterns in Global Contexts.” Studies in Higher Education 46(12): 2629–2649. DOI: 10.1080/03075079.2020.1749254.
Linn, B.M. Carney Almroth, C.D. Collins, S. Cornell, C.A. de Wit, M.L. Diamond, and P. Fantke et al. 2022. “Outside The Safe Operating Space Of The Planetary Boundary For Novel Entities”. Environmental Science & Technology 56 (3): 1510-1521. doi:10.1021/acs. est.1c04158.
Luca, F.-A., Epuran, G., Ciobanu, C. I., & Horodnic, A.-V. (2019). “Green Jobs Creation—Main Element in the Implementation of Bioeconomic Mechanisms”. Amfiteatru Economic 21(50): 60-74. https://doi.org/10.24818/ EA/2019/50/60
Lupi, V., C. Candelise, M.A. Calull, S. Delvaux, P. Valkering, W. Hubert, and A. Sciullo et al. 2021. “A Characterization Of European Collective Action Initiatives And Their Role As Enablers Of Citizens’ Participation In The Energy Transition”. Energies 14 (24): 8452. doi:10.3390/ en14248452.
Macdonald, K. and H.A. Patrinos. 2021. “Education quality, green technology and the economic impact of carbon pricing.” Washington, DC: World Bank.Männasoo, K., H. Hein, and R. Ruubel. 2018. “The contributions of human capital, R&D spending and convergence to total factor productivity growth.” Regional Studies 52(12): 1598-1611.
Más Rodriguez, P. 2021. The EU budget: the new MFF and the recovery instrument: Next Generation EU. Instituto Español de Analistas Financieros. https://www.ieaf.es/ images/Publicaciones-FEF/Anuarioeuro2021/10_The_ EU_budget.pdf
Mayekar, M.R., and K.G. Sankaranarayanan. 2019. “Values As Predictors Of Consumers’ Green Product Purchase Behaviour”. International Journal Of Green Economics 13 (1): 1. doi:10.1504/ijge.2019.101443.
McCann, P. (2019). “Perceptions of Regional Inequality and the Geography of Discontent: Insights from the UK.” Regional Studies 53(5): 741–760.
McCann, P., and R. Ortega-Argiles. 2016. “The early experience of smart specialisation implementation in EU Cohesion Policy.” European Planning Studies 24(8): 1407-1427.
McCann, P., and L. Soete. 2020. Place-based innovation for sustainability. Brussels: Joint Research Centre.
McCowan, T., W. Filho, and L. Brandli (eds.). 2021. “Universities facing Climate Change and Sustainability.” Commissioned by Körber-Stiftung in preparation for the 2021 Global University Leaders Council Hamburg. https://www.researchgate.net/ publication/ 353764763_Universities_facing_Climate_ Change_ and_Sustainability.
126 MAKING THE EUROPEAN GREEN DEAL WORK FOR PEOPLE
McKenzie, D. 2017. “How Effective Are Active Labor Market Policies in Developing Countries? A Critical Review of Recent Evidence.” Policy Research Working Paper No. 8011. World Bank, Washington, DC. © World Bank. https://openknowledge.worldbank.org/handle/10986/26352 License: CC BY 3.0 IGO.
Minelgaitė, A., and G. Liobikienė. 2021. “Changes in pro-environmental behaviour and its determinants during long-term period in a transition country as Lithuania.” Environment, Development and Sustainability 23(11): 16083–16099. doi:10.1007/s10668-021-01329-9
Moreno, R., and D. Ocampo-Corrales. 2022. “The Ability Of European Regions To Diversify In Renewable Energies: The Role Of Technological Relatedness”. Research Policy 51 (5). doi:10.1016/j.respol.2022.104508.
Mousa, S. K., and M. Othman. 2020. “The Impact of Green Human Resource Management Practices on Sustainable Performance in Healthcare Organisations: A Conceptual Framework.” Journal of Cleaner Production 243. doi:10.1016/j.jclepro.2019.118595
Muro, M., R. Maxim, and J. Whiton. 2019. Automation and Artificial Intelligence: How Machines are Affecting People and Places. Washington DC: Brookings Metropolitan Program.
Nayna Schwerdtle, P., E. Irvine, S. Brockington, C. Devine, M. Guevara, and K.J. Bowen. 2020. “Calibrating to Scale: A Framework for Humanitarian Health Organizations to Anticipate, Prevent, Prepare for and Manage Climate-related Health Risks.” Globalization and Health 16(1): 54-10. doi:10.1186/s12992-020-00582-3
North, D. C. 1990. Institutions, institutional change and economic performance. Cambridge University Press.
OECD (Organisation for Economic Co-operation and Development). 2018. Global Material Resources Outlook to 2060: Economic Drivers and Environmental Consequences . Paris: OECD Publishing. doi:10.1787 /9789264307452-en
OECD (Organisation for Economic Co-operation and Development). 2019a. OECD Regional Outlook 2019: Leveraging Megatrends for Cities and Rural Areas. Paris: OECD.
OECD (Organisation for Economic Co-operation and Development). 2019b. “Results for regions within countries.” In PISA 2018 Results (Volume I): What Students Know and Can Do , OECD Publishing, Paris. doi:10.1787/bad603f0-en.
OECD (Organisation for Economic Co-operation and Development). 2020. Making the green recovery work for jobs, income and growth https://read.oecd-ilibrary. org/view/?ref=136_136201-ctwt8p7qs5&title=Making-the-Green-Recovery-Work-for-Jobs-Income-andGrowth_
OECD (Organisation for Economic Co-operation and Development). 2020a. Global Material Resources Outlook to 2060 Economic drivers and environmental consequences. Paris: Organisation for Economic Co-operation and Development.
OECD (Organisation for Economic Co-operation and Development). 2020b. COVID-19 response measures and their potential implication for greening the economies of Eastern Europe, the Caucasus and Central Asia GREEN Action Task Force, Environment Directorate, OECD, Paris.
OECD (Organisation for Economic Co-operation and Development). 2020c. Policy challenges for the next 50 years. Paris: Organisation for Economic Co-operation and Development.
OECD (Organisation for Economic Co-operation and Development). 2021a. OECD Skills Outlook 2021: Learning for Life, OECD Publishing. Paris. doi:10.1787/0ae365b4-en.
OECD (Organisation for Economic Co-operation and Development). 2021b. Incentives for SMEs to Invest in Skills: Lessons from European Good Practices
Panic, M and J.D. Ford. 2013. “A Review of National-Level Adaptation Planning with Regards to the Risks Posed by Climate Change on Infectious Diseases in 14 OECD Nations.” International Journal of Environmental Research and Public Health 10: 7083-109.
Pelau, C., and C. Chinie. 2018. “Econometric Model for Measuring the Impact of the Education Level of the Population on the Recycling Rate in a Circular Economy.” Amfiteatru Economic 20: 340–355. 10.24818/ EA/2018/48/340.
Peters. 2014. “Understanding Green Occupations from a Task-Based Approach.” Applied Economic Perspectives and Policy 36(2): 238–264. https://doi. org/10.1093/aepp/ppt026Persson,
Pike, A., A. Rodríguez-Pose, and J. Tomaney. 2017. “Shifting horizons in local and regions development.” Regional Studies 51(1): 46-57.
Poschen, P. 2015. “Decent Work, Green Jobs and the Sustainable Economy: Solutions for Climate Change and Sustainable Development”. 1st ed. Routledge Publishing.
Potting, J. and M.P. Hekkert, E. Worrell, and A. Hanemaaijer. 2017. Circular Economy: Measuring innovation in the product chain
Pugliese, E., and A. Tübke. 2019. Economic complexity to address current challenges in innovation systems: a novel empirical strategy for regional development Luxembourg: JCR Policy Insights.
Radinger-Peer, V., and G. Pflitsch. 2017. “The Role of Higher Education Institutions in Regional Transition Paths towards Sustainability: The Case of Linz (Austria).” Review of Regional Research 37: 161–187 (2017). DOI: https://doi.org/10.1007/s10037-017-0116-9.
Rodriguez-Alvarez, A., M. Llorca and T. Jamasb. 2021. “Alleviating energy poverty in Europe: Front-Runners and Laggards.” Energy Economics 103: 105575. doi:10.1016/j.eneco.2021.105575
Rodríguez-Pose, A. 2013. “Do institutions matter for regional development?” Regional Studies 47(7): 1034-1047.
Rodríguez-Pose, A. 2018. “The revenge of the places that don’t matter (and what to do about it).” Cambridge Journal of Regions, Economy and Society 11(1): 189-209.
127 References
Rodríguez-Pose, A. 2020. “Institutions and the fortunes of territories.” Regional Science Policy Practice 12: 371386.
Rodríguez-Pose, A., and T. Ketterer. 2020. “Institutional change and the development of lagging regions in Europe.” Regional Studies 54(7): 974-986.
Rodríguez-Pose, A., and C. Wilkie. 2017. “Revamping Local and Regional Development Through Place-based Strategies.” Cityscape: A Journal of Policy Development and Research
Rodrik, D. 2021. “A Primer on Trade and Inequality.” NBER Working Papers 29507. National Bureau of Economic Research (NBER), Cambridge, MA.
Sabato, S., and B. Frotenddu. 2020. “A socially just transition through the European Green Deal?” European Trade Union Institute Research Paper Series. doi:10.2139/ssrn.3
Saget, C., A. Vogt-Schilb and T. Luu. 2020. “Jobs in a Net-Zero Emissions Future in Latin America and the Caribbean.” Inter-American Development Bank and International Labour Organization, Washington D.C. and Geneva.
Santoalha, A., and R. Boschma. 2020. “Diversifying in green technologies in European regions; does political support matter?” Regional Studies 1-14.
Slijepčević, S. and Z. Kordej-De Villa. 2021. “Public Attitudes toward Renewable Energy in Croatia” Energies 14 (23): 8111. doi:10.3390/en14238111
Slovak Ministry of Education. 2019. Integrated National Energy and Climate Plan for 2021 to 2030. https://ec.europa.eu/ energy/sites/ener/files/sk_final_necp_main_en.pdf
Sofroniou, N., & Anderson, P. (2021). “The green factor: Unpacking green job growth.” International Labour Review 160 (1): 21-41. https://doi.org/10.1111/ilr.12176
SPEED (Social Protection Expenditure and Evaluation Database for Europe and Central Asia). 2022. Database, Washington, DC: World Bank. https://worldbankgroup. sharepoint.com/sites/SPL/ecaspeed/Pages/index.aspx
Storper, M. 2005. “Society, community, and economic development.” Studies in Comparative International Development 39(4): 30-57. doi:10.1016/j.techfore.2020.120528
Tanner, Carmen, and Sybille Wölfing Kast. 2003. “Promoting Sustainable Consumption: Determinants Of Green Purchases By Swiss Consumers”. Psychology & Marketing 20 (10): 883-902. doi:10.1002/mar.10101.
The Economist (2022), ”How Europe plans to cope as Russia cuts off the gas”, 1 June 2022.
Thompson, Vanessa. “The Cost-Benefit Analysis of Climate Change.” Berkeley Economic Review, April 14, 2020. https://doi.org/https://econreview.berkeley.edu/ the-cost-benefit-analysis-of-climate-change/
Thomson, H., N. Simcock, S. Bouzarovski, and S. Petrova. 2019. “Energy poverty and indoor cooling: An overlooked issue in Europe.” Energy and Buildings 196: 2129. doi:10.1016/j.enbuild.2019.05.014
Tomaszewski, Krzysztof. 2020. “The Polish road to the new European Green Deal—challenges and threats to the national energy policy.” Energy Policy Journal 23(2):5-18.
Trencher, G., M. Yarime, K. McCormick, C. Doll, S. Kraines, and A. Kharrazi. 2014. “Beyond the Third Mission: Exploring the Emerging University Function of Co-creation for Sustainability.” Science and Public Policy 41(2): 151–179. https://doi.org/10.1093/scipol/sct044.
Uehara, T., Y. Nagase, and W. Wakeland. 2015. “Integrating Economics and System Dynamics Approaches for Modelling an Ecological–Economic System”, Systems Research and Behavioral Science 33: 515-31.
UNDP (United Nations Development Programme). 2020. Human Development Report 2020: The Next Frontier—Human Development and the Anthropocene http://hdr.undp.org/en/2020-report
UNEP (United Nations Environment Programme). 2011. Introduction: Setting the Stage for a Green Economy Transition . https://wedocs.unep.org/bitstream/ handle/20.500.11822/22005/1.0_introduction. pdf?sequence=1&isAllowed=y
UNEP (United Nations Environment Programme). 2019. Global Resources Outlook 2019: Natural Resources for the Future We Want https://wedocs.unep.org/20.500.11822/27518
Van der Ploeg, F., and A. Rezai. 2020. “Stranded assets in the transition to a carbon-free economy.” Annual Review of Resource Economics 12(1): 281-298. doi:10.1146/annurev-resource-110519-040938
Wagner, C. 2013. “Adult learning meets the green economy: Lessons from a green jobs education project.” Adult Learning 24(1): 14-21. doi:10.1177/1045159512467324
Wang-Erlandsson, L., A. Tobian, R.J. van der Ent, I. Fetzer, S. te Wierik, M. Porkka, and A. Staal et al. 2022. “A Planetary Boundary For Green Water.” Nature Reviews Earth & Environment. doi:10.1038/s43017-022-00287-8.
WHO (World Health Organization). 2018. Circular economy and health: opportunities and risks, World Health Organization, Regional Office for Europe.
WHO (World Health Organization). (2021, October 30). Climate change and health. World Health Organization. Retrieved April 7, 2022, from https://www.who.int/newsroom/fact-sheets/detail/climate-change-and-health World Bank. 2012. Inclusive Green Growth: The Pathway to Sustainable Development, Washington DC: World Bank. World Bank. 2016. Shockwaves: Managing the Impacts of Climate Change on Poverty, Washington, D.C.: World Bank.
World Bank. 2017. “Poverty and Distributional Impact of Electricity Tariff Reform on Vulnerable Households in Albania.” unpublished presentation.
World Bank. 2018a. “Managing Coal Mine Closure: Achieving a Just Transition for All”, Washington, DC: World Bank Group.
World Bank. 2018b. World Development Report 2018. Learning to Realize Education’s Promise. Washington, DC: World Bank.
World Bank. 2020. “Cost-Effective Approaches to Improve Global Learning.” World Bank, Washington, DC. https://www.worldbank.org/en/topic/teachingandlearning/publication/cost-effective-approaches-to-improve-global-learning
128 MAKING THE EUROPEAN GREEN DEAL WORK FOR PEOPLE
World Bank. 2020a. “The Human Capital Index 2020 Update: Human Capital in the Time of COVID-19.” World Bank, Washington, DC. https://openknowledge.worldbank.org/handle/10986/34432
World Bank. 2020b. “Supporting Transition in Coal Regions: A Compendium of the World Bank’s Experience and Guidance for Preparing and Managing Future Transitions, Washington, DC: World Bank Group.
World Bank. 2021b. “Social Protection and Labor: A Key Enabler for Climate Change Adaptation and Mitigation (DRAFT).” World Bank, Washington, DC.
World Bank. 2021c. “Latin America and the Caribbean Climate Change Action Plan: Technical Background Report.” World Bank, Washington, D.C.
World Bank. 2022a. Squaring the Circle: Policies for Europe’s Circular Economy Transition. Washington DC: The World Bank Group.
World Bank. 2022b. Unlocking Green Finance in Turkey, Washington, DC: World Bank.
Wu, H., D. Peng and L. Wang. 2021. “Model for sustainable development based on system dynamics and energy–economy–environment coordination: A case study of Beijing, China.” Energy Science & Engineering 9: 828–842.
129 References
Endnotes
1 These case studies were selected on important aspects of the EGD, and in countries where the World Bank has active engagements.
2 The source for the poverty data: https://documents1. worldbank.org/curated/en/706751601388457990/ pdf/Revised-Estimates-of-the-Impact-of-ClimateChange-on-Extreme-Poverty-by-2030.pdf.
For job losses: https://www.ilo.org/global/aboutthe-ilo/newsroom/news/WCMS_711917/lang--en/ index.htm#:~:text=Projections%20based%20on%20 a%20global,losses%20of%20US%242%2C400%20billion.
For health: https://www.who.int/news-room/factsheets/detail/climate-change-and-health.
3 Improving education levels are also related to an improvement in citizen’s environmental attitudes and behaviors through cognitive and non-cognitive factors, though establishing causality requires further research (Ambasz et al. forthcoming).
4 Program for the International Assessment of Adult Competencies (PIAAC).
5 Estimating the impact of skills on earnings, where skills are divided between foundational skills, their usage at home or work, and soft skills, also finds a somewhat stronger relationship between skills and earnings in green than in brown jobs. However, the difference is not significant at the 0.05 level, with the exception of the relationship between years of schooling and earnings.
6 Research shows that investments in improving quality of education can have long lasting benefits in mitigating inequalities arising out of environmental policies. Having higher quality education increases the elasticity of skill supply and, as a result, mitigates a carbon tax’s economic costs including output loss and wage inequity and enhances its effect on emissions reduction (Macdonald and Patrinos 2021).
7 Chapter 6 concludes by not only recapitulating the effects and the policies to enable, adapt and mitigate, but also by highlighting the binding constraints: behavioral change and financing.
8 SDMs are useful to visualize and understand feedback dynamics. However, they do not allow the representation and interaction of discrete agents, limiting the understanding of micro behaviors (they ignore the relationships that may emerge between the macro and micro behaviors of the system).
9 Figures 2.1 through 2.4 are examples that represent just parts of the overall SDM that are too large to show in a single screen. See full details of the SDM in Annex B.
10 Scenarios were built taking into account the current state of the EGD and each one of the countries regarding environmental taxes (https://ec.europa.eu/eurostat/ statistics-explained/index.php?title=Environmental_ tax_statistics), their recycling capacity (https://www. eea.europa.eu/ims/waste-recycling-in-europe) and the corresponding degradation of natural environment and ecosystems (https://unstats.un.org/sdgs/report/2019/ goal-15/). It’s important to note that costs imposed to firms resulting from supra-national, national, regional and local taxes and regulations, depend on where each firm is located. The two scenarios presented in this chapter offer a range of impacts that the EGD is likely to represent for the EU at large and each of the three countries selected for case studies.
11 More instability in investment was found in the Slovak Republic (see Annex E).
12 This is particularly the case for the moderate-high scenario in which the EGD puts in place more astringent policies.
13 That is, demand trends in the long run, for both types of workers, could move in opposite direction. Note that the result is a movement towards convergence, not that the former is achieved. Therefore, the wage gap will expand. Under one scenario, the moderate-high, there is the possibility that in the long run, the wage gap rises and then contracts without closing.
14 The higher scenario (SC2) accounts for EGD policies (as in SC1), and potential country/regional level policies that could increase the astringency of the vector of policies shocking the economy.
15 Beyond HD, other productive-sector policies may be required. For instance, entrepreneurial and financial-market policies that allow firms to fail and exit the market so that entrepreneurs can reenter the market with new ideas.
16 E-wallets are complete electronic solutions, allowing beneficiaries to send and receive money, as well as carry out financial transactions. E-payments only deliver the cash virtually to an account and are usually cashed out by the beneficiary, thus not necessarily reducing travel for the beneficiary.
17 The substantiality requirement, however, would need to be met to qualify for CCBs.
18 Györi, M., Diekmann, K., and Kühne, E. 2021. The Importance of Social Protection for Climate Change Mitigation in LMICS: Success Stories and Opportunities for the Future. GIZ.. There is, however, no experience to date on initiatives improving environmental behaviors through SBCC campaigns and nudges.
19 Reuters, 2020.
20 World Bank. 2021. “Latin America and the Caribbean Climate Change Action Plan: Technical Background Report.” World Bank, Washington, D.C.
21 Costella, Cecilia, Anna McCord, Maarten van Aalst, Rebecca Holmes, Jonathan Ammoun, and Valentina Barca. 2021. “Social Protection and Climate Change: Scaling Up Ambition.” Social Protection Approaches to COVID-19 Expert Advice Service (SPACE), DAI Global UK, United Kingdom.
22 LAC SPJ Task Team Toolkit, World Bank, 2022.
23 Cunningham, Wendy and Achim Schmillen. 2021. “The Coal Transition: Mitigating Social and Labor Impacts.” Social Protection and Jobs Discussion Paper No. 2105, World Bank, Washington, D.C.
24 World Bank. 2021. Social Protection and Labor: A Key Enabler for Climate Change Adaptation and Mitigation (DRAFT). World Bank, Washington, DC.
25 IDB. 2020. Jobs in a Net-Zero Emissions Future in Latin America and the Caribbean. IDB and ILO, Washington, D.C. and Geneva.
26 The Slovak Republic’s case study.
27 Eurostat, indicator TRNG_AES_102.
28 https://www.oecd.org/els/emp/skills-and-work/ adult-learning/Prior_learning.pdf
29 See https://education.ec.europa.eu/sites/default/ files/document-library-docs/pisa-2018-eu_1.pdf
30 the Slovak Republic case study.
31 Crato, 2021 https://link.springer.com/book/10.1007/ 978-3-030-59031-4
32 The share of working age adults participating in learning in 2016 varied from only 7 percent in Romania to 64 percent in the Netherlands. 15 of the 27 EU countries
130 MAKING THE EUROPEAN GREEN DEAL WORK FOR PEOPLE
were below the EU target of 47 percent of working age adults participating in learning by 2025.
33 The Slovak Republic’s case study.
34 OECD Skills Outlook 2021 Learning for Life: Learning for Life, Figure 3.16
35 International Labor Organisation. 2017. Green Initiative Policy Brief: Active Labor Market Policies.
36 Ed Markey Press Release. 2021. Senator Markey and Representative Ocasio-Cortez introduce Civilian Climate Corps For Jobs and Justice to rebuild America. https://www. markey.senate.gov/news/press-releases/senatormarkey-and-rep-ocasio-cortez-introduce-civilianclimate-corps-for-jobs-and-justice-to-rebuild-america
Accessed: 10/27/2021
37 https://ec.europa.eu/eurostat/web/products-eurostat-news/-/ddn-20220330-1
38 See Albania Environmental Services Project (P172543), World Bank, Virtual Mission Aide Memoire, May 2021.
39 The source is Cedefop (2018c) from the Slovak Republic’s case study.
40 OECD. 2020. COVID-19 response measures and their potential implication for greening the economies of Eastern Europe, the Caucasus and Central Asia. GREEN Action Task Force, Environment Directorate, OECD, Paris.
41 Note that unlike the other two countries, there is only one relevant policy document available in English for Poland.
42 Suncˇana Slijepcˇevic and Željka Kordej-De Villa. Public Attitudes toward Renewable Energy in Croatia. The Institute of Economics.
43 See “Slovakia’s recovery and resilience plan” at https:// ec.europa.eu/info/business-economy-euro/recoverycoronavirus/recovery-and-resilience-facility/slovakiasrecovery-and-resilience-plan_en
44 Elkind, Jonathan and Damian Bednarz. Warsaw, Brussels, and Europe’s Green Deal: Challenges and Opportunities in 2020. July 30, 2020 Colombia, Center on Energy Policy. https://www.energypolicy.columbia.edu/research/ commentary/warsaw-brussels-and-europe-s-greendeal-challenges-and-opportunities-2020
45 See UN Populaiton data and Global Material Flow database - https://www.resourcepanel.org/global-material-flows-database
46 UNEP, 2019
47 Electronics and ICT, Batteries and Vehicles, Packaging, Plastics, Textiles, Construction and buildings, Food water nutrient
48 (EEA, 2016).
49 Latest available data on Eurostat. Values for both indicators were not available for six member states (Estonia,
Ireland, the Czech Republic, Luxemburg, Malta and Finland) nor was the value for employment in France.
50 As per the calculation method specified in Directive 2012/19/EU of the European Parliament and of the Council of 4 July 2012 on waste electrical and electronic equipment (EEE). The ratio is calculated as the share of collected waste of the average weight of EEE put on the market in the three preceding years
51 European Court of Audits (2019)
52 Production and consumption, waste management, secondary raw materials
53 EEA (2019).
54 Skill differences between green and brown jobs are analyzed for the EU countries with PIAAC data available. Examples of job transition patterns are provided for Poland only using the unique dataset developed through web-scrapping of tasks required in job offers in this country.
55 These are kernel density estimation plots. We used Elliott et al. (2021) to identify green jobs as those in occupations with a greenness index greater than the average greenness index. We use the skills profiles from the PIAAC data for the whole EU. As the occupation tasks descriptions are similar across Europe, similar figures could be produced for other European countries.
56 The skills index combines information about years of education and measures of foundational skills (numeracy and literacy), usage of skills at home and at work, and soft skills (influencing, planning). Controls for age, economic sector and gender are included in the equation (see Annex for details).
57 Extensive margin refers to the incidence of retraining needs, while the intensive margin refers to the depth of retraining needs.
58 The three core objectives are: (i) reducing carbon emissions, (ii) decoupling the economy from natural resource consumption, and (iii) leave no one and no region behind. The eight policy actions reported in the European Commission (2022) are: (i) climate action, (ii) a clean energy transition, (iii) a healthy food system for people and planet, (iv) an industrial strategy for a competitive, green, digital Europe, (v) protecting the environment and oceans, (vi) providing efficient, safe and environmentally friendly transport, (vii) investing in a green future, and (viii) research and innovation driving transformative change.
59 The weakness of the heat map is that only one relevant policy was available in English for Poland.
60 See The Economist (2022), “How Europe plans to cope as Russia cuts off the gas”, 1 June 2022.
Endnotes
ANNEXES
Annex A. The Human
Transitions General Equilibrium Model
(HTGEM)
The carbon-economy equilibrium
Our analytical approach follows a general equilibrium model in which society faces the choice of either consume goods and services, invest in productive capital or address climate change.1 Following Nordhaus (1992), the choice is represented by an aggregate utility function based on consumption so that:
(1)
where U is the utility derived from consumption, c(t) represents consumption at time t, N is population at time t, and τ is the social preference rate. Thus, the equation depicts the time-discounted value of the sum of utility functions. The maximization is then subject to two restrictions in terms of economic growth and in terms of emissions.
The set of economic constraints, in particular to the decreasing returns to capital model in Ramsey (1928). Thus, the maximized utility equation (1), is based on the utility definition:

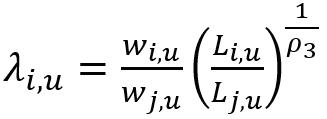
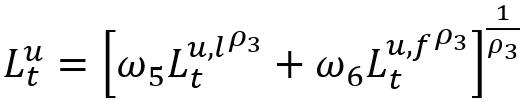
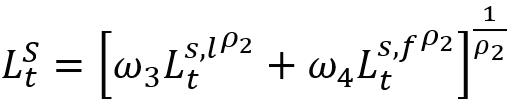
(2)
where α is the rate of inequality aversion ranging from 0 to 1, so that the larger α becomes, the more aversion to inequality a given society displays and a preference for more egalitarian systems.
Labor, skills, and technology for carbon-neutrality
Consumers then obtain personal or household incomes according to their marginal productivity expressed in wages. The greater the skill the greater their contribution to productivity and reflected in higher wages. The economy wide income derived from labor is obtained by the sum of all workers’ remunerations according to their individual skill:
(3)
where W stands for wages, L for number of workers (labor) and u and s refer to unskilled and skilled workers correspondingly. While the EGD’s human transitions will require skilled workers for the production of capital and consumption goods and
services, the technological progress required to meet the challenge would also require an emphasis on research workers (r), so that the total skilled workers’ wage bill will comprise research ( r ) and non-research (nr) workers:
(4)
It follows that labor is made of unskilled and skilled (including research) workers subject to skill-specific shares reflected in ω (1 for skilled and 2 for unskilled), and the elasticity of substitution between types of workers ():
(5)
To allow for labor mobility across countries as it is the case in the EU, foreign workers (f) are assumed to be able substitutes for local workers (l) with an elasticity of substitution among them (ρ2):
(6)
(7)
where ω continues to be the share of worker type (3 for skilled local, 4 for skilled foreign, 4 for unskilled local, and 5 for unskilled foreign), and elasticity of substitution between types of workers () according to 2 local to foreign among skilled workers, and 3 for local substitution for foreigners among unskilled workers.
Assuming there are no consumption externalities of choosing one location over another, workers will move to locations chiefly based on relative factor prices, specifically relative wages. However, locations with higher wages will attract further workers, until the receiving and sending locations’ wage gap narrows. The narrowing of the wage gap will be the result of rising wages in locations losing labor, and declining wages in the region that receives the inflow of workers. The same phenomenon will occur by segment of the labor market (i.e. unskilled and skilled) subject to the elasticity of substitution (ρ). Each location’s resulting labor share (λ) of unskilled workers will therefore be:
(8)
and correspondingly for skilled workers:
(9)
where location i is different from location j
134 MAKING THE GREEN DEAL WORK FOR PEOPLE
For simplicity, the production process could occur under a constant-returns-to-scale Cobb-Douglas production function in which total factor productivity is represented by A, capital (K), effective labor (L) and natural resources (E):
(10)
subject to β + γ ≤ 1
Aggregate demand will therefore be the results of all factors of production at their marginal product (assuming payments to the factors of production reflect their true contribution to productivity as in the Arrow-Debreu model), so that the linear equation for (10) is:2
(11)
(12)
where r refers to the payments to capital, and p is prices under the carbon (c) economy.
However, the EGD implies an investment of physical and human capital to face policy shocks related to the objectives in the new green economy. The demand therefore for innovation will be significant. Technological progress will then accelerate. As a consequence, some firms may be able to acquire or develop newer technologies; however, some others would likely not. Therefore, assuming constant returns to scale as in equation 10, at least in some of the sectors would not be realistic. Instead, technology and innovation will determine market structure for firms. Innovation in this Schumpeterian view leads to a creative destruction (Schumpeter, 1934), which is only possible if some protection is provided to new ideas in the form of patents and copy rights. The likely unintended consequence is, some degree market concentration. Monopolist and oligopolistic competition would then require firms’ profit-maximizing supply to be:
(13)
where represents the cost of renting or acquiring capital, and is the share of revenues that accrue to workers. Following Aghion and Howitt (1999), A becomes the average productivity parameter and (1−θ) represents profits. It is therefore implied that the sum of intermediate outputs equals the intensity in the use of capital (i.e. capital-labor ratio) so that:
(14)
and the associated cost of acquiring capital will decline with past accumulations expressed in the intensity of capital:
(15)
With this market structure favoring innovation in firms exerting market power, innovation (V) in a steady-state growth path would become:
(16)
where is the maximum A which in turn indicates productivity gains stemming from the leader’s technology (or the leading-edge technology); represents as before, firms’ profits and k continues to be capital intensity at steady-state level. Similarly, r is the discount rate applied to future consumption and φ is the innovation probability flow and ϑ represents the level of research.
The carbon-neutral economy
An EGD framework requires to account for the coupled relationship between production—and its growth—and carbon emissions, as well as natural resource consumption. The framework assumes that a short-term fixed rate, but long-run variable ratio, of carbon is an externality of production. Similarly, the model also incorporates a rate with similar intertemporal properties for production and natural resource consumption. The depletion of natural resources is then given by:
(17)
where D is the net depletion of natural resources, n ranges from 0 to 1 and represents the ratio of natural resources consumption to gross production (Q). D is net of any offsetting elements provided by reforestation or any action that leads to replenishment (R) of natural resources (E).
Greenhouse gas (GHG) emissions are an externality of production and thereby a ratio that changes over time with efficiency (ε), and a ratio to production represented by σ:
(18)
It follows that overall impact (I) of production will be:
(19)
Following Hallegate et. al. (2012), a vector of policies that aim at controlling or reducing can be considered under the vector P(e), which may have the
135 ANNEXES
effect of inducing efficiency (such as those related to the European Green Deal):
(20)
where ψ measures production efficiency. P(e) will be assumed to lead to a reduction in GHG through the ratio μ. Thus P(e) in equation 20 will transform equation 18 so that:
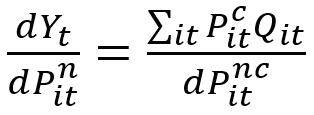
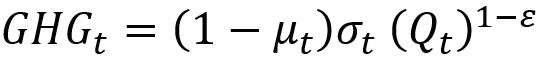
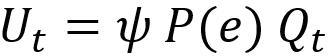
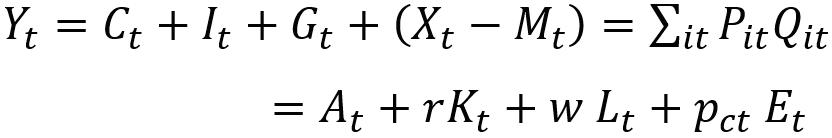
(21)
In order to better understand how environmental-upgrading policies may entail costs to different economic agents, but at the same time lead to efficiencies and positive externalities, economy-wide effects need to be modeled from the basic production equation using the output approach:
(22)
where aggregate demand is represented by Y, P are prices and Q production for i industry in t time. Prices in equation 22 are t=0 where carbon industries are still largely unaffected by ay elements in P(e). Since Y can also be accounted for using the expenditure approach:
(23)
All output in the economy (equation 22) is equal to all expenditures (equation 23) and to the sum of all payments to the factors of production (the simplified form of equation 12), so that:
(24)
The EGD entails regulations that increasingly put pressure on economic agents to change behaviors and production methods. These regulations under P(e) may have two main effects. On the one hand, these policies may foster innovation and technology adoption in firms that leads to efficiency. On the other hand, they also represent an additional cost for firms to operate. The former is already considered under equation 20. The latter would alter relative prices in the economy resulting in:
(25)
Payments to the factors of production will change accordingly, by changing r and w in equation 24, increasing k in equation 14 and changing relative wages in λ (skilled and unskilled in equation 9). Changes in consumption will follow so that: (i) carbon-neutral production ( Qn ) at carbon-neutral prices (Pn) would be favored following EGD policies; (ii) investment moves towards carbon-neutral
technologies that will trigger a change in labor demand patterns; and (iii) relative wages will increase in favor of skilled workers.
The short-run equilibrium
Assuming firms have no particular market power so that n firms operate in i location, labor market equilibrium condition would imply that labor demand (Ld) and supply (Lt as in equation 5) are effectively matched:
(26)
Firms will then invest in capital according to the market structure, in those markets in which technologies are widely available (e.g. solar panels), the industries market structure can be assumed to reach a monopolistic competition equilibrium and thus, face prices that include an elasticity of substitution among varieties of the same product so that:
(27)
where are prices in location i under the new conditions imposed by carbon neutrality (n). These prices are explained as individual prices in location i and subject to the elasticity of substitution for other varieties (ε > 1). In contrast, for industries in which technologies are the result of innovation, market structure can be assumed to take the form of an oligopoly that will appear at the speed dictated by V in equation 16 and with an associated cost of as in equation 15. Finally, we recall that profit maximization is
as in equation 13, with an elasticity of substitution of 0. For consumers, welfare implications of the new carbon-neutral economy start considering that they seek the maximization of their utility function
expressed in equation 1. However, relative prices and wages will imply:
(28)
where the inequality aversion term continues to determine utility as in equation 1. However, equation 28 includes changes in income due to carbonto-carbon-neutral relative prices (P*), and relative wages triggered by P(e) restrictions stemming from the EGD.
136 MAKING THE GREEN DEAL WORK FOR PEOPLE
The long-run equilibrium
In the long-run, firms have the capacity to evaluate their choice regarding the mix of factors of production. Given the transition to a carbon-neutral economy, technological requirements most likely will lead to both, an increase in the capital-labor ratio and to a shift in skills in the latter. Equation 26 would therefore transform to:
(29)
Equation 29 proposes that total labor demand is the sum of individual firms in location i proportional to their individual capital-labor ratio (k as in equation 14). Thus, the EGD’s requirement to increase efficiency will over time, likely raise individual firms’ capital-labor ratio (k) and alter the demand for labor. However, since labor is in this model, not homogeneous, but instead allows for differences in skills (research, skilled and unskilled), as well as for labor mobility (by allowing local and
foreign labor to substitute each other), labor demand will also be subject to relative wages, relative labor forces and the elasticity of substitution as per equation 9. As a result, labor demand will be explained by long-run adjustments related to workers’ migration choices based on relative wages and the elasticity of substitution in other locations in Europe:
(30)
In the long-run, k will continue to change, and firms will face market structure determined by technological progress and innovation. Welfare implications in the long run are similar to equation 28. However, the long-run utility function adds a term that reflect positive externalities from the new carbon-neutral economy in terms of the cleaner air and environmental amenities (Z(t)) that can be enjoyed including a health improvement term (H(t)).
(31)
137 ANNEXES
Annex B. The HTGEM in a System Dynamics Model (SDM) perspective
The purpose of the current section is to describe the dynamic equations used to create the economic model that will represent some of the key aspects of the EGD. As in other economic models, the order in which the equations are organized go from the producer side to the consumer side. Similar to classic macroeconomic models (Swan, 1956; Ramsey, 1928), the overall structure relies in methodological individualism in which there is a single representative consumer and two representative firms (one representing the green economy and another one representing the brown economy). Each of these agents takes as given some information seen in the previous period and some information seen in the current period (the information depends on the agent, and it will be defined case by case) and takes economic decisions conditional on that information. Finally, while the agents are unable to foresee the long run future, for decisions that will affect them for several periods, they will assume that the state of the world will not change (assumption justified in the high uncertainty levels faced by the individuals). Finally, for jargon purposes, the equations that define the actions of an agent given their current and past information are going to be called reaction functions. This name is preferred as it highlights the fact that a decision doesn’t imply full rationality or knowledge about the past, present, and future conditions of the economy, but a scenario where the agent recognizes the information limitations and chooses its actions given the best of its own knowledge.
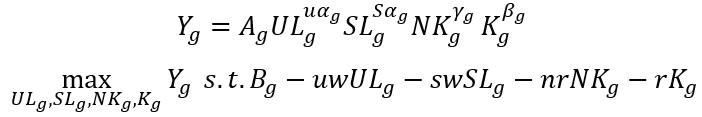
The final good
The model description starts with the final good. This final good can be considered a single product or a basket of products that are the source of utility of the consumers. Therefore, consumer utility is derived from using it. However, to capture the essence of the green economy, this final good, identified with the symbol Y, can be produce under brown standards (linked to low-tech production mechanisms that strongly rely on natural resources), or under green standards (linked to high-tech production mechanisms that replace natural resources by high skilled labor). The final good is indistinguishable from the point of view of the utility that the
consumer derives from it. For illustration purposes, consider the use of energy. While energy can be produced by thermoelectrical plants, hydropower plants, solar farms, or nuclear plants, once the energy enters the grid it becomes undistinguishable for the consumer’s eye. Unfortunately, due to this commodity attribute of the good, the consumer is not able to differentiate and assign different prices to the final good. Nevertheless, it is possible to take active decisions of the source of the good that the consumer wants to buy (e.g. divest from thermoelectrical plants), or the society (in this case represented by the will of the representative consumer) can tax inputs that have major effects in the non-green production forms. This topic will be detailed later. For the moment, the main point is the existence of a single final good (with a single price) that can be produced either using green technology (identified with the subindex g) or brown technology (identify with the subindex b). For simplification purposes, the final good is produced under a classical Cobb-Douglass production function with constant returns to scale. Also, as mentioned before, the Cobb-Douglass relies in four production factors (unskilled labor (UL), skilled labor (SL), natural capital (N), and physical capital (K)) and the corresponding total factor productivity (A). Each of these variables has an assigned subindex depending on the production type (green or brown) and a corresponding production coefficient. Finally, and given that the model focuses on the real economic effects of the EGD (removing the monetary related effects), the price of the final good will be 1, and it will be used as the numerator for any other price in the model. Having defined these primitives, the objective of the green firm is:
where uw is the salary of unskilled labor, sw is the salary of skilled labor, nr is the return on natural capital, and r is the return on capital. Correspondingly, the objective of the brown firm is:
Notice two elements. First, the price of the factors has no index associated with the production type, meaning that because markets are competitive, the price of, for example, skilled workers is the same, independent of the company that hires them. The second element to highlight is that the production coefficients are indexed in the production type, and
138 MAKING THE GREEN DEAL WORK FOR PEOPLE
consistent with the difference between green and brown production, the following rules apply:
uα g < uαb, sαb < sαg, nkg < nkb, and k g = kb (the last equality was done to simplify calculations focus on the main elements of the production transition).
Due to the objective functions, the demanded quantities for each factor of production (i.e. the reaction functions) are (for i ∈ {b,g}):
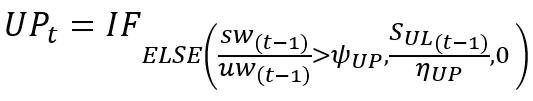
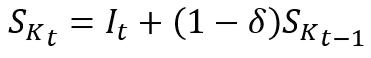
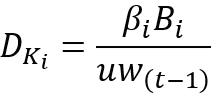
Demand of unskilled labor:
Demand of skilled labor:
time subindex t is used to make explicit the intertemporal relation of the process.
Labor market
Demand of natural capital:3
Demand of capital:
In each of these equations, the subindex ( t −1) highlights that in order to calculate the production for period t, firms rely on the price information observed in the previous period, and use it to calculate their current demand of inputs. It’s worth noting that from this point onwards, the subindex t will be exclusively dedicated to time dynamics.
Finally, for F ∈ {UL, SL, NK, K}, let SF denote the supply of factor F in the economy, then, if SF ≥ DFb + DF g , then the effective resources allocated to each firm will be its demand (i.e. E F b = D F b , EFg = EFg). However, if there are less available factors than those demanded (i.e. SF < DFb + DFg), the amount of inputs are prorated according to the demands of each firm. Therefore,
Implicitly, the need of a production factor is calculated as max {0, DFg+ DFb− SF}, while the excess of a factor is calculated as max{0, SF − DFg− DFb)}.
Capital markets
The capital market follows the guidelines of the traditional Solow-Swan model, in which:
The labor market in this model is strategically designed to capture three elements that linked the EGD with the labor market transitions. The first element is that, within an open economy, there is a constant pressure for the local labor force to migrate outside the country. Of course, there are also other pressures that make workers resist migration (Ransom, 2019; Ikhenaode & Parello, 2020; Ridder & van den Berg, 2003) highlighting the importance of a wage gap for workers to decide when to take the decision to leave the country. The second element is the need for upgrading their skills. Education takes time and is costly. Nevertheless, skilled workers have better remunerations. Therefore, individuals have a second wage gap to consider in order to change from one labor market to another. The final element is that all these processes take time and are not certain. Thus, the individuals have lags in their reactions to changes in market conditions.
In that context,
where IM represents the immigrant population (in this case, unskilled labor, as the subindex suggests), EM represents the corresponding emigrant population, and UP the population that decides to upgrade their skills (that is why this one has no skill related index, as its only from the unskilled to the skilled sector). Each of these variables has two key elements; a wage gap and a time lag. To begin with, consider the upgrading population. For the sake of the example, consider that a single individual will have probability p of upgrading in a given period t. Assuming that the probability is independent between time periods, the expected time for an individual to upgrade will be 1/p. This equivalence allows the model to have two perspectives, either it can reflect a market where the probability of upgrading is linked to a probability p, or it reflects a deterministic market where transitions take a duration of 1/p. Based on the previous logic,
where I is the investment of the representative individual, δ is the depreciation rate of capital, and the
where ψUP determines the minimum ratio that workers are willing to accept in order to start their upgrading process. This value reflects education costs as well as inertial costs related to social preferences,
139 ANNEXES
and peer pressure effects. ηUP determines the expected duration of the training process (or, as noticed from the previous discussion, the inverse of the probability of succeeding in the transition between two consecutive periods). Using a similar logic,
where the subindex Int and Nat have been added to specify the origins of the prices and labor forces. As the focus of the model is the local economy rather than the international economy, the international context is considered to be large enough to be affected by the shocks of a specific country. Therefore, the international salaries are taken as fixed quantities. This construction also makes it easy to redefine the model for a close economy. Notice that when the international salaries are defined as 0, both immigration and emigration are fixed at a value of 0.
As expected, the formula for the skilled labor market is
noticing that the main change is the unidirectional movement of the upgrading of skills.
A final note to this section is the population growth. The previous formulas can be expanded to include population growth. For this purpose, consider that the population growth rate is v, then, the previous equations can be modified as
not work as much as in the beginning, but it will still be working. Thus, the computer is never removed from the stock of capital, the stock is just adjusted by its depreciation. In contrast, when natural resources are used, they are inputted in the good. This means that, if a tree is used to produce a chair, the tree will become part of the good and it will be removed from the available stock. The second key difference between natural and physical capital is that the first one is limited, while the second one is virtually illimited (as long as you have inputs you can produce computers, but independent of the agent will, then number of trees is limited to the available soil and water, which are factors external to the economic production). Finally, if physical capital is left alone, it will remain the same (or depreciate). But, if natural capital is left alone, it will recover and expand. Based on the previous discussion, the dynamic equation for the natural capital is
and
However, in the practice, the qualitative results remained unchanged, and therefore, in pro of a parsimonious model, this expansion was not considered.
Natural capital market
While often modelled as a parallel to physical capital, this report considers that there are several conceptual differences between natural and physical capital that can’t be ignored as they will neglect the sustainability problem embedded in natural resource exploitation. To illustrate this point, consider the following illustrations. A computer is a traditional example of physical capital. The fact that the computer is used to produce one good doesn’t affect it to produce another good. For sure there will be some depreciation as with its use the computer will
In this case ρ represents the nature recovery rate, CN is the consumption of goods that is subject to participate in the circular economy, and χcircular is the share of this consumption that can be successfully recovered and placed into the system. τ C corresponds to the resources that have been collected via taxes that can be used to invest in nature, and similar to the logic used in the labor market, ηNK is the time it takes for these elements to be reincorporated in the natural capital stock. ψ NK denotes the maximum available natural capital in the economy. Finally, μ, the nature degradation rate, shows that there are some artificial limits to nature degradation. For example, there are policies in the different countries that do not allow to use more than x% of the current stock of water in the country reservoirs, or that cannot have a deforestation higher than x% of the available trees. Notice that the current modelling strategy allows the incorporation of the main elements of natural capital previously discussed and at the same times opens the door to develop scenarios to link the model with EGD policies. In particular, this formulation allows the models to evaluate the strengthening of circular economy, the imposition of green taxes, and the effects that these policies have over the capacity to use nature resources in a sustainable way. To illustrate this point, consider an economy without circular economy or green taxes and where nature is the limiting factor (i.e. effective demand is
140 MAKING THE GREEN DEAL WORK FOR PEOPLE
at least the natural capital supply). In that context, the system is sustainable only if ρ > μ, meaning that if the nature degradation rate is higher than the nature recovery rate, the resource will eventually deplete condemning the full economy. However, as it will be detailed in the following section, green taxes, and circular economy allows the economy to go beyond the limits imposed by the nature recovery rate.
Green taxes
The previous section mentions tax collection for nature resources. As expected, the most intuitive place to collect this tax is from the use of natural resources. In order to do so, it is important to modify the demand of natural capital presented in previous sections. Therefore, to include the possibility to impose taxes, the demand of natural capital is modified to
In this context, χrecyclable is the share of consumption that can be recycled, s is the saving rate and is calculated using the golden rule logic of the SolowSwann model, where the rate is the weighted rate that would be optimal in for the workers in each of the industries. Notice that the division of the nature capital rate happens because the amount of natural capital recovered is real, and not monetary.
Finally, the last element of the individual is the definition of the budget share. As mentioned in the beginning, the households can’t do price differentiation in the final good, however they can decide how much money to allocate to each industry (element that mirrors current movements such as the efforts to divest in fossil fuels). Therefore, the households use their full budget Σ and use the ideal proportion of money that they have in mind to invest in the green firm, π, and distribute all the money flow accordingly:
Thus, when the firms buy natural resources, they have to pay a tax based on the monetary value they are paying for these resources. In this case, is the corresponding tax rate. Correspondingly,
meaning that the money collected from the green tax is proportional to the value paid by the industry in nature resources.
Individual consumer
As in other neoclassical growth models, the representative individual owns the factors of production, thus, its income (Σ) is the sum of the payments done by the companies for their resources:
Price evolution
As in any market, price is the instrument that tunes the demand and supply in order for the markets to efficiently allocate resources. However, as detailed in the introduction, in this context is very difficult to estimate, a priori, what is this closing solution. Thus, following the most basic intuitions of the markets described by Marshall (1919), the price will also follow a dynamic adjustment in which an excess of demand will push to higher prices while an excess of supply will push to lower prices. In practical terms:
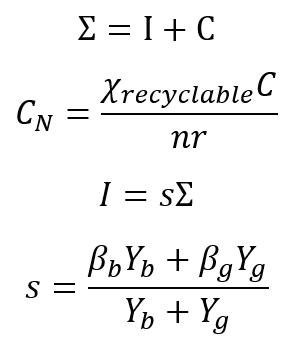
r adjustment:
nr adjustment:
Individuals distribute their income in savings (that will become investments and consumption). In this case consumption is divided into consumption that can be recycled and consumption that can’t be recycled.
sw adjustment:
uw adjustment:
Although the formulas seem to follow the same structure, there are significant differences among them.
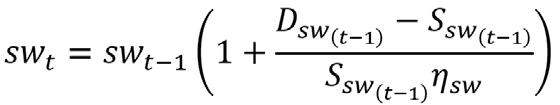
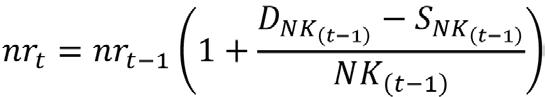
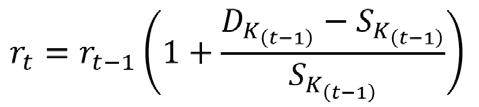
The case of the price of capital (r), is quite straight forward as it suggest a price adjustment proportional to the difference in the demand and supply. The case of natural capital is subtly different, in this case the available natural capital is not SNK, but NK
141 ANNEXES
Finally, the salary adjustments follow an additional logic in which there is a delay in the adjustment that has been explicitly modelled as ηsw and ηuw . This adjustment is highly relevant due to the inertia that salaries present due to their straight social implications (Dixon, 1992; Bewley, 1999). In this way, capital and natural capital will have relatively fast adjustment processes, while salaries reflect some stickiness, as Keynesian approaches will say. Finally, closing the model, it is important to mention that the price of the final good has no evolution as it is always considered the numerary, ergo, it is constant 1. With this last discussion, the model closes itself and it is possible to program it and calibrate its parameters to visualize the dynamics that these market structures recreate. The final part of this section will discuss a final modelling strategy not related with the model but with the modelling of policy scenarios that will be at the core of the next section.
Fast changes and slow changes
As it is detailed in the next section, the model is a useful policy tool and allows the creation of hypothetical scenarios to evaluate the implications of
Glossary of variables
Variable Description
policy and behavioral changes. However, it is important to notice that there are different types of changes. For example, if a change is in a tax rate, that effect can take place instantaneously. However, if the effect is in a variable linked to behavior or to the research and development of new technologies, the change will take time. In particular, as it will be observed in the next section, there are two changes that take time. The first is the preference to allocate resources between the green and the brown firm (π). The second is the improvement of the recovery rate for the expansion of the circular economy (χcircular). To capture this slow process, the modelling strategy takes the following form. Consider the policy parameter P that wants to achieve an ideal final state PF but its initial condition is Pi. Then, in the model, the parameter will be initialized in Pi and will have the following dynamic equation linked to it:
where ηP, as discussed in previous sections, modules the speed of convergence.
The following tables show a list of variables and parameters of the model.
Y Final good, where the quantity produced under green technologies is Y g, while the quantity produced under brown technologies is Yb
B Budget assigned, where the quantity assigned to green technologies is B g, while the quantity assigned to brown technologies is Bb
UL Unskilled labor, where the quantity assigned to green technology production is UL g, while the quantity assigned to brown technology production is ULb
SL Skilled labor, where the quantity assigned to green technology production is SL g, while the quantity assigned to brown technology production is SLb
NK Natural capital, where the quantity assigned to green technology production is NK g, while the quantity assigned to brown technology production is NKb
K Capital, where the quantity assigned to green technology production is K g, while the quantity assigned to brown technology production is Kb
uw Salary of unskilled workers.
sw Salary of skilled workers.
nr Return to natural capital.
r Return to capital.
D Used to denote the demand of a given production factor. The factor associated is a subindex of the variable. For example, DKg stands for the demand of capital of the green firm.
E Used to denote the effective demand (i.e. the quantity that is actually used for production) of a given production factor. The factor associated is a subindex of the variable. For example, E Kg stands for the effective demand of capital of the green firm.
(Continued next page)
142 MAKING THE GREEN DEAL WORK FOR PEOPLE
Glossary of variables
Variable Description
S Used to denote the supply of a given production factor. The factor associated is a subindex of the variable. For example, SK stands for the supply of capital.
I Investment.
IM Immigrant population
EM Emigrant population
UP Population that upgrades its skills.
C Consumption
CN Consumption that can be part of the circular economy.
∑ Individual income.
Glossary of parameters
Parameter Description
uα Unskilled workers production coefficient, the coefficient for green production is denoted by uα g while the coefficient assigned to brown production is denoted by uαb .
sα Skilled workers production coefficient, the coefficient for green production is denoted by sα g while the coefficient assigned to brown production is denoted by sα g
β Capital production coefficient, for green production it is denoted by βg while for brown production it is denoted by βb
γ Natural capital production coefficient, for green production it is denoted by γg while for brown production it is denoted by γb
δ Depreciation rate.
ρ Nature recovery rate.
ψUP Ratio workers are willing to accept in order to start their upgrading process.
ηUP Expected duration of the training process.
χcircular Share of consumption that can be successfully recovered and placed into the system.
ηNK Time it takes to resources collected by taxes to be reincorporated in the natural capital stock.
ψNK Maximum available natural capital in the economy.
μ Nature degradation rate.
χ recyclable Share of consumption that can be recycled.
π Consumption preference
p Probability of upgrading.
ηIMUL Expected duration of unskilled workers migration process.
ψIMUL Ratio unskilled workers are willing to accept to migrate.
ψEMUL Ratio skilled workers are willing to accept to emigrate.
ηEMUL Expected duration of skilled workers emigration process.
τ Green tax
143 ANNEXES
Annex C. Calibration Strategy for the SDM
The model is intended to show general market dynamics after policies of the European Green Deal. Unfortunately, from a modelling perspective, some concepts are being abstracted in order to capture the dynamics, but this abstraction makes it difficult to quantify and calibrate. Let’s take for example the natural rate of recovery of resources (ρ). If the natural capital is forestry, the recovery of vegetation fully depends on the type of soil, the type of plants, and the type of impact. For example, it is not the same to lose a full strip of dry forest than some scattered patches (of equal area) of rainforest. The first case will induce a desertification process making it extremely difficult to recover, while the second will take few years to recover. Moreover, nature is not only forest, what about the water resources? What about animal resources? And how to aggregate these values into a single modelling element? These technical difficulties are the ones that make the model descriptive rather than prescriptive, meaning that the model is suited to describe the dynamics of the economy and the qualitative effects of its policies, however it is not recommended to develop conclusions of specific magnitudes of change. Indeed, in these highly complex topics of sustainable development, geographical specificity is fundamental, and prescription is only suitable for areas that are small and homogeneous.
Having done these clarifications, the rest of these section divides calibration values of the model into three groups. The first group mentions all the values that were calculated from available macroeconomic data. The second group mention those values that were estimated as a result of equilibrium conditions. Finally, the third group mention those values that were inputted using expert criteria. For this last group it is important to note that several experiments were done testing different values and once outstandingly odd values were rejected, it was worth noting that the results were robust to variations.
The first group corresponds to variables and parameters for which values were chosen or calculated from the available data. In some cases, the available data was used to set fix values for the variables and in others it was used to set initial that were modified through the simulations.
• Depreciation rate. Depreciation was set in 0.025 as this value was presented by the European Cen-
tral Bank (2005) in its reports regarding fiscal devaluation in the European Area.
• The capital (β) and the natural capital (ϒ) production coefficients were calculated by using the ‘crude’ multifactor productivity indicator of the European Commission (2021). The dataset included information for the four case studies regarding labor (skilled and unskilled) and capital shares which allowed the calculation of β, ϒ, and an approximation of uα and sα over which experiments were carried out in order to set their values. Calculations were carried out by taking the average of capital shares for a 20-year period given by the available data, afterwards this value was multiplied by 0.5 in order to equally divided between shares of natural capital and capital. These values correspond to the β, ϒ, and the uα and sα approximations for brown production, they were later adjusted for green production in which ϒ decreases as the use of natural resources decreases as well.
The second group is about the values chosen under equilibrium conditions. To understand better this point is important to recall two important elements. Due to aggregation issues mentioned at the beginning of the section, there are variables that are not feasible to calculate from reality. For example, what is green production? As a concept is clear, but how to define in a non-controversial and practical way what is the value of each type of production in the economy of a country. The second element to recall is that dimensions in the model are relative. For example, the use of 5 units of natural resources is not meaning literally 5 liters of water, or 5 logs, or 5 pelts of tigers. For that reason, there are some values that are not even reasonable to force to match the data. Instead, the modelling decision was to select these values (all are related to initial conditions of variables, as the following list will show), to be those in which the system stabilizes. In that way, the stability of the system can be used as a reference point. For example, let’s say that in equilibrium (once the variable stop changing along time), the value of production is 5. However, after a policy change is done, the new equilibrium value is 10. Then, independent of what is the unit of production, it is possible to declare that the policy allow production to duplicate. The values calibrated in this way were:
• Skilled Labor (SL)
• Unskilled Labor (UL)
• Skilled labor wages (sw t−1)
144 MAKING THE GREEN DEAL WORK FOR PEOPLE
• Unskilled labor wages (uwt−1)
• Return to capital (rt−1)
• Return to natural capital (nrt−1)
• Natural capital (NK)
• Capital (K)
• Green production (Y g)
• Brown production (Yb)
• Individual income (Σ)
Finally, the third group involve those variables such as the ones related with time delays for which quantification is difficult but that after expert criteria and the evaluation of different experiments, reasonable values were chosen. These variables are:
• Expected duration of unskilled workers migration process (ηIMUL)
• Expected duration of skilled workers emigration process (ηEMUL)
• Expected duration of the training process (ηUP)
• Time it takes to resources collected by taxes to be reincorporated in the natural capital stock (ηNK)
• Skilled workers production coefficient (sα g) (sαb)
• Unskilled workers production coefficient (uα g) (uαb)
• Total factor productivity (A)
• Green tax (τ)
• Consumption preference (π)
• Maximum degradation rate (μ)
• Recovery rate (χcircular)
145 ANNEXES
Annex D. Scenarios in the SDM
The ideal contrast scenario is the equilibrium of a business as usual (BAU) world. In particular, the BAU for Europe and for each one of the countries considers green and brown production forms, the latter implies larger amounts of natural resources and more unskilled labor when compared to the skilled one. Concurrently, in the BAU consumers do not have a consumption preference over goods that have been produced by brown or green production forms. The BAU considers the absence of taxation over natural resource consumption as well as inexistent recycling capacities, this has a large impact over the available natural resources at a particular period of time, as well as over the rate in which they can be regenerated, as the absence of recycling capacities as well as that of taxation, reduces the investment that can be made for regenerating natural resources. On the other hand, natural resource depletion is produced by using these resources in the production of goods. Labor is divided between skilled and unskilled workers, unskilled workers can become skilled after upscaling their capacities, this implies an investment in education and a delay related to the time that takes the worker to complete its training process. Migration inwards and outwards each one of the countries can also take place for both, skilled and unskilled workers as a result of the wages dynamics. However, for the European case, international wages for skilled and unskilled workers are set as 0. This is given by the fact that setting the boundary of the region as a whole, allows the mobility of the workers between the countries within this boundary with them still being considered as local labor implying the absence of emigration as there is no motivation in terms of wages to leave the region. International wages for skilled and unskilled workers in the BAU for each one of the countries uses the resulting values of the local skilled and unskilled wages of the European BAU case.
1. Once the BAU has been defined, five parameters have been strategically modified between scenarios to displays the effects of the EGD.
2. Green tax: As expected EGD needs to be finance with taxation policies that reduce nature resource exploitation, thus changes in the tax rate are considered among the scenarios (τ).
3. Recovery rate: To support circular economy, the EGD needs to promote technologies that incorporate the concepts of reusing and recycling of the goods that the economy produces. In terms of the model, this implies increasing the recovery rate (χcircular).
4. Green preferences: the EGD comes hand in hand with a change of preference from the consumers, in which more sustainable ways of production are preferred. This element is directly modelled with the parameter of consumption preference (π).
5. Increment of nature frontier: By improving the sustainable use of nature, the economy might be allowed to use more natural resources without falling into a depletion trap. To understand better these dynamics, the maximum degradation rate can change between scenarios (μ).
6. Upgrading costs: Changes require plasticity from society in order to adapt. However sometimes there are limitations to it. In particular, changes such as skill upgrading cost and take time. However, if there are policies that can help with the reduction of these times (ηUP), society can better absorb the benefits of the EGD, and thus they are considered among the scenarios.
Naturally, only with these options, there is an endless spectrum of scenarios that can be analyzed. Yet, after producing several of them, two scenarios; (SC1) and (SC2) have been selected as they capture the essence drivers of the model. Variation in these scenarios had similar qualitative results providing robustness to the claims presented in the final part of this section. Having specified these elements, the chosen scenarios were as follows (see table below):
146 MAKING THE GREEN DEAL WORK FOR PEOPLE
Europe Croatia Poland Slovakia BAU SC1 SC2 BAU SC1 SC2 BAU SC1 SC2 BAU SC1 SC2 Green tax 0 0.03 0.06 0 0.04 0.08 0 0.025 0.05 0 0.02 0.04 Recovery rate 0 0.24 0.48 0 0.14 0.28 0 0.18 0.36 0 0.2 0.4 Consumption preference 0.5 0.7 0.9 0.5 0.7 0.9 0.5 0.7 0.9 0.5 0.7 0.9 Maximum degradation rate 0.04 0.05 0.06 0.02 0.03 0.04 0.02 0.04 0.05 0.02 0.03 0.04 Education cost 1.5 1.4 1.3 1.5 1.4 1.3 1.5 1.4 1.3 1.5 1.4 1.3
The variations over each one of the parameters will be described in what follows.
In the BAU green taxes do not exist, for this reason SC1 and SC2 consider the emergence of taxes with incremental variations in its values, were SC1 constitutes an intermediate point between the BAU and the SC2. The values used to build the scenarios are grounded on the environmental taxes in the European Union (EU) for 2020 provided by the statistical office of the European Union (Eurostat). The recovery rate is intervened by producing variations in the recycling capacity. When the recycling capacity of the country increases, so does its recovery rate. For this reason, the BAU considers the recycling capacity as 0 and proceeds to build both scenarios grounded on the available data of the European Environment Agency (2021) regarding waste recycling in Europe. These cases follow the same logic as the green tax in which SC2 uses the maximum recycling capacity and SC1 takes the intermediate point between the BAU and SC2.
In the BAU, there is no preference between goods produced by green or brown means, for this reason the parameter consumption preference takes a value of 0.5. However, in SC1 and SC2 consumers prefer goods produced by green means, increasing the
consumption preference in 0.2 units for each one of the scenarios. This implies that in SC2 consumers prefer goods produced by green means even more than in SC1 and BAU. The units used in the scenarios, were chosen as they depict large changes in the consumer preferences, smaller values would not be reflected in the behavior of the model when simulated under the different scenarios.
The maximum degradation rate, allow us to determine the level in which natural resources can be consumed without a total depletion. The values used to build the scenarios are grounded on the United Nations report over life and land (n.d.). It is important to note that for this parameter, degradation rate in BAU starts at an approximate value for yearly nature degradation for each one of the countries and for the region as a whole with an increase between 1 and 2 percent.
Finally, the intervention of upskilling is related to education costs, in order to set a value for this parameter, educational differences between skilled and unskilled workers were considered allowing us to choose a value of 1.5 which means that upskilling imply a large investment of money in training.
147 ANNEXES
Annex E. SDM Additional Results
Croatia
Figure A.E.1: Simulation Results for Croatian Brown Production under the EGD System-dynamics simulations using Vensim, 2022–52
Source: Own calculations based on Eurostat (2022), European statistics accessed online at https://ec.europa.eu/eurostat/
Note: Moderate scenario refers to a nature tax of 3%, a recycling capacity of 24%, a maximum degradation capacity of 5%, an ideal consumption shares of green production forms of 70% and an education cost ratio of 1.4, and moderate-high scenario refers to a nature tax of 6%, a recycling capacity of 48%, a maximum degradation capacity of 6%, an ideal consumption share0073 of green production forms of 90% and an education cost ratio of 1.3.
Figure A.E.2: Simulation Results for Croatian Green Production under the EGD System-dynamics simulations using Vensim, 2022–52
Business as usual (BAU)
Source: Own calculations based on Eurostat (2022), European statistics accessed online at https://ec.europa.eu/eurostat/.
Note: Moderate scenario refers to a nature tax of 3%, a recycling capacity of 24%, a maximum degradation capacity of 5%, an ideal consumption shares of green production forms of 70% and an education cost ratio of 1.4, and moderate-high scenario refers to a nature tax of 6%, a recycling capacity of 48%, a maximum degradation capacity of 6%, an ideal consumption share0073 of green production forms of 90% and an education cost ratio of 1.3.
Business as usual (BAU) Moderate scenarioModerate-high scenario
Source: Own calculations based on Eurostat (2022), European statistics accessed online at https://ec.europa.eu/eurostat/.
Note: Moderate scenario refers to a nature tax of 3%, a recycling capacity of 24%, a maximum degradation capacity of 5%, an ideal consumption shares of green production forms of 70% and an education cost ratio of 1.4, and moderate-high scenario refers to a nature tax of 6%, a recycling capacity of 48%, a maximum degradation capacity of 6%, an ideal consumption share0073 of green production forms of 90% and an education cost ratio of 1.3.
148 MAKING THE GREEN DEAL WORK FOR PEOPLE
0 20 40 60 80 100 120 2022 2027 2032 2037 2042 2047 2052 Per cent of BAU Business as usual (BAU) Moderate scenario Moderate-high scenario
Moderate scenario Moderate-high scenario 0 20 40 60 80 100 120 140 160 180 200 2022 2027 2032 2037 2042 2047 2052 Per cent of BAU
Figure A.E.3: Simulation for Capital in Croatia under the EGD System-dynamics simulations using Vensim, 2022-52
60 70 80 90 100 110 120 2022 2027 2032 2037 2042 2047 2052 Pr cent of of BAU
Figure A.E.4: Simulation for Capital-Labor Ratios in Croatia under the EGD System-dynamics simulations using Vensim, 2022–52
Source: Own calculations based on Eurostat (2022), European statistics accessed online at https://ec.europa.eu/eurostat/
Note: Moderate scenario refers to a nature tax of 3%, a recycling capacity of 24%, a maximum degradation capacity of 5%, an ideal consumption shares of green production forms of 70% and an education cost ratio of 1.4, and moderate-high scenario refers to a nature tax of 6%, a recycling capacity of 48%, a maximum degradation capacity of 6%, an ideal consumption share0073 of green production forms of 90% and an education cost ratio of 1.3.
Figure A.E.5: Simulation for Unskilled Labor Supply and Demand in Croatia under the EGD System-dynamics simulations using Vensim, 2022–52
Source: Own calculations based on Eurostat (2022), European statistics accessed online at https://ec.europa.eu/eurostat/
Note: Moderate scenario refers to a nature tax of 3%, a recycling capacity of 24%, a maximum degradation capacity of 5%, an ideal consumption shares of green production forms of 70% and an education cost ratio of 1.4, and moderate-high scenario refers to a nature tax of 6%, a recycling capacity of 48%, a maximum degradation capacity of 6%, an ideal consumption share0073 of green production forms of 90% and an
simulations using Vensim, 2022–52
Source: Own calculations based on Eurostat (2022), European statistics accessed online at https://ec.europa.eu/eurostat/
Note: Moderate scenario refers to a nature tax of 3%, a recycling capacity of 24%, a maximum degradation capacity of 5%, an ideal consumption shares of green production forms of 70% and an education cost ratio of 1.4, and moderate-high scenario refers to a nature tax of 6%, a recycling capacity of 48%, a maximum degradation capacity of 6%, an ideal consumption share0073 of green production forms of 90% and an education cost ratio of 1.3.
149 ANNEXES
Business as usual (BAU) Moderate scenarioModerate-high scenario 85 90 95 100 105 110 115 120 2022 2027 2032 2037 2042 2047 2052 Per cent of BA U
of 1.3. 60 70 80 90 100 110 120 2022 2027 2032 2037 2042 2047 2052 Per cent of BAU Business as usual (BAU) Moderate scenario (D) Moderate-high scenario (D) Moderate scenario (S) Moderate-high scenario (S)
education cost ratio
Figure A.E.6: Simulation for Skilled Labor Demand in Croatia under the EGD System-dynamics
90 95 100 105 110 115 120 125 130 2022 2027 2032 2037 2042 2047 2052 Per cent of BAU Business as usual (BAU) Moderate scenario (D) Moderate-high scenario (D) Moderate scenario (S) Moderate-high scenario (S)
Figure A.E.7: Simulation for Skilled-Unskilled Wage Gap in Croatia under the EGD System-dynamics simulations using Vensim, 2022–52
Source: Own calculations based on Eurostat (2022), European statistics accessed online at https://ec.europa.eu/eurostat/
Note: Moderate scenario refers to a nature tax of 3%, a recycling capacity of 24%, a maximum degradation capacity of 5%, an ideal consumption shares of green production forms of 70% and an education cost ratio of 1.4, and moderate-high scenario refers to a nature tax of 6%, a recycling capacity of 48%, a maximum degradation capacity of 6%, an ideal consumption share0073 of green production forms of 90% and an education cost ratio of 1.3.
Poland
Figure A.E.8: Simulation Results for Polish Brown Production under the EGD System-dynamics simulations using Vensim, 2022–52
Business as usual (BAU)
Source: Own calculations based on Eurostat (2022), European statistics accessed online at https://ec.europa.eu/eurostat/
Note: Moderate scenario refers to a nature tax of 3%, a recycling capacity of 24%, a maximum degradation capacity of 5%, an ideal consumption shares of green production forms of 70% and an education cost ratio of 1.4, and moderate-high scenario refers to a nature tax of 6%, a recycling capacity of 48%, a maximum degradation capacity of 6%, an ideal consumption share0073 of green production forms of 90% and an education cost ratio of 1.3.
Business as usual (BAU) Moderate scenario
Source: Own calculations based on Eurostat (2022), European statistics accessed online at https://ec.europa.eu/eurostat/
Note: Moderate scenario refers to a nature tax of 3%, a recycling capacity of 24%, a maximum degradation capacity of 5%, an ideal consumption shares of green production forms of 70% and an education cost ratio of 1.4, and moderate-high scenario refers to a nature tax of 6%, a recycling capacity of 48%, a maximum degradation capacity of 6%, an ideal consumption share0073 of green production forms of 90% and an education cost ratio of 1.3.
150 MAKING THE GREEN DEAL WORK FOR PEOPLE
Business as usual (BAU) Moderate scenario Moderate-high scenario 0 20 40 60 80 100 120 140 2022 2027 2032 2037 2042 2047 2052 Percent of BAU
Moderate scenario Moderate-high scenario 0 20 40 60 80 100 120 2022 2027 2032 2037 2042 2047 2052 Per cent of BAU
Figure A.E.9: Simulation Results for Polish Green Production under the EGD System-dynamics simulations using Vensim, 2022–52
Moderate-high
0 50 100 150 200 250 2022 2027 2032 2037 2042 2047 2052 As pe rc entage of BAU
scenario
Figure A.E.10: Simulation for Capital in Poland under the EGD System-dynamics simulations using Vensim, 2022–52
Source: Own calculations based on Eurostat (2022), European statistics accessed online at https://ec.europa.eu/eurostat/
Note: Moderate scenario refers to a nature tax of 3%, a recycling capacity of 24%, a maximum degradation capacity of 5%, an ideal consumption shares of green production forms of 70% and an education cost ratio of 1.4, and moderate-high scenario refers to a nature tax of 6%, a recycling capacity of 48%, a maximum degradation capacity of 6%, an ideal consumption share0073 of green production forms of 90% and an education cost ratio of 1.3.
Figure A.E.11: Simulation for Capital-Labor Ratios in Poland under the EGD System-dynamics simulations using Vensim, 2022–52
Source: Own calculations based on Eurostat (2022), European statistics accessed online at https://ec.europa.eu/eurostat/
Note: Moderate scenario refers to a nature tax of 3%, a recycling capacity of 24%, a maximum degradation capacity of 5%, an ideal consumption shares of green production forms of 70% and an education cost ratio of 1.4, and moderate-high scenario refers to a nature tax of 6%, a recycling capacity of 48%, a maximum degradation capacity of 6%, an ideal consumption share0073 of green production forms of 90% and an education cost ratio of 1.3.
Figure A.E.12: Simulation for Unskilled Labor Demand in Poland under the EGD
Source: Own calculations based on Eurostat (2022), European statistics accessed online at https://ec.europa.eu/eurostat/
Note: Moderate scenario refers to a nature tax of 3%, a recycling capacity of 24%, a maximum degradation capacity of 5%, an ideal consumption shares of green production forms of 70% and an education cost ratio of 1.4, and moderate-high scenario refers to a nature tax of 6%, a recycling capacity of 48%, a maximum degradation capacity of 6%, an ideal consumption share0073 of green production forms of 90% and an education cost ratio of 1.3.
151 ANNEXES
Business as usual (BAU) Moderate scenario Moderate-high scenario 60 70 80 90 100 110 120 130 140 150 160 2022 2027 2032 2037 2042 2047 2052 Per cent of BAU
Business as usual (BAU) Moderate scenario Moderate-high scenario 60 70 80 90 100 110 120 130 2022 2027 2032 2037 2042 2047 2052 Per cent of BAU
System-dynamics simulations using Vensim, 2022–52
0 50 100 150 200 250 300 2022 2027 2032 2037 2042 2047 2052 Per cent of BAU Business as usual (BAU) Moderate scenario (D)Moderate-high scenario (D)Moderate scenario (S)Moderate-high scenario (S)
Figure A.E.13: Simulation for Skilled Labor Demand in Poland under the EGD System-dynamics simulations using Vensim, 2022–52
Source: Own calculations based on Eurostat (2022), European statistics accessed online at https://ec.europa.eu/eurostat/
Note: Moderate scenario refers to a nature tax of 3%, a recycling capacity of 24%, a maximum degradation capacity of 5%, an ideal consumption shares of green production forms of 70% and an education cost ratio of 1.4, and moderate-high scenario refers to a nature tax of 6%, a recycling capacity of 48%, a maximum degradation capacity of 6%, an ideal consumption share0073 of green production forms of 90% and an education cost ratio of 1.3.
Slovak Republic
Figure A.E.14: Simulation for Skilled-Unskilled Wage Gap in Poland under the EGD System-dynamics simulations using Vensim, 2022–52
Source: Own calculations based on Eurostat (2022), European statistics accessed online at https://ec.europa.eu/eurostat/
Note: Moderate scenario refers to a nature tax of 3%, a recycling capacity of 24%, a maximum degradation capacity of 5%, an ideal consumption shares of green production forms of 70% and an education cost ratio of 1.4, and moderate-high scenario refers to a nature tax of 6%, a recycling capacity of 48%, a maximum degradation capacity of 6%, an ideal consumption share0073 of green production forms of 90% and an education cost ratio of 1.3.
as usual (BAU) Moderate scenario (D)Moderate-high scenario (D)Moderate scenario (S)Moderate-high scenario (S)
Source: Own calculations based on Eurostat (2022), European statistics accessed online at https://ec.europa.eu/eurostat/
Note: Moderate scenario refers to a nature tax of 3%, a recycling capacity of 24%, a maximum degradation capacity of 5%, an ideal consumption shares of green production forms of 70% and an education cost ratio of 1.4, and moderate-high scenario refers to a nature tax of 6%, a recycling capacity of 48%, a maximum degradation capacity of 6%, an ideal consumption share0073 of green production forms of 90% and an education cost ratio of 1.3.
152 MAKING THE GREEN DEAL WORK FOR PEOPLE
Business as usual (BAU) Moderate scenario Moderate-high scenario 60 70 80 90 100 110 120 130 140 150 160 2022 2027 2032 2037 2042 2047 2052 Per cent of BAU
Moderate scenario Moderate-high scenario 60 70 80 90 100 110 120 130 2022 2027 2032 2037 2042 2047 2052 Per cent of BAU
Business as usual (BAU)
Figure A.E.15: Simulation Results for Slovak Brown Production under the EGD System-dynamics simulations using Vensim, 2022–52
0 50 100 150 200 250 300 2022 2027 2032 2037 2042 2047 2052 Per cent of BAU Business
Figure A.E.16: Simulation Results for Slovak Green Production under the EGD System-dynamics simulations using Vensim, 2022–52
Source: Own calculations based on Eurostat (2022), European statistics accessed online at https://ec.europa.eu/eurostat/
Note: Moderate scenario refers to a nature tax of 3%, a recycling capacity of 24%, a maximum degradation capacity of 5%, an ideal consumption shares of green production forms of 70% and an education cost ratio of 1.4, and moderate-high scenario refers to a nature tax of 6%, a recycling capacity of 48%, a maximum degradation capacity of 6%, an ideal consumption share0073 of green production forms of 90% and an education cost ratio of 1.3.
Figure A.E.17: Simulation for Capital in the Slovak Republic under the EGD System-dynamics simulations using Vensim, 2022–35
Source: Own calculations based on Eurostat (2022), European statistics accessed online at https://ec.europa.eu/eurostat/
Note: Moderate scenario refers to a nature tax of 3%, a recycling capacity of 24%, a maximum degradation capacity of 5%, an ideal consumption shares of green production forms of 70% and an education cost ratio of 1.4, and moderate-high scenario refers to a nature tax of 6%, a recycling capacity of 48%, a maximum degradation capacity of 6%, an ideal consumption share0073 of green production forms of 90% and an education cost ratio of 1.3.
153 ANNEXES
Business as usual (BAU) Moderate scenario Moderate-high scenario 0 20 40 60 80 100 120 140 160 180 200 2022 2027 2032 2037 2042 2047 2052 Per cent of BAU
Business as usual (BAU) Moderate scenario Moderate-high scenario 90 95 100 105 110 115 2022 2027 2032 2035 Per cent of BAU
Figure A.E.18: Simulation for Capital-Labor Ratios in the Slovak Republic under the EGD System-dynamics simulations using Vensim, 2022–52
Business as
scenario Moderate-high scenario 94 96 98 100 102 104 106 108 110 112 2022 2027 2032 2037 2042 2047 2052 Per cent of BAU
usual (BAU) Moderate
Figure A.E.19: Simulation for Unskilled Labor Demand in the Slovak Republic under the EGD System-dynamics simulations using Vensim, 2022–52
Source: Own calculations based on Eurostat (2022), European statistics accessed online at https://ec.europa.eu/eurostat/
Note: Moderate scenario refers to a nature tax of 3%, a recycling capacity of 24%, a maximum degradation capacity of 5%, an ideal consumption shares of green production forms of 70% and an education cost ratio of 1.4, and moderate-high scenario refers to a nature tax of 6%, a recycling capacity of 48%, a maximum degradation capacity of 6%, an ideal consumption share0073 of green production forms of 90% and an education cost ratio of 1.3.
Figure A.E.20: Simulation for Skilled Labor Demand in the Slovak Republic under the EGD System-dynamics simulations using Vensim, 2022–35
Source: Own calculations based on Eurostat (2022), European statistics accessed online at https://ec.europa.eu/eurostat/
Note: Moderate scenario refers to a nature tax of 3%, a recycling capacity of 24%, a maximum degradation capacity of 5%, an ideal consumption shares of green production forms of 70% and an education cost ratio of 1.4, and moderate-high scenario refers to a nature tax of 6%, a recycling capacity of 48%, a maximum degradation capacity of 6%, an ideal consumption share0073 of green production forms of 90% and an education cost ratio of 1.3.
Figure A.E.21: Simulation for Skilled-Unskilled Wage Gap in the Slovak Republic under the EGD System-dynamics simulations using Vensim, 2022–52
Source: Own calculations based on Eurostat (2022), European statistics accessed online at https://ec.europa.eu/eurostat/
Note: Moderate scenario refers to a nature tax of 3%, a recycling capacity of 24%, a maximum degradation capacity of 5%, an ideal consumption shares of green production forms of 70% and an education cost ratio of 1.4, and moderate-high scenario refers to a nature tax of 6%, a recycling capacity of 48%, a maximum degradation capacity of 6%, an ideal consumption share0073 of green production forms of 90% and an education cost ratio of 1.3.
154 MAKING THE GREEN DEAL WORK FOR PEOPLE
Business as usual (BAU) Moderate scenario (D)Moderate-high scenario (D)Moderate scenario (S)Moderate-high scenario (S) 0 20 40 60 80 100 120 140 2022 2027 20322037204220472052 Per cent of BAU
Business as usual (BAU) Moderate scenario
scenario (D)Moderate scenario (S)Moderate-high scenario (S) 90 95 100 105 110 115 120 125 130 2022 2027 2032 2037 2042 2047 2052 Per cent of BAU
(D)Moderate-high
Business as usual (BAU) Moderate scenario Moderate-high scenario 0 20 40 60 80 100 120 2022 2027 20322037204220472052 Per cent of BAU
Annex F. Methodology and Data Used in Defining Clusters in Principal Components Analysis
The purpose of this section is to develop a clustering methodology that provides inputs for policy-makers to identify countries that have similar conditions regarding the EGD pillars. Frequently, with these types of statistical methodologies, the main challenge faced by the policy-maker is the availability of high-quality data. For the case of the European Union, however, this problem is solved. Eurostat, the statistical office of the European Union, has made a significant effort in the standardization of indicator and data collection in all the member countries (European Union, 2022). Moreover, Eurostat has organized the different indicators by themes in a way that sets a standard for the different member countries on what are the variables that policy makers should consider when they want to discuss a given topic. Therefore, the European Union has a privileged position in a strong information system with a consensus among its members on what areas to focus attention, and a standardized protocol on how to collect the data.
Data selection
Having defined the data sources, the next step is the concrete identification of the relevant indicators to assess the comparison between countries in the EGD. For this purpose, the initial frame emerges directly from the EU communications on the EGD. In particular, the communication COM (2019) 640 final discusses eight policy pillars that lie at the core of the EGD. These pillars are:
1. Increasing the EU’s climate ambition for 2030 and 2050 (CA)
2. Supply clean, affordable, and secure energy (ClE)
3. Mobilizing industry for a clean and circular economy (CE)
4. Building and renovating in an energy and resource efficient way (EB)
5. A zero pollution ambition for a toxic-free environment (Pol)
6. Preserving and restoring ecosystems and biodiversity (Biod)
7. From ‘Farm to Fork’: A fair, healthy, and environmentally friendly food system (FP)
8. Accelerating the shift to sustainable and smart mobility (Tr).
Whereas all these topics are represented in Eurostat, only CE has its own section with detailed indicators. For the other pillars, the headings are suggestive (for example, for ClE the indicators are basically the same as those for the equivalent Sustainable Development Goal), but there is a need to include other sources within Eurostat to complement the analysis. For this reason, a thorough review was done of all the themes covered in Eurostat and for each of the pillars, all the relevant indicators were identified. This list can be found in Annex Table 3F.1. After the full list was identified, each indicator was assessed under four criteria:
1. If the indicator is in absolute or relative terms, the latter is preferred over the former.
2. The indicator was disaggregated at the country level.
3. The missing registries was less than 10%
4. Data keeps a level of aggregation suitable for the analysis.
On this last point it is worth mentioning that some indicators, in particular regarding agricultural topics can refer to very specific commodities, that end up distracting the focus of the reader. For example, knowing the crop area dedicated to pears might be too specific. Therefore, only the overall indicator (area dedicated for crops) was included, and the specific ones on given commodities were removed.
During the development of this analytical exercise, Eurostat develop a section exclusively on EGD themes and divided in three categories:
1. Reducing our climate impact
2. Protecting our planet and health
3. Enabling a green and just transition
There is a deontological difference between these categories and the former pillars. These three categories are aiming at ends and are identified to find how are the countries doing in some indicators that measure the success of the EGD. In contrast, the first eight pillars are focused on the initial conditions on the topics that the EGD cares about. As these two approaches are highly complementary, both sets of topics are considered. For display purposes, these eleven groups of indicators will be named the eleven themes (the theme of the circular economy is not investigated to avoid redundancies, since Chapter 4 of this report is on the circular economy). One final caveat: since Eurostat defined very specific indicators for its approach to measure the EGD, these indicators are always used, except if there is no country level disaggregation or the missing values exceed 10%.
155 ANNEXES
Data processing
The following data procedure was used for each of the cluster analyses shown in the document.
1. A data set consisting of all relevant variables for each country, including the two most recent observations and the change between them, was considered. The reason why this approach was preferred over selecting a specific year or average year is three-fold: i) These variables are rapidly changing and long-term averages reduce the bias by minimizing the value of the most recent values. ii) Specific years might have many missing values, but in general, the data was collected with a maximum of two years of difference between countries; in this way more observations could be recovered. iii) It is important both to consider the level of a variable as well as its change to better understand where a country is and towards which direction it is moving. Similar experiments were done using other selection criteria but the results presented minor changes, suggesting the robustness of this approach.
2. While the data is in general very complete, some specific countries have missing values in a couple of variables. However, as all the variables in the set are highly correlated (they all refer to the same EGD theme), it is possible to develop a predictive model to fit, as best as possible, those missing values based on the available data. In the interest of standardization and to avoid specific subjective biases, the data process to input these missing values was chosen to be purely statistical. For each theme, decision trees were built to predict the value of each of its variables given the available information of the other variables within the set. The parameters of the decision tree were selected as the default ones used by the R program “rpart”, as they have been generically approved by the statistical community as reasonable algorithms for filling these data gaps.
3. No single indicator is meaningful for a theme, but the set of indicators embeds the essence of the topic. For example, circular economy is not the
percentage of waste being recycled. Nevertheless, once that indicator is included in a larger set that also includes the use of secondary materials, R&D for the use of materials, among others, the whole set of indicators begin to provide a general idea of the theme that is to be captured. For this reason, it is important to process the data to capture those common trends and remove the specificities of each single indicator. To do so, the full data set was normalized (de-meaned, and divided by its standard deviation), and a set of principal components was calculated. Then these principal components were organized according to their variance and the process selected them in order, until 95% of the total variance of the theme can be explained.
4. The set of selected principal components is used to implement a hierarchical clustering using an Euclidean distance and Ward’s methodology. While being aware of and experimenting with other clustering procedures, the advantage of Ward’s lies in its capacity to preserve the covariance information over each of the element aggregation stages. This approach produces clustering hierarchies that are appealing to policy makers, as they can do multiple analyses depending on the number of policy groups they want to have (a decision that has logistical, political, and theoretical implications).
Whereas the procedure followed is fairly generic for statistical profiling exercises, it is useful to highlight several elements. Firstly, the process is intended to maximize the use of the available data to develop the clustering. Secondly, it focuses on the latent variables embedded within the set of preselected indicators rather than focusing on the particularities of each of them. Thirdly, the selection of the clustering is an art more than an exact science, as different clustering procedures will focus attention on different aspects of the data structure. The selected method was used to match specific policy needs of rapid identification of comparable countries and to have a reference on how similar these groups are.
156 MAKING THE GREEN DEAL WORK FOR PEOPLE
Table A.F.1: Variables Identified and Used for the Statistical Profiling
Increasing the EU’s climate ambition for 2030 and 2050
Eurostat Code Description
sdg_07_40
Share of renewable energy in gross final energy consumption by sector
Sub-indicators
All sectors
Electricity
Heating and Cooling
Transportation
sdg_12_30
sdg_13_10
Average CO2 emissions per km from new passenger cars
Greenhouse gas emissions by source sector
Excluding LULUCF and memo items, Index 1990 = 100 Excluding LULUCF and memo items, Tonnes per capita
Excluding memo items, Index 1990 = 100 Excluding memo items, Tonnes per capita
sdg_13_20
sdg_13_40
Greenhouse gas emissions
intensity of energy consumption
Climate related economic losses by type of event
Average losses over 30 years, Euro per capita
Average losses over 30 years, million Euro
Climatological events, million Euro Hydrological events, million Euro Meteorological events, million Euro
Total losses, million Euro
sdg_13_60
Population covered by the Covenant of Mayors for Climate & Energy signatories
Supply clean, affordable, and secure energy
Eurostat Code Description
sdg_07_10
sdg_07_11
sdg_07_20
sdg_07_30
sdg_07_40
Primary energy consumption
Final energy consumption
Final energy consumption in households per capita
Energy productivity
Share of renewable energy in gross final energy consumption by sector
Percentage of total population
sdg_07_50
Energy import dependency by products
Sub-indicators
Index 2005 = 100
Million ton of oil equivalent
Ton of oil equivalent (TOE) per capita
Index, 2005 = 100
Million tons of oil equivalent (MTOE)
Tonnes of oil equivalent (TOE) per capita
Euro per kilogram of oil equivalent (KGOE)
Purchasing power standard (PPS) per kilogram of oil equivalent
All sectors
Electricity
Heating and Cooling
Transportation
Solid fossil fuels
Natural gas
Oil and petroleum products excluding biofuel portion
Total
sdg_07_60
sdg_13_20
Population unable to keep home adequately warm by poverty status
Greenhouse gas emissions
intensity of energy consumption
Above 60% of equivalized income
Below 60% of equivalized income
Total
157 ANNEXES
Building and renovating in an energy and resource efficient
Eurostat Code Description
sdg_01_60
sdg_04_20
sdg_06_20
sdg_09_10
Population living in a dwelling with a leaking roof, damp walls, floors or foundation or rot in window frames of floor by poverty status
Sub-indicators
Above 60% of equivalised income
Below 60% of equivalised income
Total
Tertiary educational attainment by sex Females
Males
Total
Population connected to at least secondary wastewater treatment
Gross domestic expenditure on R&D by sector
sdg_09_30 R&D personnel by sector
Business enterprise sector
Government sector
Higher education sector
Private non-profit sector
All sectors
Business enterprise sector
Government sector
Higher education sector
Private non-profit sector
Total
sdg_09_40
sdg_09_50
Patent applications to the European Patent Office Number
Per million inhabitants
sdg_09_60
sdg_09_70
sdg_11_10
sdg_11_20
sdg_11_31
sdg_11_40
sdg_11_50
sdg_11_60
sdg_12_30
sdg_16_20
sdg_17_60
Share of buses and trains in total passenger transport
Share of rail and inland waterways in total freight transport
Air emission intensity from industry
Overcrowding rate by poverty status
Population living in households considering that they suffer from noise, by poverty status
Settlement area per capita
Motor coaches, buses and trolley buses
Trains
Trains, motor coaches, buses and trolley busessum of available data
Inland waterways
Railways
Inland waterways, railways - sum of available data
Above 60% of median equivalised income
Below 60% of median equivalised income
Total
Above 60% of median equivalised income
Below 60% of median equivalised income
Total
Road traffic deaths, by type of roads Number
Exposure to air pollution by particulate matter
Recycling rate of municipal waste
Average CO2 emissions per km from new passenger cars
Population reporting occurrence of crime, violence or vandalism in their area by poverty status
High-speed internet coverage, by type of area
Particulates < 10 μm
Particulates < 2.5 μm
Above 60% of equivalised income
Below 60% of equivalised income
Total
Low settled areas Total
158
MAKING THE GREEN DEAL WORK FOR PEOPLE
Rate
A zero pollution ambition for a toxic-free environment
Eurostat Code Description
sdg_06_10
sdg_06_20
sdg_06_30
Population having neither a bath, nor a shower, nor indoor flushing toilet in their household by poverty status
Population connected to at least secondary wastewater treatment
Biochemical oxygen demand in rivers
sdg_06_40 Nitrate in groundwater
sdg_06_50
Phosphate in rivers
sdg_06_60 Water exploitation index, plus (WEI+)
sdg_11_50
Exposure to air pollution by particulate matter
sdg_12_10 Consumption of chemicals by hazardousness - EU aggregate
sdg_12_30
sdg_13_10
Average CO2 emissions per km from new passenger cars
Greenhouse gas emissions by source sector
sdg_13_20 Greenhouse gas emissions intensity of energy consumption
t2020_30 Greenhouse gas emissions, base year 1990
env_air_esd Greenhouse gas emissions in effort sharing decision (ESD) sectors
t2020_rd210 Water productivity
t2020_rd300 Greenhouse gas emissions per capita
t2020_rk300 Pollutant emissions from transport
ten00002
ten00003
ten00006
Fresh water abstraction by source - million m³
Fresh water abstraction by source per capita - m³ per capita
Water (fresh surface water) abstracted by sector of use
Sub-indicators
Total
Percentage
ten00020
Population connected to urban wastewater collecting and treatment systems, by treatment level
Particulates < 10 μm
Particulates < 2.5 μm
Hazardous to environment
Hazardous
Hazardous and non-hazardous - Total
Hazardous to health
Excluding LULUCF and memo items, Index 1990 = 100
Excluding LULUCF and memo items, Tonnes per capita
Excluding memo items, Index 1990 = 100
Excluding memo items, Tonnes per capita
Index, 2000=100
Index, EU effort sharing decision base year=100
Million tonnes of CO2 equivalent
Euro per cubic metre
Purchasing power standard (PPS) per cubic metre
Non-methane volatile organic compounds
Nitrogen oxides
Particulates < 10 μm
Fresh groundwater, Million cubic metres
Fresh surface and groundwater
Fresh surface water
Fresh groundwater
Fresh surface and groundwater
Fresh surface water
Total
Agriculture
Production of electricity
Manufacturing Industry
Manufacturing industry - cooling
Public water supply
Independent wastewater treatment - total
Urban wastewater collecting system
Urban and other wastewater treatment plans - total
Percentage of population not connected to urban and other wastewater treatment
Urban and other wastewater treatment plans - primary treatment
Urban and other wastewater treatment plans - secondary treatment
Urban and other wastewater treatment plans - tertiary treatment
ten00030
Sewage sludge production and disposal from urban wastewater (in dry substance (d.s))
Sludge production - Total
Sludge disposal - Agricultural use
Sludge disposal - Compost and other applications
Sludge disposal - Incineration
Sludge disposal - Landfill
Sludge disposal - Other
Sludge disposal - Total
159 ANNEXES
Preserving and restoring ecosystems and biodiversity
Eurostat Code Description
sdg_06_30
sdg_06_50
sdg_14_10
sdg_14_40
sdg_14_60
sdg_15_10
sdg_15_20
sdg_15_41
sdg_15_50
sdg_15_60
sdg_15_61
Biochemical oxygen demand in rivers
Phosphate in rivers
Sub-indicators
Surface of marine sites designated under Natura 2000 Marine protected area (km2) Marine protected area (%)
Bathing sites with excellent water quality by locality
Marine waters affected by eutrophication
Share of forest area
Inland water excellent
Square kilometre
Percentage
Forest FAO
Forest and other wooded land FAO
Other wooded land FAO
Surface of terrestrial sites designated under Natura 2000 Terrestrial protected area (km2) Terrestrial protected area (%)
Soil sealing index
Estimated soil erosion by water - area affected by severe erosion rate
Common bird index by type of species - EU aggregate (All Common Species)
Grassland butterfly index - EU aggregate
Index 2005 = 100
Square kilometre
Percentage
Square kilometre
Percentage
Index, 2000 = 100
Index, 1991 = 100
Index, 2000 = 100
Index, 1991 = 100
From ‘Farm to Fork’: A fair, healthy, and environmentally friendly food system
Eurostat Code Description
sdg_02_10
Obesity rate by body mass index (BMI)
Sub-indicators
Pre-obese
sdg_02_20
sdg_02_30
sdg_02_40
sdg_02_51
sdg_02_60
sdg_06_40
sdg_15_50
sdg_15_60
tag00001
Agricultural factor income per annual work unit (AWU)
Government support to agricultural research and development
Area under organic farming
Harmonised risk indicator for pesticides (HRI1), by groups of active substances
Ammonia emissions from agriculture
Nitrate in groundwater
Estimated soil erosion by water - area affected by severe erosion rate
Common bird index by type of species - EU aggregate (All common species)
Agricultural holdings by agricultural area
Index, 2010=100
Chain linked volumes (2010), euro per annual work unit (AWU)
Pesticides - harmonised risk indicators 1 (all active substances)
Kilograms per hectare
Tonne
Square kilometre
Percentage
Index, 2000 = 100
Index, 1990 = 100
Zero ha
From 20 to 49.9 ha
From 5 to 19.9 ha
From 50 to 99.9 ha
100 ha or over
Less than 5 ha
Total
160
THE GREEN DEAL WORK FOR PEOPLE
MAKING
Overweight Obese
(Continued)
From ‘Farm to Fork’: A fair, healthy, and environmentally friendly food system
Eurostat Code Description
Sub-indicators
tag00007 Agricultural holdings by crops hold: seeds, seedings and other crops in arable land
Hold: cereals
Hold: pulses - total
Hold: Root crops
Hold: Industrial crops - total
Hold: Fresh vegetables, melons, strawberries
Hold: flowers and ornamental plants
Hold: Fodder crops - total
tag00014
tag00016
tag00017
tag00018
tag00020
Number of dairy cows
Number of bovine animals
Number of sheep
Number of pigs
Farm labour force
tag00025 Utilised agricultural area by categories
pers: Family labour force
pers: Labour force - members of sole holders’ family
pers: Regular nonfamily labour force
pers: Females: Regular labour force pers: Regular labour force
Arable land
Permanent grassland
Kitchen gardens
Permanent crops
Utilised agricultural area
tag00027 Cereals for the production of grain (including seed) by area, production and humidity
Area (cultivation/harvested/production)
EU standard humidity (%)
Harvested production in EU standard humidity (1000 t)
tag00029 Agricultural holdings by age of holder Total
From 35 to 44 years
From 45 to 54 years
From 55 to 64 years
65 years or over
Less than 35 years
tag00042 Production of meat: pigs
tag00043 Production of meat: poultry
tag00044 Production of meat: cattle
tag00045 Production of meat: sheep and goats
tag00047 Wheat and spelt by area, production and humidity Area (cultivation/harvested/production)
EU standard humidity (%)
Harvested production in EU standard humidity (1000 t)
tag00049 Rye and winter cereal mixtures by area, production and humidity Area (cultivation/harvested/production)
EU standard humidity (%)
Harvested production in EU standard humidity (1000 t)
tag00051 Barley by area, production and humidity Area (cultivation/harvested/production)
EU standard humidity (%)
Harvested production in EU standard humidity (1000 t)
161 ANNEXES
(Continued)
From ‘Farm to Fork’: A fair, healthy, and environmentally friendly food system
Eurostat Code Description
tag00053 Oats and spring cereal mixtures by area, production and humidity
tag00093 Grain maize and corn-cob-mix by area, production and humidity
tag00094 Dry pulses and protein crops for the production of grain (including seed and mixtures of cereals and pulses) by area, production and humidity
tag00098 Organic crop area (fully converted area)
tag00100 Rape, turnip rape, sunflower seeds and soya by area
Sub-indicators
Area (cultivation/harvested/production)
EU standard humidity (%)
Harvested production in EU standard humidity (1000 t)
Area (cultivation/harvested/production)
EU standard humidity (%)
Harvested production in EU standard humidity (1000 t)
Area (cultivation/harvested/production)
EU standard humidity (%)
Harvested production in EU standard humidity (1000 t)
Rape and turnip rape seeds Area (cultivation/ harvested/production)
Sunflower seed Area (cultivation/harvested/ production)
Soya Area (cultivation/harvested/production)
tag00101 Green maize by area, production and humidity Area (cultivation/harvested/production)
EU standard humidity (%)
Harvested production in EU standard humidity (1000 t)
tag00115 Fresh vegetables and strawberries by area
tag00120 Permanent crops for human consumption by area
tag00123 Agricultural holdings by economic size of the farm
Fresh vegetables (including melons) and strawberries
From 100000 to 249999 euros
From 15000 to 49000
From 250000 to 499999
From 4000 to 14000 euros
From 50000 to 99999 euros
500000 euros or over
Less than 4000 euros
Total
tag00124 Agricultural holdings with livestock hold: Number of holdings with livestock
tai09 Livestock density index
162
MAKING THE GREEN DEAL WORK FOR PEOPLE
Accelerating the shift to sustainable and smart mobility
Eurostat Code Description
sdg_11_40 Road traffic deaths, by type of roads
t2020_rk310 Modal split of passenger transport
t2020_rk320 Modal split of freight transport
Sub-indicators
Total, Number Total, Rate
Motor coaches, bus and trolley buses
Passenger cars
Train
Inland waters
Railroads
Roads
Inland waters, railroads and roads - sum of available data
tgs00075 Maritime transport of passengers by NUTS 2 regions
tgs00076 Maritime transport of freight by NUTS 2 regions
tgs00077 Air transport of passengers by NUTS 2 regions
tgs00078 Air transport of freight by NUTS 2 regions
tgs00113 Rail network by NUTS 2 regions
tgs00114 Motorways network by NUTS 2 regions
ttr00001 Volume of passenger transport relative to GDP
ttr00002 Total length of motorways
ttr00003 Total length of railway lines
ttr00005 Goods transport by road
ttr00006 Goods transport by rail
ttr00007 Goods transport by inland waterways
ttr00009 Sea transport of goods
ttr00011 Air transport of goods by country
ttr00012 Air transport of passengers by country
ttr00015 Rail transport of passengers
Kilometre
Kilometres per thousand square kilometres
Kilometre
Kilometres per thousand square kilometres
Motorways, Kilometre
E-roads, Kilometre
Million tonne-kilometre
Thousand tonnes
Million tonne-kilometre
Thousand tonnes
Million tonne-kilometre
Thousand tonnes
Thousand tonnes
163 ANNEXES
Reducing our climate impact
Eurostat Code Description
cli_act_noec
env_air_gge
Share of zero emission vehicles in newly registered passenger cars
Sub-indicators
Greenhouse gas emissions by source sector Energy, Greenhouse gases in CO2 equivalent
nrg_ind_esc Available energy, energy supply and final energy consumption per capita
sdg_07_10
sdg_07_40
sdg_13_10
tran_hv_frmod
Primary energy consumption
Share of renewable energy in gross final energy consumption by sector
Greenhouse gas emissions by source sector
Modal split of freight transport
tran_hv_psmod Modal split of passenger transport
Protecting our planet and health
Eurostat Code Description
env_bio4
sdg_02_40
sdg_02_51
sdg_06_40
sdg_11_50
sdg_12_50
sdg_15_10
Protected areas
Area under organic farming
Harmonised risk indicator for pesticides (HRI1), by groups of active substances
Nitrate in groundwater
Exposure to air pollution by particulate matter
Generation of waste excluding major mineral wastes by hazardousness
Share of forest area
Enabling a green and just transition
Eurostat Code Description
env_ac_ainah_r2 Air emissions accounts by NACE Rev. 2 activity
Final consumption - other sectors - households - energy use - space heating, KGOE per capita
Million tonnes of oil equivalent
All renewable energy sources, Percentage
Total (excluding memo items, including international aviation), Index, 1990=100
Railways, Percentage
Train, Percentage
Sub-indicators
Terrestrial protected area, Square kilometre
Percentage of total utilised agricultural area
Index, 2011-2013 average =100
Milligrams per litre
Particulates < 2.5µm
Hazardous and non-hazardous - Total, Kilograms per capita
Forest and other wooded land FAO, Percentage
env_ac_epneis National expenditure on environmental protection by institutional sector
env_ac_rme
sdg_07_60
sdg_09_10
sdg_12_41
sdg_17_50
sdg_17_60
Material flow accounts in raw material equivalentsmodelling estimates
Population unable to keep home adequately warm by poverty status
Gross domestic expenditure on R&D by sector
Circular material use rate
Share of environmental taxes in total tax revenues
High-speed internet coverage, by type of area
Sub-indicators
Total - all NACE activities, greenhouse gases in CO2 equivalent tonnes
Total economy, Million euro
Raw material consumption, tonnes per capita
Total, Percentage
All sectors, Percentage of gross domestic product (GDP)
Percentage
Low settled areas, Percentage of households
164 MAKING THE GREEN DEAL WORK FOR PEOPLE
Table A.F.2: Tables for the Clustering
Increasing the EU’s climate ambition for 2030 and 2050
Supply clean, affordable, and secure energy
Mobilizing industry for a clean and circular economy
Building and renovating in an energy and resource efficient way
living in a dwelling with a leaking roof, damp walls, floors or foundation or rot in window frames of floor by poverty status (Above 60% of equivalised income)
165 ANNEXES
Clusters 1 2 3 4 5 6 Change in share of renewable energy in gross
energy consumption by sector (All sources) 2.5 −2.1 −0.6 1.7 −5.1 −3.0 Change in greenhouse gas emissions intensity of energy consumption 2.0 2.1 2.5 17.5 −0.2 −1.9 Change in population covered by the Covenant of Mayors for Climate & Energy signatories −0.1 −0.4 −1.5 −0.3 −2.7 0.2 Share of renewable energy in gross final energy consumption by sector (All sources) 16.2 21.9 35.9 31.7 78.6 74.4 Population covered by the Covenant of Mayors for Climate & Energy signatories (Percentage of total population) 25.6 59.4 44.9 42.7 8.6 25.5 Average CO2 emissions per km from new passenger cars 123.3 123.1 114.0 130.1 114.3 59.9
Clusters 1 2 3 4 5 6 Change in Energy import dependency by products (Total) 4.0 0.2 −3.8 0.0 4.0 55.8 Change in population unable to keep home adequately warm by poverty status (Above 60% of equivalised income) 0.1 1.7 −0.3 −0.8 0.3 0.4 Change in greenhouse gas emissions intensity of energy consumption 1.7 2.7 7.1 1.9 −0.2 −1.9 Primary energy consumption (Ton of oil equivalent (TOE) per capita) 2.9 2.4 4.2 5.1 17.2 4.8 Population unable to keep home adequately warm by poverty status (Above 60% of equivalised income) 4.0 18.7 1.6 2.7 1.1 0.8
final
Clusters 1 2 3 4 5 6 Change in trade in recyclable raw materials (Imports extra-EU27 (from 2020)) 25,875 −20,220 −3,957 −3,472 52,256 213,962 Change in recycling rate of all waste excluding major mineral waste (Percentage) −0.2 −0.1 3.3 −0.5 2.6 −1.3 Generation of waste excluding major mineral wastes per domestic material consumption 9.2 20.5 23.3 8.1 19.2 12.6 Recycling of biowaste (Kilograms per capita) 163.7 96.0 21.5 45.6 131.0 61.0
Clusters 1 2 3 4 5 6 Change in population
−0.1 0.7 −3.2 1.9 1.6 0.7 Change in
expenditure
R&D
(Higher
sector) 0.0 0.0 0.0 0.0 −0.1 0.0 Change in road traffic deaths, by type of
(Total)(Rate) 0.4 0.0 0.0 0.5 3.4 0.5 R&D personnel by sector (Total) 1.9 1.1 1.2 0.8 1.7 0.6 Exposure to air pollution by particulate matter (Particulates < 2.5) 10.6 19.2 11.4 10.3 6.2 6.7
gross domestic
on
by sector
education
roads
MAKING THE GREEN DEAL WORK FOR PEOPLE
A zero pollution ambition for a toxic-free environment
Preserving and restoring ecosystems and biodiversity
From ‘Farm to Fork’: A fair, healthy, and environmentally friendly food system
Accelerating the shift to sustainable and smart mobility
166
Clusters 1 2 3 4 5 6 Change in population connected to at least secondary wastewater treatment (Percentage) −0.4 −1.9 −0.8 −0.1 0.5 −15.5 Change in exposure to air pollution by particulate matter (Particulates < 2.5μm) 1.7 1.4 2.5 0.8 0.3 −0.3 Change in average CO2 emissions per km from new passenger cars 14.3 6.9 6.7 13.8 34.1 7.7 Greenhouse gas emissions intensity of energy consumption (Index, 2000=100) 82.6 93.4 87.5 84.0 44.6 57.6 Fresh water abstraction by source − million m³ (Fresh surface and groundwater) 3842 3060 2250 23661 5142 42.7 Population connected to urban wastewater collecting and treatment systems, by treatment level (Urban wastewater collecting system) 89.6 72.0 64.9 85.3 96.9 98.9 Population connected to urban wastewater collecting and treatment systems, by treatment level (Urban and other wastement treatment plans − secondary treatment) 8.0 11.6 37.1 20.8 8.7 15.5
Clusters 1 2 3 4 5 6 Change in share of forest area (Forest and other wooded land FAO) −0.3 −0.2 −1.2 0.2 0.4 2.0 Change in estimated soil erosion by water − area affected by severe erosion rate (Percentage) 0.0 0.0 0.0 0.0 0.3 0.0 Bathing sites with excellent water quality by locality (Inland water) (Percentage) 72.7 83.8 21.2 86.0 91.3 68.8 Surface of terrestrial sites designated under Natura 2000 (Terrestrial protected area (%)) 24.9 13.0 30.1 13.5 13.3 9.0 Estimated soil erosion by water − area affected by severe erosion rate (Percentage) 9.9 0.9 4.3 0.3 12.6 4.1
Clusters 1 2 3 4 5 6 Change in obesity rate by body mass index (BMI) (pre-obese) 0.6 −0.1 −0.1 0.0 0.0 2.4 Change in number of bovine animals (Thousand heads) −2.9 299.6 60.1 119.8 −92.6 78.3 Change in farm labour force (pers: Family labour force) (Thousand full-time equivalents (FTE)) 9.2 13.5 171.5 412.3 78.6 187.7 Change in permanent crops for human consumption by area (All crops) −1.89 −1.77 −71.67 −32.24 16.47 −0.29
Clusters 1 2 3 4 5 6 Change in modal split of passenger transport (Motor coaches, bus and trolley buses) 0.5 0.1 −0.3 0.0 0.1 2.4 Change in modal split of freight transport (Roads) −1.1 −0.5 0.6 0.2 −0.5 −3.6 Modal split of passenger transport (Passenger cars) 74.8 83.6 84.2 85.1 84.6 86.4 Modal split of freight transport (Inland waters, railroads and roads - sum of available data) 29.9 14.0 50.8 26.6 17.4 12.5 Air transport of passengers by country (Passenger) 6284014 8859613 2603989 73597370 91088327 2437390
Reducing our climate impact
Protecting our planet and health
Enabling a green and just transition
accounts by NACE Rev. 2 activity (Greenhouse gases in CO2 equivalent, Total - all NACE activities, Tonne)
167 ANNEXES
Clusters 1 2 3 4 5 6 Change in share of zero emission vehicles in newly registered passenger cars (Percentage) −2.9 −1.3 0.7 −3.0 −2.2 −13.0 Change in greenhouse gas emissions by source sector (Greenhouse gases in CO2 equivalent, Energy) (Thousand Tonnes) 1.6 2.5 −0.1 17.9 2.5 0.9 Change in available energy, energy supply and final energy consumption per capita (Final consumption − other sectors − households − energy use − space heating, KGOE per capita) 0.2 0.2 −0.3 0.1 0.8 0.4 Change in primary energy consumption (Million tonnes of oil equivalent) 2.6 1.4 0.3 41.8 0.9 0.6 Change in share of renewable energy in gross final energy consumption by sector (All sources) −2.8 −2.5 −2.8 −1.9 0.7 −4.0 Share of zero emission vehicles in newly registered passenger cars (Percentage) 3.3 1.3 1.5 1.2 1.1 26.0 Share of renewable energy in gross final energy consumption by sector (Renewable energy sources, Percentage) 20.1 22.6 11.0 16.2 35.6 76.5 Modal split of passenger transport (Train, Percentage) 9.3 2.7 3.8 8.2 4.2 5.1
Clusters 1 2 3 4 5 6 Change in area under organic farming (Percentage of total utilised agricultural area) −0.4 −0.2 0.2 −1.0 −0.1 0.0 Change in harmonised risk indicator for pesticides (HRI1), by groups of active substances (Index, 2011−2013 average =100) 9.0 1.4 −4.3 16.4 −18.0 −2.1 Change in share of forest area (Forest and other wooded land FAO, Percentage) 0.1 −0.5 −1.2 0.0 0.0 1.8 Protected areas (Terrestrial protected area, Square kilometre) 18.6 23.1 39.0 38.8 20.8 14.8 Share of forest area (Forest and other wooded land FAO, Percentage) 60.2 30.0 42.8 42.3 58.2 27.4
Clusters 1 2 3 4 5 6 Change in
2690978 6459602 4272963 67648486 18036115 20506602 Change in gross domestic expenditure on R&D
sector (All
domestic
(GDP)) −0.1 −0.3 −0.1 0.0 −0.1 −0.1 National expenditure on environmental protection by institutional sector (Total economy, Million euro) 2.1 3.2 1.3 2.1 2.0 1.3 Share of environmental taxes in total tax revenues 6.5 6.1 8.1 4.4 7.4 4.8
air emissions
by
sectors, Percentage of gross
product
Annex G. Heat Maps Methodology and Results for Country Policy Analysis
Croatia
• Context: While Croatia has the strongest governance structures and stable economy in the Balkans, giving it capacity adapt to changes, high unemployment, growing trade deficits, and uneven regional development continue to be issues creating risk to economic stability.4 Response to the EU GD in Croatia was generally positive5 the European Investment Bank found that 85 percent of Croatians believe climate change has negative impact (one of the highest percentages in the EU) and Croatia’s need for energy independence (as it currently imports 56 percent of its energy) make the EU GD politically beneficial. Funding to support the GD in Croatia is expected to grow the economy by around 2 percent by 2026 and Croatia has plans for green jobs based on this growth. Impediments to the implementation of the GD in Croatia include hesitancy on the part of business and complex and inefficient systems and bureaucracy.6
• Policy documents reviewed: The following documents on Slovak environmental policy were reviewed for inclusion in analysis: The European Commission’s Commission Staff Working Document: Analysis of the recovery and resilience plan of Croatia, which was reviewed as a replacement for direct analysis of Slovakia’s Recovery and Resilience Plan, as it was unavailable in English;7 the National Reform Programme, April 2020;8 and the National Development Strategy 2030 9
• Analysis: The EC found that Croatia’s Recovery and Resilience Plan addresses a significant subset of the challenges and recommendations from the European Semester, including country-specific recommendations, specifically budgetary framework, active labor market policy measures, implementation of education reform, improvements to health systems. Cross cutting digitization and social cohesion through labor market policies and skills development for vulnerable groups.
With regards to education, Croatia aims to improve access and curricular development in early education and improved access to secondary education for improved tertiary and labor market force;
strengthened job skills training; digital transformation of schools; and strengthen R&D.
Health policies focus on improved quality of and access to health systems; renovation and improvements to energy efficiency of hospitals; and poverty reduction. Policies around social protection and jobs include: a Guaranteed Minimum Benefit and improvements to social protection benefits/welfare systems; measures to prevent social exclusion (deinstitutionalization); and job skills training and training in digital competencies.
Slovakia
• Context: Slovakia is one of the fastest growing economies in the EU, with a carbon-intense industry-based economy (automotive and steel) forming 28 percent of the country’s GDP. The real GDP grew by 61 percent between 2005 and 2019.10 In March 2020, Slovakia elected a new center right government and passed the Slovak Climate Initiative. 11 However, Slovakia faces socio-economic challenges due to poor educational outcomes, especially for socially disadvantaged populations, health outcomes are weak and life expectancy is one of the lowest in the EU.12 Limited public and private relationships and research and development sector provides challenges to growth under the EU GD.
• Policy documents reviewed: The following documents on Slovak environmental policy were reviewed for inclusion in analysis: The European Commission’s Commission Staff Working Document: Analysis of the recovery and resilience plan of Slovakia,13 which was reviewed as a replacement for direct analysis of Slovakia’s Recovery and Resilience Plan, as it was unavailable in English;14 the Integrated National Energy and Climate Plan for 2021 to 2030;15 Greener Slovakia: Strategy of the Environmental Policy of the Slovak Republic until 2030;16 and the Low-Carbon Development Strategy of the Slovak Republic until 2030 with a View to 2050 (2019).17 A number of relevant policies were not available in English, such as Slovakia’s Strategy on Inclusive Approach to Education (2021).
• Analysis: Slovak environmental policy written prior to 2020 and reviewed for this paper, tends to mostly address improvements to education and social protection and jobs. For example, Greener Slovakia: Strategy of the Environmental Policy the Slovak Republic until 2030, written in 2019, focuses on improvements to education—with focus on
168 MAKING THE GREEN DEAL WORK FOR PEOPLE
environmental education and training for sustainable development. It also focuses on development of active cooperation and partnership between public and private sectors to develop solutions to environmental problems. However, Greener Slovakia does not deal directly with the health sector with regards to climate solutions. The Integrated National Energy and Climate Plan for 2021 to 2030 (2019) includes public-private partnerships, upgrades for hospitals; improvements to education and R&D in order to support elimination of unemployment, poverty, and social exclusion. However, the Low–Carbon Development Strategy of the Slovak Republic until 2030 with a View to 2050, does not address education or social protection and jobs directly, but does include policy on improvements to public buildings (including hospitals).
Analysis of Slovakia’s Recovery and Resilience Plan (2020) found that it has a strong focus on inclusive education, improvements to the health system, public governance and productivity-enhancing green and digital transitions. The EC notes that Slovakia lacks adequate investment in the green transition (most funding is going to Cohesion Policy and public finance, with some for-environment protection and resource efficiency). Main priorities are energy efficient solutions for households and renewable energy. The EC found that Slovakia’s plan expects to contribute 43 percent of its total allocation of 6.3 billion euro (exceeding the required 37 percent), with focus on building renovations (including hospitals), shift to digital economy, decarbonization of industry, greener transportation, landscape/water management, and education reforms.18
Poland
• Context: Poland in particular, has been ‘climate cautious’, facing internal political challenges due to its heavily coal-dependent energy sectors. For Poland to meet EU climate targets, will require decisive action on the part of the government.19
However, the Polish government has remained politically committed to coal, even as the realities of the economics of the coal industry in Poland are beginning to shift (employment in the coal mining industry has dropped significantly since 1990) and there is growing public support for climate policies, particularly in light of low air quality (of the top 50 EU cities with worst air quality, 36 are in Poland),20 Poland continues to represent a significant portion of coal mining employment
in the EU; 43 percent of coal mining jobs in the EU are in Poland (in a country that is 8.5 percent of the total population of the EU).21
As a result of these political realities, Poland’s path in the EU GD has been contentious. In an effort to address difficulties related to these transitions and to prevent backlash, particularly in Eastern Europe, a Just Transition Fund was added, to mobilize capital and ease the transition through bank lending, private investment.22 However, a number of efforts on the part of Poland to make political decisions independently of the EU have put this funding in jeopardy—reluctance to phase out coal mining and political changes to the Polish courts system which assert that Polish law is paramount to EU law.23 The tensions between Poland and the EU over rule of law principles, as well as tensions about burden sharing, climate energy market integration, and energy security concerns have resulted in funding from the EU to Poland being put on hold.24
• Policy documents reviewed: Analysis of Poland’s policy documents regarding education, health, and social protection and justice was severely limited due to the lack of availability of English versions. As a result of the conflicts between Poland and the EU, Poland’s Recovery and Resilience Plan has still not been approved by the EC/EU and as a result, there has not yet been an EC analysis of the plan (as there is for Croatia and Slovakia, in English and allowing for analysis). Analysis was done on Poland’s National Strategy of Regional Development 2030 (NSRD). The National Strategy was adopted by the Council of Ministers in September 2019. The NSRD is the fundamental document for shaping regional policy in Poland until 2030.
• Analysis: The National Strategy includes some educational provisions for innovation (R&D) by establishing cooperation between universities and government. Additionally, the Strategy emphasizes equipping students with the skills needed by the labor market; adjustments to the education system to allow past graduates to upskill and reskill during adulthood to mitigate skills imbalances; and improving the awareness, flexibility and funding of adult learning to help boost participation. It also includes provisions for improvements to health care systems. With regards to social protection and jobs, the National Strategy’s focus is stronger—including provisions for improvement of public services, and vocational education and life-long learning.
169 ANNEXES
Annex H. Green Jobs Methodology
Estimating “greenness” of jobs
Following Vona et al. (2019) and Elliott et al. (2021) we apply the O*NET classification system (US Department of Labour) to describe jobs’ “greenness”. Green jobs in this classification are defined according to the number of green tasks they require from the workers. O*NET classification helps us to understand the changes in occupation and skill requirements happening when a country transitions to a greener economy (Elliott et al. 2021). We have used the data on the greenness of occupations on the 4-digit levels available in the appendix of the Elliott et al. (2021) working paper. As in our analysis we use data on up to 6-digit level granularity, we have made an assumption that each occupation on the 6-digit level is characterized by the same level of greenness as its 4-digit “umbrella occupation”.
Greenness of each occupation (Green core index) is calculated using the following formula: ,
where wij is the importance score that is attached to each task within occupationi, and greenj is a dummy that takes the value of 1 if task j is a green task. Elliott et al. (2021) differentiate three areas of greenness in which they refer to the O*NET classification. They contribute to the growing body of literature on green
jobs by providing a methodology on translating green indices from the 8-digit O*NET level to 4-digit ISCO level.
Estimating returns to skills in green versus brown jobs
We estimate earnings equation explaining log wages by skills, age and age squared (capturing decline in cognitive abilities but also a proxy of job experience), sector (public/private), and gender.
We use a single index of skills combining information about years of education and measures of foundational skills (numeracy and literacy), usage of skills at home and at work, and soft skills (influencing, planning). The combined measure was estimated using factor analysis model and after imputing missing data for individual skills indices (key measures of cognitive skills has no missing data). Skills index is standardized (z-score), so the results can be interpreted as the percentage change in wages related to one standard deviation change in skills.
Moreover, we interact skill measures with indicators of how “green” or “brown” is the job. In this case, we follow classification of occupations by Vona et al. (2019) and Elliott et al. (2021). We use a continuous measure of job green core tasks and a dummy variable indicating jobs that are mainly brown or green. To see if green (or greener) jobs provide different returns to skills we estimate the following equation. In addition, we control for fixed differences between countries by including country fixed effects uj
The results are presented in Table A.H.1.
170 MAKING THE GREEN DEAL WORK FOR PEOPLE
Table A.H.1. Log Hourly Wages in Green and Brown Jobs Explained by Skills, Age, Gender, and Sector
171 ANNEXES
Log of hourly wage (including bonuses) Green vs. brown jobs (dummy indicator) Continuous indicator of green core Skills 0.23*** (0.01) 0.26*** (0.00) Green −0.02 (0.03) 0.01 (0.01) Skills*green 0.05*** (0.01) 0.02*** (0.00) Age 0.03*** (0.00) 0.02*** (0.00) Age^2 −0.00*** (0.00) −0.00*** (0.00) Female −0.15*** (0.02) −0.14*** (0.01) Female*green 0.06* (0.02) 0.02** (0.01) Private −0.03 (0.02) −0.04*** (0.01) Private*green 0.05 (0.03) 0.02* (0.01) Constant 2.15*** (0.06) 2.20*** (0.03) Country fixed effects Yes Yes Adj R2 0.82 0.84 N 11335 31960 Source: Own calculations using PIAAC micro data. Note: Standard errors in parentheses. * p<0.05; ** p<0.01; *** p<0.001.
MAKING THE GREEN DEAL WORK FOR PEOPLE
Endnotes
1 The approach follows Nordhaus (1992) based on the author’s interpretation of the Dynamic Integrates Climate-Change Economy (DICE), which is used by the US Environmental Protection Agency.
2 See Arrow and Debreu (1954).
3 This equation will be modified in a coming section to include taxes, but for explanatory clarity that topic is not discussed at this point.
4 https://energsustainsoc.biomedcentral.com/ articles/10.1186/s13705-021-00328-y
5 Slijepčević and Kordej-De Villa 2021.
6 Kotarski 2022.
7 European Commission 2021a.
8 Government of the Republic of Croatia 2020.
9 Government of the Republic of Croatia 2022.
10 EPRS 2021.
11 https://bankwatch.org/blog/a-dozen-green-dealsteps-for-the-new-slovak-government.
12 https://ec.europa.eu/info/business-economy-euro/ recovery-coronavirus/recovery-and-resilience-facility/ slovakias-recovery-and-resilience-plan_en.
13 European Commission 2021b.
14 https://www.mfsr.sk/files/archiv/1/Plan_obnovy_a_ odolnosti.pdf.
15 Slovak Ministry of Education 2019.
16 Government of Slovakia 2019.
17 Government of the Slovak Republic 2020.
18 https://ec.europa.eu/commission/presscorner/ detail/en/qanda_21_3055.
19 Tomaszewski 2020.
20 Elkind and Bednarz 2020.
21 Elkind and Bednarz 2020.
22 Elkind and Bednarz 2020.
23 Elkind and Bednarz 2020.
24 Elkind and Bednarz 2020.
172

