14 minute read
CHAPTER 2 Introduction


2
Introduction
Ambient or outdoor air pollution has significant impacts on public health around the globe. According to the World Health Organization, an estimated 4.2 million1 people die every year worldwide from exposure to tiny solid and liquid particles— referred to as aerosols or fine particulate matter with an aerodynamic diameter less than or equal to 2.5 microns (PM2.5)—suspended in outdoor air. Reducing these impacts through air pollution controls is thus a major goal of environmental efforts to improve public health. However, quantifying and reducing the health impacts of PM2.5 is especially challenging in low- and middle-income countries (LMICs) because these countries tend to have limited air-quality (AQ) monitoring infrastructure, have insufficient quality assurance and quality control of their AQ monitoring data, and have limited local technical expertise in AQ monitoring, modeling, and planning. These shortcomings related to data and expertise can undermine the effectiveness of the design and implementation of policies to improve AQ in LMICs.
Earth-orbiting satellites can detect aerosols using observations of the sunlight scattered by the aerosols (figure 2.1; Bernard and others 2011; Levy and others 2013). This report examines whether the extensive spatial and temporal coverage of these satellites (figure 2.2) can potentially complement the sparse networks of ground-level monitors that typically exist in LMICs, thereby improving AQ monitoring and enforcement actions in these countries.
However, satellites are not able to measure ambient ground-level concentrations of PM2.5 directly. Instead, satellites use the observations of the sunlight scattered by aerosols to estimate a parameter called aerosol optical depth (AOD), which represents the extinction (absorption and scattering) of light by all of the aerosols in a column of air from the Earth’s surface up to the top of the atmosphere (for example, Levy and others 2013). As shown in figure 2.3, the reflected sunlight measured by the satellite depends on the intensity of sunlight reaching the Earth (I o), the fraction of the sunlight reflected by the ground (α, also called the “surface reflectance” or “albedo”), the AOD, and the aerosol light scattering and absorbing properties (also called aerosol optical properties, here represented by a single factor ω). Although the intensity of the incoming sunlight reaching Earth is well known, the other three properties are more uncertain.
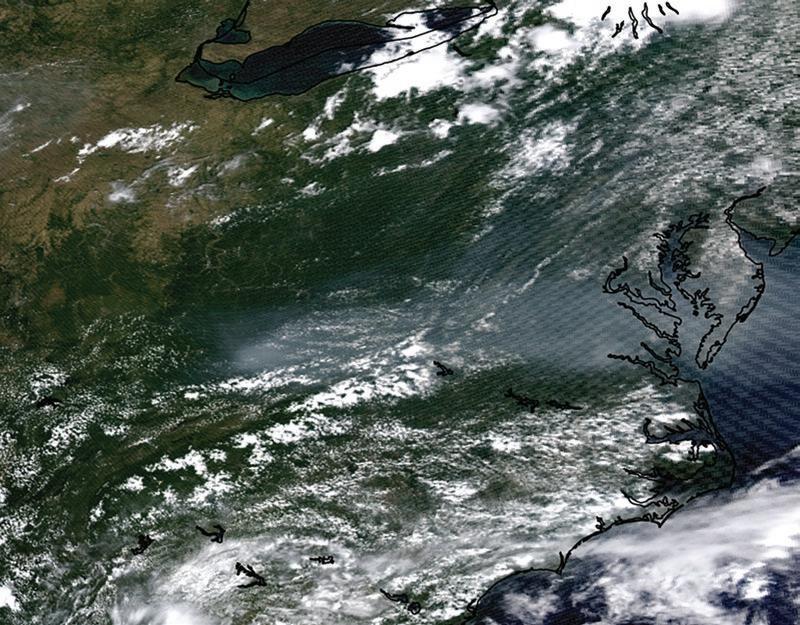
FIGURE 2.1
MODIS Aqua image of wildfire smoke being transported eastward to the Chesapeake Bay, US
Source: World Bank. Note: The white haze image is produced by the scattering of sunlight by the aerosols in the smoke. Image taken June 10, 2015, 18:55 UTC. MODIS = Moderate-Resolution Imaging Spectroradiometer; UTC = Coordinated Universal Time.
To measure AOD, “retrieval algorithms” are designed that use tabulated estimates of the surface reflectance and aerosol optical properties.
Radiative-transfer (RT) models enable accurate simulations of reflectance at the top of the atmosphere (TOA) in the presence of aerosol layers with a variety of optical properties. By properly accounting for surface reflectance from land and ocean backgrounds, it is possible to retrieve several important aerosol properties by comparing satellite-observed TOA reflectances to those calculated from an RT model. Typically, to optimize processing time, TOA reflectances are precalculated by the RT model for several combinations of aerosols and are stored in look-up tables accessed by the retrieval algorithm. The RT calculations are performed for a range of aerosol optical thicknesses, so each stored reflectance value in the look-up table corresponds to an aerosol optical thickness.
The estimates of all three parameters (surface reflectance, AOD, and aerosol optical properties) are then refined to provide the best match with the observed reflected sunlight at multiple wavelengths (that is, the satellite measurement of the different colors in the reflected sunlight). However, uncertainties or errors in the estimated surface reflectance and aerosol optical properties can lead to similar uncertainties and errors in the measured AOD.
FIGURE 2.2
Current and future coverage provided by available polar and geostationary weather satellites
a. Current coverage provided by available polar and geostationary satellites b. Future coverage after planned updates of geostationary satellites
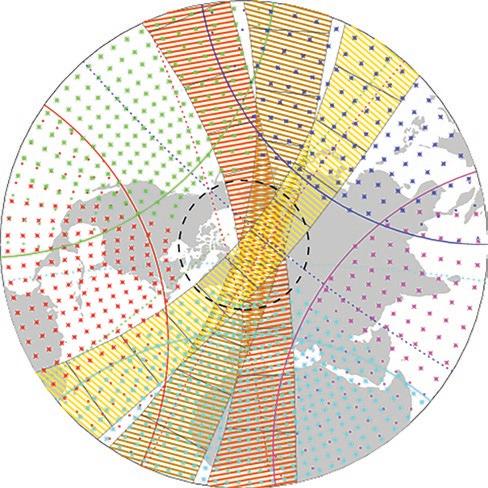
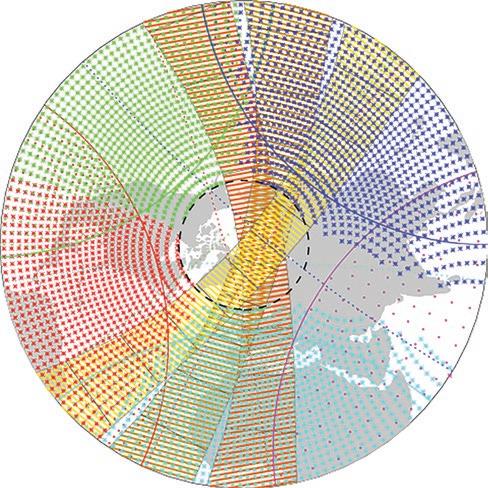
Source: World Bank. Note: The three bands in each panel illustrate three consecutive swaths from Moderate-Resolution Imaging Spectroradiometer (MODIS) in a polar orbit. Green, red, turquoise, magenta, and blue points represent coverage from geostationary satellites.
The exact relationship between AOD and ground-level PM2.5 concentrations depends on the vertical distribution of aerosols above the observed location and their ability to scatter and absorb sunlight, which in turn depends on their size, shape, and chemical composition (van Donkelaar, Martin, and Park 2006). Two main approaches are used to estimate the relationship between AOD and ground-level PM2.5 concentrations: statistical approaches (for example, generalized additive models [GAMs]) and chemical transport model (CTM)–based approaches. Statistical techniques can be used to predict the relationship between AOD and ground-level PM2.5 using historical data sets for both parameters and other variables (for example, Hu and others 2014; Sorek-Hamer and others 2013, 2015; Strawa and others 2013). Alternatively, the relationship can be estimated by using a computer model of the chemistry of the atmosphere, called a chemical transport model (CTM) (for example, Geng and others 2015; van Donkelaar and others 2006, 2010, 2011, 2015a, 2015b).
Several factors can limit the ability of satellites to obtain accurate AOD measurements. Satellite observations of AOD generally require that the fraction of the sunlight reflected by the ground (that is, the surface reflectance) is relatively uniform across the satellite “footprint.” This “footprint” is the area covered by a single satellite AOD observation, which may include multiple satellite image picture elements or “pixels.” The horizontal extent of this footprint is referred to as the horizontal resolution of the AOD observation. Thus, mixed and reflective surfaces—including deserts, persistent snow cover, and mixed land and water
FIGURE 2.3
How satellites can measure aerosol optical depth from reflected sunlight
I
o Aerosol scatteringωlo e–0.5AOD = 0.54Io αl o e–2AOD = 0.027I o
PM2.5 = 100 µg m–3 AOD = 1
lo e–AOD = 0.37I o αl o e–AOD = 0.074I o
Surface reflectance α = 0.2
Source: World Bank. Note: The reflected sunlight measured by the satellite includes that reflected by the aerosols (54 percent) and that reflected by the surface (2.7 percent). Here I o represents the initial intensity of the sunlight, the surface reflectance is represented by one factor (α), and the aerosol scattering and absorbing properties are represented by a single combined factor (ω). The numbers are just to illustrate relative magnitudes and are not results from a radiative transfer model simulation. AOD = aerosol optical depth; PM2.5 = particulate matter with an aerodynamic diameter less than or equal to 2.5 microns; μg/m3 = micrograms per cubic meter.
surfaces near coastal cities—can reduce the ability of satellites to provide accurate AOD observations for many cities. Clouds also prevent satellite AOD observations, and thus cities with seasonal persistent clouds will have reduced satellite observations during those periods.
The statistical and CTM-based approaches for relating AOD to ground-level concentrations of PM2.5 also have important limitations. The vertical profile of the aerosols, and thus the relationship between AOD and ground-level PM2.5, depends strongly on the height of the well-mixed layer of air near the Earth’s surface called the planetary boundary layer (PBL). For example, a one-kilometer PBL height with a more concentrated aerosol layer near the Earth’s surface (green line in figure 2.4) may have the same AOD as a more dilute aerosol layer with a two-kilometer PBL height (blue line in figure 2.4). In addition, if there is a concentrated aerosol layer above the PBL—as can happen when wildfire, dust, or pollution is transported a long distance from its source—the AOD may be due mainly to this concentrated aerosol layer. In this case, the AOD observation does not provide much useful information about the aerosol concentration at the Earth’s surface (red line in figure 2.4).
Lack of satellite AOD products at night, or due to clouds, snow cover, and other problems, can limit the ability of satellites to be used to estimate exposure to PM2.5 for health studies. Satellite AOD observations are obtainable only for one specific time during the day (for polar orbiting satellites) or during the cloud-free daylight times (for geostationary satellites). However, the daily
FIGURE 2.4
Highly idealized example of three different aerosol vertical profiles, each with different ground-level PM2.5 concentrations, that result in the same aerosol-optical-depth value of one when measured by satellites
16
14
12
Altitude (kilometers) 10
8
6
4
2
0 50 100
PM2.5 (µg/m3) 150 200
Source: World Bank. Note: The green profile shows a 1-kilometer planetary boundary layer (PBL) height. The blue profile shows a 2-kilometer PBL height. The red profile shows a 2-kilometer PBL height and an elevated aerosol layer between 3.5 and 5.5 kilometers in altitude. AOD = aerosol optical depth; PM2.5 = particulate matter with an aerodynamic diameter less than or equal to 2.5 microns; μg/m3 = micrograms per cubic meter.
average PM2.5 concentration is the required metric for estimation of acute (short-term) health effects of PM2.5. Consequently, even if the relationship between satellite AOD and the ground-level PM2.5 at the satellite observation time were perfectly known, the relationship between the ground-level PM2.5 concentration at the satellite observation time and the daily average PM2.5 concentration would have to be estimated as well. This estimation would be based on either the statistics of past ground-level PM2.5 observations or the output of a CTM. Errors in this relationship would lead to errors in the satellite-based estimate of PM2.5 exposure.
In addition, investigations of the chronic (long-term) health effects of groundlevel PM2.5 require estimating the annual average PM2.5 concentration. Thus, any seasonal pattern that affects the probability of a successful AOD retrieval, from either seasonal patterns in clouds or surface properties (that is, winter snow cover), will lead to a potentially incorrect annual average of
PM2.5 from satellite observations. This is so even if the relationship between AOD and ground-level PM2.5 concentrations is known.
The ability of satellite observations to estimate ground-level PM2.5 has not been established in LMICs. In addition, most previous studies have provided global or continental-scale results on monthly or annual timescales, rather than the city-scale, daily average PM2.5 concentration estimates needed for routine AQ monitoring and for public health alert programs. Most previous validation work on the use of satellite observations to estimate ground-level PM2.5 has been performed in developed countries with extensive, well-calibrated, long-term ground-level monitoring (GLM) observations of PM2.5 (for example, Geng and others 2015; Hu and others 2014; Sorek-Hamer and others 2013, 2015; Strawa and others 2013; van Donkelaar and others 2006, 2010, 2011, 2015a, 2015b). A few studies have evaluated the performance in some of the East Asia countries where GLM data are relatively new (for example, van Donkelaar, Martin, Brauer, and Boys 2015). However, the performance of the statistical models and CTMs used to derive these relationships has not been established in LMICs where GLM is infrequent or absent.
Thus, the satellite estimates of ground-level PM2.5 in LMICs may be biased—that is, the average difference between the estimated ground-level PM2.5 and the true PM2.5 concentration may be large, suggesting consistent (nonrandom) errors in the satellite estimates. Techniques that attempt to remove these consistent errors are called bias-correction methods (for example, van Donkelaar, Martin, Spurr, and Burnett 2015), but these corrections depend on data from well-calibrated, long-term GLM networks and thus may not perform well in LMICs. Errors in the city-scale, daily average PM2.5 concentration estimates could cause significant problems for public health alert programs, such as “code red” days when selfprotective measures are advised for sensitive populations. This could result in significant economic impacts through lost work or school (if PM2.5 is overestimated) or significant health, welfare, and productivity losses (if PM2.5 is underestimated).
The lack of GLM data in many LMICs also introduces difficulties in trying to relate the spatially averaged AOD observations to variations in PM2.5 within a city (due to distance from roadways and other pollution sources). This suggests the need to combine satellite observations with GLM observations and data on pollution sources within a city using interpolation techniques (for example, Lee, Chatfield, and Strawa 2016; Millar and others 2010; Vienneau and others 2013).
REPORT METHODOLOGY
This report evaluates different approaches for using satellite AOD data in estimating daily average ground-level PM2.5 concentrations within selected cities in LMICs, with the goal of improving estimates of human PM2.5 exposure. The methodological approach was, first, to conduct a literature review of previous approaches used to estimate PM2.5 exposures employing satellite data, with a focus on identifying those satellite instruments and approaches for PM2.5 estimation best suited to provide city-scale, daily average PM2.5 concentrations and exposures. nine LMIC cities with multiyear GLM data records were then identified to be used to test these approaches. Since the accuracy of these GLM data could affect the results of the analysis, the accuracy of the GLM instruments and the details of the quality-assurance procedures applied to these data were investigated. Finally, the identified satellite approaches
(one statistical and one CTM-based) were applied to the nine cities to determine how the usefulness of satellite observations for estimating PM2.5 concentrations and exposures varies across the geographic locations represented by the different cities.
OUTLINE OF THIS REPORT
This report discusses the results of a review of the literature on approaches used to combine satellite observations with GLM measurements of PM2.5 and discusses the strengths and limitations of these approaches (chapter 3). The quality of GLM data available in LMICs is also discussed, and recommendations for improving the GLM data are made (chapter 4). In addition, this report discusses the effort to develop and evaluate methods for converting satellite AOD into daily average, city-scale, ground-level PM2.5 estimates in nine cities in LMICs (chapter 5). Based on this work, recommendations are made for how LMICs could best incorporate satellite data into their ambient AQ monitoring efforts (chapter 6). The recommendations use the same typology proposed in chapter 1 based on a given LMIC’s level of engagement with AQ monitoring. The appendixes provide additional information on the literature review conducted for this report (appendix A); converting satellite AOD to ground-level PM2.5 (appendix B); evaluation of satellite approaches (appendix C); and quality considerations for GLM data in LMICs (appendix C).
NOTE
1. https://www.who.int/health-topics/air-pollution#tab=tab_2.
REFERENCES
Bernard, E., C. Moulin, D. Ramon, D. Jolivet, J. Riedi, and J.-M. nicolas. 2011. “Description and
Validation of an AOT Product over Land at the 0.6 μm Channel of the SEVIRI Sensor
Onboard MSG.” Atmospheric Measurement Techniques 4: 2543–65. Geng, G., Q. Zhang, R. V. Martin, A. van Donkelaar, H. Huo, H. Che, J. Lin, and K. He. 2015.
“Estimating Long-Term PM2.5 Concentrations in China Using Satellite-Based Aerosol
Optical Depth and a Chemical Transport Model.” Remote Sensing of Environment 166: 262–70.
Hu, X., L. A. Waller, A. Lyapustin, Y. Wang, M. Z. Al-Hamdan, W. L. Crosson, M. G. Estes,
S. M. Estes, D. A. Quattrochi, S. J. Puttaswamy, and Y. Liu. 2014. “Estimating Ground-Level
PM2.5 Concentrations in the Southeastern United States Using MAIAC AOD Retrievals and a Two-Stage Model.” Remote Sensing of Environment 140: 220–32. Lee, H. J., R. B. Chatfield, and A. W. Strawa. 2016. “Enhancing the Applicability of Satellite
Remote Sensing for PM2.5 Estimation Using MODIS Deep Blue AOD and Land Use
Regression in California, United States.” Environmental Science & Technology 50 (12): 6546–55.
Levy, R. C., S. Mattoo, L. A. Munchak, L. A. Remer, A. M. Sayer, F. Patadia, and n. C. Hsu. 2013.
“The Collection 6 MODIS Aerosol Products over Land and Ocean.” Atmospheric
Measurement Techniques 6: 2989–3034. Millar, G., T. Abel, J. Allen, P. Barn, M. noullett, J. Spagnol, and P. L. Jackson. 2010. “Evaluating
Human Exposure to Fine Particulate Matter Part II: Modeling.” Geography Compass 4 (7): 731–49.
Sorek-Hamer, M., I. Kloog, P. Koutrakis, A. W. Strawa, R. Chatfield, A. Cohen, W. L. Ridgway, and D. M. Broday. 2015. “Assessment of PM2.5 Concentrations over Bright Surfaces Using
MODIS Satellite Observations.” Remote Sensing of Environment 163: 180–85. Sorek-Hamer, M., A. W. Strawa, R. B. Chatfield, R. Esswein, A. Cohen, and D. M. Broday. 2013.
“Improved Retrieval of PM2.5 from Satellite Data Products Using non-Linear Methods.”
Environmental Pollution 182: 417–23.
Strawa, A. W., R. B. Chatfield, M. Legg, B. Scarnato, and R. Esswein. 2013. “Improving Retrievals of Regional Fine Particulate Matter Concentrations from Moderate Resolution Imaging
Spectroradiometer (MODIS) and Ozone Monitoring Instrument (OMI) Multisatellite
Observations.” Journal of the Air & Waste Management Association 63 (12): 1434–46. van Donkelaar, A., R. V. Martin, M. Brauer, and B. L. Boys. 2015a. “Use of Satellite Observations for Long-Term Exposure Assessment of Global Concentrations of Fine Particulate Matter.”
Environmental Health Perspectives 123 (2): 135–43. van Donkelaar, A., R. V. Martin, M. Brauer, R. Kahn, R. Levy, C. Verduzco, and P. J. Villeneuve. 2010. Global Estimates of Ambient Fine Particulate Matter Concentrations from Satellite-
Based Aerosol Optical Depth: Development and Application.” Environmental Health
Perspectives 118 (6): 847–55. van Donkelaar, A., R. V. Martin, R. C. Levy, A. M. da Silva, M. Krzyzanowski, n. E. Chubarova,
E. Semutnikova, and A. J. Cohen. 2011. “Satellite-Based Estimates of Ground-Level Fine
Particulate Matter during Extreme Events: A Case Study of the Moscow Fires in 2010.”
Atmospheric Environment 45 (34): 6225–32. van Donkelaar, A., R. V. Martin, and R. J. Park. 2006. “Estimating Ground-Level PM2.5 Using
Aerosol Optical Depth Determined from Satellite Remote Sensing.” Journal of Geophysical
Research: Atmospheres 111: D21201. van Donkelaar, A., R. V. Martin, R. J. Spurr, and R. T. Burnett. 2015b. “High-Resolution Satellite-
Derived PM2.5 from Optimal Estimation and Geographically Weighted Regression over north America.” Environmental Science & Technology 49 (17): 10482–91. Vienneau, D., K. de Hoogh, M. J. Bechle, R. Beelen, A. van Donkelaar, R. V. Martin, D. B. Millet,
G. Hoek, and J. D. Marshall. 2013. “Western European Land Use Regression Incorporating
Satellite- and Ground-Based Measurements of nO2 and PM10.” Environmental Science &
Technology 47 (23): 13555–64.


