140 minute read
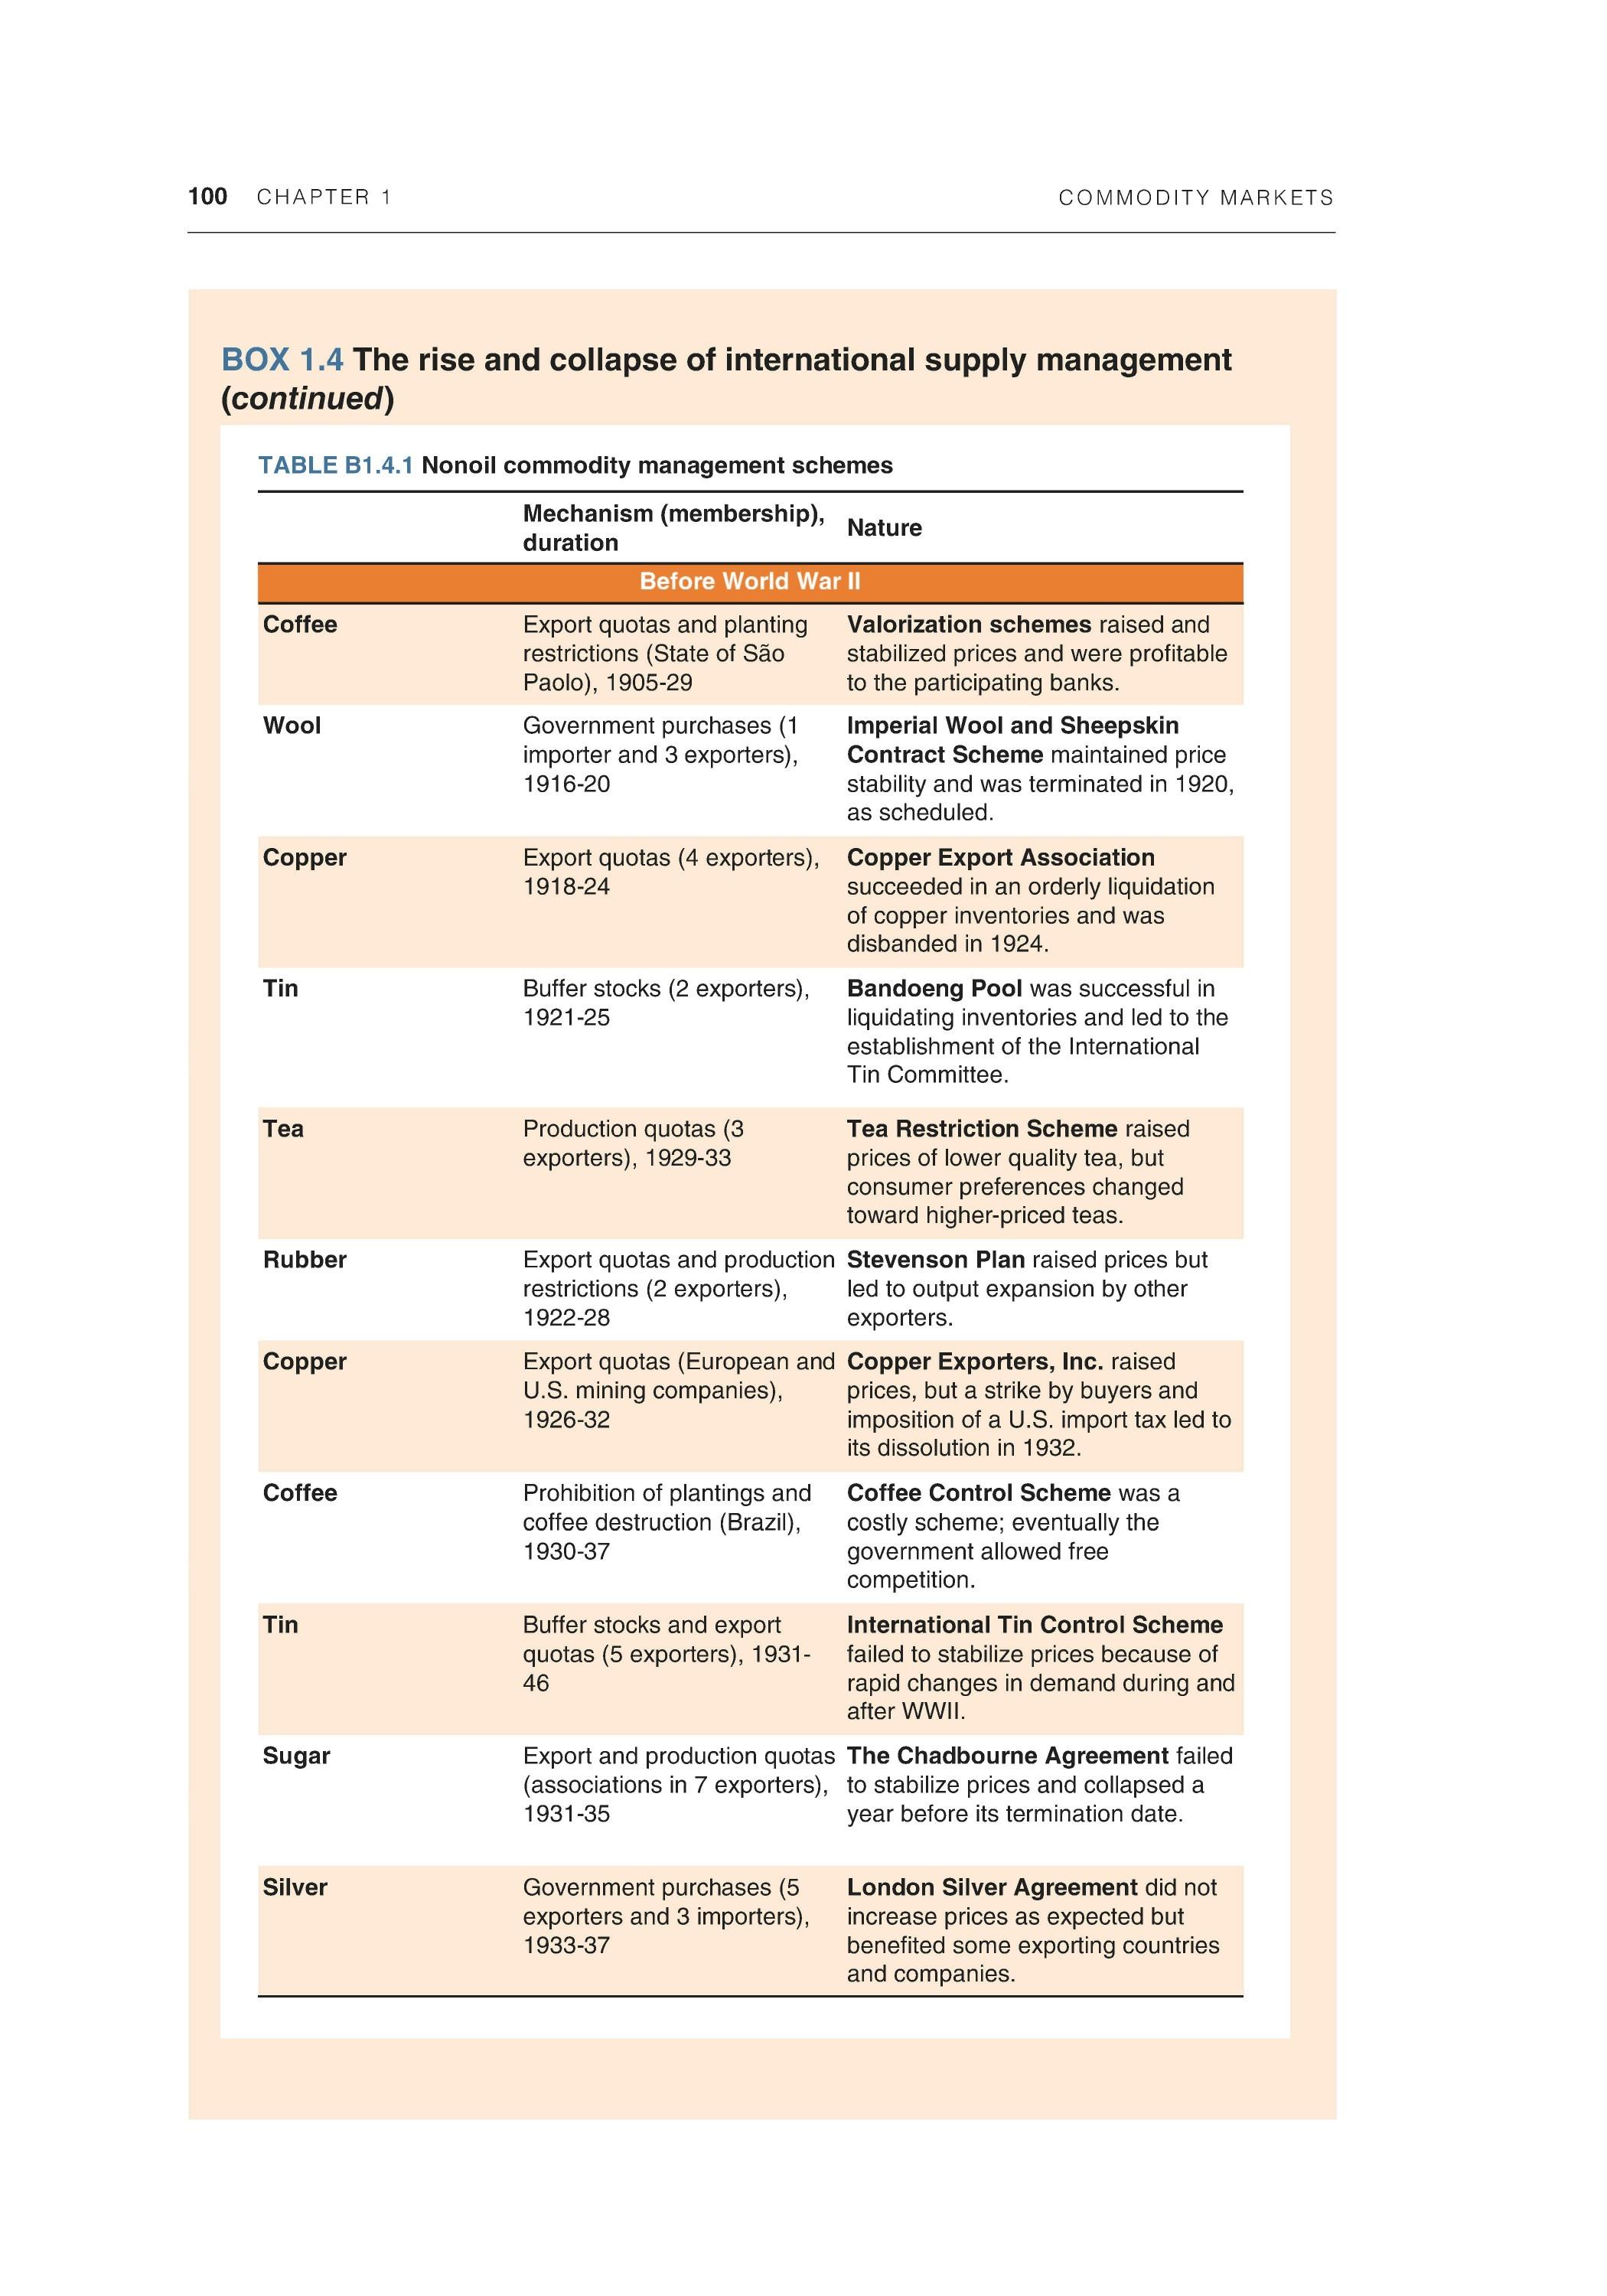
B1.4.1 Nonoil commodity management schemes
100 CHAPTER 1 COMMODITY MARKETS
BOX 1.4 The rise and collapse of international supply management (continued)
TABLE B1.4.1 Nonoil commodity management schemes Mechanism (membership), duration Nature
Before World War II
Coffee
Wool
Copper
Tin
Export quotas and planting restrictions (State of Sao Paolo), 1905-29
Government purchases (1 importer and 3 exporters), 1916-20
Export quotas (4 exporters), 1918-24
Buffer stocks (2 exporters), 1921-25 Valorization schemes raised and stabilized prices and were profitable to the participating banks.
Imperial Wool and Sheepskin
Contract Scheme maintained price stability and was terminated in 1920, as scheduled.
Copper Export Association
succeeded in an orderly liquidation of copper inventories and was disbanded in 1924.
Bandoeng Pool was successful in liquidating inventories and led to the establishment of the International Tin Committee.
Tea
Rubber
Copper
Coffee
Tin
Sugar
Production quotas (3 exporters), 1929-33 Tea Restriction Scheme raised prices of lower quality tea, but consumer preferences changed toward higher-priced teas.
Export quotas and production Stevenson Plan raised prices but restrictions (2 exporters), led to output expansion by other 1922-28 exporters.
Export quotas (European and Copper Exporters, Inc. raised U.S. mining companies), prices, but a strike by buyers and 1926-32 imposition of a U.S. import tax led to its dissolution in 1932.
Prohibition of plantings and coffee destruction (Brazil), 1930-37
Buffer stocks and export quotas (5 exporters), 193146
Coffee Control Scheme was a
costly scheme; eventually the government allowed free competition.
International Tin Control Scheme
failed to stabilize prices because of rapid changes in demand during and after WWII.
Export and production quotas The Chadbourne Agreement failed (associations in 7 exporters), to stabilize prices and collapsed a 1931 -35 year before its termination date.
Silver
Government purchases (5 exporters and 3 importers), 1933-37 London Silver Agreement did not increase prices as expected but benefited some exporting countries and companies.
COMMODITY MARKETS CHAPTER 1 101
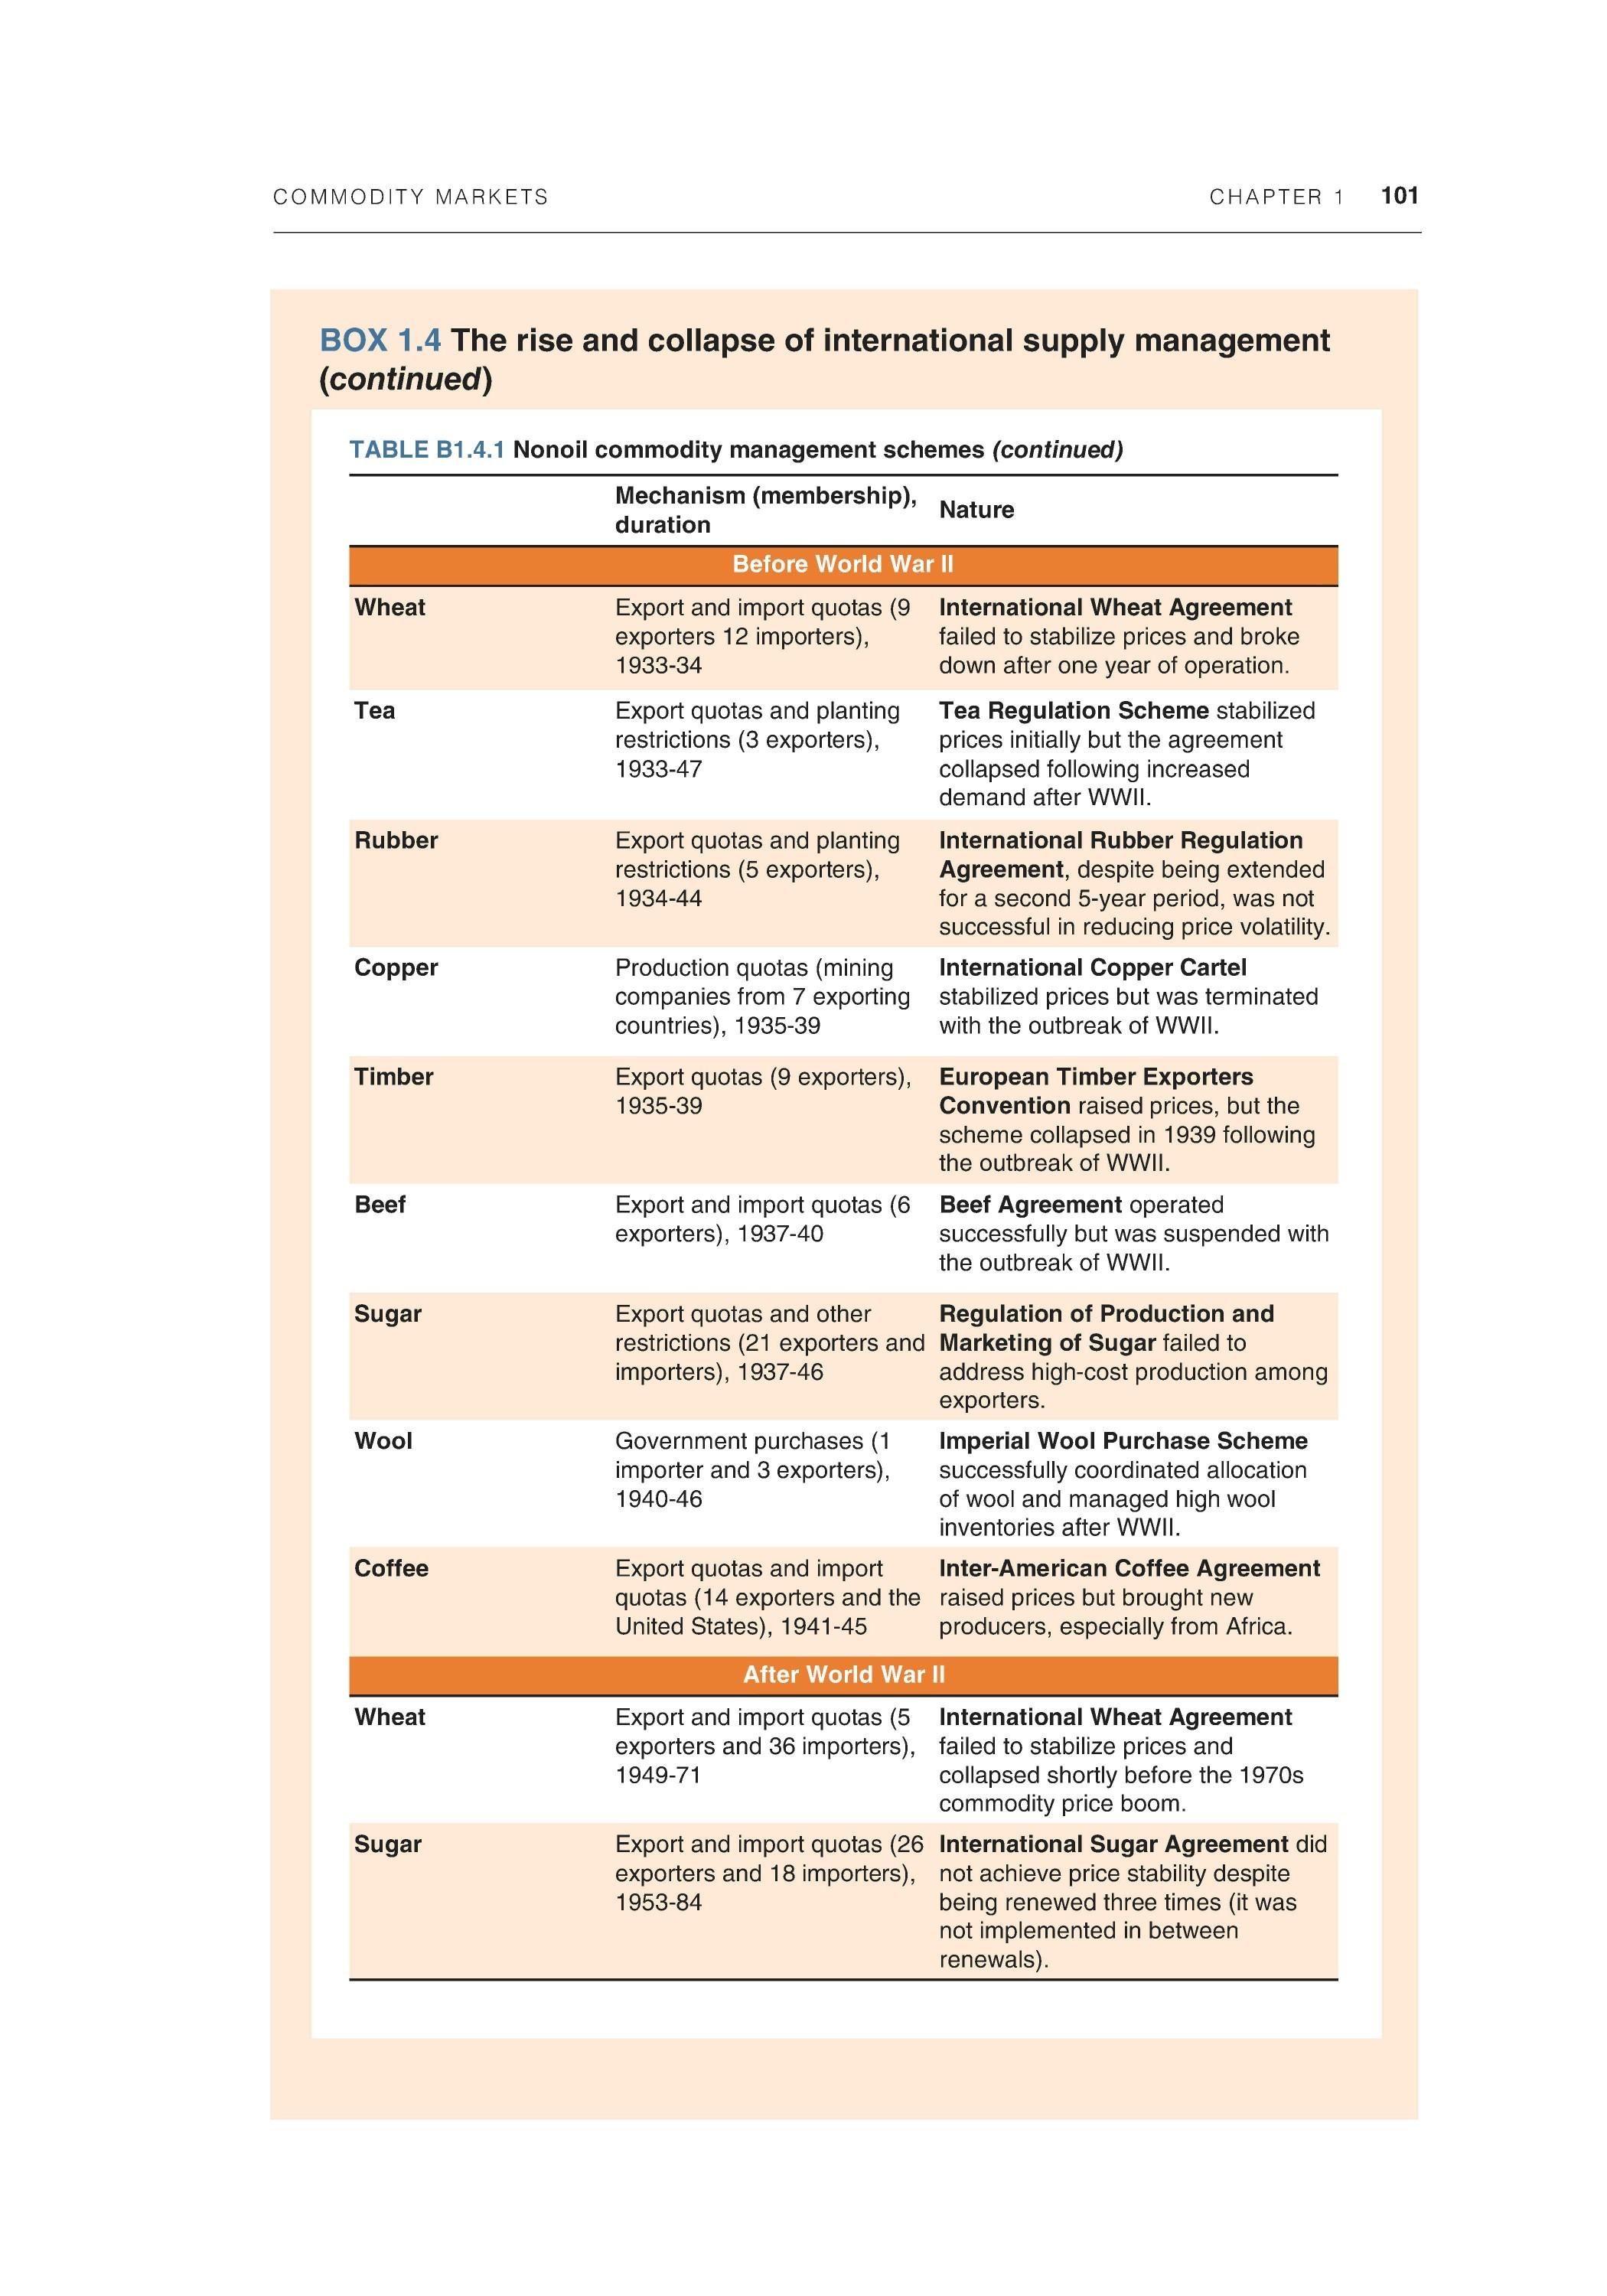
TABLE B1.4.1 Nonoil commodity management schemes (continued) Mechanism (membership), duration Nature
Before World War II
Wheat
Tea
Export and import quotas (9 exporters 12 importers), 1933-34
Export quotas and planting restrictions (3 exporters), 1933-47
International Wheat Agreement
failed to stabilize prices and broke down after one year of operation.
Tea Regulation Scheme stabilized prices initially but the agreement collapsed following increased demand after WWII.
Rubber
Copper
Export quotas and planting restrictions (5 exporters), 1934-44
Production quotas (mining companies from 7 exporting countries), 1935-39
Export quotas (9 exporters), 1935-39
International Rubber Regulation
Agreement, despite being extended for a second 5-year period, was not successful in reducing price volatility.
International Copper Cartel
stabilized prices but was terminated with the outbreak of WWII.
Timber
Beef
Export and import quotas (6 exporters), 1937-40
European Timber Exporters
Convention raised prices, but the scheme collapsed in 1939 following the outbreak of WWII.
Beef Agreement operated successfully but was suspended with the outbreak of WWII.
Sugar
Wool
Coffee
Wheat
Sugar
Export quotas and other Regulation of Production and restrictions (21 exporters and Marketing of Sugar failed to importers), 1937-46 address high-cost production among exporters.
Government purchases (1 importer and 3 exporters), 1940-46
Export quotas and import quotas (14 exporters and the United States), 1941-45
Imperial Wool Purchase Scheme
successfully coordinated allocation of wool and managed high wool inventories after WWII.
Inter-American Coffee Agreement
raised prices but brought new producers, especially from Africa.
fter World War
Export and import quotas (5 exporters and 36 importers), 1949-71
International Wheat Agreement
failed to stabilize prices and collapsed shortly before the 1970s commodity price boom. Export and import quotas (26 International Sugar Agreement did exporters and 18 importers), not achieve price stability despite 1953-84 being renewed three times (it was not implemented in between renewals).
102 CHAPTER 1 COMMODITY MARKETS
TABLE B1.4.1 Nonoil commodity management schemes (continued) Mechanism (membership), duration Nature
After World War II
Tin
Coffee
Cocoa
Cocoa
Rubber
Buffer stocks and export quotas (7 exporters and 18 importers), 1954-85
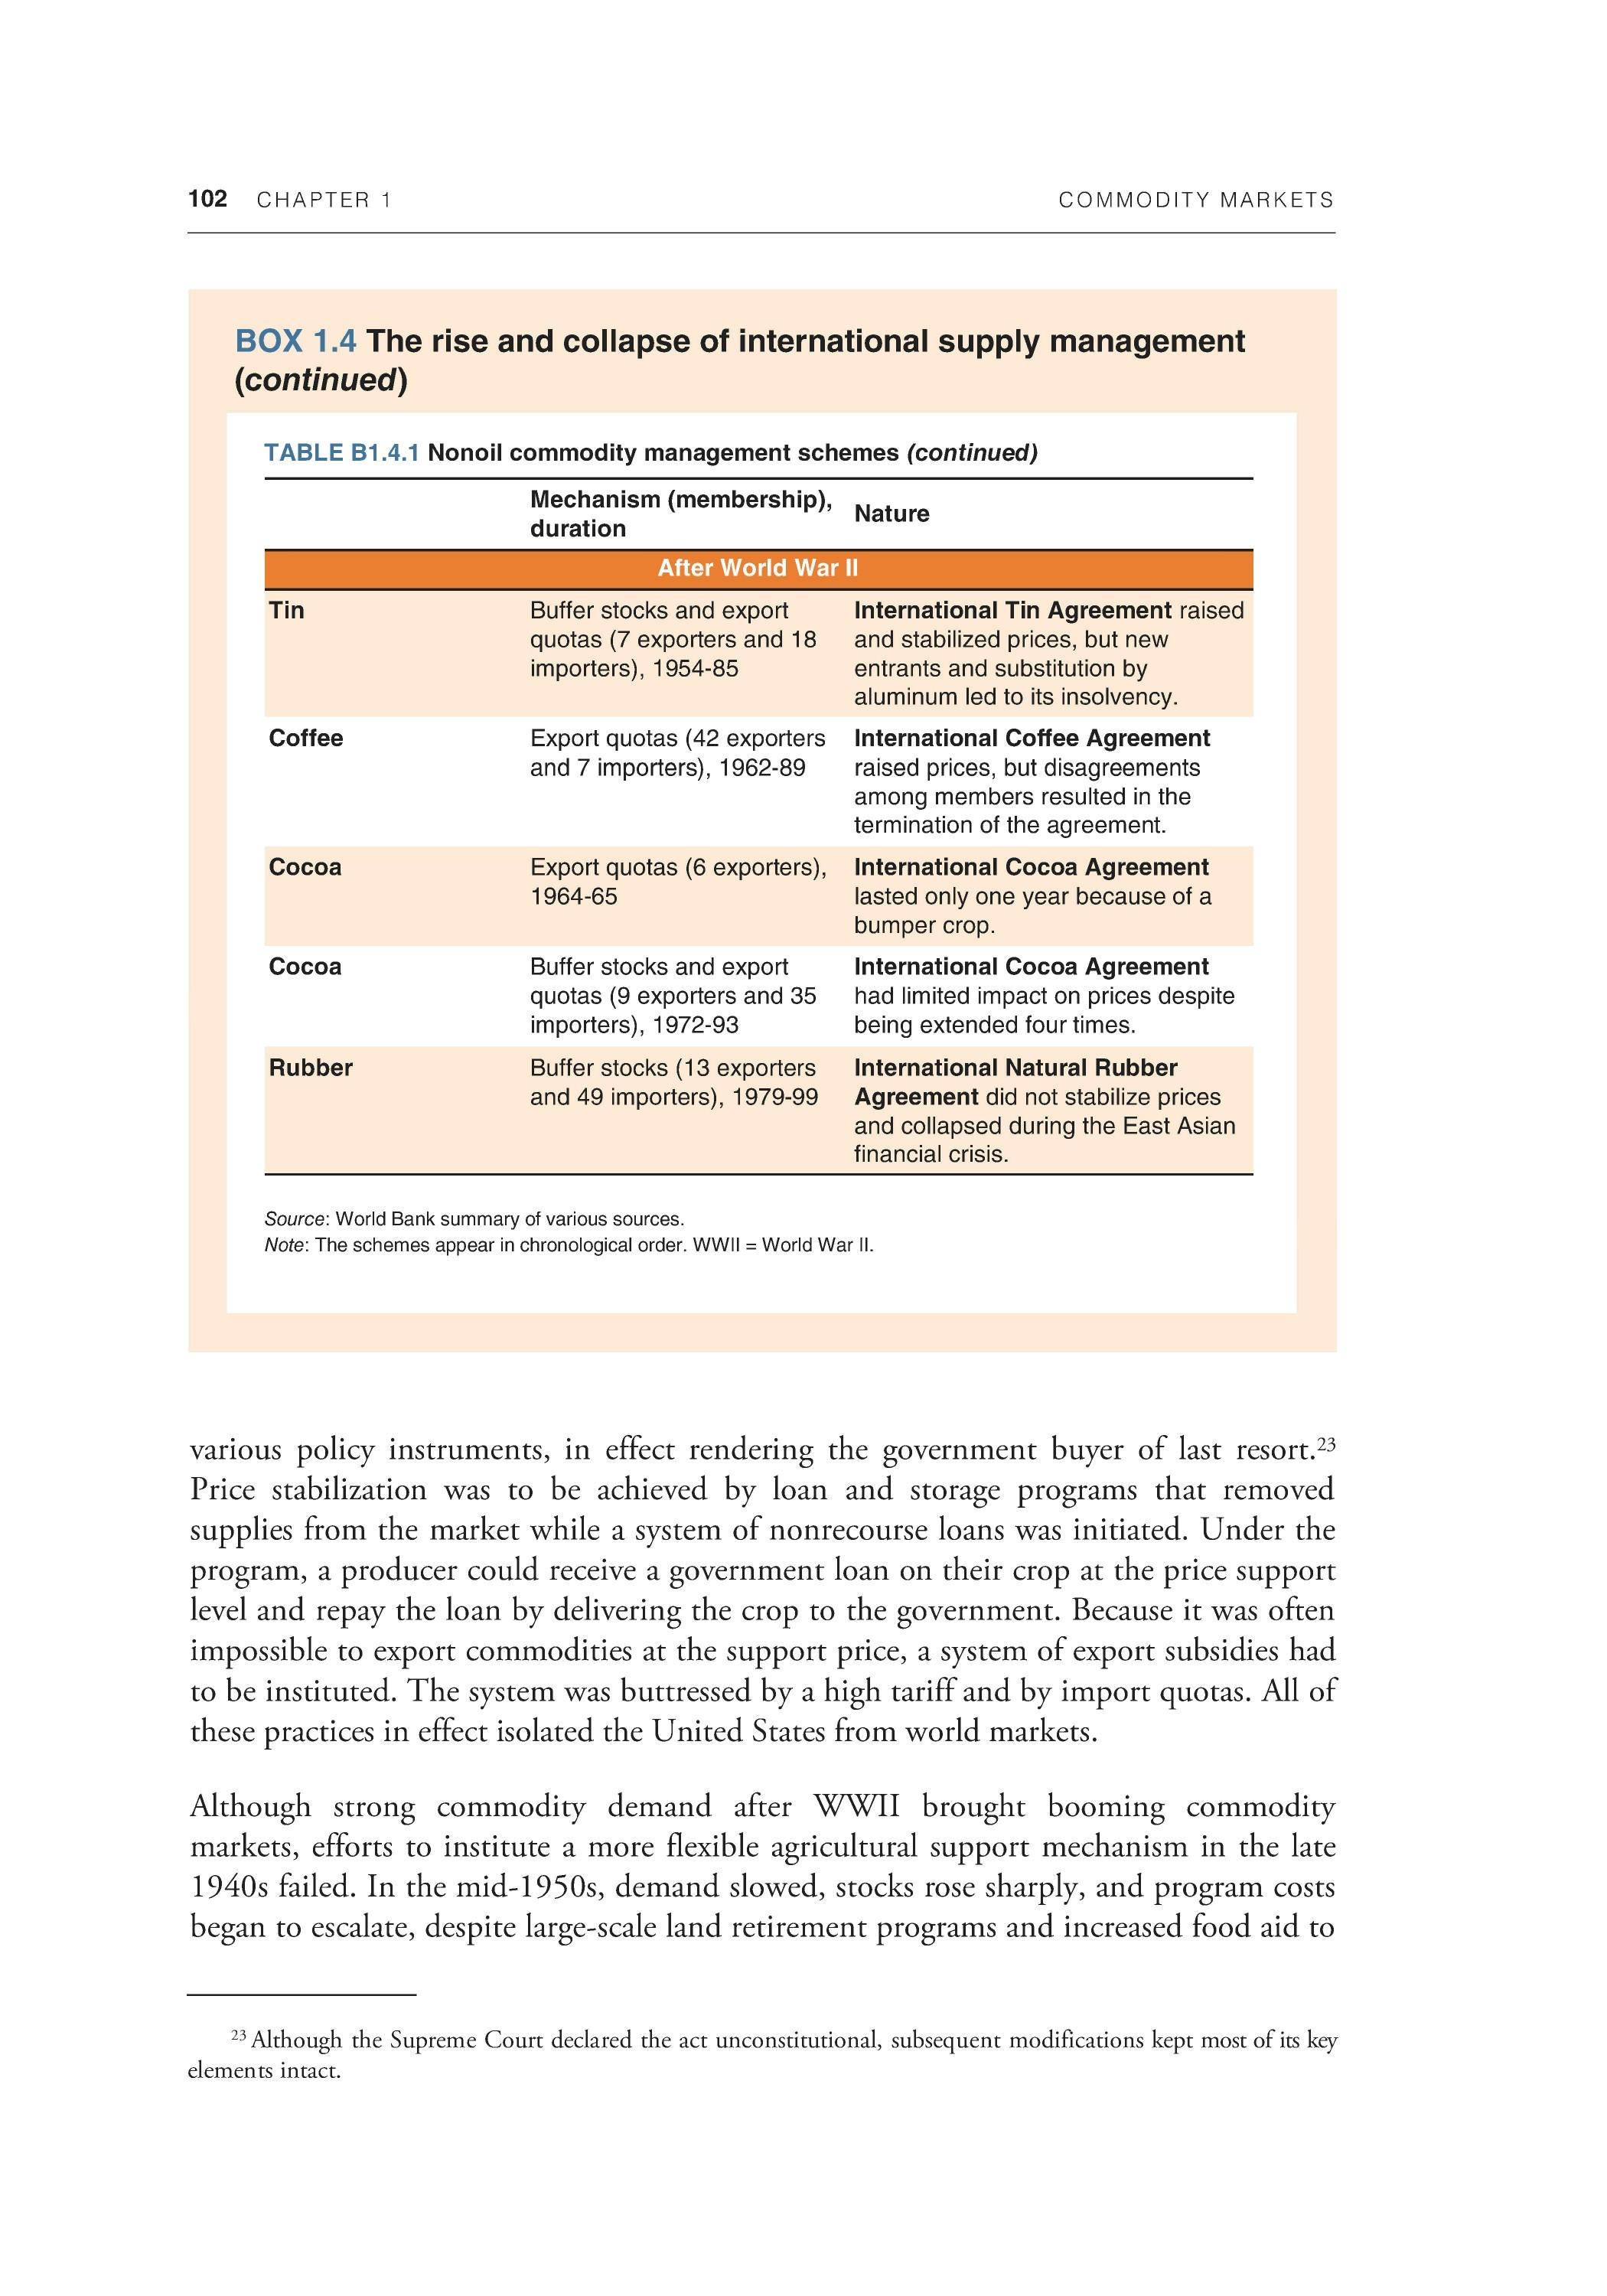
Export quotas (42 exporters and 7 importers), 1962-89
Export quotas (6 exporters), 1964-65
Buffer stocks and export quotas (9 exporters and 35 importers), 1972-93 Buffer stocks (13 exporters and 49 importers), 1979-99 International Tin Agreement raised and stabilized prices, but new entrants and substitution by aluminum led to its insolvency.
International Coffee Agreement
raised prices, but disagreements among members resulted in the termination of the agreement.
International Cocoa Agreement
lasted only one year because of a bumper crop.
International Cocoa Agreement
had limited impact on prices despite being extended four times.
International Natural Rubber
Agreement did not stabilize prices and collapsed during the East Asian financial crisis.
Source: World Bank summary of various sources. Note: The schemes appear in chronological order. WWII = World War II
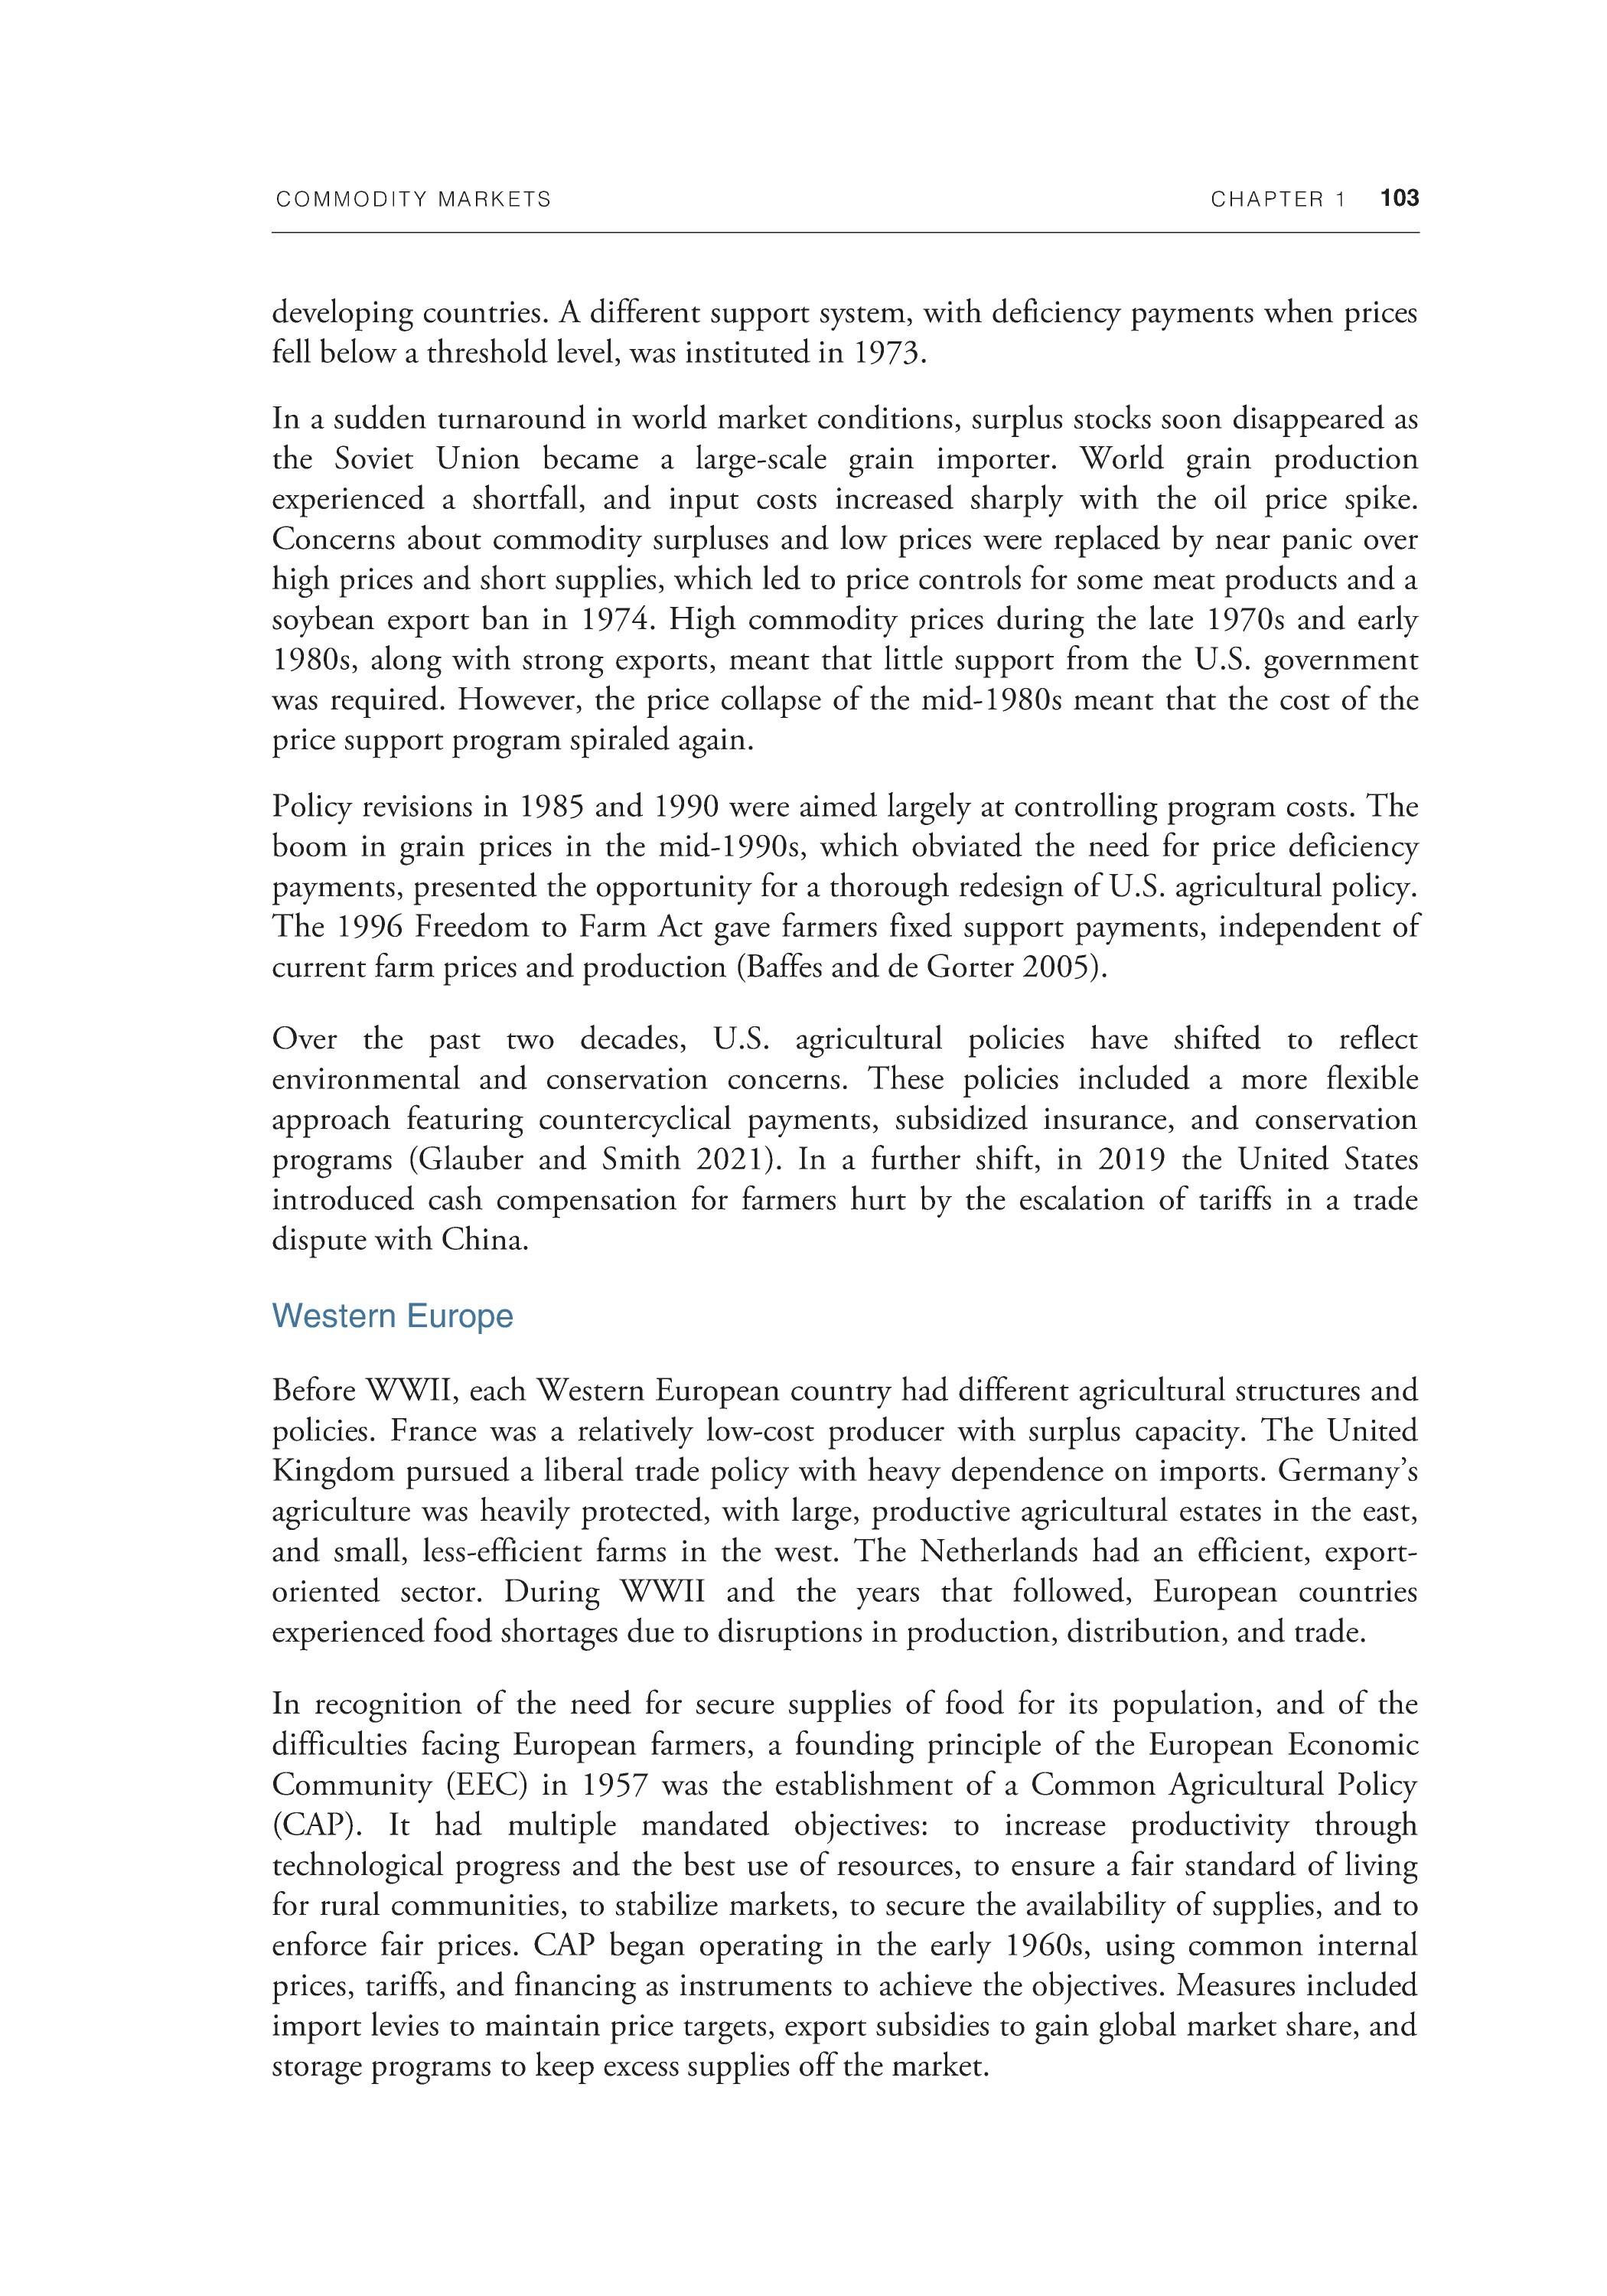
various policy instruments, in effect rendering the government buyer of last resort.
23
Price stabilization was to be achieved by loan and storage programs that removed supplies from the market while a system of nonrecourse loans was initiated. Under the program, a producer could receive a government loan on their crop at the price support level and repay the loan by delivering the crop to the government. Because it was often impossible to export commodities at the support price, a system of export subsidies had to be instituted. The system was buttressed by a high tariff and by import quotas. All of these practices in effect isolated the United States from world markets.
Although strong commodity demand after WWII brought booming commodity markets, efforts to institute a more flexible agricultural support mechanism in the late 1940s failed. In the mid-1950s, demand slowed, stocks rose sharply, and program costs began to escalate, despite large-scale land retirement programs and increased food aid to
23 Although the Supreme Court declared the act unconstitutional, subsequent modifications kept most of its key elements intact.
COMMODITY MARKETS CHAPTER 1 103
developing countries. A different support system, with deficiency payments when prices fell below a threshold level, was instituted in 1973.
In a sudden turnaround in world market conditions, surplus stocks soon disappeared as the Soviet Union became a large-scale grain importer. World grain production experienced a shortfall, and input costs increased sharply with the oil price spike. Concerns about commodity surpluses and low prices were replaced by near panic over high prices and short supplies, which led to price controls for some meat products and a soybean export ban in 1974. High commodity prices during the late 1970s and early 1980s, along with strong exports, meant that little support from the U.S. government was required. However, the price collapse of the mid-1980s meant that the cost of the price support program spiraled again.
Policy revisions in 1985 and 1990 were aimed largely at controlling program costs. The boom in grain prices in the mid-1990s, which obviated the need for price deficiency payments, presented the opportunity for a thorough redesign of U.S. agricultural policy. The 1996 Freedom to Farm Act gave farmers fixed support payments, independent of current farm prices and production (Baffes and de Gorter 2005).
Over the past two decades, U.S. agricultural policies have shifted to reflect environmental and conservation concerns. These policies included a more flexible approach featuring countercyclical payments, subsidized insurance, and conservation programs (Glauber and Smith 2021). In a further shift, in 2019 the United States introduced cash compensation for farmers hurt by the escalation of tariffs in a trade dispute with China.
Western Europe
Before WWII, each Western European country had different agricultural structures and policies. France was a relatively low-cost producer with surplus capacity. The United Kingdom pursued a liberal trade policy with heavy dependence on imports. Germany's agriculture was heavily protected, with large, productive agricultural estates in the east, and small, less-efficient farms in the west. The Netherlands had an efficient, exportoriented sector. During WWII and the years that followed, European countries experienced food shortages due to disruptions in production, distribution, and trade.
In recognition of the need for secure supplies of food for its population, and of the difficulties facing European farmers, a founding principle of the European Economic Community (EEC) in 1957 was the establishment of a Common Agricultural Policy (CAP). It had multiple mandated objectives: to increase productivity through technological progress and the best use of resources, to ensure a fair standard of living for rural communities, to stabilize markets, to secure the availability of supplies, and to enforce fair prices. CAP began operating in the early 1960s, using common internal prices, tariffs, and financing as instruments to achieve the objectives. Measures included import levies to maintain price targets, export subsidies to gain global market share, and storage programs to keep excess supplies off the market.
104 CHAPTER 1 COMMODITY MARKETS
When CAP was formulated, most member states were net importers of agricultural commodities. At first, CAP brought price stability in the internal market and posed no threat to external competitors. However, high and stable prices incentivized farmers to increase production, and within a decade the EEC went from being a major food importer to an exporter of grains, meats, sugar, and other food commodities.
Moreover, to maintain parity between farm incomes and rising urban incomes, the EEC had to repeatedly raise internal agricultural support prices (and thus widen the gaps between domestic and world prices). Doing so imposed increasingly heavy costs on members for commodity purchases, storage, and export subsidies. To sustain CAP objectives, the EEC looked to international commodity agreements to achieve higher and more stable world prices. This became the EEC's main negotiating objective in the Tokyo Round of General Agreement on Tariffs and Trade negotiations.
Declining world commodity prices during the 1980s, however, intensified the difficulties with CAP. Stocks rose at unsustainably high rates, costs skyrocketed—in the 1980s CAP accounted for about 60 percent of total EEC spending—and farm incomes still lagged those of nonfarm sectors. Reforms to CAP since then reduced the fiscal burden on the European Union (established in 1992) to 35 percent of the budget in 2020. Markets opened up, support prices were phased out, and European Union storage spending was capped. The reforms marked a policy reorientation—from price support per se toward supporting incomes of farmers directly, improving food quality, and encouraging environmental sustainability. For example, the European Union has measures to retire farmland in favor of afforestation. Policy reforms in Western Europe combined with reforms in the United States and other AEs have resulted in a decline in overall agricultural support to Organisation for Economic Co-operation and Development countries by more than one-third during the past two decades (figure 1.16).

Japan and East Asia
Before WWII, Japan depended on imports from China, Korea, and elsewhere in the region to supplement domestic food production. Following WWII, the main government objectives were a high degree of self-sufficiency in rice and maintaining farmer incomes. Key aspects of the policies included support of an extensive system of cooperatives for small farmers and the establishment of state trading agencies for imports. Marketing of basic commodities—including rice, wheat, beef, and dairy products, but excluding other commodities such as soybeans and coarse grains—was another feature. Domestic prices were protected by import quotas.
The commodity price boom of the 1970s along with the soybean export embargo by the United States reinforced the desire for self-sufficiency in food commodities and fueled Japan's interest in international agreements to stabilize agricultural commodity prices and to guarantee reliable supplies of imports. Other East Asian countries, including the Republic of Korea, also adopted policies that placed a heavy emphasis on high domestic protection and extensive use of state trading agencies.
COMMODITY MARKETS CHAPTER 1 105
FIGURE 1.16 Developments since 2000
Despite high food commodity prices during 2020-22, world food markets are much better supplied than in the early 2000s, according to the aggregate stocks-to-use ratio, a measure of demand relative to supply. Input costs, however, have risen, posing important risks if such increases become permanent. On the technology front, biotech commodities have been used by both advanced economies and EMDEs, with considerable productivity gains for the latter. Most of global cotton, maize, and soybean production comes from biotech varieties. Domestic support to agriculture by OECD countries has declined during the past two decades. On the demand side, food marketed through formal channels, such as supermarkets, has increased in most regions, including SubSaharan Africa. However, challenges regarding undernourishment remain, especially following COVID-19.
A. Biotechnology use in selected EMDEs in 2018
B. Biotechnology use in selected advanced economies in 2018
C. Agricultural support in OECD countries D. Undernourishment
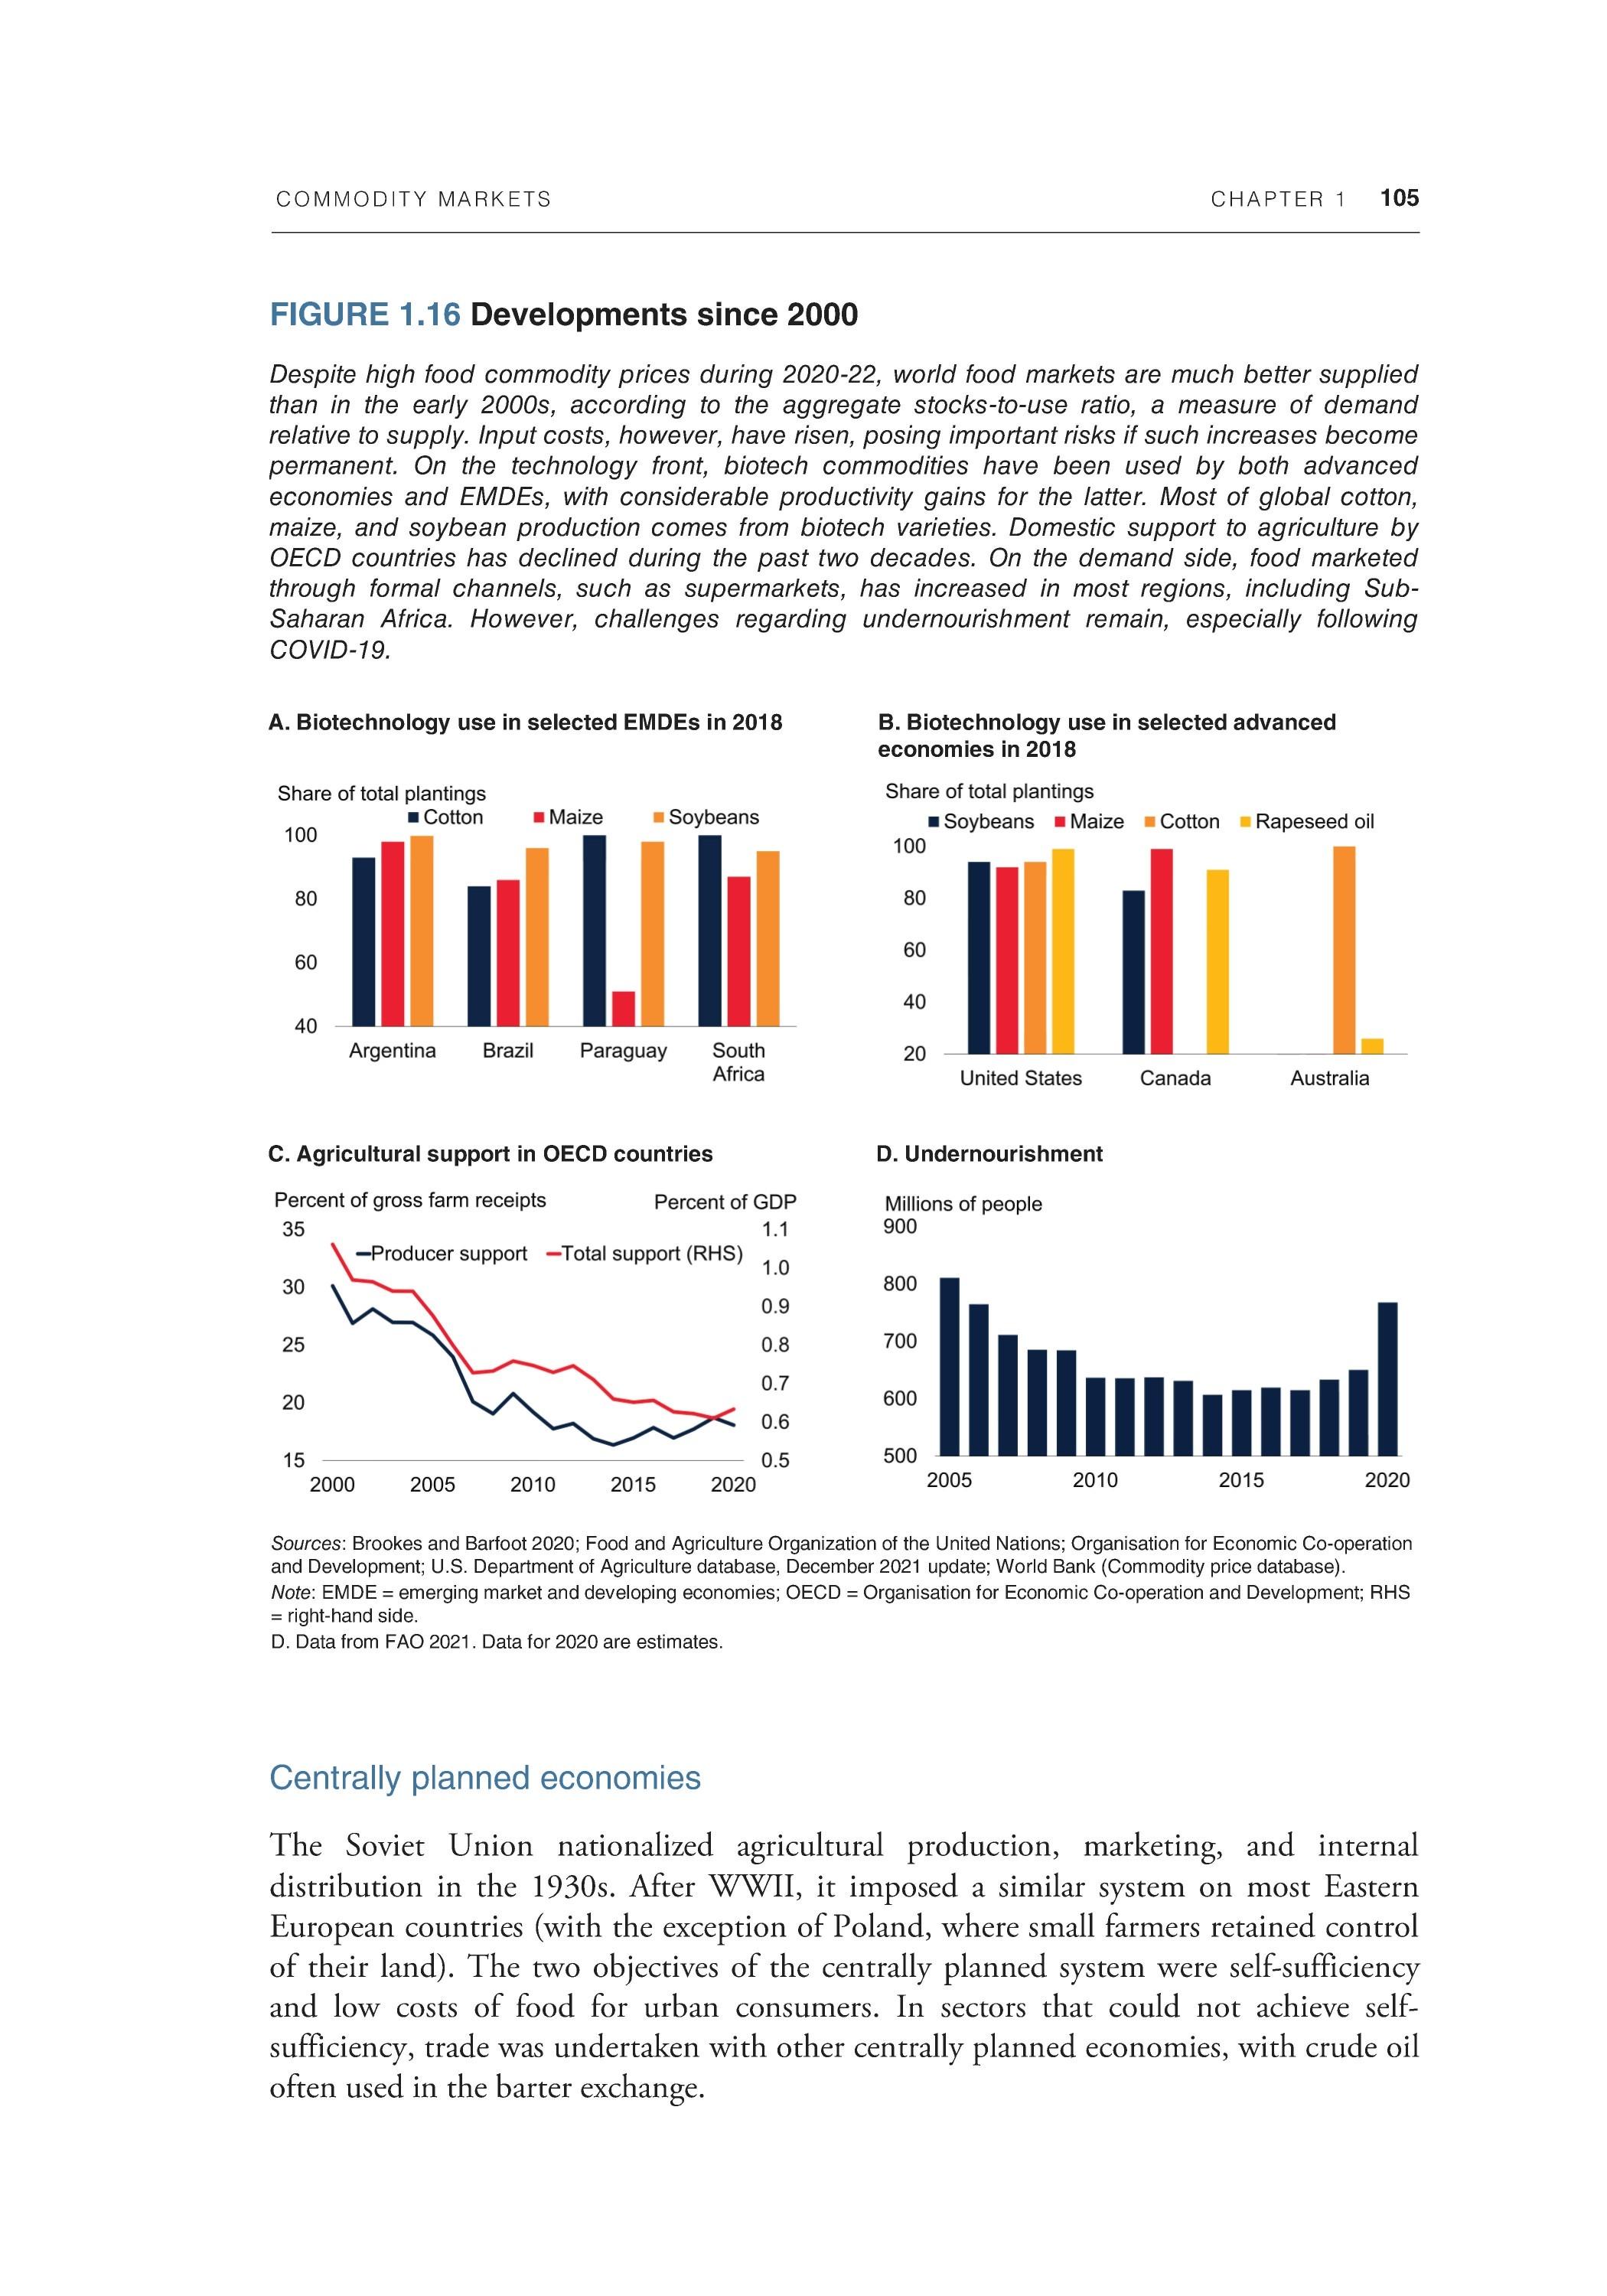
Sources: Brookes and Barfoot 2020; Food and Agriculture Organization of the United Nations; Organisation for Economic Co-operation and Development; U.S. Department of Agriculture database, December 2021 update; World Bank (Commodity price database). Note: EMDE = emerging market and developing economies; OECD = Organisation for Economic Co-operation and Development; RHS = right-hand side. D. Data from FAO 2021. Data for 2020 are estimates.
Centrally planned economies
The Soviet Union nationalized agricultural production, marketing, and internal distribution in the 1930s. After WWII, it imposed a similar system on most Eastern European countries (with the exception of Poland, where small farmers retained control of their land). The two objectives of the centrally planned system were self-sufficiency and low costs of food for urban consumers. In sectors that could not achieve selfsufficiency, trade was undertaken with other centrally planned economies, with crude oil often used in the barter exchange.
106 CHAPTER 1 COMMODITY MARKETS
These policies were not successful. Inefficient production and marketing systems could not produce adequate supplies to meet consumer demand at artificially low prices. Consumption was rationed because of severe shortages, ultimately forcing the Soviet Union and several Eastern European countries to import grains and meats in the early 1970s.
Large and erratic Soviet imports had a destabilizing effect on international commodity markets during the 1970s and 1980s. In 1975, the United States signed an agreement with the Soviet Union under which the latter agreed to import at least 6 million metric tons of grains annually. The Soviet Union also agreed not to exceed a maximum amount, although domestic U.S. policies prevented any upper limit from being enforced. In the early 1980s, in response to the Soviet invasion of Afghanistan, the United States imposed an embargo on grain exports to the Soviet Union, triggering a collapse of grain prices in the global market.
Although the Soviet Union was producing large amounts of wheat before 1990, it was an inefficient producer. It relied on imports in the 1980s for grains to feed its livestock sector, which was growing rapidly under the incentive of heavy subsidies.24 The breakup of the Soviet Union in 1991, and the transition to market economies, led to a major liberalization of agriculture, the removal of livestock subsidies, and substantial improvements in productivity. Russia, along with Kazakhstan and Ukraine, became a key player in the global grain market.
Other centrally planned economies, notably China, began importing grains in the 1970s to offset domestic shortfalls. In the late 1970s, China began liberalizing its domestic commodity markets, albeit in a gradual manner. Initial reforms included the right to trade surplus production (Huang and Rozelle 2006). More reforms followed record production growth in the mid-1980s, including a reduction of production quotas (implying that farmers could sell more in open markets). New reforms were launched in the early 2000s, including the removal of all marketing restrictions and the elimination of government intervention in grain prices (Huang, Rozelle, and Chang 2004).
Agriculture policies of other EMDEs
Government intervention in agriculture in EMDEs has had multiple objectives. They include support for rural incomes, protection of domestic output (or self-sufficiency), maintenance of secure supplies, low prices of basic foods, and conservation of the environment. Managing the trade-offs between these objectives is a difficult task, fraught with political and social pitfalls. For reasons of economic efficiency, economists often advocate the replacement of distortionary subsidies and price controls with direct income supplements to farmers and low-income households. However, attempts to enact such proposals generally meet overwhelming opposition from interested parties (through regular political channels and through street demonstrations). Another
24 During 1970-90, meat production in the Soviet Union increased by two-thirds, and by the end of this period its per capita meat consumption was on par with that of AEs (Liefert 2002).
COMMODITY MARKETS CHAPTER 1 107
challenge is that governments often do not have the administrative capacity to deliver individualized support payments to targeted households in countries where a large proportion of the population works in the informal sector (Ohnsorge, Okawa, and Yu 2021). In these circumstances, government welfare payments may not be a feasible alternative to subsidized price-controlled food, such as bread or flour provided to poor people from a government outlet.
Some EMDEs had adopted policies aimed at shifting resources from raw materials and agriculture to processing and manufacturing. This industrialization-focused approach was based on the observation that rising incomes tend to boost demand for manufactured goods and services while having noticeably less impact on demand for primary products. That, in turn, would have a negative impact on primary commodity prices relative to manufacturing goods (Kindleberger 1943; Prebisch 1950; Singer 1950; see also chapter 2). This view dominated the development agenda of the 1950s and 1960s and set the stage for the widespread industrialization policies pursued by lowincome countries in the following decades. Import substitution, whereby domestic manufacturing is heavily protected from foreign competition, was a favored approach for promoting industrialization. At the same time, government parastatals assumed sole authority to manage all aspects of domestic commodity markets, including marketing, trade, provision of inputs, and exports—at considerable cost to these economies. Many EMDEs assumed large external debts to finance industrialization projects.
Numerous authors warned against such interventions from the outset. Johnson (1947) argued that the agricultural sector should not be subjected to interventions. Friedman (1954) disputed the benefits of managing income variability for agricultural producers. Johnston and Mellor (1961) criticized the pro-urban policies followed by many developing countries in pursuit of the industrialization agenda.
In the end, poor results undermined the arguments for industrialization and importsubstitution policies, largely because programs were poorly conceived and managed. Government interventions in Africa have been found to amount to expropriation from agricultural producers for the benefit of urban populations (Bates 1981). More fundamentally, the strategic decisions of government planners were undone by the realities of world markets. Lai (1985) criticized the rigid approach to planning (where governments actively dictate economic decision-making) and advocated for more reliance on the price mechanism for allocating resources. The industrialization programs were ill-prepared to adapt to changes in technology and patterns of demand—or to the policy changes of foreign governments. Many authors highlighted the growing distortions associated with interventions in commodity markets (for example, Krueger, Schiff, and Valdes 1992; World Bank 1986). Through the commodities price boom of the 1970s, rising revenues and heavy borrowing kept programs afloat, but the bust of the early 1980s and the following EMDE debt crisis fully exposed their deficiencies.
On a practical level, international organizations pushed for market-oriented reforms as a condition of financial assistance. The World Bank introduced Structural Adjustment Loans in the early 1980s to assist EMDEs with debt issues caused by poor fiscal
108 CHAPTER 1 COMMODITY MARKETS
management. The associated conditions included reduced intervention by the state along with a reduction of subsidies and trade barriers. Some authors, however, have questioned the effectiveness of the adjustment programs (for example, Harrigan and Mosley 2007). Reappraisal of conditionality in World Bank and International Monetary Fund lending in the 2000s has led to less prescriptive programs, with more focus on results and the specific circumstances facing borrowing countries (Koeberle et al. 2005).
Conclusion
The chapter has reviewed developments in three commodity sectors—energy, metals, and agriculture—over the past century. It has looked at demand patterns, the impact of technology on supply, and the evolution of policy.
On the demand side, consumption of energy and metals has expanded more rapidly than world population and per capita income in recent decades. For agricultural commodities, demand has expanded at about the same pace, especially that of basic foodstuffs. Over the past half century, the location of demand growth for all commodities has shifted from AEs toward EMDEs, with a large shift in the consumption of primary products to China. Similarly, production of some commodities, especially refined metals, has also shifted to EMDEs. Technological improvements have taken place in all sectors, at varying rates, and with different effects both for consumption and production. The shale revolution, for example, upended oil and natural gas market dynamics in the 2010s. Among metals, innovation has led to widespread substitution (notably aluminum for other metals) and to the discovery and development of new reserves. In addition, the technology behind the energy transition will increasingly drive demand for metals. Spectacular increases in agricultural productivity followed the development of hybrid grains in the 1930s and the Green Revolution of the 1960s-70s. Advances in technology have also encouraged consumption via the creation of new products and thus new uses of commodities.
Commodity prices have always been volatile. Over the past half century, oil prices have seen large fluctuations following shifts in strategy by OPEC and the emergence of new sources of oil. Metals prices have seen prolonged cycles caused mainly by macroeconomic developments in the main consuming markets. Agricultural prices on the world market have followed a downward path in real terms, mostly because of the large increases in agricultural productivity. Volatility around the downtrend has been caused by geopolitical factors (such as intermittent grain purchases by the Soviet Union in the 1970s) and variations in harvests.
Policies at the national level have had multiple objectives, for example, stabilizing prices, protecting domestic industries, ensuring secure supplies, and raising rural incomes. Policy tools have included border policies (such as export subsidies, export or import bans, and tariffs) and internal policies (such as subsidies, taxes, and other types of support). Policies at the international level, such as international commodity agreements, have generally been directed toward stabilizing world markets and prices. They have
COMMODITY MARKETS CHAPTER 1 109
included agreements to limit output, such as production quotas. In practice, however, policies have had distortionary and, in the long run, destabilizing effects on commodity markets. For example, in the oil market, the changing strategies of OPEC have caused steep jumps and drops in prices. And the long-run outcome of agricultural support programs, despite their intention, has generally been excess supplies and stockpiling, and heightened downward pressure on prices.
References
Akiyama, T., J. Baffes, D. F. Larson, and P. Varangis. 2003. "Commodity Market Reform in Africa: Some Recent Experience." Economic Systems 27 (1): 83-115.
Akiyama, T., and P. Varangis. 1990. "The Impact of the International Coffee Agreement on Producing Countries." World Bank Economic Review 4 (2): 157-73.
Alexander, P., C. Brown, A. Arneth, J. Finnigan, and M. D. A. Rounsevell. 2016. "Human Appropriation of Land for Food: The Role of Diet." Global Environmental Change 41 (November): 88-98.
Armstrong, R. 1859. High-Speed Steam Navigation. London: E. & N. F. Spon.
Astier, J. 2015. "Evolution of Iron Ore Prices." Mineral Economics 28: 3-9.
Baffes, J. 2005. "History of Cotton Trade: From History to the Twentieth Century." In Cotton Trading Manual, edited by the Secretariat of the International Cotton Advisory Committee. Cambridge, U.K.: Woodhead Publishing Limited.
Baffes, J. 2012. "How Africa Missed the Cotton Revolution." In African Agricultural Reforms: The Role of Consensus and Institutions, edited by M.A. Aksoy, 125-50. Washington, DC: World Bank.
Baffes, J., and H. de Gorter. 2005. "Experience with Decoupling Agricultural Support." In Global Agricultural Trade and Developing Countries, edited by M. A. Aksoy and J. C. Beghin, 75-90. Washington, DC: World Bank.
Baffes, J., and A. Kabundi. 2021. "Commodity Price Shocks: Order Within Chaos?" Policy Research Working Paper 9792, World Bank, Washington, DC.
Baffes, J., A. Kabundi, and P. Nagle. 2022. "The Role of Income and Substitution in Commodity Demand." Oxford Economic Paper si ^ (2): 498-522.
Baffes, J., A. Kabundi, P. Nagle, and F. Ohnsorge. 2018. "The Role of Major Emerging Markets in Global Commodity Demand." Policy Research Working Paper 8495, World Bank, Washington, DC.
Baffes, J., and I. Kaltsas. 2004. "Cotton Futures Exchanges: Their Past, Their Present, and Their Future." Quarterly Journal of International Agriculture^ (2): 153-76.
110 CHAPTER 1 COMMODITY MARKETS
Baffes, J., A. Kose, F. Ohnsorge, and M. Stocker. 2015. "The Great Plunge in Oil Prices: Causes, Consequences, and Policy Responses." Policy Research Note 15/01, World Bank, Washington, DC.
Baffes, J., and J. Meerman. 1998. "From Prices to Incomes: Agricultural Subsidization without Protection?" World Bank Research Observer 13 (2): 191-211.
Baldwin, W. 1983. The World Tin Market: Political Pricing and Economic Competition. Durham, NC: Duke University Press.
Baranyai, L. 1959. "History of Commodity Agreements." Report No. EC-74b, World Bank, Washington, DC.
Barsky, R., C. Epstein, A. Lafont-Meuller, and Y. Yoo. 2021. "What Drives Gold Prices." Chicago Fed Letter 464, November 2021. https://www.chicagofed.org/publications/chicagofed-letter/2021/464.
Bates, R. 1981. Markets and States in Tropical Africa: The Political Basis of Agricultural Policies. Berkeley, CA: University of California Press.
Baumeister, C., and L. Kilian. 2016. "Forty Years of Oil Price Fluctuations: Why the Price of Oil May Still Surprise Us." Journal of Economic Perspectives 30 (1): 139-60.
Baumeister, C., and G. Peersman. 2013. "The Role of Time-Varying Price Elasticities in Accounting for Volatility Changes in the Crude Oil Market." Journal of Applied Econometrics 28 (7): 1087-109.
Bertilorenzi, M. 2013. "From Patents to Stock Buffering Schemes: The Historical Evolution of the International Aluminum Cartels (1886-1945)." Revue economique 64 (6): 1145-69.
Bertilorenzi, M. 2016. The International Aluminum Cartel 1886-1973. Routledge: New York.
Birol, F., and D. Malpass. 2021. "It's Critical to Tackle Coal Emissions." Voices (blog), October 8, 2021. https://blogs.worldbank.org/voices/its-critical-tackle-coal-emissions.
Blau, G. 1946. "Wool in the World Economy." Journal of the Royal Statistical Society 109 (3): 179-242.
Boustan, L. P., D. Bunten, and O. Hearey. 2013. "Urbanization in the United States, 18002000." NBER Working Paper 19041, National Bureau of Economic Research, Cambridge, MA.
Bratter, H. M. 1938. "The Silver Episode: I." Journal of Political Economy 46 (5): 601-52.
Briggs, A. 1947. "The Framework of the Wool Control." Oxford Economic Papers 8 (November): 18-45.
Brookes, G., and P. Barfoot. 2020. GM Crops: Global Socio-Economic and Environmental Impacts 1996-2020. Dorchester, U.K.: PG Economics Ltd.
Carl ton, D. W. 1984. "Futures Markets: Their Purpose, Their History, Their Growth, Their Successes and Failures. " Journal of Futures Markets ^ (3): 237-71.
COMMODITY MARKETS CHAPTER 1 111
Chandra, V. 2020. "How Is Natural Gas Priced?" Geo ExPro 17 (6): 42-45.
Chandrasekhar, S. 1989. "Cartel in a Can: The Financial Collapse of the International Tin Council." Northwestern Journal of International Law and Business 10 (2): 308-32.
Chapoto, A., and T. S. Jayne. 2009. "Effects of Maize Marketing and Trade Policy on Price Unpredictability in Zambia." Food Security Collaborative Working Papers 54499, Michigan State University.
Clark, G., and D. Jacks. 2007. "Coal and the Industrial Revolution, 1700-1869." European Review of Economic History 11 (1): 39-72.
Clifton, E. V. 1985. "The Currency Futures Market and Interbank Foreign Exchange Trading." Journal of Futures Markets^ (3): 375-85.
Cole, R. 1981. The Japanese Automotive Industry. Model and Challenge for the Future? Ann Arbor, MI: University of Michigan Center for Japanese Studies.
Colen, L., P. C. Melo, Y. Abdul-Salam, D. Roberts, S. Mary, and S. Gomez Y Paloma. 2018. "Income Elasticities for Food, Calories and Nutrients Across Africa: A Meta-Analysis." Food Policy 77 (May): 116-32.
Colombo, S., M. El Harrak, and N. Sartori. 2016. The Future of Natural Gas: Markets and Geopolitics. The Netherlands: Istituto Affari Internazionali, OCP Policy Center, and Lenthe Publishers/European Energy Review.
Cooper, R. and R. Lawrence. 1975. "The 1972-75 Commodity Boom." Brookings Papers on Economic Activity 6 (3): 671-724.
Cooper, R. N. 1982. "The Gold Standard: Historical Facts and Figures and Future Prospects." Brookings Papers on Economic Activity 1982 (1): 1-56.
Crow, J. F. 1998. "90 Years Ago: The Beginning of Hybrid Maize." Genetics 148 (1): 92328.
Cuddington, J., and D. Jerrett. 2008. "Super Cycles in Real Metal Prices? IMF Staff Papers 55 (4): 541-65.
Davis, J. S. 1946. "Experience under Intergovernmental Commodity Agreements." Journal of Political Economy 54 (3): 193-220.
Dumbell, S. 1923. "Early Liverpool Cotton Imports and the Organization of the Cotton Markets in the Eighteenth Century." Economic Journal33 (131): 363-73.
EIA (U.S. Energy Information Administration). 2012. "Crude Oils Have Different Quality Characteristics." Today in Energy, July 16, 2012. https://www.eia.gov/todayinenergy/ detail.php?id=7110.
EIA (U.S. Energy Information Administration). 2014. "Global Natural Gas Markets Overview: A Report Prepared by Leidos, Inc., Under Contract to EIA." EIA Working Paper, U.S. Energy Information Administration, Washington, DC.
112 CHAPTER 1 COMMODITY MARKETS
EIA (U.S. Energy Information Administration). 2018. "The United States Is Now the Largest Global Crude Oil Producer." Today in Energy, September 12, 2018. https:// www.eia.gov/todayinenergy/detail. php?id=37053.
EIA (U.S. Energy Information Administration). 2020. "More Than 100 Coal-Fired Plants Have Been Replaced or Converted to Natural Gas since 2010." Today in Energy, August 5, 2020. https://www.eia.gov/todayinenergy/detail.php?id=44636.
EIA (U.S. Energy Information Administration). 2021. Annual Coal Report 2020. Washington, DC: U.S. Energy Information Administration.
Eichengreen, B., and M. Uzan. 1992. "The Marshall Plan: Economic Effects and Implications for Eastern Europe and USSR." Economic Policy 7 (14): 13-75.
Ellerman, A. 1995. "The World Price of Coal." Energy Policy 23 (6): 499-506.
EPA (U.S. Environmental Protection Agency). 2007. "Summary of the Energy Independence and Security Act; Public Law 110-140." U.S. Environmental Protection Agency, Washington, DC. https ://www. epa.gov/laws-regulations/summary-energy-inde pendence-and-security-act.
Erhlich, L. G. 2018. "What Drives Nickel Prices—A Structural VAR Approach." Research Paper 186, Hamburg Institute of International Economics.
Erten, B., and J. A. Ocampo. 2013. "Super Cycles of Commodity Prices since the Midnineteenth Century." World Development 44 (C): 14-30.
Evans, C., and O. Saunders. 2015. "A World of Copper: Globalizing the Industrial Revolution, 1830-70." Journal of Global History 10 (1): 3-26.
European Commission. 2009. "Directive 2009/73/EC of the European Parliament and of the Council of 13 July 2009 Concerning Common Rules for the Internal Market in Natural Gas and Repealing Directive 2003/55/EC." European Commission, Brussels.
European Parliament. 2009. "Directive 2009/28/EC of the European Parliament and of the Council of 23 April 2009, on the Promotion of the Use of Energy from Renewable Sources." European Commission, Brussels. https://eur-lex.europa.eu/legal-content/EN/TXT/?uri=CE LEX%3A02009L0028-20151005.
Fakhri, M. 2011. "The 1937 International Sugar Agreement: Neo-Classical Cuba and Economic Aspects of the League of Nations." Leiden Journal of International Law 24 (4): 899-922.
FAO (Food and Agriculture Organization of the United Nations). 2021. 77?^ State of Food Security and Nutrition in the World: Transforming Food Systems for Food Security. Improved Nutrition, and Affordable Healthy Diets for All. Rome: FAO.
Friedman, M. 1954. "The Reduction of Fluctuations in the Incomes of Primary Producers: A Critical Comment." Economic Journal64 (256): 698-703.
Friedman, M. 1992. "Franklin D. Roosevelt, Silver, and China." Journal of Political Economy 100(1): 62-83.
COMMODITY MARKETS CHAPTER 1 113
Gamson, W. A., and A. Modigliani. 1989. "Media Discourse and Public Opinion on Nuclear Power: A Constructionist Approach." American Journal of Sociology 95 (1): 1-37.
Gardner, B. 1987. "Causes of Commodity Farm Programs." Journal of Political Economy 95 (2): 290-310.
Gately, D. 1986. "Lessons from the 1986 Oil Price Collapse." Brookings Papers on Economic Activity 2 (1986): 237-84.
George, M. W. 2012. Metals Prices in the United States until 2010. Reston, VA: U.S. Geological Survey.
Gibson-Jarvie, R. 1983. The London Metal Exchange: A Commodity Market. Cambridge, U.K.: Woodhead-Faulkner.
Gilbert, C. L. 1996. "International Commodity Agreements: An Obituary." World Development24 (1): 1-19.
Gilbert, C. L. 2011. "International Agreements for Commodity Price Stabilization: An Assessment." OECD Food, Agriculture and Fisheries Paper 53, Organisation for Economic Co-operation and Development, Paris.
Glauber, J., and V. Smith. 2021. "Trends in Agricultural Policy since 2000 and Implications for the Next Twenty Years." EuroChoices 20 (2): 58-63.
Glesinger, E. 1945. "Forest Products and the World Economy." American Economic Review, Papers and Proceedings 35 (2): 120-29.
Goss, B. A., and B. S. Yamey. 1978. The Economics of Futures Trading: Readings Selected, Edited and Introduced. London: Macmillan Press.
Grilli, E. R., B. B. Agostini, and M. J. Hooft-Welvaars. 1980. The World Rubber Economy: Structure, Changes, and Prospects. Baltimore, MD: John Hopkins University Press.
Guzman, J. I. 2018. "The International Copper Cartel, 1935-1939: The Good Cartel?" Miner Econ 3\ (1): 113-25.
Hagelberg, G. B., and A. C. Hannah. 1994. "The Quest for Order: A Review of International Sugar Agreement." Food Policy 19 (1): 17-29.
Hamilton, J. 2009. "Causes and Consequences of the Oil Shock of 2007-08." NBER Working Paper 15002, National Bureau of Economic Research, Cambridge, MA.
Hamilton, J. 2010. "Historical Oil Shocks." In Routledge Handbook of Major Events in Economic History, edited by R. E. Parker and R. Whaples. New York: Routledge Taylor and Francis Group.
Harrigan, J., and P. Mosley. 2007. "Evaluating the Impact of World Bank Structural Adjustment Lending: 1980-87." Journal of Development Studies 27 (3): 63-94.
Heap, A. 2005. "China—The Engine of a Commodities Super Cycle." Citigroup Global Markets.
114 CHAPTER 1 COMMODITY MARKETS
Herfmdahl, O. 1959. Copper Costs and Prices: 1870-1957. Baltimore, MD: John Hopkins University Press.
Hieronymus, T. A. 1977. Economics of Futures Trading for Commercial and Personal Profit. New York: Commodity Research Bureau.
Honma, M., and Y. Hayami. 1988. "In Search of Agricultural Policy Reform in Japan." European Review of Agricultural Economics 15 (4): 367-95.
Huang, J., and S. Rozelle. 2006. "The Emergence of Agricultural Commodity Markets in China." China Economic Review 17 (2006): 266-80.
Huang, J., S. Rozelle, and M. Chang. 2004. "The Nature of Distortions to Agricultural Incentives in China and Implications of WTO Accession." World Bank Economic Review 18 (1): 59-84.
Hutchinson, L. 1909. "Coffee 'Valorization' in Brazil." Quarterly Journal of Economics 23 (3): 528-35.
ICE (Intercontinental Exchange). 2021. Global Crude Benchmarks: Brent Sets the Standard. Atlanta, GA: Intercontinental Exchange.
IEA (International Energy Agency). 1979. "Principles for IEA Action on Coal: Decision on Procedures for Review of IEA Countries' Coal Policies." Press release, International Energy Agency, Paris.
IEA (International Energy Agency). 2013. "Developing a Natural Gas Trading Hub in Asia." IEA Country Report, International Energy Agency, Paris.
IEA (International Energy Agency). 2019. "The Role of Gas in Today's Energy Transitions." World Energy Outlook special report, International Energy Agency, Paris.
IEA (International Energy Agency). 202la. "Gas Market Report: Ql 2021." International Energy Agency, Paris.
IEA (International Energy Agency). 202Ib. Net Zero by 2050. A Roadmap for the Global Energy Sector. Paris: International Energy Agency.
IFC (International Finance Corporation). 2019. "Natural Gas and the Clean Energy Transition." EM Compass Note 65, International Finance Corporation, Washington, DC.
Ilkenberry, G. 1988. Reasons of State: Oil Politics and the Capacities of American Government. Ithaca, NY: Cornell University Press.
IMF (International Monetary Fund). 2015. World Economic Outlook: Adjusting to Lower Commodity Prices. October. Washington, DC: International Monetary Fund.
IRENA (International Renewable Energy Agency). 2020. Renewable Power Generation Costs in 2019. Abu Dhabi: International Renewable Energy Agency.
Irwin, D. 1998. "The Smoot-Hawley Tariff: A Quantitative Assessment." Review of Economics and Statistics 80 (2): 326-32.
COMMODITY MARKETS CHAPTER 1 115
Irwin, D. A. 2012. Trade Policy Disaster: Lessons from the 1930s. Cambridge, MA: MIT Press.
Ivanic, M., and W. Martin. 2008. "Implications of Higher Global Food Prices for Poverty in Low-Income Countries." Policy Research Working Paper 4594, World Bank, Washington, DC.
Ivanic, M., and W. Martin. 2014. "Implications of Domestic Price Insulation for Global Food Price Behavior." Journal of 'InternationalMoney and Finance 42 (1): 272-88.
Jacks, D. 2013. "From Boom to Bust: A Typology of Real Commodity Prices in the Long Run." NBER Working Paper 18874, National Bureau of Economic Research, Cambridge, MA.
Jacks, D. S., and M. Stuermer. 2021. "Dry Bulk Shipping and the Evolution of Maritime Transport Costs, 1850-2020." Australian Economic History Review 61 (2): 204-27.
Jarvis, S., O. Deschenes, and A. Jha. 2019. "The Private and External Costs of Germany's Nuclear Phase-Out." NBER Working Paper 26598, National Bureau of Economic Research, Cambridge, MA.
Johnson, D. G. 1947. Forward Prices for Agriculture. Chicago: University of Chicago Press.
Johnston, B., and J. Mellor 1961. "The Role of Agriculture in Economic Development." American Economic Review 51 (4): 566-93.
Kabundi, A., and F. Ohnsorge. 2020. "Implications of Cheap Oil for Emerging Markets." Policy Research Working Paper 9403, World Bank, Washington, DC.
Kaufmann, R. K., S. Dees, P. Karadeloglou, and M. Sanchez. 2004. "Does OPEC Matter? An Econometric Analysis of Oil Prices." Energy Journal 25 (4): 67-90.
Kearney, J. 2010. "Food Consumption Trends and Drivers." Philosophical Transactions of the Royal Society B 365: 2793-807.
Khan, T., T. Nguyen, F. Ohnsorge, and R. Schodde. 2016. "From Commodity Discovery to Production." Policy Research Working Paper 7823, World Bank, Washington, DC.
Kilian, L. 2009. "Not All Oil Price Shocks Are Alike: Disentangling Demand and Supply Shocks in the Crude Oil Market." American Economic Review 99 (3): 1053-69.
Kilian, L. 2020. "Understanding the Estimation of Oil Demand and Oil Supply Elasticities." CESifo Working Paper 8567, Center for Economic Studies, Munich.
Kilian, L., and D. Murphy. 2014. "The Role of Inventories and Speculative Trading in the Global Market for Crude Oil." Journal of Applied Econometrics 29 (3): 454-78.
Kindleberger, C. P. 1943. "Planning for Foreign Investment." American Economic Review 33 (1): 347-54.
Koeberle, S., H. Bedoya, P. Silarszky, and G. Verheyen, eds. 2005. Conditionality Revisited: Concepts, Experiences, and Lessons. Washington, DC: World Bank.
116 CHAPTER 1 COMMODITY MARKETS
Kooroshy, J, and F. Preston. 2014. "Cartels and Competition in Mineral Markets: Challenges for Global Governance." Chatham House, London.
Krasner, S. D. 1973. "Manipulating International Coffee Markets: Brazilian Coffee Policy 1906 to 1962." Public Policy 21 (4): 493-523.
Krueger, A. O. 1964. "The Political Economy of the Rent Seeking Society." American Economic Review 64 (3): 291-303.
Krueger, A. O., M. Schiff, and A. Valdes. 1992. The Political Economy of Agricultural Pricing Policy. Baltimore, MD: Johns Hopkins University Press.
Kuck, P. 1999. Metals Prices in the United States through 1998. Reston, VA: U.S. Geological Survey.
Laborde, D., C. Lakatos, and W. Martin. 2019. "Poverty Impact of Food Price Shocks and Policies." In Inflation in Emerging and Developing Economies—Evolution, Drivers, and Policies, edited by Jongrim Ha, M. Ayhan Kose, and Franziska Ohnsorge, 371-401. Washington, DC: World Bank Group.
Lagos, G. 2018. "Mining Nationalization and Privatization in Peru and in Chile." Miner EconSl: 127-39.
Lai, D. 1985. The Poverty of Development Economics. Cambridge, MA: Harvard University Press.
Lemon, C. 1838. "The Statistics of the Copper Mines of Cornwall." Journal of the Statistical Society of London 1 (2): 65-84.
Levinson, M. 2016. The Box: How the Shipping Container Made the World Smaller and the World Economy Bigger, Second Edition. Princeton, NJ: Princeton University Press.
Liefert, W. M. 2002. "Comparative (Dis?)Advantage in Russian Agriculture." American Journal of Agricultural Economics 84 (3): 762-67'.
Liu, B., and H. Geman. 2017. "World Coal Markets: Still Weakly Integrated and Moving East." Journal of Commodity Markets 5 (March): 63-76.
Lundgren, N. 1996. "Bulk Trade and Maritime Transport Costs: The Evolution of Global Markets." Resources Policy 22 (1-2): 5-32.
Mallory, I. A. 1990. "Conduct Unbecoming: The Collapse of the International Tin Agreement." American University International Law Review 5 (3): 835-92.
Markham, J. W. 1987. The History of Commodity Futures Trading and Its Regulation. New York: Praeger Publishers.
McNally, R. 2017. Crude Volatility: The History and the Future of Boom-Bust Oil Prices. New York: Columbia University Press.
Meltzer, A. H. 1991. "U.S. Policy in the Bretton Woods Era." Federal Reserve Bank of St. Louis Review 773 (3): 53-83.
COMMODITY MARKETS CHAPTER 1 117
Mitchell, B. 1988. British Historical Statistics. New York: Cambridge University Press.
Mueller, M., and D. Gorin. 1985. "Informative Trends in Natural Resource Commodity Prices: A Comment on Slade." Journal of Environmental Economics and Management 12 (1): 89-95.
Nakano, J. 2016. "The Evolution of Japan's LNG Strategies and Their Geopolitical Implications." In The Future of Natural Gas: Markets and Geopolitics, edited by Silvia Colombo, Mohamed El Harrak, and Nicolo Sartori. Houboerweg, the Netherlands: Lenthe/ European Energy Review.
Nappi, C. 2013. The Global Aluminium Industry: 40 Years from 1972. London: International Aluminium Institute.
Ohnsorge, F., Y. Okawa, and S. Yu. 2021. "Lagging Behind: Informality and Development." In The Long Shadow of Informality: Challenges and Policies, edited by F. Ohnsorge and S. Yu, 125-202. Washington, DC: World Bank.
OPEC (Organization of the Petroleum Exporting Countries). 2014. "OPEC Monthly Oil Market Report." Organization of the Petroleum Exporting Countries, Vienna.
Paulus, M. 2012. "The Economics of International Coal Markets." PhD dissertation, University of Cologne. http://inis.iaea.org/search/search.aspx?orig_q=RN:46021454.
Pettigrew, J. and B. Richardson. 2013. A Social History of Tea: Tea's Influence on Commerce, Culture Community. Danville, KY: Benjamin Press.
Prebisch, R. 1950. The Economic Development of Latin America and Its Principal Problems. New York: United Nations.
Prest, M. 1986. "The Collapse of the International Tin Agreement." IDS Bulletin 17 (4): 1-8.
Qaim, M. 2009. "The Economics of Genetically Modified Crops." Annual Reviews of Resource Economics 1: 665-93.
Qaim, M., and D. Zilberman. 2003. "Yields Effects of Genetically Modified Crops in Developing Countries." Science 299 (5608): 900-2.
Radetzki, M. 2006. "The Anatomy of Three Commodity Booms." Resources Policy 31(1): 5664.
Radetzki, M. 2009. "Seven Thousand Years in the Service of Humanity—The History of Copper, the Red Metal." Resources Policy 34 (December): 176-84.
Radetzki, M., and L. Warell. 2016. A Handbook of Primary Commodities in the Global Economy. Cambridge, U.K.: Cambridge University Press.
Reardon, T., D. Tschirley, L. S. O. Liverpool-Tasie, T. Awokuse, J. Fanzo, B. Minten, R. Vos, et al. 2021. "The Processed Food Revolution in African Food Systems and the Double Burden of Malnutrition." Global Food Security 28 (March): 100466.
118 CHAPTER 1 COMMODITY MARKETS
Roberts, T. J. 1951. "A Study of International Commodity Agreements." Master's thesis, University of British Columbia, Canada.
Schaede, U. 1989. "Forwards and Futures in Tokugawa-Period Japan: A New Perspective on the Dojima Rice Market." Journal of Banking and Finance 13 (September): 487-513.
Schmitz, C. 1979. World Non-Ferrous Metal Production and Prices 1700-1976. London: Frank Cass.
Scott, R. 1994. The History of the International Energy Agency. Volume Two. Major Policies and Actions. Paris: International Energy Agency.
Shibata, H. 1982. "The Energy Crises and Japanese Response." Resources and Energy 5 (2): 129-54.
Singer, H. W. 1950. "The Distribution of Gains between Investing and Borrowing Countries." American Economic Review 40 (2): 473-85.
Sjostrom, W. 2004. "Ocean Shipping Cartels: A Survey." Review of Network Economics 3 (2): 107-34.
Slade, M. E. 2020. "Vertical Restraints Imposed by Buyers: The Secretan Copper Cartel, 1887-1889." Antitrust Law Journal 83 (1): 75-97.
Smil, V. 2002. "Worldwide Transformation of Diets, Burdens of Meat Production and Opportunities for Novel Food Proteins." Enzyme andMicrobial Technology 30 (3): 305-11.
Smil, V. 2017. Energy and Civilization. A History. Cambridge: MIT Press.
Smith, G. 1999. "Lead." In Metal Prices in the United States through 1998, edited by P. A. Plunkert and T. S. Jones. Reston, VA: U.S. Geological Survey.
Stern, J., and A. Imsirovic. 2020. "A Comparative History of Oil and Gas Markets and Prices: Is 2020 Just an Extreme Cyclical Event or an Acceleration of the Energy Transition?" Energy Insight 68, Oxford Institute for Energy Studies.
Storli, E. 2014. "Cartel Theory and Cartel Practice: The Case of the International Aluminum Cartels, 1901-1940." Business History Review88 (3): 445-67.
Stringham, E. 2003. "The Extralegal Development of Securities Trading in SeventeenthCentury Amsterdam." Quarterly Review of ^Economics and Finance 43 (2): 321-44.
Stuermer, M. 2017. "Industrialization and the Demand for Mineral Commodities." Journal of International Money and Finance 16 (September): 16-27.
Stuermer, M. 2018. "150 Years of Boom and Bust: What Drives Mineral Commodity Prices?" Macroeconomic Dynamics 22 (3): 702-17.
Swerling, B. C. 1968. "Commodity Agreements." In International Encyclopedia of the Social Sciences, edited by D. L. Sills. New York: Macmillan Co. and Free Press.
COMMODITY MARKETS CHAPTER 1 119
Tamvakis, M. 2018. "From Chicago to Shanghai and Dalian: Apprehending the Future of Chinese Commodity Derivative Markets." In The Financialization of Commodity Markets: A Short-Lived Phenomenon, edited by Y. Jegourel. Ramat, Morocco: OCP Policy Center.
Thoburn, J. 1994. Tin in the World Economy. Edinburgh, U.K.: Edinburgh University Press.
Tolcin, A. C. 2012. Metals Prices in the United States through 2010. Zinc. Reston, VA: U.S. Geological Survey.
Tsokhas, K. 1993. "British Economic Warfare in the Far East and the Australian Wool Industry." Agricultural History Review 41 (1): 44-59.
Tsou, S. S., and J. D. Black. 1944. "International Commodity Arrangements." Quarterly Journal of Economics 58 (4): 521-52.
Tyers, R., and K. Anderson. 1992. Disarray in World Food Markets: A Quantitative Assessment. Cambridge, U.K.: Cambridge University Press.
UNCTAD (United Nations Conference on Trade and Development). 2017. "Using Trade Policy to Drive Value Addition: Lessons from Indonesia's Ban on Nickel Exports." United Nations, Geneva.
USDA (United States Department of Agriculture). 2019. Crop Production Historical Track Records. April. Washington, DC: USDA.
Vale. 2012. Vale: Our History. Rio de Janeiro: Vale, http://www.vale.com/en/aboutvale/book -our-history/pages/default.aspx.
Verico, K. 2013. "Economic Cooperation in Natural Rubber: The Impacts on Natural Rubber's World Supply and Indonesia's Economy." Asian Journal of Agriculture and Development 10 (2): 1-19.
Walters, A. 1944. "The International Copper Cartel." Southern Economic Journal 11 (2): 133-56.
Warell, L. 2005. "Defining Geographic Coal Markets Using Price Data and Shipments Data." Energy Policy 33 (17): 2216-30.
Wickizer, V.D. 1943. The World Coffee Economy with Special Reference to Control Schemes. Palo Alto, CA: Stanford University Press.
Williams, J. C. 1982. "The Origin of Futures Markets." Agricultural History 56 (1): 306-16.
Williams, J. 1986. The Economic Function of Futures Markets. Cambridge MA: Harvard University Press.
World Bank 1986. The World Development Report: Trade and Pricing Policies in World Agriculture. New York: Oxford University Press.
World Bank. 2000. Global Commodity Markets. A Comprehensive Review and Price Forecast. Washington, DC: World Bank.
120 CHAPTER 1 COMMODITY MARKETS
World Bank. 2018. Global Economic Prospects: The Turning of the Tide? June. Washington, DC: World Bank.
World Bank. 2019a. Commodity Markets Outlook: The Role of Substitution in Commodity Demand. October. Washington, DC: World Bank.
World Bank. 2019b. Commodity Markets Outlook: Food Price Shocks: Channels and Implications. April. Washington, DC: World Bank.
World Bank. 2020. Commodity Markets Outlook: Implications ofCOVID-19for Commodities. April. Washington, DC: World Bank.
World Bank. 2021. Commodity Markets Outlook: Urbanization and Commodity Demand. October. Washington, DC: World Bank.
World Bank. 2022. Commodity Markets Outlook: The Impact of the War in Ukraine on Global Commodity Markets. April. Washington, DC: World Bank.
Yang, J., and Y. Zhou. 2020. "Return and Volatility Transmission between China's and International Crude Oil Futures Markets: A First Look." Journal of Futures Markets 40 (6): 860-84.
Zaklan, A., A. Cullmann, A. Neumann, and von Hirschhausen, C. 2012. "The Globalization of Steam Coal Markets and the Role of Logistics: An Empirical Analysis." Energy Economics 34 (1): 105-16.
C H A P T ER 2
John Baffes and Peter Nagle
Commodity consumption has surged over the past half century. Metal commodities led the way, their consumption rising fourfold between 1970 and 2019, followed by a threefold increase in consumption of energy and agricultural commodities. Key drivers of this growth have been income and population growth, with demand for metals the most responsive to rising income. Technological innovations have heavily influenced the commodity intensity of output by boosting efficiency in the consumption and production of commodities. Government policies, through taxes, subsidies, and regulation, have also had strong effects. These factors, along with changes in relative prices reflecting the relative scarcity of resources, affect the composition of demand as well as the total. Over the decades ahead, the energy transition is expected to be a primary driver of substitution among commodity groups. The switch to lowcarbon sources of energy is anticipated to reduce consumption of hydrocarbons but increase consumption of the metals used to produce clean energy, such as copper.
Introduction
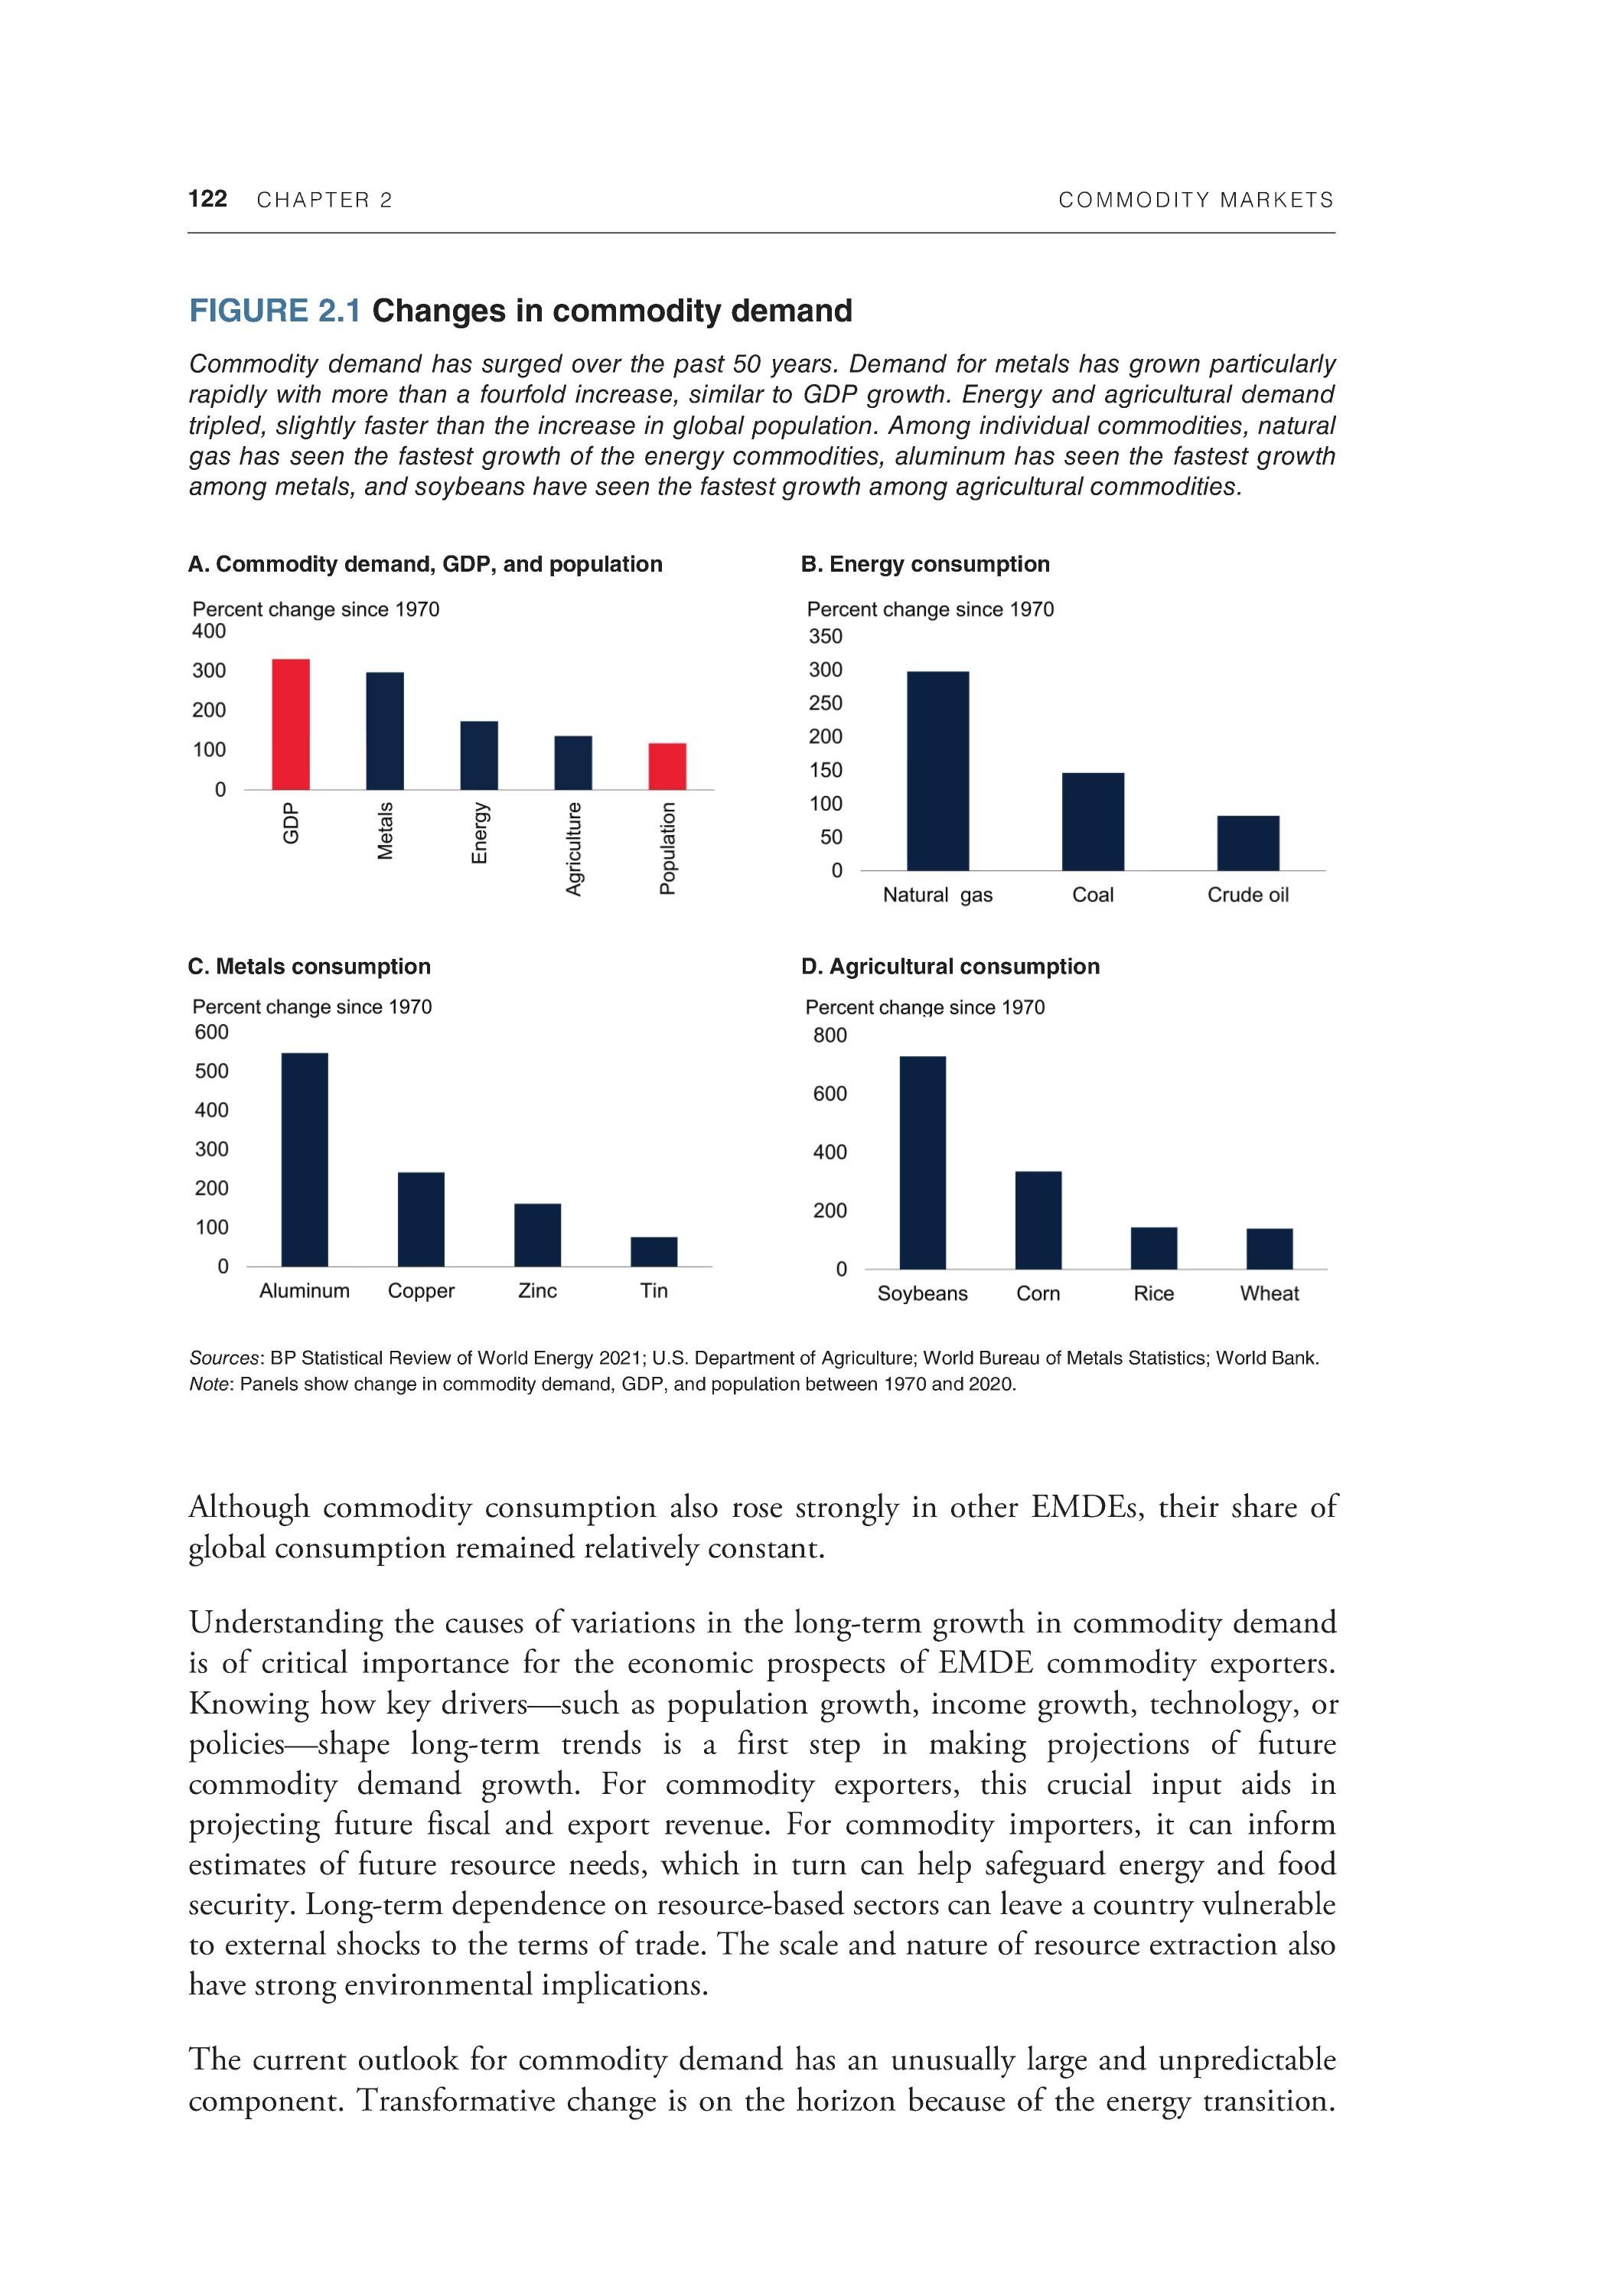
Global consumption of natural resource-based commodities has seen a substantial increase over the past half century, but at significantly varying speeds across the major commodity groups. Consumption of base metals rose more than fourfold from 23 million metric tons in 1970 to 107 million metric tons in 2019—a growth similar to that of global gross domestic product, or GDP (figure 2.1). Consumption of energy materials nearly tripled over the same period, from just over 200 exajoules to 580 exajoules, as did consumption of food commodities. Aluminum experienced the fastest growth of the base metals, rising more than sixfold because of its increasing use as a substitute for other metals, particularly in the transportation industry (Chen and Graedel 2012). Among energy commodities, natural gas consumption rose fourfold, thanks to its clean-burning properties relative to crude oil and coal. Among food commodities, the sharpest increases were for inputs to processed consumer products, animal feed, and biofuels, with consumption of edible oils rising eightfold and corn fourfold. Consumption of other grains doubled, broadly in line with the increase in world population over the past 50 years.
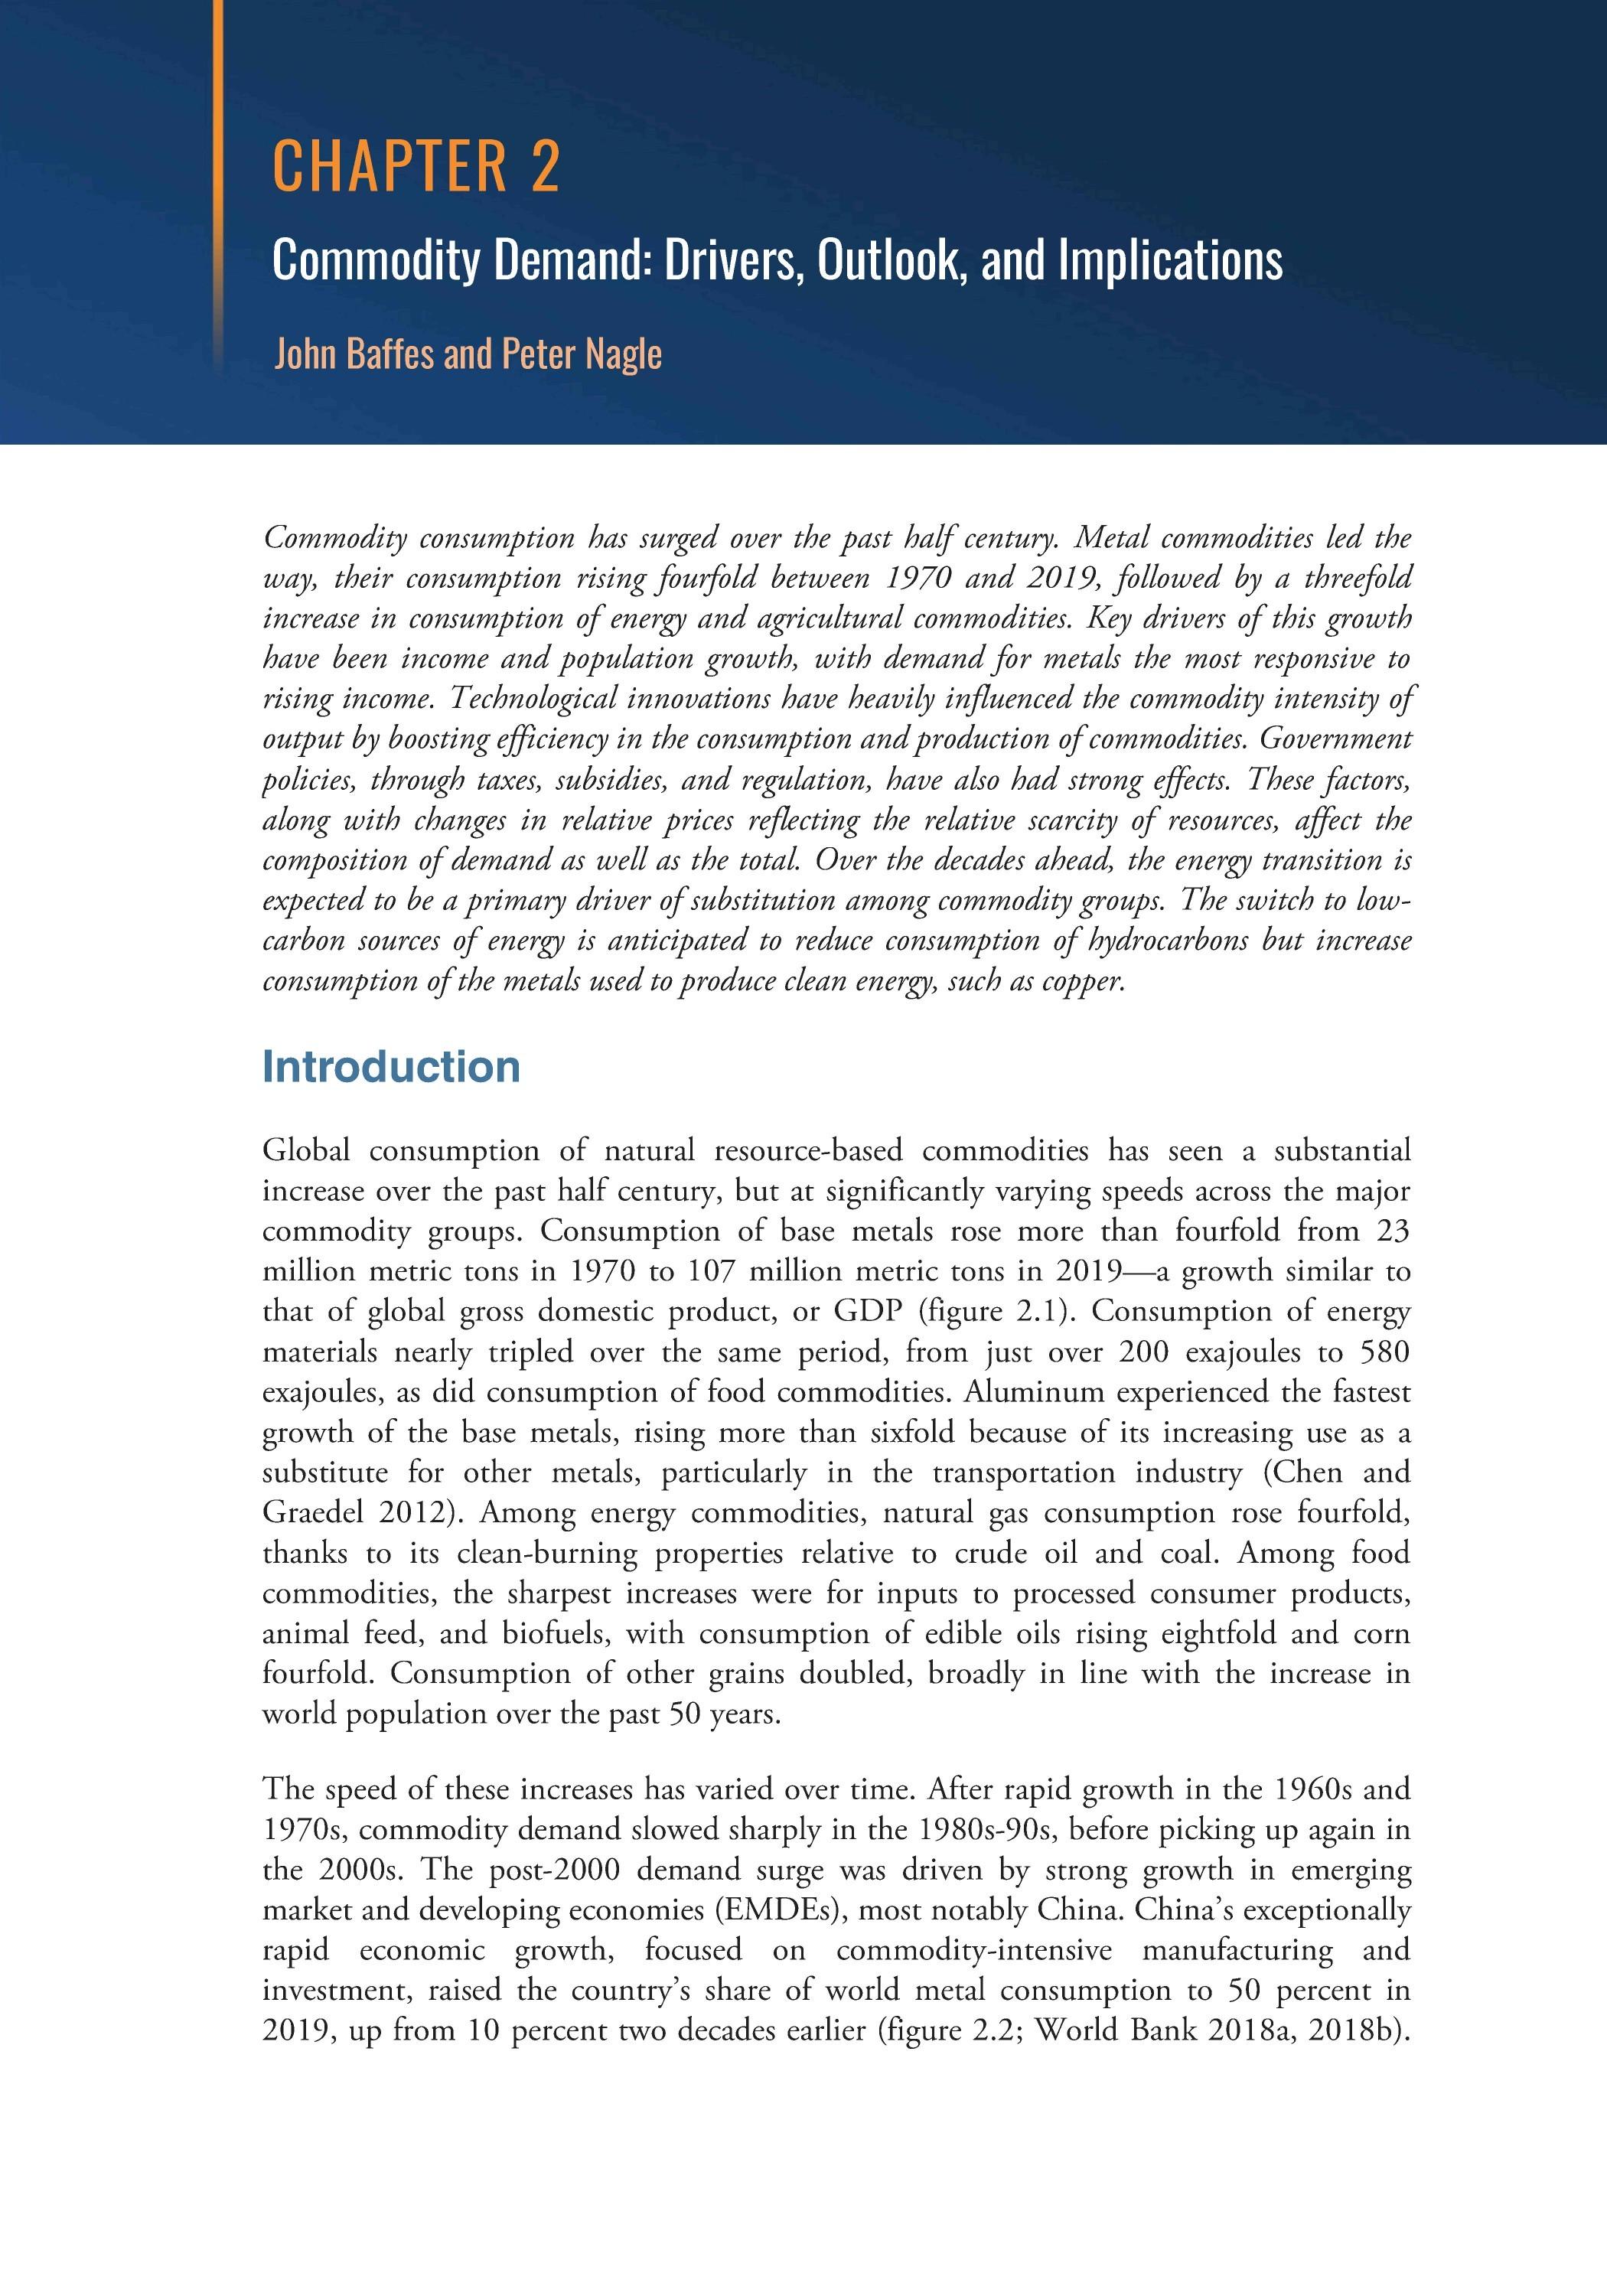
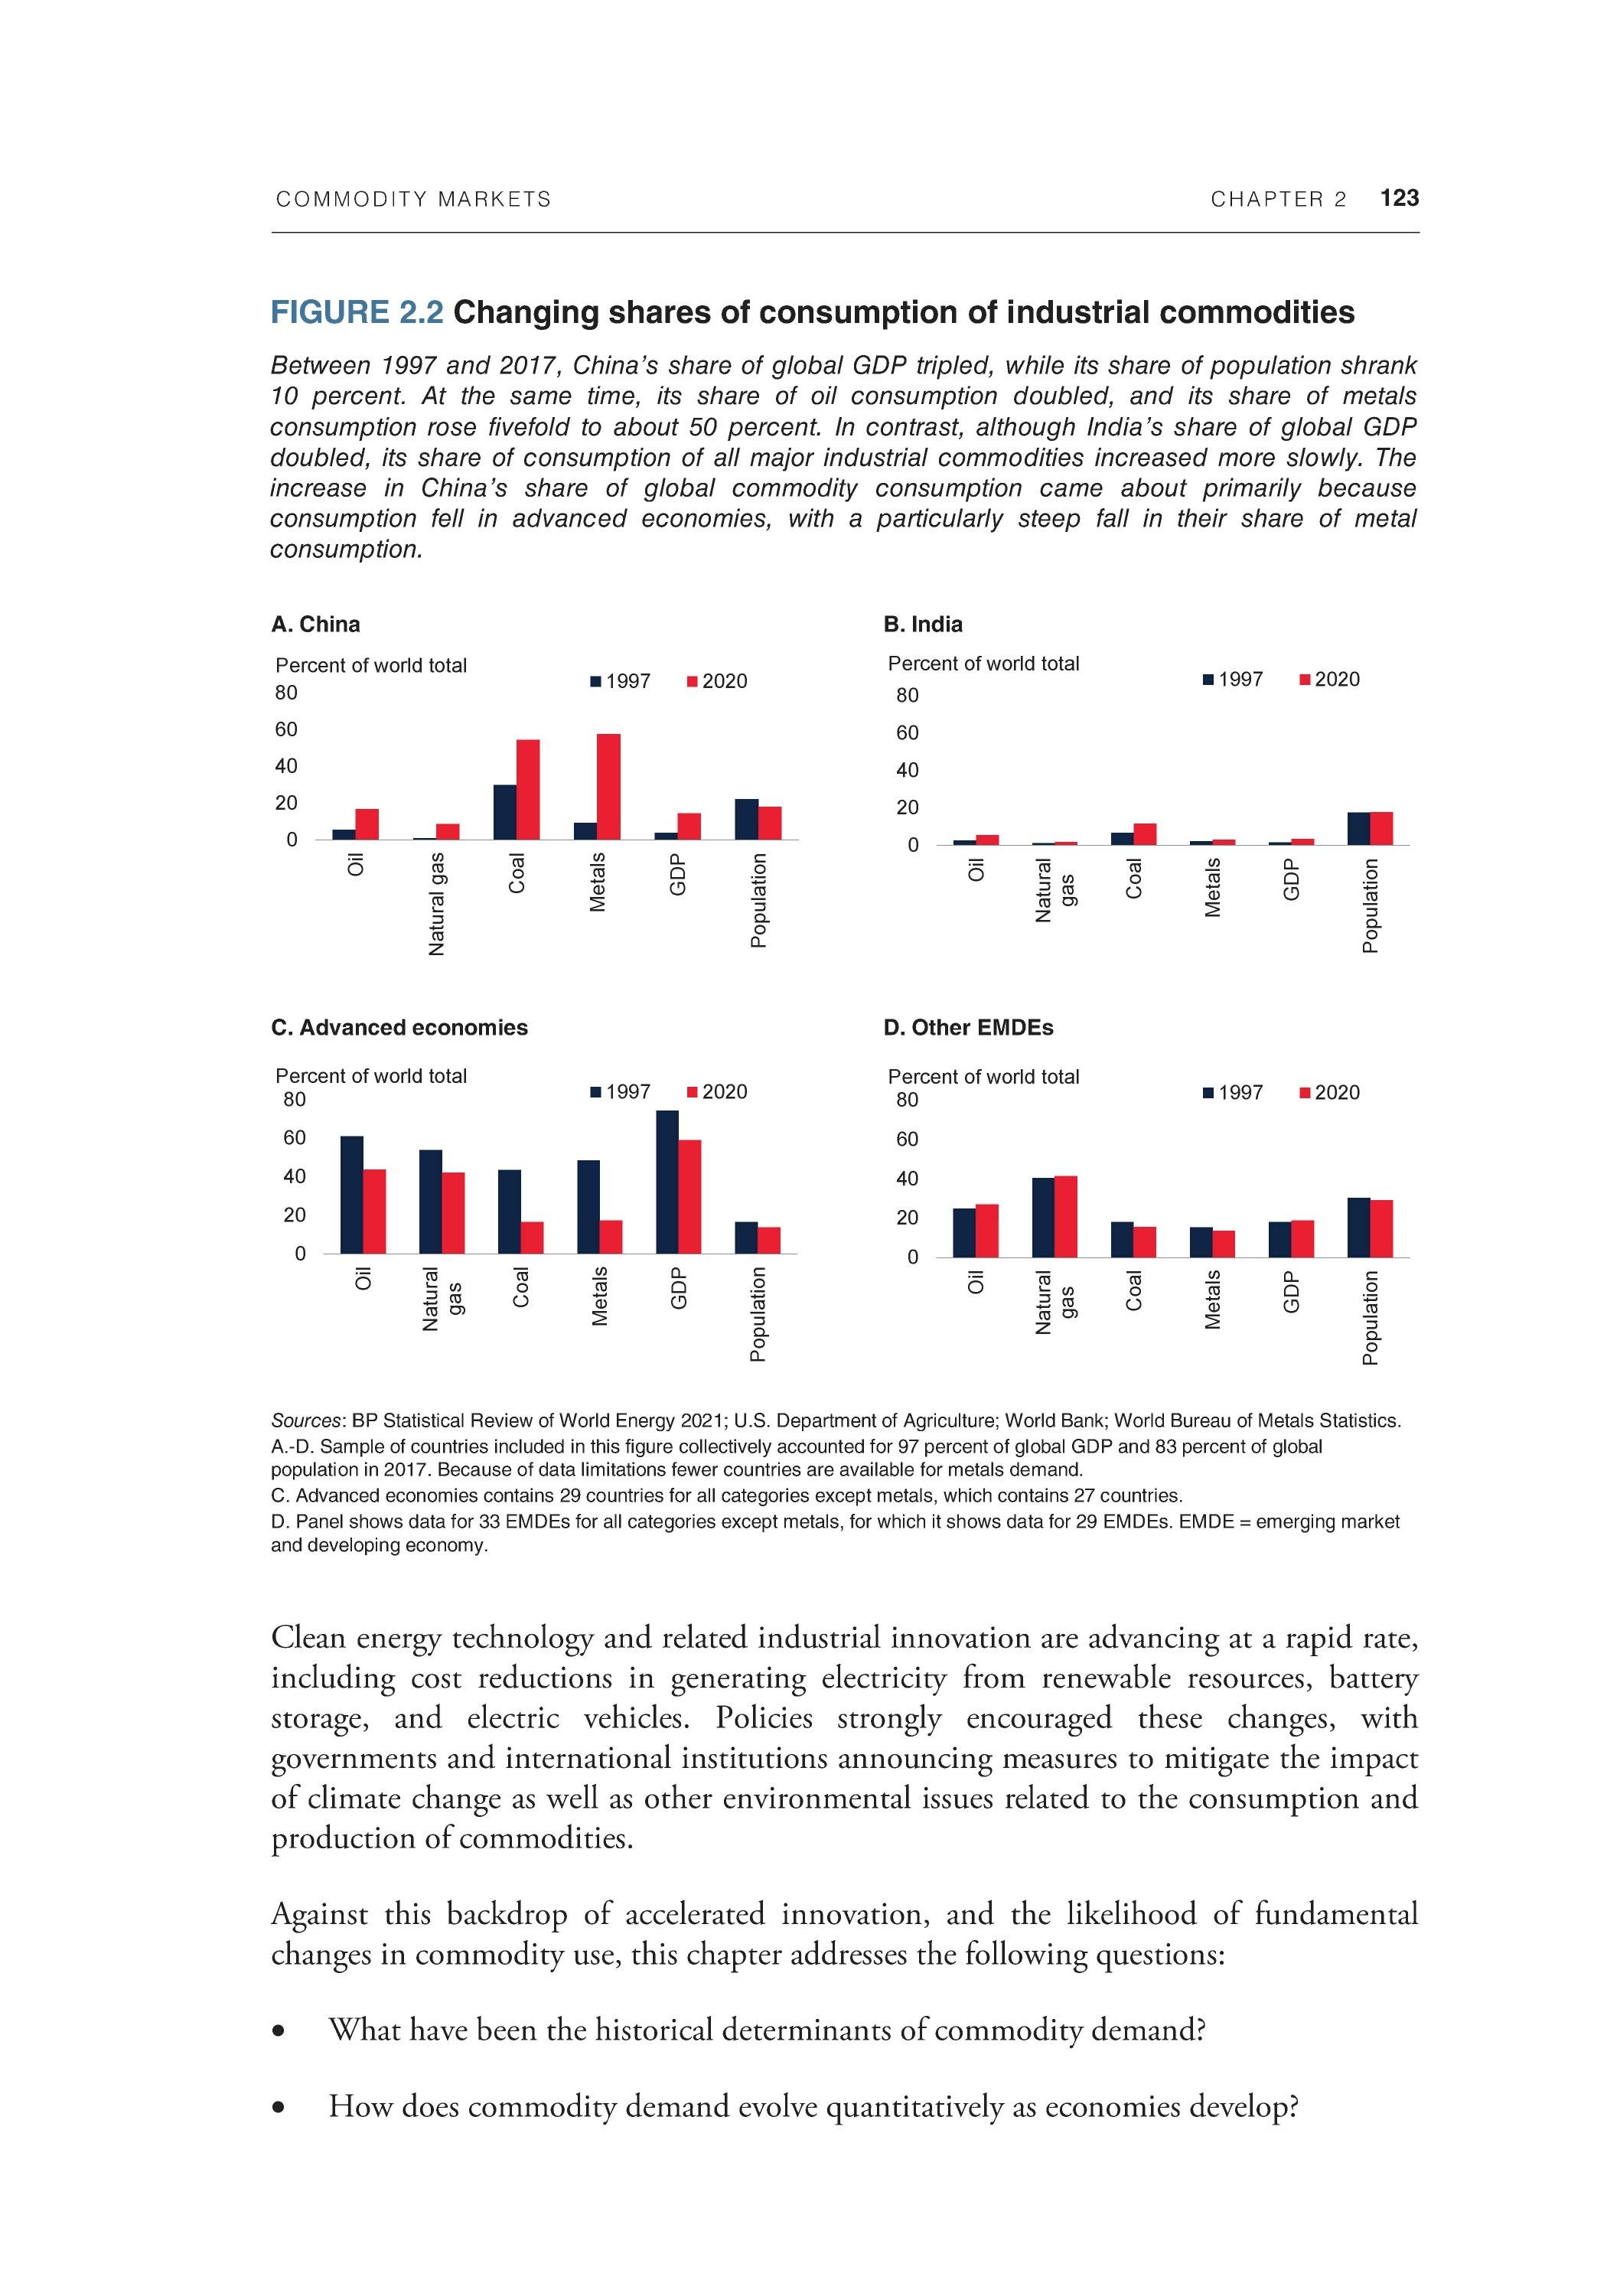
The speed of these increases has varied over time. After rapid growth in the 1960s and 1970s, commodity demand slowed sharply in the 1980s-90s, before picking up again in the 2000s. The post-2000 demand surge was driven by strong growth in emerging market and developing economies (EMDEs), most notably China. China's exceptionally rapid economic growth, focused on commodity-intensive manufacturing and investment, raised the country's share of world metal consumption to 50 percent in 2019, up from 10 percent two decades earlier (figure 2.2; World Bank 2018a, 2018b).
122 CHAPTER 2 COMMODITY MARKETS
FIGURE 2.1 Changes in commodity demand
Commodity demand has surged over the past 50 years. Demand for metals has grown particularly rapidly with more than a fourfold increase, similar to GDP growth. Energy and agricultural demand tripled, slightly faster than the increase in global population. Among individual commodities, natural gas has seen the fastest growth of the energy commodities, aluminum has seen the fastest growth among metals, and soybeans have seen the fastest growth among agricultural commodities.
A. Commodity demand, GDP, and population B. Energy consumption
C. Metals consumption D. Agricultural consumption
Sources: BP Statistical Review of World Energy 2021; U.S. Department of Agriculture; World Bureau of Metals Statistics; World Bank. Note: Panels show change in commodity demand, GDP, and population between 1970 and 2020.
Although commodity consumption also rose strongly in other EMDEs, their share of global consumption remained relatively constant.
Understanding the causes of variations in the long-term growth in commodity demand is of critical importance for the economic prospects of EMDE commodity exporters. Knowing how key drivers—such as population growth, income growth, technology, or policies—shape long-term trends is a first step in making projections of future commodity demand growth. For commodity exporters, this crucial input aids in projecting future fiscal and export revenue. For commodity importers, it can inform estimates of future resource needs, which in turn can help safeguard energy and food security. Long-term dependence on resource-based sectors can leave a country vulnerable to external shocks to the terms of trade. The scale and nature of resource extraction also have strong environmental implications.
The current outlook for commodity demand has an unusually large and unpredictable component. Transformative change is on the horizon because of the energy transition.
COMMODITY MARKETS CHAPTER 2 123
FIGURE 2.2 Changing shares of consumption of industrial commodities
Between 1997 and 2017, China's share of global GDP tripled, while its share of population shrank 10 percent. At the same time, its share of oil consumption doubled, and its share of metals consumption rose fivefold to about 50 percent. In contrast, although India's share of global GDP doubled, its share of consumption of all major industrial commodities increased more slowly. The increase in China's share of global commodity consumption came about primarily because consumption fell in advanced economies, with a particularly steep fall in their share of metal consumption.
A. China B. India
C. Advanced economies D. Other EMDEs
Sources: BP Statistical Review of World Energy 2021; U.S. Department of Agriculture; World Bank; World Bureau of Metals Statistics. A.-D. Sample of countries included in this figure collectively accounted for 97 percent of global GDP and 83 percent of global population in 2017. Because of data limitations fewer countries are available for metals demand. C. Advanced economies contains 29 countries for all categories except metals, which contains 27 countries. D. Panel shows data for 33 EMDEs for all categories except metals, for which it shows data for 29 EMDEs. EMDE = emerging market and developing economy.
Clean energy technology and related industrial innovation are advancing at a rapid rate, including cost reductions in generating electricity from renewable resources, battery storage, and electric vehicles. Policies strongly encouraged these changes, with governments and international institutions announcing measures to mitigate the impact of climate change as well as other environmental issues related to the consumption and production of commodities.
Against this backdrop of accelerated innovation, and the likelihood of fundamental changes in commodity use, this chapter addresses the following questions:
• What have been the historical determinants of commodity demand?
• How does commodity demand evolve quantitatively as economies develop?
124 CHAPTER 2 COMMODITY MARKETS
• What are the prospects for global commodity demand, and what are the implications for policy makers?
Contribution to the literature. This chapter presents estimates of income elasticities of demand for the energy, metals, and food commodity groups. It builds on the research in Baffes, Kabundi, and Nagle (2022), which estimates income elasticities of demand for the individual commodities within each of these sectors. The results reported in this chapter control for the presence of long-term substitutions between commodity groups, in both production and consumption. The use of a common framework facilitates a comparison of income elasticities across commodity groups. Previous studies have typically focused more narrowly on a single commodity group, with much of the literature focusing on energy.
The chapter uses a methodology that enables the estimation of income-varying elasticities of demand, in contrast to most previous studies that for a given commodity provide estimates of linear income elasticities, uniform across all levels of per capita income. Calculating nonlinear elasticities of demand enables an analysis of how commodity demand changes at different stages of economic development.
Main findings. This chapter has three main findings. First, population and income growth are the two primary drivers of aggregate commodity demand in the long run. Whereas income is a key driver of growth for metals and energy, it is less important for food commodities, which tend to be driven chiefly by population growth. Other factors, including relative prices, technology, substitutions from one commodity group to another, and government policies, are also important drivers of demand growth. These factors can lead to changes in the intensity of commodity demand for a given level of per capita income, as well as changes in the relative importance of individual commodities.
Second, per capita income elasticities of demand vary significantly between commodity groups. Base metals have the highest income elasticity of demand, followed by energy. The lowest income elasticity is for food. Growth in metals consumption over the past 50 years has closely tracked growth in income (reflecting growth in both population and GDP per capita), whereas growth in food consumption has more closely followed population growth, particularly for grains. In addition, income elasticities vary with per capita income levels. At low levels of income, elasticities of demand for commodities are high (in some cases well above unity). As per capita income levels rise, the marginal income elasticities fall. At high levels, the marginal elasticities may go to zero, or even negative, reflecting shifts in consumption patterns toward goods with high-value-added content, and toward services, as per capita incomes rise. This decline was larger for metals and energy than for agriculture; however, because the starting elasticity for metal was high, it remains the most income elastic component of commodity demand.
Third, overall commodity demand is likely to continue to increase in the years ahead, but at a slower rate than over the past two decades. This slower pace is due to slower anticipated population and income growth, as well economic changes, such as China's shift toward a more service- and consumer-based economy. Demand for individual
C O M M O D I TY M A R K E TS CHAPTER 2 125
commodities could see transformative substitutions because of innovations and policydriven initiatives to mitigate climate change. The energy transition is likely to feature a wave of disruptive change that will cause large, permanent changes in the demand for commodities. A shift to low-carbon sources of energy is expected to raise demand for metals used for clean energy (such as copper), and much reduce the consumption of fossil fuels.
The rest of this chapter is structured as follows. The next section presents a historical description of trends in the key drivers of commodity demand—population, income levels, and commodity intensity (that is, changes in the efficiency of commodity consumption and production due to innovation). The third section presents empirical estimates of income elasticities of demand for the three sectors: metals, energy, and food, and considers the prospects for future commodity demand growth, based on expected income and population trends. The final section offers some policy implications. Boxes investigate the relationship between urbanization and commodity demand, and some notable historical examples of commodity substitution.
Classifying the determinants of commodity demand
Population and income growth, and technological progress, have been fundamental drivers of demand for commodities. Innovations in production have often caused largescale substitutions from one commodity to another. They have also led to changes in the commodity intensity of output—that is, commodity consumption per unit of GDP.
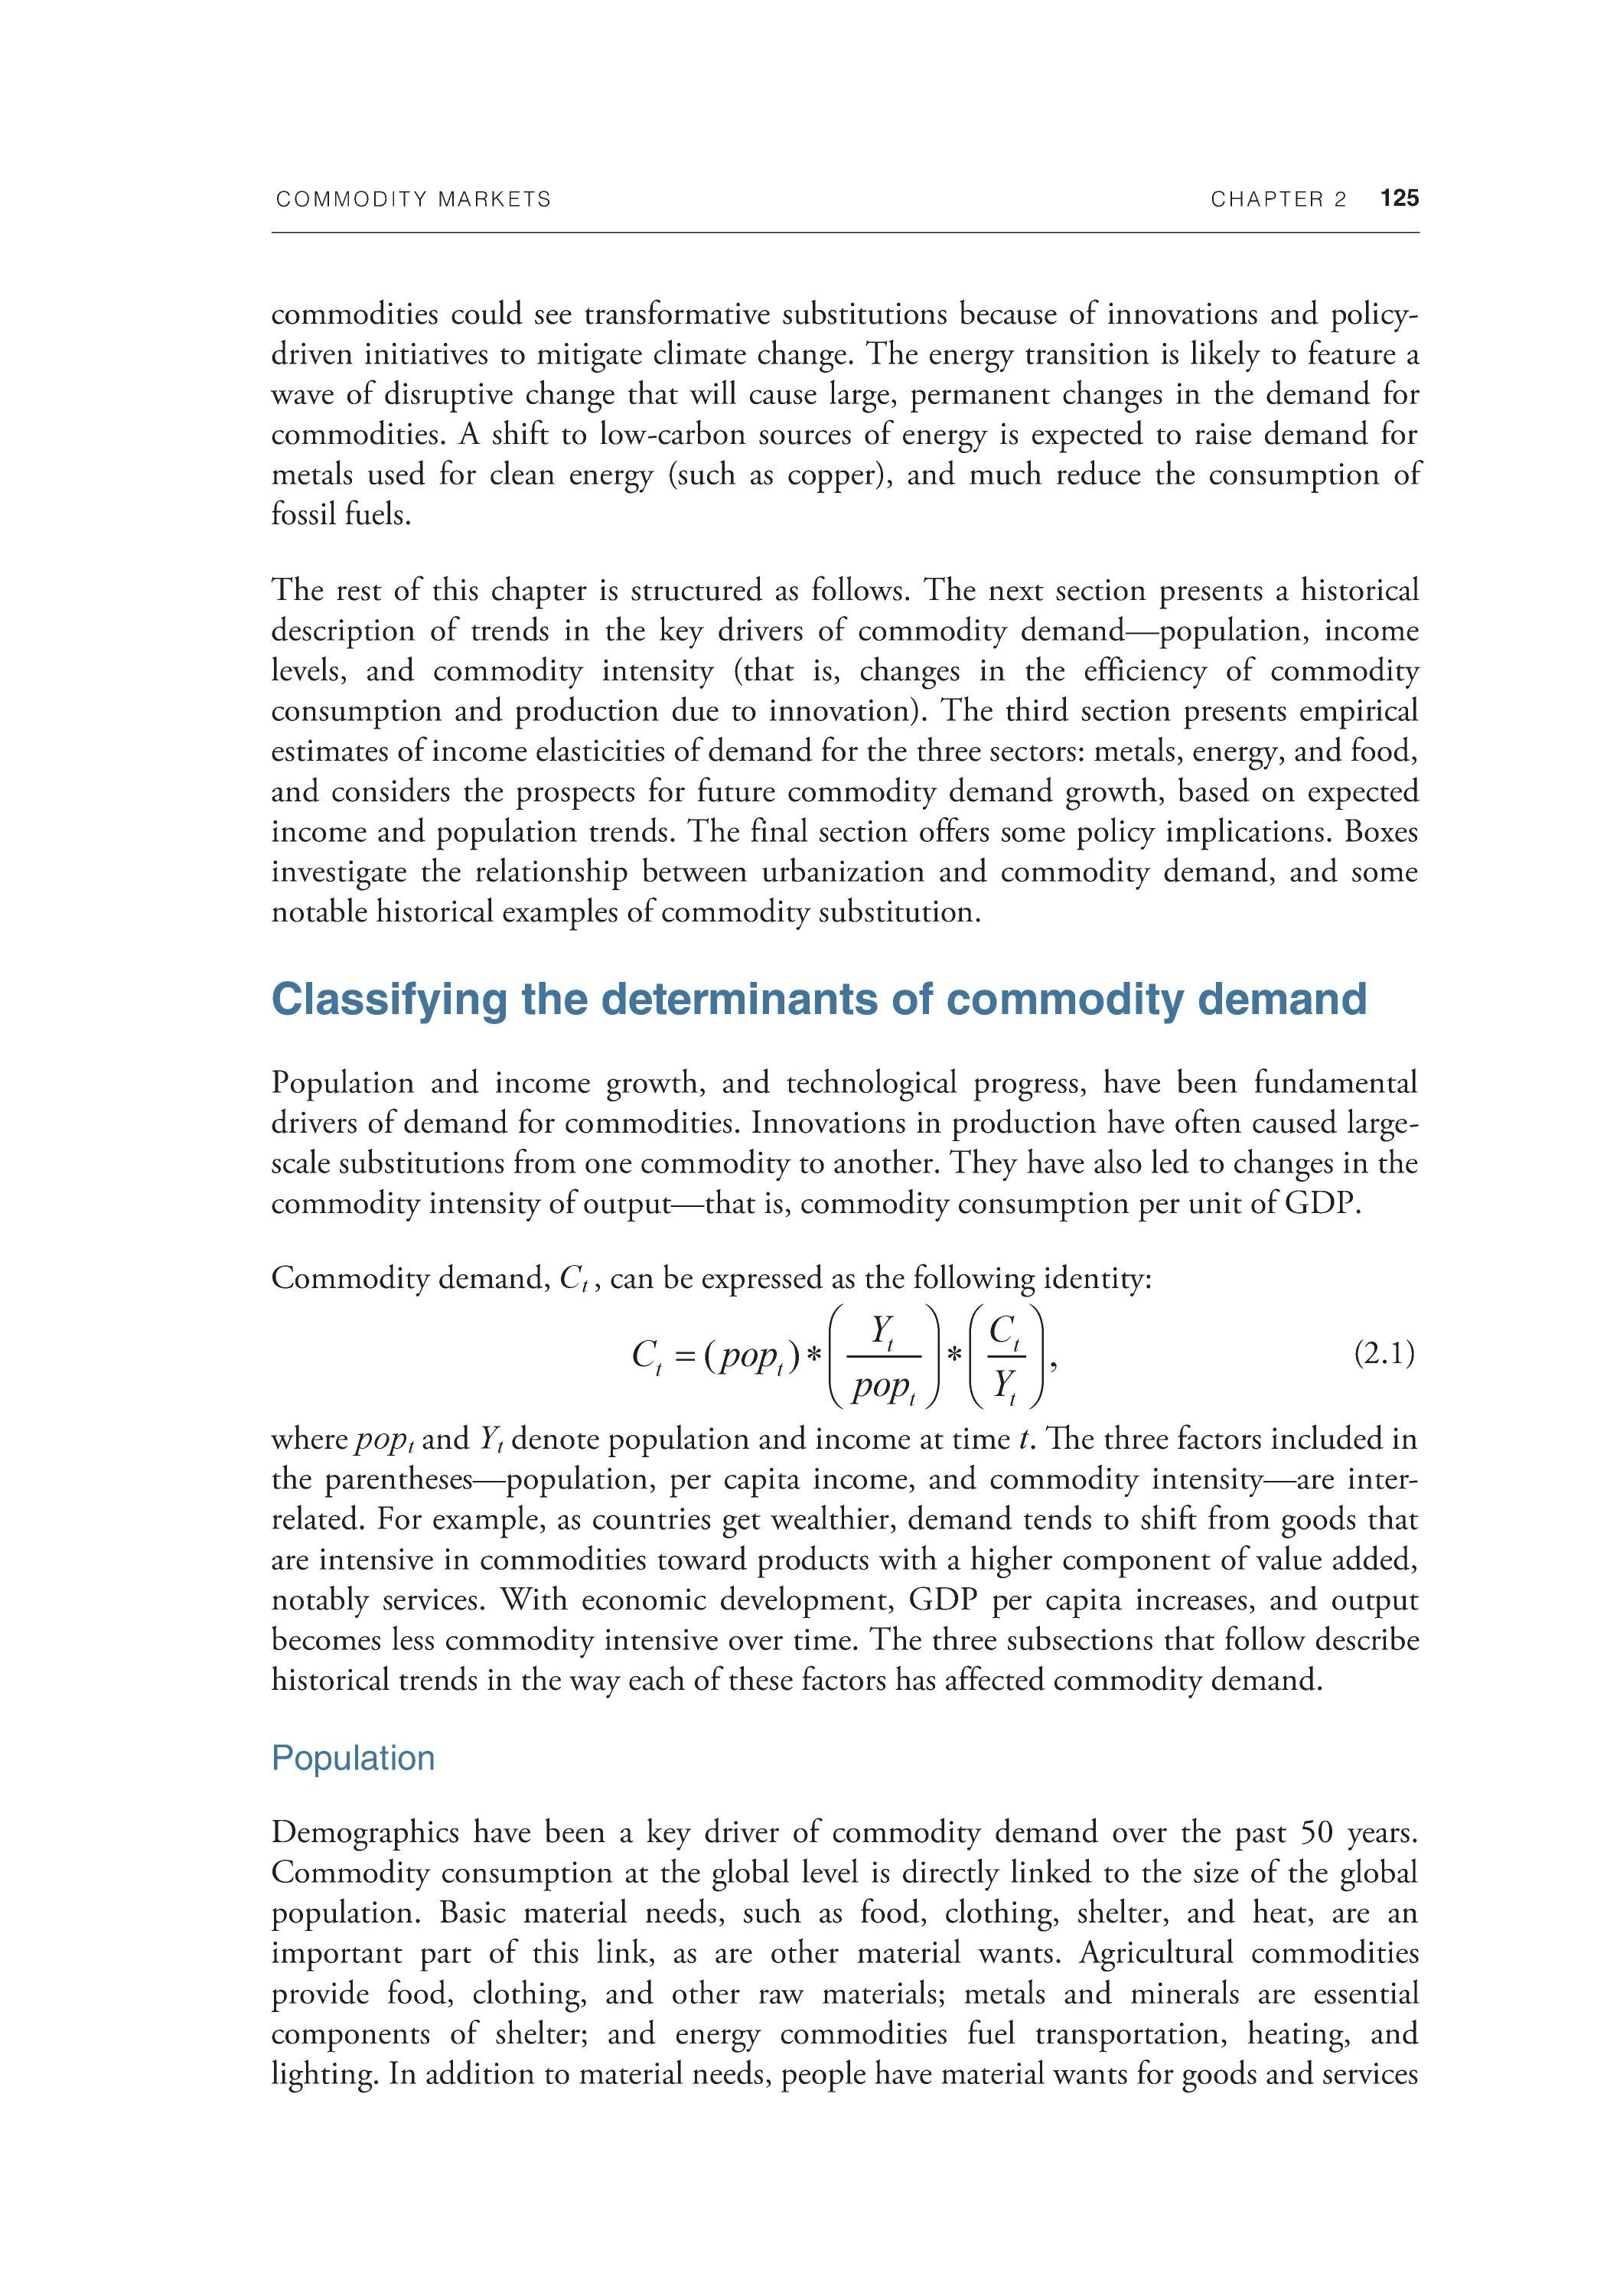
Commodity demand, Ct, can be expressed as the following identity:
(2.1)
where popt and Yt denote population and income at time t. The three factors included in the parentheses—population, per capita income, and commodity intensity—are interrelated. For example, as countries get wealthier, demand tends to shift from goods that are intensive in commodities toward products with a higher component of value added, notably services. With economic development, GDP per capita increases, and output becomes less commodity intensive over time. The three subsections that follow describe historical trends in the way each of these factors has affected commodity demand.
Population
Demographics have been a key driver of commodity demand over the past 50 years. Commodity consumption at the global level is directly linked to the size of the global population. Basic material needs, such as food, clothing, shelter, and heat, are an important part of this link, as are other material wants. Agricultural commodities provide food, clothing, and other raw materials; metals and minerals are essential components of shelter; and energy commodities fuel transportation, heating, and lighting. In addition to material needs, people have material wants for goods and services
126 CHAPTER 2 COMMODITY MARKETS
for which resource-based commodities are essential inputs (for example, beverage crops such as coffee, precious metals for jewelry, and energy use in leisure activities such as flying). If each additional person has a similar consumption pattern to the existing population, an increase in population leads to a proportional in commodity demand, as per the identity in equation (2.1).
Over the past 50 years, the global population has more than doubled, from 3.7 billion people in 1970 to 7.8 billion people in 2020. The rate of population growth in percentage terms has gradually slowed, from almost 2 percent per year in the 1970s to just over 1 percent in the 2010s (the increase in the absolute number of population has remained stable, at almost 80 million people per year).
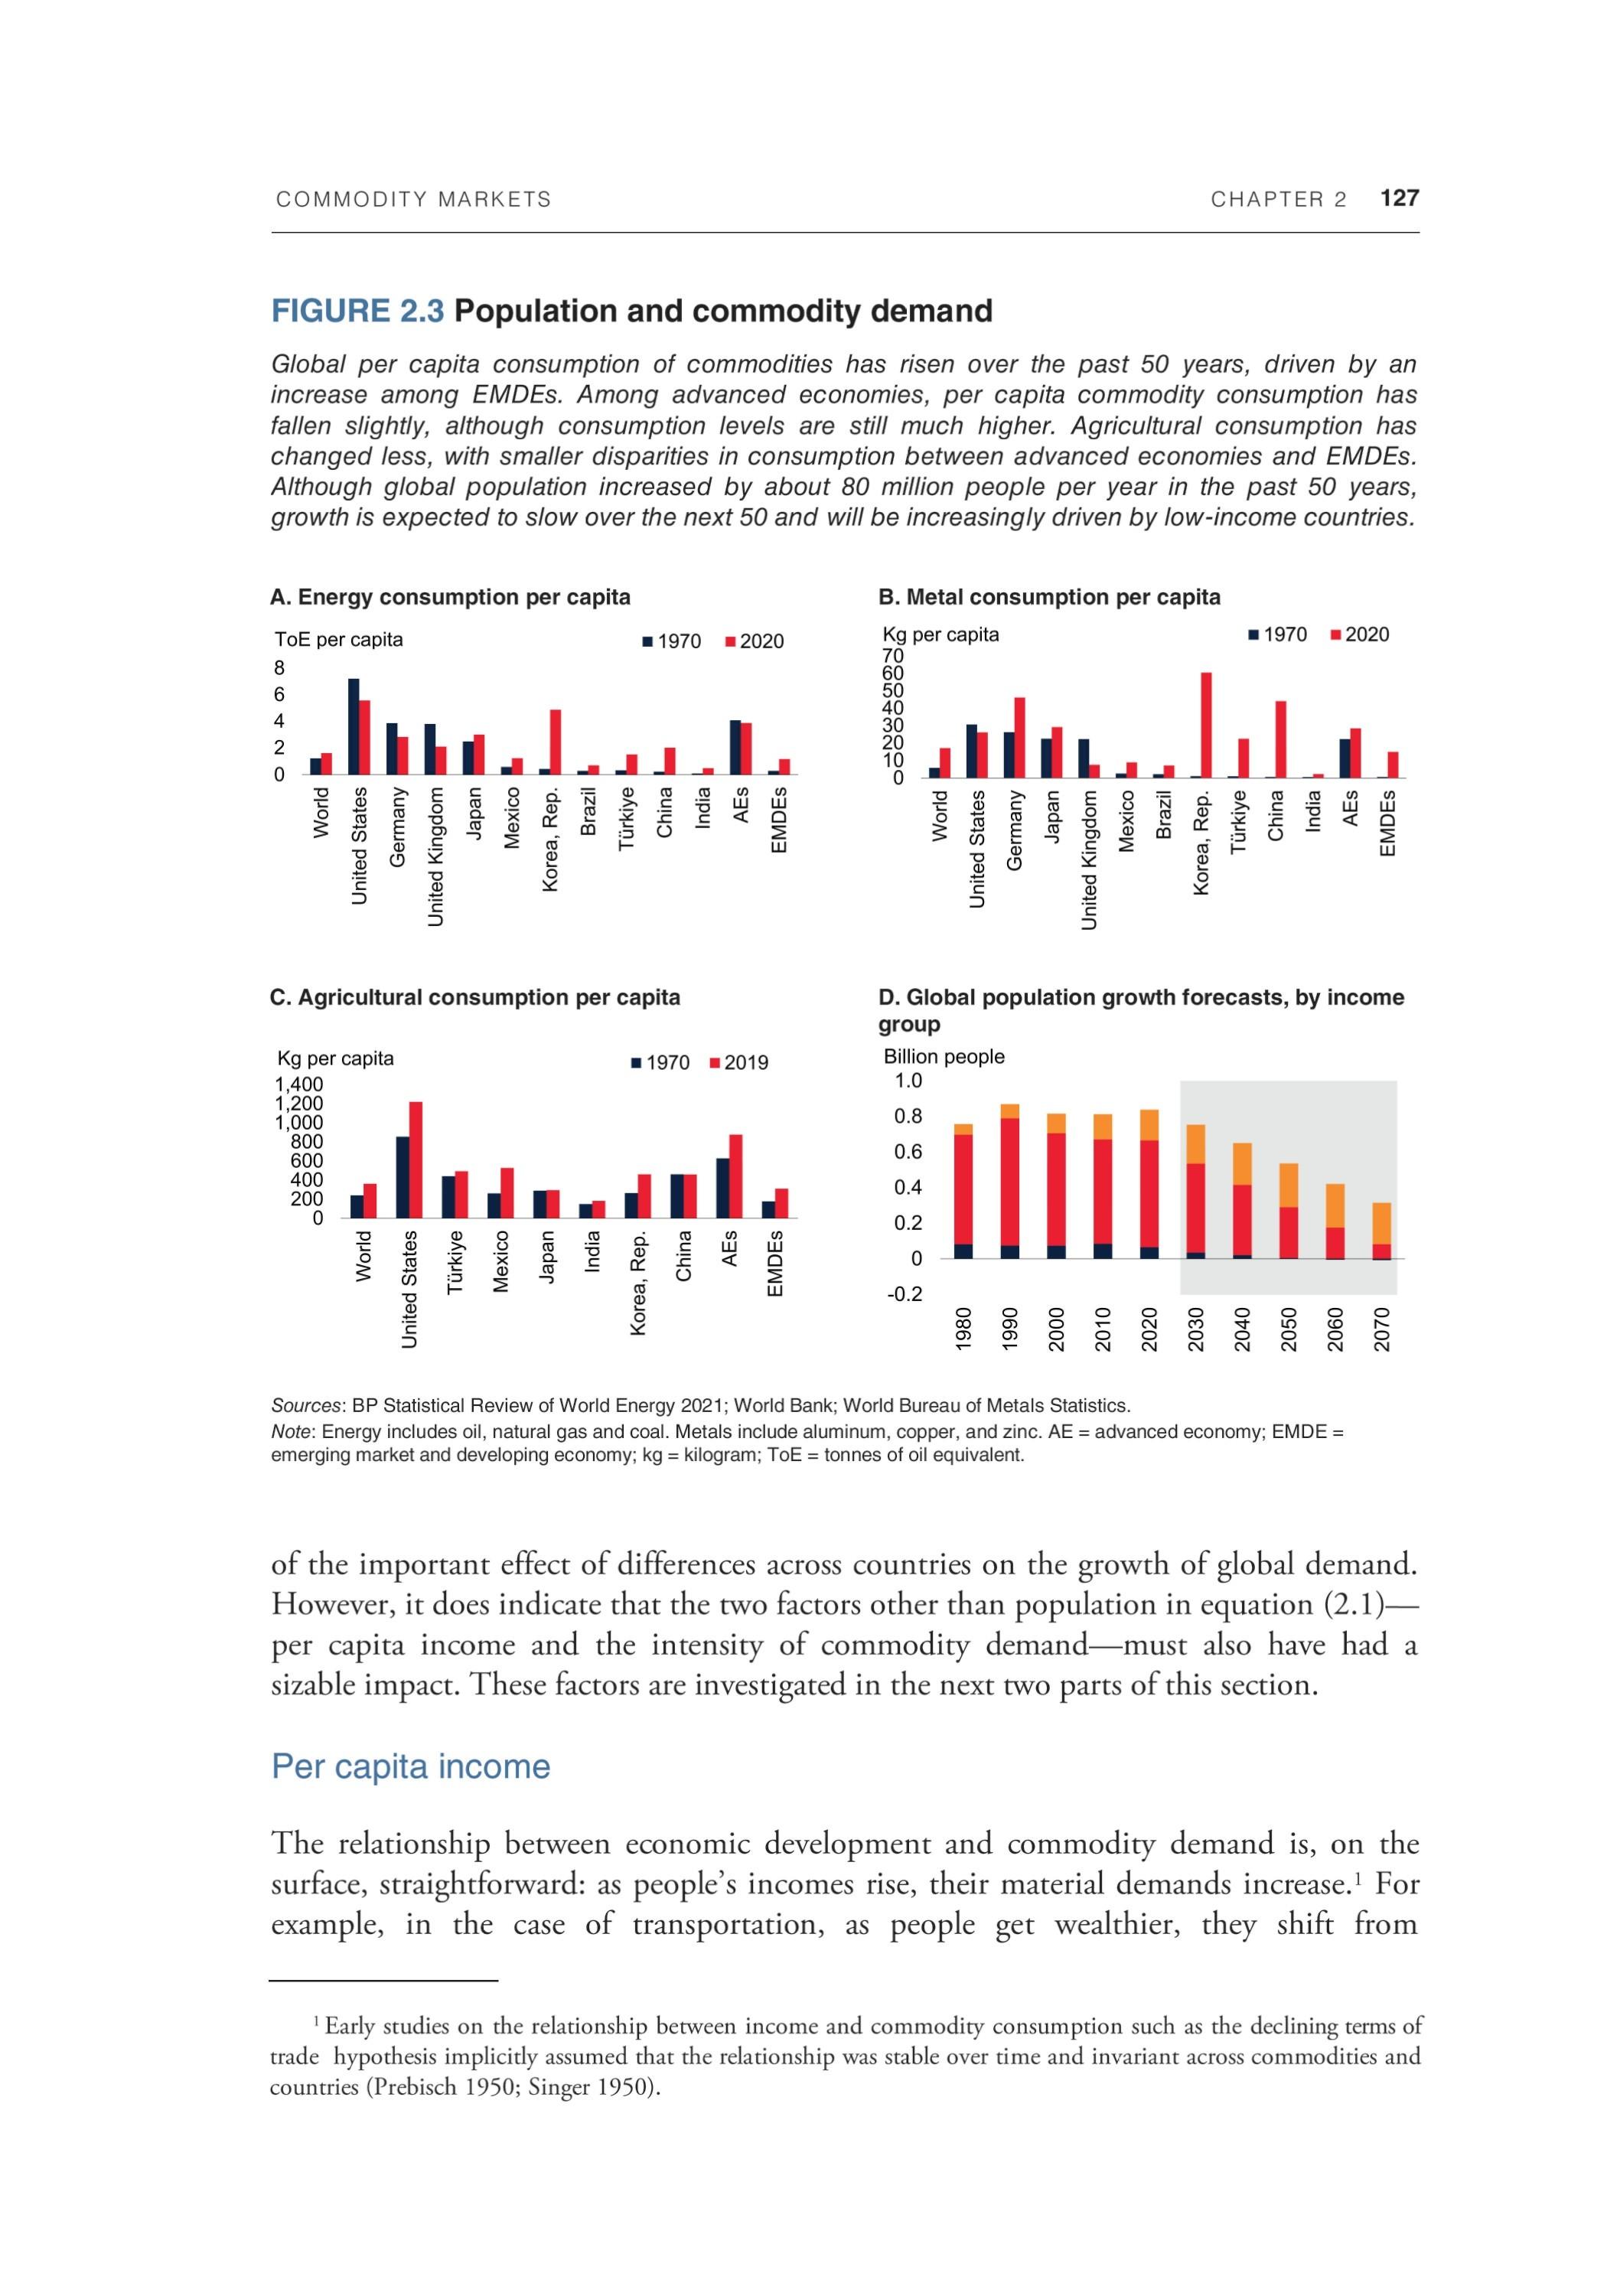
However, demand for commodities has not grown at the same rate as population. One reason is that per capita commodity demand varies significantly between countries. For example, whereas per capita energy consumption at the global level averaged 75 gigajoules in 2019, it averaged 173 gigajoules in advanced economies (AEs) and only 55 gigajoules in EMDEs. For metals, differences between AEs and EMDEs were less striking, largely because of China's high per capita metal consumption. Across individual countries, differences are more stark. For example, per capita energy and metal consumption in 2019 were approximately 10 times higher in the United States than in India (figure 2.3). Differences in agricultural consumption are less marked, with U.S. consumption roughly two-and-a-half times higher than in India.
An associated reason for the change in global per capita consumption in commodities over the past 50 years is the unevenness of population growth. Most of the increase in population has occurred in countries with per capita commodity consumption levels below the global average. Since 1970, EMDEs have accounted for 77 percent of growth, with 14 percent from low-income countries and less than 10 percent from AEs. As a result of rich countries' declining share of the global population, the increase in commodity demand due to population growth has been less than global demographics might imply.
This point can be illustrated with a simple, if counterfactual, numerical scenario. Suppose that per capita commodity consumption for each country remains at the 1970 level. Consumption in each country then grows at a rate equal to its specific population growth rate. Under this stylized scenario, although world population more than doubled between 1970 and 2019, global energy demand would have increased by just 55 percent, and metal demand by 44 percent. The increase in commodity consumption due to population growth is smaller than the actual increase in population growth because much of it happened in countries with below-average per capita commodity consumption. In contrast, the increase in food consumption under the scenario is 84 percent, far closer to population growth, because of the relatively small difference in per capita food consumption between AEs and EMDEs.
This numerical exercise assumes, counterfactually, that commodity demand per capita remains constant. In fact, it has increased significantly over the past 50 years in many countries. This change does not invalidate the relevance of the scenario as an illustration
COMMODITY MARKETS CHAPTER 2 127
FIGURE 2.3 Population and commodity demand
Global per capita consumption of commodities has risen over the past 50 years, driven by an increase among EMDEs. Among advanced economies, per capita commodity consumption has fallen slightly, although consumption levels are still much higher. Agricultural consumption has changed less, with smaller disparities in consumption between advanced economies and EMDEs. Although global population increased by about 80 million people per year in the past 50 years, growth is expected to slow over the next 50 and will be increasingly driven by low-income countries.
A. Energy consumption per capita B. Metal consumption per capita
C. Agricultural consumption per capita D. Global population growth forecasts, by income group
Sources: BP Statistical Review of World Energy 2021; World Bank; World Bureau of Metals Statistics. Note: Energy includes oil, natural gas and coal. Metals include aluminum, copper, and zinc. AE = advanced economy; EMDE = emerging market and developing economy; kg = kilogram; ToE = tonnes of oil equivalent.
of the important effect of differences across countries on the growth of global demand. However, it does indicate that the two factors other than population in equation (2.1) — per capita income and the intensity of commodity demand — must also have had a sizable impact. These factors are investigated in the next two parts of this section.
Per capita income
The relationship between economic development and commodity demand is, on the surface, straightforward: as people's incomes rise, their material demands increase.1 For example, in the case of transportation, as people get wealthier, they shift from
1 Early studies on the relationship between income and commodity consumption such as the declining terms of trade hypothesis implicitly assumed that the relationship was stable over time and invariant across commodities and countries (Prebisch 1950; Singer 1950).
128 CHAPTER 2 COMMODITY MARKETS
predominantly muscle-powered transportation such as walking, cycling, or animal transport, toward motorized forms of travel, such as cars and trains. In addition, they travel more for pleasure, notably by sea and air (Parikh and Shukla 1995). This shift leads to greater material consumption, including metals (for making vehicles), and energy commodities (especially crude oil in the past half century). Similarly, as incomes rise people use more space, including larger houses, which is associated with the use of more resources, including construction material and energy to heat, cool, and light the larger space, and to fuel transportation for commuting and shopping in less densely built locations (Brounen, Kok, and Quigley 2012; Liu et al. 2003).
The relationship between per capita income growth and commodity demand is nonlinear.2 The relationship has been estimated to follow an inverse U or an S shape, with demand for commodities initially growing rapidly at low levels of income, and then plateauing or even declining at higher income levels. Four factors account for this pattern: the evolution of an economy's production and consumption as it develops, differences in sectoral growth patterns across countries, urbanization, and improvements in technology and efficiency. The rest of this subsection explores these factors.
Per capita GDP at the global level rose from just under US$5,000 in 1970 to US$11,000 in 2019 (in constant-value, 2019 dollars). In EMDEs, per capita GDP quadrupled from US$1,200 to nearly US$5,000, an average annual growth rate of 3 percent. Per capita GDP growth was particularly rapid in China, where it increased from less than US$300 in 1970 to more than US$10,000 in 2020, an average annual growth rate of 7.7 percent. Because the majority of rapid economic growth occurred in countries with low levels of per capita income, that growth led to an overall increase in commodity demand of similar magnitude.
However, per capita consumption of most commodities shows a profile that first rises, as per capita income increases from a low level, and then plateaus, as income grows above a certain range (figure 2.4).3 There is even some evidence of declining per capita consumption at higher levels of income for some commodities. The precise form of the
2 The nonlinear nature of the commodity consumption-income relationship throughout the development process has led to a strand of literature that comes under various names: the material or environmental Kuznets curve, S-shaped curve, inverted U-shaped curve, dematerialization hypothesis, the intensity of material use hypothesis, and plateauing hypothesis (Bogmans et al. 2020; Clark 1940; Cleveland and Ruth 1998; Herman, Ardekani, and Ausubel 1990; Kuznets 1971; Radetzki et al. 2008; Tilton 1990). 3 The empirical literature on the commodity consumption-income relationship is rich, with a split between studies focused on individual commodities and a smaller literature on group aggregates, primarily energy. At a primary commodity level, Fernandez (2018a, 2018b), Lahoni and Tilton (1993), and Stuermer (2017), among others, examined individual base metals; Jaunky (2012) looked at aluminum; Bailliu et al. (2019) and Guzman, Nashiyama, and Tilton (2005) studied copper; and Crompton (2015) and Warrel (2014) covered steel. Other studies looked at individual energy commodities, including oil (Gately and Huntington 2002; Hamilton 2009), natural gas (Erdogdu 2010; Krichene 2002), and coal (Chan and Lee 1997; Shealy and Dorian 2010). Demand for final products has also been studied extensively—see Kamerschen and Porter (2004) for electricity; Dahl (2012), Drollas (1984), and Gately and Streifel (1997) for gasoline and diesel. At the aggregate level, several studies look at the demand for energy (Bogmans et al. 2020; Burke and Csereklyei 2016; Csereklyei and Stern 2015; Dahl and Roman 2004; Jakob, Haller, and Marschinski 2012), and Baffes, Kabundi, and Nagle (2022) cover both individual and group aggregates for energy and metals.
COMMODITY MARKETS CHAPTER 2 129
FIGURE 2.4 Income and commodity demand
The relationship between income per capita and commodity consumption per capita shows signs of plateauing for most commodities as income rises. Whereas the relationship for energy is similar across countries, the relationship for metals diverges among countries. China stands out as having higher metals consumption per capita at lower levels of income than other countries, particularly in the case of aluminum. Agriculture shows less relationship with income, with signs that demand plateaus at low levels of income.
A. Energy B.Oil
C. Base metals D. Aluminum
E. Agriculture F. Wheat
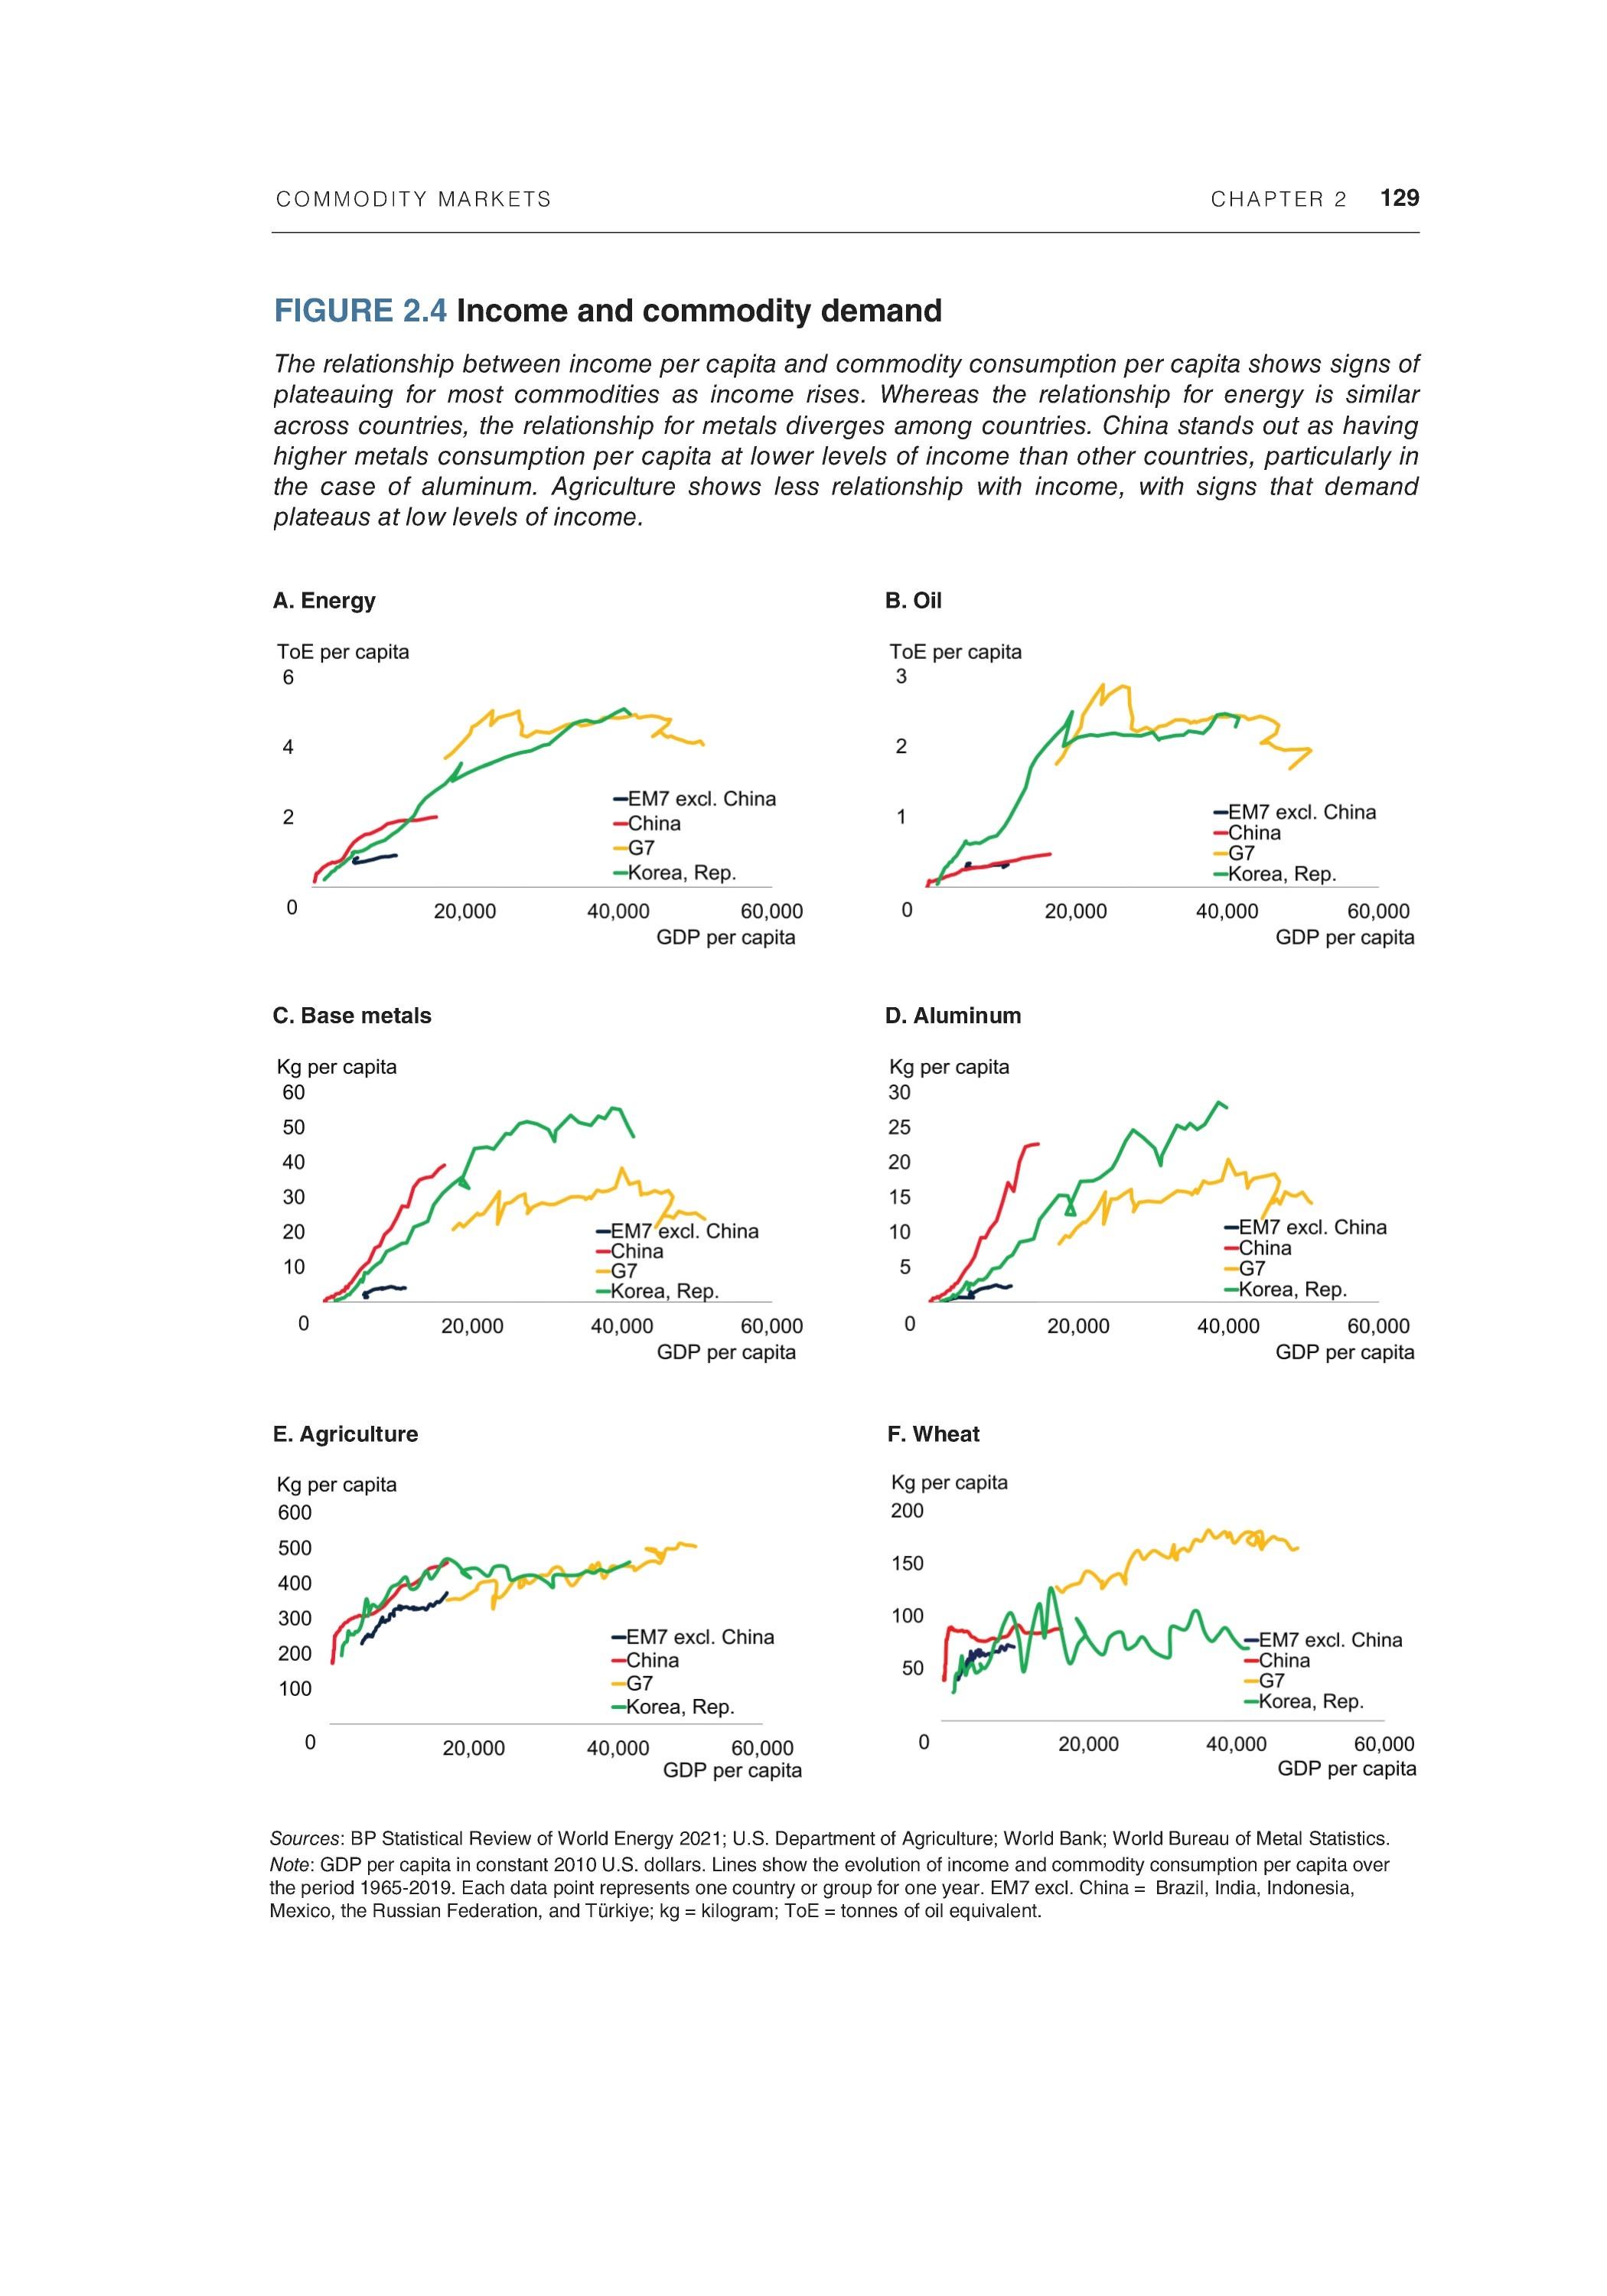
Sources: BP Statistical Review of World Energy 2021; U.S. Department of Agriculture; World Bank; World Bureau of Metal Statistics. Note: GDP per capita in constant 2010 U.S. dollars. Lines show the evolution of income and commodity consumption per capita over the period 1965-2019. Each data point represents one country or group for one year. EM7 excl. China = Brazil, India, Indonesia, Mexico, the Russian Federation, and Turkiye; kg = kilogram; ToE = tonnes of oil equivalent.
130 CHAPTER 2 COMMODITY MARKETS
relationship between commodity demand and income can vary substantially among countries. For example, China's per capita consumption of most metals is comparable to or higher than that of AEs, despite a much lower level of income.
The plateauing in commodity demand can be interpreted as a decrease in the commodity intensity of GDP. As economies get wealthier, the quantity of commodities used in the production of an additional unit of GDP decreases. Indeed, over the past 50 years, the commodity intensity of demand at the global level has, in general, decreased for most commodities, driven by the increasing importance of the service sector in the global economy and reduced infrastructure requirements and efficiency improvements (figure 2.5; Evans and Lewis 2005; Fernandez 2018a). However, there have been some notable differences: the intensity of energy and food in GDP has declined steadily over this period, whereas that of metal demand fell until about 2000, then began rising, before plateauing in recent years.
These patterns reflect major differences between countries. Although energy intensity has decreased at the global level, it has done so chiefly because of reductions among AEs. Energy intensities have risen for most EMDEs as they have industrialized. Two notable exceptions are China and Poland, which had among the highest energy intensities in the world in 1970.4 For metals, the sharp reversal of the global downtrend in the intensity of demand in 1995 was driven entirely by China's industrialization. Excluding China, intensity declined at a similar rate to that of energy. For agriculture, intensity fell at the fastest rate of all commodity groups and fell in most countries, consistent with the low income elasticity of demand for agricultural products.
Commodity intensity of demand
At a given level of per capita GDP, four factors may influence an economy's commodity intensity of demand: the degree of industrialization, urbanization, technology, and government policies at the country level and the international level. This subsection examines each factor.
Industrializatio n
Historically, as economies develop, their consumption patterns change. For economies already at high income levels, incremental growth in income typically leads to increased consumption of services, rather than goods, and services are much less commodity intensive. In addition, as economies mature, they increasingly fulfill their infrastructure needs, reducing their need for construction materials (Radetzki et al. 2008; Stuermer 2017; Tilton 1990). A similar pattern occurs in terms of production: as economies move
4 Countries that industrialized under central planning tend to exhibit high energy intensity because of inefficient resource allocation (Dienes, Dobozi, and Radetzki 1994; Ruhl et al. 2012; Urge-Vorsatz, Miladinovab, and Paizs 2006). Following the collapse of the Soviet Union, and coinciding with rapid per capita income growth, the energy intensity of demand in these countries fell steadily, although it remains elevated. China has a similar profile, with its energy intensity (measured as energy use relative to GDP) extremely high in the 1980s and steadily declining subsequently as its per capita incomes rose.
COMMODITY MARKETS CHAPTER 2 131
FIGURE 2.5 Intensity of commodity demand
Over the past 50 years the intensity of commodity demand—the amount of commodities consumed per unit of GDP—generally declined for energy and agriculture, but declined and then rose for metals. The global aggregates are driven by diverging trends at the country level, with intensities of demand typically falling in advanced economies and rising for EMDEs. An exception is agriculture, where the sharpest changes were for EMDEs.
A. Energy intensity of demand B. Energy intensity of demand, select countries
C. Metal intensity of demand D. Metal intensity of demand, select countries
E. Agricultural intensity of demand
F. Agricultural intensity of demand, select countries
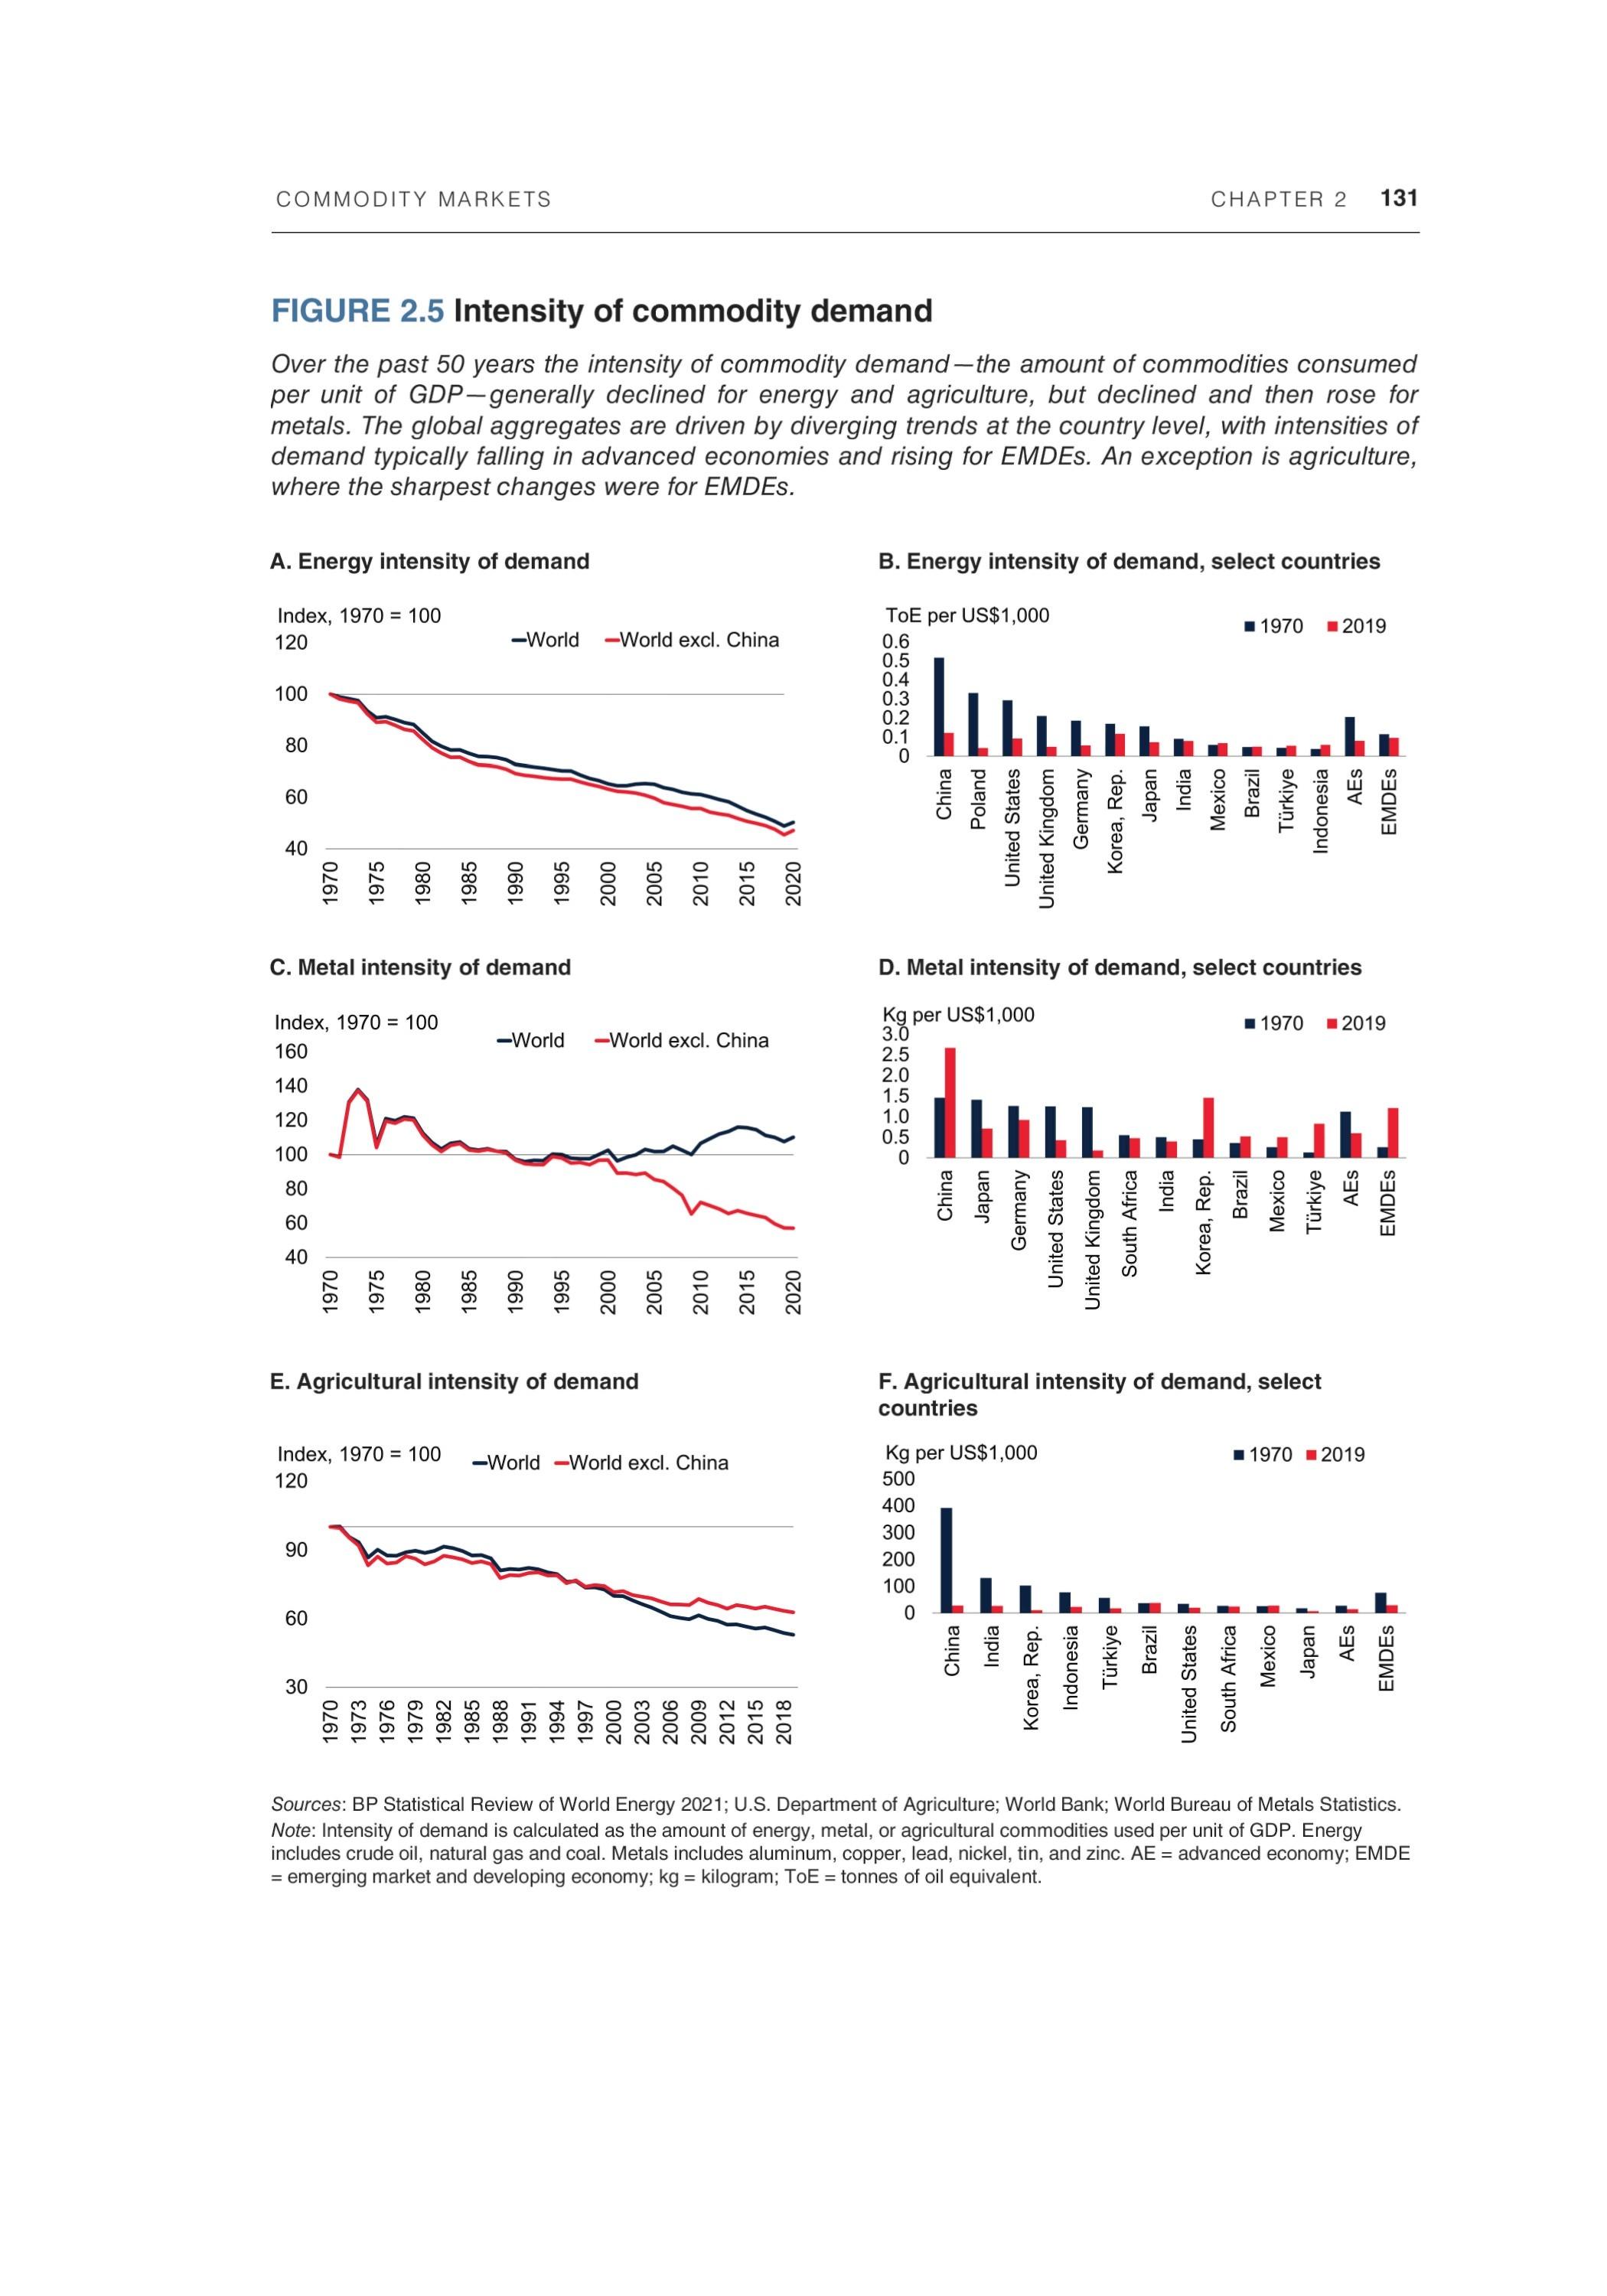
Sources: BP Statistical Review of World Energy 2021; U.S. Department of Agriculture; World Bank; World Bureau of Metals Statistics. Note: Intensity of demand is calculated as the amount of energy, metal, or agricultural commodities used per unit of GDP. Energy includes crude oil, natural gas and coal. Metals includes aluminum, copper, lead, nickel, tin, and zinc. AE = advanced economy; EMDE = emerging market and developing economy; kg = kilogram; ToE = tonnes of oil equivalent.
132 CHAPTER 2 COMMODITY MARKETS
from predominantly agricultural economies toward manufacturing, their commodity demand rapidly increases because manufacturing is more resource-intensive than agriculture, particularly for metals. At a later stage of development, economic growth tends to be increasingly accounted for by the service sector.
These trends are evident in the global data. For example, the share of the service sector in world GDP rose from about 50 percent in 1970 to 64 percent in 2019. Natural endowments can make a difference to the commodity composition of GDP. For example, Australia, Canada, and Chile are resource-rich countries with relatively large extractive industries. In contrast, the large East Asian economies have based their industrial development on manufacturing sectors.
Urbanization
The degree of urbanization has been linked to commodity demand growth (Jacks and Stuermer 2018; Yu 2011). The share of the global population living in urban areas has risen rapidly over the past 50 years, alongside a major increase in commodity consumption. Urban areas have large resource needs, for their construction and maintenance, for materials for their factories, and for everyday needs of their households. However, the effect of migration from the countryside to a city on commodity demand depends on the relative efficiency of resource use in the two areas (World Bank 2010). Furthermore, economic growth is also a key driver of urbanization, such that the relationship between urbanization and commodity demand is complex. Research on this relationship is surveyed in box 2.1.
Technology
Technological innovation is a key determinant of commodity demand. Disruptive innovation is a change that renders existing products or industries obsolete. It may involve the introduction of an entirely new product (such as the mobile phone), new methods of production (such as robots), or new techniques for marketing (such as internet shopping). Technological developments can also introduce significant efficiency gains on both the consumption and the production side, which, in turn, can encourage large-scale commodity substitution (Baffes, Kabundi, and Nagle 2022; Tilton and Guzman 2016). For example, improvements in global energy efficiency, such as increased thermal efficiency of fossil fuel power plants and improved fuel economy of internal combustion engines, have been estimated to have lowered global energy consumption by about 1.2 percent per year between 1971 and 2017 (Bogmans et al. 2020). Similarly, innovations in production processes can sharply reduce resource use and production costs in manufacturing processes (for example, 3D printing; Campbell etal. 2011).
Oil is an important case in point. The first commercial discoveries in the mid-1800s led to rapid advances in drilling technology and a steep drop in the relative price of oil. Along with the simultaneous invention of the internal combustion engine, these advances resulted in the gradual displacement of coal in transport (from steam engines to
COMMODITY MARKETS CHAPTER 2 133
BOX 2.1 Urbanization and commodity demand
The past 50 years have seen a rapid increase in urbanization rates in emerging market and developing economies, which is set to continue over the next 30 years. Urbanization can have a major impact on the composition of commodity demand given the size of cities and their concentration of people and economic activity. Empirical evidence shows that, even after controlling for income and population, an increase in the share of the population living in urban areas has generally been associated with higher energy consumption. High-density cities, however, have lower per capita energy consumption than less densely populated cities. Adoption of welldesigned policies would allow increased urbanization to proceed along with a reduction in commodity use. Such policies would include policies to encourage public transit, greater population intensity, improved insulation of buildings, and investment in modern energy-saving equipment.
Introduction
Over the past 50 years the share of the world's population living in urban areas has risen from 37 percent to 56 percent, an increase of 3 billion people (figure B2.1.1; United Nations 2019; World Bank 202la). The sharpest increase came from emerging market and developing economies (EMDEs), where the share of the urban population nearly doubled from 28 percent to 54 percent. The largest increase came from China, where the share of the urban population jumped from 17 percent to 61 percent between 1970 and 2020. Urbanization in advanced economies mainly took place earlier in the 1900s. Urban areas cover less than 3 percent of the world's land area, but account for roughly two-thirds of global energy consumption (UN Habitat 2020).
The shift from rural to urban areas is set to continue, with the share of the urban population at the global level expected to reach 68 percent by 2050, before plateauing thereafter (United Nations 2019). Most of this growth is expected to continue to occur in EMDEs and in low-income countries, especially in South Asia and in Sub-Saharan Africa.
The increase in the share of the urban population has occurred alongside a rising trend in per capita commodity demand. Although population and income growth are primary drivers of commodity demand, urbanization also has the potential to have a major impact, especially on the composition of demand, because city dwellers have different propensities to consume resources than rural dwellers (Baffes, Kabundi, and Nagle 2022).
Urbanization can affect commodity demand through several channels, but the impacts vary depending on the nature of urbanization (World Bank 2010, 202 Ib). Density of urban areas varies, ranging from high-density mega cities, to smaller cities, to low-density urban sprawls that result in dependency on
134 CHAPTER 2 COMMODITY MARKETS
BOX 2.1 Urbanization and commodity demand (continued)
FIGURE B2.1.1 Urban population trends
Urban populations have risen rapidly in EMDEs and UCs since 1970. China saw the largest increase in its urban population, followed by India. Over the next 30 years, the largest increases in urbanization are expected to occur in Sub-Saharan Africa and South Asia.
A. Urban population share B. Change in urban population and urbanization rate, 1970-2020, select countries
C. Urban population share forecasts D. Urban population share forecasts, by region
Sources: United Nations 2019; World Bank. Note: Orange whiskers indicate minimum and maximum range. EAP = East Asia and Pacific; EGA = Europe and Central Asia; EMDE = emerging market and developing economy; LAC = Latin America and the Caribbean; LIC = low-income country; MNA = Middle East and North Africa; SAR = South Asia; SSA = Sub-Saharan Africa. A.-D. Charts show data and forecasts for urbanization rates and urban populations from the United Nations (2019). D. Bars show average urbanization rates within regions. Lines show interquartile range of the urbanization rates of individual countries within regions.
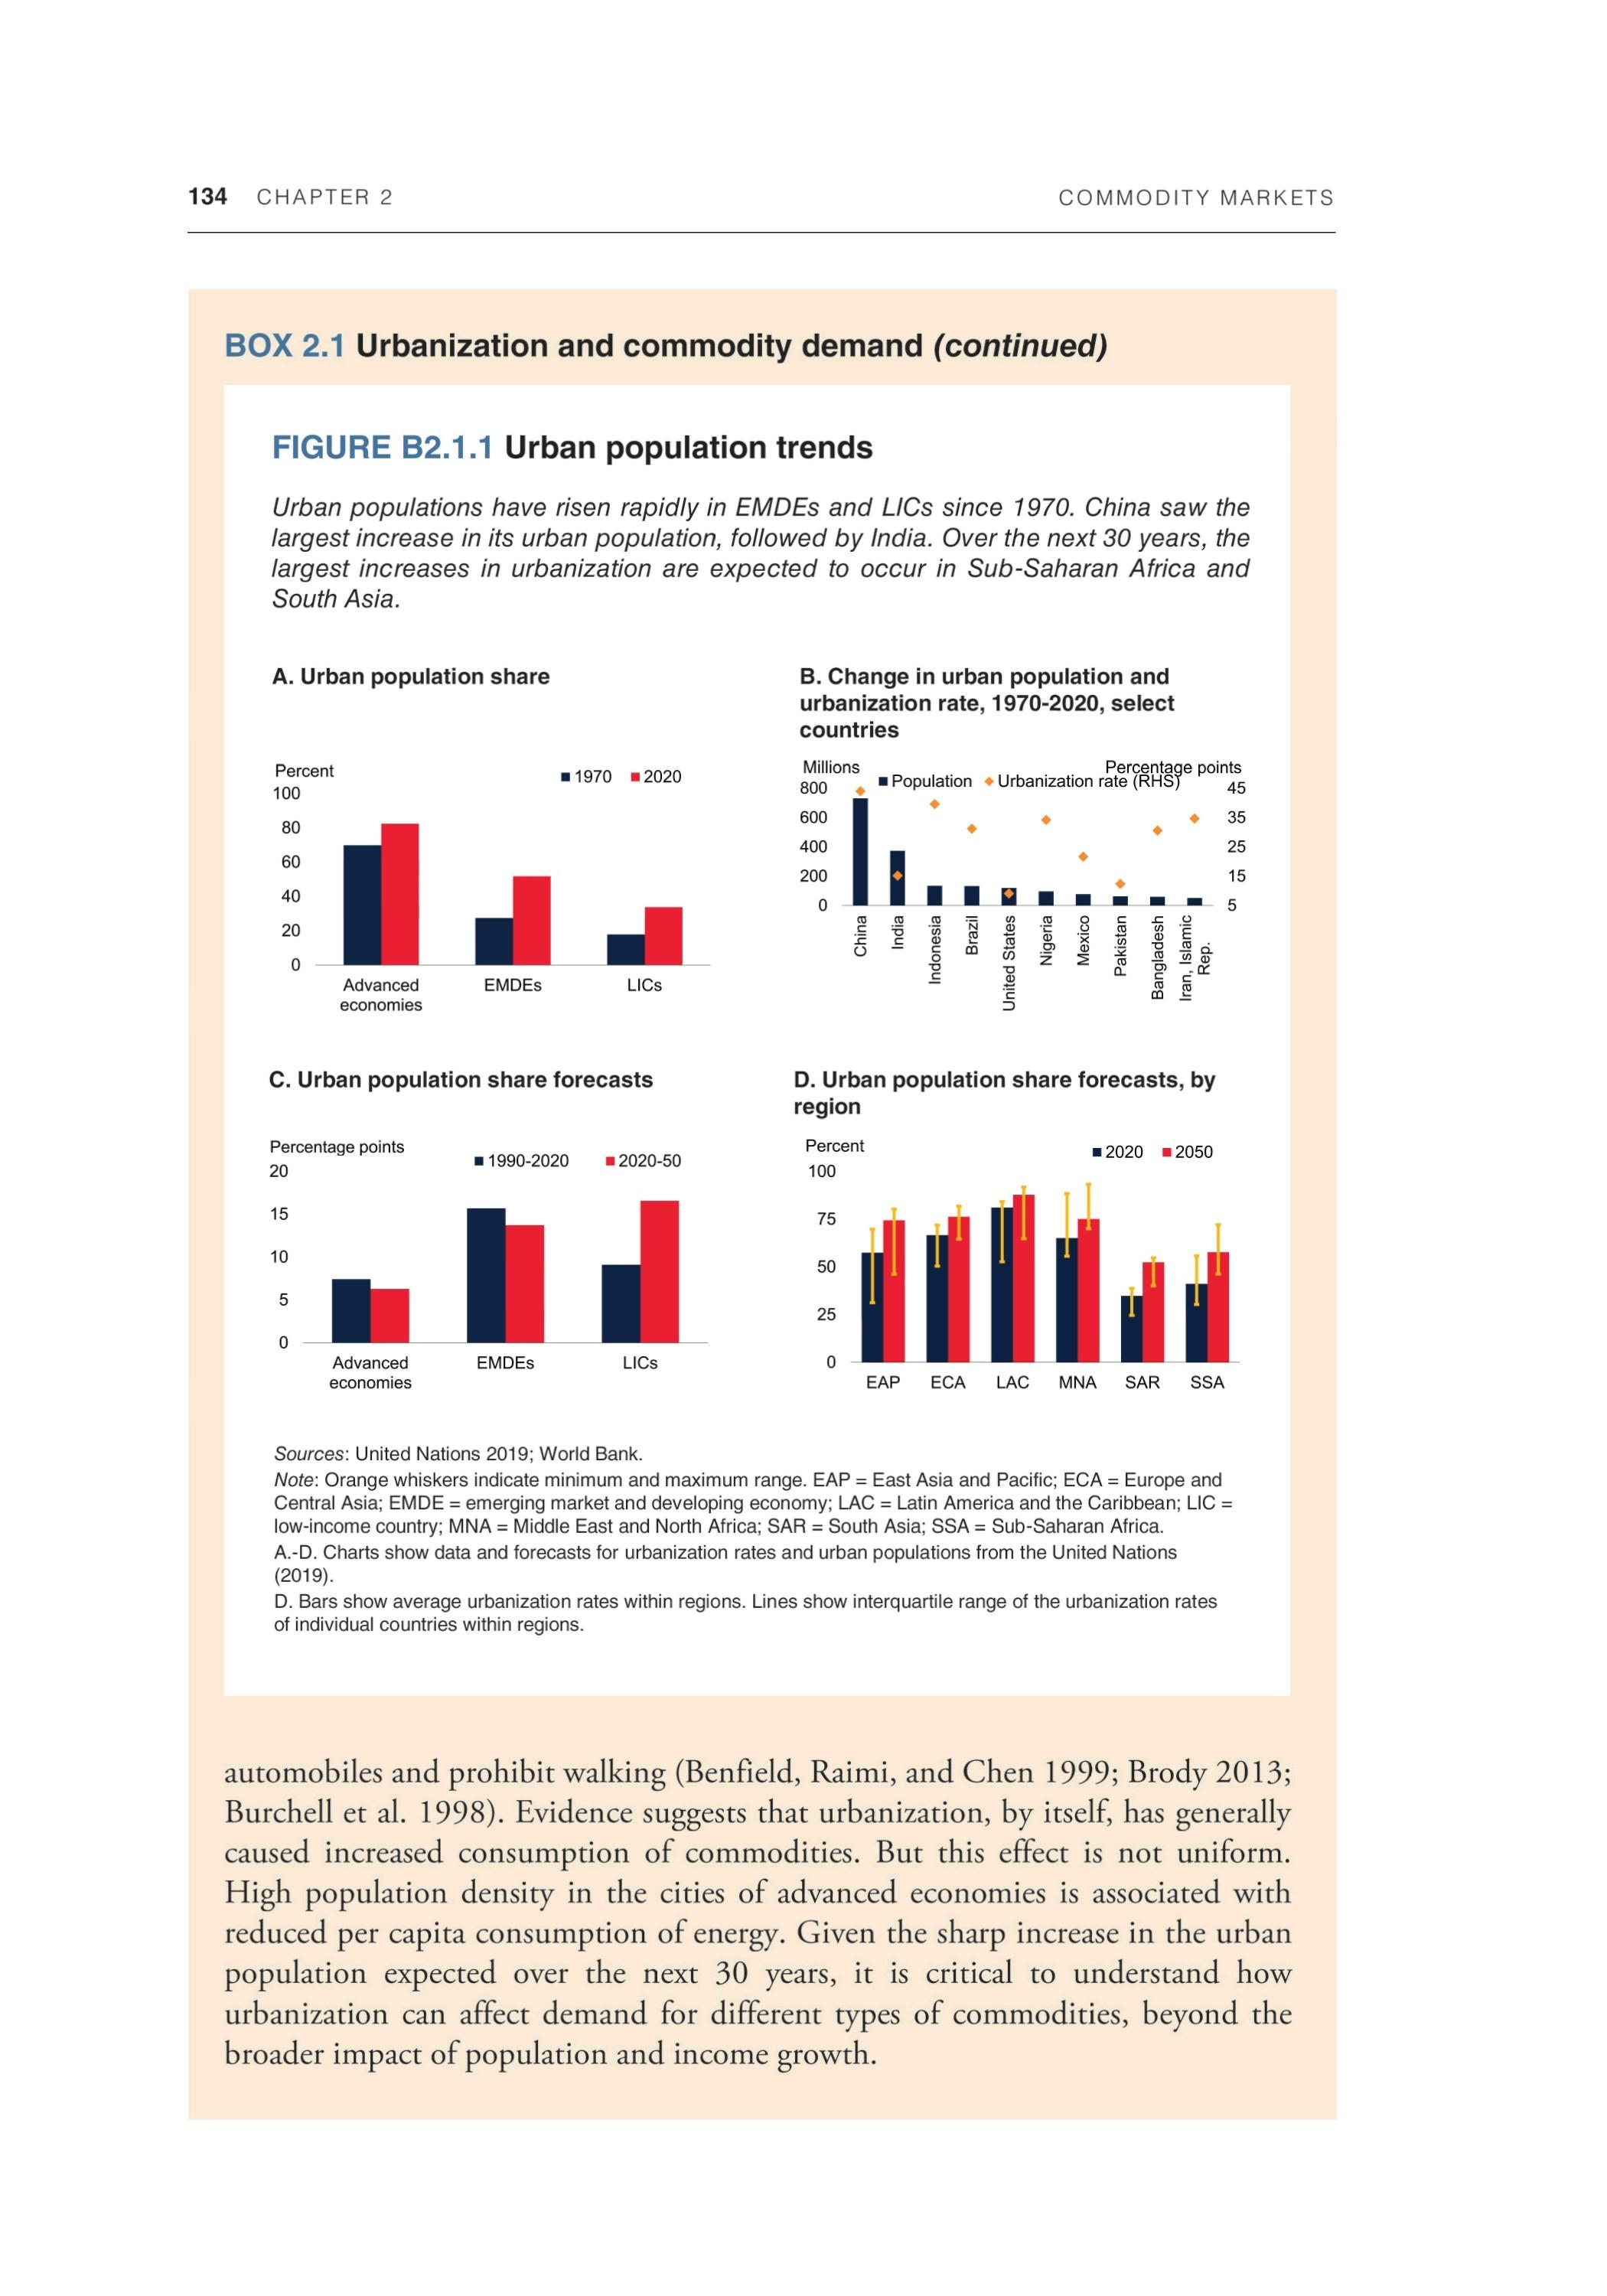
automobiles and prohibit walking (Benfield, Raimi, and Chen 1999; Brody 2013; Burchell et al. 1998). Evidence suggests that urbanization, by itself, has generally caused increased consumption of commodities. But this effect is not uniform. High population density in the cities of advanced economies is associated with reduced per capita consumption of energy. Given the sharp increase in the urban population expected over the next 30 years, it is critical to understand how urbanization can affect demand for different types of commodities, beyond the broader impact of population and income growth.
COMMODITY MARKETS CHAPTER 2 135
Against that backdrop, this box reviews the literature on the relationship between urbanization and commodity demand and asks the following questions:
• What is the nature of urbanization?
• What are the channels through which urbanization can affect commodity demand?
• What are the empirical effects of urbanization on commodity demand?
The nature of urbanization
Although the share of the population living in urban areas has risen globally, the density of urban areas varies significantly across and within countries and has changed over time.
Defining urban areas. Definitions of what constitutes an urban area differ greatly between countries, with officially designated minimum sizes ranging from 200 people in Denmark and Sweden, to 50,000 in Japan (figure B2.1.2; United Nations 2019). Furthermore, some countries use metrics such as population density instead of population size. In addition, definitions of what areas to include in urban regions vary substantially across countries/ For example, suburban areas may not be officially part of the city but may be considered for economic purposes part of the urban area. The size of defined urban areas varies considerably, from megacities containing 10 million or more people, to urban areas with fewer than 300,000 people. Although a majority of the world's population lives in an urban area, two-fifths live in urban areas of fewer than 300,000 people.
Density of urban areas. On average, the larger a city is, the denser it is. However, similar-sized cities can vary substantially (Dijkstra, Florczyk et al. 2020). Cities in Asia have much higher density than cities in the United States—among the 100 largest cities in the world, 9 of the 10 least densely populated are in the United States. Population densities of large cities in India are orders of magnitude greater than those U.S. cities. The types of density also vary. For example, the skyline of cities can be vastly different between countries. Richer cities tend to be more "pyramid shaped"—that is, with more taller buildings and skyscrapers, whereas
a. To facilitate the comparison of urban areas, the United Nations endorsed a new methodology to define cities, towns, and rural areas on the basis of total population and population density within population grids (Dijkstra, Florczyk et al. 2020; United Nations 2020). Under this definition, the share of the population living in urban areas increases substantially (in 2015, by 22 percentage points), in part because several large countries classify most towns as rural areas (Dijkstra, Hamilton et al. 2020).
136 CHAPTER 2 COMMODITY MARKETS
FIGURE B2.1.2 Urban population share and population density
The population threshold for defining an urban area varies greatly across countries. On the basis of official definitions, about 60 percent of the world's population lives in urban areas. About 50 percent of the urban population lives in cities of fewer than 300,000 people. Population densities of the largest cities in EMDEs, especially in Asia, are an order of magnitude greater than of cities in the United States.
A. Population threshold for "urban area" B. Global distribution of population, by city size
C. Population density of cities D. Population density and carbon emissions in selected cities
Sources: Our World in Data; UN Habitat 2020; World Bank. Note: EMDE = emerging market and developing economy; km = kilometer; RHS = right-hand side; tCO2 = metric tons of carbon dioxide emission. A. Chart shows the variances in definitions among countries for the minimum number of inhabitants needed for a settlement to classify as an "urban area." Sample includes 100 countries. It does not include countries that do not rely on a population threshold and instead consider other metrics, including population density. B. Chart shows the percent of the world's population living in urban and rural areas, with urban areas split by size of city. C. Population density of world's 100 largest cities. Chart shows the 10 least dense and most dense cities. Data from 2014. D. The y-axis shows metric tons of CO2 emissions per capita from transportation; the x-axis shows population density of 40 major cities. Data are from 2016 to 2019.
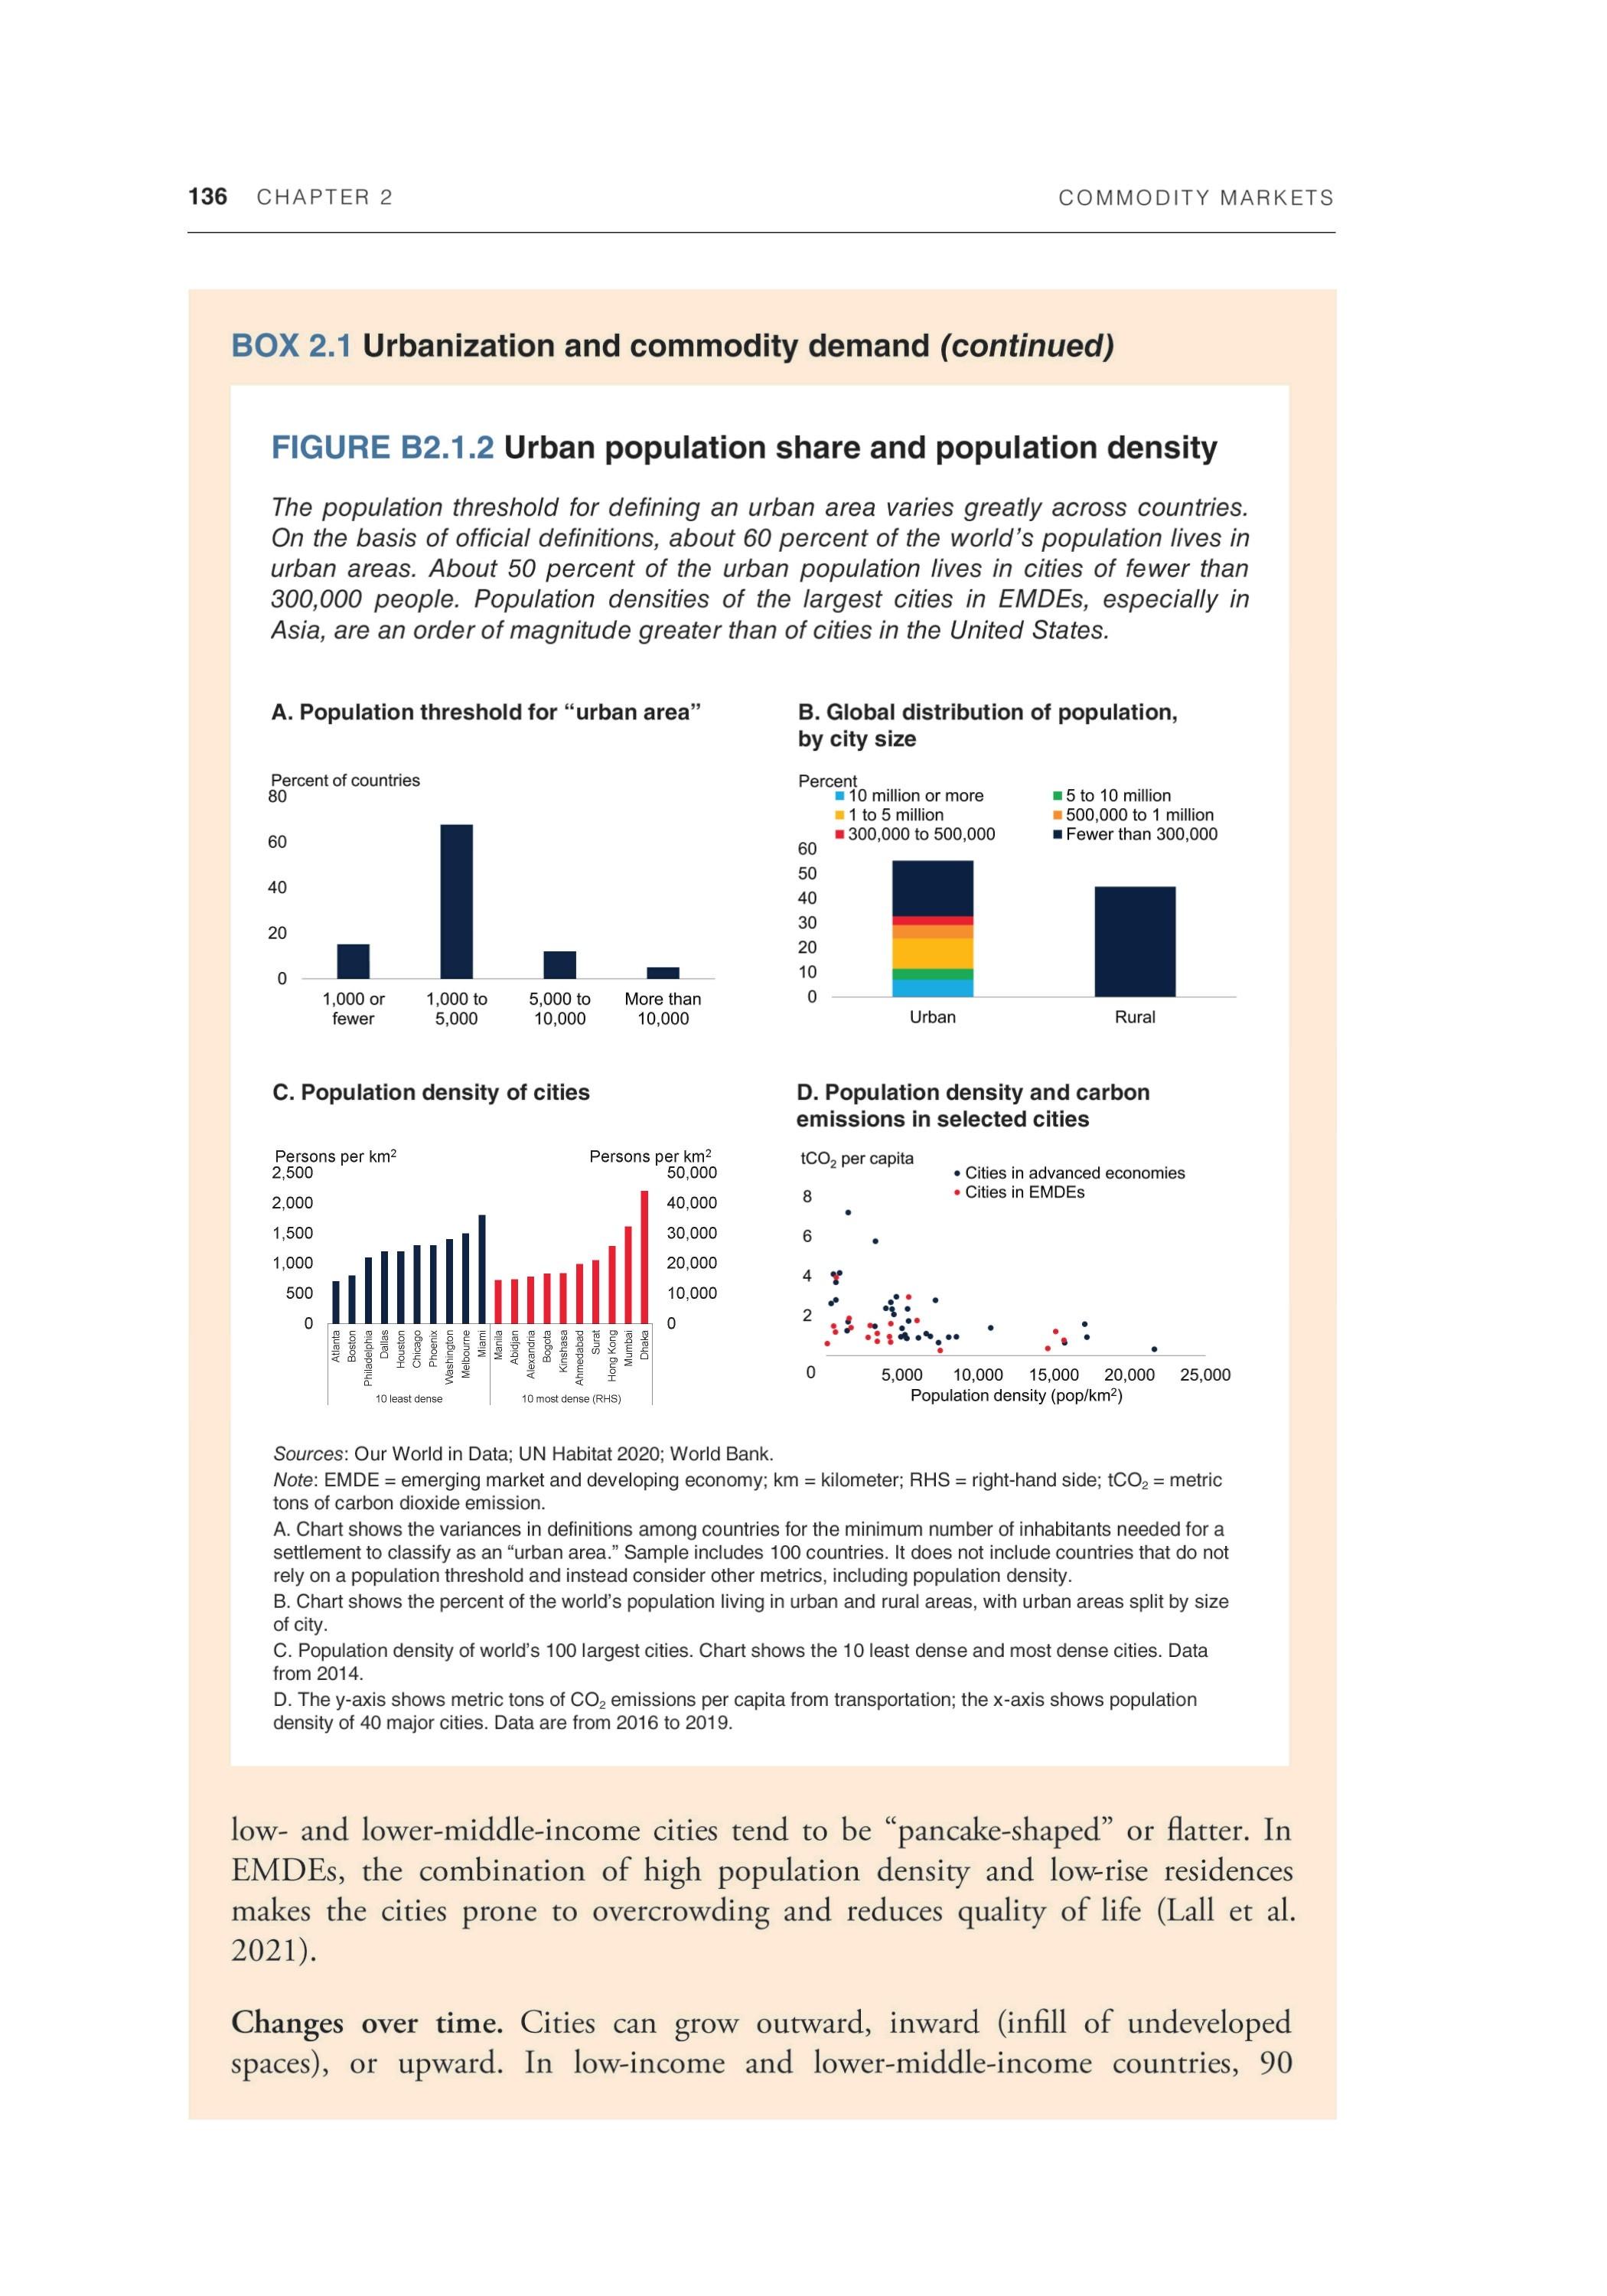
low- and lower-middle-income cities tend to be "pancake-shaped" or flatter. In EMDEs, the combination of high population density and low-rise residences makes the cities prone to overcrowding and reduces quality of life (Lall et al. 2021).
Changes over time. Cities can grow outward, inward (infill of undeveloped spaces), or upward. In low-income and lower-middle-income countries, 90
COMMODITY MARKETS CHAPTER 2 137
percent of urban built-up area expansion occurred as horizontal or outward growth between 1990 and 2015, and only 10 percent as infill. In high-income countries, however, about 30 percent occurred as infill (Lall et al. 2021). Population densities have generally increased, however, as urban populations have grown faster than urban areas have expanded. Between 1990 and 2015, global population densities of cities rose by 8 percent, with larger cities experiencing the biggest increase in density (Dijkstra, Florczyk et al. 2020). In contrast, small cities (fewer than 250,000 people) experienced declines in population density.b
Channels: From urbanization to commodity demand
Urbanization affects commodity consumption through several channels. These channels include the impact of urbanization on transportation behavior, infrastructure needs, household characteristics, and consumer choice.
Transportation. Urbanization has the potential to either raise or lower energy demand from transportation. Studies finding that urbanization reduces energy demand from transportation typically focus on the fact that high-density neighborhoods facilitate journeys by foot or by bicycle, and effective mass transit systems provide alternatives to personal motorized vehicles (figure B2.1.3; Brownstone and Golob 2009; Kahn 2000; Liddle and Lung 2010; Newman 2006). In contrast, studies finding that an increase in the urban population increases transportation energy demand focus on factors that can result in increased journeys. In the absence of mass transit systems, rising urban populations can result in increased dependence on cars, because residences and workplaces are typically separated in cities (Glaeser and Kahn 2010; Jones 2004; Marshall 2007). Urban sprawl can exacerbate this issue and lead to increased auto use (Burchell et al. 1998; Hankey and Marshall 2010; VandeWeghe and Kennedy 2007).c
In EMDEs, the move from rural to urban areas may see a shift from mainly muscle-powered transportation (such as walking or biking) to motorized transportation (such as cars, motorcycles, and buses), leading to a net increase in energy consumption (Parikh and Shukla 1995). This increase occurs particularly when cities have not been well planned (Wahba 2019). In addition, the reliance of cities on commodities, such as food, produced outside their borders can result in increased energy use because these products need to be transported and stored;
b. In contrast, earlier studies found that population densities had decreased over time. Those studies had a higher estimate of the increase in urban areas because they used different methodologies (Angel et al. 2016; UN Habitat 2020). c. Causation may also run in the opposite direction, whereby the development of the automobile facilitated lower-density cities.
138 CHAPTER 2 COMMODITY MARKETS
BOX 2.1 Urbanization and commodity demand (continued)
FIGURE B2.1.3 Urban populations and transportation-related energy demand in the United States
Low levels of population density are associated with much higher energy consumption from transportation in the United States. Rural populations tend to drive more and walk less than their urban counterparts. Similarly, high rates of urban density facilitate the use of public transportation, with commuter rates much higher in large, dense cities. Household energy use is higher in detached houses than in apartments, and energy use is also higher in smaller households.
A. Population density and transportation-related energy consumption in the United States
B. Miles driven per year
C. Frequency of walking for travel
D. Share of workers commuting by public transport
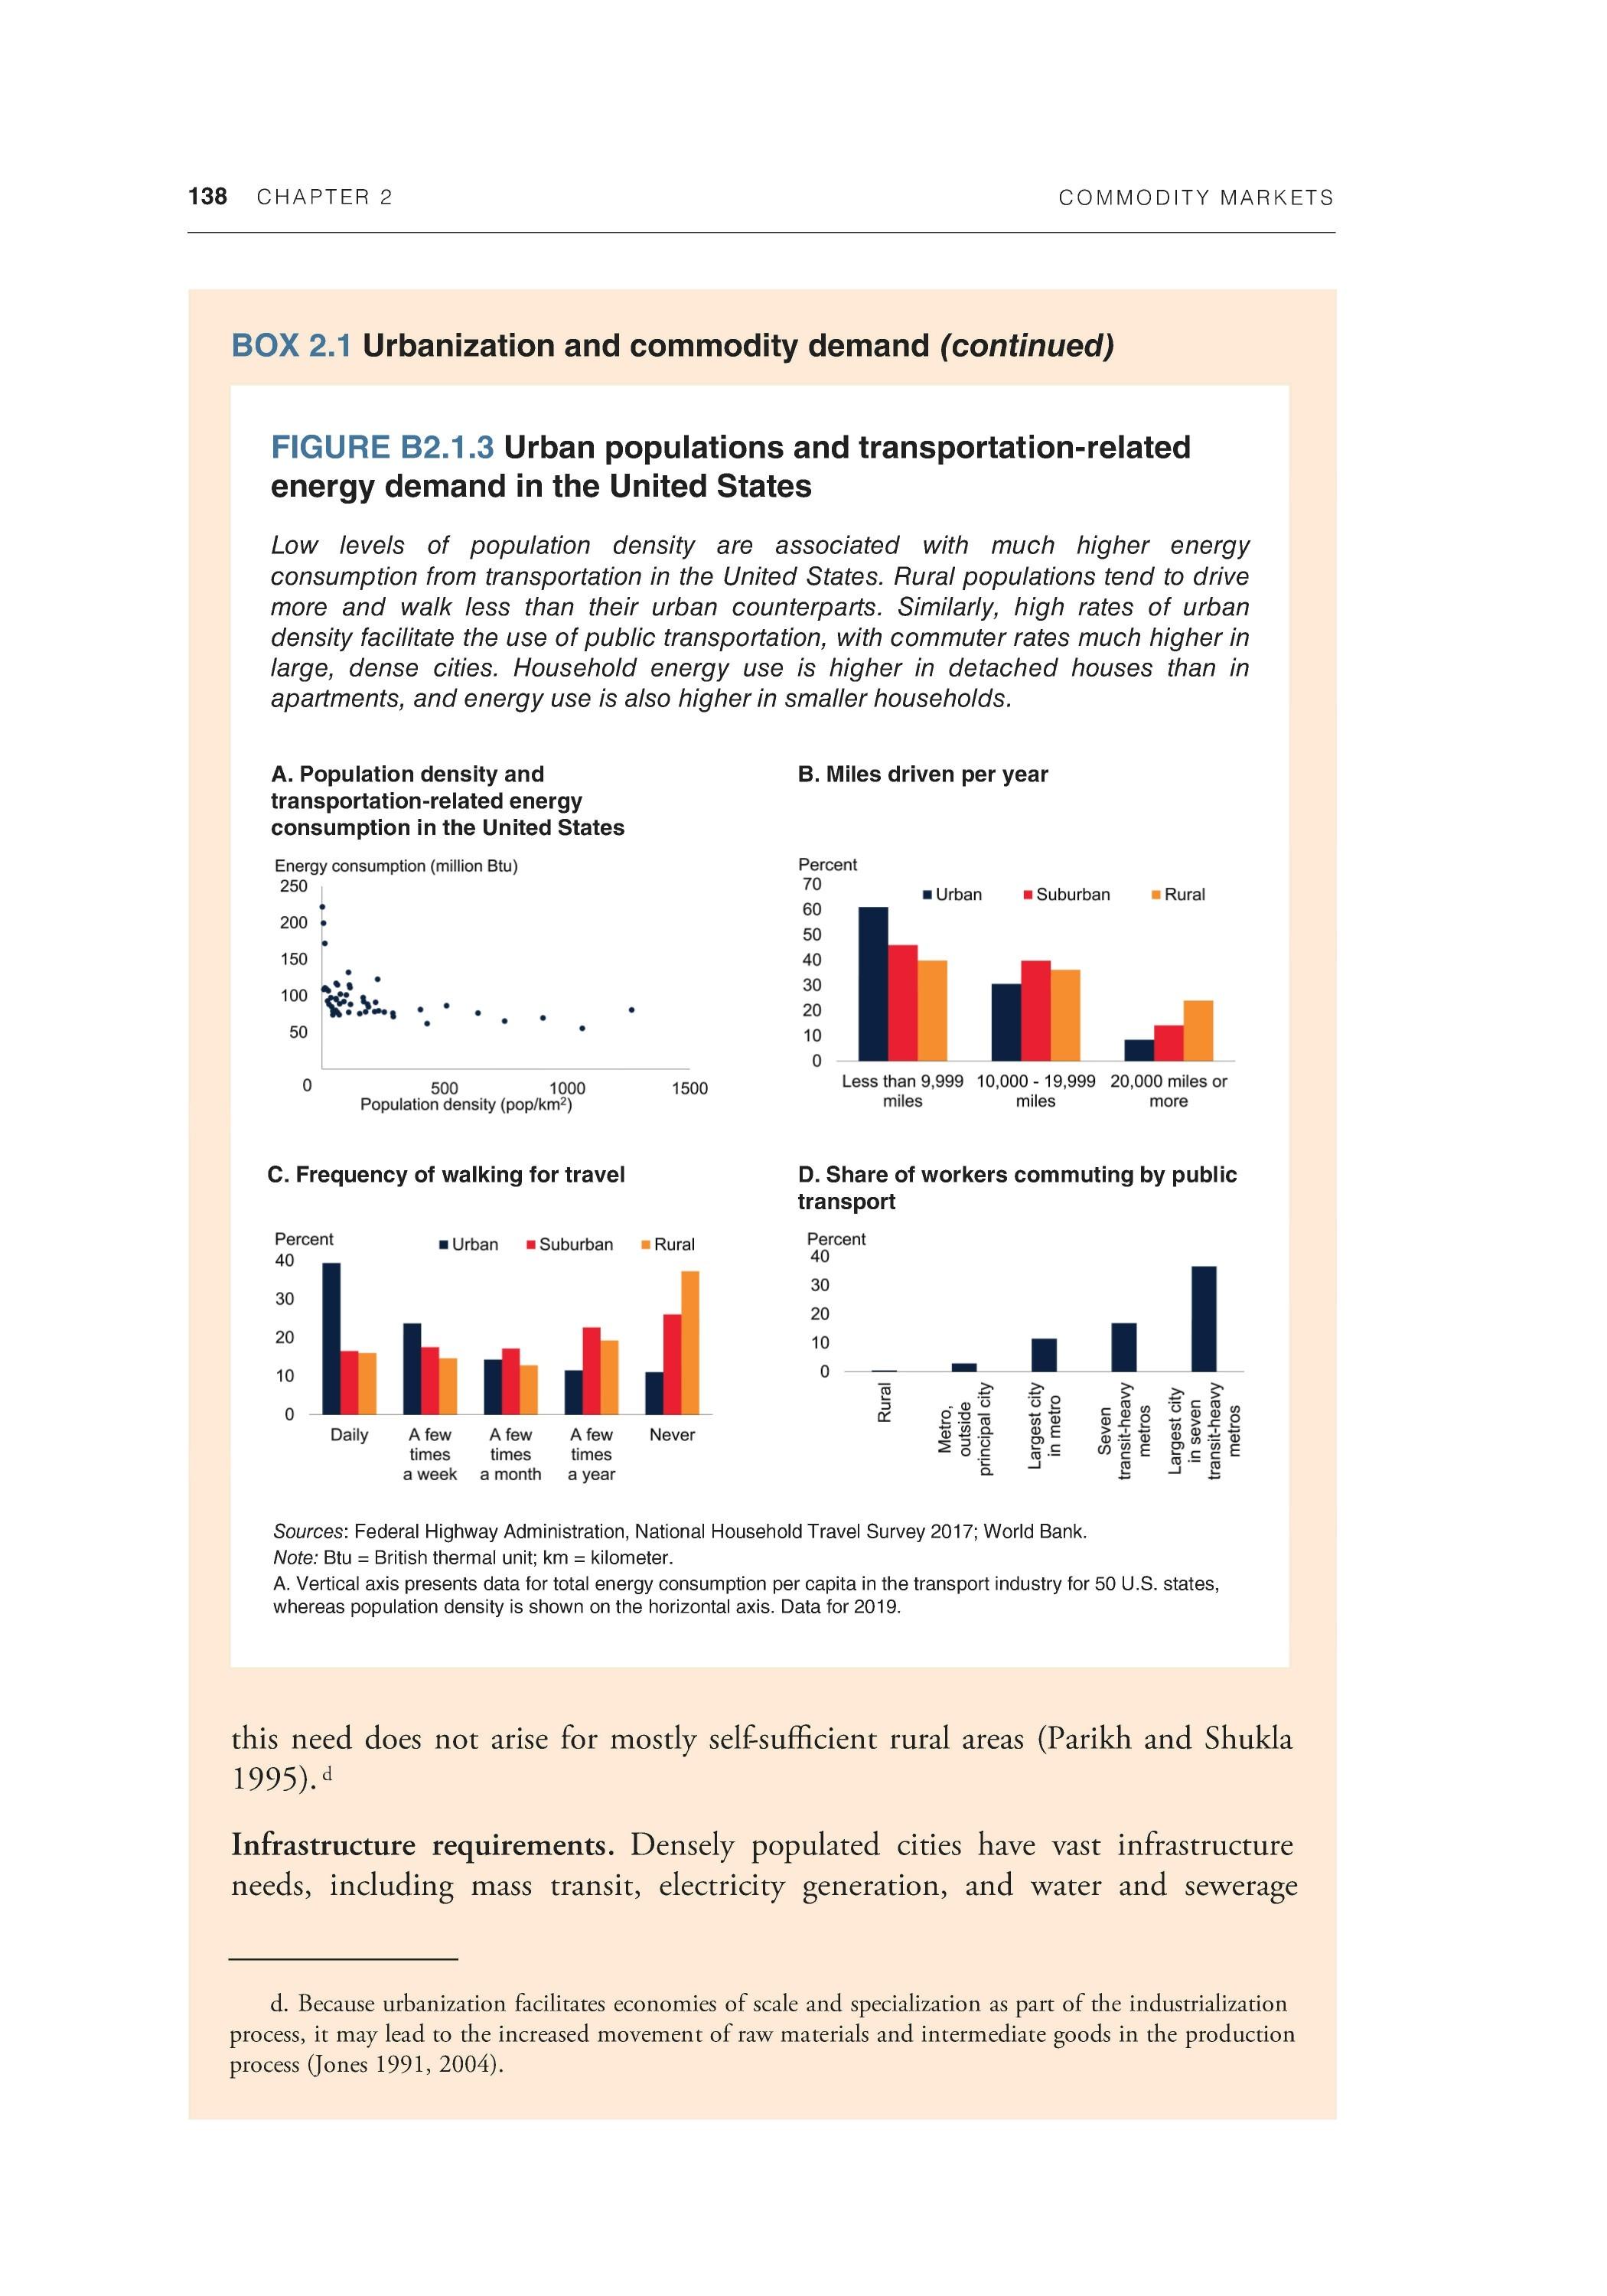
Sources: Federal Highway Administration, National Household Travel Survey 2017; World Bank. Note: Btu = British thermal unit; km = kilometer. A. Vertical axis presents data for total energy consumption per capita in the transport industry for 50 U.S. states, whereas population density is shown on the horizontal axis. Data for 2019.
this need does not arise for mostly self sufficient rural areas (Parikh and Shukla 1995).d
Infrastructure requirements. Densely populated cities have vast infrastructure needs, including mass transit, electricity generation, and water and sewerage
d. Because urbanization facilitates economies of scale and specialization as part of the industrialization process, it may lead to the increased movement of raw materials and intermediate goods in the production process (Jones 1991, 2004).
COMMODITY MARKETS CHAPTER 2 139
services (Eberts and McMillen 1999). Economies of scale and network effects may, however, make the provision of the service more efficient (that is, on a per capita basis). At the same time, it is possible that urbanization and high-density living create new demands for infrastructure. For example, high-density urban populations have greater need than low-density rural areas for sewerage systems.
Household size and type of accommodation. An increase in the share of the urban population can lead to differences in household characteristics, with either positive or negative impacts on energy consumption. Apartments are much more common in cities than in rural areas because of higher land costs. Apartments have lower energy use than detached houses because apartments have fewer exterior walls, which reduces energy loss from heating and cooling (Brounen, Kok, and Quigley 2012; Satterthwaite 2011). However, differences in household composition may partly offset this advantage. Average household size tends to be smaller in urban areas, as young people move away from their family home and delay forming households (Cole and Neumayer 2004). Smaller households tend to have higher per capita energy consumption because they benefit less from economies of scale in energy consumption compared with larger households (Liu et al. 2003).
Changes in the composition of energy demand. Urbanization can also lead to changes in the types of fuel consumed within a country. As households move from rural to urban areas, they typically move from more basic forms of energy, such as biomass, toward more modern energy forms, such as electricity from centralized power stations fueled by coal or natural gas (Barnes, Krutilla, and Hyde 2005). This shift has the potential to reduce commodity demand because the provision of energy in the form of centrally generated electricity or natural gas is typically more efficient (Pachauri and Jiang 2009; Poumanyvong and Kaneko 2010). However, greater access to better-quality, cheaper energy such as electricity may lead to increased consumption of energy (Gillingham, Rapson, and Wagner 2016; IEA 2008).
The heat island effect. Urban areas give rise to the heat island effect, whereby structures such as roads and buildings absorb and reemit heat from the sun to a greater degree than natural landscapes (Imhoff et al. 2010). Urban areas, particularly cities with larger and denser populations, are hotter than nearby rural or natural areas, although the effect can vary between cities depending on the extent of green space within them. These variations can increase energy demand for cooling in hotter countries and during summer; however, it can reduce energy demand for heating in countries with cold winters.
Increased consumer choice. Consumers living in cities benefit from a larger choice of goods and services, which can lead to increased consumption by
140 CHAPTER 2 COMMODITY MARKETS
BOX 2.1 Urbanization and commodity demand (continued)
increasing access to new products. Access to larger markets enables producers and retailers to specialize and supply a wider variety of goods and services. All else equal, a rise in consumption due to increased choice, beyond that caused by increased income, would result in an increase in commodity demand. For example, urban diets are typically more varied and include a greater share of meat and processed food, which require more energy and other commodities in their production (Hovhannisyan and Devadoss 2020; Regmi and Dyck 2001). However, because income is the primary driver of per capita commodity demand, and higher incomes generate more choices for the consumer, these studies leave open the size and direction of the impact of urbanization on commodity demand.
This section is based on a survey of literature on how urbanization affects commodity demand (see table 2.2 in the main text of the chapter). The research can be broadly split into two fields: studies that investigated the effect of the share of the urban population and studies that delve deeper by considering urban density (differences between high- and low-density urban areas within a country). The majority of the studies on the share of urban populations used panel data sets with a wide range of economies. They focused mainly on aggregate energy consumption, although some looked at individual sources of demand for energy. This group included some single-country studies, with two for food consumption. In contrast, the studies examining urban density in individual countries covered only advanced economies (Canada, Japan, the Netherlands, and the United States), likely because of greater data availability. Their main focus was on sectoral demand for energy (for example, transportation or dwellings). All studies in the literature review controlled for per capita income.
Share of urban populations. Higher urban population shares were positively correlated with energy demand in almost all cross-country studies. One study found the relationship varied by income level, with a negative relationship for low-income countries, but a positive relationship for higher-income countries; this finding was attributed to efficiency gains arising from shifts to more modern fuels (Poumanyvong and Kaneko 2010). A study investigating metals consumption also found a positive impact of urbanization on demand (Baffes, Kabundi, and Nagle 2022). Three studies investigated food consumption and found little impact from urbanization after controlling for income (Hovhannisyan and Devadoss 2020; Pandey et al. 2020; Stage, Stage, and McGranahan 2010).
Urban density. Of the studies examining the impact of urban density, all found a negative relationship with energy demand. These studies considered a variety of energy uses, including for transportation, dwellings, transportation and dwellings
COMMODITY MARKETS CHAPTER 2 141
together, and consumption from the service sector.e Higher-density cities had lower energy demand than lower-density ones, at least in advanced economies. The extent to which these results apply to EMDEs is unclear. Many cities in lowincome countries, particularly in Sub-Saharan Africa, struggle with high road congestion and commuting costs due to poor planning, inadequate transportation infrastructure, and limited public transit options, despite high population density (Hommann and Lall 2019).
Conclusions and policy implications
The share of the global population living in urban areas has risen rapidly over the past 50 years alongside a major increase in commodity consumption. Although income and population growth have been the primary drivers of commodity demand over time, urbanization per se has also had an effect. In general, an increase in the share of the urban population is associated with increased energy demand per capita. But the quantitative impact will depend on the nature of urbanization in particular countries. Compact, high-density cities have lower per capita energy consumption than low-density cities, particularly in advanced economies, because of greater resource efficiency in heating, shorter distances between home and work and recreation, and economies of scale in mass transit.
With urban populations expected to continue to increase, strategic urban planning that increases population density, and integrates transportation and land use, will become even more important in managing the impact of urbanization on commodity demand. f Key policy measures include the expansion of the capacity, affordability, and access of public mass transportation systems. Fiscal policies can also play a role; for example, fuel taxes have been shown to increase population density and preserve open space (Creutzig 2014; Creutzig et al. 2015). Many countries may be close to the upper limit of such taxes, however, because the tax burden falls on workers in certain urban sectors (such as truckers and taxi drivers).
In addition, well-devised incentives and regulations are required. Incentives for reduced energy consumption, including upgraded insulation in existing homes, provide a public good. Building codes can ensure that new homes meet high energy-efficiency standards. Regulations to reduce the use of private vehicles in
e. These studies considered various channels, including transportation (Brownstone and Golob 2009; Liddle 2004); dwellings (Brounen, Kok, and Quigley 2012; Lariviere and Lafrance 1999); transportation and dwellings together (Glaeser and Kahn 2010; Larson and Yezer 2015); and consumption from the service sector (Morikawa 2012). f. The development of green and sustainable cities is a key component of the World Bank's Climate Change Action Plan and is in line with the United Nations' Sustainable Development Goal 11 to make cities and human settlements inclusive, safe, resilient, and sustainable (World Bank 202 Ic).
142 CHAPTER 2 COMMODITY MARKETS
BOX 2.1 Urbanization and commodity demand (continued)
congested districts have proved effective. Zoning laws to encourage intensification through infill housing, and building up instead of out, can help reduce long commutes, increase use of public transit, and lower energy use and greenhouse gas emissions (Lall et al. 2021). Early planning and installation of transportation infrastructure is particularly crucial in rapidly growing cities because it can help guide and shape future urban growth (Hommann and Lall 2019).
gasoline and diesel). More recent innovations in oil production (in part due to a rise in oil prices after 1973), led to the exploitation of offshore oil, oil sands, and more recently shale oil. Innovations on the demand side have expanded the use of oil in new sectors, but efficiency improvements have also reduced oil use. For example, innovations in the petrochemicals industry have led to new products such as plastics and fertilizers, and the development of the jet airplane made long-distance travel and tourism available to a mass market. This development, in turn, increased demand for oil—jet fuel currently accounts for about 5 percent of global oil consumption. At the same time, innovations have sharply improved the efficiency of oil consumption, reducing the aggregate increase in demand for oil. The average fuel consumption of a new aircraft fell by 45 percent between 1968 and 2014, an average annual reduction of 1.3 percent (Kharina and Rutherford 2015).
Disruptive innovation has been common throughout history. It has been a major cause of transformation in the structure of commodity demand and a crucial factor for economic growth (Aghion, Antonin, and Bunel 2021).5 The industrial revolution led to massive, permanent, demand shifts for several commodities. Inventions during the 1700s transformed the textile industry from its cottage structure (that is, home-based factories employing a few workers) to the world's largest industry. Innovations included John Kay's flying shuttle in 1733, James Hargreaves' spinning jenny in 1764, and James Watt's steam engine in 1769, which all led to cotton replacing wool and flax.
The steam engine revolutionized land and ocean transportation. Iron replaced timber for ship bodies, and coal-fired steam engines replaced cotton sails. The internal combustion engine revolutionized transportation (both ocean and land) in the first half of the twentieth century, replacing coal with gasoline and diesel. In the second half of that century, kerosene became the main fuel for air transport. In addition, innovations in chemistry saw synthetic rubber overtake the use of natural rubber in the production of tires (figure 2.6). Unlike the routine substitutions that occur in response to a change in
5 The causation is not always unidirectional. Innovation may be induced by price changes. Discussions of substitutability go back to Hicks (1932), who argued that a change in the relative prices of the factors of production spurs innovation. Hicks' hypothesis, known as induced innovation hypothesis, has been tested extensively, including in Hayami and Ruttan 1970; Olmstead and Rhode 1993; Hanlon 2015; and Newell, Jaffe, and Stavins 1999.
COMMODITY MARKETS CHAPTER 2 143
FIGURE 2.6 Drivers of commodity demand: Technology, innovation, and policies
The invention of the steam engine led to the replacement of sailing ships by steamships, and of wooden frames along with cotton- and linen-based sail cloth (all agricultural commodities) by steel frames (made from iron ore) and steam engines (running on coal instead of wind energy). Innovations in chemistry led to synthetic rubber and polyester (made from crude oil) displacing natural rubber and cotton (agricultural commodities). Government policies can also sharply influence commodity consumption. For example, concerns about the health impact of asbestos in construction materials, and lead in paint and gasoline, led to their use being gradually phased out and eventually banned. Aided by improvements in battery technology, charging infrastructure, and government incentives, the share of hybrid and electric vehicles has enjoyed impressive demand growth.
A. Share of synthetic rubber in global rubber consumption B. Asbestos use
C. Consumption of lead in the United States D. Sales of alternative vehicles in the United States
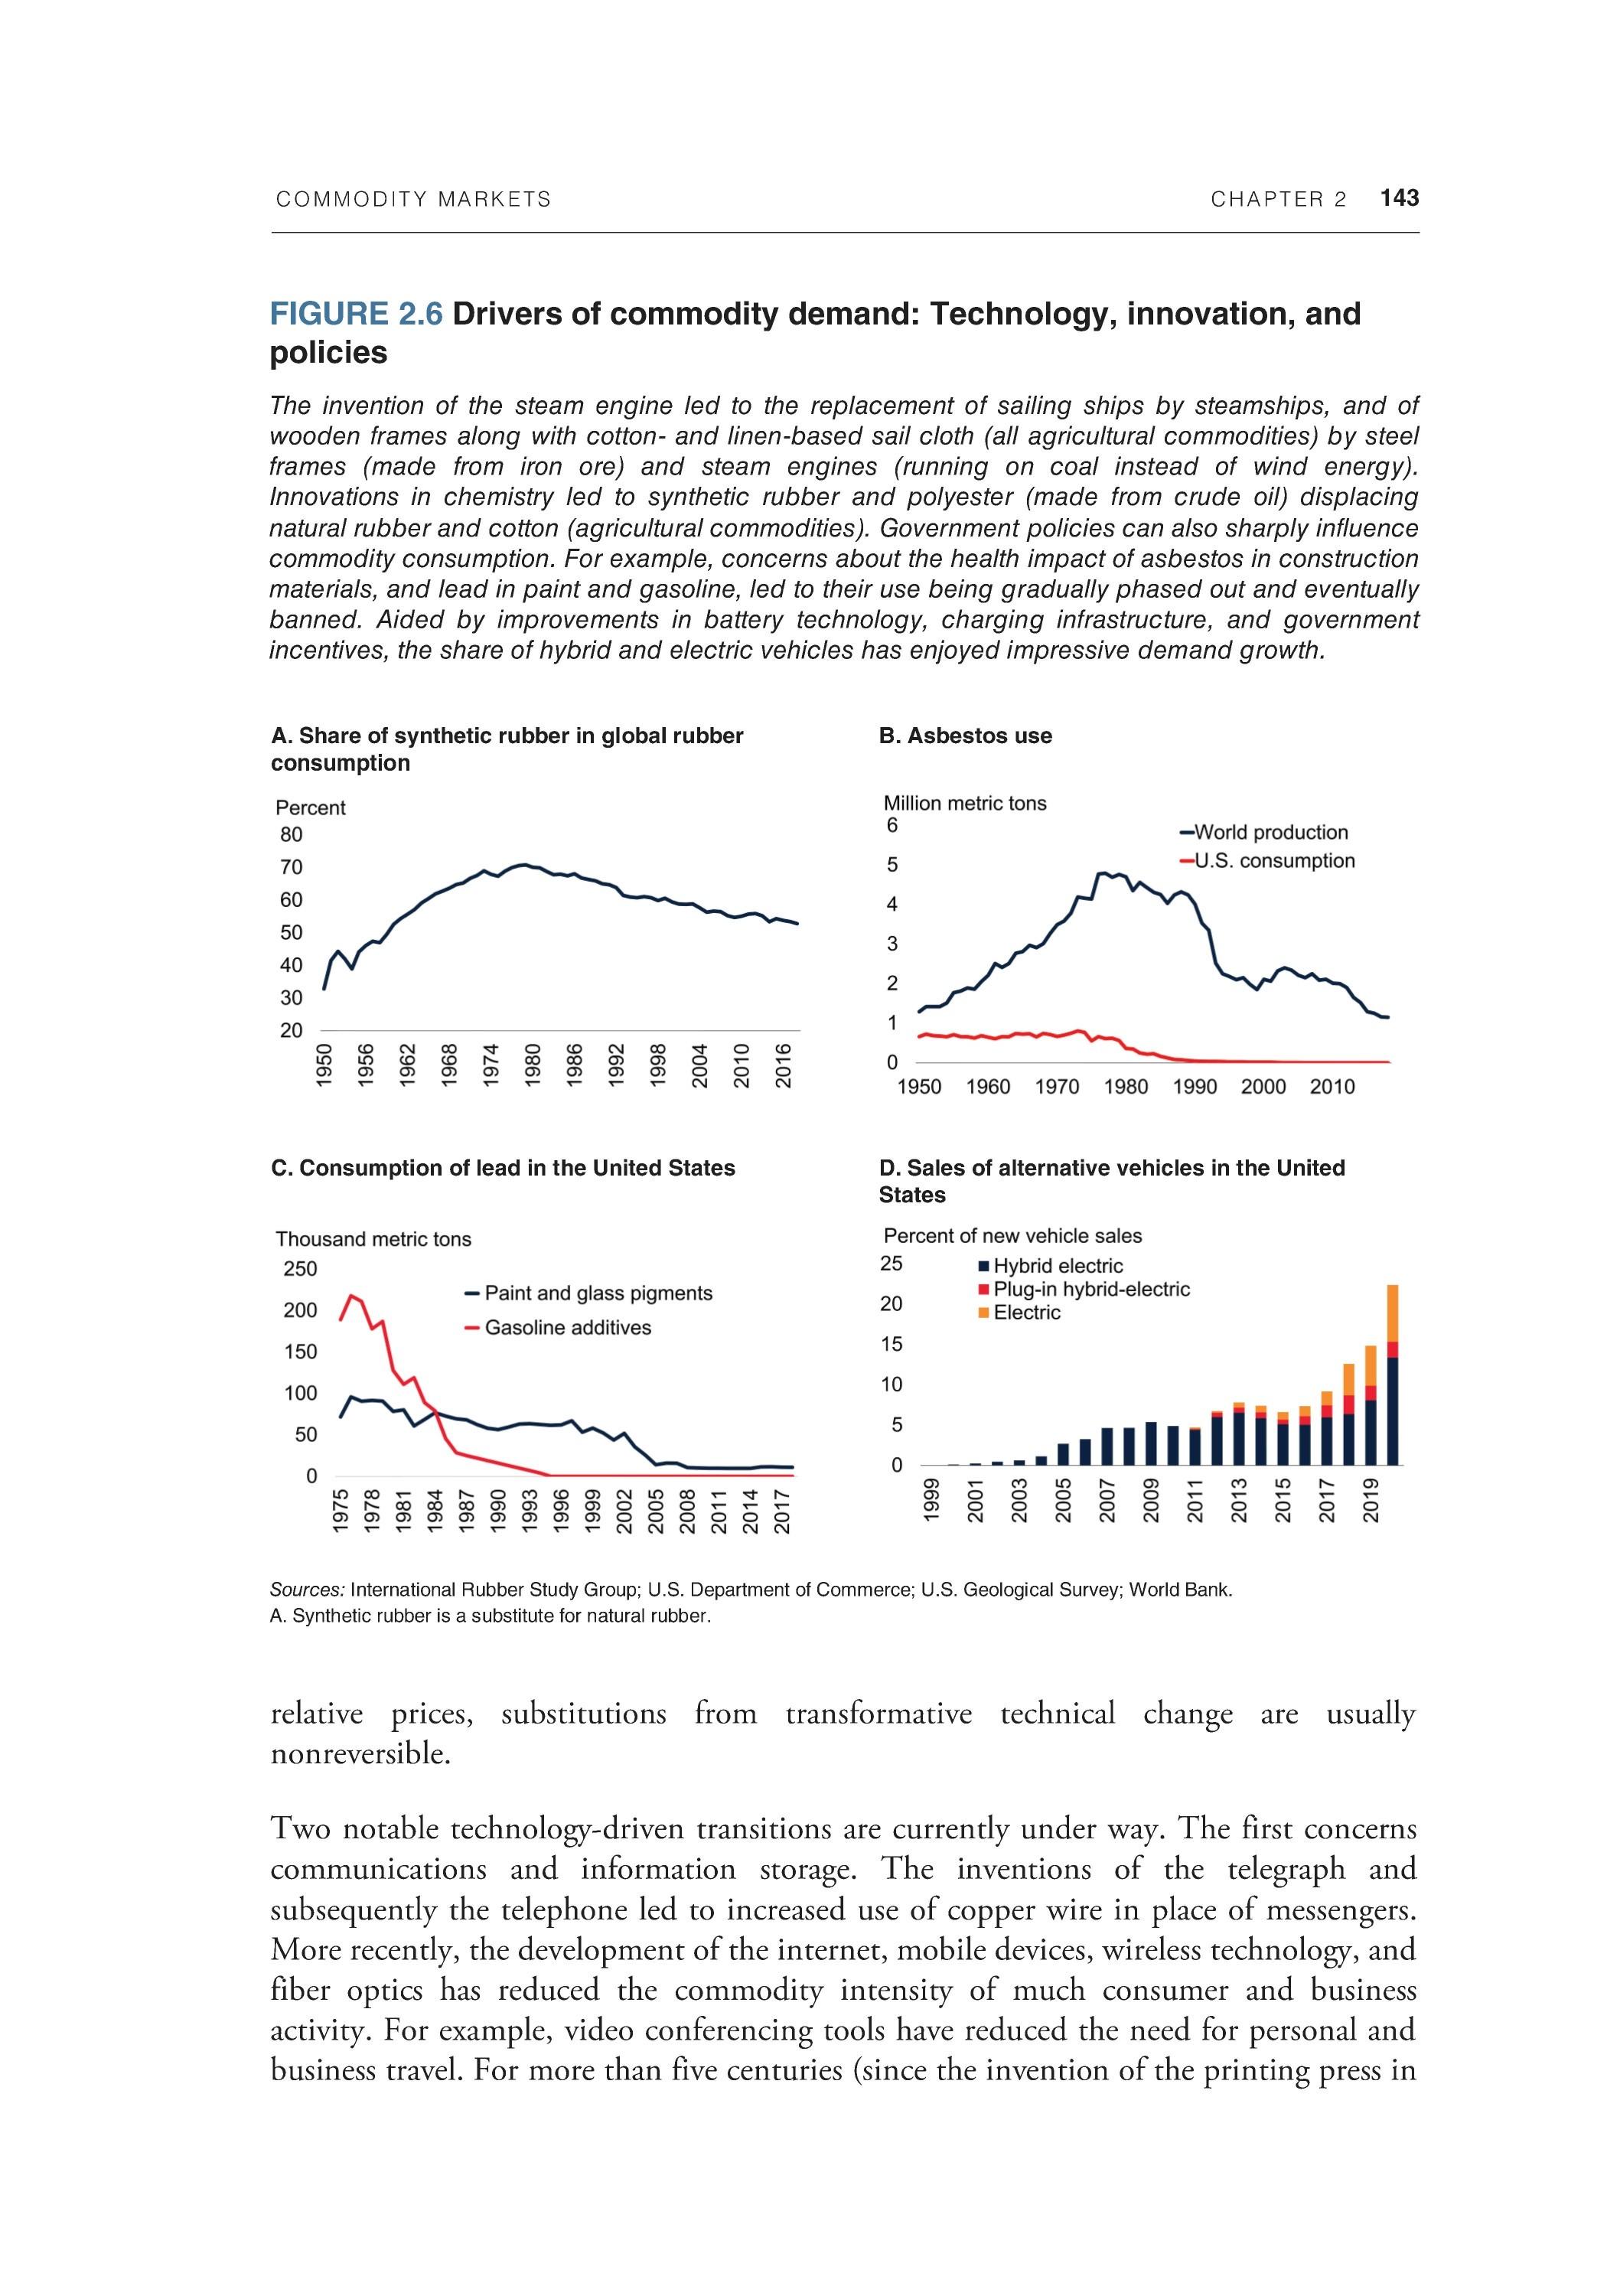
Sources: International Rubber Study Group; U.S. Department of Commerce; U.S. Geological Survey; World Bank. A. Synthetic rubber is a substitute for natural rubber.
relative prices, substitutions from transformative technical change are usually nonreversible.
Two notable technology-driven transitions are currently under way. The first concerns communications and information storage. The inventions of the telegraph and subsequently the telephone led to increased use of copper wire in place of messengers. More recently, the development of the internet, mobile devices, wireless technology, and fiber optics has reduced the commodity intensity of much consumer and business activity. For example, video conferencing tools have reduced the need for personal and business travel. For more than five centuries (since the invention of the printing press in
144 CHAPTER 2 COMMODITY MARKETS
the mid-1400s) information was typically stored and transmitted on paper made from natural fiber. Following advancements in digital technology during the late 1900s, paper is being rapidly replaced by digital storage and reading devices, thus replacing natural fibers with rare earth metals and energy. The second notable development, which has far more important implications for commodity demand and has only just begun, is the energy transition away from fossil fuels. Box 2.2 summarizes aspects of historical and current structural changes.
Co un try-level policies
Changes in government policies have resulted in major changes in commodity demand. Governments routinely use subsidies and taxes to incentivize or discourage the consumption of commodities. For example, energy subsidies are prevalent in most countries (in terms of both production subsidies and consumption subsidies) and are often used to lower the cost of energy for consumers, which would typically lead to an increase in consumption. At the same time, to reduce pollution, governments often use fuel taxes to reduce driving and consumption of gasoline or diesel. More recently, several countries have introduced special taxes on single-use plastics to address rising concerns about plastic pollution in the oceans.
Governments have sometimes introduced outright bans on the production or use of dangerous or unhealthy commodities. For example, growing awareness of the adverse health effects of lead poisoning saw the United States gradually phase out the use of lead in gasoline, paint, and plumbing. This process began around 1970, and most other countries followed suit. More recently, China has implemented a range of regulations to improve air pollution in cities, including restrictions on metal smelting.
International policies
Throughout the twentieth century, numerous international commodity agreements have had a major impact on consumption patterns.6 These agreements, often negotiated among both commodity-exporting and commodity-importing countries, were designed to mitigate the negative impacts of boom-and-bust cycles and reduce price volatility common to commodity prices. However, in practice, the agreements have distorted commodity markets by keeping prices high and stable, which encouraged consumers to reduce consumption, raise efficiency, or use substitute products (World Bank 2020). For example, the International Tin Agreement restricted the supply of tin and kept prices elevated for several years, but it resulted in the widespread substitution of aluminum for tin, especially in the beverage can industry. All efforts to manage non-energy commodity markets through international agreements have failed.
6 Commodity agreements have covered the entire spectrum of commodity markets and have been researched in the literature, including for coffee (Akiyama and Varangis 1990), tin (Chandrasekhar 1989), natural rubber (Verico 2013), and groups of nonoil commodities over time (Davis 1946; Gilbert 2011; Roberts 1951).
C O M M O D I TY M A R K E TS CHAPTER 2 145
BOX 2.2 Substitution among commodities: Reversible and permanent shifts
Substitution among commodities is a key feature of market behavior. Substitution of one good for another may follow changes in relative prices or incomes, with technology remaining basically the same. It often involves routine, reversible, shifts among similar commodities, for example, natural gas for oil, or plastic for paper packaging. However, the underlying cause of transformative substitutions since the industrial revolution has been the development and adoption of new technologies. Historical examples are the replacement of animal and wind power by steam, or the substitution of jet fuel for bunker oil in transcontinental travel. Technology and policies in response to climate change could drive a new transformation, to a lower-carbon economy. These forces will profoundly transform the structure of commodity consumption over the next few decades. The metals and other materials required to produce clean energy could see a strong rise in output, whereas the consumption of fossil fuels will start a permanent decline.
Introduction
Substitution between commodities is a routine but key feature of markets. For example, in many countries over the past 15 years natural gas has been supplanting coal for the generation of electricity. This substitution represents the normal functioning of the market mechanism, as an increased global supply of gas (especially due to rising U.S. shale gas production) caused a decline in its relative price that induced a matching increase in demand. In 2021, a surge in natural gas prices led to a reversal of this change, with countries switching to coal (and even crude oil) as fuel for electricity generation (World Bank 202Ib).
Substitution among materials used as inputs in the production of final goods can take place at both short- and long-term horizons, as well as within and across commodity groups (Tilton and Guzman 20l6).a If a good or service can be provided more cheaply via the use of a different commodity, consumers will switch. In the long run, such substitution of inputs, in response to price changes or other incentives, can occur on a much larger scale as new capital equipment and production processes move to the least-cost options.
Substitution is very common as a response to changes in relative prices or relative scarcity among commodities belonging to the same group. In agriculture, soybean oil is a close substitute for palm oil for human consumption, and soybean meal
a. As Wellmer (2012, 11) noted: [W]e do not consume resources per se but their inherent functions or their physical and chemical properties. We do not need one tonne of copper: we need its electrical conductivity for transmitting power supply or transferring messages via electric pulses in telephone wires. This latter function can be ensured via fiber cables, directional antennae or mobile phone. So, we have substitution in the narrow sense (glass fiber vs. copper) and functional substitution to obtain the same function. Every technical solution has its own raw-material profile.
146 CHAPTER 2 COMMODITY MARKETS
BOX 2.2 Substitution among commodities: Reversible and permanent shifts (continued)
FIGURE B2.2.1 Historical episodes of substitution
By 1890, steam accounted for more ship power than sail, and by 1920 that replacement was almost total. Following the introduction of aluminum beer cans in the mid-1960s, their share of shipments reached three-quarters by 1986 (they replaced refutable glass bottles and tin cans). In the early 1800s, wool and flax dominated fiber consumption. They were gradually replaced by cotton over the next 150 years. After World War II, synthetic fibers accounted for more than half of global fiber consumption. When prices of oil increased sevenfold after the oil crises of the 1970s, crude oil's share in electricity generation declined rapidly, replaced by natural gas and, to a lesser extent, coal. More recently, the share of renewable energy in electricity generation has risen rapidly, driven by a sharp decline in renewable energy costs.
A. Shipping capacity in the United Kingdom B. World fiber consumption, by type
C. Global electricity generation, by fuel D. Share of aluminum cans in beverage containers
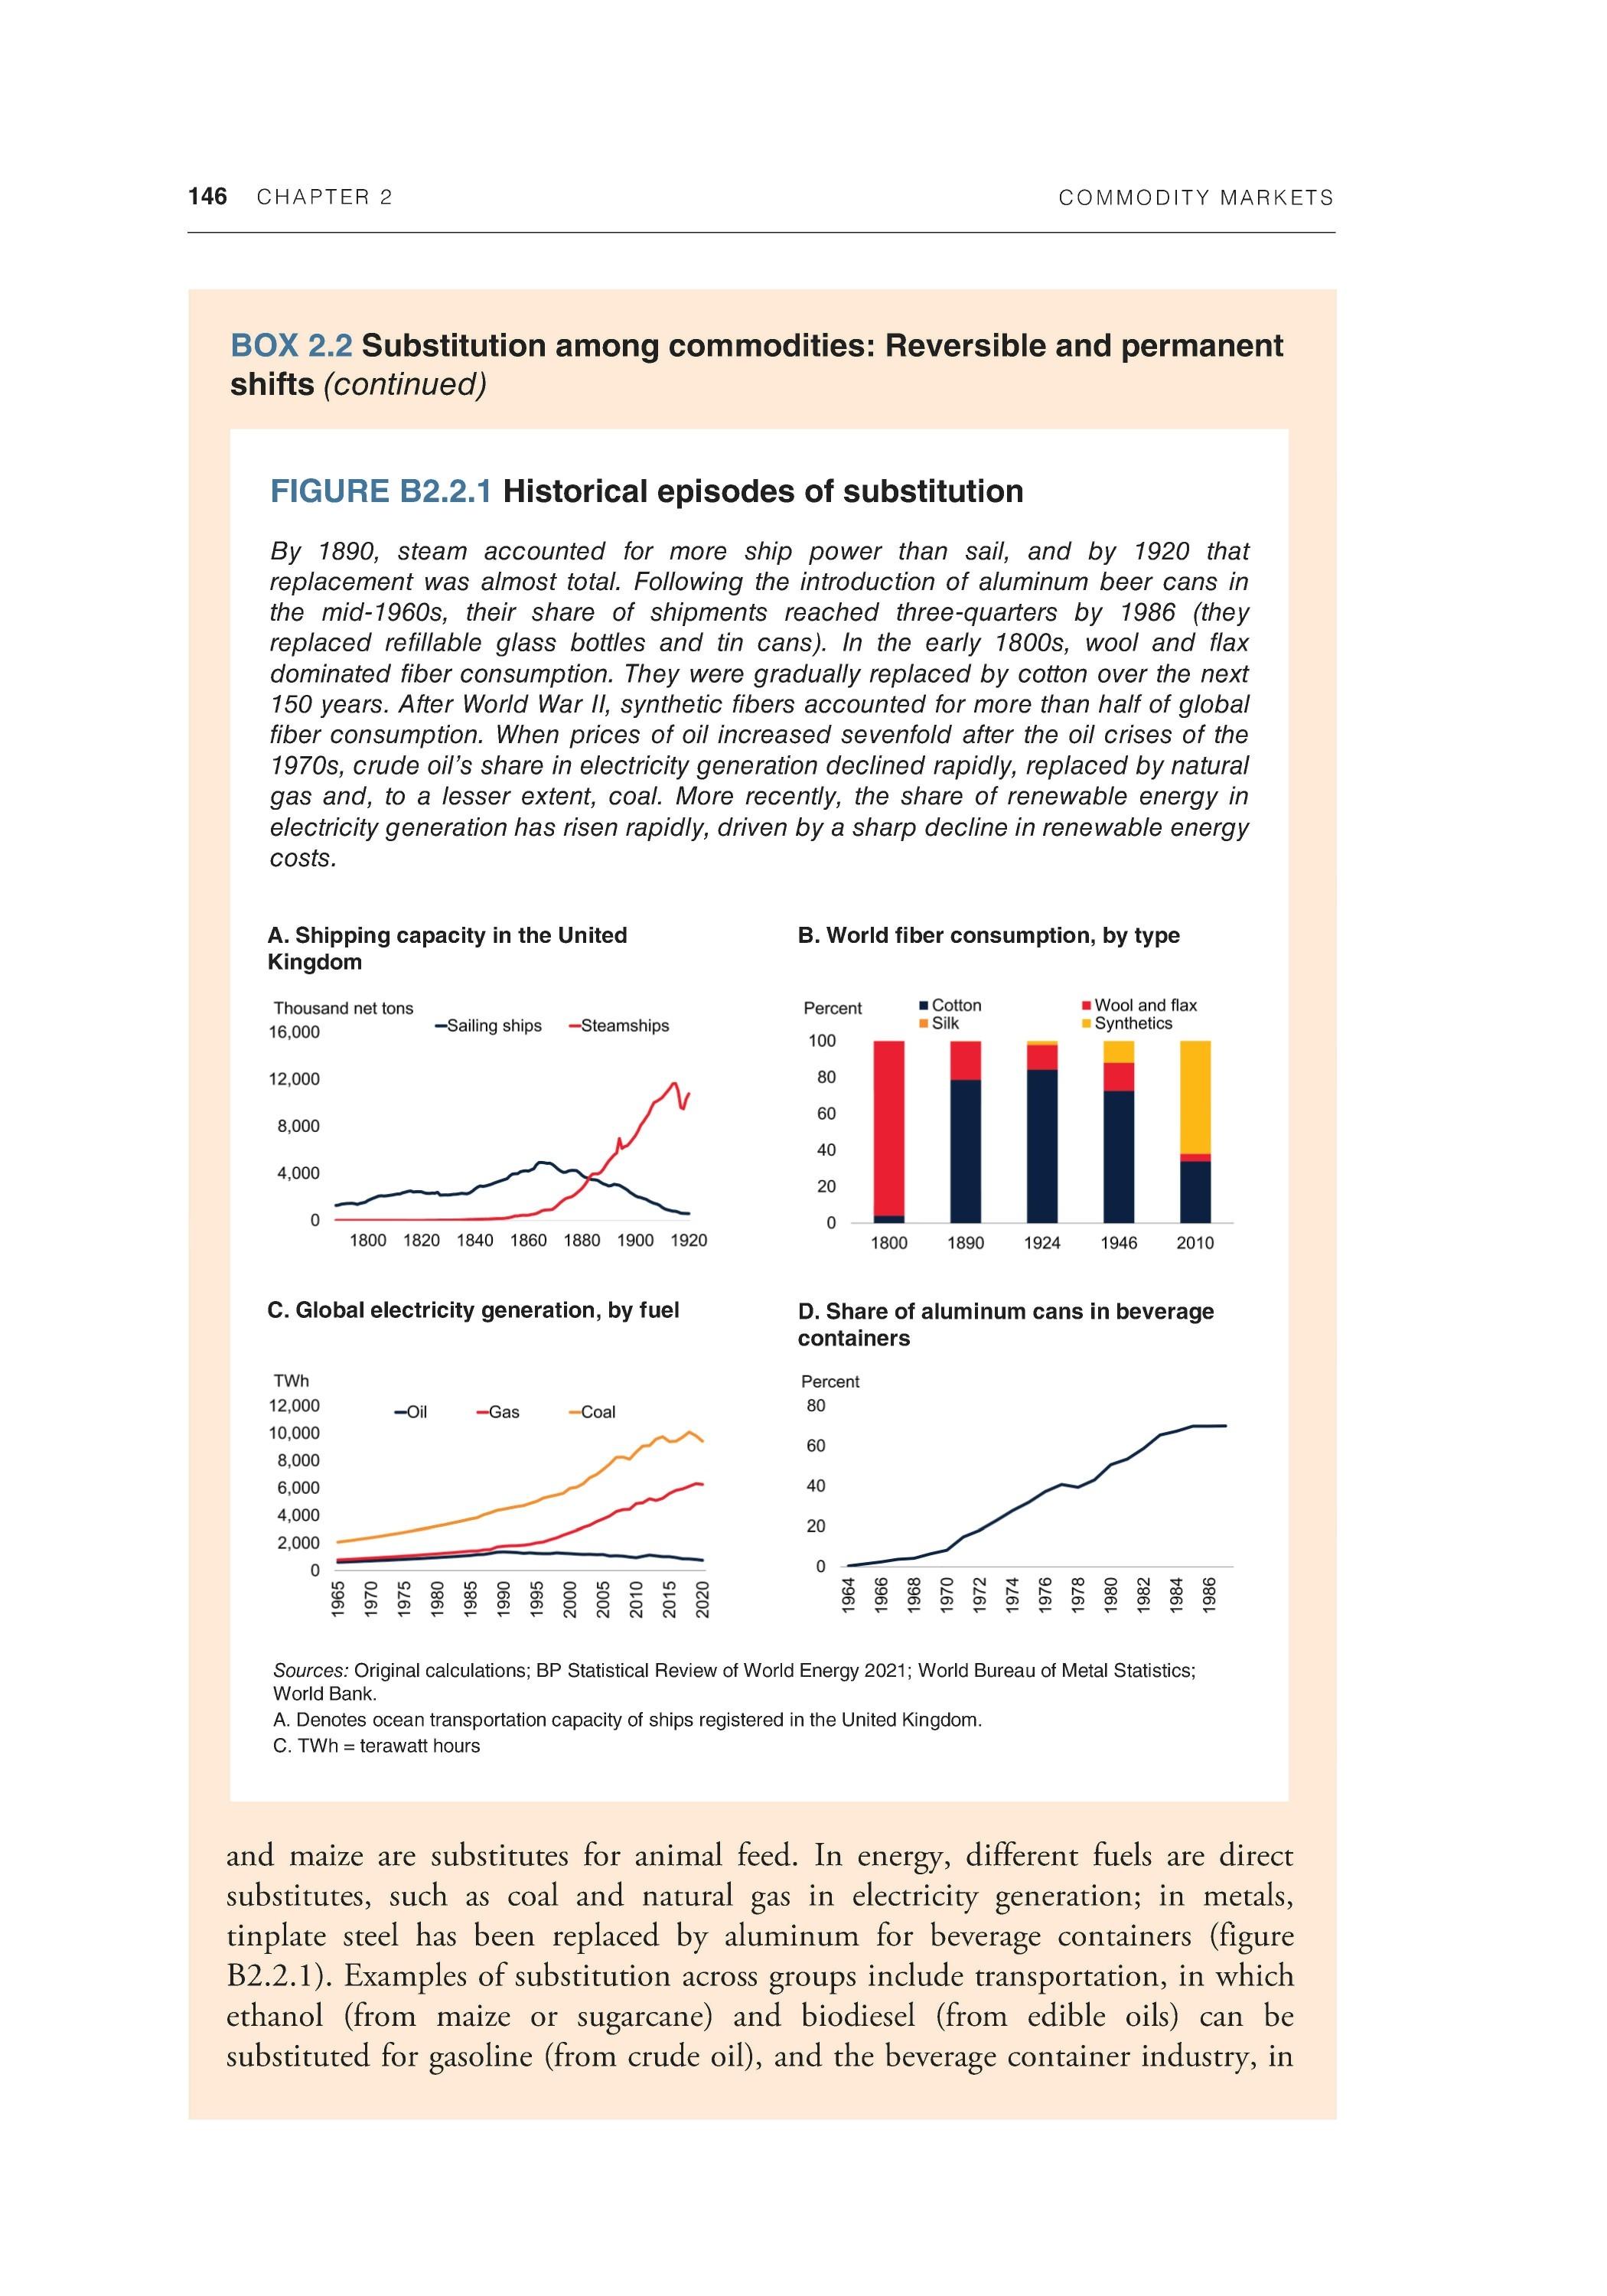
Sources: Original calculations; BP Statistical Review of World Energy 2021; World Bureau of Metal Statistics; World Bank. A. Denotes ocean transportation capacity of ships registered in the United Kingdom. C. TWh = terawatt hours
and maize are substitutes for animal feed. In energy, different fuels are direct substitutes, such as coal and natural gas in electricity generation; in metals, tinplate steel has been replaced by aluminum for beverage containers (figure B2.2.1). Examples of substitution across groups include transportation, in which ethanol (from maize or sugarcane) and biodiesel (from edible oils) can be substituted for gasoline (from crude oil), and the beverage container industry, in
COMMODITY MARKETS CHAPTER 2 147
BOX 2.2 Substitution among commodities: Reversible and permanent shifts (continued)
which plastic bottles (a by-product of crude oil) or paper (agriculture-based) can be substituted for aluminum cans (metal-based). Such substitutions can later be reversed just as easily if relative prices go back to their previous level.
Substitution can also be driven by policies. Domestic policies often change the relative prices of commodities. For example, many oil-producing countries subsidize oil, thus encouraging its consumption at the expense of other energy sources. Trade policies (such as tariffs) and industrial policies (such as protection of agriculture) can induce substitution. Regulations to protect the environment or to control dangerous substances also affect the composition of commodity demand. Changing consumer preferences can also lead to substitution. For example, following environmental concerns, consumers have sought to minimize the use of petrochemical-based materials (such as plastic) by replacing them with natural or biodegradable alternatives (such as paper).
Historically, more permanent major changes in the use of commodities have been caused by innovation. Technical advances, and their adaptation by entrepreneurs, have profoundly transformed existing economic structures. The resulting transformational commodity substitutions are not easily, and hardly ever, reversed. For example, the introduction of jet planes caused a switch from bunker oil to kerosene as the source of power for transcontinental travel. Moreover, transformational substitutions can cross commodity groups. The invention of the internal combustion engine eventually led to the substitution of metal and oil for horses and animal feed. There is no turning back from this kind of transformational change—also known as disruptive innovation or creative destruction (Aghion, Antonin, and Bunel 2021).
It can be challenging to distinguish episodes of transformative commodity substitution from routine substitution because forces like technological advances, resource discoveries, innovation, population growth, urbanization, and income growth are endlessly intertwined.15 The distinction, however, can shed light on the economic history of commodity use. And it is especially relevant today in what is likely the beginning of an era of accelerated technical change and innovation under the impetus of climate change and government policies to mitigate its impact.
b. Theoretical discussions on commodity substitution and its relationship with innovation and prices go back to Hicks (1932, 124), who wrote that "a change in the relative prices of the factors of production is itself a spur to invention, and to invention of a particular kind—directed to economizing the use of a factor which has become relatively expensive." Hicks' view, later coined the induced innovation hypothesis, has been discussed extensively, including in Hanlon (2015); Hayami and Ruttan (1970); Newell, Jaffe, and Stavins (1999), and Olmstead and Rhode (1993). Substitutability among commodities has been cited as the antidote to resource scarcity (Goeller and Weinberg 1978; Pei and Tilton 1999).
148 CHAPTER 2 COMMODITY MARKETS
BOX 2.2 Substitution among commodities: Reversible and permanent shifts (continued)
Against that background, this box examines the following questions:
• What have been the quantitative drivers of commodity substitution episodes over the past half century, and how have they affected commodity demand?
• What will be the role of commodity substitution in the energy transition that is only just under way?
The box confirms that new technologies and innovation have been the key forces behind long-term substitution, especially after the industrial revolution. On some occasions, however, policies too have played an important role. Each of the substitution episodes saw substantial changes in commodity demand, but with important differences. For some episodes substitution has been complete, with one commodity completely replaced by another; for others substitution is incomplete, with both commodities still used, albeit with a smaller share for the original commodity.
As efforts to transition away from fossil fuels accelerate (in the context of energy transition and pollution), substitution is expected to occur across commodity groups. Consumption of fossil fuels will likely decline while consumption of the metals associated with production of renewable energy and electric vehicle technology will rise. Demand for agricultural commodities may also increase, depending on whether policy announcements regarding the production of biofuels materialize.

Substitution among commodities on the demand side has played a key role in economic development at the macro level and has affected the entire spectrum of industries. To illustrate, this section examines the role of substitutability in three industries: transportation, packaging, and electricity generation.
Transportation
Substitution, driven by innovation, has been an ongoing process in the transportation industry since the industrial revolution, with profound implications for economic development. In the late 1700s, the recently invented steam engine was first adapted to the textile industry. Innovations over the next century led to its widespread adoption for land and ocean transportation. As animal traction was replaced by trains, animal feed gave way to coal as the source of power. Steel and iron replaced wood for the bodies of ships, and coal-powered steam engines replaced cotton and linen sail cloth. More generally, the industrial revolution brought a transition from agricultural commodities to mineral energy and to metals (Lundgren 1996).
COMMODITY MARKETS CHAPTER 2 149
BOX 2.2 Substitution among commodities: Reversible and permanent shifts (continued)
In the late nineteenth and early twentieth centuries, technological developments in the transportation industry induced further substitution among agricultural and energy commodities. The invention of the automobile saw three competing technologies in the late nineteenth century. The first cars were powered by steam and electricity and led to the partial replacement of animal traction, which meant that food commodities were largely supplanted by coal and coal-powered electricity. Next, the first-generation internal combustion engine vehicles that used biofuels replaced the early electric vehicles (Kovarik 2013). Later, vehicles powered by gasoline and diesel became the dominant form of ground transportation. Similar trends took place in ocean transportation, with steam engines replaced by internal combustion engines, again substituting diesel and bunker fuel for coal.
More recently, biofuels have again emerged as a substitute fuel for transport. Numerous countries legislated biofuel policies in the late 1900s, mostly in the form of mandates (de Gorter and Just 2009). Policies included the use of maizebased ethanol in the United States, edible oil-based biodiesel in the European Union, and sugarcane-based ethanol in Brazil. More recently several other countries (including China, Indonesia, and Thailand) have introduced biofuel policies and are expected to produce substantial amounts of biofuels—if or when policies are enacted. Biofuels currently account for about 4 percent of total land allocated to food crops, and less than 2 percent of global liquid energy consumption. Substitution in the transportation industry continues into the twenty-first century with internal combustion engine vehicles being replaced by electric vehicles (see the section on the energy transition, later in this box).
Packaging: Beverage and bottle industries
Until the 1960s, glass, steel, and tinplate were the main materials used to manufacture beverage containers (chiefly for soft drinks and beer). However, the emergence of aluminum in the 1960s, with its superior properties (being lightweight and easy to recycle, and featuring technological developments like the pull-up and crimp can) significantly changed the beer industry, and to a lesser extent the soft drink sector (Nappi 1990). The share of aluminum cans used in the U.S. beer industry reached 80 percent by 1986, with tinplate cans being completely replaced. In the soft drink industry, however, the share of aluminum cans was limited by the dramatic rise of plastic bottles following their introduction in the late 1970s.
Aluminum's expanded use at the expense of tin was also aided by the International Tin Agreement, which kept tin prices artificially high through the management of buffer stocks (see chapter 1). The agreement, first negotiated in 1954 with the objective of maintaining tin prices within a desired range through
150 CHAPTER 2 COMMODITY MARKETS
BOX 2.2 Substitution among commodities: Reversible and permanent shifts (continued)
the management of buffer stocks, collapsed in 1985 following several years of insufficient funds to maintain stocks (Chandrasekhar 1989). Tin lost market share not only because of technological advances of its competitors but also by its own pricing decisions.
Innovation in beverage containers continues, particularly for soft drinks. Glass, plastics, and increasingly paper (for example, Tetrapak) dominate the bottle market, although aluminum remains the main material for the can industry. Substitution between these materials occurs when relative prices change. Environmental concerns, particularly regarding plastics, have also favored recyclable (aluminum, glass) and compos table (paper) containers. Thus, what initially began as substitution among metals turned into substitution between metals and energy (plastics) and, recently, between metals/energy and agriculture (paper).
Electricity generation
In the decade before 1972, global oil consumption grew at almost 8 percent a year in response to the rapid postwar expansion of transportation, industry, and electricity consumption (generated using crude oil). The use of oil in these industries was aided by artificially low prices (during 1945-72, oil prices averaged about US$16 per barrel of crude oil in 2017 constant terms because of price controls by the Seven Sisters oil cartel), making it comparatively cheaper than coal. The cartel's control gradually weakened as emerging market and developing economies increased their share of oil production.
The 1973 and 1979 energy crises, which resulted in a sevenfold increase in oil prices, set in motion powerful market forces and policies to reduce oil consumption and seek alternative supplies. Efficiency improvements, often mandated by government policies, led to reductions in the amount of oil used by the transportation sector, while coal, nuclear power, natural gas, and renewable sources (such as hydro and geothermal) displaced oil for electricity generation.
Both national and international policies encouraged the increasing use of coal in electricity generation. The International Energy Agency's 1979 Principles for IEA Action on Coal directive required member countries to promote the use of coal as an alternative to crude oil and minimize the use of crude oil in electricity generation, including by preventing new or replacement oil-fired capacity (IEA 1979, 1995). This directive was complemented by domestic policies, such as the U.S. Powerplant and Industrial Fuel Use Act of 1978, which mandated that no new baseload electric power plant could be constructed or operated without the capability to use coal or another nonoil or nongas alternate fuel as a primary energy source.
COMMODITY MARKETS CHAPTER 2 151
BOX 2.2 Substitution among commodities: Reversible and permanent shifts (continued)
Efforts to decarbonize the global economy will induce further substitution among commodities, with important implications for commodity demand. Substitution will occur across several fronts, including both the source of energy and its use.
Electricity generation: Substitution of fossil fuel commodities by metals
As discussed in box 2.3, the energy transition is expected to see renewable energy replacing fossil fuel energy in electricity generation, which entails a sharp increase in demand for the metals and minerals used to produce renewable energy. This substitution is being driven by both demand and supply factors (IPCC 2021). Demand has shifted in response to changes in consumer preferences (for example, growing interest in renewable energy and installation of solar panels) as well as policies (such as tax incentives for solar installation or purchase of electric vehicles, and the use of carbon pricing mechanisms). In terms of supply, technological developments have led to sharp reductions in the cost of renewable energy, increasing its relative competitiveness.
Transportation: Switch to electric vehicles, batteries, and biofuels
Transitioning toward a lower-carbon energy environment will radically transform the transportation industry. Over the next decade, land transportation will see large-scale replacement of gasoline- and diesel-powered vehicles by electric vehicles (EVs). Initially, EVs faced numerous headwinds, including high prices, long charging times, sparse charging stations, and limited driving range. However, aided by improvements in battery technology and charging infrastructure and by government incentives, EVs have recently enjoyed impressive demand growth. In 2018, the global electric car fleet, at 5 million units, was up 2 million from the previous year (IEA 2019a). In the United States, electric and hybrid vehicles in 2021 accounted for nearly 10 percent of total passenger vehicle purchases. China is currently the world's largest EV market, followed by Europe and the United States. Norway has the highest use of EVs, at 46 percent of recent vehicle sales. Growth of the EV market share is expected to accelerate, because numerous countries have set high targets for phasing out new gasoline and diesel-powered vehicles.
EVs will induce substitution of commodities because of their fuel requirements— which favor sources of energy that generate electricity (most likely renewables) over crude oil—as well as their physical design. An EV, for example, contains four times more copper (for the battery, motor, and wiring) than an internalcombustion engine vehicle. Large volumes of copper will also be needed for the
152 CHAPTER 2 C O M M O D I TY M A R K E TS
BOX 2.2 Substitution among commodities: Reversible and permanent shifts (continued)
EV charging infrastructure. For a standard battery pack with the most common battery chemistry, the main materials are aluminum, copper, cobalt, graphite/ carbon, lithium, nickel, and manganese.
Electric technology is less suited to shipping and air transportation, but these sectors may find substitutes to petroleum-based fuels, such as hydrogen or biofuels. Hydrogen can be produced from water using either natural gas (although this process produces carbon emissions) or electrical energy. Biofuels currently account for about 2 percent of global liquid energy consumption. Biodiesel produced from agricultural products or waste products may also be used as a low- or zero-carbon alternative, because the feedstock comes from plants and trees that absorb carbon as they grow. The International Energy Agency estimates that a fourfold increase in biofuels production by 2050 would be needed to achieve a net-zero emissions objective (IEA 202la). Several countries (including China, Indonesia, and Thailand) have recently introduced biofuel policies, which could potentially produce substantial amounts of biofuels if enacted. However, the policy-driven expansion of biofuels is a highly controversial and hotly debated topic in terms of its environmental benefits and its impact on food prices.
Conclusion
This box examined historical commodity substitution in three sectors (beverage packaging, electricity generation, and transportation) and analyzed how substitution may affect commodity demand due to the energy transition. Ocean transportation has undergone two complete substitution cycles (from sail ship to steam ship and from steam ship to bunker fuel and diesel). Both cycles were driven by technology and innovation, and substitution was complete, resulting in large changes in commodity demand. Substitution in retail packaging was also driven by technology and innovation, with a shift from tinplate steel to aluminum (and later to plastic bottles, and more recently to paper). Substitution in electricity generation reflects a combination of innovation (such as the introduction of nuclear power) and government policies. For all three sectors, substitution continues today because of advances in technology (such as the falling cost of solar energy), policies to limit greenhouse gases (such as carbonemission pricing, biofuel mandates), and consumer preferences (such as for recyclable or compostable materials in packaging).
The ongoing energy transition will likely cause major substitution among commodities. Consumption of metals will likely increase considerably at the expense of fossil fuels (Boer, Pescatori, and Stuermer 2021). Depending on policies, the use of biofuels for transport may increase considerably, effectively substituting food commodities for fossil fuels.
COMMODITY MARKETS CHAPTER 2 153
The Organization of the Petroleum Exporting Countries (OPEC), is the only remaining example of a major international commodity agreement. OPEC was founded in the 1960s with members coming together to negotiate better prices for oil and ultimately to use their market power to influence oil prices. OPEC interventions in the oil market have occurred frequently over the past 20 years, albeit with mixed success (Baffes et al. 2015). Notable examples include OPEC's decision to abandon quotas in November 2014 and more recently to introduce massive cuts (in partnership with other countries) following the collapse in demand due to COVID-19 (World Bank 2020). Like other production agreements, OPEC's' historical attempts to manipulate prices have triggered other market forces—by keeping prices high they have encouraged consumers to reduce consumption by increasing efficiency, substituting other fuels for oil, and inducing innovation in the production of crude oil. However, the group continues to actively manage its production of crude oil.
Whereas earlier international agreements were motivated by economic objectives, more recent agreements reflect environmental and climate change concerns. For example, the Montreal agreement in 1987 began the gradual phase-out of the use of chlorofluorocarbons because of their detrimental impact on the ozone layer. An example of international action for health reasons is the outright ban on asbestos in 16 countries (2003), which followed the accumulation of scientific evidence on the carcinogen. More recently, countries have begun to phase out the use of high-sulfur fuels in shipping under the agreement known as IMO 2020 (World Bank 2019). Of note are efforts to combat climate change by reducing greenhouse gas emissions, including the signing of the Paris (2015) and Glasgow (2021) agreements (IPCC 2021). Potential policies to accelerate the energy transition include carbon taxes, subsidies for renewable energy and electric vehicles (including battery development), and mandates to use certain types of commodities such as biofuels—all of which will materially alter commodity consumption patterns.
Modeling commodity demand
Following a literature review, this section estimates income elasticities of demand for energy, metals, and agriculture at the group level.7 This estimation enables a comparison across the three different commodity groups and a better understanding of the role played by identified drivers for each commodity.
Literature review on income elasticities
Estimates of long-run income elasticities of demand vary by commodity, between countries, and over time (table 2.2). For energy, most studies have found an income elasticity of demand of less than unity (Burke and Csereklyei 2016; Csereklyei and Stern 2015; Jakob, Haller, and Marschinski 2012). That elasticity implies per capita energy
7 This section extends and builds on the work of Baffes, Kabundi, and Nagle (2022) by including agriculture and estimating income elasticities using GDP in purchasing power parity terms.
154 CHAPTER 2 COMMODITY MARKETS
consumption grows more slowly than per capita real GDP, consistent with a declining energy intensity of demand. Several studies have also found that income elasticities of demand for energy decline as income rises (Dahl 2012; Fouquet 2014; Jakob, Haller, and Marschinski 2012). An exception is Burke and Csereklyei (2016), who find the long-run income elasticity of demand increases as per capita real GDP rises. This finding likely reflects a country sample that included a number of low-income countries whose long-run income elasticity of demand may initially be very low, as a result of their reliance on noncommercial fuels (that is, biomass). As income rises beyond a certain low level, an increasing switch to purchasing fuel would imply a rising income elasticity, up until the switch is complete. Elasticities in low-income countries may also be kept low by policies such as energy subsidies (Joyeux and Ripple 2011).
For metals, the elasticity of income depends on the availability of substitutes and the range of uses. Because of its wide applicability, demand for aluminum grows more than proportionately with rising manufacturing output (that is, with an above-unitary elasticity); demand for tin and lead, because of environmental concerns, grows less than proportionately (that is, with a below-unitary elasticity; Stuermer 2017). Fernandez (2018a) also finds a higher income elasticity of demand for aluminum (and nickel and zinc) than for lead.
Methodology and data
To estimate the relationship between income and commodity demand, a standard demand equation is used (BafTes, Kabundi, and Nagle 2022):8
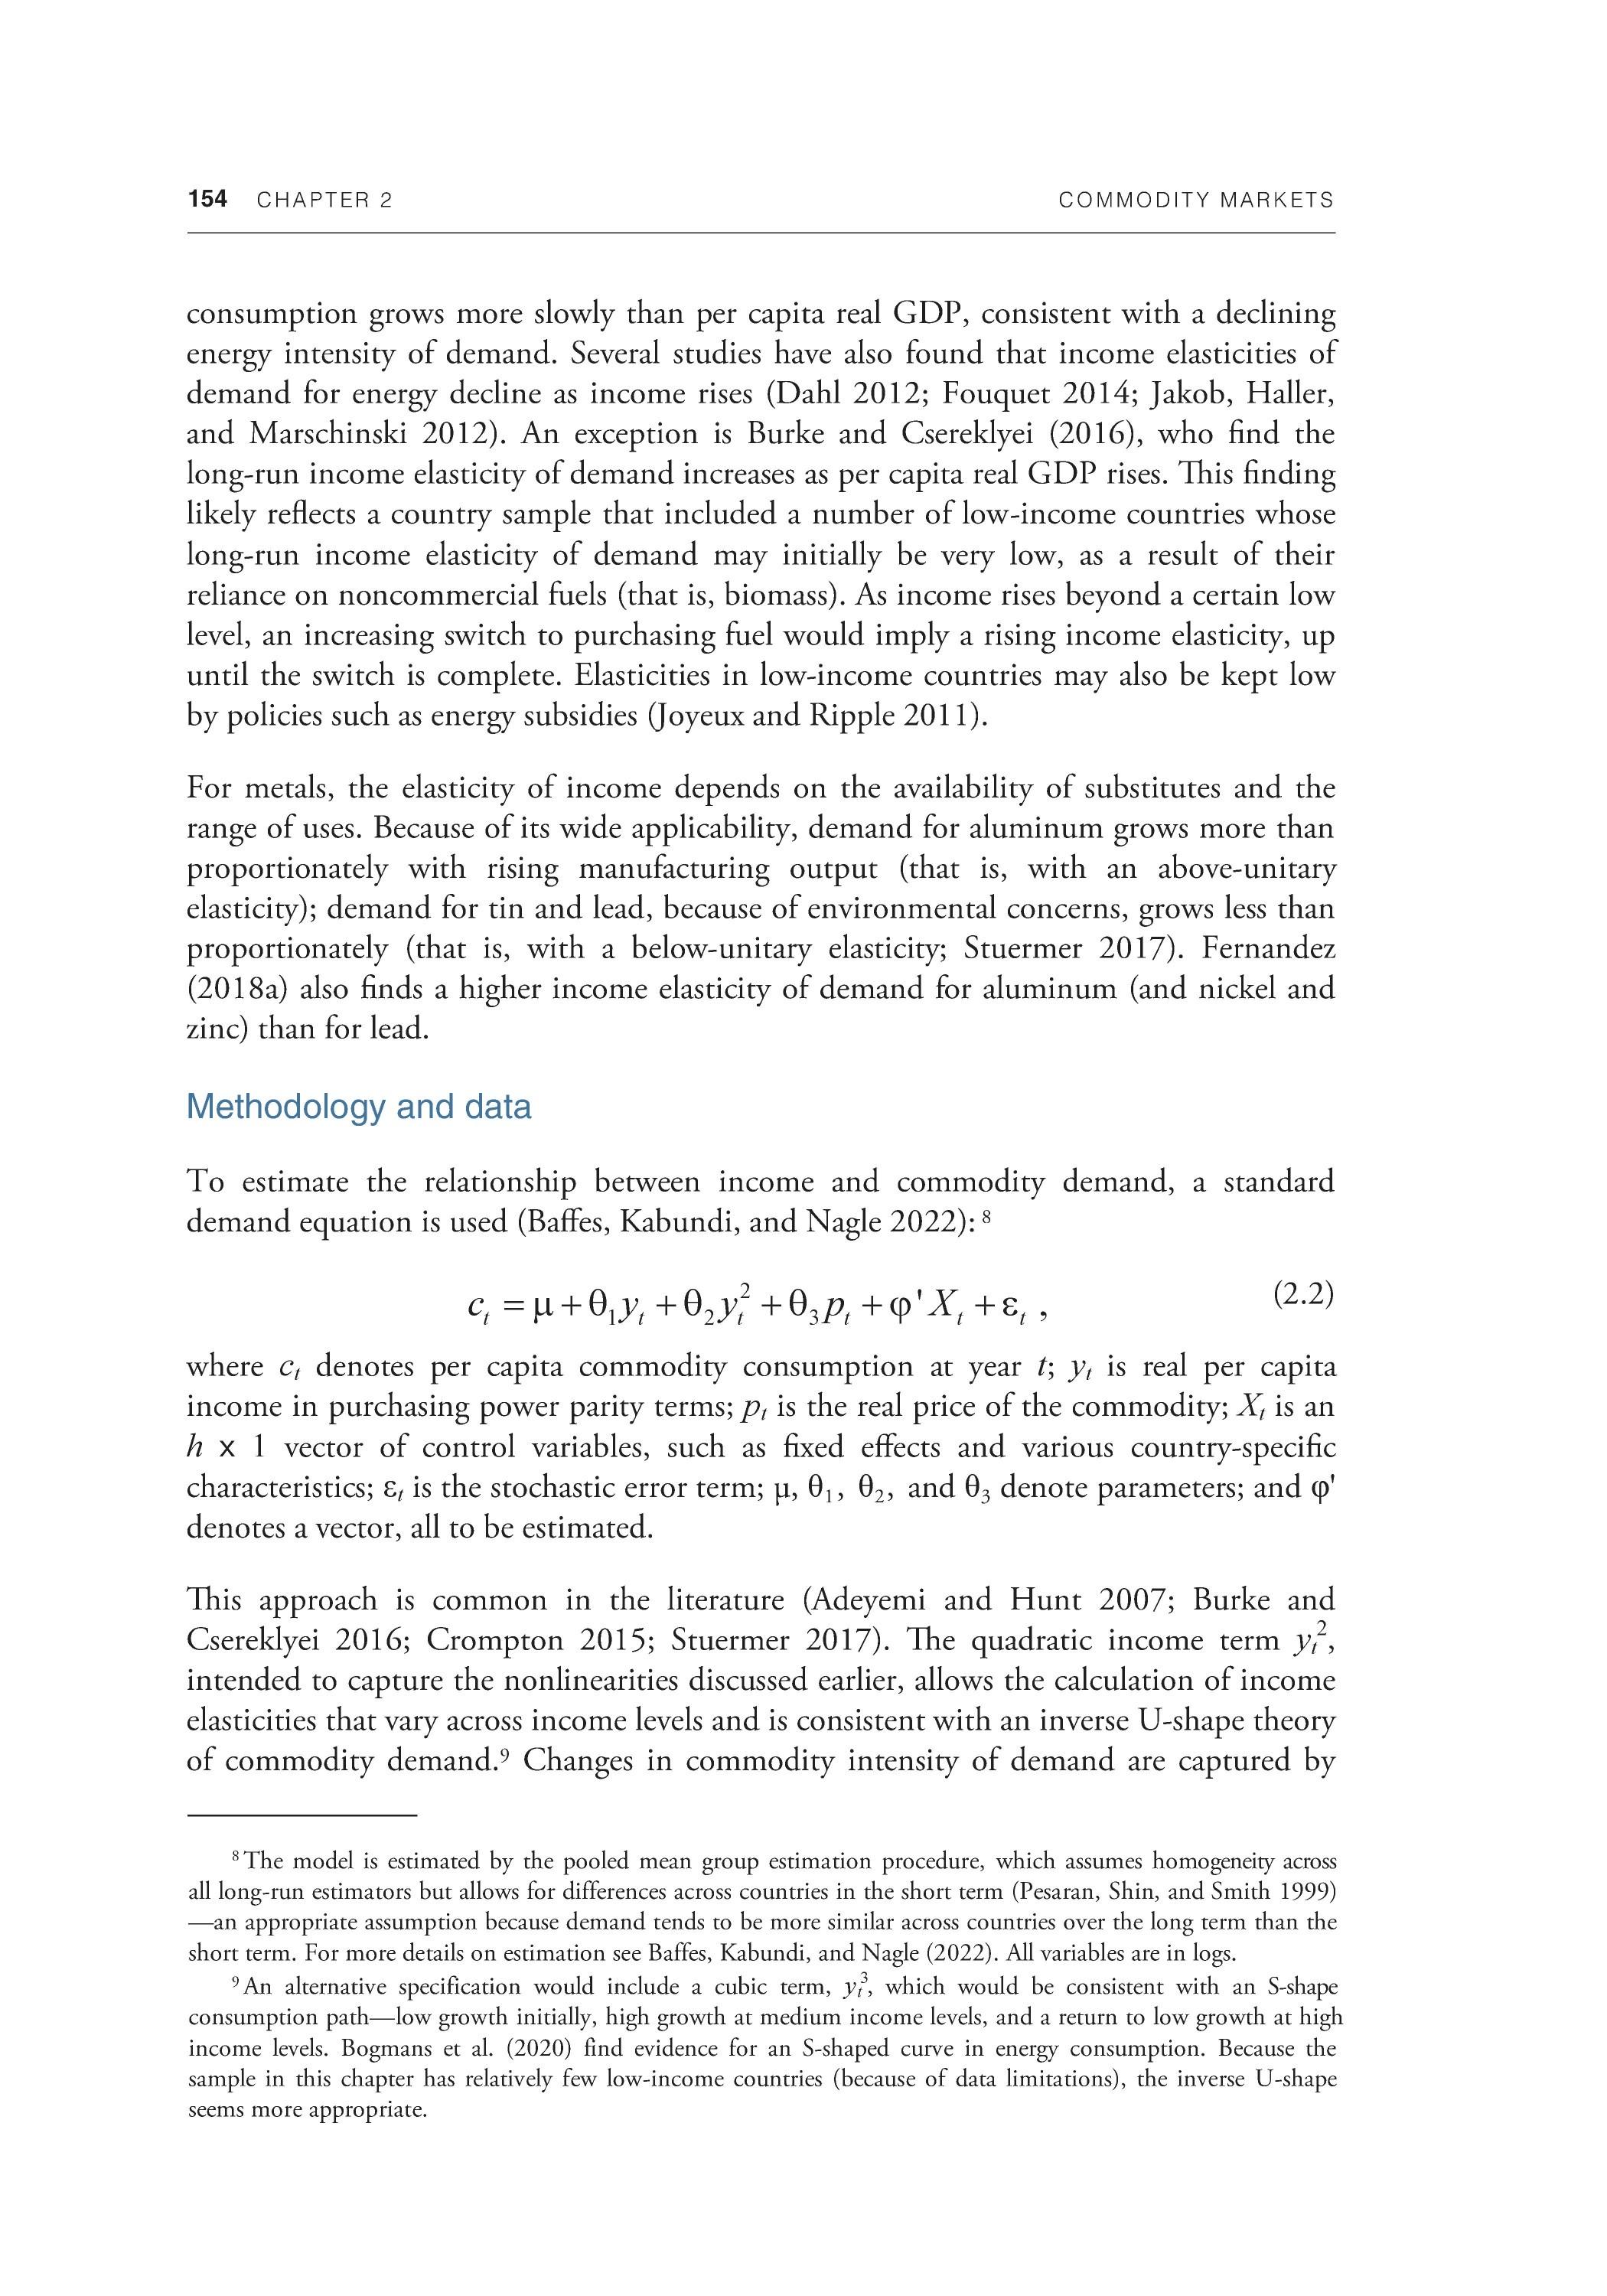
ct = |u + Q^yt + ^^yt 9 + 63pt + 9 'X t + st ?
ztO /~)\\^- ) where ct denotes per capita commodity consumption at year t; yt is real per capita income in purchasing power parity terms; pt is the real price of the commodity; Xt is an h x 1 vector of control variables, such as fixed effects and various country-specific characteristics; &t is the stochastic error term; u, 61? 02, and 63 denote parameters; and (pf denotes a vector, all to be estimated.
This approach is common in the literature (Adeyemi and Hunt 2007; Burke and Csereklyei 2016; Crompton 2015; Stuermer 2017). The quadratic income term yt , intended to capture the nonlinearities discussed earlier, allows the calculation of income elasticities that vary across income levels and is consistent with an inverse U-shape theory of commodity demand.9 Changes in commodity intensity of demand are captured by
8 The model is estimated by the pooled mean group estimation procedure, which assumes homogeneity across all long-run estimators but allows for differences across countries in the short term (Pesaran, Shin, and Smith 1999) —an appropriate assumption because demand tends to be more similar across countries over the long term than the short term. For more details on estimation see Baffes, Kabundi, and Nagle (2022). All variables are in logs. 9 An alternative specification would include a cubic term, y?, which would be consistent with an S-shape consumption path—low growth initially, high growth at medium income levels, and a return to low growth at high income levels. Bogmans et al. (2020) find evidence for an S-shaped curve in energy consumption. Because the sample in this chapter has relatively few low-income countries (because of data limitations), the inverse U-shape seems more appropriate.
C O M M O D I TY M A R K E TS CHAPTER 2 155
the control variables in Xt. Industrialization and urbanization are proxied, respectively, by the investment share and the urbanization share. A time trend proxies for technologydriven efficiency gains. By using group aggregates instead of individual commodities, the approach also controls for within-commodity group substitution (such as coal to natural gas) when overall demand for energy remains unchanged. However, it does not control for between-group substitution (such as coal to renewable energy made from metals).
Relationship (2.2) can be used to derive income elasticities as follows:
(2-3)
where r\t denotes the long-run income elasticity for the given commodity. Because r\t varies with income, it enables an estimation of whether consumption of a commodity plateaus as income rises. A large and positive value for the coefficient on yt indicates a high initial elasticity, whereas a large and negative value for the coefficient on yt indicates a rapid decrease in the elasticity.
The model was estimated for energy consumption (weighted by calorific energy content), metals consumption (aggregated using physical weights; a robustness check weighting with nominal values was also conducted), and agricultural consumption (weighted by calorific values). The analysis used annual data from 1970 to 2019 for up to 77 countries and GDP per capita in purchasing power parity terms.
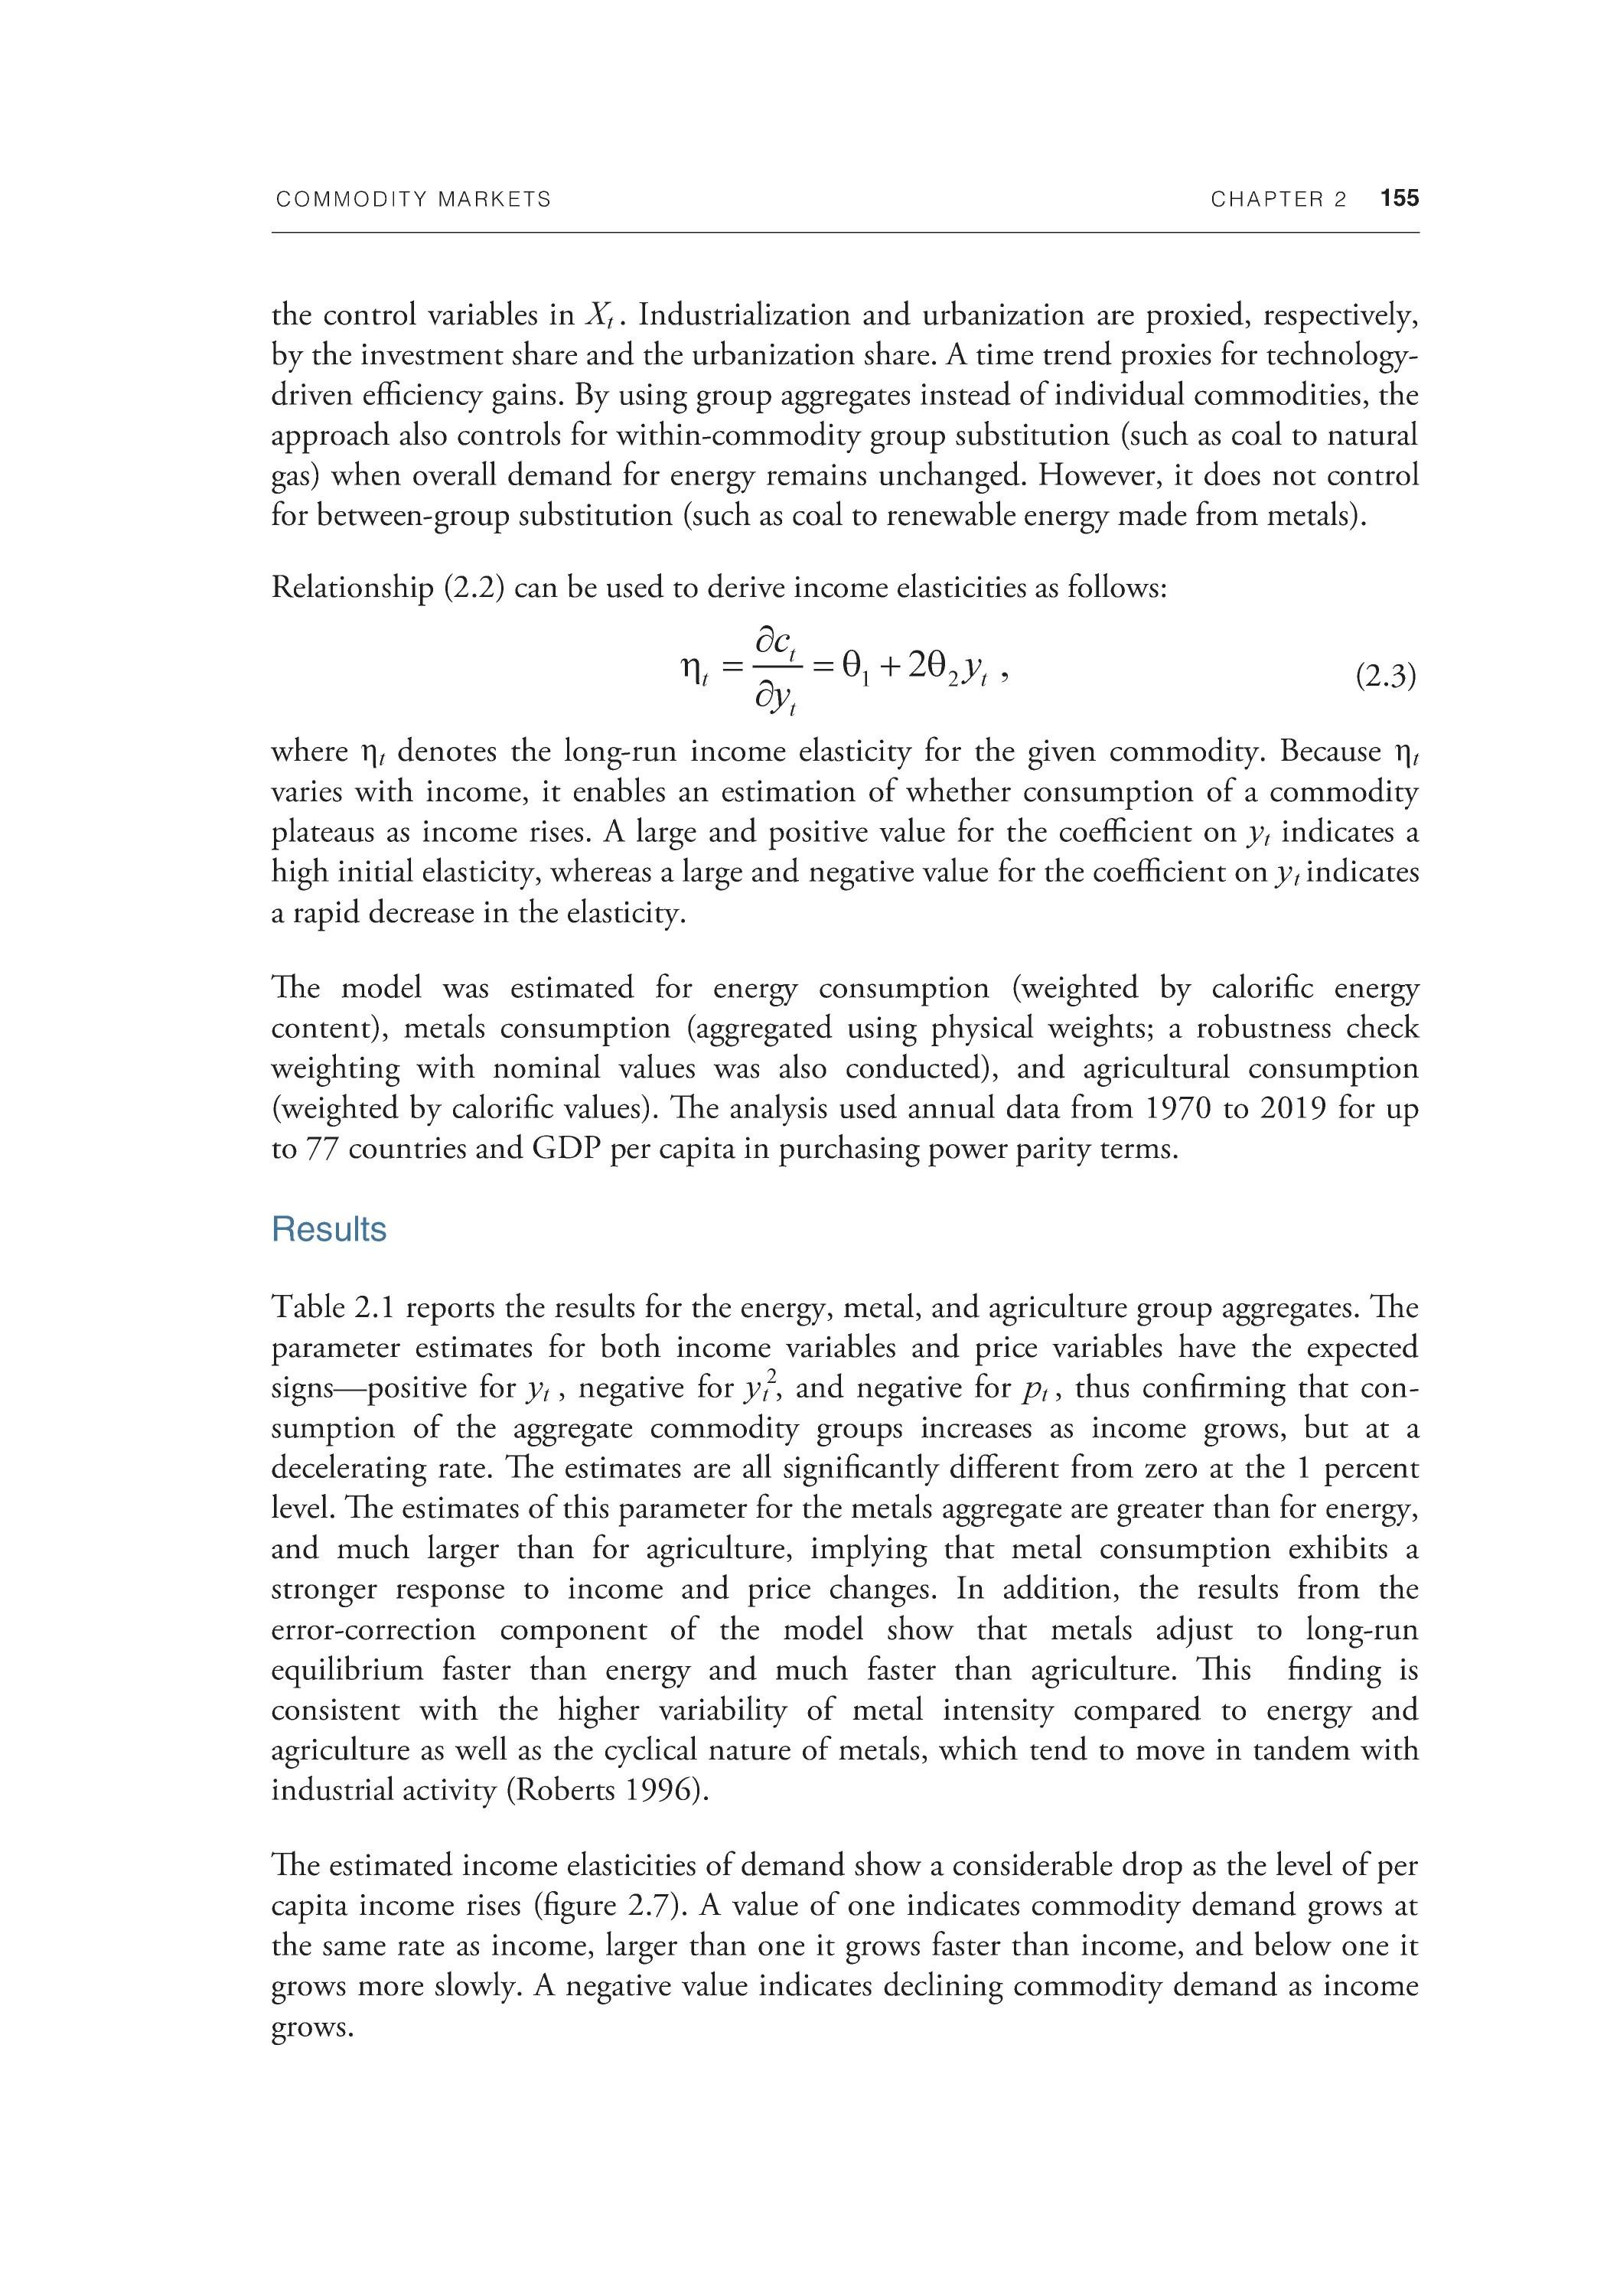
Results
Table 2.1 reports the results for the energy, metal, and agriculture group aggregates. The parameter estimates for both income variables and price variables have the expected signs—positive for yt, negative for yf, and negative for pt, thus confirming that consumption of the aggregate commodity groups increases as income grows, but at a decelerating rate. The estimates are all significantly different from zero at the 1 percent level. The estimates of this parameter for the metals aggregate are greater than for energy, and much larger than for agriculture, implying that metal consumption exhibits a stronger response to income and price changes. In addition, the results from the error-correction component of the model show that metals adjust to long-run equilibrium faster than energy and much faster than agriculture. This finding is consistent with the higher variability of metal intensity compared to energy and agriculture as well as the cyclical nature of metals, which tend to move in tandem with industrial activity (Roberts 1996).
The estimated income elasticities of demand show a considerable drop as the level of per capita income rises (figure 2.7). A value of one indicates commodity demand grows at the same rate as income, larger than one it grows faster than income, and below one it grows more slowly. A negative value indicates declining commodity demand as income grows.
156 CHAPTER 2 COMMODITY MARKETS
FIGURE 2.7 Income elasticity estimates
The income elasticity of metals was high at very low levels of income but declined rapidly, reaching unity at about US$12,000 per capita, and close to zero at the current level of U.S. income per capita. For energy, the initial elasticity was lower than for metals, but it declined more slowly and remained positive at the current level of U.S. income per capita. In contrast, agricultural elasticities were much lower than for energy and metals, indicating that population growth is the primary driver of agricultural consumption growth.
A. Aggregate income elasticity estimates B. Energy income elasticity estimates for select economies
C. Metal income elasticity estimates for select economies D. Agriculture income elasticity estimates for select economies
Sources: Original calculations; BP Statistical Review of World Energy 2021; U.S. Department of Agriculture; World Bank; World Bureau of Metal Statistics. A. Lines show implied income elasticity of demand estimates derived from coefficients in table 2.1. PPP = purchasing power parity. B.-D. Bars and diamonds indicate income elasticity of demand estimates at 1970 and 2019 per capita income levels. Russian Fed. = Russian Federation.

When calculated at the median level of per capita income in 2020, the income elasticity of demand for metals was 1.0, followed by energy at 0.6 and agriculture at 0.2. All commodities show a decrease in income elasticity as income rises, starting high and approaching zero or turning negative at higher levels of income. This result is consistent with the dematerialization hypothesis, which predicts a switch of consumption from commodity-intensive material goods to goods and services with a higher-value-added component. It can explain the plateauing of commodity demand shown in figure 2.4— as income rises, commodity demand grows at a decreasing rate.
The evidence shows a significant variation of income elasticities across commodities. Elasticities for metals and energy are well above unity at lower per capita incomes. As incomes rise, the elasticities decline, to below unity for both commodities at a per capita
COMMODITY MARKETS CHAPTER 2 157
income of more than US$20,000. The elasticity for metals declined faster, equal to energy at a per capita income level of US$35,000 (in purchasing power parity terms), and turning negative at US$50,000. In contrast, energy had a positive income elasticity at all income levels. The estimate for the income elasticity of agriculture showed the least change for different levels of income. This estimate was less than unity even at the lowest income levels, which indicates that population is the primary driver of growth in agricultural commodities.
For each country, the implied path of income elasticities of demand over time can be derived. For most EMDEs, income elasticities started high and fell as economies industrialized and developed. In the case of China, its demand elasticity for metals fell from 4.0 in 1970 to 0.7 in 2019, while for energy it fell from 1.5 to 0.5. These elasticities imply that China's demand for commodities is now growing more slowly than its economy—in the case of energy, at half the rate. In other words, the commodity intensity of demand is declining. In advanced economies, elasticities were lower in 1970 and by 2019 had fallen to near zero for energy and slightly negative for metals and agriculture, indicating a modest decline in per capita consumption as incomes rose from an already high level.
Scenarios of commodity demand growth
Two factors suggest that overall demand for commodities will grow more slowly in the decades ahead than in the past three decades. First, population growth is slowing. The world's population is expected to reach 9.8 billion by 2050 from 7.6 billion in 2020, a 30 percent increase (United Nations projection; figure 2.8). The increase over the preceding 30 years was more than 40 percent. Moreover, almost all the expected growth will take place in EMDEs, especially in Sub-Saharan Africa, a region with the world's lowest per capita commodity demand.

Second, GDP growth is expected to slow. Consensus expectations for global growth 10 years ahead have repeatedly been revised down. The Organisation for Economic Cooperation and Development's long-term forecasts for GDP growth in EMDEs indicate a slowdown in growth from an average of 4.8 percent per year between 2011 and 2019 to an average of 3.7 percent per year between 2021 and 2030, largely due to slower growth in China. As China slows, it is expected to increasingly shift toward less commodityintensive activities. For metals, however, the concentration of projected GDP growth in regions with relatively low incomes is a positive factor because of the high income elasticities of demand at lower income levels. Growth will instead shift toward economies that are currently much less commodity-intensive than China.
A key question is whether India (with a population similar in size to China's) or another group of EMDEs, such as those in Sub-Saharan Africa, could experience levels of commodity consumption growth commensurate with that of China. For India, this growth is unlikely, for two reasons. First, India is not expected to grow at the doubledigit rates experienced by China through much of the 2000s. Second, India's economy
158 CHAPTER 2 COMMODITY MARKETS
Global population is expected to continue to grow, driven increasingly by LICs, albeit at a slower pace than over the past half century. Similarly, global economic growth is expected to slow and be driven by EMDEs. Based on scenario estimates, demand for commodities in EMDEs is expected to slow, although metals demand growth will remain above that of energy and crops. When excluding China, however, EMDE demand for metals is expected to increase.
A. Cumulative population growth forecasts B. Long-term growth forecasts
C. Scenario estimates of commodity demand growth in EMDEs D. Scenario estimates of commodity demand growth in EMDEs excluding China
Sources: Consensus Economics; Organisation for Economic Co-operation and Development; United Nations; World Bank. Note: EMDE = emerging market and developing economy; LIC = low-income country. A. Chart shows cumulative increase in global population, by income levels, relative to 2020. B. Chart shows 10-year-ahead consensus global growth forecasts. C.D. Original estimates using United Nations population data, Organisation for Economic Co-operation and Development growth rates, and estimated income elasticities of demand.
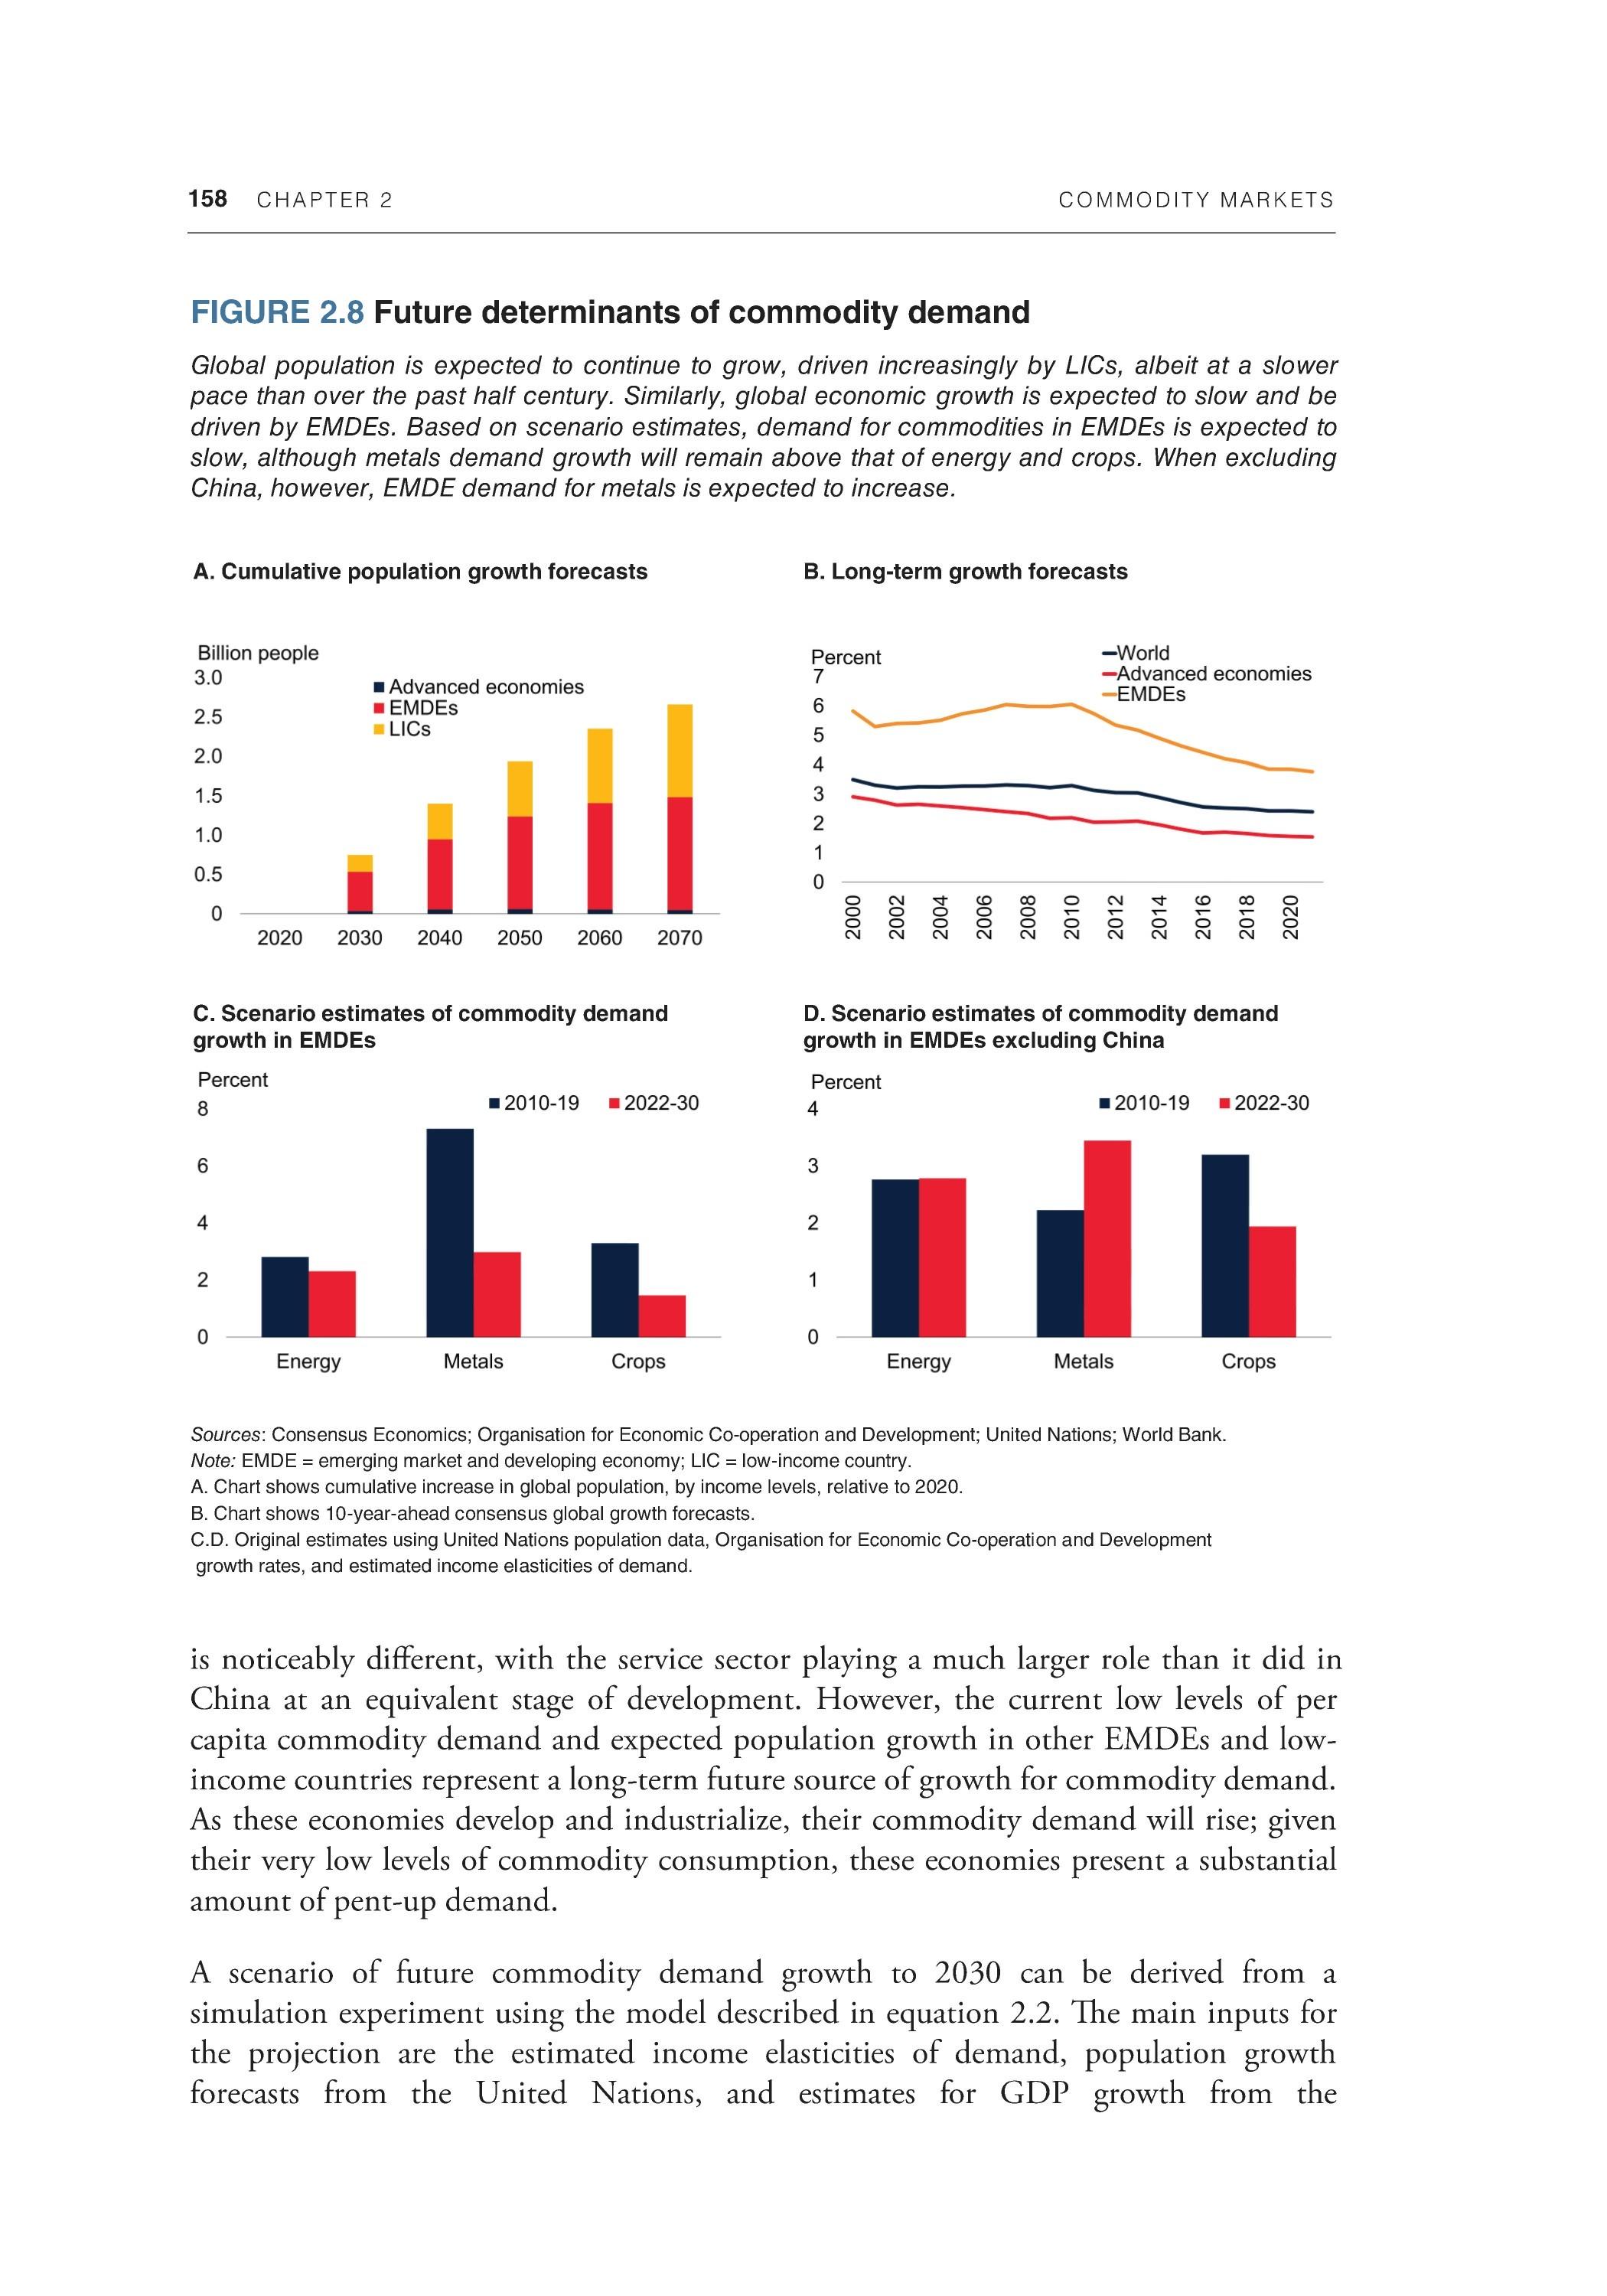
is noticeably different, with the service sector playing a much larger role than it did in China at an equivalent stage of development. However, the current low levels of per capita commodity demand and expected population growth in other EMDEs and lowincome countries represent a long-term future source of growth for commodity demand. As these economies develop and industrialize, their commodity demand will rise; given their very low levels of commodity consumption, these economies present a substantial amount of pent-up demand.
A scenario of future commodity demand growth to 2030 can be derived from a simulation experiment using the model described in equation 2.2. The main inputs for the projection are the estimated income elasticities of demand, population growth forecasts from the United Nations, and estimates for GDP growth from the
COMMODITY MARKETS CHAPTER 2 159
Organisation for Economic Co-operation and Development.10 The scenario focuses on EMDEs, given that the majority of population growth and commodity demand growth is expected to occur in these economies. The scenario does not take into account structural changes in commodity demand, however, such as the energy transition. The likely impact of the energy transition on commodity demand is explored in box 2.3.
The simulation implies that growth in EMDE consumption of energy, metals, and crops slows over the next decade compared to 2010-19. The slowdown in metals is most pronounced, declining from an annual average of 7 percent to about 3 percent. However, this growth rate remains above that of energy and crops. The slowdown can be entirely attributed to China. If China is excluded, EMDE metal demand growth increases over the next decade as income elasticities of demand in the scenario stay above 1 in many EMDEs. For the other commodity groups, energy demand is expected to remain relatively constant, and crop consumption growth is estimated to halve.
The structural trends generated in the model simulation take explicit account only of income and population growth. Other factors, such as advances in global technology, shifts in consumer preferences, environmental concerns, and policies to encourage cleaner fuels, could trigger much more radical changes in the global use of some commodities. Of particular importance is the energy transition from fossil fuels toward low- or zero-carbon sources of energy. A technological transformation of this magnitude brings an unusually large and unpredictable component to long-run quantitative forecasts of the demand for commodities.
The direction of some changes, however, seems clear. The energy transition will lead to a reduction in the growth of demand for fossil fuels, particularly coal and crude oil, in favor of renewable energy sources (IEA 202la). At some point, fossil fuel consumption will start to decline. In contrast, low-carbon energy systems are very intensive in their use of metals such as copper, nickel, cobalt, and lithium. Demand for these metals will likely grow rapidly because of the transition, although their production capacity may pose potential bottlenecks for the transition (Boer, Pescatori, and Stuermer 2021; World Bank 2017). Although the energy transition will likely have less direct effect on agricultural commodities, a sharp increase in demand for biofuels could reduce the availability of resources to grow other crops, putting upward pressure on food prices. This would be an unwelcome development, given that the poorest households spend a high proportion of their income on food, and that climate change also poses a threat to food harvests.
Conclusions and policy implications
The past half century has seen rapid growth in the consumption of most commodities. This growth is accounted for by population growth, income growth, and changes in the
10 The Organisation for Economic Co-operation and Development data contain growth forecasts for 31 AEs and 17 EMDEs that collectively account for more than 90 percent of global GDP. For countries without growth forecasts, annual growth was held constant at their 2010-19 average.
160 CHAPTER 2 COMMODITY MARKETS
BOX 2.3 The energy transition: Causes and prospects
The energy transition—the shift away from fossil fuels toward zero-carbon sources of energy—is already under way. Although the speed and magnitude of the transition are uncertain, it will have significant implications for commodity markets. Consumption of fossil fuels, especially coal and crude oil, is expected to decline. In contrast, demand for metals and minerals is likely to see a boost from the transition, because renewable energy infrastructure, such as wind turbines and solar, requires significant amounts of metal in its manufacturing. For agriculture, a surge in demand for biofuels could see increasing competition for these crops with traditional food crops, putting upward pressure on prices.
Introduction
The energy transition refers to the shift from an economy predominately driven by fossil fuels to one powered largely by zero-carbon energy sources. Such a shift is essential to sharply reduce greenhouse gas emissions to address global warming and achieve the objectives of the Paris Agreement. The transition is already under way; between 2000 and 2019, production of renewable energy increased by 300 percent, its share of total energy rose from 5 to 10 percent, and its share of electricity rose from 18 to 26 percent (figure B2.3.1). Despite this increase, the share of fossil fuels in total energy has remained relatively flat at the global level because of a fall in nuclear generation. Significant challenges remain, and further progress will be needed to avoid the worst outcomes of climate change.
Despite varying expectations for the speed of the transition, there is greater consensus that the energy transition will trigger a substantial change in the demand for commodities, leading to reduced demand for fossil fuels, particularly coal, and increased demand for the metals and minerals required for renewable energy infrastructure. Against that backdrop, this box examines the following questions:
• What is driving the energy transition?
• What are the challenges facing the transition?
• How fast is the transition expected to occur?
• How will it change patterns of demand for commodities?
What is driving the energy transition?
Government policies and consumer preferences. Policies are a potent tool in driving the energy transition. Almost all countries have signed on to the Paris Accord, and more than 100 countries have either set or are considering netzero targets, although timelines differ (IEA 202 Ib; van Soest, den Elzen, and van Vuuren 2021). Subsidies for renewable energy sources and associated technologies such as electric vehicles can encourage investment in these sources of energy. To
COMMODITY MARKETS CHAPTER 2 161
BOX 2.3 The energy transition: Causes and prospects (continued)
FIGURE B2.3.1 The energy transition and its drivers
Since 2000, the share of renewable energy has increased sharply, with rapid growth in solar and wind power. The energy transition is being assisted by government policies to reduce CO2 emissions, and by a sharp fall in renewable energy costs, both for electricity generation and storage.
A. Share of renewables in global supply B. Share of solar and wind power in global energy
C. Number of national net zero pledges and share of global CO2 emissions covered D. Renewable generation and electricity storage costs
Sources: BP Statistical Review of World Energy 2021; International Energy Agency; International Renewable Energy Agency; Our World in Data; World Bank. Note: CO2 = carbon dioxide; RHS = right-hand side. A. Renewables include hydroelectric, solar, wind, geothermal, biomass, and other renewable sources. D. Installed cost of utility-scale photovoltaic solar power, measured as U.S. dollars per kilowatt-hour (US$/kWh) of generation. Consumer cost for lithium-ion cells, measured as dollars per kilowatt hour of storage.

reduce the use of fossil fuels, many countries have enacted carbon taxes or carbon pricing (OECD 2021). Many private sector companies, including fossil fuel producers, have announced zero-target ambitions, often in response to pressure from investors. The energy transition has also been influenced by the growth of green investment, a component of the ESG (environmental, social, and corporate governance) investor movement. The Institute for International Finance estimates that ESG debt issuance grew to US$2 trillion in 2021Q1 (IIP 2021).
Declining cost of renewables. Improving technology and better manufacturing processes have resulted in a sharp decline in the cost of renewable energy. The price of utility-scale solar energy fell by 80 percent between 2010 and 2019, and
162 CHAPTER 2 COMMODITY MARKETS
BOX 2.3 The energy transition: Causes and prospects (continued)
the price of onshore wind power declined by nearly 40 percent (IRENA 2020).
a
As a result, solar and wind energy are now the lowest-cost sources of new electricity in many parts of the world, including China, India, and the United States (IEA 2020). Installed capacity is expected to grow rapidly over the next five years, and costs are expected to continue to decline with technological improvements, increasing solar and wind energy's competitiveness against traditional fossil fuels even more. b Decreasing costs of energy storage, including the development of new storage technologies, will be critical in facilitating a growing share of renewables in energy production. The ongoing development of low-cost lithium-ion batteries has been driven by the needs of the rapidly growing electric vehicle industry. In 2020, global electric vehicle sales rose nearly 20 percent, whereas sales of traditional cars declined. As storage costs continue to decrease and battery ranges improve, electric vehicle sales are expected to accelerate.
What are the challenges to achieving the transition to net-zero carbon emissions?
As the world economy has grown over the past 30 years, the carbon intensity of gross domestic product has declined, but total emissions have nonetheless kept rising. Achieving a transition to zero poses several challenges.
Insufficient investment. If investment in fossil fuel production falls faster than investment in renewable production increases, it could result in a shortfall of energy. Investment in oil and gas production is currently at a level broadly in line with the International Energy Agency scenario for a net-zero transition (figure B2.3.2; IEA 202Ic). Investment in low-carbon technology, however, is currently only about one-third of what is required. The surge in energy prices in 2021 is a reminder of how rapidly fossil fuel prices increase when demand outstrips supply. Unexpectedly high energy prices, or interruptions to supply, could weaken political support for the energy transition.
Reserves and stranded assets. Although renewables are increasingly the lowestcost source of new energy, significant reserves of fossil fuels remain and are concentrated in emerging market and developing economies (EMDEs). With energy demand expected to continue to increase in EMDEs, particularly among low-income countries where access to energy has been limited, countries may
a. Utility-scale solar farms are large installations of solar panels. They vary in size from a few acres to more than 20 square kilometers. The costs of residential rooftop solar panels are higher because of their small size. Nevertheless, residential costs fell in the past decade by an estimated 47 to 80 percent, depending on the market. b. The cost of solar panels and wind turbines increased in 2021 because of the broader rise in commodity prices, including the metals and minerals used in their construction (for example, aluminum, silicon).
COMMODITY MARKETS CHAPTER 2 163
BOX 2.3 The energy transition: Causes and prospects (continued)
FIGURE B2.3.2 Challenges to the energy transition
The energy transition faces several challenges. Current levels of investment in clean energy are insufficient to offset the decline in oil and gas investment. Significant reserves of fossil fuels, particularly among EMDEs, encourage accelerated investment to sidestep the risk of stranded assets. Renewable energy also faces the issue of intermittency and seasonality. Other uses of energy will prove harder to decarbonize than road travel and electricity generation, and achieving a net-zero target in these industries will require significant technological developments, including in biofuels and the use of hydrogen.
A. Investment needs B. Fossil fuel reserves
C. Renewable generation, EU28 D. Share of global carbon emissions, by sector
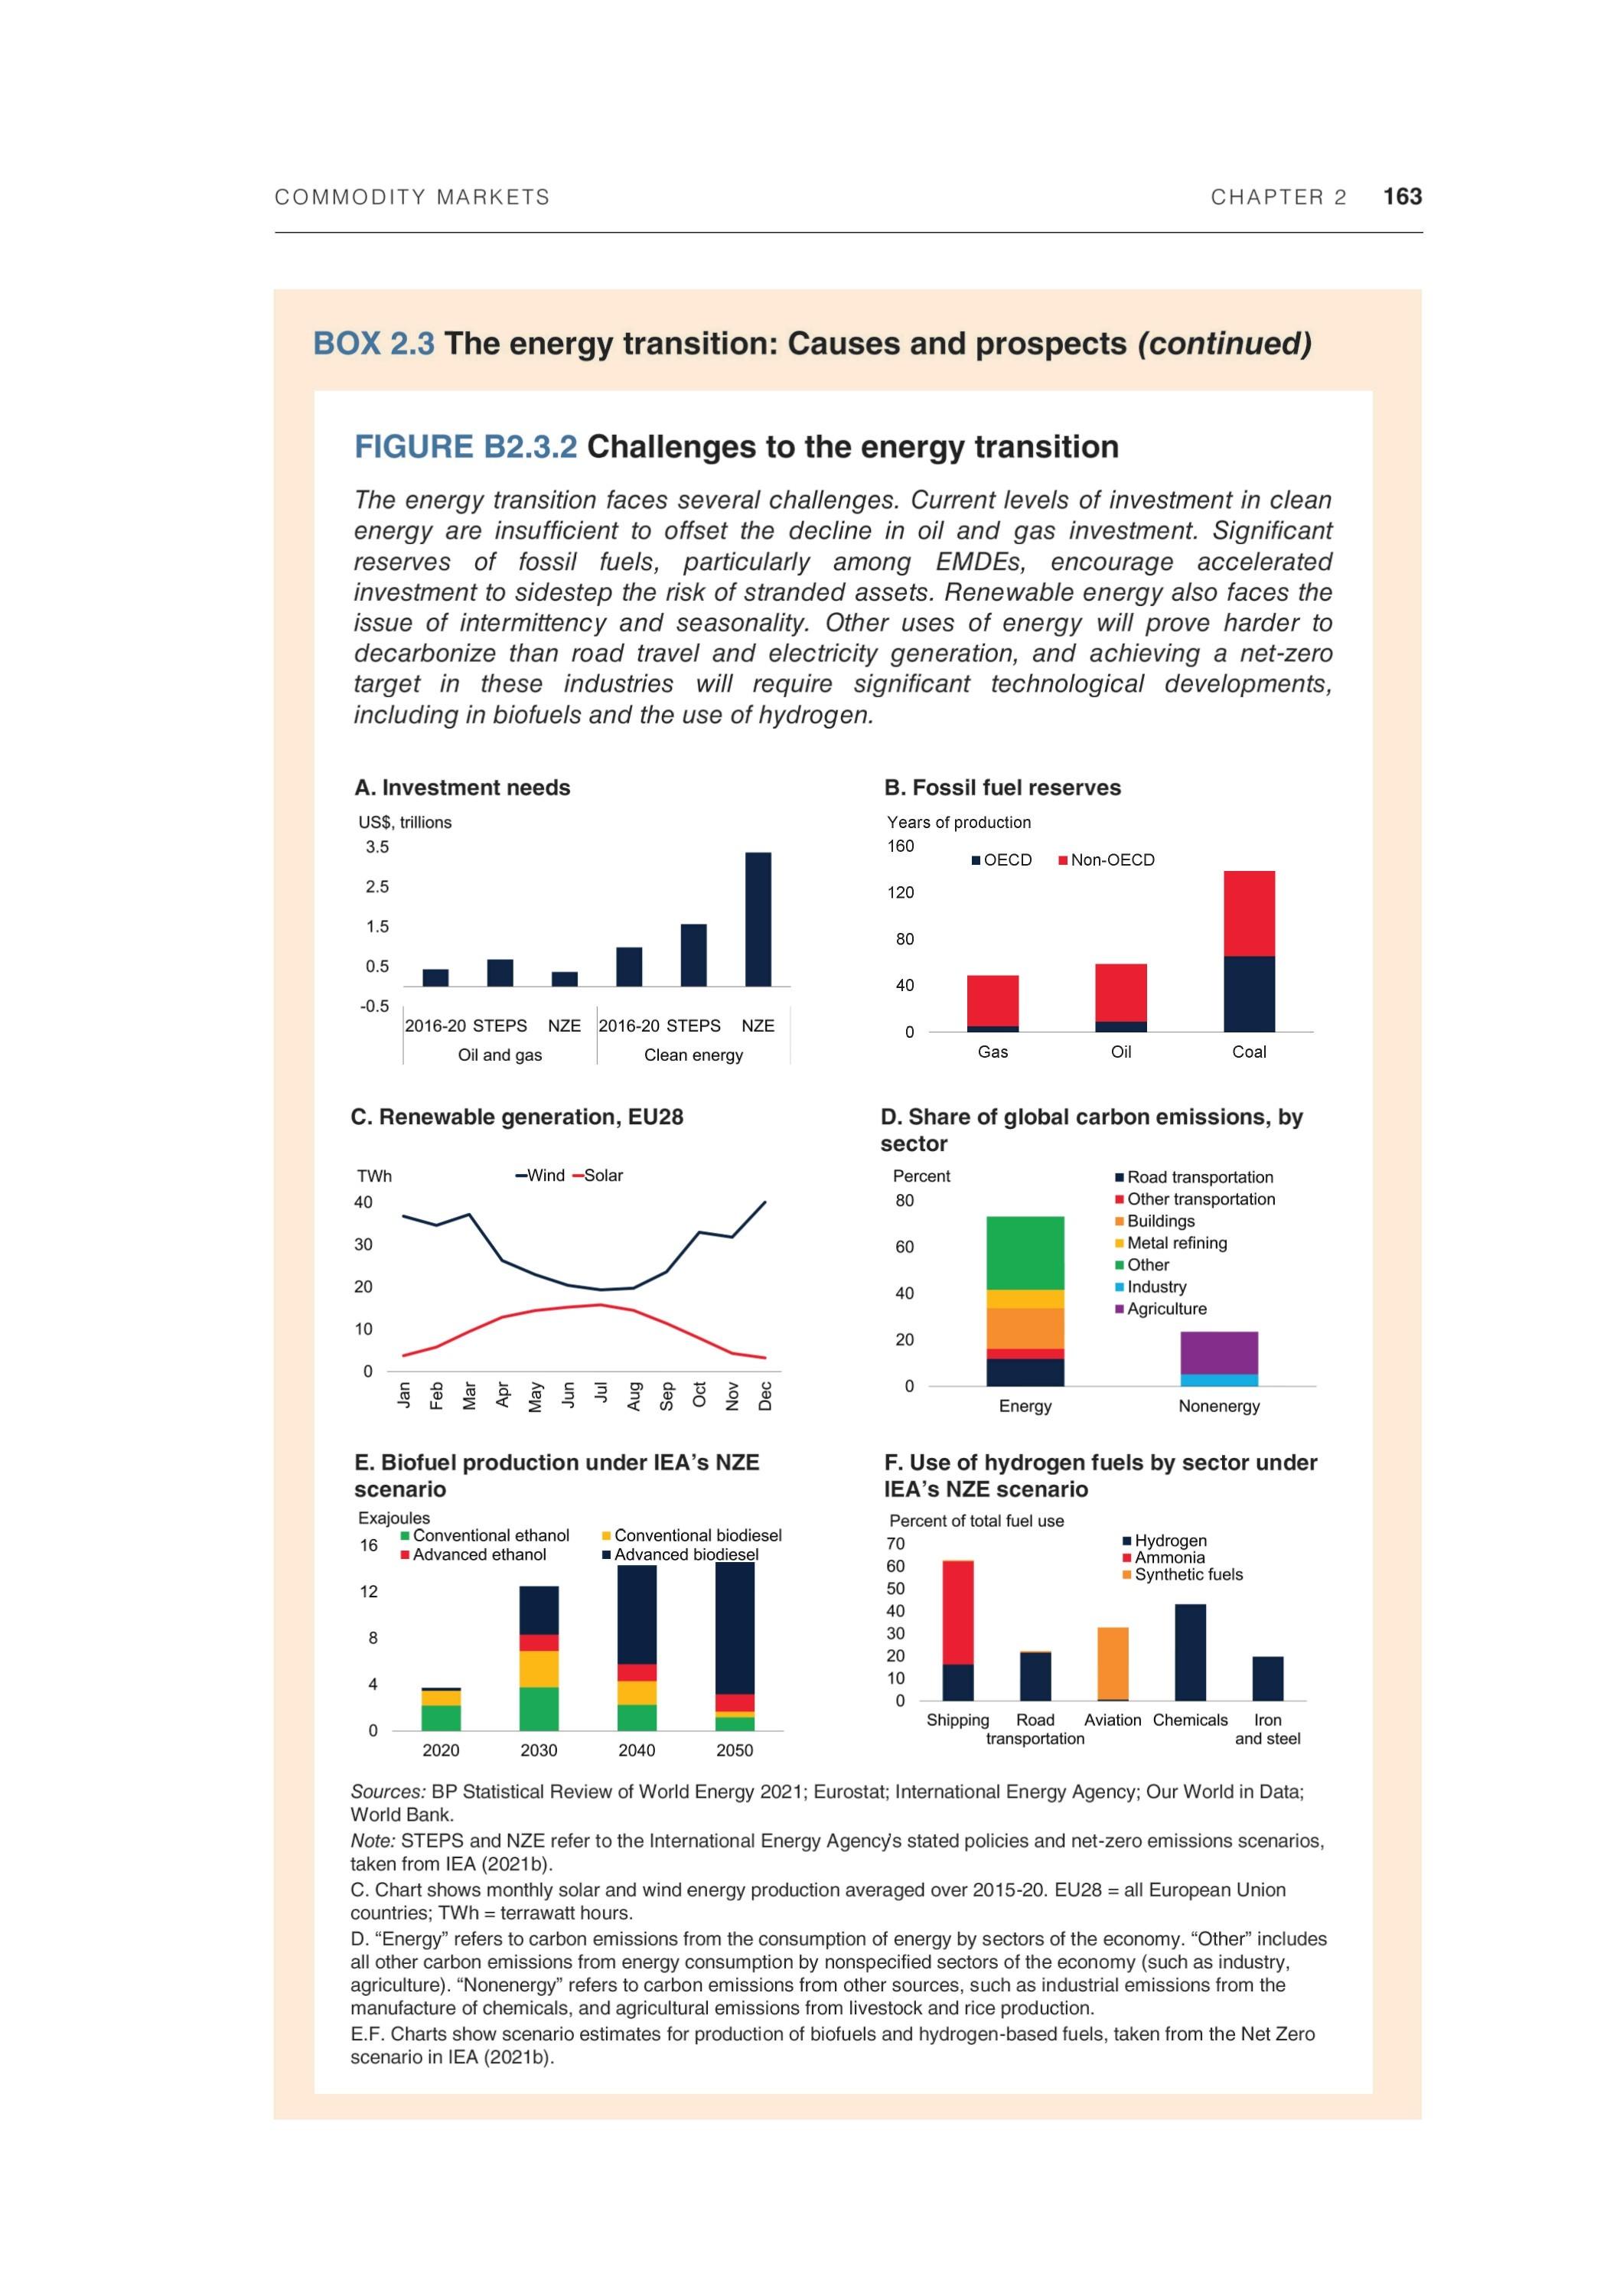
E. Biofuel production under lEA's NZE scenario
F. Use of hydrogen fuels by sector under lEA's NZE scenario
Sources: BP Statistical Review of World Energy 2021; Eurostat; International Energy Agency; Our World in Data; World Bank. Note: STEPS and NZE refer to the International Energy Agency's stated policies and net-zero emissions scenarios, taken from IEA(2021b). C. Chart shows monthly solar and wind energy production averaged over 2015-20. EU28 = all European Union countries; TWh = terrawatt hours. D. "Energy" refers to carbon emissions from the consumption of energy by sectors of the economy. "Other" includes all other carbon emissions from energy consumption by nonspecified sectors of the economy (such as industry, agriculture). "Nonenergy" refers to carbon emissions from other sources, such as industrial emissions from the manufacture of chemicals, and agricultural emissions from livestock and rice production. E.F. Charts show scenario estimates for production of biofuels and hydrogen-based fuels, taken from the Net Zero scenario in IEA (2021 b).
164 CHAPTER 2 COMMODITY MARKETS
BOX 2.3 The energy transition: Causes and prospects (continued)
choose to continue using fossil fuels, particularly if they have significant domestic reserves. Policy measures, such as border carbon taxes, can be introduced to address this environmental impact, but equity considerations must also be taken into account. Stranded assets—resources tied to fossil fuels and no longer able to generate an economic return because of carbon pricing—present another set of challenges. For example, regulators have been focusing on the risks that such assets present to financial stability.
Energy storage. A notable problem with renewable energy is the issue of intermittency. Electricity generation can fluctuate with weather, the time of day, and the season. For example, solar panels produce more energy when it is sunny, during the day, and during summer. At present, renewable electricity generation requires either storage or backup production for when renewable production drops. As renewable energy becomes increasingly widespread, this problem will become more acute, as seen in areas that have substantial solar capacity, such as California. Natural gas provides one method of backup generation of electricity and was used during 2021 when drought and low wind speed reduced renewable production in many countries (World Bank 202 Ib). However, natural gas still produces CO2 emissions, and as such low-carbon sources of backup power will be needed. Improved large-scale methods of storing electricity could help with the problem of interrupted supply. Measures to improve load-balancing, or adjusting electricity demand to synchronize with supply, will also be critical. For example, whereas solar production peaks in summer and is lowest in winter, wind production tends to be higher in winter and lower in summer. Integration of power markets across regions and countries, including transmission lines, can help balance generation from renewables.
Energy subsidies. Subsidies for traditional sources of energy remain high, despite progress in reducing them in recent years. In response to soaring energy prices in 2021, many governments in both advanced economies and EMDEs reintroduced subsidies or used price caps to prevent the higher cost of natural gas and coal from being passed onto consumers. To the extent that subsidies make fossil fuels cheaper, they will delay the energy transition.
Carbon-intensive industries and novel technologies. Despite the existence of the technology to move to zero-carbon electricity and road transportation, about onethird of emissions comes from sectors that do not have an economically feasible alternative to fossil fuels. These sectors include ocean shipping, air transportation, metal refining, and agriculture. Replacing crude oil-based fuels in shipping and air transportation with battery power is not currently an option because of the length of journeys and the size of the vehicles. Many industrial processes, including the refining of metals, notably steel, are carbon-intensive—the smelting of iron ore into steel uses coking coal and currently accounts for about 7 percent of global emissions. A potential solution could be biofuels for some forms of
COMMODITY MARKETS CHAPTER 2 165
BOX 2.3 The energy transition: Causes and prospects (continued)
transport, or hydrogen, which could be used as both a fuel for transport and a replacement for fossil fuels, such as coal, in the smelting of steel (IEA 2019b; IRENA 2020). However, further technological development is required before these solutions become viable.
Agricultural emissions. Greenhouse emissions from agriculture present a challenge. Agriculture tends to be very capital and energy intensive in advanced economies, whereas in EMDEs it is typically more labor intensive. Agriculture also produces nonenergy greenhouse gas emissions, including the production of methane from livestock, especially cows, and from rice paddy fields. The euro area stands out for its energy intensity, driven by a few countries, notably Belgium and the Netherlands, which farm very intensively on small areas of land and use energy for heating and lighting. In contrast, southern countries have much lower energy intensities because they rely more on the sun.
How fast is the energy transition expected to occur?
Although the transition is under way, the timing is uncertain and depends on the approach taken by governments, and on the pace of technological change. Both industry and international organizations have developed several scenarios (BP 2020; EIA 2021; IEA 2021c; Royal Dutch Shell 2021). Figure B2.3.3 shows two scenarios by the International Energy Agency.c The first is the stated policies scenario (the "business-as-usual" approach), which incorporates current government policies but no additional progress. The second is the net-zero emissions scenario, which assumes significant policy changes by governments as well as substantial technological development in renewable generation, storage, and carbon capture, and results in an energy transition fast enough to limit warming to 1.5 degrees.
Under the stated policies scenario, the use of coal is anticipated to have already peaked and is expected to gradually decline over the next 30 years, whereas demand for oil sees a slight increase, driven by demand from EMDEs, before plateauing and declining after 2035, but broadly unchanged from current levels by 2050. Natural gas consumption continues to rise, given its cleaner properties and use as a backup fuel for renewables. Demand for renewable and biofuels rises rapidly, approximately doubling over the next 30 years, and nuclear sees a small rise.
The net-zero scenario is similar in terms of the direction and order of trajectory but differs in terms of speed and magnitude. Use of coal falls substantially by
c. These scenarios are broadly similar to those of BP and Shell. Differences chiefly pertain to the speed of the transition, which depends on policy choices and technological developments.
166 CHAPTER 2 COMMODITY MARKETS
BOX 2.3 The energy transition: Causes and prospects (continued)
FIGURE B2.3.3 Speed and implications of the energy transition
The energy transition will result in significant changes in energy demand. Coal and crude oil will be the first to decline and see the sharpest falls, whereas natural gas may continue to increase. Renewables and biofuels will see the fastest growth, and nuclear will see modest gains. Demand for metals will likely increase sharply because renewable technologies are very metals intensive.
A. Energy demand growth by 2050 under different scenarios
B. Copper use in electricity generation
Sources: Copper Alliance; International Energy Agency; World Bank 2017; World Bank. A. Chart shows the change in energy demand for different fuels relative to their 2019 level under different scenarios from IEA (2021 b). B. Chart shows the amount in kilograms (kg) of copper required to generate one megawatt of electricity using different generation methods.
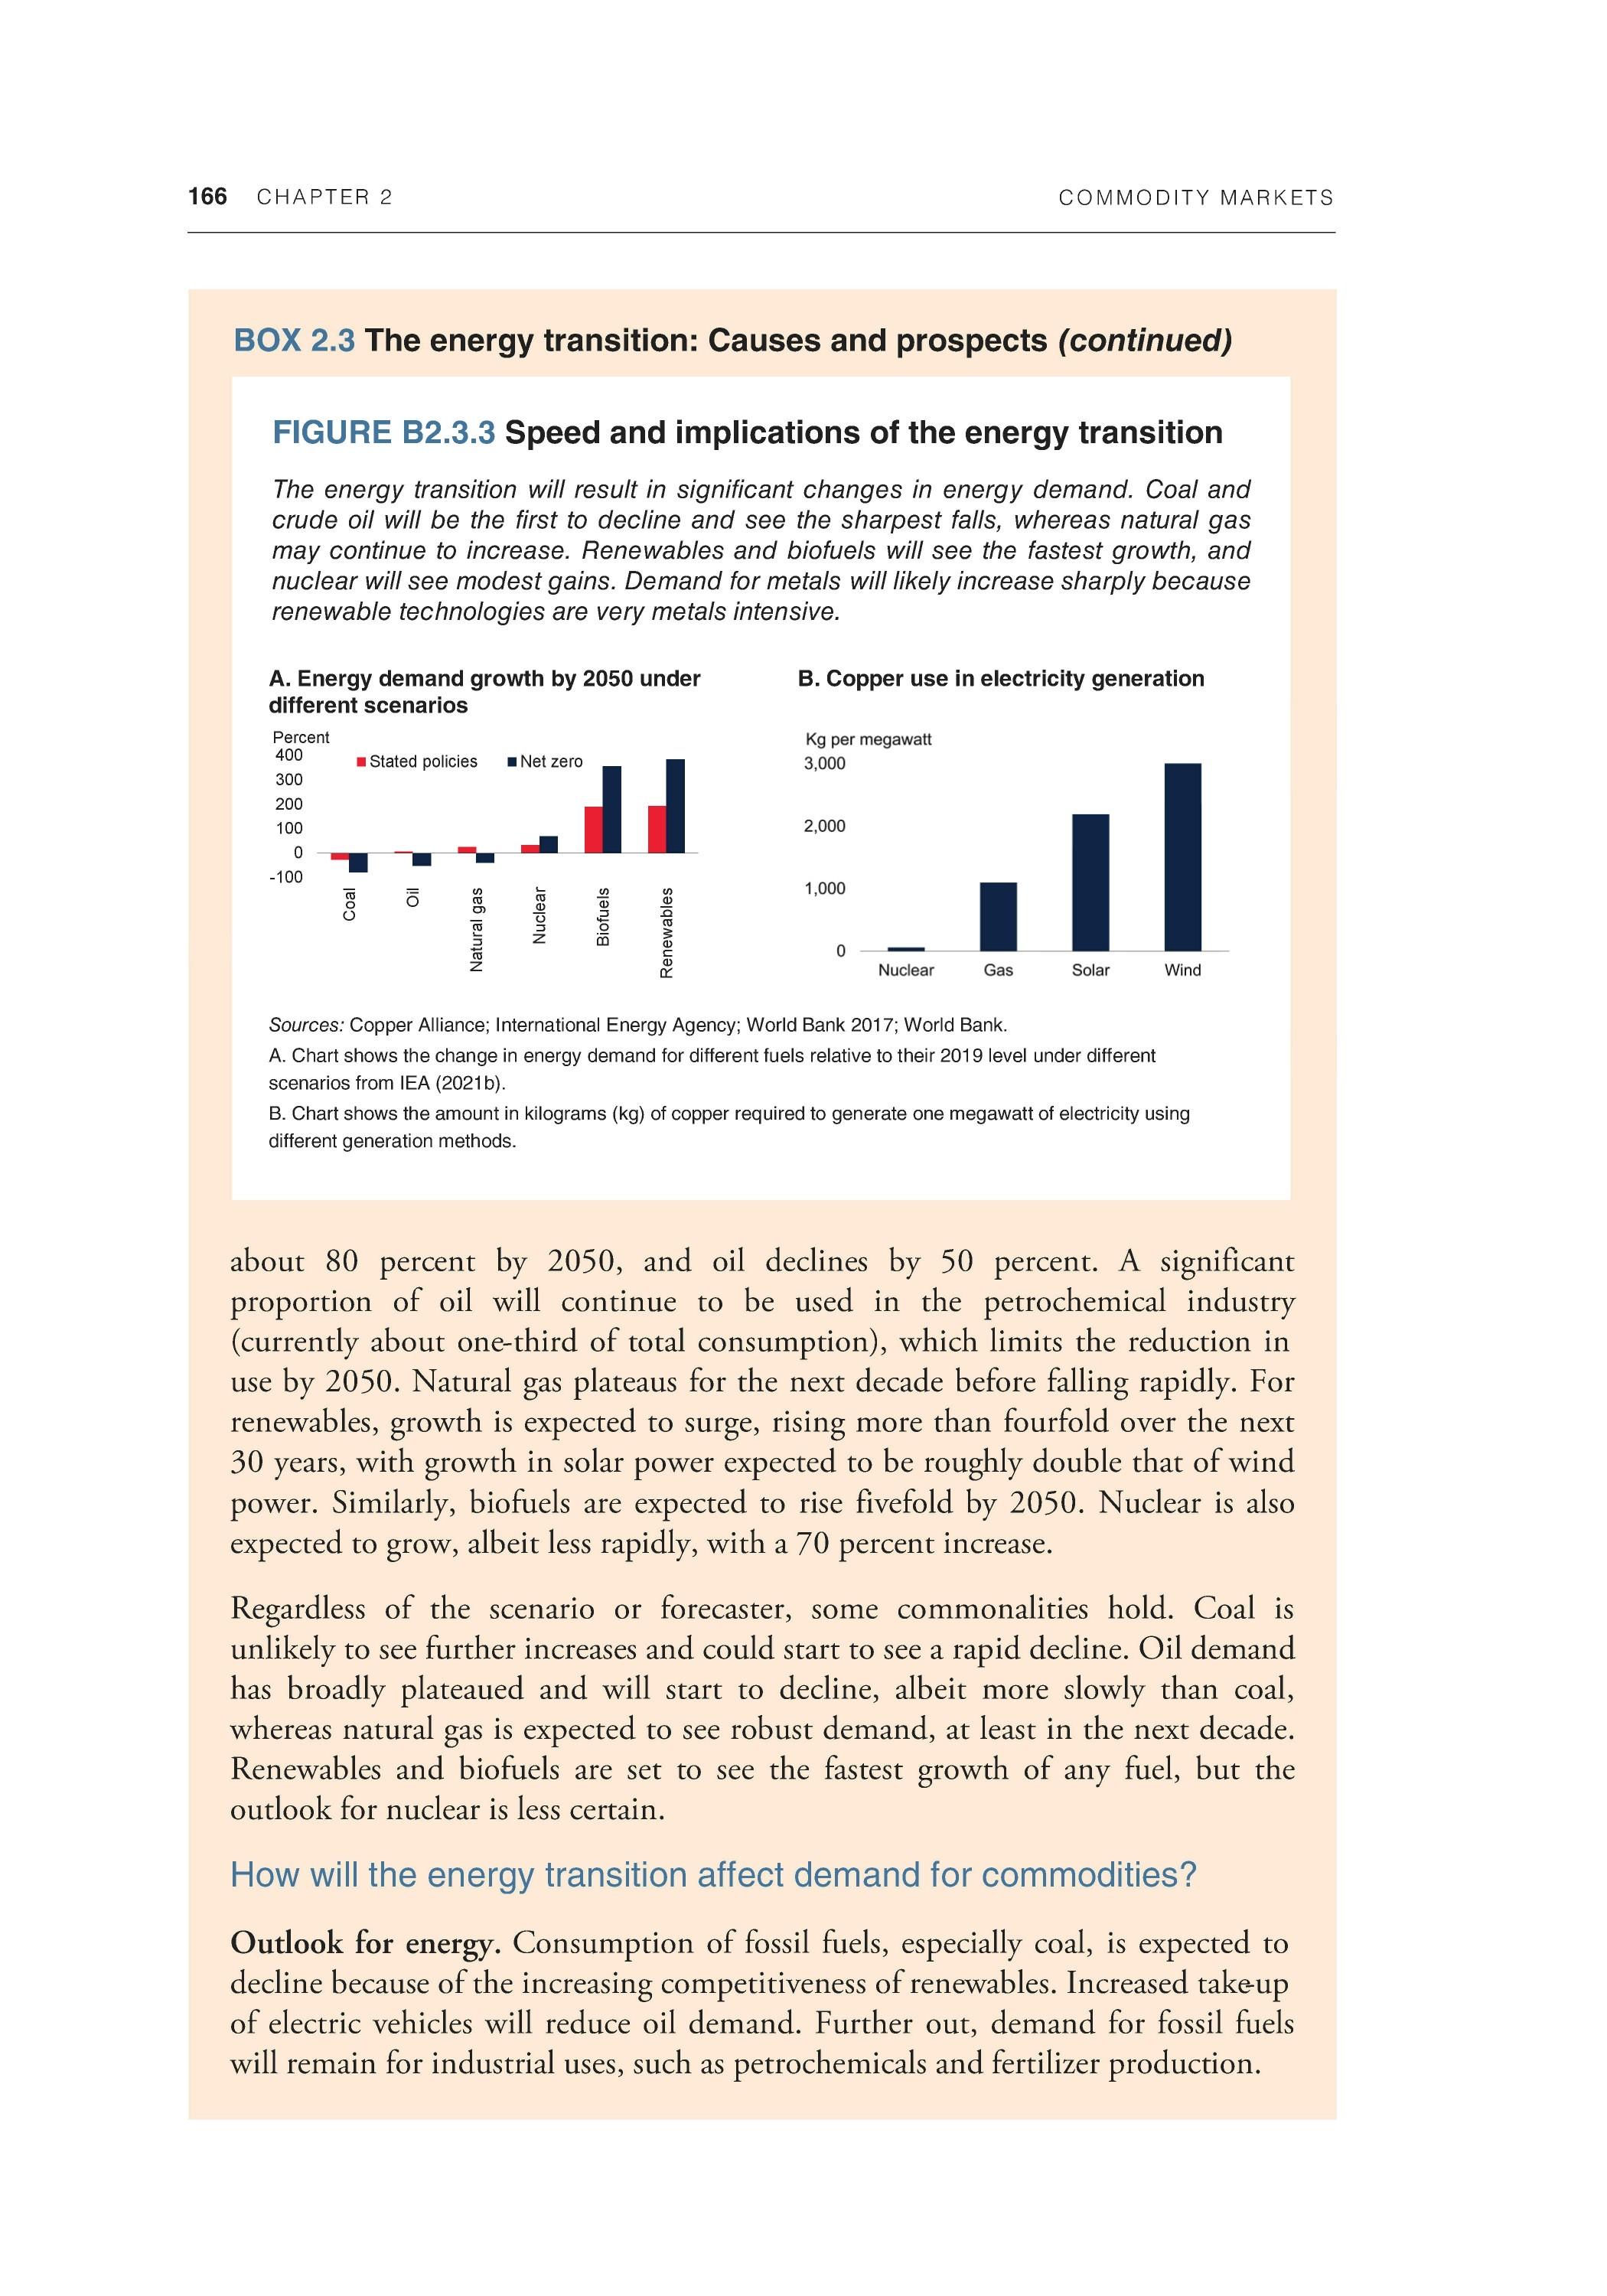
about 80 percent by 2050, and oil declines by 50 percent. A significant proportion of oil will continue to be used in the petrochemical industry (currently about one-third of total consumption), which limits the reduction in use by 2050. Natural gas plateaus for the next decade before falling rapidly. For renewables, growth is expected to surge, rising more than fourfold over the next 30 years, with growth in solar power expected to be roughly double that of wind power. Similarly, biofuels are expected to rise fivefold by 2050. Nuclear is also expected to grow, albeit less rapidly, with a 70 percent increase.
Regardless of the scenario or forecaster, some commonalities hold. Coal is unlikely to see further increases and could start to see a rapid decline. Oil demand has broadly plateaued and will start to decline, albeit more slowly than coal, whereas natural gas is expected to see robust demand, at least in the next decade. Renewables and biofuels are set to see the fastest growth of any fuel, but the outlook for nuclear is less certain.
How will the energy transition affect demand for commodities?
Outlook for energy. Consumption of fossil fuels, especially coal, is expected to decline because of the increasing competitiveness of renewables. Increased take-up of electric vehicles will reduce oil demand. Further out, demand for fossil fuels will remain for industrial uses, such as petrochemicals and fertilizer production.
COMMODITY MARKETS CHAPTER 2 167
BOX 2.3 The energy transition: Causes and prospects (continued)
The impact of the energy transition on the production of fossil fuels, and consequently on prices, is more uncertain. The production of fossil fuels (especially natural gas and crude oil) requires significant investment in exploration and drilling simply to maintain current levels of production. Natural gas and oil wells can have high decline rates, particularly in the case of shale oil. Even if demand for these fuels falls, substantial new investment will still be needed. As a result of ESG investing and shareholder activism, there has been a shift away from investment in new oil production by the oil majors. State-owned companies, however, have been under less pressure to diversify. Therefore, future production is likely to increasingly be accounted for by the Organization of the Petroleum Exporting Countries and its partners. The remaining producers will likely be those with the lowest cost of production, whereas higher-cost producers will be the first to curtail production.
Outlook for metals. In contrast to fossil fuels, demand for certain metals and minerals is likely to benefit from a shift to a zero-carbon future. Low-carbonemission technology is typically more metals intensive than fossil fuel energy. The key metals needed for a low-carbon future are aluminum (including alumina and bauxite), chromium, cobalt, copper, iron ore and steel, lithium, manganese, molybdenum, nickel, platinum group metals, rare earth metals (which include cadmium, indium, and neodymium), silver, titanium, and zinc (World Bank 2017). At present, solar-generated electricity requires twice as much copper as natural gas does, and wind requires three times as much (World Bank 2017). The same is true for electric vehicles. A traditional internal combustion engine car uses about 20 kilograms of copper, but electric vehicles require more than four times as much (ICA 2017). The wiring of the electric vehicle charging infrastructure will also imply a boost in demand for both aluminum and copper.
Outlook for agriculture. For agricultural commodities, the main impact of the energy transition is likely to be through increased demand for biofuels. Projected scenarios anticipate a sharp increase in biofuel consumption wherever electricity is not a feasible energy substitute for crude oil. The main crops for biofuels are corn/maize (United States), sugarcane (Brazil), and vegetable oils such as canola and palm (European Union). Biofuels currently account for about 4 percent of total land allocated to food crops. However, rapid-transition scenarios anticipate a fourfold increase in production, which would represent a massive diversion of land from food crops. In addition, biofuels' net environmental benefits are limited by the energy required to produce and process the crops (Searchinger et al. 2008). To mitigate this pressure, a significant further increase in agricultural yields, or the development of advanced biofuels made from crop waste or algae, would be required. Climate change could also affect agricultural production. For example, temperature and precipitation changes affect crop yields and could render large areas unsuitable for cropping (Schmidhuber and Tubiello 2007).
168 CHAPTER 2 COMMODITY MARKETS
commodity intensity of output. Technological change, per capita income, and government policies have had important effects on commodity intensity.
Since 1970, global population has doubled, with growth concentrated mainly in EMDEs and low-income countries. Per capita income at the global level has more than doubled, and it has quadrupled among EMDEs. Thus, although global per capita consumption of commodities has leveled off over the past 20 years, consumption relative to GDP has declined. The decline in the commodity intensity of global output has been focused in energy and agricultural commodities. For metals, a similar downward trend in intensity was evident until about 2000, when the rapid industrialization of China brought a turnaround.
Econometric estimates of the income elasticities of demand for commodities indicate a causal pattern underlying these trends. The estimated elasticity, at median per capita income, is greater for metals than for energy, and lower for food than either. Demand for food has been almost entirely driven by population growth. Estimated income elasticities for all three commodity groups decline as incomes rise, providing support for the hypothesis that economic development involves a shift from material-intensive goods toward products with a higher-value-added component, notably services.
EMDE demand for metals, and to a lesser extent for energy, is expected to continue to grow over the next few decades, because many countries are still in a development phase associated with high income elasticities of demand. However, it is unlikely that EMDE commodity demand growth will repeat the growth rates experienced during the past two decades, because income growth and industrialization policies in other countries are unlikely to replicate those of China. Further, whereas demand for energy will continue to grow, demand for fossil fuels is expected to decline; energy will instead be provided by zero-carbon sources, such as renewables or nuclear energy.
The evolution of the drivers of commodity demand, together with likely changes resulting from the energy transition, will have significant implications in the years ahead. Aggregate commodity demand is expected to slow, reflecting the slowdown in income and population growth, and China's shift toward services. However, the outlook for different commodities varies substantially. Growth in demand for metals is likely to be higher than for other commodities because of metals' high income elasticity of demand, as well as the energy transition. Energy demand should continue to grow, albeit at a slower rate. With the shift away from fossil fuels, however, demand for hydrocarbons will grow more slowly or decline, compared to the past 50 years. Demand growth for agricultural crops is likely to moderate in line with the slowdown in population growth. The slowing will likely be concentrated in basic foods such as grains; demand for the more income-elastic foods, such as meat and dairy, may see faster growth.
The emerging energy transition implies transformative substitutions among commodities, and underlays the robust growth projected for metal consumption. The switch to clean electric power implies a permanent increase in the demand for copper, nickel, cobalt, and lithium, and an eventual drop in the use of fossil fuels. With respect


