APRIL 2023 | VOLUME 27

AN ANALYSIS OF ISSUES SHAPING AFRICA’S ECONOMIC FUTURE
LEVERAGING RESOURCE WEALTH DURING THE LOW CARBON TRANSITION
A PRODUCT OF THE OFFICE OF THE CHIEF ECONOMIST FOR THE AFRICA REGION

ACKNOWLEDGMENTS
This report was produced by the Office of the Chief Economist for the Africa Region under the overall guidance of Victoria Kwakwa and Ousmane Diagana. The team for this edition of Africa’s Pulse was led by Andrew L. Dabalen and Cesar Calderon. The core team included James Cust, Megumi Kubota, and Vijdan Korman.
Valuable contributions to the report were provided by John Baffes, Gracelin Baskaran, Sebastian Essl, Dawit Mekonnen, Patrick Alexander Kirby, Will Pearson, Alexis Rivera-Ballesteros, and Tessy Grace Vasquez Baos.
This report was peer-reviewed by Franziska Lieselotte Ohnsorge, Garima Vasishtha, and Sergiy Kasyanenko (section 1), and Kevin Carey and Martin Lokanc (section 2). Comments were also received from Bekele Debele, Djeneba Doumbia, Franz R. Drees-Gross, Sandra El Saghir, David Elmaleh, Jakob Engel, Kene Ezemenari, Cornelius Fleischhaker, Zerihun Getachew Kelbore, Paulo Guilherme Correa, Fiseha Haile, Yumeka Hirano, Wendy Hughes, Stella Ilieva, Tehmina S. Khan, Ashish Khanna, Samuel Mulugeta, Dumisani Sihle Ngwenya, Abdoulaye Ouedraogo, Nathalie Picarelli, Frederico Gil Sander, Philip Schuler, Smriti Seth, and Natasha Sharma.
Communications, media relations, and stakeholder engagement were led by Flore de Préneuf with the External and Corporate Relations team, including Georgette Dwomoh-Appiah, Caitlin Berczik, Patricia Riehn Berg, Karima Bouckat, Kimberly Bumgarner, Christelle Chapoy, Marie Duffour, Rama George-Alleyne, Artem Kolesnikov, Daniella van Leggelo Padilla, Laure de Petiville, Pabsy Mariano, Svetlana Markova, Johanna Martinsson, and Samuel Owusu Baafi. Beatrice Berman, Abrah Desiree Brahima, Kenneth Omondi, and Rose-Claire Pakabomba provided production and logistical support.
The report was edited by Sandra Gain. The online and print publication was produced by Bill Pragluski, and the cover design was by Rajesh Sharma.
APRIL 2023 | VOLUME 27
AN ANALYSIS OF ISSUES SHAPING AFRICA’S ECONOMIC FUTURE
LEVERAGING RESOURCE WEALTH DURING THE LOW CARBON TRANSITION
© 2023 International Bank for Reconstruction and Development / The World Bank
1818 H Street NW, Washington, DC 20433
Telephone: 202-473-1000; Internet: www.worldbank.org
Some rights reserved
1 2 3 4 26 25 24 23
This work is a product of the staff of The World Bank with external contributions. The findings, interpretations, and conclusions expressed in this work do not necessarily reflect the views of The World Bank, its Board of Executive Directors, or the governments they represent. The World Bank does not guarantee the accuracy, completeness, or currency of the data included in this work and does not assume responsibility for any errors, omissions, or discrepancies in the information, or liability with respect to the use of or failure to use the information, methods, processes, or conclusions set forth. The boundaries, colors, denominations, and other information shown on any map in this work do not imply any judgment on the part of The World Bank concerning the legal status of any territory or the endorsement or acceptance of such boundaries.
Nothing herein shall constitute or be construed or considered to be a limitation upon or waiver of the privileges and immunities of The World Bank, all of which are specifically reserved.
Rights and Permissions
This work is available under the Creative Commons Attribution 3.0 IGO license (CC BY 3.0 IGO) http:// creativecommons.org/licenses/by/3.0/igo. Under the Creative Commons Attribution license, you are free to copy, distribute, transmit, and adapt this work, including for commercial purposes, under the following conditions:
Attribution—Please cite the work as follows: World Bank. 2023. Leveraging Resource Wealth During the Low Carbon Transition. Africa’s Pulse, No. 27 (April). Washington, DC: World Bank. doi:10.1596/978-1-46481985-8. License: Creative Commons Attribution CC BY 3.0 IGO
Translations—If you create a translation of this work, please add the following disclaimer along with the attribution: This translation was not created by The World Bank and should not be considered an official World Bank translation. The World Bank shall not be liable for any content or error in this translation.
Adaptations—If you create an adaptation of this work, please add the following disclaimer along with the attribution: This is an adaptation of an original work by The World Bank. Views and opinions expressed in the adaptation are the sole responsibility of the author or authors of the adaptation and are not endorsed by The World Bank.
Third-party content—The World Bank does not necessarily own each component of the content contained within the work. The World Bank therefore does not warrant that the use of any third-partyowned individual component or part contained in the work will not infringe on the rights of those third parties. The risk of claims resulting from such infringement rests solely with you. If you wish to re-use a component of the work, it is your responsibility to determine whether permission is needed for that re-use and to obtain permission from the copyright owner. Examples of components can include, but are not limited to, tables, figures, or images.
All queries on rights and licenses should be addressed to World Bank Publications, The World Bank Group, 1818 H Street NW, Washington, DC 20433, USA; e-mail: pubrights@worldbank.org.
ISBN (electronic): 978-1-4648-1985-8

DOI: 10.1596/978-1-4648-1985-8
Cover design: Rajesh Sharma
AFRICA’S PULSE > i Table of Contents Executive Summary . . . . . . . . . . . . . . . . . . . . . . . . . . . . . . . . . . . . . . . . . . . . . . . . . . . . . . . . . . . . . . . . . . . . 1 Section 1 . Recent Trends and Developments . . . . . . . . . . . . . . . . . . . . . . . . . . . . . . . . . . . . . . . . . . . . . 9 1.1 Growth and Poverty . . . . . . . . . . . . . . . . . . . . . . . . . . . . . . . . . . . . . . . . . . . 9 1.2 The Global Environment . . . . . . . . . . . . . . . . . . . . . . . . . . . . . . . . . . . . . . . .18 1.3 The Domestic Environment . . . . . . . . . . . . . . . . . . . . . . . . . . . . . . . . . . . . . .23 1.4 Outlook . . . . . . . . . . . . . . . . . . . . . . . . . . . . . . . . . . . . . . . . . . . . . . . . . .40 1.5 Risks to the Outlook . . . . . . . . . . . . . . . . . . . . . . . . . . . . . . . . . . . . . . . . . .46 1.6 Policy Recommendations . . . . . . . . . . . . . . . . . . . . . . . . . . . . . . . . . . . . . . .48 Section 2: Natural Resource Abundance, the Low Carbon Transition, and Improving Energy Access in Africa . . . . . . . . . . . . . . . . . . . . . . . . . . . . . . . . . . . . . . . . . . . . . . . . . 55 2.1 Motivation 55 2.2 Natural Resources: Insights and Stylized Facts 57 2.3 Access to Electricity: Insights and Stylized Facts 68 2.4 Policy Discussion 72 2.5 Policy Recommendations 73 Appendix: Country Classifications . . . . . . . . . . . . . . . . . . . . . . . . . . . . . . . . . . . . . . . . . . . . . . . . . . . . . . 83 References . . . . . . . . . . . . . . . . . . . . . . . . . . . . . . . . . . . . . . . . . . . . . . . . . . . . . . . . . . . . . . . . . . . . . . . . . . . 85
AFRICA’S PULSE > ii List of Boxes 1.1 Tensions in Monetary and Fiscal Policy on the Back of Inflationary Pressures 31 1.2 Persistent Twin Deficits in Sub-Saharan Africa 34 2.1 Mining Reforms in Zambia Have Driven Improving Investment and Revenues . . . . . . . 62 2.2 South Africa’s Just Transition Partnership 66 2.3 Leveraging the Regional Power Pool to Attract Renewable Energy Investment 80 List of Figures 1.1 Contribution to GDP Growth, Demand Side 10 1.2 Contribution to GDP Growth, Production Side 10 1.3 Headcount Poverty Ratio in Sub-Saharan Africa, by Subregion 11 1.4 Growth across Sub-Saharan African Countries in 2022 12 1.5 Consensus Global Growth 18 1.6 Output Deviation from Pre-Pandemic Trends 18 1.7 G7 Policy Rates . . . . . . . . . . . . . . . . . . . . . . . . . . . . . . . . . . . . . . . . . . . . . . 19 1.8 EMBI Sovereign Spread Changes Since the Beginning of 2022, by Credit Rating 19 1.9 World Bank Price Indexes for Emerging Economies 21 1.10 Average Monthly Prices of Coffee, Cocoa, and Tea . . . . . . . . . . . . . . . . . . . . . . . . 22 1.11 Investment Growth Relative to Average Long-Term Growth in Sub-Saharan Africa, by Subregion, 2010–21 . . . . . . . . . . . . . . . . . . . . . . . . . . . . . . . . . . . . . . . . . 23 1.12 Investment Growth Relative to Average Long-Term Growth in Sub-Saharan Africa, by Resource Abundance and Fragility, 2010–21 . . . . . . . . . . . . . . . . . . . . . . . . . . 24 1.13 Investment Growth Relative to Average Long-Term Growth in Sub-Saharan Africa, by Type of Investment (Public, Private, and Foreign), 2010–21 24 1.14 Growth of Remittance Inflows Relative to Average Long-Term Growth in Sub-Saharan Africa, by Subregion, 2010–21 25 1.15 Median Inflation in Sub-Saharan Africa, 2018–2025f 26 1.16 Headline and Food Inflation across Sub-Saharan African Countries, January 2023 . . . . . 27 1.17 Cumulative Variation in Exchange Rates in Selected Countries 27 1.18 Policy Rates and Cumulative Variation Since January 2022 29 1.19 Fiscal Balance in Sub-Saharan Africa, 2016–2025f . . . . . . . . . . . . . . . . . . . . . . . . . 30 1.20 Evolution of the Current Account in Sub-Saharan Africa 32 1.21 Public Debt Dynamics in Sub-Saharan Africa 35 1.22 Debt Decomposition in Sub-Saharan Africa . . . . . . . . . . . . . . . . . . . . . . . . . . . . 36 1.23 Public and Publicly Guaranteed External Debt Composition in Sub-Saharan African Countries . . . . . . . . . . . . . . . . . . . . . . . . . . . . . . . . . . 36 1.24 Risk of External Debt Distress (share of active LIC DSF countries) 37 1.25 Bond Spreads in Sub-Saharan Africa 38
AFRICA’S PULSE > iii 1.26 Contribution to GDP Growth, Demand Side 40 1.27 Contribution to GDP Growth, Production Side 40 1.28 GDP Growth Forecasts for Eastern and Southern Africa . . . . . . . . . . . . . . . . . . . . . 41 1.29 GDP Growth Forecasts for Western and Central Africa 43 1.30 Is Stagflation a Looming Threat among Sub-Saharan African Countries? 45 2.1 Average GDP Growth per Capita, by Resource Type 58 2.2 Total Poverty Headcount in Resource-Rich and Non-Resource-Rich Sub-Saharan Africa 58 2.3 Mining Exploration Budget, by Region, 1997–2021 59 2.4 Estimates of Selected Metal and Mineral Reserves in Sub-Saharan Africa, 2014–22 60 2.5 Sub-Saharan Africa’s Share of Cobalt Trade 61 2.6 Estimated Oil and Gas Reserves in Sub-Saharan Africa . . . . . . . . . . . . . . . . . . . . . . 65 2.7 Natural Gas Discoveries and Final Investment Decisions 65 2.8 Power Generation Capacity Additions in Africa in the Sustainable Africa Scenario, 2011–30 66 2.9 Population without Access to Modern Energy Services in Africa 68 2.10 Total Energy Supply for Africa, by Source, 2010–20 . . . . . . . . . . . . . . . . . . . . . . . . 68 2.11 Access to Electricity and Pandemic-Related Impacts in Selected African Countries 69 2.12 Overall Renewable Energy Investment in Africa and Globally, 2000–20 71 B1.1.1 Monetary and Fiscal Policy Stance across Sub-Saharan African Countries, 2023 31 B1.2.1 Current Account and Fiscal Balance across Sub-Saharan African Countries, 2022–23 34 B2.2.1 Price Paths of Commodities, 2013–21 67 B2.2.2 Coal’s Contribution to Earnings and Employment Increased between 2010 and 2020 67 List of Maps 2.1 Resource-Rich Countries in Sub-Saharan Africa during the Commodity Price Boom 57 2.2 Raw Mineral and Metal Export Restrictions in Sub-Saharan Africa, 2020 64 2.3 Potential and Installed Capacity for Wind, Solar, and Hydropower . . . . . . . . . . . . . . . 71 List of Tables 2.1 Minerals and Metals Required for Various Clean Energy Technologies 60 A.1 Country Classification by Resource Abundance in Sub-Saharan Africa 83 A.2 Western and Central Africa Country Classification . . . . . . . . . . . . . . . . . . . . . . . . . 83 A.3 Eastern and Southern Africa Country Classification 83
AFRICA’S PULSE > iv
Executive Summary
Economic growth in Sub-Saharan Africa remains low but the slowdown may be bottoming out
u Economic growth slowed to 3.6 percent in 2022, from 4.1 percent in 2021, an upward revision of 0.3 percentage point from the October 2022 Africa’s Pulse forecast. This upgrade reflects a more positive performance of the global economy in the last quarter of 2022, which included the resilience of the US economy, thanks to recent policy measures and declining inflation; lower than expected gas prices in Europe; and the expectation of a rapid growth recovery in China as the country unwinds its zero-COVID policy.
u Notwithstanding recent improvements, economic activity in the region is projected to further slow down to 3.1 percent in 2023, a 0.4 percentage point downward revision compared to the October 2022 Africa’s Pulse forecast. The persistent sluggishness of the global economy, declining yet high inflation rates, and challenging global and domestic financial conditions amid high levels of debt explain the downgrade. Growth is estimated to pick up to 3.7 and 3.9 percent in 2024 and 2025, respectively—thus signaling that the slowdown in growth should be bottoming out this year. A rebound of global growth later this year, easing of austerity measures, and more accommodative monetary policy amid falling inflation are the main factors contributing to the increased growth along the forecast horizon.
u Growth conditions, however, remain insufficient to reduce extreme poverty and boost shared prosperity in the medium to long term. The estimated per capita income growth in SubSaharan Africa of 1.0 and 0.6 percent in 2022 and 2023, respectively, is inadequate to have a significant impact on the twin goals. The low growth elasticity of poverty and the global pandemic further contributed to the slow pace of poverty reduction in the region. SubSaharan Africa’s poverty headcount ratio is projected at 34 percent in 2023, compared to the COVID-19 peak of 35.3 percent in 2020. The sluggish recovery of income per capita in the region, at 1.2 percent next year and 1.4 percent in 2025, still falls short of accelerating poverty reduction to its pre-pandemic path.
u The economic performance of Sub-Saharan Africa is not uniform across subregions and countries. The real gross domestic product (GDP) growth of the Western and Central Africa (AFW) subregion is estimated to decline to 3.4 percent in 2023, from 3.7 percent in 2022, while that of Eastern and Southern Africa (AFE) declines to 3.0 percent in 2023, from 3.5 percent in 2022. The region’s performance is still dragged down by lower growth of the largest countries in the continent. Economic activity in South Africa is set to weaken further in 2023 (0.5 percent) as the energy crisis deepens, while the growth recovery in Nigeria for 2023 (2.8 percent) is still fragile as oil production remains subdued and the new administration faces many policy challenges. This outlook poses challenges to policy makers in the region who seek to accelerate the post-pandemic recovery, reduce poverty, and put the economy on a sustainable growth path.
AFRICA’S PULSE > 1
Investment growth has declined sharply across the board
u Sub-Saharan Africa faces a myriad of challenges to regain its growth momentum. One of these challenges is to overcome the protracted slowdown of growth of investment in the region. Investment growth in Sub-Saharan Africa fell from 6.8 percent in 2010–13 to 1.6 percent in 2021, with a sharper slowdown in AFE than AFW. Amid the economic fallout of the pandemic and the war in Ukraine, investment growth is expected to remain modest and below the average growth rate of investment over the past two decades, not only in Sub-Saharan Africa, but also in other emerging markets and less developed economies.
u The sharp deceleration of investment growth has been broad-based across the subregions, resource abundant and resource scarce countries, and types of investors (public, private, and foreign). Oil abundant countries in the region have experienced the largest and more persistent downswing in investment, as opposed to non-resource abundant countries, which exhibit a more subdued decline in investment. Rates of public, private, and foreign investment growth have remained below their long-term averages for most years in the past decade. While domestic private investment showed a modest decline over time, foreign direct investment experienced a contraction during 2016–21. By contrast, remittances remained resilient to the various shocks over the past decade—including the pandemic.
u Slower investment growth in Sub-Saharan Africa is holding back long-term growth of output and per capita income, as well as progress toward achievement of the Sustainable Development Goals. Differences in the strength of the recovery across subregions and countries are partly related to differences in the growth of investment. For instance, the slower growth recovery of AFE relative to AFW is associated with the sharp slowdown in public investment and contraction of (domestic and foreign) private investment. Weak investment growth adds to macro-fiscal pressures, amid substantial financing needs, limited fiscal space, and rising borrowing costs.
u Consumer price inflation in Sub-Saharan Africa accelerated sharply and hit a 14-year record high in 2022 (9.2 percent), fueled by rising food and energy prices as well as weaker currencies. Domestic food prices have remained high despite the gradual decline in world food prices. Weaker currencies and higher input costs (transport fuels and fertilizers) explain the stickiness of food prices. Climate shocks, especially in the Horn of Africa, add inflationary pressures from the supply side. The number of countries with two-digit average annual rates of inflation increased from 9 in 2021 to 21 in 2022. A slowdown in aggregate demand, declining commodity prices, and the effects of the monetary policy tightening across the continent will lower inflation in the region to 7.5 percent in 2023, and further to 5.0 percent in 2024. Additionally, the number of countries with two-digit inflation is expected to drop to 12 in 2023. Although headline inflation appears to have peaked in the past year, inflation is set to remain high and above central bank target bands for all countries with an explicit nominal anchor in 2023.
u Inflation rates remain high and above targets despite the early and sizable interest rate hikes undertaken by African central banks. For instance, the monetary authorities in Ghana, Mozambique, Nigeria, South Africa, and Uganda, among others, raised their monetary policy rates swiftly to record highs over the past two years. Weaknesses in monetary transmission
AFRICA’S PULSE > 2
Inflation appears to have peaked, but remains persistently high and above target, and will continue to weigh on economic activity
across African countries might explain the reduced effectiveness of the tightening cycle. Inadequate tools for policy implementation and lack of policy independence can contribute to weak transmission. Fiscal dominance and foreign exchange rate restrictions may lead to inflation outcomes that are contrary to what monetary tightening intends. As headline inflation rates peaked in some countries at the end of 2022 and the start of 2023, policy makers might be tempted to ease or pause their contractionary monetary policy stance. This action seems premature as underlying inflationary pressures across countries in the region remain high. In Sub-Saharan Africa, curbing inflation remains essential to boost people’s incomes and reduce uncertainty around consumption and investment plans. Policies to fight against inflation should be complemented by income support measures (via cash or food transfers) to protect the most vulnerable from stubbornly high inflation—particularly, food inflation.
Unfavorable global financial conditions and high levels of debt threaten macro-fiscal stability
u The fiscal deficit in the region widened to 5.2 percent in 2022. Persistent fiscal deficits compounded by sluggish growth resulted in an increase in the (median) public debt-to-GDP ratio to 57 percent in 2022. The war in Ukraine halted the fiscal consolidation process of many countries in the region that started in the aftermath of the pandemic. A significant drop in official development assistance and restricted access to external borrowing also contribute to the worsening of fiscal outcomes. In response to increased food and fuel prices, policy makers resorted to measures that limit or reduce the pass-through on inflation, such as subsidies, temporary waivers of tariffs and levies, and income support mechanisms for the most vulnerable. This sets back fiscal consolidation as budget deficits in the region remain high and create additional pressure on the budget, especially for governments with almost depleted fiscal space. Consolidation efforts to bring down debt are projected to resume this year and lower the fiscal deficit to 4.3 percent in 2023 and further to 3 percent in 2024–25.
u Public debt in Sub-Saharan Africa has more than tripled since 2010, with a sharp increase prior to the onset of the COVID-19 crisis. The surge in public debt has been accompanied by a shift in its composition toward domestic debt—particularly, to meet pandemic-related financing needs. Domestic debt accounted for nearly half of outstanding public debt by the end of 2021. As non-concessional debt increased and nontraditional creditors held a larger share of outstanding debt in the region, public debt service increased significantly over the past decade. The ratios of total public debt service to exports and revenue reached 28 and 41 percent, respectively. Debt distress risks remain high: the number of countries in the region at high risk of external debt distress or in debt distress was 22 as of December 2022. Sovereign spreads have increased and narrowed the number of countries with market access, which raises refinancing risks for countries with large Eurobond redemptions.
u Public gross financing needs have increased steadily and remain above historical levels in Sub-Saharan Africa (about 11 percent of GDP in 2020–22). They are projected to remain at 10 percent for the upcoming five years, with greater financing needs in AFE compared to AFW. Tightening financial conditions are keeping the cost of external borrowing high, pricing some countries in the region out of international capital markets. In response, governments are increasingly resorting to domestic financing. This could put upward pressure on domestic interest rates—which, in turn, will further weigh on investment and output.
AFRICA’S PULSE > 3
POLICY RESPONSES
u Sub-Saharan African countries face a challenging global environment with sluggish global growth and tightened global financial conditions. High inflation rates, elevated domestic interest rates, high and vulnerable debt positions, and reduced capacity to borrow add to the constraints that make it difficult for African economies to finance their recovery. In this context, African policy makers must bank on their own domestic policy space to restore macroeconomic stability, deepen structural reforms to foster inclusive growth, and implement policies that seize the opportunities available during the low carbon transmission.
u Africa’s natural resource wealth holds significant untapped economic potential. About onethird of the total stock of wealth in Sub-Saharan Africa is held in various forms of natural capital, including renewable natural capital like cropland, water resources, and forests, as well as nonrenewable subsoil assets. The region’s nonrenewable petroleum and mineral deposits reached more than US$5 trillion in value during the boom years (2004–14). Sub-Saharan Africa has seen more major petroleum discoveries since 2000 than any other region in the world, accounting for 50 percent of all giant discoveries in the 2010s. Most countries in the region are already classified as resource-rich and many will join them as new investments unlock these undeveloped reserves. The number of resource-rich countries increased from 18 of 48 before the boom to 26 of 48 countries by the end of the boom. Thus, the low carbon transition is likely to see more resource dependent economies in Africa, not fewer.
Restoring macroeconomic stability
u Curbing inflation remains central to achieving macroeconomic stability. Monetary authorities in the region have been raising rates to dampen demand and contain inflation; however, other government interventions have weakened the impact of monetary tightening. For instance, rising interest rates in countries with fiscal dominance lead to greater expectations of fiscal stress, currency depreciation, and even higher inflation. Foreign exchange restrictions that widened parallel market premia have also contributed to derail the fight against inflation in some countries. There is a risk that de-anchoring inflation expectations would fuel further inflation, accelerate interest rate increases, and increase the probability of a downturn in economic activity. Ensuring the independence of the central bank (in terms of its policy instruments and decision making) and strengthening the institutions that support a sound, transparent, and accountable monetary policy are essential to curb inflation. Policy coordination to avoid actions that weaken the transmission of monetary policy is also critical. In this context, easing or putting a pause on the monetary tightening cycle seems to be premature, as inflationary pressures remain unabated.
u Fiscal policy anchored in debt sustainability can help fight inflation. Reducing fiscal and debt sustainability risks via domestic resource mobilization and greater spending efficiency can help cool aggregate demand and inflation. This includes measures to increase and diversify the tax base, improve tax administration (via taxpayer registration, e-filing, and e-payment of taxes), and enhance the targeting of social protection programs (beneficiary registration and e-transfers). Reforms to strengthen public investment management systems (that is, increasing transparency in appraisal, selection, and approval of investment projects) and repurpose government spending toward high-value investments will provide significant dividends.
AFRICA’S PULSE > 4
u Accelerating debt reduction and restructuring is critical to shore up stability for growth. The international community needs permanent, comprehensive, and credible mechanisms to address sovereign debt crises when they occur. The G-20 Common Framework for Debt Treatments is the closest framework for debt resolution. International financial institutions support this framework but would like the process to be faster, more inclusive, and cover all creditors. So far, four countries in the region are seeking debt restructuring via the Common Framework, namely, Chad, Ethiopia, Zambia, and, more recently, Ghana. Chad is the only country that has negotiated an agreement with its creditors under this initiative, albeit without an actual debt reduction.
u More could be done to increase uptake and speed up treatments under the Common Framework. The framework can be extended to more countries—particularly middle-income countries that are experiencing debt distress and need relief from unsustainable debt repayments. Mechanisms to encourage earlier participation of private creditors and new bilateral lenders such as China should be introduced to improve the alignment of their incentives with those of official creditors and sovereign borrowers. The framework should also lead to fair treatment of all lenders, and hopefully a streamlined and faster process for debt resolution. Suspending debt service payments for Common Framework applicants for the duration of the negotiation could boost uptake. In sum, a comprehensive debt solution for borrowing countries will require debt suspension, reduction, resolution, and transparency. Greater coordination with creditors and renewed efforts toward debt transparency will facilitate debt reconciliation and restructuring. For countries with debt sustainability problems, a comprehensive debt restructuring, including face value reductions, should be considered.
u Leveraging concessional financing remains key for Africa amid a challenging external environment, high levels of debt, limited capacity to mobilize domestic resources, and weak public investment management systems. Given the continent’s rising investment needs—including climate financing for adaptation—private and non-concessional lending will be needed to close the financing gap. International financial institutions, for instance, can provide support to countries in the region to strengthen critical reform areas to increase their access to concessional climate finance—such as governance, fiscal and debt management, statistical capacity, and the design of climate strategies. Synergies between public and private investors can help catalyze this financing, as the latter can provide the lion’s share of the financing while the former underwrite risks through guarantees.
Deepening structural reforms to foster inclusive growth
u Structural reforms should bolster private investment and improve the long-term competitiveness of African businesses. Market reforms that curtail structural and regulatory barriers to private sector participation in goods and services markets are essential. Trade and foreign investment policies are critical to improve participation in international markets and enhance access to intermediate inputs. These reforms can be complemented by strengthening institutions that enforce competition laws—including independent competition agencies and sound procurement systems. For public investment, boosting efficiency is critical amid scarcer resources to finance its expansion. Strengthening the credibility of multi-year budgeting and improving the governance of investment projects (including their appraisal and selection).
AFRICA’S PULSE > 5
u Attracting foreign investment and getting the most from it is an integral part of the region’s growth strategy. Advances in the region’s three I’s—infrastructure, institutions, and incentives—are critical to stimulate the entry of foreign capital. Expanding and upgrading the transportation system (including roads, airports, and ports), enhancing access to a reliable and affordable supply of electricity, and increasing the efficient use of existing infrastructure are key to boost economic integration in the region. Improving institutions includes strengthening investment and export promotion agencies and modernizing customs and border control procedures. Maintaining competitive real exchange rates; implementing regulatory frameworks that foster transparency, competition, and innovation; and designing trade policies that reduce antiexport bias can provide the right incentives to foreign investors.
Leveraging resource wealth during the low carbon transition
u Harnessing the potential of natural resources provides an opportunity to improve the fiscal and debt sustainability of African countries. This hinges on getting policies right and learning the lessons from past boom-bust cycles. Avoiding the “presource” curse, in which countries can find themselves in debt distress or facing low growth even before the production of resources begins, means tempering the pressure to borrow and spend ahead of revenues. Discoveries have been found to unleash powerful forces that can shape policy but leave countries exposed if they are not prepared for declining prices. Maximizing the government revenues captured from oil, gas, and mining offers the potential for a double dividend for people and the planet, by increasing fiscal space and removing implicit production subsidies.
u There is a significant untapped opportunity to mobilize inward investment and generate additional government revenues. On average, the rents generated by natural resources exceed government resource revenues by 2.6 times. This implies that governments could capture more of this rent with the right fiscal policies and reforms. Governance reforms and investments in fiscal administration can support higher levels of rent capture. Capturing the full share of rents would also yield a double dividend: for people and for the planet. In failing to capture the full value of resource extraction, the government provides an implicit production subsidy, generating more carbon emissions from an undertaxed petroleum sector. Similarly, in mining, failing to capture a fair share of revenues for the country risks short-changing citizens and underpricing social and environmental externalities caused by extraction.
u Natural resources (oil, gas, and minerals) offer a huge economic opportunity for African economies during the low carbon transition. Global decarbonization creates significant uncertainty, but it also opens up new ways to leverage countries’ resource wealth to spur economic transformation. On the one hand, the global low carbon transition will eventually lead to significant declines in demand for Africa’s oil, gas, and coal resources. The timing and scale remain uncertain, however. Such a major shift away from oil and gas may take years or even decades. On the other hand, there may be a marked increase in the demand for the minerals required for the clean energy transition, such as lithium, cobalt, copper, platinum, and manganese, many of which are abundant across Africa and used for batteries, electric vehicles, and other technologies.
u Regional integration and the implementation of a continental free trade area hold huge potential to spur economic transformation across Sub-Saharan Africa. The African Continental Free Trade Area unlocks the potential to promote mineral value addition and beneficiation on the continent,
AFRICA’S PULSE > 6
increasing sectoral productivity and the overall value of exports. The value chain—from the manufacturing of intermediate inputs such as machinery (backward linkages), to the actual extraction of minerals, to the processing phase (forward linkages)—can rarely be accomplished by a single country because of scale, skills, infrastructure, and capital constraints, among others. By shifting from a national approach to value addition, such as via reforming export restrictions, local content policies, and local equity participation to be regionally and continentally defined, rather than nationally, countries can unlock regional comparative advantages and value chains. Industrial policies can then be better configured to leverage regional and continental capacities, the varied resource base, larger capital and consumer markets, as well as regional or country-specific specializations. Transport and energy infrastructure present significant constraints to leveraging regional value chains and will also require prioritization, including cross-border infrastructure.
u Tapping into energy resources can improve energy access. Africa faces a significant challenge to meet its universal, high-quality energy access goals. In 2022, 600 million people in Africa, or 43 percent of the continent, lacked access to electricity. However, Africa’s resource base and associated investments could help accelerate progress by developing diverse energy sources. Because many natural resource projects are located in remote and rural communities, the scale-up of green energy investments and regional infrastructure could be leveraged to alleviate rural poverty and promote productivity gains.
u African countries can leverage their resources to bring together gas and renewable energy to meet domestic needs. Prioritizing inward investments in newly discovered and underdeveloped natural gas reserves can mobilize export revenues and spur domestic energy production and access. Exploiting natural gas reserves requires substantial investments. Given the capital-intensive and long-term nature of these investments, countries must develop and maintain clear and stable fiscal policies that support both exports and domestic consumption alongside capturing the maximum fiscal take. There are significant opportunities for gas domestically and internationally as a transition fuel, particularly where it is deployed alongside renewable energy technologies.
u Leveraging investment in and effective taxation of other natural resources can also unlock fiscal space for much-needed investments in domestic energy infrastructure, including renewable and mini-grid rural systems. Creating valuable anchor clients for the grid can help boost the finances of utilities.
u Good governance is an important determinant of positive economic outcomes from resource wealth. Policymakers need to ensure high levels of government accountability and public scrutiny of resource taxation and investment to ensure maximum development impact. Steps like contract disclosure, adherence to the Extractive Industries Transparency Initiative, and supporting and protecting civic space, can all support better resource governance.
u A just transition for Africa will depend on successfully harnessing the economic benefits from oil, gas, and mineral resources, including good governance and sound macro-fiscal management of resource revenues, while also preparing for a low-carbon future. Effective management and governance of natural resource wealth can unlock significant opportunities for job creation, value addition, and investments in human development. Given the extent of natural resource abundance, this wealth can play a central role in the transformation for Africa’s economic future.
AFRICA’S PULSE > 7
AFRICA’S PULSE > 8
Section 1. Recent Trends and Developments
1.1 GROWTH AND POVERTY
Economic growth in Sub-Saharan Africa is expected to have decelerated slightly to 3.6 percent in 2022, from 4.1 percent in 2021, an upward revision of 0.3 percentage point from the October 2022 Africa’s Pulse forecast. Economic growth continues to be supported by global trade, high commodity prices, and domestic demand. Although still below the longterm average, the upward revision of economic activity for 2022 is supported by improved global economic performance in the fourth quarter of last year, as well as an upward revision in growth across several economies in the region. The improved outlook in late 2022 was attributed to hopeful signs that the global economy may avert a recession—namely, the resilience of the US economy, thanks to recent policy measures (for instance, the Inflation Reduction Act, the Infrastructure Investment and Jobs Act, and the CHIPS and Science Act) and declining inflation; lower than expected gas prices and a benign winter in Europe; and the expectation of a growth recovery in China as the country unwinds its zero-COVID policy, translating into a relaxation of supply chain bottlenecks. Additionally, nearly half of the countries in Sub-Saharan Africa registered an upward revision in their 2022 growth estimates—with upgrades in South Africa (0.2 percentage point), Zambia (0.8 percentage point), Côte d’Ivoire (1 percentage point), Mauritania (1.2 percentage points), the Democratic Republic of Congo (2.4 percentage points), and Ethiopia (2.9 percentage points).
Economic activity in the region, notwithstanding recent improvements, is projected to decelerate to 3.1 percent in 2023, from 3.6 percent in 2022; however, it appears to be bottoming out. The region’s projected growth rate for 2023 has been revised downward by 0.4 percentage point, compared to the October 2022 forecast. Persistent sluggishness of the global economy, declining albeit high inflation rates, and challenging global and domestic financial conditions amid high levels of debt explain the downgrade. These factors can heighten the risks of stagflation, financial strains, and mounting fiscal pressures. More than half the countries in the region recorded a downgrade in their 2023 growth forecasts compared with those from the October 2022 Africa’s Pulse. South Africa is projected to have a significant downgrade in its 2023 growth projection (by 0.8 percentage point) as the energy crisis continues to cripple economic activity. Other significant growth downgrades include Ghana (1.1 percentage points), Malawi (1.6 percentage points),1 and Sudan (1.5 percentage points), among others.
Sub-Saharan Africa’s growth in 2022 was supported by private consumption, although inflation brought down its contribution
Growth in Sub-Saharan Africa in 2022 was primarily supported by higher private consumption and gross fixed investment, and less by government expenditure and net exports (figure 1.1). Rising food and fuel prices in the region and monetary policy tightening to curb inflation may have eroded the purchasing power of African citizens further and, hence, explain the lower contribution of private consumption to growth in 2022 compared to 2021. In addition, the elevated cost of
AFRICA’S PULSE > 9
1 In Malawi, the downgrade could also be attributed to pervasive electricity shortages from the Kapichira hydroelectrical power plant (about one-third of national capacity), which was damaged by cyclones in early 2022 and has remained offline.
financing (both domestic and external) amid a tightening of financial conditions is dragging down the growth of investment.2 Government consumption contracted in 2022 amid the lack of fiscal space and elevated costs of borrowing. The current account deficit declined in 2022 from the previous year as exports picked up and import growth decelerated. From the production perspective, the service sector is the main driver of growth—accounting for nearly three-quarters of the recorded increase in gross domestic product (GDP) in 2022 (figure 1.2). The agriculture and industrial sectors made modest contributions. Extreme weather events (floods in Southern Africa and droughts in the Horn of Africa and the Sahel) kept the agriculture sector subdued. Rising input costs and continued supply chain disruptions reduced the contribution of industrial activities.
The modest economic performance in the region translates into a slower path of poverty reduction and inclusive growth
The projected per capita income growth rate of 0.6 percent for 2023 undercuts the region’s capacity to meet the twin goals of reducing poverty and boosting shared prosperity over the medium term. Poverty reduction remains sluggish. The slow recovery of the per capita income growth rate, projected at 1.2 percent in 2024 and 1.4 percent in 2025, falls short of putting the continent back on the pre-pandemic path of poverty reduction. Sub-Saharan Africa’s economic performance is not uniform across subregions. The real GDP growth of the Western and Central Africa (AFW) subregion is estimated at 3.4 percent for 2023, 0.4 percentage point higher than
AFRICA’S PULSE > 10
2 Section 1.3
describes in more detail the deceleration of investment growth in Sub-Saharan Africa.
Source: World Bank staff projections.
Note: Change in inventories and statistical discrepancy are not displayed. e = estimate; f = forecast; GDP = gross domestic product.
FIGURE 1.1: Contribution to GDP Growth, Demand Side
Higher private con-
-4 -2 0 2 4 6 8 10 2018 2019 2020 2021 2022e 2023f Percentage points Government consumption Private consumption Gross xed investment Net exports Real GDP growth -3 -2 -1 0 1 2 3 4 5 2018 2019 2020 2021 2022e 2023f Percentage points Agriculture Industry Services Net taxes Real GDP growth
FIGURE 1.2: Contribution to GDP Growth, Production Side
sumption and gross fixed investment supported SubSaharan African economic growth in 2022. On the production side, the service sector was the main driver of economic growth in 2022.
that of Eastern and Southern Africa (AFE). The weaker recovery in AFE compared with AFW is partly associated with the weaker growth in investment over the past years—which, in turn, is mainly driven by a sharp deceleration in both private and public investment. In per capita terms, the AFE subregion has been disproportionately affected, with projected per capita income growth of 0.4 percent for 2023, lower than the regional average. The performance is expected to remain subdued in the near term, increasing gradually to 1.4 percent in 2025. This outlook poses challenges to policy makers who seek to accelerate the recovery, reduce poverty, and put the economy on a sustainable growth path. Although the per capita growth of AFW (0.8 percent in 2023) is slightly higher than that of AFE this year and in the coming years, the subregion faces similar challenges.
The low rate of growth in per capita terms is compounded by the low growth elasticity of poverty, resulting in a slower reduction of extreme poverty rates over time. For instance, the poverty headcount ratio in the region declines from a COVID-19 peak of 35.3 percent in 2020 to 34 percent in 2023, and it further declines to 32.7 percent in 2025 (figure 1.3). The poverty headcount ratio is considerably lower in AFW (26.8 percent in 2023) than in AFE (38.8 percent in 2023), although the latter subregion experiences a slightly faster reduction in poverty rates.
Growth across Sub-Saharan African countries is characterized as divergent and multispeed
The recovery of economic activity in Sub-Saharan Africa is multispeed, with wide variation across countries. The region’s moderate growth in 2022 was associated with large countries on the continent registering growth rates that were lower than their long-term average. Broadly, more than half of the countries in the region are growing at rates below their long-term average. Among the 10 largest economies in Sub-Saharan Africa—which represent more than threequarters of the region’s GDP—eight are growing at rates that are below their long-term average growth. Sudan, Nigeria, Angola, and Ethiopia are among the countries with weaker performance compared to their long-term growth rates (see figure 1.4).
AFRICA’S PULSE > 11
Source: World Bank staff estimates and projections. Note: The headcount poverty rate is based on US$2.15 per person per day in 2017 purchasing power parity.
Percent 20 25 30 35 40 45 2015 2016 2017 2018 2019 2020 2021 2022 2023 2024 2025 2026 2027 2028 2029 2030 Sub-Saharan Africa Eastern and Southern Africa Western and Central Africa
FIGURE 1.3: Headcount Poverty Ratio in Sub-Saharan Africa, by Subregion The low rate of growth in per capita terms resulted in a slower reduction of extreme poverty rates over time.
Economic activity in South Africa is being held back by the fallout from the war in Ukraine, extreme weather events, and the energy crisis. On the back of the worst power outages on record, weakness is spreading to sectors beyond manufacturing, in particular, retail trade. In Nigeria, oil production picked up in late 2022, thanks to improved security that has so far prevented further oil theft; however, production remains below the OPEC+ quota. Non-oil economic activity remained weak as the agriculture and industrial sectors experienced a rapid increase in the costs of energy and raw materials that were magnified by a weaker naira in the foreign exchange market. Despite growing at a slower pace than its long-term rate, there are signs of strong economic activity in Angola—with growth accelerating to 3.5 percent in 2022, from 1.1 percent in 2021. Declining inflation, improvement in the fiscal accounts, and a pickup in oil production by late 2022 contributed to this recovery.
There are also countries growing at a faster pace than their long-term rates and showing resilience amid the current polycrisis environment. In Kenya, growth of economic activity remained solid at 5.2 percent in 2022, thanks to strengthened manufacturing, improved investor confidence supported by the credibility of the new administration’s plan to stabilize public finances, and a more general improvement in risk appetite. Amid the multiple global shocks, growth remained resilient in Côte d’Ivoire (6.7 percent in 2022). Private consumption, shielded from inflation through an increase in public wages, and public investment were the main
AFRICA’S PULSE > 12
Source: World Bank staff estimates and projections.
Note: The long-term average growth for each country (as denoted by the thick green lines) is the average gross domestic product growth during 2000–14 (prior to the plunge in commodity prices).
Sudan Central African Republic Eswatini São Tomé and Príncipe Malawi Congo, Rep. Mali Lesotho Burundi South Africa Chad Comoros Burkina Faso Equatorial Guinea Sierra Leone Gabon Ghana Nigeria Zimbabwe Cameroon Angola Namibia Guinea-Bissau Madagascar Zambia Mozambique Senegal Gambia, The Tanzania Guinea Uganda Liberia Togo Mauritania Kenya Benin Ethiopia Botswana Côte d’Ivoire Rwanda Mauritius Congo, Dem. Rep. Seychelles Niger Cabo Verde Percent -2 0 2 4 6 8 10 12 14 16
FIGURE 1.4: Growth across Sub-Saharan African Countries in 2022 Growth across many Sub-Saharan African countries remains below the long-term average.
-4
2022 2023 Long-term average
drivers on the expenditure side. Industry and services were the main engines of growth on the production side (8.1 and 6.8 percent, respectively). In the Democratic Republic of Congo, growth accelerated to 8.6 percent in 2022, from 6.2 percent in 2021. The mining sector—in particular, copper and cobalt—was the main driver of growth due to an expansion in capacity and a recovery in global demand. However, growth outside the mining sector remained modest. On the expenditure side, growth was led by exports and public investment, whereas inflation limited the contribution of private consumption.
Resource-rich countries
The impact of commodity prices on resource-rich countries depends on the net effects on trade. In countries where exports held up and their proceeds increased at a faster pace than the growth of the import bill, there was an expansion in economic activity. The opposite was true in countries with widening current account and fiscal deficits. In oil abundant countries, stable and relatively high oil prices—on average—led to increased external and fiscal revenues, which shifted the current and fiscal accounts into surpluses. This supported economic activity in 2022, which is projected to have grown at 3.1 percent, up from 2.8 percent in 2021. The Republic of Congo and Chad were set to emerge from seven- and two-year recessions in 2022, and are expected to have grown by 1.5 and 2.2 percent, respectively. The upswing in economic activity reflects rising oil prices and stable oil production, compounded by the strong performance of the non-oil sector. Current account and fiscal surpluses widened in the Republic of Congo, while current and fiscal deficits turned into surpluses in Chad during 2022. The expansion of output in Equatorial Guinea in 2022 (2.9 percent) benefited from higher oil prices—with a reduction in the country’s current account deficit and an increase in the fiscal balance. Subsidies to protect consumers from rising food inflation may weigh on public finances.
Mineral and metal resource-rich countries are projected to have grown at 3.3 percent in 2022, down from 5 percent in 2021. The growth projected in October 2022 has been upgraded by 0.7 percentage point as external receipts from high metal prices picked up, while the import bill grew at a slower pace. In Botswana, growth in 2022 slowed to 6.5 percent, from a doubledigit rebound in 2021 (11.8 percent). The performance of Botswana was underpinned by increased diamond and copper production along with high metal prices, the revival of tourism as restrictive measures were lifted, and favorable weather conditions for the agriculture sector. However, the fiscal measures that were adopted to curb inflation may weigh on public finances and hinder growth. Additionally, revenue receipts from the Southern African Customs Union decreased as economic activity decelerated in South Africa. By contrast, growth in Niger is expected to have jumped by 10.1 percentage points to 11.5 percent in 2022 on the back of expansion of the agriculture sector after a severe drought that dragged down growth in 2021. Investment in several infrastructure projects, in particular, the construction of the oil pipeline and the Kandadji Dam, boosted growth on the demand side.
Economic activity in Namibia picked up slightly to 3.5 percent in 2022, from 2.7 percent in 2021. The growth acceleration took place on the back of strong mining—in particular, increased production of diamonds, copper, and uranium. However, growth was restricted by monetary policy tightening to maintain parity with the South African rand and curb rising inflation. After a moderate rebound in 2021, growth in Zambia is expected to remain subdued at 3.9 percent
AFRICA’S PULSE > 13
in 2022. The strong momentum in services supported economic activity, while challenges in mining and agriculture held back growth. The current account continued to record a surplus for a fourth consecutive year, while the fiscal deficit narrowed as the government consolidated in line with the expected debt restructuring program. Analogously, economic activity is projected to have expanded in Liberia (4.8 percent), Guinea (4.7 percent), and Sierra Leone (3.0 percent). Overall, growth in resource-rich countries is expected to have decelerated slightly from 3.7 percent in 2021 to 3.2 percent in 2022.
Non-resource-rich countries
The growth of non-resource-rich countries has been more than proportionally affected by the polycrisis as the deterioration of their terms of trade increased their import bills. The real GDP of non-resource-rich countries is expected to have dropped by 0.6 percentage point, to 4.2 percent in 2022. For this group of countries, inflation in 2022 nearly doubled to 8.3 percent (from 4.3 percent in 2021); the current account deficit widened to 6.1 percent of GDP, and the fiscal deficit deteriorated slightly to 5.6 percent of GDP. These developments heightened pressures that weakened domestic currencies and led policy makers to tighten their monetary policy stance— thus weighing on economic activity. For instance, the average growth forecast among West African Economic and Monetary Union (WAEMU) countries is expected to be 5.6 percent for 2022, down from 6.0 percent in 2021—but 0.7 percentage point higher than the October 2022 Africa’s Pulse forecast.
GDP growth decelerated by more than 1 percentage point from 2021 in Benin (which grew by 6 percent in 2022), Burkina Faso (2.5 percent), Mali (1.8 percent), and Senegal (4.2 percent), while a mild slowdown—less than 0.5 percentage point—is observed in Côte d’Ivoire (6.7 percent) and Togo (4.9 percent). The subregion is characterized by fiscal and current account deficits (twin deficits) attributed to government interventions to contain inflation that has breached the regional target of 3 percent.
Outside the WAEMU, growth in Ghana is expected to have slowed in 2022 to 3.2 percent, down from 5.4 percent in 2021 and far below the country’s average pre-pandemic performance (6.1 percent). The economy has been struggling with high levels of public debt and elevated inflation (52.8 percent in February 2023) fueled by a sharp weakening of the cedi (a cumulative depreciation of 40 percent in 2022 and about 20 percent in 2023 so far). To curb rising inflation, the Bank of Ghana raised its policy rate by a record 1,500 basis points to 29.5 percent in March 2023, from 14.5 percent in December 2021. Real GDP growth in Ethiopia amounted to 6.4 percent in 2022, slightly higher than the 6.3 percent growth registered during the preceding year. The service sector was the most significant contributor to growth, followed by agriculture. While real growth was on the upside, it is still significantly below the pre-COVID-19 growth rate of 9.0 percent registered in 2019. Similarly, economic activity accelerated in Mauritius and Mozambique, by 8.3 and 4.1 percentage points, respectively, in 2022. Growth in Mozambique stemmed from the increase in coal and aluminum output, thanks to high global demand, high prices, and the start of liquefied natural gas exports to Europe. Mauritius benefited from the recovery in tourism assisted by the country’s high rate of COVID-19 vaccination.
AFRICA’S PULSE > 14
High-frequency data point to mixed results in performance across African countries
Incoming activity data from countries in the region show mixed results in the last quarter of 2022 and the start of 2023 amid the prolonged war in Ukraine, still high (and above target) global inflation, and the reopening of the Chinese economy. At the subregional level, AFE countries are experiencing rising inflation above central bank targets. Central banks across the subregion have embarked on a tightening cycle of monetary policy, which in turn holds back economic activity.
In South Africa, headline inflation has been declining slowly, reaching 7.0 percent year-over-year (y/y) in February 2023 (from a peak of 7.8 percent in July 2022), which is still above the upper limit of the South African Reserve Bank’s target range of 3 to 6 percent. The deceleration in inflation is partly attributed to lower costs of transportation. However, food inflation has not peaked yet—as it reached an annual rate of 13.6 percent in February 2023. High-frequency activity data suggest that South Africa experienced a sharper than expected contraction in the fourth quarter of 2022 (1.3 percent quarter-over-quarter (q/q)). The deepening of the energy crisis weighed on economic activity, with the government declaring a “state of disaster.” The sharper contraction was broadbased across economic sectors—in particular, financial services, internal trade, and industry.
Agricultural production fell 3.3 percent q/q, while mining production decreased by 3.2 percent q/q in the last quarter of 2022. More timely data point to further deterioration in economic activity in early 2023. The seasonally adjusted Absa manufacturing Purchasing Managers’ Index (PMI) dropped to 48.8 in February 2023 from a seven-month high of 53 in the previous month—as record loadshedding undermines business activity. Growth prospects appear to be lower than expected, as the Finance Minister estimates that the economy will grow 0.9 percent in 2023—a downgrade from the 1.4 percent announced by the Treasury last October.
In contrast, Angola’s economy appears to have ended 2022 with a strong performance— which continued at the start of 2023. Data released at the start of 2023 show that GDP growth accelerated to 3.9 percent y/y in the third quarter of 2022, from 3.6 percent y/y in the second quarter. Export growth increased further into triple digits in the third quarter of 2022, while import growth decelerated. This led to an eight-year-high annualized trade surplus of US$40 billion in September 2022. Oil output increased for a fourth consecutive month to 1.16 million barrels per day in January 2023, but it remains below the OPEC+ quota. Angola can potentially be one of the biggest beneficiaries of China’s reopening and the associated small upward impact on global oil prices. The positive spillovers from Chinese demand and the good economic news may have contributed to a significant drop in the country’s spreads on sovereign dollar bonds in January. The kwanza has remained relatively stable against the US dollar so far this year, after strengthening last year.
Economic activity in Kenya continues to pick up. Incoming data released on GDP show that the economy performed relatively well over the course of last year. Real GDP growth amounted to 4.7 percent y/y in the third quarter of 2022, not far below the 5.2 percent registered in the second quarter. This performance was driven by increases in industry and services and supported by high private sector credit, improved investor confidence, high international
AFRICA’S PULSE > 15
prices for the country’s commodity exports (tea and coffee), and a recovery in tourism. Investor confidence has continued to be buoyed by the new government’s plans to stabilize public finances, as well as the more general improvement in risk appetite. The whole economy PMI strengthened for a third consecutive month to 52 in January 2023. The Ethiopian economy was held back in 2022 by high inflation, currency depreciation, and the lingering conflict. During the first half of 2022, another failed rainy season weighed on agricultural activity— with significant losses in livestock and crops. However, growth in agriculture picked up in the second half of 2022. The economy registered US$1 billion in export proceeds from agricultural products—in particular, coffee, tea, and spices (which accounted for nearly two-thirds of the revenues generated), as well as flowers and other horticultural products. In November 2022, the government and the Tigray People’s Liberation Front agreed to stop fighting and signed a truce laying out the roadmap for implementation of a peace deal.
In Uganda, the growth recovery remained resilient during the first three quarters of 2022, thanks to the strong performance of the industrial and service sectors. Bad weather continued to hold back agriculture. Investment recovered slightly, thanks to strong credit and employment growth, reflecting virtuous firm dynamics. Rising interest rates in response to contractionary monetary policy in late 2022 and the start of 2023 weighed on investment. Economic activity in Rwanda remained resilient in 2022, propelled by the revival of the tourism sector. Tourism in 2022 reached 68 percent of its pre-pandemic level and generated 3.4 percent of GDP in foreign exchange. In late 2022, the first shipment of liquified natural gas from Mozambique reached Europe. Hence, the country’s incipient position places it as an alternative market for Europe’s gas supplies. Finally, economic activity in Zambia decelerated in 2022 due to contractions in agriculture, mining, and construction. The poor performance of mining was attributed to a contraction in copper output due to lower ore grades and sluggish turnaround of mining operations.
In AFW, incoming data point to further moderation of growth at the start of the year as challenges arising from mounting fiscal pressures amid lack of fiscal space and unsustainable debt positions, as well as stubbornly high inflation, affect the largest countries in the subregion. In Nigeria, recently released activity data show mixed results. On the one hand, real GDP growth was higher than expected in the fourth quarter of 2022. It picked up to 3.5 percent y/y, from 2.3 percent in the third quarter. Both oil and non-oil sector activity improved by late 2022. After a 22.7 percent y/y contraction in the third quarter of 2022, oil GDP fell by 13.4 percent y/y in the fourth quarter as security services were making headway against oil theft. In January 2023, oil production increased to a 10-month high of 1.34 million barrels per day; however, output was still below the country’s OPEC+ quota. Growth in non-oil activity increased slightly to 4.4 percent y/y in the fourth quarter of 2022, from 4.3 percent in the third quarter. Faster growth in agriculture and a recovery in manufacturing appear to have driven this increase. However, the demonetization efforts that started in mid-December are weighing on economic activity. The Stanbic IBTC Bank PMI contracted to 44.7 in February 2023, from 53.5 in January 2022, as business output and new orders were sharply affected by cash shortages. Recent credit rating downgrades on account of the worsening fiscal accounts added to the poor economic outlook.
AFRICA’S PULSE > 16
In Ghana, more timely data highlight the weakness of economic activity amid the deleterious global shocks and heightened macroeconomic instability. GDP growth slowed to 0.7 percent q/q in the third quarter of 2022, the weakest outcome since the height of the pandemic. Rising inflation and high interest rates held back private consumption and investment, while government consumption has declined on the back of high debt service and restricted access to international capital markets. Business and consumer confidence slumped in late 2022; however, the PMI is gradually picking up and signaling an expansion in economic activity (50.2 in February 2023). On the external front, export growth has held up, while import growth has dwindled. Debt overhang also weighs on economic activity. Government officials are seeking to restructure the country’s external debt through the Common Framework. The cedi has weakened and the sovereign spreads have remained high since the default. In Côte d’Ivoire, the latest data suggest that the economy slowed in the fourth quarter of 2022. Industrial production contracted by 1.7 percent y/y in November due to weakness in both the mining and manufacturing sectors. The trade balance swung into a deficit by end-2022 as import growth remained strong while export growth fell back. Finally, inflation softened further, from 5.7 percent y/y in November to 4.8 percent y/y in January, on the back of easing food price pressures.
AFRICA’S PULSE > 17
The resilience of the US economy and Europe as well as the reopening of the Chinese economy contributed to stabilizing global growth in the last quarter of 2022.
1.2 THE GLOBAL ENVIRONMENT
Global activity is not expected to regain its pre-pandemic trend in the foreseeable future, with EMDEs accounting for most of the shortfall.
Sources: Consensus Economics; World Bank.
Note: The last observation is February 15, 2023.
Global growth is forecast to slow this year and recover only weakly in 2024, primarily reflecting the combination of high inflation and associated aggressive monetary policy tightening. This is despite the fact that major economies showed more resilience than expected around the turn of the year, resulting in upward revisions to forecasts for global growth in 2023 (figure 1.5). Global trade is expected to slow sharply alongside global growth, despite support from a continued recovery in services trade, particularly tourism. Continued economic weakness means that global activity is not expected to regain its prepandemic trend in the foreseeable future, with emerging markets and developing economies (EMDEs) accounting for most of the shortfall (figure 1.6). The negative shocks of the past three years— namely, the pandemic, the invasion of Ukraine, and the rapid increase in inflation and associated tightening of monetary policy worldwide—are having a lasting impact on economic prospects.
Source: World Bank.
Note: Aggregate growth rates are calculated using real US dollar gross domestic product weights at average 2010–19 prices and market exchange rates. Data for 2023 and onward are forecasts. The figure shows the deviation between current forecasts and the January 2020 Global Economic Prospects. The January 2020 baseline is extended to 2023 and 2024 using projected growth for 2022. EMDEs = emerging markets and developing economies.
Inflationary pressures started to abate toward the end of 2022 as demand slowed and commodity prices eased, but inflation nonetheless remains high worldwide and well above central bank targets in almost all inflation-targeting economies. Although headline inflation is likely to moderate gradually over the course of the year, there are signs that underlying inflationary pressures could become more persistent. Core inflation—a better gauge of inflationary pressures—remains stubbornly above target in many economies, including the
AFRICA’S PULSE > 18
FIGURE 1.5: Consensus Global Growth
FIGURE 1.6: Output Deviation from Pre-Pandemic Trends
Feb 22 Mar 22 Apr 22 May 22 Jun 22 Jul 22 Aug 22 Sep 22 Oct 22 Nov 22 Dec 22 Jan 23 Feb 23 Mar 23 Percent 0 1.0 0.5 2.0 3.0 1.5 2.5 3.5 Percent -8 -6 -4 -2 0 2019 2020 2021 2022 2023f 2024f Advanced economies EMDEs EMDEs
China
excl.
United States (5.5 percent y/y in February 2023, from a peak of 6.6 percent in September 2022) and the euro area (5.6 percent y/y in February 2023). In response, central banks around the world have been tightening policy at an unusually rapid pace (figure 1.7).
FIGURE 1.7: G7 Policy Rates
In response to high global inflation, central banks around the world have been tightening policy at an unusually rapid pace.
Sources: BIS (database); Bloomberg; Haver Analytics; World Bank World Development Indicators (database); World Bank.
Note: The short-term policy rate is weighted by nominal gross domestic product in current US dollars. “t” is the month before the US policy rate increases. The cycle ends when the G7-weighted policy rate peaks. Judgement was used to define “double-peak” cycles. The March 2022 cycle was extended using market-implied interest rate expectations from March 2023 onward, observed on February 21, 2023. G7 = Canada, France, Germany, Italy, Japan, the United Kingdom, and the United States.
FIGURE 1.8: EMBI Sovereign Spread Changes Since the Beginning of 2022, by Credit Rating
Many EMDEs have faced widespread capital outflows, a severe slowdown in bond issuance, and rising sovereign borrowing spreads that resulted in a severe deterioration of financial conditions.
Sources: JP Morgan; Moody’s; World Bank.
Note: EMBI change in spreads from January 2022 is based on Moody’s sovereign rating in foreign currency. The sample includes 11 energy exporters and 35 energy importers. The sample excludes the Russian Federation, Belarus, the República Bolivariana de Venezuela, Lebanon, Ukraine, and Zambia. The last observation is February 10, 2023. EMBI = Emerging Market Bond Index.
Although this tightening has been necessary for price stability, it has contributed to a significant worsening of global financial conditions since approximately the beginning of last year. Longterm government bond yields in the United States and Germany increased at their fastest pace in nearly three decades in 2022 and remain high this year. Asset prices experienced a broad, synchronous decline; investment growth has weakened substantially; and housing markets in many countries are worsening rapidly. The recent failure of two regional banks in the United States was met by rapid action by authorities to stem financial contagion, but has nonetheless increased investor concerns about vulnerabilities in the global financial system, and is likely to tighten credit conditions. Many EMDEs have faced widespread capital outflows, a severe slowdown in bond issuance, and rising sovereign borrowing spreads, with countries with lower credit ratings facing a much more severe deterioration in financial conditions (figure 1.8).
AFRICA’S PULSE > 19
Basis points 0 250 500 750 t t+7 t+14 t+21 t+28 Mar-2022 Dec-1972 May-1979 Jun-1999 Jun-2004 Dec-2015 Percentage points -2 0 2 4 6 8 10 12 Strong credit Weak credit
In the United States, rising food and energy prices, together with a tight labor market, pushed inflation to multi-decade highs in 2022, before price pressures began easing toward the end of the year. This has prompted the most rapid monetary policy tightening in more than 40 years, with substantial fiscal consolidation adding to monetary headwinds. Activity was more robust than expected at the end of 2022, but domestic demand remains weak despite a strong labor market, and activity is expected to slow significantly this year. Activity in the euro area has also been somewhat stronger than expected thanks to a warm winter, but is nonetheless expected to only narrowly escape recession as a result of continuing monetary tightening and the lagged effects of high energy prices.
Economic activity in China deteriorated markedly in 2022. COVID-19-related restrictions, unprecedented droughts, and ongoing property sector stress restrained consumption, industrial production, and residential investment, with a partial offset from various fiscal and credit support measures. Following the relaxation of lockdown measures, COVID-19 cases peaked in late December and declined through January, according to the China Center for Disease Control and Prevention. Incoming data point to a rapid domestic recovery as the COVID-19 wave fades. Elsewhere, activity remains robust in India, in many countries in East Asia, and among many commodity exporters, but other EMDEs face headwinds from a combination of slow global growth and domestic challenges.
The combination of slowing growth, persistently high inflation, and tightening financial conditions amid high levels of debt increases the risks of stagflation, financial strains, continued fiscal pressures, and weak investment in many countries. Fiscal space has narrowed considerably, and concerns about debt sustainability in many countries have risen as global financial conditions have made it more difficult to service debt loads that have accumulated rapidly in recent years, particularly during the pandemic. More persistent inflation could result in significantly more monetary tightening, which could prompt investors to reassess the sustainability of large and rising debt burdens in many countries, and the health of bank balance sheets. Signs of weakness in an important sovereign or financial institution could trigger contagion effects and financial stress, which would include a broad-based flight to safety and substantial capital outflows from many EMDEs.
In addition to the risks around monetary tightening and global financial conditions, a number of other developments could worsen the trajectory of the global economy. First, activity in China could be weaker than expected as a result of stress in the real estate sector. Second, geopolitical tensions, which rose markedly after the Russian Federation’s invasion of Ukraine, could increase further and encompass a larger set of countries. In addition to their humanitarian implications, escalating tensions could hasten the trend toward unproductive reshoring of supply chains, put the financial system under strain, and disrupt the supply of commodities. Finally, the risks associated with climate change are growing as changing weather patterns contribute to increasingly disruptive events, such as heat waves and floods. In the near term, climate-related disasters can substantially weigh on activity; in the longer term, climate change can render some populated areas uninhabitable, reduce productivity, and worsen global poverty.
AFRICA’S PULSE > 20
Commodity market developments
Commodity prices have eased in recent months, to varying degrees, as global growth has slowed. By historical standards, however, they remain elevated, prolonging the challenges associated with energy and food insecurity (figure 1.9). Energy prices have been trending down, with natural gas prices in particular plunging over the winter due to warmer than expected weather. The price of Brent crude oil averaged US$83 per barrel in the first quarter of 2023, down considerably from its peak in the aftermath of Russia’s invasion of Ukraine, but also well above its pre-pandemic average.3 Oil prices remain volatile as markets weigh the outlook for global demand and the imposition of a price cap on Russian oil products. After doubling between the second and third quarters of 2022, natural gas prices dropped sharply. In the first quarter of this year, they were about 44 percent below their levels in the first quarter of 2022. Warm weather, weak industrial demand, conservation measures, and time to import liquified natural gas have enabled Europe’s gas storage to be at its highest level in years and contributed to the sharp decline in natural gas prices. Natural gas prices in the United States declined by about 39 percent y/y in the first quarter of 2023 as warmer weather reduced demand and natural gas production in the first 10 months of 2022 reached record levels.
Agricultural prices continued their decline in much of 2022 from their peaks in February to April as the Russia-Ukraine war broke out (figure 1.9). In recent months, these prices have remained broadly stable and are expected to stay above pre-pandemic levels. The United Nations brokered Black Sea Grain Initiative, along with better harvests in other major wheat and maize producing countries, has helped food and fertilizers reach global markets—which contributed to stabilizing grain prices in the second half of the year. The initiative has been renewed in mid-March for a shorter period; however, uncertainty about its future and the war itself will raise price volatility—particularly in commodities which the region is a major global supplier, such as wheat, maize, and fertilizers. The initiative is set to expire in March 2023, and failure of renewal will likely lead to higher prices, especially for wheat, maize, and fertilizers. Despite the declining global prices of agricultural commodities, grain prices in local markets in many developing countries are still among the highest historically due to the slow price transmission from global to local prices and the
AFRICA’S PULSE > 21
3
The average of the first quarter of 2023 corresponds to the average price of Brent crude oil (US$ per barrel) for the months of January and February. March data were not available at the time of publication.
60 80 100 120 140 160 180 200 0 50 100 150 200 250 300 350 1/1/2019 1/1/2020 1/1/2021 1/1/2022 2/1/2023 Energy price index Fertilizer price index Agriculture price index (RHS) Metals & minerals (RHS) Sources: World Bank; Bloomberg; Haver Analytics.
FIGURE 1.9: World Bank Price Indexes for Emerging Economies (2019 = 100) Although commodity prices have eased in recent months, they remain elevated, prolonging challenges associated with energy and food insecurity, while agricultural prices continued to decline.
stronger US dollar over the past few months—affecting food security in many developing economies. After reaching their highest level since 2007/08 following the onset of the RussiaUkraine war in February 2022, fertilizer prices have declined steadily since May 2022. However, the cost of fertilizers is still higher than in the pre-Russia-Ukraine war or pre-COVID-19 years.
The prices of coffee and tea declined throughout the year (figure 1.10). The price of Arabica coffee declined by about 19 percent y/y in the first quarter of 2023, while the average price of tea in the Mombasa auctions declined by about 13 percent y/y. The major downward pressure on coffee prices started in October 2022, following steady rains in Brazil that projected an increase in the production of Arabica coffee by 16 percent in the 2022–23 agricultural season, compared to that of 2021–22. The declines in coffee and tea prices will affect the export revenues of several African countries that rely on export revenues from these commodities. Cocoa prices declined for much of 2022; however, they have picked up since the fourth quarter of 2022.
Metal and mineral prices, in contrast, have increased in recent months, reflecting improved prospects for the Chinese economy after its reopening. They were up nearly 11 percent in the first quarter of 2023 from the last quarter of 2022 but remained below their March 2022 peak. China’s reopening following its zero-COVID policy reversal and measures to stimulate its property sector has raised optimism about the demand for industrial commodities. For instance, copper prices declined in the first half of 2022 but increased steadily in the second half of the year. While the prices for iron ore, aluminum, lead, nickel, tin, and zinc declined during most of the first three quarters of 2022, they reversed the trend and have increased gradually, starting in the fourth quarter of 2022. The price increases in these industrial metals are expected to gain momentum in 2023 as China’s reopening strengthens and the interest rate hikes of central banks all over the world move closer to their peaks. Similarly, gold prices began an upward trend in October 2022, after declining in the first three quarters of last year, and prices continued to rise in the first quarter of 2023. Other precious metals, such as platinum and silver, followed a trend similar to that of gold prices. Finally, risks to the commodity price outlook may arise from adverse weather patterns, policy decisions (particularly, the Black Sea agreement), and higher energy costs.
AFRICA’S PULSE > 22
kg =
Sources: International Coffee Organization; International Cocoa Organization; International Tea Committee.
Note:
kilogram.
FIGURE 1.10: Average Monthly Prices of Coffee, Cocoa, and Tea
2019M01 2019M04 2019M07 2019M10 2020M01 2020M04 2020M07 2020M10 2021M01 2021M04 2021M07 2021M10 2022M01 2022M04 2022M07 2022M10 2023M01
The prices of coffee and tea declined throughout the year.
US$/kg 0.5 1.0 1.5 2.0 2.5 3.0 2 3 4 5 6
Co ee, Arabica Cocoa (RHS) Co ee, Robusta (RHS) Tea, Mombasa (RHS)
1.3 THE DOMESTIC ENVIRONMENT
A slowdown of investment growth is holding back growth in the region 4
Sub-Saharan Africa faces a myriad of challenges to regain growth momentum. Among these challenges is the slowdown of investment growth, which had decelerated sharply over the decade prior to the pandemic. Investment growth in Sub-Saharan Africa slowed from nearly 6.8 percent in 2010–13 to 1.6 percent in 2020–21, well below the long-term average over 2000–19 of about 6.1 percent (figure 1.11).5 The deceleration of investment growth in the region has pulled down the investment share in GDP by nearly 3 percentage points of GDP.
The deceleration has been broad-based, as the share of countries in the region with declining investment growth went from nearly 25 percent in 2010 to a peak of 68 percent in 2020. This deceleration is sharper in AFE where the growth of investment decelerated from 5.6 percent in 2010–13 to an average contraction of 0.1 percent in 2020–21—thus leading to a decline in the investment-to-GDP ratio of more than 4 percentage points over the period. The sluggishness in investment growth is less marked for AFW countries, with the growth rate declining from an annual average of 6.9 percent in 2010–13 to 3 percent in 2020–21—which implies a drop in the subregion’s average investment ratio of 1.8 percentage points of GDP (figure 1.11).
Investment growth deceleration is also observed across various groups of countries in Sub-Saharan Africa, depending on their extent of resource abundance and fragility. Oil abundant countries exhibit the largest and most persistent downswing in investment relative to the other groups. After exhibiting annual average growth of nearly 8 percent in 2010–13, oil abundant countries on average have experienced a contraction in investment since the 2014–15 plunge in international oil prices (figure 1.12). The downturn in investment is also sharp among metal abundant countries in the region, although coming from a higher growth rate at the beginning of the 2010s. Non-resource abundant countries showed the slowest deceleration of investment growth—as their annual average rate declined from 6.3 percent in 2010–13 to 2.2 percent in 2020–21 (which is still well below their long-term average
Note:
AFRICA’S PULSE > 23
4 The discussion on the slowdown of investment growth in Africa follows the analysis in World Bank (2023).
5 Investment is proxied by gross fixed capital formation in local currency at constant prices. It is defined in an analogous fashion as in World Bank (2023).
Source: World Bank World Development Indicators.
Investment growth is computed as the growth rate of gross fixed capital formation (expressed in local currency at constant prices). The definition is in line with World Bank (2023). The black dashed lines represent the average long-term growth of investment for each corresponding group, as measured by the group’s average over 2000–19.
-1 0 1 2 3 4 5 6 7 8 9 10 2010-13 2014-15 2016-19 2020-21 2010-13 2014-15 2016-19 2020-21 2010-13 2014-15 2016-19 2020-21 Sub-Saharan
Average 2000-19 Percent
FIGURE 1.11: Investment Growth Relative to Average Long-Term Growth in Sub-Saharan Africa, by Subregion, 2010–21 Investment growth in Sub-Saharan Africa has slowed sharply.
Africa Eastern and Southern Africa Western and Central Africa
In oil abundant countries, annual average growth was nearly 8 percent in 2010–13, but it has contracted since 2014–15 due to the plunge in international oil prices.
FIGURE 1.12: Investment Growth Relative to Average Long-Term Growth in Sub-Saharan Africa, by Resource Abundance and Fragility, 2010–21
growth of 6.1 percent). Investment growth stayed below the long-term average across fragile countries in the aftermath of the plunge in commodity prices.
The sharp deceleration of investment growth was broadbased across public, private, and foreign investment.
SSA non-resource abundant SSA resource abundant, oil
resource abundant, minerals
Note:
by the group’s average over 2000–19. Resource abundant countries are defined as those with natural rents (excluding forests) that exceed 10 percent of gross domestic product over the past five years. Fragile countries are those appearing in the World Bank’s list of fragile and conflict-affected situations over the past five years. SSA = Sub-Saharan Africa.
FIGURE 1.13: Investment Growth Relative to Average Long-Term Growth in Sub-Saharan
of Investment
(Public, Private, and Foreign), 2010–21
Sources: World Bank World Development Indicators; UNCTAD World Investment Report.
Note: Investment growth is computed as the growth rate of gross fixed capital formation (expressed in local currency at constant prices). The definition is in line with World Bank (2023). The black dashed lines represent the average long-term growth of investment for each corresponding group, as measured by the group’s average over 2000–19. FDI = foreign direct investment inflows.
The sharp drop in investment growth in the region is also evident across public, private, and foreign investment (figure 1.13). An important observation that emerges is that the growth of investment, regardless of the type of agent that undertakes it (public, private, or foreign), lies below the long-term average (2000–19) in most of the years under analysis. The decline in private investment growth was relatively larger (from 5.9 percent in 2014–15 to 3.1 percent in 2020–21) compared to that of public investment growth (from 3.3 percent in 2014–15 to 1.6 percent in 2020–21), and the growth of the former has been more volatile throughout the period. In contrast, foreign direct investment (FDI) has contracted on average since the onset of the 2014–15 plunge in commodity prices. It shifted from annual average growth of 1.9 percent in 2014–15 to a contraction of 3.7 percent in 2016–19, and an even larger downswing (5.1 percent per
AFRICA’S PULSE > 24
Source: World Bank World Development Indicators.
Investment growth is computed as the growth rate of gross fixed capital formation (expressed in local currency at constant prices). The definition is in line with World Bank (2023). The black dashed lines represent the average long-term growth of investment for each corresponding group, as measured
Africa, by Type
-6 -4 -2 0 2 4 6 8 10 12 2010-13 2014-15 2016-19 2020-21 2010-13 2014-15 2016-19 2020-21 2010-13 2014-15 2016-19 2020-21 2010-13 2014-15 2016-19 2020-21
SSA fragile Average 2000-19 Percent -6 -4 -2 0 2 4 6 8 2010-13 2014-15 2016-19 2020-21 2010-13 2014-15 2016-19 2020-21 2010-13 2014-15 2016-19 2020-21 Private sector Public sector FDI Average 2000-19 Percent
SSA
6
year) after the onset of COVID-19 (2020–21). The contraction of FDI since 2016 can be attributed to declining and volatile international prices of extractives as well as insufficient investment in new or mature exploration and production oil fields.
The regional trend masks differences across the AFE and AFW subregions. Annual average growth of public and private investment in AFE is below the long-term trend since 2010. While private sector investment has contracted since 2014–15, public investment growth was still positive although modest (0.4 percent in 2020–21). After fast growth in 2010–13 (8.1 percent per year), FDI contracted at an annual rate of 4.3 percent per year during the COVID-19 period. Unlike AFE, private and public investment growth in AFW remained positive throughout 2010–21. Additionally, public investment provided some support to economic activity in AFW by growing at a slightly faster pace than the long-term average in 2016–19 and 2020–21. In AFW, foreign investment increased at a higher rate than the long-term average in 2016–19; however, it contracted by 1.94 percent per year during the COVID-19 period.
FIGURE 1.14: Growth of Remittance Inflows Relative to Average Long-Term Growth in Sub-Saharan Africa, by Subregion, 2010–21
The evolution of remittance inflows over time differed considerably across the subregions.
Sources: World Bank World Development Indicators; World Bank Migration and Remittances data.
Note: Remittance growth is computed as the growth rate of remittance inflows (expressed in US dollars at constant prices). The black dashed lines represent the average long-term growth of remittances for each corresponding group, as measured by the group’s average over 2000–19.
Remittances, another source of financing, remained relatively resilient to the various shocks that took place throughout 2010–21—including the COVID-19 pandemic.6 Growth of remittance inflows for the region as a whole remained above the long-term average from 2010 to 2015 (with an average annual growth of remittances above 6 percent), and then decelerated to positive growth of 3.5 percent per year during the COVID-19 period (2020–21). However, the evolution of remittance inflows over time differed considerably across the subregions (figure 1.14). Remittance inflows to AFE countries have grown near or above the long-term growth average since 2016, and especially during the COVID-19 period (6.6 percent per year in 2020–21). In contrast, in AFW countries, remittances grew near or above trend during 2010–15 and decelerated after the plunge in commodity prices—reaching a growth rate of 1 percent per year in 2020–21.7 The resilience of remittances in the COVID-19 period among countries in the region (and, particularly, AFE countries) can be partly attributed to the surge in remittance growth among resource abundant countries (both oil and minerals and metals).
individuals). Compensation of employees refers to the income of border, seasonal, and other short-term workers who are employed in an economy where they are not resident and of residents employed by nonresident entities.
7 The contrasting trends in the evolution of remittance inflow growth across AFE and AFW might be attributed to the fact that the former has a relatively smaller reliance on inflows from advanced economies (50 versus 63 percent) and relatively higher intraregional inflows (World Bank 2021).
AFRICA’S PULSE > 25
Remittances refers to personal remittances, as defined by the sum of personal transfers and compensation of employees. Personal transfers consist of current in cash or in kind transfers made or received by resident households to or from nonresident households (including resident and nonresident
Average 2000-19 0 2 4 6 8 10 12 2010-13 2014-15 2016-19 2020-21 2010-13 2014-15 2016-19 2020-21 2010-13 2014-15 2016-19 2020-21
Percent
Sub-Saharan Africa Eastern and Southern Africa Western and Central Africa
However, remittances grew at rates below trend among fragile countries and contracted among non-resource abundant countries during the COVID-19 period. Amid the economic fallout of the COVID-19 pandemic and the war in Ukraine, investment growth is expected to remain modest and below the average growth rate of the past two decades. This trend is not specific to the region but widespread across EMDEs.8 Empirical analysis suggests that the deceleration of investment growth could be associated with downswings in economic activity, terms-of-trade deterioration, weak real credit growth, and stalled investment in climate reforms.9
Slower growth of investment in the region is holding back long-term growth of potential output and per capita income, as well as progress on meeting the Sustainable Development Goals. Amid substantial financing needs, limited fiscal space, and rising borrowing costs, policy makers in the region will be required to improve the efficiency of spending. Scaling up investment will require additional financing from the private sector and the international community, accelerating reforms to improve the institutions that support private sector growth, developing local capital markets, improving the quantity and quality of public infrastructure, enhancing the efficiency of utilities, and strengthening domestic resource mobilization.
Inflation remains persistently high, fueled by food prices and weaker currencies
Inflation in Sub-Saharan Africa accelerated in 2022 to 9.2 percent, from 4.5 percent in 2021 (figure 1.15). The slowdown in global demand, declining commodity prices, and the effects of the monetary policy tightening across the continent are expected to reduce inflation to 7.9 percent in 2023, and further to 5 percent in 2024 and 2025. Headline inflation is still above the ceiling of the central bank target bands for all countries with an explicit nominal anchor. Consumer prices rose at a faster pace in 2022 amid supply chain disruptions, pent-up demand associated with pandemic restrictions being lifted, and the war in Ukraine. The number of countries with a two-digit average annual rate of inflation for the year increased from 9 in 2021 to 21 in 2022—that is, about 45 percent of the countries in the region recorded twodigit inflation rates last year. This number is expected to decline to 12 countries in 2023 and drop even further to 6 in 2025.
Rising food and fuel prices as well as the depreciation of the exchange rate were
AFRICA’S PULSE > 26
8 World Bank (2017, 2023). 9 World Bank (2023).
Source: World Bank staff projections.
Note: Inflation is measured by percentage changes in the Consumer Price Index using the World Bank Macro-Fiscal Model database. e = estimate; f = forecast; SSA = Sub-Saharan Africa.
FIGURE 1.15: Median Inflation in Sub-Saharan Africa, 2018–2025f Inflation in Sub-Saharan Africa accelerated from 4.6 percent in 2021 to 9.2 percent in 2022.
Oil exporting countries in SSA
Sub-Saharan Africa 2 3 4 5 6 7 8 9 10 2018 2019 2020 2021 2022e 2023f 2024f 2025f Percent
Mineral and metal exporters in SSA Non-resource-rich countries in SSA
the main drivers of inflationary pressures in the region—and, particularly, in countries like Ghana, Sudan, and Malawi (figures 1.16 and 1.17).10 The Ghanaian cedi, the worst performing currency in the region during 2022, posted a depreciation of about 40 percent. It has weakened an additional 20 percent so far in 2023. Other currencies with significant losses last year include those of Sudan (23.6 percent), Malawi (20.7 percent),11 The Gambia (14.6 percent), and Nigeria (10.2 percent).12
Furthermore, rising food and energy prices continued to fuel headline inflation. An inspection
Rising food and fuel prices as well as the depreciation of the exchange rate are the main drivers of inflationary pressures across countries in the region.
Sources: Haver Analytics; Bloomberg.
Note: Figure 1.16 depicts the year-over-year headline inflation (bars) and food inflation (dots) in January 2023. Zimbabwe has rates of headline and food inflation that exceed 100 percent. CPI = Consumer Price Index. Figure 1.17 presents the cumulative variation in the exchange rates of selected Sub-Saharan African and world currencies from December 31, 2021, to February 23, 2023. A negative (positive) cumulative variation represents a depreciation (appreciation).
10 For some countries in the region, inflation is also fueled by the prevalence of fiscal dominance and foreign exchange distortions that have given rise to widening premia in parallel markets (for instance, Ethiopia, Zimbabwe).
11 The Reserve Bank of Malawi adjusted downward the official kwacha-US dollar exchange rate by 25 percent on May 26, 2022. Furthermore, the kwacha depreciated further during the same period in foreign exchange rate bureaus—thus widening the spread with the official exchange rate.
12 Note that these depreciations are calculated from December 31, 2021 to December 31, 2022, and the exchange rate is expressed in US dollars per unit of local currency. Hence, a decline implies a depreciation.
AFRICA’S PULSE > 27
FIGURE 1.16: Headline and Food Inflation across Sub-Saharan African Countries, January 2023 (%, year-over-year)
FIGURE 1.17: Cumulative Variation in Exchange Rates in Selected Countries (%, year-over-year)
Percent -60 -50 -40 -30 -20 -10 0 10 20 Ghana Egypt, Arab Rep. Sri Lanka Pakistan Türkiye Sudan Ukraine Malawi Zambia Eswatini South Africa Gambia, The United Kingdom Kenya Botswana Nigeria India Madagascar Ethiopia China Indonesia CFA franc Malaysia Rwanda Uganda Vietnam Thailand Congo, Dem. Rep. Tanzania Mozambique Somalia Peru Brazil Angola Mexico Percent -10 10 30 50 70 90 Benin Niger Seychelles Congo, Rep. Côte d'Ivoire Tanzania Equatorial Guinea Gabon Eswatini Namibia South Africa Cameroon Togo Mali Lesotho Burkina Faso Chad Kenya Botswana Zambia Guinea-Bissau Mozambique Mauritania Uganda Senegal Madagascar Mauritius Angola Gambia, The Cabo Verde Nigeria Malawi Burundi Rwanda Ethiopia Sierra Leone Ghana Sudan Zimbabwe ++ CPI Food
of monthly information available for 39 Sub-Saharan African countries by January 2023 shows that year-over-year food inflation remains high. About 75 percent of the countries in the region registered double-digit year-over-year inflation rates at the end of 2022, with the fastest increases experienced in Zimbabwe, Sudan, Ghana, Rwanda, Sierra Leone, Burundi, Malawi, and Ethiopia (figure 1.16). Domestic food inflation in Africa has remained sticky in some African countries while it has decelerated in others—although at a much slower pace than the disinflation of food prices in global markets. This might be attributed to currency depreciation—as countries in the region import most of their food staples— as well as high input costs (high oil and natural gas prices affecting transportation and refrigeration, and nitrogenous fertilizers) and extreme weather events (for instance, droughts in the Horn of Africa). Bringing down inflation and anchoring inflation expectations should continue to be a priority for policy makers, to prevent further deterioration of people’s incomes and food security and avert social unrest and conflict.
The rate of inflation is expected to have peaked for most countries in the region. Average annual inflation forecasts project that about 70 percent of the countries in the region are expected to have a lower inflation rate in 2023 compared with that in 2022. The median inflation for the group of countries where inflation is expected to have peaked last year drops to 7 percent in 2023 (from nearly 10 percent in 2022).13 However, despite the declining inflation rates across many countries in the region, the rates of consumer price growth are still high, above target, and above pre-pandemic levels.14 In contrast, the rate of inflation in three countries in the region is expected to accelerate by more than 3 percentage points in 2023 from last year, namely, Ghana, Uganda, and Burundi.
Cross-country differences in the evolution of external and fiscal balances as well as debt dynamics are also present in countries’ inflation rates. Inflation is expected to remain contained in resource-rich countries—and, particularly, oil-rich countries where the impact of food and fuel inflation as well as the currency has been limited through a series of monetary and fiscal measures. The median rate of inflation in oil exporting countries in the region is expected to decline to 5.2 percent in 2023 and edge down to 4 and 3 percent in 2024 and 2025, respectively (figure 1.15). In non-resource-rich countries, inflation was elevated in 2022 (8.3 percent) and is set to decline slowly to 6.5 percent in 2023, and stabilize at 5 percent in 2025.
Central bank policies need to anchor still high inflationary expectations
As inflation reached historical records in 2022, monetary policy makers in the region reacted rapidly and aggressively by hiking policy rates to levels not seen in many years. Since January 2022, central banks have hiked their key benchmark rates by a cumulative of 350 basis points in Lesotho, and Uganda; 400 basis points in South Africa and Mozambique; 650 basis points in Nigeria; and 1,500 basis points in Ghana (figure 1.18). Notwithstanding these early and sizable interest rate hikes over the past two years, inflation remains above target in many Sub-Saharan
AFRICA’S PULSE > 28
13 High-frequency information confirms a deceleration of inflation across some countries in the region since the last quarter of 2022, albeit at different speeds across countries. In nearly 75 percent of the countries in the region, year-over-year inflation in December 2022 was lower than the maximum registered that year.
14 By December 2022, nearly half of Sub-Saharan African countries with monthly data available (18 of 39) registered two-digit inflation.
African economies— thus, suggesting a limited monetary policy transmission. Reduced effectiveness of monetary policy can be attributed, among other factors, to the importance of persistent supply shocks driving inflation (say, commodity prices and climatic shocks), perceived lack of central bank autonomy, foreign exchange distortions that widened parallel exchange rate market premia, and fiscal dominance. There is evidence of rising fiscal dominance in some Sub-Saharan African countries, as central banks’ net claims on the central government have increased since the start of the pandemic, and remain high for some countries.15 This links fiscal developments to inflation expectations.
FIGURE 1.18: Policy Rates and Cumulative Variation Since January 2022
Central banks implemented early and sizable interest rate increases to curb inflation.
Botswana WAEMU Mauritius CEMAC Tanzania Namibia Rwanda South Africa Lesotho Kenya Zambia Uganda Mozambique Nigeria Angola Ghana
Rate increase Rate (Feb. 2023)
Sources: Haver Analytics; International Monetary Fund International Financial Statistics. Note: The bars depict cumulative variation in the interest rate (in percentage points) from January 2022 to February 2023. The diamonds signal the monetary policy rate at the end of January 2023. CEMAC = Economic and Monetary Community of Central Africa; WAEMU = West African Economic and Monetary Union.
Despite these limits, some monetary policy committees have started to slow down the pace of the tightening cycle (South Africa) or put it on pause (Kenya, Mozambique, and Uganda) as inflation rates started to peak in late 2022.16 Newly released data on inflation in the United States and some European countries signal that underlying inflationary pressures are still strong and inflation may not decline steadily, thus prompting fears of more interest rate hikes. The fight against inflation is far from over in Sub-Saharan Africa: inflationary pressures remain stubbornly high and above target. Curbing inflation remains essential to boost people’s incomes and reduce uncertainty about consumption and investment plans.17
Governments have additionally resorted to fiscal instruments to limit the impact of increased inflation, especially on households—such as subsidies, tariff waivers, and income support, among others. This could mount fiscal pressures in countries with depleted fiscal space. Coordination of monetary and fiscal policy to anchor inflationary expectations is essential. Box 1.1 depicts the trade-offs in monetary and fiscal policy to curb inflation across Sub-Saharan African countries.
16
17
index—the preferred inflation measure of the US Federal Reserve—still has not peaked; it shot up 5.4 percent y/y in January 2023 (from 5.3 percent in December 2022). Excluding food and energy prices, the PCE price index advanced 4.7 percent y/y (from 4.6 percent in December). Furthermore, inflation in France and Spain accelerated in February 2023 (to 7.2 and 6.1 percent y/y, respectively) against expectations of falling or stagnating rates.
AFRICA’S PULSE > 29
15 The data show that net claims on the central government by central banks exceed 10 percent of GDP in countries such as Burundi, the Central African Republic, The Gambia, Ghana, Malawi, Mozambique, Nigeria, Sierra Leone, and South Sudan, among others.
Going against the trend, the Bank of Angola started lowering its monetary policy rates as the currency strengthened, and the disinflation process continues.
The personal consumption expenditures (PCE) price
Percent -5 0 5 10 15 20 30
Rising inflation amid global shocks and domestic vulnerabilities is putting a temporary pause on fiscal consolidation in Sub-Saharan Africa
The process of consolidation that started across most Sub-Saharan African countries in the aftermath of the coronavirus pandemic was halted by the war in Ukraine. In response to rising food and fuel prices, policy makers in the region resorted to supporting the most vulnerable through a series of measures that limit the rise of inflation—especially food inflation—such as direct price subsidies, temporary waivers of tariffs and levies, and income support (through cash and food transfers), among others. Other relevant factors include the sizable reduction in official development assistance (due to conflict and military takeover in some African countries, and diversion to countries outside Africa), and lack of access to external borrowing (for those countries participating in the Common Framework).18 These developments set back the consolidation process as the fiscal deficit remains elevated and creates additional pressure on the budget—especially for governments in the region with an almost depleted fiscal space. The (median) fiscal deficit in Sub-Saharan Africa is projected to have widened from 4.8 percent in 2021 to 5.2 percent in 2022. It is expected to narrow to 4.3 percent in 2024 and to an average of 3.0 percent in 2024–25 (figure 1.19). The widening of the fiscal deficit in 2022 was mainly driven by the deterioration in fiscal outcomes among mineral and metal exporters in the region— and despite oil countries projecting a surplus of 3 percent of GDP. Liberia and Sierra Leone were among the metal and mineral exporters in the region that experienced an expansion of their fiscal deficits of more than 2 percentage points in 2022. Expenditure overruns associated with macro and policy shocks and, in some cases, lower export proceeds may explain the deterioration of the fiscal accounts among these countries. Throughout the forecast horizon (2023–25), the process of fiscal consolidation is expected to resume. Fiscal balances will remain in surplus among
AFRICA’S PULSE > 30
oil exporting countries, while deficits retreat for mineral and metal exporters as well as nonresource-rich countries, to averages of 3.2 and 3.3 percent of GDP, respectively, in 2024–25.
18 In 2021, net official development assistance and official aid received by Sub-Saharan Africa declined by about 10 percent to US$54 billion compared with the previous year.
Source: World Bank staff projections.
Note: Inflation is measured by percentage changes in the Consumer Price Index using the World Bank Macro-Fiscal Model database. e = estimate; f = forecast; SSA = Sub-Saharan Africa.
Percent -8 -6 -4 -2 0 2 4 2016 2017 2018 2019 2020 2021
FIGURE 1.19: Fiscal Balance in Sub-Saharan Africa, 2016-2025f Fiscal balance is expected to narrow during 2023–25.
2022e 2023f 2024f 2025f
Oil exporting countries in SSA
Mineral and metal exporters in SSA Non-resource-rich countries in SSA
Sub-Saharan Africa, median
In 2023, the Republic of Congo and Chad will have the largest fiscal surpluses in the region— revenues in both countries are expected to exceed expenditure by more than 4 percent of GDP. The surplus will gradually decline but still settle above 3 percent of GDP in both countries. The fiscal performance of these countries is due to rising oil-based revenues. In the Republic of Congo, revenue growth was underpinned by reforms—including greater efficiency of government spending, introduction of electronic payment systems, and collection of tax arrears, among others. Improvement was also experienced in Chad in terms of digitalization of public finances as well as tax and customs administration. Other countries that are expected to post a fiscal surplus in 2023 are Gabon, Equatorial Guinea, Lesotho and Angola. The surplus declines over time in Equatorial Guinea, Angola and Lesotho, while it remains firm in Gabon. In contrast, the fiscal deficit exceeds 7 percent of GDP in Mauritius, Zambia, and Malawi.
Inflation in many Sub-Saharan African countries has remained elevated—above central bank targets and above inflation in advanced economies and the global economy. Figure B1.1.1 shows that for 2023, for almost 70 percent of the countries in the region, the projected rate of inflation is greater than 4 percent (the benchmark rate measured by the rate of inflation of advanced countries in the same year), and 25 percent of Sub-Saharan African countries will suffer from two-digit inflation rates in 2023. Looking at the fiscal policy outcomes, almost 70 percent of the region’s countries posted a larger average fiscal deficit in 2022–23 than the 3 percent of gross domestic product deficit that separates countries with and without fiscal space. According to figure B1.1.1, about half of Sub-Saharan African countries face both high inflation (low monetary policy space) and wider fiscal deficits (low fiscal policy space). Notable cases include Ghana, Nigeria, Malawi, Zambia, and Burundi, among others. By contrast, six countries (of a sample of 45) have some monetary and fiscal space to address macroeconomic stability and support aggregate demand. Most of these countries are oil producers, such as the Republic of Congo, Chad, and Gabon. Rising international prices for crude oil and the strengthening of their currencies are providing macroeconomic space in these countries. Still, efforts should be undertaken to improve macro resilience.
Sources: International Monetary Fund World Economic Outlook; World Bank World Development Indicators.
Note: The dashed lines represent benchmarks for inflation (red) and fiscal balance (green) that point to a country having monetary and fiscal space or not. The benchmarks are defined by the average inflation rate for advanced countries in 2023 (4 percent) and a fiscal deficit of 3 percent of GDP. We use the CPI for advanced countries to have an inflation rate that would be closer to the prepandemic period. CPI = Consumer Price Index; GDP = gross domestic product.
AFRICA’S PULSE > 31
BOX 1.1: Tensions in Monetary and Fiscal Policy on the Back of Inflationary Pressures
-10 -5 0 5 10 15 0 5 10 15 20 25 AGO BEN BWA BFA BDI CIV CPV CMR CAF TCD COM COD GNQ ERI SWZ GAB GHA GIN GNB LSOKEN LBR MDG MWI MLI MRT MUS MOZ NAM NER NGA COG RWA SEN SYC SOM ZAF STP TZA GMB TGO UGA ZMB Fiscal balance, 2022–23 (% of GDP) CPI inflation 2023 (%, average of period)
FIGURE B1.1.1: Monetary and Fiscal Policy Stance across Sub-Saharan African Countries, 2023
The deficit in Ghana will remain elevated throughout 2023–25, with the large deficit being compounded by severe financing constraints resulting from a limited ability to issue longterm domestic debt and a lack of access to international capital markets. Successful agreement on and implementation of an International Monetary Fund (IMF)–supported program would help contain the deficit and provide the necessary financing, including via the ongoing debt restructuring negotiations. In Zambia, fiscal consolidation will eventually bring the deficit down to 6.9 percent in 2025. The path to consolidation will be supported by improved tax efficiency measures and containing public expenditure by strictly adhering to priority projects, cutting wasteful subsidies, and strengthening procurement procedures. Finally, higher government spending in South Africa on social grants, wage pressures, tapering of global commodity prices, and weaker domestic growth will weigh on the budget deficit this year. The fiscal outlook is compounded by the conditional debt relief arrangement for the state power utility Eskom, which raises financing needs by an average 1.1 percent of GDP over the medium term. The budget deficit is estimated at 4.2 percent of GDP in 2022 and projected at 4.4 percent in 2023.
Current account deficits in the region are projected to narrow slightly over the next three years
Despite the downward trend in commodity prices, the regional current account deficit is projected to remain invariant at 5.6 percent of GDP in 2023 compared with the previous year. The region’s deficit is projected to shrink steadily to 4.8 percent of GDP in 2024 and 4.2 percent of GDP in 2025 (figure 1.20). Notwithstanding some softening of energy prices (crude, natural gas, and coal), they remain above trend levels, which will help oil-exporting countries to register a substantial surplus of 4.2 percent of GDP in 2023. However, these countries’ surplus is set to shrink to 2.1 percent of GDP in 2025, reflecting a softening in projected energy prices.
Country projections show a mixed picture of the evolution of the current account deficit across oilexporting countries. For example, Angola, Gabon, and the Republic of Congo are expected to post current account surpluses in 2022 and to maintain a surplus in the coming three years, albeit at declining levels. Nigeria, the largest African oil producer, is not expected to reach a current account surplus in 2022. The country’s higher crude oil export revenues are more than offset by higher imports of
AFRICA’S PULSE > 32
Source: World Bank staff projections. Note: e = estimate; f = forecast; GDP = gross domestic product; SSA = Sub-Saharan Africa.
Percent of GDP -12 -9 -6 -3 0 3 6 2018 2019 2020 2021 2022e 2023f 2024f 2025f Oil exporting countries in SSA Mineral and metal exporters in SSA Non-resource-rich countries in SSA Sub-Saharan Africa, median
FIGURE 1.20: Evolution of the Current Account in Sub-Saharan Africa The current account deficit is expected to shrink steadily from 2024 to 2025.
refined petroleum products, lower remittances, and lower capital inflows. Nigeria’s projected current account deficit will remain at an average of 0.3 percent of GDP in 2023–25 as a result of declining prices and stagnant oil production.
Unlike oil-rich countries, the metal and mineral resource-rich countries in the region failed to turn their current account position positive into a surplus despite high commodity prices. Their expected current account deficit is widened to 9.3 percent of GDP in 2022 as export earnings from rising metal prices were insufficient to offset the significant increase in import bills due to high food and energy prices. The expected improvement in global economic activity and lower energy prices will support metal and mineral prices, which were already up nearly 20 percent in January 2023 from October 2022. Consequently, the average current account deficit in metal and mineral exporting countries in the region is projected to narrow gradually from 8.0 percent in 2023 to almost half (3.4 percent of GDP) in 2025, echoing the fall in food and energy prices.
Like oil exporting countries, metal and mineral exporters also display a mixed picture of current account deficits. Most metal and mineral exporters are experiencing current account deficits, such as the Democratic Republic of Congo, Guinea, Liberia, Niger, and Sierra Leone. For example, the current account deficit in the Democratic Republic of Congo deteriorated to 2.9 percent of GDP in 2022 (from a deficit of 0.9 percent of GDP in 2021) despite solid export earnings, which were more than offset by rising food and fuel import bills. Notwithstanding the projected decline in food and fuel prices, the country will continue to have a current account deficit in the next few years, partly because of deteriorating terms of trade. While many metal and mineral exporting countries experienced double-digit current account deficits in 2022, a few of these countries, including Zambia and Botswana, strengthened their current account position. In Zambia, the current account surplus is expected to shrink from an average 10 percent of GDP in 2020-21 to 2.3 percent of GDP in 2022 as copper prices drop and imports pick up. However, Zambia’s current account surplus is projected to bounce back this year to 3.4 percent of GDP, before reaching 4.3 percent of GDP in 2024. In South Africa, many factors contributed to deterioration of the current account balance. Exports suffered partly from the flooding that caused damage to the Durban port and the country’s deteriorating terms of trade. Consequently, South Africa’s current account balance shifted to a deficit of 0.5 percent of GDP in 2022 (from a surplus of 3.7 percent of GDP in 2021). The deficit will widen to 1.6 percent in 2023.
Finally, increased import bills on account of high energy and food prices will cause a deterioration of the current account deficit for non-resource-rich countries. However, the size of these countries’ median current account deficit (6.1 percent of GDP) was lower than that of the region’s metal and mineral resource-rich countries (9.3 percent of GDP) in 2022. About two-thirds of the countries with double-digit current account deficits in 2022 (9 of 14 countries) are non-resource-rich countries; the remaining are metal and mineral exporting countries. Mozambique is expected to have the highest deficit in the region (36 percent of GDP) in 2022, with the sharp increase in the deficit being primarily driven by the import of the offshore liquefied natural gas platform, which was fully financed through a Special Investment Vehicle.19 São Tomé and Príncipe and Burundi are expected to have high current account deficits of about 20.6 and 15.5 percent of their respective GDP in 2022. In Côte d’Ivoire, the trade balance turned negative, at -1.7 percent of GDP in 2022,
AFRICA’S PULSE > 33
19
More generally, the current account deficit for large natural resource investments (“megaprojects”) is fully financed through trade credits and FDI.
causing a widening of the current account deficit from 4.0 percent of GDP in 2021 to an estimated 6.5 percent of GDP in 2022, owing to sustained infrastructure-related imports and generally high import bills for food and fuel. The country is projected to improve its current account deficit gradually, with the softening of food and fuel prices over the next three years. Box 1.2 provides a taxonomy of countries depending on their fiscal and external balances—thus identifying countries with a twin deficit problem.
Global and domestic shocks that affected Sub-Saharan Africa prior to the pandemic widened the region’s current account and fiscal deficits. At the onset of the COVID-19 pandemic, fiscal pressures mounted and countries depleted their already limited fiscal space. Current account deficits also deteriorated as exports plummeted during the pandemic. Figure B1.2.1 depicts the current account and fiscal balance across Sub-Saharan African countries during 2022–23 and points out countries that exhibit the problem of twin deficits. In the shaded area (lower left quadrant), countries have posted a fiscal deficit greater than 5 percent of gross domestic product (GDP) and a current account deficit higher than 3 percent of GDP. These countries are identified as having significant twin deficit problems—notable cases include Malawi, Ghana, and Nigeria.
By contrast, a few countries in the region have healthier fiscal and current account positions (upper right quadrant). For instance, Angola and Chad have current account and fiscal surpluses. Rising oil prices are contributing to improving both fiscal and external balances. Additionally, these countries have made significant efforts to consolidate their fiscal accounts. Chad is one of the four countries participating in the Common Framework, and the only one that has finalized a debt restructuring agreement. About 60 percent of the sample countries (27 of 46) register fiscal deficits above the benchmark (5 percent of GDP deficit) in 2022–23, while nearly 67 percent of the sample countries suffer from widened current account deficits (above the 3 percent of GDP benchmark) in the same years.
Note:
for the fiscal balance (red) and current account balance (blue) that point to a country having healthier external and fiscal balances or not. The benchmarks are defined by a current account deficit of 3 percent in 2022–23 and a fiscal deficit of 5 percent of GDP over the same period. GDP = gross domestic product.
AFRICA’S PULSE > 34
Sources: International Monetary Fund World Economic Outlook; World Bank World Development Indicators.
The dashed lines represent benchmarks
-10 -8 -6 -4 -2 0 2 4 6 8 10 -20 -15 -10 -5 5 10 0 AGO BEN BWA BFA BDI CPV CMR CAF TCD COM COD CIV GNQ ETH GAB GMB GHA GIN GNB KEN LSO LBR MDG MWI MLI MUS NAM NER NGA RWA STP SEN SYC SLE ZAF SSD SDN SWZ TZA TGO UGA ZMB ZWE Fiscal balance (% of GDP) Current account balance (% of GDP)
FIGURE B1.2.1: Current Account and Fiscal Balance across Sub-Saharan African Countries, 2022–23
BOX 1.2: Persistent Twin Deficits in Sub-Saharan Africa
Debt levels remain high and vulnerabilities persist
Public debt in Sub-Saharan Africa has more than tripled since 2010, with a sharp increase prior to the onset of the COVID-19 crisis. Nominal public debt at the end of 2022 is estimated at about US$1.14 trillion, up from US$354 billion in 2010.20 Nominal public debt in the region increased faster before the onset of the global pandemic, at an average annual growth rate of 12 percent during 2010–19, compared to 9 percent during 2020–22. The fast accumulation of public debt, together with sluggish growth, resulted in an increase in the median public debt-to-GDP ratio from 32 percent in 2010 to 57 percent in 2022. Estimates point to a greater reliance on domestic public debt in the region, which accounted for nearly half of outstanding public debt by the end of 2021.21 Over the past decade, the composition of public debt has been shifting gradually toward domestic debt, and data suggest that there was even greater reliance on domestic debt to meet COVID-19-related financing needs.
AFE has recorded a higher level of public debt than AFW; however, AFW’s public debt has increased faster in recent years—especially during the pandemic.
Nominal public debt in AFW quadrupled from US$109 billion in 2010 to US$437 billion in 2022; it tripled in AFE from US$246 billion in 2010 to US$707 billion in 2022. Prior to the pandemic, the average growth rate of public debt in AFW was already higher than that in AFE (13 and 10 percent per year, respectively). The dynamics further diverged during 2020–22, when public debt increased on average by 12 percent in AFW and 7 percent in AFE. Nevertheless, the lower nominal debt levels in AFW translate into lower public burdens relative to GDP, with a median public debt-to-GDP level of 56 percent at the end of 2022, compared to 64 percent in AFE (figure 1.21).
Persistent primary deficits were the main driver of public debt increases in the region. They have increased public debt by nearly 20 percent of GDP since 2015. The real exchange rate has contributed to increasing public debt by nearly 7 percent of GDP since 2015, with larger contributions in 2015, 2016, and 2018. On the one hand, unobserved debt drivers—which include the materialization of fiscal risks or increases in debt coverage—drove
debt creation
AFRICA’S PULSE > 35
20 The analysis excludes Sudan, which reached the Heavily Indebted Poor Countries Initiative decision point in 2021 and is expected to receive substantial external debt relief over the upcoming years.
21 In the absence of a comprehensive database including domestic debt, these numbers represent staff estimates based on different debt databases.
0 20 40 60 80 0.0 0.3 0.6 0.9 1.2 2010 2011 2012 2013 2014 2015 2016 2017
2021 2022 % of GDP US$, trillions Public debt,
debt,
AFW (RHS)
FIGURE 1.21: Public Debt Dynamics in Sub-Saharan Africa Public debt in Sub-Saharan Africa has more than tripled since 2010, with a sharp increase prior to the onset of the COVID-19 crisis.
2018 2019 2020
nom. (AFE) Public
nom. (AFW) Debt level (RHS)
AFE (RHS)
Sources: International Monetary Fund World Economic Outlook, October 2022; World Bank staff calculations.
Note: AFE = Eastern and Southern Africa; AFW = Western and Central Africa; GDP = gross domestic product.
Persistent primary deficits were the main driver of increases in public debt in the region.
by 12 percent of GDP.22 On the other hand, real GDP growth helped to contain public debt and reduced its accumulation by nearly 13 percent of GDP on average since 2015 (figure 1.22).23
The share of multilateral debt in PPG external debt rebounded in 2020–21.
FIGURE 1.22: Debt Decomposition in Sub-Saharan Africa
Sources: World Bank International Debt Statistics; World Bank staff calculations.
Note: GDP = gross domestic product.
FIGURE 1.23: Public and Publicly Guaranteed External Debt Composition in Sub-Saharan African Countries
Debt increases in the region have come along with a changing landscape of external creditors. Between 2010 and 2021, Sub-Saharan African countries increased their reliance on Eurobonds and Chinese loans. Since 2010, more than 15 countries in the region have issued bonds in international markets, which increased the share of public and publicly guaranteed (PPG) external debt from 18 percent in 2010 to 27 percent in 2021. The share of official bilateral debt, excluding China, declined from 12 to 5 percent during the same period, while the share of bilateral debt owed to China increased—particularly from 2013 to 2016. By 2021, about 11 percent of the PPG external debt of the region was owed to Chinese creditors. The share of multilateral debt in PPG external debt decreased gradually over 2010–19; however, it rebounded in 2020–21 as international financial institutions provided multilateral emergency financing (figure 1.23).
Debt distress risks in Sub-Saharan Africa have increased significantly on the back of rising debt levels and increased nonconcessional borrowing.
Sources: World Bank International Debt Statistics 2022; World Bank staff calculations.
Note: PC = Paris Club.
As of December 2022, the number of countries in the
are large, (2) there are large portfolio flows (not captured), or (3) a country overborrows because it is accumulating reserves. Similar issues may arise in the case of overall public debt. A positive contribution from unobserved components signals that debt is increasing beyond what we observe in the identified flows. For instance, that could happen if the primary deficit corresponds to the central government (and does not capture state-owned enterprise borrowing), but state-owned enterprises borrow and the public sector debt is increasing.
23 The decomposition analysis excluded South Sudan, Somalia, and Zimbabwe due to data gaps.
AFRICA’S PULSE > 36
22 Unobserved factors include all factors that are not captured by the identified debt creating flows. For instance, the unobserved component for external debt can be larger and positive if:
(1) the errors and omissions in the balance of payments
Percent of GDP -6 -4 -2 0 2 4 6 8 10 2015 2016 2017 2018 2019 2020 2021 2022 Primary de cit Real interest rate Growth Real exchange rate Other identi ed debt-creating ows Residual Change in public debt Percent of total 2010 2011 2012 2013 2014 2015 2016 2017 2018 2019 2020 2021 Multilateral Bonds Bilateral, PC Bilateral, non-PC, excl. China Commercial and other private China 0 20 40 60 80 100
FIGURE 1.24: Risk of External Debt Distress (share of active
region at high risk of external debt distress or in debt distress had already increased to 22 (from 20 in 2020)—thus representing 58 percent of International Development Association (IDA)–eligible countries in the region. By contrast, no country in the region is at low risk of debt distress (figure 1.24). Under the Low-Income Country Debt Sustainability Framework, four countries in the region have seen their risk of debt distress rating deteriorate since the onset of the COVID-19 pandemic. At the start of 2023, Ghana requested to restructure its bilateral debt under the G20 Common Framework, thus joining Chad, Ethiopia, and Zambia, which signed up early in 2021. Other countries in the region are engaged in bilateral restructuring negotiations. Significant downside risks could further worsen public debt vulnerabilities in the region, although the wave of defaults that some observers expected has yet to materialize. Sub-Saharan African countries face multiple challenges, including tightening financial conditions, high inflation, the economic effects of the Russian invasion of Ukraine, and the lingering COVID-19 crisis. These factors could further worsen macroeconomic conditions and push more countries with strained solvency and liquidity into default.
Public gross financing needs have steadily increased and remain higher than historical averages in Sub-Saharan Africa.24 They increased from a median of 3 percent of GDP in 2008–14 to 8 percent of GDP in 2015–19, and remained high in 2020–22, at 11 percent of GDP. The average gross financing needs in the region for the upcoming five years is projected to remain at levels close to 10 percent of GDP, with greater financing needs in AFE compared to AFW.25 External debt service in the region increased from US$6 billion in 2010 to almost US$34 billion in 2021, with the AFE subregion showing the largest increase, from US$4 billion in 2010 to almost US$22 billion in 2021. External PPG debt service in the Sub-Saharan Africa region increased from US$10 billion in 2010 to almost US$43 billion in 2021. The AFE subregion showed higher levels of external PPG debt service, rising from US$7 billion in 2010 to nearly US$31 billion in 2021. The increase in external debt service translated into higher ratios of total debt service to exports and debt service to revenue; in 2021, Sub-Saharan Africa reached 28 and 41 percent, respectively.
AFRICA’S PULSE > 37
24 Gross financing needs are typically defined as the financial needs required to roll over maturing debt, defined as the fiscal deficit, plus any other transactions that require financing, plus amortization.
25 From 2014–18 to 2020–22, the countries with the sharpest increases in their public gross financial needs included Zambia (about 11 percentage points of GDP) and Rwanda (15 percentage points) in AFE, as well as Ghana (19 percentage points of GDP) and The Gambia (nearly 20 percentage points) in AFW.
Low
Percent 0 20 40 60 80 100 2006 2007 2008 2009 2010 2011 2012 2013 2014 2015 2016 2017 2018 2019 2020 2021 2022
LIC DSF countries) No country in the region is at low risk of debt distress.
Moderate High
Source: World Bank staff estimates as of December 2022.
Note: The data cover joint World Bank–International Monetary Fund debt sustainability analyses for low-income countries in Sub-Saharan Africa. The number of countries varies by year. LIC DSF = Low-Income Country Debt Sustainability Framework.
The sell-off of developing countries’ Eurobonds and increasing investor fears about the global outlook amplify the risks for Sub-Saharan African countries facing large Eurobond redemptions. More than 15 countries in the region have (repeatedly) tapped international markets. Despite the halt in international bond issuances in 2020 after the onset of the pandemic, several countries (including Angola, Benin, Ghana, and Kenya) issued Eurobonds in 2021 and early 2022. However, the spreads have increased and narrowed the number of countries with market access, which increases refinancing risks for countries with large Eurobond redemptions (figure 1.25), including Kenya (US$2 billion in 2024) and Angola (around US$1.7 billion in 2025). Consequently, an increasing number of countries have negotiated IMF-funded programs to meet their gross financing needs. Benin, Ghana, Uganda, and Rwanda have recently secured IMF staff-level agreements. Malawi and Burkina Faso reached staff-level agreements through the Food Shock Window of the Rapid Credit Facility.26 Côte d’Ivoire is negotiating a new three-year Extended Credit Facility/Extended Fund Facility arrangement with the IMF that will be focused on revenue-based fiscal consolidation and debt sustainability.27 In December 2022, the IMF’s Executive Board concluded the 2022 Article IV Consultation and Fourth Review of the Extended Credit Facility for Somalia. The Somali authorities are making steady progress in meeting the requirements for the Heavily Indebted Poor Countries initiative, which will mean that the country is eligible for full and irrevocable debt relief.
Addressing higher debt levels and heightened debt vulnerabilities has been challenging for SubSaharan African countries. Countries in the region have used credit enhancement and/or liability management operations to address their debt problems. Benin received a partial guarantee from the African Development Bank to lower the cost of the country’s new external commercial loan. Benin and Angola used parts of the proceeds from new Eurobond issuances for partially buying back outstanding bonds. Several institutions, such as the International Committee of the Red Cross and the Global Fund, are proposing debt swap arrangements.
Several countries have reverted to debt restructurings to resolve sustainability issues and rebuild
AFRICA’S PULSE > 38
26
In Malawi, a disbursement of US$88.5 million under the new Food Shock Window of the Rapid Credit Facility was approved in November 2022 by the IMF Executive Board Meeting, and disbursed in December 2022. Additionally, the government has requested Program Monitoring with Board Involvement and has been in discussions with the IMF to secure an Extended Credit Facility.
27 Improving domestic revenue mobilization is one of the greatest challenges for Côte d’Ivoire to keep the level of public spending needed to support productive and social spending within a sustainable fiscal framework.
Source: World Bank staff projections.
Basis points 0 200 400 600 800 1,000 1,200 1,400 Angola
Nigeria Senegal South Africa Oct-21 Nov-21 Dec-21 Dec-21 Jan-22 Feb-22 Mar-22 Mar-22 Apr-22 May-22 May-22 Jun-22 Jul-22 Jul-22 Aug-22 Sep-22 Sep-22 Oct-22 Nov-22 Nov-22 Dec-22 Jan-23 Jan-23 Feb-23 Mar-23
FIGURE 1.25: Bond Spreads in Sub-Saharan Africa Sovereign spreads have increased and elevated refinancing risks.
Côte d'Ivoire Gabon Namibia
fiscal space. Chad, Ethiopia, Ghana, and Zambia applied for external debt treatments under the Common Framework, adding China, India, and Saudi Arabia to the Paris Club restructuring process.28 So far, only the restructuring in Chad has been completed.29 In Ethiopia, political instability has halted the process. In Zambia, bondholders are pushing back against assumptions of the World Bank/IMF debt sustainability analysis, and China has called for the inclusion of multilateral debt and nonresident domestic debt holders in the debt treatment. Ghana requested a Common Framework debt treatment in early 2023; hence, progress has yet to be made. In conjunction with the Common Framework engagement, Ghana conducted a voluntary domestic debt exchange program. Other countries engaged with private creditors and bilateral donors engaged in external restructuring efforts through bilateral engagements (Malawi).30
Yet, these efforts cannot replace a comprehensive and well-coordinated solution for countries in debt distress. High liquidity and solvency pressures may push more countries into an unsustainable situation that requires a comprehensive restructuring of their obligations. The G-20 Common Framework for Debt Treatments is the closest framework for debt resolution available to address sovereign debt crises. International financial institutions like the World Bank support this framework but point out that more can be done to strengthen the Common Framework. This includes improving the process through clear and time-bound implementation steps, introducing a debt service standstill for applicants, providing greater clarity on the enforcement of comparability of treatment, and expanding the Common Framework to currently noneligible countries.
AFRICA’S PULSE > 39
28 The World Bank Group has provided significant relief in to debt-distressed countries, in the form of grants and concessional financing. For instance, Chad, Zambia, and Ethiopia have received US$7.9
billion in commitments (of which US$4.5 billion
were grants) over the past two fiscal years.
29 Private and official creditors agreed to reprofile part of Chad’s debt service due in 2024 and bring the ratio of debt service to revenue below 14 percent next year.
30 In the Seychelles, some operations were conducted to guarantee debt sustainability in the post-pandemic era: (1) a liability management operation in 2021 to reduce interest rate and refinancing risks by exchanging Treasury bills for Treasury bonds with maturity of 3, 5, and 7 years; and (2) restructuring of Air Seychelles debt, which reduces it by two-thirds.
1.4 OUTLOOK
Growth in Sub-Saharan Africa is projected to remain modest, at 3.1 percent in 2023, but it appears to be bottoming out as economic activity is estimated to pick up to 3.7 and 3.9 percent in 2024 and 2025, respectively. The projected growth of the region in 2023 has been revised downward by 0.4 percentage point compared to the October 2022 Africa’s Pulse forecast. The growth deceleration in 2023 reflects several short-term headwinds, including the slowdown in the global economy (particularly in the United States, the euro area, and China), the lingering effects of the coronavirus pandemic, elevated inflation, rising financial risks owing to high public debts reaching unsustainable levels, continued supply disruptions, and the war in Ukraine.
From the expenditure side, growth in 2023 is supported by subdued contributions from private consumption and gross fixed investment (lower than in 2022). This reflects the impact of central banks hiking interest rates to anchor inflationary pressures, and commodity prices stabilizing at a lower level than at the onset of the war in Ukraine. Government consumption continues to contribute negligibly to real GDP growth in 2023. Exports have held up in 2023, while import growth has declined, resulting in lower but still negative net exports (figure 1.26). On the production side, an uptick in industry and a modest recovery in agriculture will support growth in 2023 and 2024. The service sector will retreat in 2023 before recovering in 2024 (figure 1.27).
The growth forecast differs across subgroups. For instance, growth in the region excluding large countries, such as Angola, Nigeria, and South Africa, is projected at 4.3 percent in 2023, and set to expand to 5.1 and 5.2 percent in 2024 and 2025, respectively. Non-
AFRICA’S PULSE > 40
GDP
Source: World Bank
staff
projections. Note: Change in inventories and statistical discrepancy are not displayed. e = estimate; f = forecast;
= gross domestic product.
FIGURE 1.26: Contribution to GDP Growth, Demand Side
FIGURE 1.27: Contribution to GDP Growth, Production Side
Growth in 2023 is supported by subdued contributions from private consumption and gross fixed investment.
Government consumption Private consumption Gross xed investment Net exports Real GDP growth -4 -2 0 2 4 6 8 10 2018 2019 2020 2021 2022e 2023f 2024f 2025f Percentage points -3 -2 -1 0 1 2 3 4 5 2018 2019 2020 2021 2022e 2023f 2024f 2025f Percentage points Agriculture Industry Services Net taxes Real GDP growth
The service sector will retreat in 2023 before recovering in 2024.
resource-rich countries are projected to grow 4.2 percent in 2023 and to pick up to 5.1 and 5.3 percent in 2024 and 2025, respectively. The stronger performance of non-resource-rich countries can be attributed to gains enjoyed from lower import bills and an expansion in services. Real GDP growth in resource-rich countries will remain subdued, at 2.4 percent in 2023, but will rebound slightly to 2.9 and 3.0 percent in 2024 and 2025, respectively—still below the growth rate of 3.7 percent in 2021. Growth for this group of countries is dragged down by lower commodity prices, pointing to strong dependence on the extractive sector.
Growth across the subregions remains sluggish, but it is projected to bottom out in 2023
Growth for the region as a whole hides significant heterogeneity in the performance of the subregions, as well as individual countries. In the AFE subregion, growth in economic activity is expected to grow at 3.0 percent in 2023, down from 3.5 percent in 2022, but to accelerate to 3.7 and 3.9 percent in 2024 and 2025, respectively (figure 1.28). The economic performance of the AFE subregion is dragged down by the lower than the average regional performance of two of its largest economies, namely, South Africa and Angola.
In South Africa, economic activity is set to weaken further as structural constraints—particularly, the energy crisis—and headwinds persist throughout the forecasting period. Growth will decelerate to 0.5 percent in 2023 (from 2.0 percent in 2022), and it is expected to rebound to 1.3 percent in 2024 and 1.6 percent in 2025. The projected weak performance is inadequate to address the problems of high unemployment and rising inequality in the country. Private consumption expenditure growth is set to moderate to 1.7 percent in 2023, from 2.6 percent in 2022. While structural problems and adverse global shocks add to the uneven recovery from the pandemic, high inflation and the lingering effects of the monetary tightening cycle, the deteriorated labor market, and weak (business and consumer) confidence are expected to weigh on the growth of private consumption. Private consumption growth is projected to remain stable in 2024–25. Investment growth will decelerate slightly to 4.2 percent in 2023, down from 4.7 percent in 2022. Significant investment in infrastructure—including in the energy sector—is expected to support this increase. Investment
AFRICA’S PULSE > 41
FIGURE 1.28: GDP Growth Forecasts for Eastern and Southern Africa In the AFE subregion, economic activity is expected to slow down in 2023 but to accelerate in 2024 and 2025.
AFE
AFE, excl. South Africa
AFE, excl. Angola and South Africa Non-resource-rich countries
-4 -2 0 2 4 6 8 2020 2021 2022e 2023f 2024f 2025f Percent
AFE mineral and metal exporters, excl. South Africa EAC
Source: World Bank staff projections.
Note: AFE = Eastern and Southern Africa; e = estimate; EAC = East African Community; f = forecast; GDP = gross domestic product.
growth is expected to moderate to 4.4 percent during 2024–25. Fiscal consolidation is set to cut government consumption by 2.7 percent in 2023—with a smaller contraction (of 0.5 percent) during 2024–25. On the supply side, the agriculture sector will support growth in 2023, with growth of 2.7 percent, up from 0.3 percent. Industry will remain under pressure in 2023, after a contraction of 2.3 percent in 2022. The service sector, which has been supporting growth since 2021, is set to moderate in 2023 before recovering in 2024 (1.5 percent).
Angola’s growth rate is expected to decelerate to 2.6 percent in 2023 (from 3.5 percent in 2022) and stabilize at 3.1 percent in 2025. Despite improving by late 2022, oil production remains below the OPEC+ quota. Lower oil prices may hurt economic performance in Angola, as the economy still relies heavily on growth of the oil sector. Gross fixed capital formation is set to increase by 2.7 percent in 2023, up from a 1.2 percent contraction in 2022. Private consumption growth is projected to slow down from 4.1 percent in 2022 to 2.6 percent in 2023. Oil production and diamond production are expected to pick up in 2023. Lower oil prices will likely cut external receipts substantially since they will not be offset by the upturn in production. The current account surplus will narrow, from 12.7 percent of GDP in 2022 to 6.7 percent of GDP in 2023, on account of the declining value of exports. On the production side, the agriculture and service sectors will remain robust over the forecast horizon.
Excluding South Africa and Angola, the AFE subregion is expected to grow at 4.4 percent in 2023, and it is set to speed up to 5.1 and 5.3 percent in 2024 and 2025, respectively (figure 1.28). The performance is above the subregional growth, with a minor downward revision of 0.1 percentage point for 2023. Kenya is expected to grow at 5 percent in 2023 (down from 5.2 percent in 2021) and set to expand at 5.2 and 5.3 percent in 2024 and 2025, respectively. The slowdown in economic activity in 2023 is attributed to a deceleration of growth in private consumption associated with the impact of higher interest rates that are aimed at curbing inflation. Growth of private consumption is set to decline to 5 percent in 2023, from 5.2 percent in 2022. Investment growth will show some resilience amid tighter financing conditions, growing by 7.7 percent in 2023—up from 7 percent in 2022. On the production side, growth in Kenya reflects strong increases in activity across all sectors in 2023—with growth accelerating to 3.8 percent in agriculture and 4.9 percent in industry. Growth in services will remain resilient, at 5.4 percent in 2023, although down from 7.5 percent in 2022.
In Ethiopia, real GDP is set to grow steadily from 6.0 percent in 2023 to 6.6 and 7.0 percent in 2024 and 2025, respectively. With the peace agreement between the government and the Tigray People’s Liberation Front, the upswing in economic activity is attributed to a recovery in investment—with growth rates of 5.9 percent in 2023 and an average of 6.9 percent in 2024–25. On the supply side, the agriculture sector will pick up due to improved weather conditions. Zambia is set to grow by 4.2 percent in 2023, and accelerate to 4.7 percent in 2024–25. This growth acceleration is attributed to strong performance in services, a rebound in mining, and improvement in manufacturing. Over the medium term, output growth might be hampered by the lingering uncertainty associated with the conclusion of the ongoing debt restructuring negotiations. Additionally, inadequate electricity generation—associated with the low water levels in the Kariba dam—may weaken production across different sectors of the economy.
AFRICA’S PULSE > 42
In the AFW subregion, economic activity is expected to grow at 3.4 percent in 2023, down from 3.7 percent in 2022, and it is expected to accelerate to 3.9 and 4.0 percent in 2024 and 2025, respectively (figure 1.29). The economic performance of the AFW subregion is dragged down by the lower than the average regional performance of Nigeria— its largest economy. The Nigerian economy is set to grow by 2.8 percent in 2023, down from 3.3 percent in 2022. It is expected to accelerate slightly to an average annual rate of 3 percent in 2024–25. This translates into growth per capita of 0.2 percent in 2023 and 0.4 percent in 2024–25, which is insufficient to reduce extreme poverty in the country. Growth will continue to be driven by services, trade, construction, manufacturing, and agriculture. Oil production is projected to remain subdued in 2023, because of inefficiencies and insecurity, and recover slightly in 2024–25. On the production side, growth in 2023 will be supported by industry (with growth of 5.6 percent) with the mega-refinery project.
Economic activity in the AFW subregion excluding Nigeria is expected to grow at 4.2 percent in 2023, rising to 5.3 percent in 2024–25 (figure 1.29). Growth in 2023 and 2024 is predicted to lose 0.7 and 0.2 percentage point, respectively, from the October 2022 forecasts. The downward revision is accounted for by the still high rates of inflation, tightening monetary and fiscal policies, continued conflict in the Sahel region, and slowdown of the global economy. The expansion of the AFW subregion in 2023 (3.4 percent) is higher than that of its counterpart, AFE (3.0 percent).
Growth of WAEMU countries is expected at 5.5 percent in 2023, slightly down from 5.6 percent in 2022, and these countries will grow at a faster pace in 2024 (7.0 percent). The WAEMU countries will reap the benefits of declining food and fuel inflation, expansionary (or neutral at best) monetary policy, as well as investment in infrastructure. Economic activity in Côte d’Ivoire is projected to decelerate slightly in 2023 (6.2 percent) due to global headwinds affecting exports, cutting private investment expectations, and increasing uncertainty around the path of inflation. Still, growth is projected to remain strong at an annual average of 6.5 percent during 2024–25, driven by growth in investment as a result of pro-competitive market reforms. In Senegal, growth is projected to accelerate slightly to 4.7 percent in 2023, from 4.2 percent in 2022, and to firm at 9.9 percent in 2024. The strong economic performance is attributed to
AFRICA’S PULSE > 43
Source: World Bank staff projections.
Note: AFW = Western and Central Africa; CEMAC = Economic and Monetary Community of Central Africa; e = estimate; f = forecast; GDP = gross domestic product; WAEMU = West African Economic and Monetary Union.
FIGURE 1.29: GDP Growth Forecasts for Western and Central Africa Economic activity in the AFW subregion excluding Nigeria is expected to grow at 4.5 percent in 2023 and even faster in 2024 and 2025.
-3 -2 -1 0 1 2 3 4 5 6 7 8 2020 2021 2022e 2023f 2024f 2025f Percent
AFW AFW, excl. Nigeria Mineral and metal exporters Non-resource-rich countries Oil resource-rich countries WAEMU CEMAC
an increase in domestic investment and a sharp acceleration in government consumption. Ongoing infrastructure investments—particularly in electricity, transport, and the digital economy—will boost growth in the next years. Investments in climate-smart agriculture will help alleviate the impact of climate shocks.
In contrast to WAEMU countries, weak economic performance is expected among Economic and Monetary Community of Central Africa (CEMAC) countries in 2023 (2.7 percent), down from 2.9 percent in 2022. As the global economy slows down, the international price of oil— the main export commodity for many of the CEMAC countries—will drop, thus weighing on economic activity. In Cameroon, the economy will maintain its post-pandemic growth with an annual average growth rate of 4.2 percent in 2023–25, supported by investment and private consumption. On the production side, all sectors will contribute to growth. Production of liquefied natural gas, oil, and other mining commodities is projected to increase. Economic growth in Gabon will remain unchanged at 3.1 percent in 2023 and drop slightly to 3 percent in 2024 and 2025. Growth of investment will decrease from 11.1 percent in 2022 to 1.9 percent in 2023, while growth of private consumption will increase from -0.2 to 1 percent. On the production side, the agriculture and industrial sectors will be the main contributors to growth (and, particularly, the timber and construction sectors), while the contribution of services will remain limited. Additionally, oil production will pick up as investment in the sector increases.
Amid high inflation and weak growth prospects in 2023, fear of stagflation is rising across some countries in the region
There is a rising fear of stagflation in the global economy—as manifested by stagnation of economic activity, higher inflation rates, and a high unemployment rate. Sub-Saharan African economies as well as the global economy are experiencing an episode of high inflation that is driven by the COVID-19-related lockdowns and supply chain disruptions, and exacerbated by the war in Ukraine, among other factors. The war in Ukraine escalated supply chain disruptions further and intensified volatility in energy and commodity prices. Many central banks across the globe responded by tightening their monetary policies to curb inflation. For example, the US Federal Reserve has increased its monetary policy rate by 450 basis points since March 17, 2022. However, inflation declined slowly to 6.4 percent by January 2023—a rate that is still above the Fed’s 2 percent inflation target. The slow disinflationary process can be attributed not only to remaining supply chain issues, but also rising wages and higher consumer savings from government stimulus checks. Further interest rate hikes to curb inflation add more pressure to tightening global financial conditions and elevate the risk of a global economic slowdown.
One of the salient features in the current inflationary episode is the increase in food prices— which had started prior to the pandemic—due to pent-up demand as the global economy lifted COVID-19 restrictions and harsh weather conditions. Many Sub-Saharan African countries have experienced high headline inflation fueled primarily by food inflation. Nearly three-quarters of the countries in the region with available data for January 2023 recorded a two-digit year-overyear rate of food inflation—with Zimbabwe (264 percent), Sudan (58.7 percent), and Ghana (61 percent) exhibiting the highest rates (see figure 1.16).
AFRICA’S PULSE > 44
Rising inflation erodes purchasing power, holds back growth, and, if not addressed, leads the government to run the risk of de-anchoring inflationary expectations—with dire consequences for financial markets. Many countries have also accumulated mounting debt burdens since the pre-pandemic era. In this context, what are the risks of stagflation in Sub-Saharan African countries, and what are the policies needed to engage in a sustainable growth path with a stable macroeconomic environment?
Figure 1.30 depicts the risks of stagflation across SubSaharan African countries. It considers countries at risk of stagflation as those that meet two criteria: (1) their income per capita in 2023 is still below that of 2019 (prior to the pandemic), and (2) the projected average inflation rate in 2023 is higher than the corresponding rate for advanced economies.
According to figure 1.30, countries in the upper left quadrant exhibit the highest risk of stagflation. Evidence shows that about 38 percent of Sub-Saharan African countries have a greater risk of stagflation. Many countries in this group have also recorded two-digit unemployment rates—particularly Southern African countries, Angola, and Nigeria, among others. Countries in the right quadrants and with a low inflation deviation from advanced countries (say, less than 0.025) show moderate to robust growth under a relatively stable inflationary environment. For countries in the right-side quadrants with a higher inflation differential, growth recovery is accompanied by rising inflation (for instance, Ghana and Ethiopia). In those countries, the rising cost of living is already weighing on consumers and investors
may hamper economic growth.
AFRICA’S PULSE > 45
and
Source: World Bank staff projections. Note: This figure depicts the trade-offs between inflation and growth across countries in the region. It compares the recovery of income per capita in 2023 relative to 2019 (x-axis) vis-à-vis the inflation differential projected for 2023 for each Sub-Saharan African country relative to that of advanced countries (y-axis). Following these definitions, countries in the upper left quadrant of the figure exhibit the highest risk of stagflation.
0.1 0.2 0.3 -0.2 0.2 0.0 0.0 -0.1 -0.1 0.1 AGO BDI BEN BFA BWA CAF CIV CMR COD COG COM CPV ERI ETH GAB GHA GIN GMB GNB GNQ KEN LBR LSO MDG MLI MOZ MRT MUS MWI NAM NER NGA RWA SEN SLE SOM SSD STP SWZ SYC TCD TGO TZA UGA ZAF ZMB Inflation differential with advanced aconomies, 2023
FIGURE 1.30: Is Stagflation a Looming Threat among Sub-Saharan African Countries? More than one-third of the countries in the region have a greater risk of stagflation (upper-left quadrant).
Ratio of income per capita 2003/2019
1.5 RISKS TO THE OUTLOOK
Risks to the outlook for the region—both external and domestic—remain tilted to the downside. A slowdown in global demand—and, particularly, a less than stellar reopening of the Chinese economy—would affect global trade and commodity prices. Food and fuel prices may remain elevated if the war in Ukraine is prolonged—and, especially, if the Black Sea Grain Initiative is not extended. Persistent inflation, and the risk of de-anchored inflation expectations, in advanced countries could accelerate the pace of the interest rate or keep interest rates higher for a long period. In this context, further tightening of global financial conditions may raise the costs of external borrowing and restrict access to international capital markets for SubSaharan African countries. Internal risks include elevated public debts in Sub-Saharan Africa, which constrain countries from frontloading needed spending for development. Worsening of weather conditions, especially in the Sahel region and the Horn of Africa, may also weigh down the outlook.
External risks
Growth prospects in Sub-Saharan Africa can be further aggravated if there is lower-thanexpected economic performance among the region’s major trading partners. For instance, central banks may tip the global economy into recession as a result of accelerating their interest rate increases to curb inflation. Added to this scenario, lower-than-expected growth in China, as a result of zero-COVID restrictions being lifted, would have an adverse impact not only on global trade, but also direct trade with Africa.31 The United States, the euro area, and China account for 40 percent of Sub-Saharan Africa’s total trade. Finally, greater financial turmoil in the United States—as a result of the collapse of Silicon Valley Bank and Signature Bank—and in China—from the real estate market—can be transmitted to African countries through lower demand for the region’s exports (particularly, commodities), supply chain disruptions, and softer commodity prices.
An escalation of the war in Ukraine has the potential to induce increases in the international prices of food, fertilizers, and energy commodities. Failure to extend the Black Sea grain export deal between Ukraine and Russia (which was extended for at least 60 days on March 18, 2023) may create supply disruptions and elevate the prices of grains. Ukraine was a major player in the global food commodity markets prior to the war: it accounted for nearly 10 percent of the global wheat export market, nearly half of the sunflower oil market, and 16 percent of the corn market. Inflation across countries in Sub-Saharan Africa remains stubbornly high despite an aggressive tightening cycle in monetary policy. Further increases in inflation could not only further erode people’s purchasing power, but also lead to a financial crisis. Additionally, food insecurity would intensify—along with greater risk of social unrest and undernourishment.
Persistent inflationary pressures, as a result of labor market tightness, could translate into an acceleration of the pace of interest rate hikes among central banks in advanced economies. Core inflation—a better gauge of the underlying inflationary pressures—remains high and above central banks’ targets. Such developments could lead to a de-anchoring of inflation
AFRICA’S PULSE > 46
31 By contrast, a faster rebound of economic activity in China, as a result of the reopening, could have an impact on international commodity prices (particularly, food and fuel prices) and be transmitted into headline inflation.
expectations and a more aggressive monetary policy tightening cycle. Additionally, the recent turmoil in US financial markets may delay the end of the tightening cycle as the Federal Reserve navigates the trade-off between inflation management and financial stability. In this context, further tightening of global financial conditions will lead to an outflow of foreign capital from African countries, thus weakening their currencies and widening their sovereign spreads. It could also prompt central banks in the region to tighten further their monetary policies if their currencies come under pressure. Finally, African governments will be less likely to meet their still elevated financing needs as the costs of (domestic and external) borrowing increase and access to international capital markets becomes more restricted—especially for those countries in the region with high risk of debt distress.
Internal risks
Debt levels and vulnerabilities remain high in Sub-Saharan Africa, with sluggish improvement in some countries. The region’s countries still have little room to maneuver given that their fiscal space remains depleted in most cases. The situation could worsen, especially for countries that have lost access to the credit market and are in or at risk of debt distress. If not addressed, debt dynamics could escalate into a full-blown crisis, setting countries even further back. The international community needs to find more adequate ways to speed up debt treatments. The current resolution mechanisms need to be strengthened so that they can effectively address a potential debt crisis, and additional instruments may need to be set in motion.
Extreme weather conditions continue to have a stranglehold on economic activity in the Horn of Africa and the Sahel, aggravating the humanitarian situation. The Horn of Africa is experiencing an unprecedented three-year drought. A sixth failed consecutive rainfall season, as predicted by some meteorological agencies for between March and May of this year, would have devastating consequences for communities in the region. Amid poor social safety nets and weak health systems, the poorest households will resort to unhealthy coping mechanisms (including restricting consumption), and emigration will increase further.
Finally, violence and civil insecurity remain at historically high levels not only in low-income countries in the Sahel region, but also in major regional economies (Nigeria), and homicide rates are at record high levels in South Africa. At the same time, the region has become the global epicenter of violent extremist activity. Nearly half of all terrorism-related deaths in 2021 took place in Sub-Saharan Africa—with four countries accounting for more than one-third of these deaths (Somalia, Burkina Faso, Niger, and Mali). Violent extremism also spread to other parts of the region, such as Mozambique, and is severely affecting lives, livelihoods, and prospects for peace and development.32 In many countries, increases in fragility induced by the pandemic are further amplified by vulnerabilities to climate shocks and risk of debt unsustainability. These multiple vulnerabilities and the lack of resilience to (economic and climatic) shocks may lead to persistent poverty and food insecurity, which, in turn, raises the probability of social unrest.
AFRICA’S PULSE > 47
32 UNDP (2023).
1.6 POLICY RECOMMENDATIONS
Sub-Saharan Africa faces a myriad of challenges to regain its growth momentum. The global environment remains challenging, with a reduced demand for the region’s export products and tightened global financial conditions. At the same, African economies are being held back by high inflation, insufficient fiscal space to support the recovery, elevated domestic interest rates, high levels of debt, and reduced capacity to borrow—including restricted access to international capital markets for countries with high sovereign debt risks. Against this background, African economies must increasingly rely on their own policy reforms and domestic space for action in three areas:
First, restoring macroeconomic stability is essential for growth. Raising interest rates and avoiding policy conflicts that reduce the effectiveness of monetary transmission (say, fiscal dominance, and foreign exchange distortions) are crucial to reduce inflation to target levels. At the core of the fight against inflation, central bank independence can be complemented by fiscal policy anchored on debt sustainability. Finally, actionable policies can be implemented to stabilize debt-to-GDP ratios as well as seeking debt reduction for countries with high risk or already in debt distress. Strengthening the Common Framework to be more inclusive of countries with sovereign risk as well as having a more transparent and faster process plays a crucial role.
Second, structural reforms that foster private investment should be at the top of the pro-growth policy agenda of countries in the region. A premium should be put on policy measures that boost long-term competitiveness—including actions to improve market contestability and promote a sound regulatory framework. Expanding public investment would be challenging for governments with severe fiscal constraints and restricted access to capital markets. Public investment, hence, needs to be very selective—with the scarce fiscal resources being allocated to projects with high quality and large output and employment multiplier effects. Finally, public policies to attract FDI are needed—including expanding and upgrading transportation and other trade-related infrastructure to boost economic integration in the region.
Third, African policy makers need to seize the opportunities that are available to them during the low carbon transition. The transition toward the low-carbon economy is irreversible and will be intensive in minerals that are abundant in many countries in the region. The governments of resource abundant countries in the region can harness their resource wealth—and more specifically the abundant resources in extractives industries—to: (1) address their existing fiscal challenges by boosting government revenues, (2) drive economic transformation by leveraging the African Continental Free Trade Area (AfCFTA) and unlocking regional value chains to create jobs, and (3) improve access to energy, with a gradual shift in the energy mix from fossil fuels to more renewable resources—with natural gas playing a role as a transition energy resource. Tapping into the existing energy resources and associated fiscal revenues to achieve universal access to reliable and affordable electricity is also essential.33
AFRICA’S PULSE > 48
33 Section 2 of this volume, “Natural Resource Abundance, the Low Carbon Transition, and Improving Energy Access in Africa,” discusses in more detail a series of policy options to harness resource wealth for sustainable and diversified development in the region.
Restoring macroeconomic stability
Taming inflation is central to achieving macroeconomic stability. Inflation rates across countries in the region remain elevated and above target despite the early and sizable interest rate increases undertaken by their central banks. Taming inflation will remain a challenge for monetary authorities in Sub-Saharan Africa, especially for those with ineffective inflation-targeting policies, inadequate tools for policy implementation, or without policy independence.34 Monetary policy tightening has also been ineffective in countries with unorthodox interventions such as fiscal monetization, direct lending interventions, and untargeted subsidy programs. Foreign exchange restrictions that widened parallel market premia also contributed to derail disinflationary efforts.35 The risk of de-anchoring inflation expectations would fuel further inflation, accelerate interest rate increases, and raise the probability of a downturn in economic activity.36 Easing or putting a pause on the monetary tightening cycles appears to be premature given that inflationary pressures across Sub-Saharan African countries remain high.37 In this context, guaranteeing central bank independence (in policy instruments and decision making) and strengthening the institutions that support a sound, transparent, and accountable monetary policy are essential to curb inflation. Close coordination with fiscal policy is required, with actions that should not jeopardize inflation targets and fiscal sustainability (see box 1.1).
A fiscal policy anchored in debt sustainability, along with an autonomous and credible central bank, can help in the fight against inflation. Amid mounting fiscal pressures and restricted access to financing, inflation expectations may react to monetary policy tightening in a way that is contrary to that was intended. Rising interest rates may increase the risk of fiscal stress, thus leading to currency depreciation and a higher rate of inflation. In this context, reducing fiscal and debt sustainability risks via domestic resource mobilization and greater spending efficiency is critical. Boosting domestic resource mobilization includes actions to diversify the base and digital solutions to improve tax administration and tax collection (for instance, taxpayer electronic registration, e-filing, and e-payment of taxes). Redesigning tax incentives toward growth-enhancing activities (for instance, research and development and the digital economy) is also critical. On the expenditure side, reforms to strengthen public investment management systems include (1) the adoption of stricter and more transparent arrangements for the appraisal, selection, and approval of investment projects; (2) more rigorous oversight of public-private partnerships; and (3) enhanced integration between national strategic planning and capital budgeting.38 Targeting of social protection programs can be enhanced by the use of digital technologies. Income support measures, such as cash transfers, should continue to be deployed to protect the most vulnerable from persistently high inflation rates—and particularly food inflation. Finally, repurposing public support toward high-return investments will yield large benefits for governments with depleted fiscal space.
AFRICA’S PULSE > 49
34 The limits of monetary policy to bring down inflation in Sub-Saharan Africa are also associated with: (1) the greater weight of supply shocks driving inflation—such as climatic shocks and commodity prices, and (2) weakness of the monetary policy transmission across countries with underdeveloped domestic financial markets and large informal sectors.
35 Countries with parallel exchange rates typically exhibit high inflation. More than three-quarters of the countries in the world with high inflation rates for 2021 had parallel foreign exchange markets (Farah Yacoub, Hamadeh, and Reinhart 2022).
36 Mankiw and Reis (2018); Reis (2021).
37 A more cautious approach to keep inflation under control while monitoring its overall impact on economic activity and employment has been followed by some countries in the region. For instance, the Central Bank of Seychelles has kept its monetary policy rate at 2 percent and will continue to do so for the first quarter of 2023 to support the economy.
38 IMF (2015a); Chaponda, Matsumoto, and Murara (2020); Miyamoto et al. (2020).
Accelerating debt reduction and restructuring is essential to shore up stability for growth. Amid the pandemic crisis, a series of initiatives were introduced to alleviate the liquidity and solvency problems of governments in low-income countries, including debt restructuring. One of these initiatives, the Common Framework for Debt Treatments, was designed to address a wide range of sovereign debt challenges and ensure broad participation of creditors with fair burden sharing. Four Sub-Saharan African countries are seeking debt restructuring via the Common Framework: Chad, Ethiopia, and Zambia, and, more recently, Ghana. Chad is the only country that has reached an agreement with its creditors under the Common Framework—albeit an agreement that does not include an actual debt reduction. So far, the different initiatives launched during the pandemic have not successfully reduced the debt levels and vulnerabilities of IDA-eligible countries.
Addressing the debt crisis in Sub-Saharan Africa would require a comprehensive solution from borrowing countries and greater coordination with creditors. Comprehensive debt solutions will require debt suspension, reduction, resolution, and transparency. So far, countries that received IMF and World Bank financing during the pandemic have committed to specific governance measures to improve accountability and transparency—including arrangements to track COVID-19-related spending. At the same time, the World Bank and IMF are collaborating with other development partners to help strengthen governance, accountability, and transparency. Advances in these areas among debt-distressed countries will facilitate debt reconciliation and restructuring.
Accelerating debt treatments under the Common Framework is essential as bringing in a more diverse and complex group of creditors for negotiation has proven challenging. Measures to formalize the implementation process—such as a clear timeline for the different stages of the process, assessment of the parameters of the comparability of treatment, and transparent rules and procedures—could help reduce the time taken to provide debt relief. This could be complemented by other measures to increase the uptake of the framework, such as suspending debt service to official creditors for all applicants during the negotiations, and broadening the eligibility requirements to include other heavily indebted and vulnerable lower-middleincome countries. The Common Framework will also need a mechanism to encourage private sector participation. For instance, bringing commercial creditors into the negotiating from the beginning may help align the incentives of commercial creditors with those of government creditors and sovereign borrowers. Clarifying the methodology of how to assess different types of debt relief from private creditors would also help in assessing private sector comparability and encourage creditor participation. In the case of countries with unsustainable debt, creditors should aim for an outright debt reduction.39 The lack of a predictable, orderly, and rapid process of debt restructuring at the sovereign level is costly—and will limit recovery prospects and heighten uncertainty.40
AFRICA’S PULSE > 50
39 The evidence from past debt relief initiatives suggests that where debt is unsustainable, a successful resolution can only be achieved by comprehensive debt relief, including face value debt reductions (Nagle 2022; World Bank 2022). 40 World Bank (2022b).
Deepening structural reforms to foster inclusive growth
Weak investment growth adds to the macro-financial pressures weighing on economic activity in Sub-Saharan Africa. Structural reforms that bolster private investment should put a premium on boosting the long-term competitiveness of African businesses. In Sub-Saharan Africa, markets are often characterized by anticompetitive practices and structures—with monopolies, most of them owned by the government, holding large market shares in the key economic sectors of many countries. Countries in the region have much to gain from fostering competition.41 The policy agenda that enhances competitiveness includes42 (1) product market reforms that scale down structural and regulatory barriers to private sector participation in goods and services markets, (2) an effective competition policy framework comprising sound competition laws and an independently funded and staffed enforcement agency, (3) trade and FDI policies that improve foreign competition and enhance access to intermediate inputs, and (4) fiscal policies and procurement systems that support competition. These mutually reinforcing structural reforms as well as sound macroeconomic policies are needed to attract investment. Moreover, strengthening cooperation among national competition authorities is essential to address the anticompetitive practices of large firms amid rising regional trade and integration.
Public investment, an engine of growth for many countries in the region over the past decades, may remain lower in the foreseeable future for governments with severe fiscal constraints and restricted access to capital markets. The scarce fiscal resources then need to be allocated to high-quality investment projects with output and employment multiplier effects. Improving public investment efficiency in Sub-Saharan Africa involves strengthening the credibility of multiyear budgeting, the effectiveness of project appraisal and selection, among others. Additionally, fostering the transparency and surveillance of public investment projects includes improving procurement processes, enhancing data transparency (including the budget process), and conducting audits and independent diagnoses of the current public investment private management systems.
Finally, public policies to attract foreign investment and getting the most from it must address three important areas: infrastructure, institutions, and incentives. Expanding and upgrading the transportation system and ports, enhancing the reliability of and access to electricity, and fostering the efficient use of existing infrastructure are essential to boost economic integration in the region.43 Institutional reforms should include enhancing investment and export promotion agencies, border control authorities, and customs. Providing the right incentives to foreign investors involves maintaining competitive real exchange rates; regulatory frameworks that foster transparency, competition, and innovation; and trade policies that are designed to reduce anti-export bias. Getting the most from foreign investment flows entails improving backbone network services and financial services to advance growth in industry, and the creation of local content units—especially in the case of extractives.
AFRICA’S PULSE > 51
41 Recent evidence shows that raising competition in Sub-Saharan Africa to levels corresponding to the top quartile of the global institutions is associated with a one percentage point increase in the growth rate of real GDP per capita—achieved primarily through greater export competitiveness and productivity growth (Cherif et al. 2020). 42 IMF (2019), Cherif et al. (2020). 43 Qiang et al. (2021).
Leveraging resource wealth during the low carbon transition
The untapped resource potential of resource abundant countries in the region provides an additional pathway to address existing fiscal challenges and support the economic recovery. This includes tax policies that optimize the value captured from the extractives sector while providing a stable fiscal environment, improved management of the commodity price boom-bust cycle, and policies designed toward asset portfolio diversification—thus fostering investment in human and physical capital, alongside the protection of renewable natural capital. The following policies would support these efforts.
Maximize the value captured from both fossil fuels and mining. Resource-rich countries can harness a greater share of value from their resources for development. Resource rents are estimated to account for 9 percent of resource-rich Sub-Saharan Africa’s GDP. However, this figure far exceeds the revenues captured by governments, with rents on average 2.6 times higher than the government’s take. This finding implies that countries may fail to capture their full share of the rents. More can be done in the following areas: (1) taxing the sector effectively to capture a greater share of rents without deterring sufficient investment, and (2) investing these revenues in the economy, to accumulate productive capital in the form of infrastructure, an educated workforce, and a healthy, productive environment, including land, water, and forests. Countries like Zambia have been able to increase mining investment while also pursuing policies that improve the capture of revenues for the government. Finally, countries can promote new investment to capture upside potential from new discoveries and exploration, by supporting clear and consistent approaches to sector policies—including fiscal terms that do not require cyclical revisions but capture a share of revenues in both high- and low-price conditions.
Manage the boom-bust cycle, learning the lessons from previous cycles. Policy makers should beware of the “presource” curse. Countries need to be mindful of policies that are consistent with managing expectations and ensuring fiscal sustainability. Avoiding the presource curse, where countries can find themselves in debt distress or facing low growth even before the production of resources begins, means tempering the pressure to borrow and spend ahead of revenues.
Improve the economic sustainability of the economy, using revenues from the resource sector. To move from negative to positive adjusted net savings, governments need to invest in human capital, including education and health; produced capital, particularly infrastructure; and natural capital such as forests, cropland, and nature-based tourism. Revenues generated from the mining and petroleum sectors can be used to finance these forms of capital. Disclosure of resource-backed loans should be increased to improve value for money and protect countries. The Democratic Republic of Congo, for example, has published contracts involving resourcebacked loans between its state-owned mining companies and a consortium of Chinese companies and with a large commodity trader. To encourage more progress, countries can put in place legal requirements for disclosure of loan contracts.
Prepare for the future, including via investing in asset diversification. Due to pressure from the Dutch disease, policy makers in resource-rich countries may have more success working toward asset diversification rather than export diversification. The Changing Wealth of Nations 2021 report suggests that targeting asset portfolio diversification—investing in the expansion of human and physical capital—instead of export diversification may be a successful policy for sustainable
AFRICA’S PULSE > 52
economic growth.44 Countries should support the transition to automation and mechanization. Given the expected decline in mining jobs resulting from mechanization, identifying new ways to increase employment opportunities is critical. Transferable skills and value chains that are not carbon-linked will be important. Therefore, government support should avoid favoring fossil fuel sectors via subsidies—or under-taxation—and instead promote broad-based skill development, linkage development, and value addition.
Use the AfCFTA to build regional value chains. The resource wealth in Sub-Saharan Africa can play an important role in driving the creation of (more, better, and inclusive) jobs and economic transformation by building value chains in the context of the AfCFTA, and providing additional sources of energy and investments to foster universal access to reliable and affordable electricity.
Work toward tariff harmonization and reduction of non-tariff barriers. In the short term, no new tariffs should be erected. In the medium term, countries should jointly harmonize mining taxes and royalties. Tax harmonization has three components: an equalization of tax rates, a common definition of national tax bases, and uniform application of agreed-on rules. The lack of a harmonized tax policy can undermine regional integration, even with the establishment of a customs union, a common market, and a monetary union.45 A powerful first step would be creating a common floor rate. Implementation of harmonized tariffs and regulations requires data and strong institutions that have coordination and enforcement capabilities. Establishing and regularly updating an online tax database that provides comprehensive data on national tax structures can be useful for understanding disparities. It would also offer a source of accountability because it publicly identifies countries deviating from regional efforts.
Address policy impediments that inhibit intraregional trade. Shift from nationally defined export restrictions to a continental and regional approach. Stringent national export restrictions in Africa can make all the countries involved worse off. Not only can these restrictions adversely affect domestic mining production by deterring investment, but also, they affect other sectors, including transportation and logistics, services, and construction. This can impede countries’ ability to establish regional value chains, where some degree of regional specialization and comparative advantage may unlock new opportunities that a national approach cannot achieve. In the medium term, countries may be better able to utilize regional or continental export restrictions, meaning that restrictions are not imposed on exports to other countries within the regional economic community or African Union region, but are in effect restrictions on exports moved outside the region, consistent with the goals of the AfCFTA. Easing infrastructure constraints, including in transportation and power, can support the development of regional value chains.
Replace local content policies with continental and regional (regional economic community) approaches to content policies instead of nationally defined targets and approaches. Many African countries have skills shortages and limited capacity to produce or access key inputs when working at the national level. Regional content policies can reduce the burden of ongoing constraints by enabling countries to access a larger pool of skilled labor and requisite inputs. Firms operating in the region can implement training programs and capacity building for micro, small, and medium-size enterprises in parallel with regional sourcing.
AFRICA’S PULSE > 53
44 World Bank (2021a). 45 IMF (2015a).
Tap into energy resources to improve access to energy in Sub-Saharan Africa. Africa faces a significant challenge to meet its universal, high-quality energy access goals. In 2022, 600 million people in Africa, or 43 percent of the continent, lacked access to electricity. However, Africa’s resource base and associated investments could help accelerate progress toward the goals by developing diverse energy sources.
Invest in domestic energy access, attracting investment to domestic gas supply to promote domestic energy access and boost export revenues. Develop and maintain stable investment policies to leverage domestic gas supplies for export revenue and domestic consumption. Exploiting natural gas reserves requires substantial investments. Given the capital-intensive and long-term nature of these investments, countries must develop and maintain clear and consistent fiscal policies that support exports and domestic consumption, alongside capturing the full value of the resource.
Utilize fiscal revenue from, and investments in, the mining, oil, and gas sectors to support universal energy access . Fiscal revenues generated from the extractive sector are critical to bridge the financing gap for renewable energy. In 2018, the International Energy Agency estimated that Sub-Saharan African countries would require US$28 billion per year until 2030 to attain universal access to electricity. This would include US$13 billion for mini-grids, US$7.5 billion for grid, and US$6.5 billion for off-grid investments. Given the high levels of debt distress across the region, countries should focus on leveraging fiscal revenue from the extractive sector rather than relying on external debt, much of which has become inaccessible or expensive amid sovereign downgrades.
AFRICA’S PULSE > 54
Section 2: Natural Resource Abundance, the Low Carbon Transition, and Improving Energy Access in Africa
2.1 MOTIVATION
The global low carbon transition has begun. Although it could take decades to phase out the oil, gas, and coal markets at the global level, the transition period poses significant uncertainty and risks for fossil fuel and mineral exporters in Africa. Countries rich in carbon-based resources, such as oil, gas, and coal, face the looming prospect falling demand and potentially sustained lower prices. Estimates suggest that 80 percent of proven fossil fuel reserves must remain under the ground to meet the carbon reduction targets agreed in Paris (Bos and Gupta 2019), not accounting for the significant undiscovered reserves. Meanwhile, demand for many metals and minerals could rise dramatically in the coming years to supply the low-carbon economy. The low carbon transition is likely to create demand for 3 million tons of minerals and metals needed to deploy solar, wind, and geothermal energy by 2050 (World Bank 2020). Many of these minerals are found in abundance across Africa. Countries such as the Democratic Republic of Congo, South Africa, and Zambia are already key players in the low carbon transition, being major producers of cobalt, copper, and platinum. For such countries that are rich in metals and minerals, the longer term prospects may be better than for the fossil fuel producers.46 This section examines Africa’s natural resource opportunity and the steps policy makers should consider taking to harness the economic potential from oil, gas, and mineral resources during the low carbon transition. The analysis draws from a forthcoming coming report from the World Bank, titled “Africa’s Resource Future” (Cust and Zeufack 2023).
Despite the significant opportunity, natural resource wealth also poses challenges that countries have struggled with even before the low carbon transition began to accelerate. Following the decline in commodity prices from 2015, and the more recent COVID-19 pandemic, countries have accumulated high levels of external debt, thereby reducing their fiscal capacity to finance core development objectives. Therefore, natural resources remain a critical source of fiscal revenue, even though demand and prices can be volatile and uncertain.
Nonetheless, the region has significant untapped resource potential, both known and being discovered each year. The past two decades have seen major new discoveries concentrated in Sub-Saharan Africa, particularly in oil and gas. This means that the region’s subsoil wealth has risen since the turn of the millennium, with many potential projects still under development or yet to see investment. Because the region remains relatively underexplored compared with other parts of the world, countries do not yet have a complete picture of their subsoil assets.
The fiscal revenues available from resource extraction can create the fiscal space needed to invest in human capital and produced capital, and for policies to improve resilience and help reduce poverty. Metal and mineral prices have remained robust, and oil and gas prices have reached pre-2014 levels again, presenting an opportunity to help finance ways to meet these challenges. However, countries can do better in terms of capturing the full value of their resource wealth. Improvements in governance and investments in fiscal capabilities can improve revenue
AFRICA’S PULSE > 55
46 See, for example, IEA (2021).
capture. Higher levels of revenues for the government could also help redress the environmental externalities from extraction, in particular the implicit carbon production subsidy that arises if countries under-tax oil and gas extraction.
There exist major opportunities for promoting regional value chains, particularly those that leverage the metals and minerals needed for the low carbon transition. In addition to the valuable fiscal revenues they generate, the output from mining can be used as an input to industrial production generating jobs, increase trade linkages, and spur economic transformation. However, tapping into these opportunities will require a more regional approach to value addition, given the small size of many countries in the region. Regional integration, improvements in national and regional infrastructure, and harmonization of regional trade will allow for the development of regional value chains that can better tap into comparative advantages, clustering of activities, and scale economies associated with larger markets.
Increasing the revenues from natural resource extraction also plays an important role in improving access to electricity across the continent, given low levels of private investment. In 2022, 590 million people in Sub-Saharan Africa lacked access to electricity. Drastic measures will need to be undertaken to achieve universal access to electricity, as Africa’s rapidly growing population is outpacing growth in electricity generation. Achieving universal access will require building up diverse energy sources, expanding both grid and off-grid infrastructure, strengthening regional power pools, and attracting renewable energy investments across the continent, rather than in a select few countries as has been the trend. Further, countries will also need to do more to strengthen regulatory frameworks and implement key reforms to improve utility performance and financial viability of the sector to help attract renewable energy investments.
Africa is well-endowed with the commodities required to build renewable energy for domestic energy access and to accelerate the low carbon transition. For example, Zimbabwe has one of the 10 largest reserves of lithium in the world, and other countries, such as Namibia, have started building lithium mines. South Africa is the world’s largest producers of manganese; the Democratic Republic of Congo is home to nearly 70 percent of the global supply of the cobalt used in lithium-ion batteries; and Madagascar, Mozambique, and Tanzania are among the 10 countries with the largest graphite deposits (IEA 2022a). Leveraging the African Continental Free Trade Area (AfCFTA) can enable countries, most of which face infrastructure and capital constraints, among others, to build regional clean energy value chains.
A just transition for Africa will depend on successfully harnessing the economic benefits from oil and mineral resources through good governance and sound macro-fiscal management of resource revenues, while also preparing for a low-carbon future. Given the extent of natural resource abundance, this wealth can play a central role in economic transformation for Africa’s economic future.
AFRICA’S PULSE > 56
2.2 NATURAL RESOURCES: INSIGHTS AND STYLIZED FACTS
The extractive sector is a critical part of Sub-Saharan Africa’s economy, in terms of both revenue and exports. Minerals, oil, and gas account for a third or more of exports from most countries in Sub-Saharan Africa, and they can reach similar shares of government revenues. Today there are markedly more resource-rich countries in Sub-Saharan Africa than there were at the turn of the twenty-first century, and the number is trending even higher because of new discoveries every year. By one definition (IMF 2012), the number of resource-rich countries rose from 18 of 48 before the most recent commodity price boom from 2004, to 26 of 48 countries by the end of the boom in 2015 (map 2.1). This means that the majority of countries in Sub-Saharan Africa can be categorized as resource rich, with more on the path to reaching this status given two decades of major new discoveries. This trend was caused by a combination of new discoveries, new production, and rising resource prices that pushed up levels of resource abundance and resource dependence and pulled more countries into this resource-rich grouping.
Sub-Saharan Africa has large reserves of resources such as oil, gas, and minerals, but the region has struggled to convert this wealth into sustainable prosperity. During the last commodity price boom, from 2004 to 2014, economic growth accelerated to record highs in the region’s resource-rich countries. But this prosperity proved to be precarious and dependent on high commodity prices, and few African countries shifted from being resource-driven economies during this period. Since the decline in commodity prices in 2014, resource-rich Sub-Saharan Africa has grown more slowly than the region’s average growth rate, which is consistent with the “resource curse” hypothesis (figure 2.1).
The previous boom and bust in commodity prices in SubSaharan Africa resulted in missed opportunities for the region’s resource-rich countries to convert their resource revenues into sustainable, diversified prosperity. This has led to slower economic growth and disappointing progress on poverty reduction. By 2030, it is projected that more
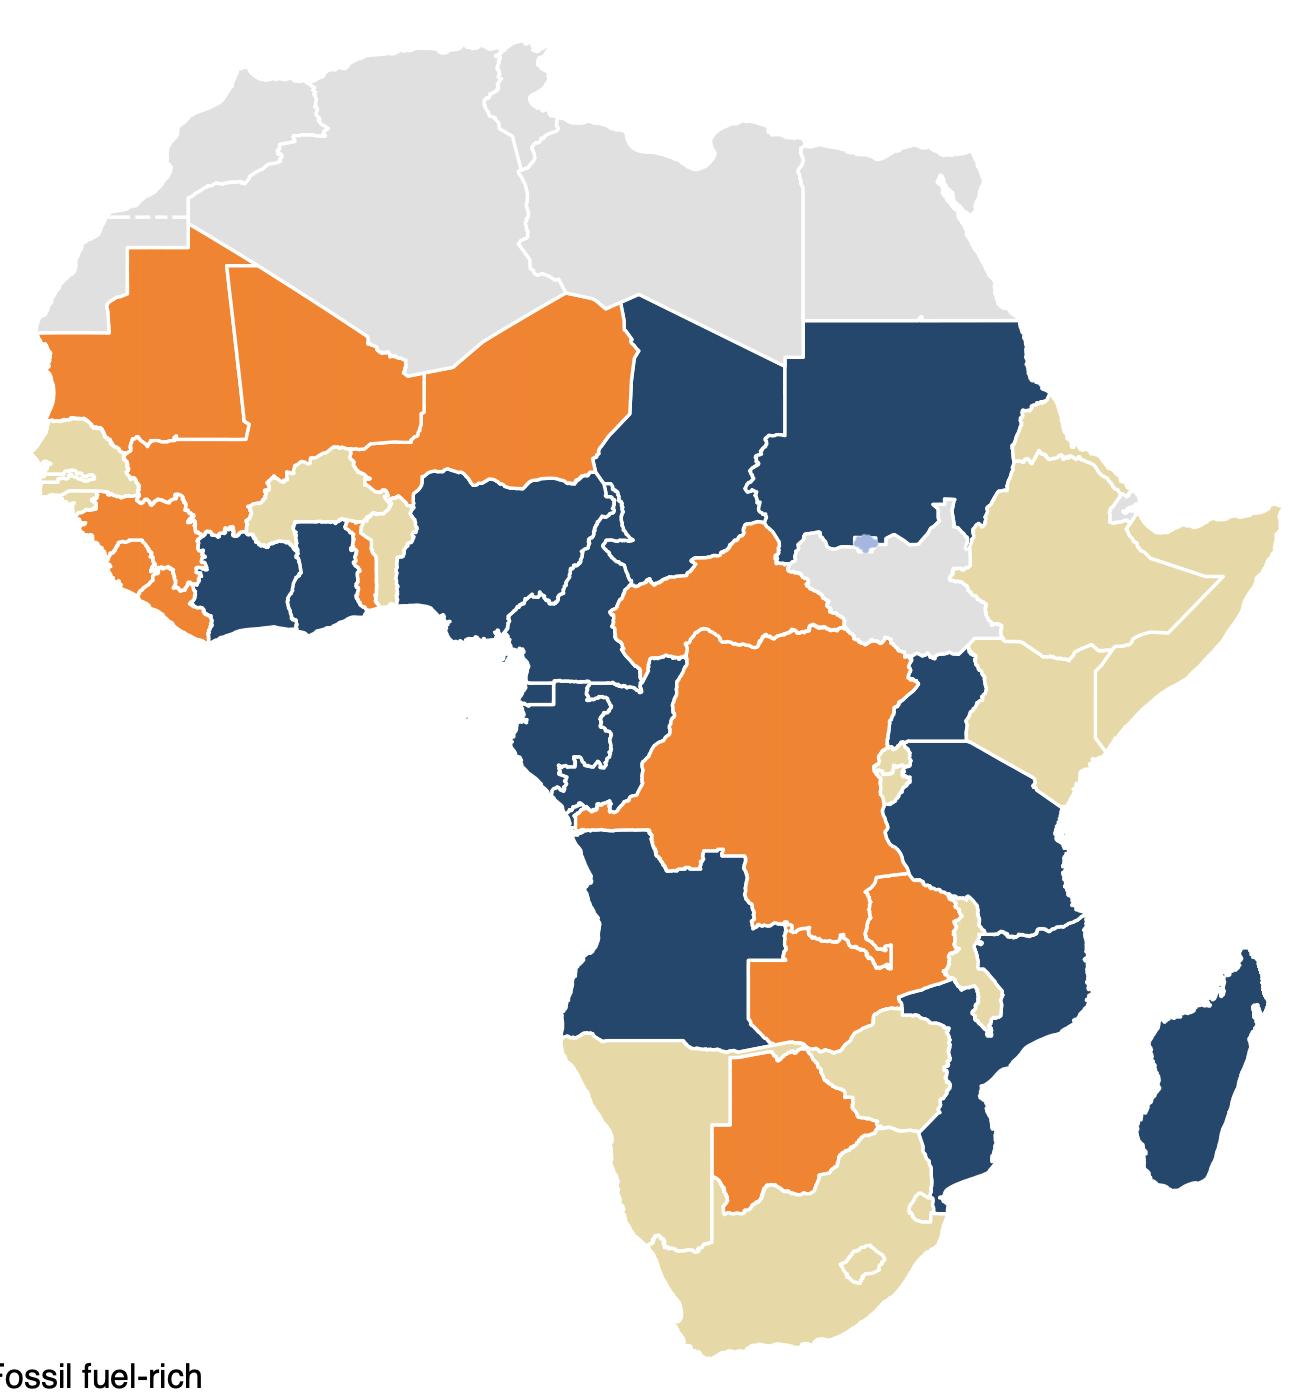
Fossil fuel-rich
Mineral-rich
Non-resource-rich
North Africa and South Sudan
Source: Based on IMF 2012.
Note: Resource-rich countries are defined in IMF (2012) as low-income, middle-income, or upper-middle-income countries that had natural resource revenue or exports earning at least 20 percent of total fiscal revenue or export earnings over 2006–10, including countries with identified reserves but where production has not begun or has not reached significant levels. Countries where the main type of natural resource is oil or gas are in blue. Countries where the main type of natural resource is minerals and metals are in orange. South Sudan is not included in the IMF (2012) resource-rich country classification.
AFRICA’S PULSE > 57
MAP 2.1: Resource-Rich Countries in Sub-Saharan Africa during the Commodity Price Boom Twenty-six of 48 countries in the region are classified as resource rich.
Growth has fallen in resource-rich countries since the end of the commodity price boom in 2015, and these countries continue to grow more slowly than non-resource-rich countries.
than 80 percent of the world’s poor will be in the Africa region, and almost 75 percent of the world’s poor will live in resourcerich countries. As a result, global poverty eradication is becoming disproportionately a challenge faced mostly by resource-rich countries in Sub-Saharan Africa (figure 2.2).
By 2030, it is projected that 80 percent of the world’s population in extreme poverty will be living in Sub-Saharan Africa, mostly in resourcerich countries.
Source: Based on Word Bank data 2022.
Note: GDP per capita growth is by group. Pre-boom = 1998–2003; boom = 2004–14; post-boom = 2015–18. GDP = gross domestic product; Rest of the world = RR countries outside Sub-Saharan Africa that meet the same threshold for resource richness; RR = resource-rich countries; SSA = Sub-Saharan Africa.
Note:
data were filled using linear interpolation with the available data. RR = resource rich; SSA= Sub-Saharan Africa.
Despite abundance in subsoil assets, harnessing them for sustainable development means production should not come at the cost of other forms of natural capital like forests, cropland, and biodiverse ecosystems. Unfortunately, environmental degradation has accelerated more in resource-rich countries and could get worse. The depletion of natural resources in SubSaharan Africa increased by approximately 150 percent during the boom, and in the region’s resource-rich countries, depletion of natural resources increased by more than 190 percent. Total forest area fell by 2 percent, declining from an area of about 6.9 million square kilometers in 2004 to 6.5 million square kilometers in 2014. Nonetheless, Sub-Saharan African countries’ per capita contribution to global climate change remains the smallest of any region. African governments can take steps to leverage global decarbonization, to accelerate the diversification of their economies, build resilience to external shocks, and anticipate the eventual decline in fossil fuel markets.
AFRICA’S PULSE > 58
Source: Cust, Rivera-Ballesteros, and Zeufack 2022.
The figure shows the number of people living on less than US$1.90 a day. Projected data start after 2020, and missing historical poverty
FIGURE 2.1: Average GDP Growth per Capita, by Resource Type
FIGURE 2.2: Total Poverty Headcount in Resource-Rich and Non-Resource-Rich Sub-Saharan Africa
Percent -1 0 1 2 3 4 5 SSA RR SSA
1998–2003
0 50 100 150 200 250 300 350 400 1995 2000 2005 2010 2015 2020 2025 2030 Millions SSA RR SSA non-RR
non-RR Rest of the world RR
2004–14 2015–20
A key tenet driving economic sustainability from resource wealth is to use the opportunity created by a boom to promote a more diversified economy. Although many countries actively pursued diversification strategies during their respective resource booms, the record of success is poor. For example, Chad and Sudan saw increased export concentration, while Tanzania and Uganda were able to diversify exports.
Despite being relatively underexplored, SubSaharan Africa boasts a majority of reserves in key commodities. In 2021, the mining exploration budget in Sub-Saharan Africa was the second lowest in the world (figure 2.3)—roughly half that of Latin America, Australia, and Canada—although the region has triple the surface area of Canada and Australia. In 2021, on a yearly basis, Canada’s exploration budget rose by 62 percent, followed by 39 percent in Australia, 37 percent in the United States, and 29 percent in Latin America. The budget for Africa grew only 12 percent, and the vast majority of exploration continues to be concentrated in gold, rather than green metals that are critical for the clean energy transition (Baskaran 2022). Still, the African continent boasts a large proportion of the world’s mineral resources, including precious platinum group elements (59 percent of total world resources) and diamonds (48 percent); a dominant position in ferroalloy metals such as cobalt (75 percent), manganese (68 percent), and graphite (59 percent); and undeveloped lithium resources (Guj et al., forthcoming). There exist significant opportunities to improve the knowledge of African economies’ geology, and international cooperation can help support these investments.
AFRICA’S PULSE > 59
Source: S&P Global Market Intelligence 2022.
FIGURE 2.3: Mining Exploration Budget, by Region, 1997–2021 African countries continue to lag in mining exploration spending, despite that the region is relatively underexplored with untapped potential.
0 1,000 2,000 3,000 4,000 5,000 6,000 US$, millions 1997 1999 2001 2003 2005 2007 2009 2011 2013 2015 2017 2019 2021
Latin America Canada Australia Rest of World United States Africa Paci c
Commodities for the Clean Energy Transition
Sub-Saharan Africa is richly endowed with resources that are critical for the clean energy transition. The transition from fossil fuels to clean energy is likely to create demand for 3 billion tons of the minerals and metals needed to deploy solar, wind, and geothermal energy by 2050 (World Bank 2020). The low-carbon energy transition will increase demand for many of the resources found in abundance across the region. Africa is home to nearly all the resources that are critical for a range of clean energy technology. It has particularly large shares of cobalt, manganese, and platinum. As figure 2.4 shows, new discoveries have drastically increased Africa’s reserves of cobalt and manganese. The continent also has over 75 percent of the world’s platinum and chromium. Africa exports nearly all the world’s cobalt (figure 2.5), which is the only commodity used for every form of energy highlighted in table 2.1.
The AfCFTA is a key avenue for building clean energy value chains regionally. It brings together 54 African countries with a total population of more than 1 billion people and a combined gross domestic product (GDP) of more than US$3.4 trillion (World Bank 2020). The AfCFTA offers an unprecedented opportunity to develop the mine-to-market value chain within the continent. The entire value chain—
AFRICA’S PULSE > 60
Wind Solar photovoltaic Concentrated solar power Hydro Geothermal Energy storage Nuclear Gas Carbon capture and storage Cobalt Raw copper Raw aluminum Chromium ore Graphite Manganese Raw nickel Zinc ore Titanium ore Lithium Source: World Bank 2017.
TABLE 2.1: Minerals and Metals Required for Various Clean Energy Technologies
Note: Green cells indicate an important role for these minerals and metals in each low-carbon technology.
Source: World Bank 2023. Note: Reserve estimates do not include reserves depletion. b = billion; m = million.
New discoveries and continued explora-
are expanding the known reserves of critical metals and minerals. 90 100 110 120 130 140 2014 2015 2016 2017 2018 2019 2020 2021 2022 Indexed reserves (2014=100) Cobalt
2.7b tonnes 15.6m tonnes 230m tonnes
FIGURE 2.4: Estimates of Selected Metal and Mineral Reserves in Sub-Saharan Africa, 2014–22
tion
Copper Manganese
from the manufacturing of intermediate inputs such as machinery (backward linkages), to the actual extraction of minerals, to the processing phase (forward linkages)—can rarely be provided by a single country because of skills, infrastructure, and capital constraints, among others. Although many countries have prioritized local beneficiation, few have the capacity to undertake it domestically. Further, regional markets would allow greater leveraging of regional comparative advantages and scale economies associated with larger markets. If implemented effectively, the AfCFTA would allow various countries within the continent to specialize in a select part of the value chain and move the parts of the value chain between participating countries free of tariffs, enabling the entire value chain to come together competitively within Africa.
Given the resource endowments within the region, many renewable energy technologies could be produced in part or in full Africa, if the AfCFTA is leveraged. Box 2.1 describes how recent mining reforms in Zambia are already leading to improved investment and revenues. This example underscores both the importance of improving governance to strength African mineral countries’ potential supply responsiveness to capitalize on the low carbon transition, but also the amount of scope governments have to change outcomes, where political will is present to do so. However, Zambia has also taken a regional approach, agreeing on a memorandum of understanding on battery minerals and value chains with the Democratic Republic of Congo and the United States. This could unlock even greater value if implemented, by combining the opportunities available to both Zambia and the Democratic Republic of Congo, while leveraging capital and technology from countries such as the United States. Success will likely depend on additional factors, including the costs of finance, the skill base for high-technology industries, and the ability to leverage regional capabilities that may not exist in Zambia and the Democratic Republic of Congo.
AFRICA’S PULSE > 61
Source: World Bank 2023.
0 10 20 30 40 50 60 70 80 90 100 0 .2 .4 .6 .8 1.0 1.2 1.4 1995 1996 1997 1998 1999 2000 2001 2002 2003 2004 2005 2006 2007 2008 2009 2010 2011 2012 2013 2014 2015 2016 2017 2018
FIGURE 2.5: Sub-Saharan Africa’s Share of Cobalt Trade Africa’s share of the global cobalt supply has grown in recent years.
Cobalt ores (left scale) Cobalt metal (left scale)
% of Total World Trade in Cobalt % of total SSA Trade in Cobalt
Cobalt ores (right scale) Cobalt metal (right scale)
BOX 2.1: Mining Reforms in Zambia Have Driven Improving Investment and Revenues
The election of the new government in 2021 led to a series of reforms around Zambian mining that have begun to yield some successes in attracting inward investment and expanding production. Government revenues from mining are also on the rise.
· The government has reviewed the mining tax framework to develop a stable and competitive mining policy environment, to scale up investment and production (Fitch Solutions 2021). Previous reforms had seen royalty changes more often than every two years for nearly two decades.
· The government committed to expanding Zambia’s copper production over the next decade from 800,000 to 3 million tonnes per year.
· Within two months of taking office, the new administration ended double taxation by making mining royalties tax deductible.
· The tax regime was adjusted, and royalties were reduced to more competitive levels.
· The country made a marked shift toward regional cooperation when it signed a memorandum of understanding agreement with the Democratic Republic of Congo and the United States to leverage the resources found in both African countries to manufacture electric batteries.
Within a short span of time, Zambia has begun to turn around a downward trend in investment sentiment within the mining sector. First Quantum Minerals announced a US$1.3 billion investment to build a nickel mine and scale up copper production in Zambia (Business Day 2022). Anglo American has returned to Zambia after two decades, with a 70 percent joint venture with Arc Minerals, which will have the right to explore Zambia’s copper-rich North-Western province (Reid 2022a). Barrick Gold has scaled up exploration, with chief executive officer Mark Bristow noting that the new mineral royalty tax regime that came into effect this year will unlock additional free cash flow for the company. The additional cash flow could expand its Zambian Lumwana copper mine, thereby extending its life from 2042 to 2060 (Reuters 2022).
This begins to reverse the trend of previous policies that had appeared to deter investments. According to the Chamber of Mines, companies withheld more than US$650 million of investment in 2019 (Warwick 2019). Vedanta had previously shut down its Nchanga smelter, citing unprofitability as a result of the earlier imposed 5 percent import duty. Glencore shut down its Mopani operation and went on to sell it for $1 in cash. Challenges remain with mines such as Mopani, and the picture is still a mixed one despite early successes.
The country has since seen improving government revenues, including from the mining sector. Fiscal reforms, expanded mining investment, and buoyant global copper prices have boosted Zambia’s government revenues and export earnings. Mining continues to be an anchor for the Treasury and external accounts, contributing over 40 percent of all government revenue in 2022.
Insights from Zambia’s Efforts to Achieve a Turnaround
· Regional integration is now being promoted rather than nationally-defined policies. After the cooperation agreement was signed with the Democratic Republic of Congo, Bank of Zambia Governor Denny Kalyalya noted that the agreement would increase foreign exchange inflows in the long run. This would enable the country to pay its debt servicing costs and finance critical development objectives.
AFRICA’S PULSE > 62
· Regular revisions to fiscal policies deterred investment by creating uncertainty in the investment environment. Zambia has adopted a suite of instruments to bring investment and value addition back to the country. This includes fiscal instruments (eliminating double taxation and reducing royalty rates), regional cooperation agreements to incentivize investments across the value chain, and an investment climate that is now more welcoming of foreign investment.
· The government improved the enabling environment—and the private sector showed up. At the United States–Africa Leaders Summit, the Democratic Republic of Congo, Zambia, and the United States signed a memorandum of understanding on electric vehicle battery value chains, with a focus on the US private sector providing technical expertise and financing to build a mine-to-assembly line value chain in the Democratic Republic of Congo and Zambia. Shortly thereafter, a California-based exploration firm, KoBold Metals, which uses artificial intelligence and machine learning to identify battery metal deposits, announced a US$150 million investment to build a copper mine in Zambia. The firm will use artificial intelligence tools to process drilling data and optimize copper and cobalt exploration at the Mingomba mine, which has the potential to be a top-tier copper mine.
Much remains to be done, but the initial signs are positive. This underscores the opportunity African governments have to seize the mineral opportunity, particularly where there is political will for reform and an appetite for regional collaboration.
The recent agreement signed between Zambia, the Democratic Republic of Congo, and the United States to build a regional value chain by manufacturing electric batteries using the minerals found in both African countries presents an exciting new example of regional collaboration and marks a potential break from previously nationally focused approaches to value addition in the mining sector. The Democratic Republic of Congo produces over 70 percent of the world’s cobalt and Zambia is one of the world’s largest copper producers. By building a regional value chain, both countries strengthen their value addition and can support a just energy transition for workers and communities. (See also box 2.2 on South Africa’s Just Energy Transition Investment Plan.) The two African countries have partnered with the United States to leverage its technical expertise, financing, and commercial development (Burger 2023). Among other countries with resource endowments, more regional and continental value chains can be developed for clean energy technologies that can be deployed domestically and exported. Unfortunately, a range of tariff, non-tariff, and policy barriers continue to inhibit the development of Africa’s of regional value chains, such as overt export restrictions, including to neighboring countries, that directly contradict the spirit of the AfCFTA (map 2.2).
AFRICA’S PULSE > 63
BOX 2.1 Continued
Countries’ export restrictions on metals and minerals may hamper the development of continental and regional value chains.
MAP 2.2: Raw Mineral and Metal Export Restrictions in Sub-Saharan Africa, 2020
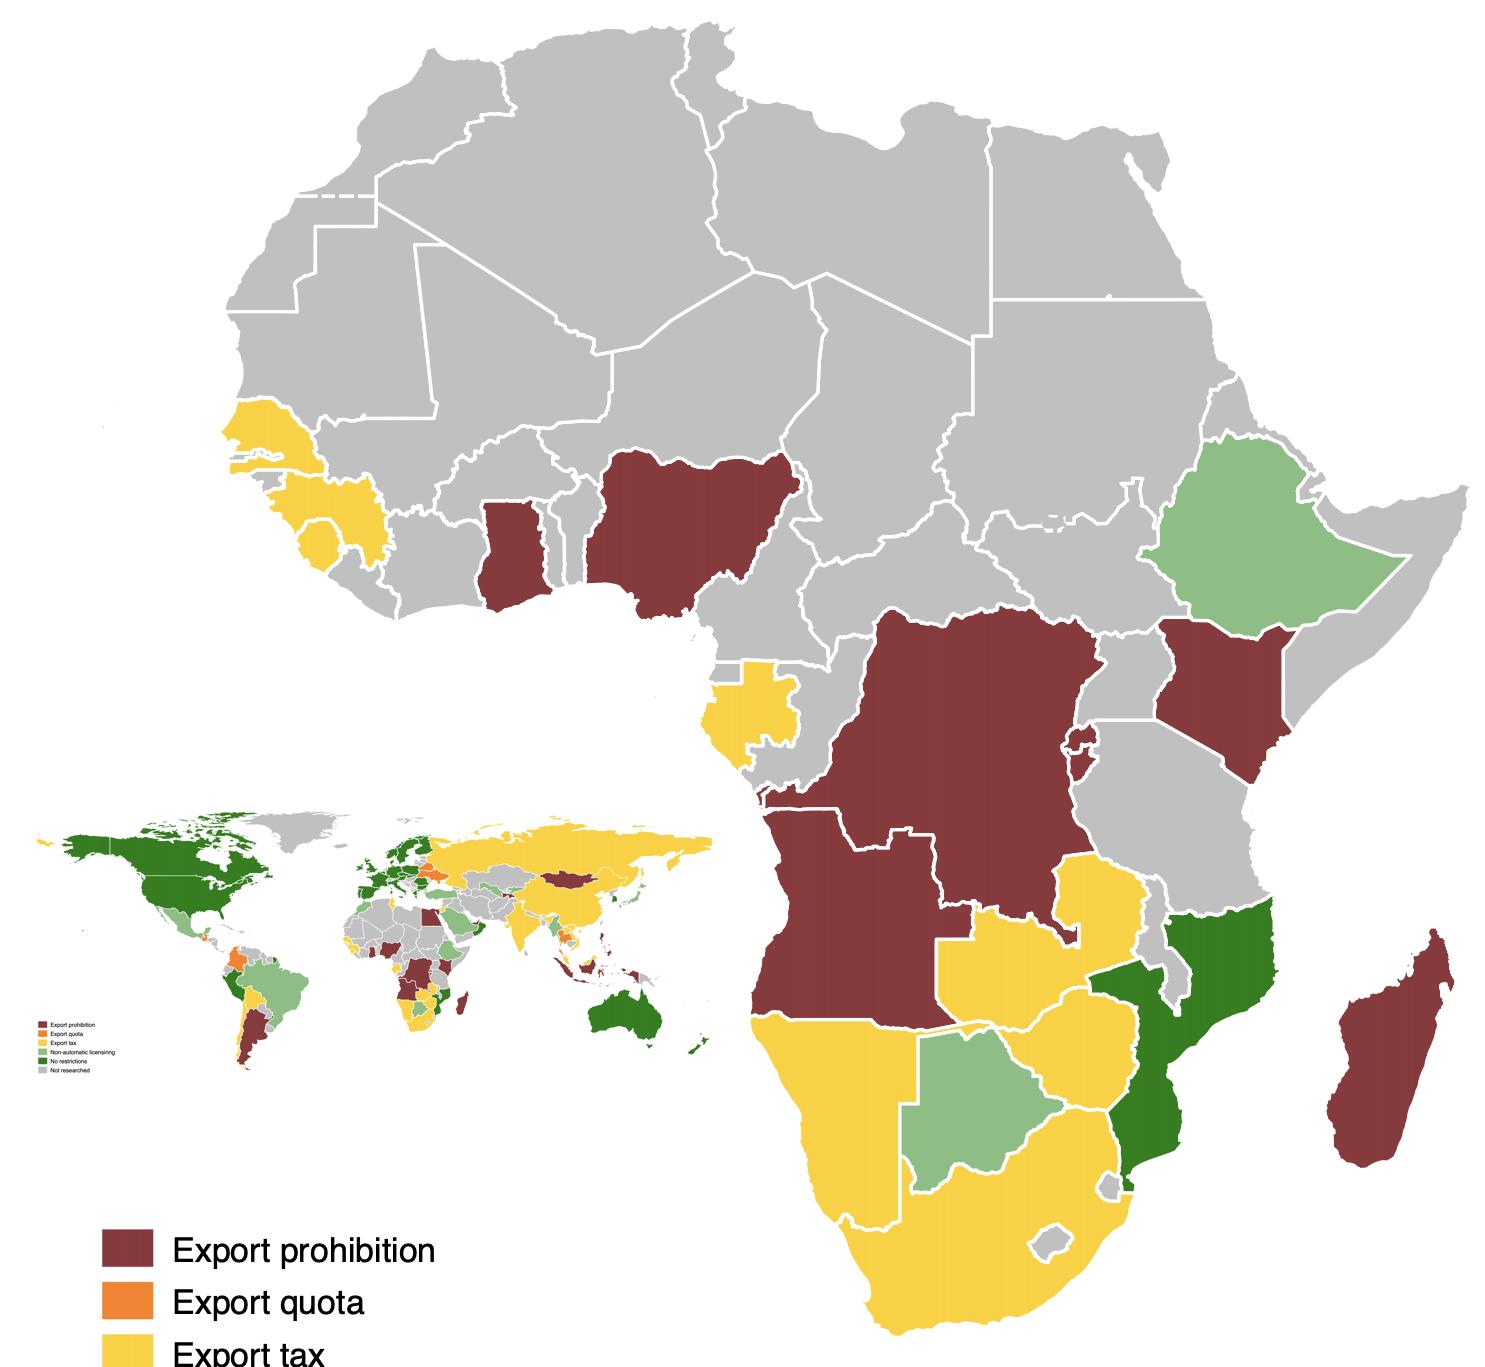
Export prohibition
Export quota
Export tax
Non-automatic licensing
No restrictions
Not researched
Fossil Fuels
Fossil fuel exporters face the bulk of the uncertainty, due to changing policies, consumer behavior, and technology trends. Similar to the private sector’s concern about “stranded assets,” countries could be left with undeveloped fossil fuel reserves, creating the risk of “stranded nations” (Cust, Manley, and Cecchinato 2017) (figure 2.6). The first challenge is that carbon wealth could decline in value as the world gradually decarbonizes, putting severe strains on carbon-rich countries’ finances (Malova and van der Ploeg 2017). This potential decline in value makes a number of countries highly vulnerable, particularly in the Middle East and North Africa, but also many countries in Sub-Saharan Africa. Additionally, carbon-rich nations in Africa cannot easily monetize their carbon wealth. Carbon-rich nations hold a lot of their wealth in the form
AFRICA’S PULSE > 64
Source: Based on Trade in Raw Materials Database, OECD 2020.
Note: Color coding is indicative of severity of the restrictions and not of the number of restrictions. Countries in gray have no data.
of fossil fuels, but to benefit people, this wealth needs to be extracted and sold. However, getting resources out of the ground is costly. These countries may find themselves facing a race to exit the fossil fuel market just as producers speed up extraction while prices decline.
Natural gas can play an important role for Africa— and the rest of the world—as a transition fuel as countries build up their renewable energy capacity. Africa is home to 13 percent of the world’s known natural gas reserves and 40 percent of the world’s natural gas discoveries between 2010 and 2020. These included discoveries in Mozambique and Tanzania in the early 2010s, the Arab Republic of Egypt in 2015, Senegal and Mauritania in the late 2010s, and South Africa, where natural gas was discovered off the southern coast in 2020 (figure 2.7). These discoveries contributed to the 20 percent increase in natural gas production during the 2010s. Upwards of 5,000 billion cubic meters of natural gas has been discovered—but not approved for development—on the continent. This could produce an additional 90 billion cubic meters per year until 2030, up to two-thirds of which the International Energy Agency (IEA) estimates could eventually be used for domestic needs, and the remainder for export. The use of natural gas in Africa would keep its contribution to carbon emissions at fewer than 10 gigatons over the next 10 years, and, if added to existing emission levels, it would amount to 3.5 percent of total emissions (IEA 2022a).
Petroleum reserves have been growing in the region, following two decades of major discoveries.
Natural gas discoveries across Africa have led to decisions about significant new investment.
AFRICA’S PULSE > 65
Source: World Bank 2023.
Source: IEA 2022a.
Note: FID = final investment decision; FLNG = floating natural gas; GTA = Greater Tortue Ahmeyim; LNG = liquefied natural gas; Mtpa = million tonnes per annum; tcm = trillion cubic meters.
FIGURE 2.6: Estimated Oil and Gas Reserves in Sub-Saharan Africa
FIGURE 2.7: Natural Gas Discoveries and Final Investment Decisions
0 50 100 150 200 250 300 350 400 0 10 20 30 40 50 60 70 1980 1982 1984 1986 1988 1990 1992 1994 1996 1998 2000 2002 2004 2006 2008 2010 2012 2014 2016 2018 Terajoules of gas (millions) Barrels of oil (billions)
Oil (left scale) Natural gas (right scale)
Coral South FLNG (Mozambique)
Hilli Episeye FLNG (Cameroon)
Mozambique LNG
Nigerian Train 7
GTA
FLNGH (Senegal and Mauritania)
Senegal
Nigeria Rest
2014 2015 2016 2017 2018 2019 2020 2012 2011 2013 0 5 10 25 15 20 0 3 6 15 9 12 tcm Mtpa
Tanzania Mozambique Egypt, Arab Rep. LNG FID (right axis)
and Mauritania
of Africa South Africa
Major gas discoveries in the 2010s triggered a series of investment decisions for export-driven LNG projects
Even under lowcarbon sustainable energy scenarios, natural gas plays an important transition role in Africa’s energy mix.
Both natural gas and renewable energy will likely be important to help African countries achieve universal energy access. The IEA (2022a) models a Sustainable Africa Scenario (figure 2.8), under which all of Africa’s energy‐related development goals are achieved, including universal access to modern energy services by 2030 in parallel with the full implementation African climate pledges. In this scenario, Africa’s electricity demand increases by 75 percent to 2030. The scenario contains the following considerations and parameters:
· Natural gas production continues to increase in the near term, reflecting a series of major discoveries in the 2010s.
· Renewables, mainly solar photovoltaic, account for the majority of new capacity additions due to ever‐declining costs driven by rapid global uptake. By 2030, solar and wind together provide 27 percent of power generation, eight times more than today.
· Once plants that are currently under construction are completed, Africa builds no other coal‐fired power stations.
Under the IEA modeling, universal access to energy includes a mix of fossil fuels and renewable energy. Over the next decade, the share of renewable energy in the mix increases significantly, but there remains an important role for natural gas as a transition fuel. This also is likely to be seen in other regions of the world, implying an important role for both domestic consumption and the export of natural gas from African economies.
At the United Nations Climate Change Conference (COP26) in Glasgow, a group of wealthy countries pledged US$8.5 billion to support South Africa’s decarbonization commitments, while promoting sustainable development and minimizing the consequences for workers and communities. South Africa’s economy is nearly twice as carbon intensive as that of the average Group of Twenty country and the 14th largest global greenhouse gas emitter.
Coal has been a mainstay of South Africa’s economy:
· South Africa is the seventh largest coal producer and fourth biggest exporter. This has been a critical source of revenue for the country, given rising coal prices (figure B2.2.1).
· The country derives 70 percent of its domestic energy from coal.
· In 2019/20, coal mining firms paid out R 2.1 billion in royalties.
AFRICA’S PULSE > 66
BOX 2.2: South Africa’s Just Transition Partnership
Source: IEA 2022a.
Note: Values are gigawatts (GW) of installed capacity.
FIGURE 2.8: Power Generation Capacity Additions in Africa in the Sustainable Africa Scenario, 2011–30
0 50 100 150 200 350 300 Fossil fuels 2011–2020 2021–2030 Renewables GW
· Employment in the coal sector has increased sharpy, from 78,580 workers in 2011 to 92,670 in 2021, indicating a growth rate of 17.9 percent (other economically significant commodities, notably gold and platinum group metals, saw an employment reduction during that timeframe).
· The household income generated through earnings from employment in the coal sector has more than doubled over the past decade (figure B2.2.2).
Despite coal’s large contribution to domestic energy consumption, energy security remains poor due to poor infrastructure. In 2021, as the country began its journey to recovery from the pandemic, load-shedding increased by 38 percent, with more than 2,400 hours shed. This amounts to 1,136 hours of power outages, or three hours per day for an entire calendar year. This suggests that despite having 53.2 billion tonnes of coal reserves, the country has failed to provide an adequate supply of domestic energy.
Still, given its fragile socioeconomic situation, and coal’s important contribution to domestic energy, community development, employment, and household incomes, South Africa’s transition to a low-carbon economy is a heavily contested policy space. In November 2022, at COP27, South Africa announced its Just Energy Transition Investment Plan. The US$8.5 billion will be used for coal plant de-commissioning, funding alternative employment in coal mining areas, and investments that will facilitate accelerated deployment of renewable energy and investments in new sectors of the green economy. South Africa is a “prototype” to see if this financing and partnership model can effectively support carbon-intensive developing countries as they decarbonize.
Sources: Minerals Council South Africa (2022); World Bank (2022a).
AFRICA’S PULSE > 67
BOX 2.2 Continued Employee earnings (R’000) Employment (number) 70,000 75,000 80,000 85,000 90,000 95,000 100,000 14,000 16,000 18,000 20,000 22,000 24,000 26,000 28,000 30,000 32,000 34,000 2011 2012 2013 2014 2015 2016 2017 2018 2019 2020 2021 Employment earnings (rand) in coal Total employment in coal ( rhs) Jan-13 May-13 Sep-13 Jan-14 May-14 Sep-14 Jan-15 May-15 Sep-15 Jan-16 May-16 Sep-16 Jan-17 May-17 Sep-17 Jan-18 May-18 Sep-18 Jan-19 May-19 Sep-19 Jan-20 May-20 Sep-20 Jan-21 May-21 Rand index (2007 = 100) Rand index, gold (2007 = 100) 790 690 590 490 390 290 190 90 430 380 330 280 230 180 130 80 30 Iron ore Platinum Coal Gold Source: World Bank 2022.
Minerals Council South Africa 2022.
Source:
FIGURE B2.2.1: Price Paths of Commodities, 2013–21
between 2010 and 2020
FIGURE B2.2.2: Coal’s Contribution to Earnings and Employment Increased
2.3 ACCESS TO ELECTRICITY: INSIGHTS AND STYLIZED FACTS
Access to energy is one of the most profound development challenges Sub-Saharan Africa faces. In 2022, 600 million people in Africa, or 43 percent of the continent, lacked access to electricity (figure 2.9). The vast majority of them—590 million or 98 percent—were in Sub-Saharan Africa. This has left the region far behind achieving United Nations Sustainable Development Goal 7 to “ensure access to affordable, reliable, sustainable and modern energy for all” (IEA 2022a).
Coal, natural gas, and oil accounted for 77 percent of Africa’s total electricity generation in 2019. The continent’s biggest consumers—South Africa, Egypt, Algeria, and Nigeria—largely shaped these trends. South Africa is the continent’s biggest coal consumer and only nuclear power producer. Africa’s electricity generation increased roughly 25 percent over the past decade, largely due to increased natural gas (IRENA 2022). Renewable energy’s contribution to Africa’s total energy supply grew from 16 percent in 2010 to only 21 percent in 2020, indicating that further investment and innovation are needed to expedite progress. (figure 2.10).
Africa’s rapidly growing population has translated to energy demand increasingly outstripping supply. At present, Africa has 18 percent of the world’s population but less than 6 percent of global energy consumption (IEA 2022a). As of 2018, 13 countries in Sub-Saharan Africa had less than 25 percent access, compared to one country in developing Asia (OECD 2018). The challenges are mounting alongside SubSaharan Africa’s population growth rate—the region is growing at a rate of 2.7 percent per year—which is more than double South Asia (1.2 percent) and triple Latin America (0.9 percent) (The Economist 2020). In the
AFRICA’S PULSE > 68
FIGURE 2.9: Population without Access to Modern Energy Services in Africa
FIGURE 2.10: Total Energy Supply for Africa, by Source, 2010–20
African countries have significant and growing needs for access to electricity and other modern energy services.
250 0 500 750 1,000 2000 2005 2010 2015 2021 Million people East Africa West Africa Central Africa Southern Africa North Africa 2000 2005 2010 2015 2021
The contribution of renewables to Africa’s energy supply has grown over the past decade.
Source:
0 5 10 15 20 25 0 1 2 3 4 5 6 7 2010 2011 2012 2013 2014 2015 2016 2017 2018 2019 2020 GWs, 10,000s Percent Total nonrenewable
of
a. People without electricity b. People without clean cooking
Source:
IEA 2022a.
IEA 2022a.
Total renewable Share
renewable energy (%)
long term, there is a need to develop and scale up diversified energy sources to keep pace with population growth. By 2050, Sub-Saharan Africa’s population is forecasted to reach 2.5 billion, or one-fourth of the global population. By 2100, Sub-Saharan Africa’s population is expected to increase to 4.3 billion. At present, almost half of all Africans without access to electricity live in a handful of countries—the Democratic Republic of Congo, Ethiopia, Nigeria, Tanzania, and Uganda. Four of these countries are among the fastest growing countries in the world. By 2100, the population of Tanzania is forecasted to increase by 378 percent, the Democratic Republic of Congo by 304 percent, and Ethiopia by 156 percent. Nigeria, already the most populous country on the continent, will surpass the United States to be the third most populous country in the world (Gramlich 2019). Other countries are on track to achieving full energy access by 2030, including Ghana, Rwanda, and Kenya (IEA 2022a) (see figure 2.11).
Electricity access rate
2015 2021e
Congo, Dem. Rep
Uganda
Tanzania
Sudan
Niger
Angola
Burkina Faso
Madagascar
Malawi
Zambia
Chad
Ethiopia
Somalia
Ghana
Côte d'Ivoire
Mali
Liberia
Togo
Mozambique
Senegal
Eritrea
Gambia, The
Rwanda
Nigeria
Kenya
Additional population without access 2019–2021e (million people)
Countries have made progress in closing energy access gaps; however, millions of people lack modern energy services.
AFRICA’S PULSE > 69
Source: IEA 2022a.
FIGURE 2.11: Access to Electricity and Pandemic-Related Impacts in Selected African Countries
25% 50% 75% 100% 1 2 3 4 5
The COVID-19 pandemic has had a sharp, adverse effect on access to electricity. The pandemic eroded gains made in the preceding five years—the number of people without access to electricity increased by 4 percent in 2021, compared to 2019. This was the result of compounding challenges, including (1) limited fiscal and financial capacity to develop new grid and off-gird connections by both governments and households, and (2) lockdowns resulting in supply chain disruptions and other logistical disruptions. In several countries, the number of people without access to electricity grew rapidly between 2020 and 2021 despite progress made prior to the pandemic. In Ghana, Kenya, Rwanda, Senegal, and Côte d’Ivoire, the numbers were stable or reduced. The pandemic had the largest effect on the installation of new stand-alone off-grid systems, as the majority of new connections since 2020 have been grid connections. Sales of independent solar home systems, including solar panels and batteries with a capacity of at least 20 watts, declined by roughly 20 percent in Sub-Saharan Africa between 2019 and 2021 (GOGLA 2021).
The compounding crisis of inflation and COVID-19 has further undermined households’ ability to pay for electricity. IEA estimated that at the beginning of 2022, 10 million people in SubSaharan Africa who gained access to electricity could no longer afford to pay for it. Some governments have earmarked budgetary resources to increase energy access. This is generally limited to national grid systems, although off-grid systems are a staple of energy framework plans in two-thirds of the region’s countries. Some exceptions exist. For example, Nigeria’s Economic Sustainability Plan 2020 allocated US$620 million for solar home installations in 5 million homes. Similarly, the Rwandan government set aside US$30 million to subsidize rural electrification with solar technology (IEA 2022a). Unfortunately, the price of technology has increased substantially due to the pandemic, as prices of raw materials have gone up and logistics disruptions have been pervasive. By May 2022, the price of polysilicon, which is needed for manufacturing photovoltaic wafers, was 350 percent higher than in 2019. In parallel, the prices of other clean energy technologies also increased (GOGLA 2021).
There is growing inequality across countries on the renewable energy front. In 2018, half of all solar investments were in Morocco; 62 percent of wind investments were in South Africa; and solar thermal investments were concentrated in Morocco and South Africa (IRENA 2022). Overall, four countries accounted for 75 percent of renewable energy investments between 2010 and 2020—South Africa, Morocco, Kenya, and Egypt. Regionally, Southern Africa received the largest share of investments, but this was overwhelmingly concentrated in South Africa. This was followed by Northern Africa, largely in Morocco; then East Africa, with over half going to Kenya; West Africa, with the majority somewhat equally split among Nigeria, Senegal, Mauritania, Ghana, Sierra Leone, and Burkina Faso; and Central Africa, which received the lowest level of renewable energy investments (figure 2.12).
At present, the majority of renewable energy investments have come from the public sector— which is in sharp contrast to global trends. Globally, just 14 percent of direct investments in renewable energy are publicly funded. Public finance plays a more critical role on the African continent—between 2010 and 2020, 78 percent of financing for renewable energy came from term loans; 20 percent from balance sheet financing; and 2 percent from bonds, development loans, construction loans, tax, and syndicated equity. The reliance on public finance is typically
AFRICA’S PULSE > 70
a result of countries being unable to attract private capital due to perceived political, economic, and legal risks. To offset this, governments can attract private capital through fiscal incentives, guarantees, and regulatory instruments, or by improvements in governance and the overall clarity and stability of the investment environment. Guarantees have become an effective tool, as they can help manage risk (IRENA 2022).
Investments in renewable energy have grown significantly in all parts of the continent.
AFRICA’S PULSE > 71
FIGURE 2.12: Overall Renewable Energy Investment in Africa and Globally, 2000–20 MAP 2.3: Potential and Installed Capacity for Wind, Solar, and Hydropower
BNEF 2021;
2022. Note: BNEF data exclude investments in large hydropower (greater than 50 megawatts).
2022. Note: GW
East Africa West Africa Central Africa Southern Africa North Africa East Africa West Africa Central Africa Southern Africa North Africa 2.0 0.5 0 0.3 1.9 4.8 55 60 587 2,254 2,841 Current US$, billions GLOBAL AFRICA 38% 32% 2% 20% 7% 9.7 3.9 1.3 22.4 17.5 2000–09 2010–20 60 US$ billion Cumulative 2000–09 US$ billion US$ billion US$ billion US$ billion US$ billion US$ billion US$ billion US$ billion US$ billion US$ billion US$ billion US$ billion US$ billion US$ billion US$ billion of global investment of global investment of global investment 2.4% 2% 0.8% 0–10 10–20 20-30 >30 0–0.1 0.1–1.0 1.0–2.0 >2.0 Capacity (GW) Installed Potential 0–0.1 0.01–1.0 0.1–1.0 >1.0 0–1 1–10 10-100 >100 Capacity (GW) Installed Potential 0–0.1 0.1–1 1–3 >3 0–1 1–10 10-100 >100 Capacity (GW) Installed Potential
Sources:
IRENA
Source: IRENA
= gigawatts.
b. Solar
c. Hydropower
a. Wind
2.4 POLICY DISCUSSION
Africa’s resource endowments have three critical roles to play going forward: (1) a source of fiscal revenue, to finance core development objectives without increasing external debt; (2) an opportunity to drive economic transformation via regional integration and value addition; and (3) provision of additional energy sources and investment to promote universal access to electricity.
• Resource revenues will be a critical source of fiscal revenue as the continent grapples with high levels of debt. Of the 38 countries in Sub-Saharan Africa that are covered in the debt sustainability analyses conducted through the joint World Bank–International Monetary Fund Debt Sustainability Framework for Low-Income Countries, 9 countries are in debt distress, 28 are at high risk, and 7 are at low risk of debt distress. Africa’s natural resource wealth remains an important part of its economic recovery given its deep reserves and untapped investment potential. About one-third of Sub-Saharan Africa’s stock of wealth is held in various forms of natural capital, including nonrenewable petroleum and mineral deposits, which reached more than US$5 trillion during the boom years (World Bank 2021a).
• The AfCFTA offers an unprecedented opportunity to develop the mine-to-market value chain within the continent. The AfCFTA unlocks the potential to promote mineral value addition and beneficiation on the continent, which increases sectoral productivity and the overall value of exports. The value chain—from the manufacturing of intermediate inputs such as machinery (backward linkages), to the actual extraction of minerals, to the processing phase (forward linkages)—can rarely be accomplished by a single country because of skills, infrastructure, and capital constraints, among others. Although many countries have prioritized local beneficiation, few have the capacity to undertake it wholly domestically. If implemented effectively, the AfCFTA would allow various countries to specialize in selected parts of the value chain and move them free of tariffs between participating countries, enabling the entire value chain to come together competitively within Africa.
• Good governance is an important determinant of positive economic outcomes from resource wealth. Policymakers need to ensure high levels of government accountability and public scrutiny of resource taxation and investment to ensure maximum development impact. Steps like contract disclosure, adherence to the Extractive Industries Transparency Initiative, transparency in public spending and debt, as well as supporting and protecting civic space, can all support better governance of resource wealth.
• African countries can leverage their resources to bring together gas and renewable energy to meet the region’s domestic needs. Natural gas and renewable energy can go hand in hand, particularly with gas as both a transition fuel and a source of export earnings. Africa has significant renewable energy potential, but attracting investment is critical (figure 2.13). The International Renewable Energy Agency estimates that Africa could have 310 gigawatts of renewable energy capacity by 2030. This is in part due to the region’s high potential in a range of clean energy: it has 10 terawatts of solar capacity, 350 gigawatts of hydro, 110 gigawatts of wind, and 15 gigawatts of geothermal capacity (map 2.3) (AFDB 2018). African countries also have rich endowments of the “green” minerals and metals that are required to build these clean energy technologies.
AFRICA’S PULSE > 72
2.5 POLICY RECOMMENDATIONS
Leverage Natural Resources for Fiscal Revenue and Economic Growth
Recommendation 1: Maximize the value captured from both fossil fuels and mining, consistent with addressing environmental and social negative externalities.
Policy makers have significant new opportunities to harness the untapped resource potential in Africa. By supporting clear, consistent, and stable approaches to sector policies, they can promote new investment to capture upside potential from new discoveries and exploration.
First, governments should seek to capture the full value of resource rents, subject to fiscal terms that attract investment and are robust to changing conditions. World Bank estimates put the value of these rents at 2.6 times the level of government revenues currently captured in resource-rich Africa. This implies not only that citizens are missing significant untapped revenues, consistent with the same levels of investment, but also that a significant subsidy is provided to production. This is bad for both countries and, in the case of subsidizing petroleum extraction, the climate. Capturing the full value of fossil fuel extraction will move closer toward imposing the true social cost of petroleum extraction, thus helping to reduce global emissions.
Better taxation of extractives offers a “double dividend,” for both people and the planet. Much more could therefore be done to invest in fiscal administration and capture a greater share of resource rents. The international community could also play a supporting role to governments in the region as part of their efforts to mitigate climate change as well as improve development outcomes. However, this may require a new approach to partnering with countries to extract maximum value from the petroleum sector. Short of pricing carbon at the wellhead, reducing implicit production subsidies can be an important pillar of long-term mitigation strategies.
Governments can achieve higher levels of rent capture via improvements in the governance environment and fiscal regime, which can reduce uncertainty and perceived risks of operating. Furthermore, investments in tax administration and associated capabilities like contract negotiation can pay for themselves via increased revenue capture. The international community can play a valuable role in supporting countries to harness the maximum value from their resources.
Second, governments should seek clear and consistent fiscal arrangements that are robust to changing circumstances. For example, in 2020, 72 percent of mining firms surveyed through the Fraser Institute stated that uncertainty about the administration, interpretation, and enforcement of existing regulations was a mild deterrent, strong deterrent, or a reason that they would not pursue investment in South Africa (Yunis and Aliakbari 2020).
In practice, some combination of royalties and taxes on profits, or equivalent nontax instruments, can be used to ensure maximum and efficient rent capture for the government and its citizens. Countries should avoid and minimize tax incentives and design fiscal terms that can feasibly be administered and monitored, avoiding unnecessary complexity. Making fiscal terms robust to changing conditions, such as price cycles, also reduces the need, and pressure, to revise them frequently in response to external factors. Investors prefer fiscal stability given the time horizons of investment decisions, especially when developing new discoveries, of which the region has a disproportionate share.
AFRICA’S PULSE > 73
Zambia is an example of both a failure of consistent policies and the beginnings of a successful turnaround. In 2018, Zambia raised its royalty rate for the 10th time in 16 years, withheld valueadded tax refunds, imposed double taxation as mineral royalties were no longer tax deductible, and adopted a nationally centered approach by implementing a 5 percent import duty on copper concentrates. Fiscal policy uncertainty can have an adverse impact on the mining sector: production dropped, despite strong prices, and investment was interrupted. When the new government was elected in 2021, it sought to restore credibility and establish more stable policies. The impact has been renewed investment, rising production, and buoyant copper revenues as global price conditions improved.
Third, governments should develop policies that help to ensure that firms internalize their social and sustainability costs of mine exploration and well closure. Substantial negative externalities can arise from resource extraction, including pollution, health consequences for workers and communities, infrastructure damage, and irreversible land damage. These costs should be internalized via externality taxation and thus factored into firms’ investment decisions. However, these costs should be built into fiscal regime design so that there is policy clarity and stability. Governments should consider setting high environmental and social standards into law to help create policy stability, rather than negotiating such provisions separately.
Recommendation 2: Manage the boom-and-bust cycle.
The experiences of different economies during Africa’s last commodity price boom-and-bust cycle can yield insights that are relevant for today’s policy makers. Rising commodity prices once again put Africa’s resource wealth at the center of economic decisions, and how these choices are made will determine the outcomes for a generation of Africans. The following are suggestions based on these insights.
Beware of the “presource curse” as well as the resource curse. Countries need to be mindful of policies that are consistent with managing expectations and ensuring fiscal sustainability. Avoiding the presource curse, where countries can find themselves in debt distress or facing low growth even before production of resources begins, means tempering the expectations of citizens and the corresponding pressure to borrow and spend ahead of revenues. Discoveries have been found to unleash powerful forces that can shape policy but leave countries exposed if they are not prepared for declining prices. This is especially true where global decarbonization may imply both declining fossil fuel prices in the future and higher variation in all kinds of natural resource prices because of mismatched supply and demand. Getting it wrong carries a heavy cost, where debt distress and sharp resource-induced recessions can cause more economic reversal than the positive value of the boom.
Improve the sustainability of the economy by using revenues from the resource sector. To move from negative to positive adjusted net savings, governments need to invest in human capital, including education and health; produced capital, particularly infrastructure; and natural capital, such as forests, cropland, and nature-based tourism. Revenues generated from the mining and petroleum sectors can be used to finance these forms of capital.
AFRICA’S PULSE > 74
Shift policy considerations from exploitation to asset stewardship. Sustainable use of natural resources requires that overall national wealth rises, including stocks of natural capital, to safeguard the prosperity of future generations as well as the environment. Positive adjusted net savings is one step toward this goal, but mitigating the harmful impact of resource extraction on the environment and agriculture will also help ensure that overall levels of natural capital are rising, not falling, in resource-rich African countries. Furthermore, a shift to accounting for revenues from depleting natural assets as an asset rather than an income stream can help ensure that revenues are invested in the future, not earmarked for recurrent consumption. Managing resource wealth for the future will require new consideration of the sustainability of public finances and economic growth. Wealth accounting provides a means for policy makers to look beyond GDP, and to consider the wealth portfolio, asset diversification, and sustainable development driven by resource wealth.
Investing in, and protecting, other forms of natural capital such as forests, cropland, and water resources is also an important consideration for resource-rich countries. Subsoil resource extraction can place such assets under pressure, and conflict can arise as a key risk where land and resources become contested. Good governance, strong environmental stewardship, and reinvestment of resource revenues can all help support the economic prosperity of non-urban regions where resource extraction typically occurs.
African governments should also work with their partners to increase disclosure of resourcebacked loans to improve value for money and protect countries. It is imperative that the details of resource-backed loans be made public. Some governments have begun to take important steps in that direction (Maslen and Aslan 2022). The Democratic Republic of Congo, for example, has published contracts involving resource-backed loans between its state-owned mining companies and a consortium of Chinese companies and with a large commodity trader. To encourage more progress, countries should put in place legal requirements for disclosure of loan contracts.
Recommendation 3: Prepare for the future.
Policy makers in resource-rich countries may have more success working toward asset diversification rather than export diversification, because of pressure from the Dutch disease (Cust and Rivera-Ballesteros 2021). The Changing Wealth of Nations 2021 report (World Bank 2021a) suggests that targeting asset portfolio diversification—investing in the expansion of human and physical capital—instead of export diversification may be a successful policy for sustainable economic growth. This recommendation builds on earlier work exploring the benefits of portfolio diversification (Gill et al. 2014; Peszko, van der Mensbrugghe, and Golub 2020).
Asset diversification is a strategy that fossil fuel–dependent countries can pursue to manage the risks of the low carbon transition. Peszko, van der Mensbrugghe, and Golub (2020) find that decarbonization policies initiated by fuel importers can unleash macroeconomic forces that encourage traditional export diversification of fuel exporters. This leads to reduced reliance on export revenues from fossil fuel commodities and diversification into downstream, emission-
AFRICA’S PULSE > 75
intensive fossil fuel value chains. Such diversification represents a comfort zone for fossil fuel exporters, but it increases their exposure to multiple channels of impacts from the low carbon transition, such as border carbon adjustments, disruptive technologies, and shifts in the preferences of consumers and investors. Asset diversification can be a long-term, sustainable alternative, but it is a challenging proposition because it requires discovery of new sources of comparative advantage and accumulation of unfamiliar produced assets and human capital, including new skills and capabilities.
Countries should support the transition to automation and mechanization. Given the expected decline in mining jobs resulting from mechanization, identifying new ways to increase employment opportunities is critical. The demographic dividend will translate into a sharp increase in the size of the workforce, and harnessing this workforce within the mining sector will require strengthening the foundation of basic education. It will be important to create and implement skills development programs aligned with both mechanization and diversified economic activities to absorb the decline in labor demand resulting from mechanization. Similarly, technology adoption will be required at significant scale to drive the low carbon transition and this presents opportunities for African countries to work together via regional integration.
Utilize the AfCFTA to Build Regional Value Chains
Recommendation 4: Work toward tariff harmonization.
In the short term, countries should reconsider plans to implement or increase tariffs. Under the AfCFTA, members must phase out 90 percent of tariff lines over the next 5-10 years, while another 7 percent, deemed to be sensitive, will have additional time. Three percent will be allowed to be placed on an exclusion list. More than 80 percent of countries have already submitted their tariff reduction schedules. As a first point of implementation, this means that no new tariffs should be enacted.
In the medium term, countries should undertake regional harmonization of mining taxes and royalties. Tax harmonization has three components: equalization of tax rates, common definition of national tax bases, and uniform application of agreed-on rules (Mansour and Rota-Graziosi 2013). The lack of a harmonized tax policy can undermine regional integration, even with the establishment of a customs union, a common market, and a monetary union (IMF 2015a). Harmonized tax rates remove tax distortions and prevent competition for capital. Tax competition can foment a race to the bottom, which does not benefit any country given the reduction in tax revenue. Harmonizing tariffs and royalties requires rigid implementation, including coordination and surveillance. A powerful first step would be the creation of a common floor rate.
Implementation of harmonized tariffs and regulations requires data and strong institutions that have coordination and enforcement capabilities. Establishing and regularly updating an online tax database that provides comprehensive data on national tax structures can be useful for understanding disparities. It would also offer a source of accountability because
AFRICA’S PULSE > 76
it publicly identifies countries that are deviating from regional efforts. This database should be complemented by financing and building the capacity of a regional institution that can provide training to national governments, coordinate forums and meetings to ensure continued dialogue, and enforce harmonization policies. Challenges exist with such regional institutions. For example, the West African Economic and Monetary Union had not provided its regional institution the requisite resources to carry out surveillance effectively (IMF 2016).
Recommendation 5: Mitigate non-tariff barriers, especially those linked to mining.
Given that transport costs make regional value chain development uncompetitive, key regional trade patterns should be mapped to identify areas for strengthening infrastructure, including roads, railways, and ports. Mapping can identify infrastructure that has the highest potential for unlocking regional trade. Significant improvements in transportation and energy infrastructure will be needed at both the national and regional levels to unlock the full potential of regional value chains.
Namibia, for example, has the potential to be a gateway for the AfCFTA, opening trade over land from Southern Africa to the rest of the continent, while also having a port that enables access to the EU and US markets. Although the World Economic Forum has called Namibia’s roads the best in Africa, most bulk commodities move by rail. More than 50 percent of the railway lines on which state-owned railway company TransNamib currently operates do not meet the minimum Southern African Development Community–stipulated standard of 18.5 tons per axle load. TransNamib’s revenue generated from bulk commodities equates to about 93 percent of its revenue, which includes revenue from transporting Zambia’s commodities. TransNamib has a demonstrated interest in moving bulk commodities by rail between Angola, Botswana, Zambia, and Zimbabwe.
A policy landscape should be created that is amenable to private energy generation and enables firms to export to meet regional needs. In 2021, the South African government announced that businesses would be allowed to generate power of up to 100 megawatts each without a license, a significant increase from the 1-megawatt limit. Mining firms could also buy electricity from other companies that produce a surplus. South African mining companies now have 3,900 megawatts of renewable energy projects in the pipeline. To put this in perspective, 100 megawatts could power two large mines in South Africa. This move drastically alleviates pressure on Eskom, the country’s state-owned electricity utility, while ensuring that energy is no longer a bottleneck for the mining sector. In the longer term, creating a policy environment that lets mining firms export renewable energy to other countries can alleviate regional constraints.
Recommendation 6: Address policy impediments inhibiting regional mineral value addition.
Shift from nationally defined export restrictions to a continental and regional approach. Stringent national export restrictions in Africa can make all the countries involved worse off. The restrictions not only adversely affect domestic mining production, but also affect other sectors, including transportation and logistics, services, and construction. Export restrictions can have
AFRICA’S PULSE > 77
direct adverse effects on other countries within the region. Zambia’s (now reversed) imposition of import and export taxes also affected the Democratic Republic of Congo, which exported copper to Zambia for processing, and made Zambian processing of Democratic Republic of Congo commodities largely commercially unviable. In the medium term, countries may be better able to utilize regional or continental export restrictions, rather than national ones. This can help ensure that restrictions are not imposed on exports to other countries within the regional economic community or African Union region, but are in effect on exports moved outside the region, consistent with the goals of the AfCFTA.
Replace local content policies with continental and regional (regional economic community) approaches to content policies instead of nationally defined targets and approaches. Many African countries have skills shortages and limited capacity to produce or access key inputs when working at the national level. Regional content policies can reduce the burden of ongoing constraints by enabling countries to access a larger pool of skilled labor and requisite inputs. Firms operating in the region can implement training programs and capacity building for micro, small, and medium-size enterprises in parallel with regional sourcing.
Shifting from a national approach to local equity participation to a regional approach could benefit from developing a regulatory framework for (sub)regional equity. Currently, some countries have policies that require local equity participation in the extractives sector. For example, Kenya’s new Mining Act makes the granting of every mining license conditional on local equity of at least 35 percent in respect of mineral rights, and in Namibia, all applications for a mining license must have 15 percent local owners. In countries where capital markets are shallow, these local ownership policies may impede new investment as local capital raising may be challenging or the number of potential investors too low. Expanding local equity access to the regional level can tap into deeper capital markets and facilitate the emergence of medium-size regional mining firms that have the capital to invest and sufficient interest in investing in various African jurisdictions. A regional—rather than national—equity requirement could also enable these African firms to benefit from skills and technology transfer from large multinationals, such as Rio Tinto, Glencore, BHP, and Anglo American. This regional equity may best be achieved first at the level of the subregion, via regional economic communities. Rapid implementation of the AfCFTA may facilitate technology transfer at the African Union level and tapping into continental capital markets.
Reconsider plans to implement or increase tariffs related to extractives regional value chains. Under the AfCFTA, members must phase out 90 percent of tariff lines over the next 5-10 years, while another 7 percent that is deemed to be sensitive will get some additional time. As a first point of implementation, this could mean that no new tariffs should be enacted. Countries can go further and seek to minimize new tariffs and reduce existing ones related to promoting the development of extractives-linked value chains at the regional level across Africa. Unfortunately, much of the extractive sector policy today is formulated in national rather than regional terms, and countries may seek to exclude the extractive sector from the AfCFTA.
AFRICA’S PULSE > 78
Recommendations for Improving Access to Electricity
Recommendation 7: Tap into domestic gas supply to drive energy access alongside generating export revenues.
Stable investment policies are critical for leveraging domestic gas supplies for export revenue and domestic consumption. Exploiting natural gas reserves requires substantial investments, particularly offshore and for liquefied natural gas transportation. Given both the capital-intensive and long-term nature of these investments, countries should develop and maintain policies that support both export and domestic consumption, consistent with attracting sufficient investment. While it may be appealing for countries to retain large shares of gas for future projected energy consumption, such restrictions can weaken the economic case for investment and significantly delay investment decisions. Countries should seek deals to invest in their gas reserves that are consistent with meeting domestic energy and development goals while also ensuring sufficient exports of natural gas to generate fiscal and export revenues. Effective policies can support an effective transition from pipeline to operation.
With stable investment policies in hand, countries can work with the private sector to fasttrack projects. Since the crisis in Ukraine began, the global natural gas market has come under pressure. Europe has been particularly hard hit, given that the supply of gas from the Russian Federation has been disrupted since the invasion. Europe’s accelerated efforts to diversify gas sourcing bode well for some countries. Algeria, a long-time supplier of natural gas to Europe, has seen a strong increase in contracting activity since the beginning of the supply crisis. The Egyptian Natural Gas Holding Company signed an agreement to develop short-term opportunities to expand natural gas exports to Europe (Egypt saw a 10 percent year-over-year increase in gas exports in the first eight months of 2022). In Sub-Saharan Africa, a number of projects have been fast-tracked. Mozambique commissioned the Coral Sul FLNG liquefied natural gas unit, and the operator Eni announced plans to develop a second FLNG in the same block, which could be fast-tracked. In the Republic of Congo, the development of the Marine XII offshore field was fast-tracked, and a floating liquefaction unit should help to start liquefied natural gas exports by mid-2023. In Angola, state-owned Sonangol partnered with BP, Eni, Chevron, and TotalEnergies to take a final investment decision in July 2022 on the Quiluma and Maboqueiro offshore field. In Senegal and Mauritania’s joint offshore developments, the first phase of Grand Tortue Ahmeyim was identified as 80 percent complete early in the third quarter of 2022, with an expected startup in the third quarter of 2023 and the first liquefied natural gas exports by the end of the year (IEA 2022b).
Recommendation 8: Utilize fiscal revenue from, and investments in, the mining, oil, and gas sectors to support universal energy access.
Fiscal revenues generated from the extractive sector are critical to bridge the financing gap for renewable energy. In 2018, IEA estimated that countries in Sub-Saharan Africa would require US$28 billion per year until 2030 to attain universal access to electricity. This would include US$13 billion for mini-grids, US$7.5 billion for grid, and US$6.5 billion for off-grid investments (Ireri and Shirley 2021). Given the high levels of debt distress across the region, countries should
AFRICA’S PULSE > 79
focus on leveraging fiscal revenue from the extractive sector rather than relying on external debt, much of which has become inaccessible or expensive amid sovereign downgrades.
A policy landscape should be supported to be amenable to private energy generation. This could include enabling operations in the mining sector as anchor clients and the opportunities they may find to supply surrounding communities. An example is described in Recommendation 5—in 2021, the South African government announced policies for businesses to generate a certain amount of power without a license. Beyond alleviating the energy bottleneck that has become a deterrent to mining companies, the move to private generation enables firms to supply excess electricity to surrounding communities, for example, for schools, hospitals, and households. Mining as anchor clients can also help boost the finances of utilities and reduce the risk of investments such as in renewable power generation.
Recommendation 9: Strengthen grid and mini-grid infrastructure, but avoid lowquality electricity alternatives.
Although grid expansion is critical for expanding access to electricity, alternative solutions are often more affordable and fit for purpose in rural, low-income, or micro-commercial markets. Decentralized solutions—particularly mini-grids—can be cost-efficient ways to attain universal access. However, popular approaches, such as solar home systems, may fail to deliver the quality electricity access that is necessary to meet development ambitions. These can be deployed judiciously where grid connection is infeasible or uneconomic. However, countries should avoid subsidizing or otherwise allocating scarce capital to low-quality electricity alternatives where there are cost-effective and proven options from the grid or mini-grid systems. Africa accounted for 70 percent (US$1.7 billion) of global off-grid investments between 2010 and 2020. For countries to meet Sustainable Development Goal 7, “Access to affordable, reliable, sustainable and modern energy for all,” it will be essential to achieve mini-grids, grid extensions, and reform of utilities. Meanwhile, regional integration can further support harnessing the significant potential from renewable power generation (see box 2.3 for an example).
Namibia is a highly attractive destination for renewable energy investments. It has one of the highest solar irradiation levels in the world, with much of the country having nearly 3,000 kilowatt hours per square meter of solar irradiation. Namibia also has excellent wind resources, with average wind speeds at typical turbine heights that can exceed 10 meters per second. If these sources were exploited well, Namibia would not only meet its own rising electricity demand, but also become a leading regional exporter to other Southern African Power Pool peers, thereby benefitting from export earnings.
Source: World Bank (2021b).
AFRICA’S PULSE > 80
BOX 2.3: Leveraging the Regional Power Pool to Attract Renewable Energy Investment
Mini-grid solutions can be efficient where governments are slow to expand the grid. For example, in Nigeria, although grid would be the most cost-effective solution for 80 percent of the population that has yet to access electricity, this would require adding 10 million people to the grid annually over 2022–30. Nigeria has connected a maximum of 4.3 million people to the grid in a single year. If 4.5 million people were connected to the grid per year between 2022 and 2030, then 60 percent of the people would have to access electricity through mini-grid systems. These solutions are also a better fit for purpose given that 95 percent of Nigerians without electricity access live in rural areas, where it may be difficult to achieve the necessary scale to deliver high-quality electricity access.
AFRICA’S PULSE > 81
Appendix: Country Classifications
TABLE A.1: Country Classification by Resource Abundance in Sub-Saharan Africaa
Resource-rich countries
Oil Metals & minerals
Angola
Chad
Republic of Congo
Equatorial Guinea
Gabon
Nigeria
South Sudan
Botswana
Democratic Republic of Congo
Guinea
Liberia
Mauritania
Namibia
Niger
South Africa
Sierra Leone
Zambia
Benin
Burkina Faso
Burundi
Cabo Verde
Cameroon
Central African Republic
Comoros
Côte d’Ivoire
Eritrea
Eswatini
Ethiopia
Non-resource-rich countries
Gambia, The Ghana
Guinea-Bissau
Kenya
Lesotho
Madagascar
Malawi
Mali
Mauritius
Mozambique
Rwanda
São Tomé and Príncipe
Senegal
Seychelles
Somalia
Sudan
Tanzania
Togo
Uganda
Zimbabwe
aNote: Resource-rich countries are those with rents from natural resources (excluding forests) that exceed 10 percent of gross domestic product during the period 2015-2021.
TABLE A.2: Western and Central Africa Country Classification
Resource-rich countries
Oil Metals & minerals
Non-resource-rich countries
Chad
Equatorial Guinea
Gabon
Nigeria
Republic of Congo
Guinea
Liberia
Mauritania
Niger
Sierra Leone
Benin
Burkina Faso
Cabo Verde
Cameroon
Central African Republic
Côte d’Ivoire
Gambia, The Ghana
Guinea-Bissau
Mali
Senegal
Togo
Note: Since July 2020, for operational purposes, the World Bank Africa Region has been split into two subregions—Western and Central Africa and Eastern and Southern Africa. The analysis in this report reflects this setup. Resource-rich countries are those with rents from natural resources (excluding forests) that exceed 10 percent of gross domestic product.
TABLE A.3: Eastern and Southern Africa Country Classification
Resource-rich countries
Angola
Oil
South Sudan
Metals & minerals
Botswana
Democratic
Republic of Congo
Namibia
South Africa
Zambia
Burundi
Comoros
Eritrea
Eswatini
Ethiopia
Kenya
Lesotho
Madagascar
Malawi
Mauritius
Non-resource-rich countries
Mozambique
Rwanda
São Tomé and Príncipe
Seychelles
Somalia
Sudan
Tanzania
Uganda
Zimbabwe
Note: Since July 2020, for operational purposes, the World Bank Africa Region has been split into two subregions—Western and Central Africa and Eastern and Southern Africa. The analysis in this report reflects this setup. Resource-rich countries are those with rents from natural resources (excluding forests) that exceed 10 percent of gross domestic product.
AFRICA’S PULSE > 83
References
AFDB (African Development Bank). 2018. “Why Africa Is the Next Renewables Powerhouse.” December 7. https://www.afdb.org/en/news-and-events/why-africa-is-the-next-renewables-powerhouse-18822.
Akhtar, S., J. Haas, and U. Volz. 2022. Debt Relief for a Green and Inclusive Recovery. T7 Task Force International Finance and Economic Recovery Policy Brief.
Barhoumi, K., H. Vu, S. Nikaein Towfighian, and R. Maino. 2018. “Public Investment Efficiency in Sub-Saharan African Countries: What Lies Ahead?” African Department Paper Series No. 18/09, International Monetary Fund, Washington, DC.
Baskaran, G. 2022. “Could Africa Replace China as the World’s Source of Rare Earth Elements?” Brookings Institution, Washington, DC, December 29. https://www.brookings.edu/blog/africa-in-focus/2022/12/29/ could-africa-replace-china-as-the-worlds-source-of-rare-earth-elements/
Beirne, J., N. Renzhi, and U. Volz. 2021. “Feeling the Heat: Climate Risks and the Cost of Sovereign Borrowing.” International Review of Economics & Finance 76: 920-36.
BNEF (Bloomberg New Energy Finance). 2021. “Renewable Assets.” Database, BNEF. www.bnef.com/projects/ search (subscription required).
Bos, K., and J. Gupta. 2019. “Stranded Assets and Stranded Resources: Implications for Climate Change Mitigation and Global Sustainable Development.” Energy Research and Social Science 56: 101215.
Burger, S. 2023. “US, DRC and Zambia Sign MoU to Strengthen EV Battery Value Chain.” Mining Weekly, January 19. https://www.miningweekly.com/article/us-drc-and-zambia-sign-mou-to-strengthen-ev-battery-valuechain-2023-01-19.
Chamon, M., E. Klok, V. V. Thakoor, and J. Zettelmeyer. 2022. “Debt-for-Climate Swaps: Analysis, Design, and Implementation.” IMF Working Paper WP/22/162, August, International Monetary Fund, Washington, DC.
Chaponda, T., C. Matsumoto, and L. Murara. 2020. “The Public Investment Management Assessment Framework: An Overview.” In Well Spent: How Strong Infrastructure Governance Can End Waste in Public Investment, edited by G. Schwartz, M. Fouad, T. Hansen, and G. Verdier. Washington, DC: International Monetary Fund.
Cherif, R., S. Dhungana, X. Fang, J. Gonzalez-Garcia, M. Mendes, Y. Yang, M. Yenice, and J. E. Yoon. 2020. “Competition, Competitiveness and Growth in Sub-Saharan Africa.” IMF Working Paper WP/20/30, February, International Monetary Fund, Washington, DC.
Cust, J., D. Manley, and G. Cecchinato. 2017. “Unburnable Wealth of Nations.” Finance and Development 54 (1).
Cust, J., and A. Rivera-Ballesteros. 2021. “The Nonrenewable Wealth of Nations.” In The Changing Wealth of Nations 2021: Managing Assets for the Future, 193–223. Washington, DC: World Bank.
Cust, J., and A. Zeufack. 2023. “Africa’s Resource Future.” World Bank, Washington DC.
The Economist. 2020. “Demography: Africa’s Population Will Double by 2050.” The Economist, March 26. https:// www.economist.com/special-report/2020/03/26/africas-population-will-double-by-2050
Farah Yacoub, J. P., N. Hamadeh, and C. Reinhart. 2022. “The Pitfalls of Parallel Currency Markets: Higher Inflation and Lower Growth.” World Bank Blogs, Let’s Talk Development, March. https://blogs.worldbank. org/developmenttalk/pitfalls-parallel-currency-markets-higher-inflation-and-lower-growth Fitch Solutions. 2021. “Tax Breaks to Stimulate Mining Sector in Zambia.” March 5. https://www.fitchsolutions. com/mining/tax-breaks-stimulate-mining-sector-zambia-05-11-2021
AFRICA’S PULSE > 85
Georgieva, K., M. Chamon, and V. Thakoor. 2022. “Swapping Debt for Climate or Nature Pledges Can Help Fund Resilience.” IMF Blog , December 14. https://www.imf.org/en/Blogs/Articles/2022/12/14/swappingdebt-for-climate-or-nature-pledges-can-help-fund-resilience
Gill, I. S., I. Izvorski, W. van Eeghen, and D. De Rosa. 2014. Diversified Development: Making the Most of Natural Resources in Eurasia. Washington, DC: World Bank.
GOGLA (Global Off-Grid Lighting Association). 2021. “Global Off-Grid Solar Market Report, Semi-Annual Sales and Impact Data 2021.” GOGLA, Amsterdam, Netherlands. https://www.gogla.org/sites/default/files/ resource_docs/gogla_sales-and-impact-reporth2-2021_def2.pdf
Gramlich, J. 2019. “For World Population Day, a Look at the Countries with the Biggest Projected Gains—and Losses—by 2100.” The Pew Research Center, Washington, DC, July 10. https://www.pewresearch.org/facttank/2019/07/10/for-world-population-day-a-look-at-the-countries-with-the-biggest-projected-gains-andlosses-by-2100/
Griffith-Jones, S., U. Volz, and K. P. Gallagher. 2021. “Debt Relief by Private Creditors: Lessons from the Brady Plan.” DRGR Working Paper. Berlin, Debt Relief for Green and Inclusive Recovery Initiative, London, and Boston.
Guj, P., R. Schodde, B. Bocoum, and J. Cust. Forthcoming. “Mineral Resources of Africa.” World Bank, Washington, DC.
IEA (International Energy Agency). 2021. “The Role of Critical Minerals in Clean Energy Transitions.” IEA, Paris.
———. 2022a. Africa/ Energy Outlook 2022—Analysis. Paris: IEA. https://www.iea.org/reports/africaenergy-outlook-2022.
———. 2022b. Gas Market Report, Q4-2022. Paris: IEA. https://www.iea.org/reports/africa-energyoutlook-2022.
IMF (International Monetary Fund). 2012. “Macroeconomic Policy Frameworks for Resource-Rich Developing Countries.” Policy Paper, IMF, Washington, DC. https:// bit.ly/2txKGzB.
———. 2015a. “Options for Low-Income Countries’ Effective and Efficient Use of Tax Incentives for Investment.” Report to the G20 Development Working Group, IMF, Washington, DC.
———. 2015b. “Making Public Investment More Efficient.” Fiscal Affairs Department, Staff Report, IMF, Washington, DC.
———. 2016. “West African Economic and Monetary Union: Common Policies of Member Countries.” Press Release, Staff Report, and Statement by the Executive Director for the West African Economic and Monetary Union. Country Report 16/96, IMF, Washington, DC.
———. 2019. “Sub-Saharan Africa Regional Economic Outlook: Navigating Uncertainty.” IMF, Washington, DC, October.
———. 2020. Fiscal Monitor: Policies for the Recovery. IMF, Washington, DC, October.
IRENA (International Renewable Energy Agency). 2022. “Renewable Energy Market Analysis: Africa and Its Regions.” IRENA, Masdar City, United Arab Emirates. https://www.irena.org/publications/2022/Jan/ Renewable-Energy-Market-Analysis-Africa.
Ireri, B., and R. Shirley. 2021. “Powering Growth.” International Monetary Fund, Washington, DC. https://www. imf.org/en/Publications/fandd/issues/2021/09/fighting-climate-change-in-Africa-ireri
Malova, A., and F. van der Ploeg. 2017. “Consequences of Lower Oil Prices and Stranded Assets for Russia’s Sustainable Fiscal Stance.” Energy Policy 105: 27–40.
AFRICA’S PULSE > 86
Mankiw, N. G., and R. Reis. 2018. “Friedman’s Presidential Address in the Evolution of Macroeconomic Thought.” Journal of Economic Perspectives 32 (1): 81–96.
Mansour, M., and G. Rota-Graziosi. 2013. “Tax Coordination, Tax Competition, and Revenue Mobilization in the West African Economic and Monetary Union.” IMF Working Paper WP/13/163, International Monetary Fund, Washington, DC.
Maslen, S., and C. Aslan. 2022. “Enhancing Debt Transparency by Strengthening Public Debt Transaction Disclosure Practices.” EFI Insight, World Bank, Washington, DC.
Minerals Council South Africa. 2021. “Facts and Figures 2021.” Minerals Council South Africa, Johannesburg. https://www.mineralscouncil.org.za/downloads/send/16-featured/1875-facts-and-figures-2021
———. 2022. “Facts and Figures.” Minerals Council South Africa, Johannesburg.
Miyamoto, H., N. Gueorguiev, J. Honda, A. Baum, and S. Walker. 2020. “Growth Impact of Public Investment and the Role of Infrastructure Governance.” In Well Spent: How Strong Infrastructure Governance Can End Waste in Public Investment, edited by G. Schwartz, M. Fouad, T. Hansen, and G. Verdier. Washington, DC: International Monetary Fund.
Nagle, P. 2022. “Five Lessons from Past Episodes of Debt Relief.” World Bank Blogs, Let’s Talk Development, January 31. https://blogs.worldbank.org/developmenttalk/5-lessons-past-episodes-debt-relief
OECD (Organisation for Economic Co-operation and Development). 2018. “Financing Climate Futures: Rethinking Infrastructure.” OECD, Paris. https://www.oecd.org/environment/financing-climate-futures9789264308114-en.htm
Peszko, G., D. van der Mensbrugghe, and A. Golub. 2020. Diversification and Cooperation in a Decarbonizing World: Climate Strategies for Fossil Fuel–Dependent Countries. Washington, DC: World Bank.
Qiang, C. Z., P. Kusek, V. Steenbergen, and B. Viney. 2021. “The Road to Recovery in Sub-Saharan Africa: Capitalizing on Transformative Opportunities from Shifting FDI Patterns.” World Bank Blogs, African Can End Poverty https://blogs.worldbank.org/africacan/road-recovery-sub-saharan-africa-capitalizingtransformative-opportunities-shifting-fdi
Reid, H. 2022a. “Anglo American to Return to Zambia with Arc Minerals Copper Deal.” May 12. https:// www.reuters.com/business/exclusive-anglo-american-return-zambia-with-arc-minerals-copperdeal-2022-05-12/
———. 2022b. “First Quantum Minerals Approves $1.25bn Zambia Mine Expansion.” Business Day, May 9. https://www.businesslive.co.za/bd/companies/mining/2022-05-09-first-quantum-minerals-approves125bn-zambia-mine-expansion/
Reis, R. 2021. “Losing the Inflation Anchor.” Brookings Papers on Economic Activity, 307-61. Fall 2021.
Reuters. 2022. “Barrick CEO Says Zambia’s Lumwana Mine Life Could Be Extended to 2060.” Reuters, October 26. https://www.reuters.com/markets/commodities/barrick-ceo-says-zambias-lumwana-mine-life-couldbe-extended-2060-2022-10-26/
S&P Global Market Intelligence. 2022. “Report: World Exploration Trends 2022.” S&P Global Market Intelligence, New York. https://pages.marketintelligence.spglobal.com/World-Exploration-Trends-2022-EMC1705.html
UNDP (United Nations Development Programme). 2023. “Journey to Extremism in Africa: Pathways to Recruitment and Disengagement.” UNDP, New York.
Volz, U., S. Akhtar, K.P. Gallagher, S. Griffith-Jones, J. Haas, and M. Kraemer. 2020. “Debt Relief for a Green and Inclusive Recovery: A Proposal.” Heinrich-Böll-Stiftung, Berlin SOAS, University of London; and Boston University.
AFRICA’S PULSE > 87
———.2021. Debt Relief for a Green and Inclusive Recovery: Securing Private-Sector Participation and Creating Policy Space for Sustainable Development. Berlin, London & Boston, MA: Heinrich-Böll-Stiftung; SOAS, University of London; & Boston University.
Volz, U., K. Berensmann, S. Burke, K. P. Gallagher, S. Griffith-Jones, M. Kessler, and I. Monasterolo. 2022. “Addressing the Debt Crisis in the Global South: Debt Relief for Sustainable Recoveries” T7 Task Force Sustainable Economic Recovery Policy Brief.
Warwick, F. 2019. “Zambia 2019 Copper Output Drop Due to New Mining Taxes.” S&P Global Market Intelligence, December 27. https://www.spglobal.com/commodityinsights/en/market-insights/latestnews/metals/122719-zambia-2019-copper-output-drop-due-to-new-mining-taxes-com
World Bank. 2017. “The Growing Role of Minerals and Metals for a Low Carbon Future.” World Bank, Washington, DC.
———. 2019. “Digging Beneath the Surface: An Exploration of the Net Benefits of Mining in Southern Africa.” World Bank, Washington, DC.
———. 2020. “The African Continental Free Trade Area: Economic and Distribution Effects.” World Bank, Washington, DC.
———. 2021a. The Changing Wealth of Nations 2021: Managing Assets for the Future. Washington, DC: World Bank.
———. 2021b. “Namibia Country Private Sector Diagnostic.” World Bank, Washington, DC.
———. 2022a. “South Africa Country Climate and Development Report.” CCDR Series. World Bank, Washington, DC.
———. 2022b. Global Economic Prospects, January 2022. Washington, DC: World Bank.
———. 2023. Global Economic Prospects, January 2023. Washington, DC: World Bank.
Yunis, J., and E. Aliakbari. 2020. “Fraser Institute Annual Survey of Mining Companies 2020.” Fraser Institute, Vancouver. https://www.fraserinstitute.org/sites/default/files/annual-survey-of-miningcompanies-2020.pdf
AFRICA’S PULSE > 88
report was produced by the Office of the Chief Economist for the Africa Region.
This
https://www.worldbank.org/africaspulse
