Growth Outlook for the Region
Source: World Bank staff calculations.
Note: The cut-off date for the data is March 23, 2023. “e” stands for estimate; “f” for forecast.
Real gdP growth Rates 2020 2021 2022e 2023f 2024f 2025f Argentina -9.9 10.4 5.2 0.0 2.0 2.0 Bahamas -23.8 13.7 11.0 4.3 2.0 1.9 Barbados -13.7 0.7 10.0 4.9 3.9 3.1 Belize -13.4 15.2 9.6 3.0 2.0 2.0 Bolivia -8.7 6.1 3.1 2.7 2.1 2.1 Brazil -3.3 5.0 2.9 0.8 2.0 2.0 Chile -6.0 11.7 2.4 -0.7 2.1 2.2 Colombia -7.3 11.0 7.5 1.1 2.8 2.8 Costa Rica -4.3 7.8 4.3 2.7 3.1 3.2 Dominica -16.6 6.9 5.8 5.0 4.6 3.6 Dominican Republic -6.7 12.3 4.9 4.4 5.0 5.0 Ecuador -7.8 4.2 2.9 3.0 2.8 2.8 El Salvador -8.2 10.3 2.8 2.3 2.1 2.1 Grenada -13.8 4.7 5.8 3.5 3.3 2.9 Guatemala -1.8 8.0 4.0 3.2 3.5 3.5 Guyana 43.5 20.0 57.8 25.2 21.2 28.2 Haiti -3.3 -1.8 -1.7 -1.1 1.5 2.5 Honduras -9.0 12.5 4.0 3.5 3.6 3.7 Jamaica -9.9 4.6 4.2 2.0 1.7 1.2 Mexico -8.0 4.7 3.1 1.5 1.8 2.0 Nicaragua -1.8 10.3 4.0 3.0 3.4 3.5 Panama -17.9 15.3 10.5 5.7 5.8 5.9 Paraguay -0.8 4.0 -0.3 4.8 4.3 4.3 Peru -10.9 13.4 2.7 2.4 2.8 2.8 St. Lucia -24.4 12.2 15.4 3.6 3.4 2.5 St. Vincent and the Grenadines -5.3 1.3 5.0 6.0 4.8 3.5 Suriname -16.0 -2.7 1.9 2.4 3.2 3.1 Uruguay -6.1 4.4 5.0 1.8 2.8 2.4
oV e RVI ew | T H e e lus IV e P R om I se of In T eg RATI on— oPP o RT un ITI es I n A cHA ng I ng g lo BA l e conomy The promise of in T egraT ion 15
c HAPT e R I
STRENGTHENING RESILIENCE, BOOSTING GROWTH
16 The promise of in T egraT ion
latin America and the Caribbean (LAC) has largely transitioned from the pandemic period. However, the region continues to confront the challenges posed by potential new variants of COVID-19, ongoing global inflation, persistent and rising interest rates in the advanced countries, and the collateral effects of the Russian invasion of Ukraine. LAC has handled the management of the accumulated debt and fought against inflation in a manner unimaginable a generation ago. LAC has achieved a certain level of “normalcy” in its macro management, and it needs to maintain its accumulated credibility and resilience. Over the longer term, the overarching problem remains one of low growth rates and what is necessary to reenergize incumbent industries, but also to take advantage of the new opportunities offered in the global economy given the shifting map of supply chains and the Green Revolution.
Boosting Resilience for Dealing with the Next Disease
As the October 2022 issue of the Latin America and the Caribbean Economic Review (LACER) documented, LAC was one of the regions most affected by the COVID-19 pandemic. Vaccinations played a key role in the economic recovery, with effective health information campaigns raising the coverage of the first scheduled dose in adults and children to 80 and 92.2 percent, respectively.1 2 However, decreases in antibody production and the appearance of new variants dictate the need for additional booster doses.3,4,5 Yet, vaccination coverage remains uneven across the region. At the beginning of February 2023, total vaccination coverage varied from 3.2 doses per person in Chile to 2.5 doses in Argentina, to only 1.2 doses in Bolivia and 0.54 dose in Jamaica (see figure 1.1). For the latest round of boosters, only Chile shows more than one dose per person on average; some previous good performing countries, like Mexico and Colombia, fell behind, with 0.45 and 0.28 dose per person, respectively. Many Caribbean countries continue to lag in basic protection and have barely started administering the boosters, leaving their populations vulnerable to new variants. Authorities are also warning about a potential bird flu epidemic.6 The World Bank Pandemic Preparedness Fund stands ready to build resilience to future diseases.7
initial doses and boosters
100
54 68 71 72 82 89 93 103 113 113 120 124 134 135 135 141 144 146 163 174 175 178 198 219 225 247 251 256 260 320 0 50 100 150 200 250 300 350 Jamaica St. Lucia St. Vincent and the Grenadines Grenada Suriname Bahamas Dominica Trinidad and Tobago Guatemala Guyana Bolivia Belize Venezuela, RB St. Kitts and Nevis Barbados Paraguay Dominican Republic Antigua and Barbuda Honduras Colombia Mexico El Salvador Panama Ecuador Brazil Costa Rica Argentina Peru Uruguay Chile Initial protocol doses Booster doses Source: Our World in Data, as of February 4, 2023. cHAPT e R I | sTR eng TH en I ng Res I l I ence, Boos TI ng gR ow TH The promise of in T egraT ion 17
Figure 1.1. COVID-19 Boosters Are Prominent in the Region, Except for the Caribbean COVID-19 vaccine
per
people, Feb 4, 2023
Figure 1.2. Share of Households Reporting Needing Healthcare Whose Healthcare Services were Disrupted between 2020 and 2021
Ecuador Peru Bolivia ParaguayDominicanRepublicElSalvador Colombia St.Lucia Chile All HondurasGuatemala Argentina MexicoCostaRica
Source: Herrera C.A., A.C. Kerr, J.M. Dayton, and J.J. Kakietek. 2022. Healthcare Services Disruption in 14 LAC Countries during the COVID-19 Pandemic: Analysis of Household Phone Surveys 2020–2021. Journal of Global Health, 2023. In press.
Notes: Three rounds of a high frequency pulse survey (HFPS) were conducted between May and August 2020 at the beginning of the pandemic, and a fourth round was completed between May and July 2021. The HFPS collected nationally representative information about people’s access to services when they perceived the need for them in 14 countries: Argentina, Bolivia, Chile, Colombia, Costa Rica, Dominican Republic, Ecuador, El Salvador, Guatemala, Honduras, Mexico, Paraguay, Peru, and Saint Lucia.
In addition to preventative measures, the region needs to redress the weaknesses in the health care and public health systems revealed by the pandemic. As shown in the report Building Resilient Health Systems in Latin American and the Caribbean: Lessons Learned from the COVID-19 Pandemic, most health systems in LAC underperform compared to the average for the Organization for Economic Cooperation and Development (OECD) and this led to severe disruptions in both reacting to the pandemic and in providing ongoing services (figure 1.2). On average, health spending, although it grew in recent years, stands at only 25 percent of OECD countries’ expenditure per capita adjusted for purchasing power. Despite improvements in universal health coverage over the last 30 years, long-standing structural handicaps such as underinvestment in human resources and infrastructure, and poor governance all undermined ability to respond. Fragmentation in service delivery is an important source of waste in the region, leading to duplication of tasks, substantially reducing system efficiency, and exacerbating inequalities. While green shoots have appeared in the form of technical innovations in provision, reforms are urgent to improve access and delivery, and ensure resilience against future health emergencies.
Economic Performance: Slow Growth, Continued Resilience, and Guarded Optimism
Although LAC’s gross domestic product (GDP) is now firmly above the pre-COVID-19 levels, going forward, its growth is expected to lag all other regions including war-battered Eastern Europe (figure 1.3). Growth is not expected to pick up soon. The waning energy of the recovery and persistent inflation, the Russian Federation’s invasion of Ukraine, and uncertainty around China’s recovery from the COVID-19 lockdown continue to depress the outlook for growth globally and in the region.
Looking at the subregions in LAC, the growth rate of South America could possibly allow it to regain its previous modest growth trajectory, but Central America shows that, at best, it is achieving a parallel but lower trajectory compared to pre-COVID-19 (figure 1.4). The Caribbean is still recovering from its especially severe downturn, reflecting the incomplete recovery of the battered tourism industry, which fell by 71 percent in 2020 relative to 2019 (figure 1.5). The drop in tourism revenues left Caribbean economies about 10
Average Disruption Rate 0 5 10 15 20 25 30 35 40 45 50
Disrupted healthcare (percent) Round 1 Round 2 Round 3 Round 4
18 cHAPT e R I | sTR eng TH en I ng Res I l I ence, Boos TI ng gR ow TH The promise of in T egraT ion
1.3. Recovered, but Showing Lackluster Growth Real Annual GDP Levels by Region
Source: World Bank, Macroeconomics, Trade, and Investment Global Practice–Latin America.
Note: The index values are based on projections (as of March 28, 2023). e = estimate; f = forecast; GDP = gross domestic product.
Degree of Underperformance by Subregion
Sources: National authorities; Haver Analytics; Global Economic Prospects (World Bank, January 2023).
Note: The pre-pandemic trend was calculated using the average growth rates over 2015–19. e = estimate; f = forecast.
percentage points (p.p.) below their pre-pandemic potential output in 2022 given the slow recovery of travel to the region. The gap is estimated to remain about 5 p.p. by 2024.
Consensus
forecasts for GDP growth in 2023
worsened for all regions
in the world in
2022 (figure 1.6). Starting from already pessimistic growth expectations, as of January 2023, LAC has been relatively resilient to the lower forecast, losing around 1.2 p.p., compared to North American and Western European economies, which lost 2 p.p. The outlook has worsened the most for Chile, Argentina, and Colombia, while the forecasts for Brazil and Mexico have stabilized, and Peru tops the list with the highest predicted growth, at 2.1 percent.
With the changing forecasts, rising global uncertainty has rendered the outlook increasingly speculative. Figure 1.7 shows the dramatic increase in the spread of industry forecasts. It is also notable that the increase in LAC’s spread is not larger than, for instance, that for the United States.
Index, 2019 = 100 Sub-Saharan Africa South Asia Middle East and the North Africa Latin America and the Caribbean Europe and the Central Asia East Asia and the Pacific 113 123 111 108 112 124 90 95 100 105 110 115 120 125 130 2019 2020 2021 2022e 2023f 2024f
Figure
Gross Domestic Product (2019=100) a. South America (median) 80 85 90 95 100 105 110 115 120 20152019201720182019202020212022e2023f2024f 20152019201720182019202020212022e2023f2024f 20152019201720182019202020212022e2023f2024f Pre-pandemic trend Actual GDP level 80 85 90 95 100 105 110 115 120 80 85 90 95 100 105 110 115 120
Central America (median) c.
(median)
Figure 1.4.
b.
Caribbean
cHAPT e R I | sTR eng TH en I ng Res I l I ence, Boos TI ng gR ow TH The promise of in T egraT ion 19
Figure 1.5. Caribbean Economies Are Still Reeling from Unrecovered Loss of Tourism
Sources: United Nations World Tourism Organization; Our World in Data.
Note: The annualized index for 2022 was estimated as y_2022^E=y_sep×(1+x (percent)), where y_sep corresponds to data collected until September 2022, and x percent is the proportion of arrivals as of the fourth quarter of 2018 over the sum of arrivals between the first and third quarters of 2018.
Figure 1.6. Expectations for 2023 Growth Fell over 2022
GDP Consensus Forecasts
Source: Consensus Economics.
Note: GDP = gross domestic product; LAC = Latin America and the Caribbean.
Four key factors drive LAC’s weakening performance (figure 1.8). First, global interest rates are expected to remain high and rising (panel d). Although the US Federal Reserve has slowed the pace of interest rate hikes, disappointing progress on inflation combined with strong job reports in February have led to expectations of further rate hikes. Second, demand from LAC’s principal export destinations is expected to remain lackluster as growth in the Group of Seven (G7) is constrained by contractionary monetary policy and energy shocks from the war (panel a). Third, there is uncertainty as China recovers tentatively from the COVID-19 lockdown (panel b). Fourth, weak demand has also led to a softening of commodity prices (panel c). An additional consideration, discussed in chapter 2, is that greater geopolitical uncertainty, a desire for closer supply chains, and higher G7 returns are driving capital flows away from many developing countries, including LAC, with the notable exception of Mexico.
for 2023 a. World regions b. Countries in LAC -0.5 0.0 0.5 1.0 1.5 2.0 2.5 3.0 3.5 4.0 4.5 5.0 Jan Feb Mar Apr May Jun Jul Aug Sep Oct Nov Dec Jan Percent change over previous year Asia Pacific Eastern Europe Latin America North America Western Europe World -1.5 -1.0 -0.5 0.0 0.5 1.0 1.5 2.0 2.5 3.0 3.5 Percent change over previous year Argentina Brazil Chile Colombia Mexico Peru 2023 2022 Jan Feb Mar Apr May Jun Jul Aug Sep Oct Nov Dec Jan 2023 2022
International Tourist Arrivals by year 0 20 40 60 80 100 120 140 160 Caribbean Central America South America Index, 2011-2016=100 1995199619971998199920002001200220032004200520062007200820092010201120122013201420152016201720182019202020212022
20 cHAPT e R I | sTR eng TH en I ng Res I l I ence, Boos TI ng gR ow TH The promise of in T egraT ion
Figure 1.7. Consensus Forecasts Have Become More Volatile after the COVID-19 Pandemic Standard Deviation of GDP (percent change) Forecasts for Current Year
Sources: Consensus Economics; World Bank staff calculations.
Note: LAC(5) represents the simple average of the values for Brazil, Chile, Colombia, Mexico, and Peru. GDP = gross domestic product; LAC = Latin America and the Caribbean.
b. China’s growth
Sources: World Bank Commodity Prices (Pink Sheets); International Monetary Fund World Economic Outlook database; US Department of the Treasury.
Note: f = forecast; G7 = Group of Seven.
Figure 1.8. Continued Headwinds
External Factors -2 -1 0 1 2 3 4 5 6 7 8 2021:Q32021:Q42022:Q12022:Q22022:Q32022:Q4 2023f 2024f 2025f 2021:Q32021:Q42022:Q12022:Q22022:Q32022:Q4 2023f 2024f 2025f Percent -2 -1 0 1 2 3 4 5 6 7 8 Percent 85 105 125 145 165 185 205 225 245 2019:Q12019:Q22019:Q32019:Q42020:Q12020:Q22020:Q32020:Q42021:Q12021:Q22021:Q32021:Q42022:Q12022:Q22022:Q32022:Q42023f2024f2025f 2019:Q12019:Q22019:Q32019:Q42020:Q12020:Q22020:Q32020:Q42021:Q12021:Q22021:Q32021:Q42022:Q12022:Q22022:Q32022:Q4 2023f2024f2025f Index, 2016:Q2 = 100 0 1 2 3 4 5 6 Percent Fed Funds Rate Real Yield on 10-year U.S. Treausry T-note c. Commodity Price Index
G7 growth d. Fed funds rate and 10-year US Treasury yield
on
a.
0.0 0.2 0.4 0.6 0.8 1.0 1.2 Jan-15 Jan-16 Jan-17 Jan-18 Jan-19 Jan-20 Jan-21 Jan-22 Jan-23 China Euro area LAC(5) United States
cHAPT e R I | sTR eng TH en I ng Res I l I ence, Boos TI ng gR ow TH The promise of in T egraT ion 21
However, business confidence levels remain at or above their historical means (represented by 100 in figure 1.9, panel a), although they displayed a downward trend in 2022. The case of Chile is the most salient, with a steep decline in business expectations since the second quarter of 2021. Meanwhile, consumer confidence remains subdued, with most countries reporting low levels relative to historical means (figure 1.9, panel b).
Source: OECD (2023).
Note: For both indexes, the historical mean = 100. OECD = Organization for Economic Co-operation and Development.
Missing on Long-Run Growth
As with the stock market, the more important focus is on the long run, and here the news remains disconcerting. The low forecasted growth rates for 2024 do not reflect post-pandemic scarring or even the fight against inflation as they are roughly the same as those of the 2010s, when world output grew at 3.1 percent and LAC’s output grew at only 2.2 percent. The stabilization of the region’s economies should generate more room to turn again to the longer term reform agenda, including, as chapter 2 argues, how the region can better take advantage of the greening and potentially fragmenting global economy.
90 92 94 96 98 100 102 104 106 Jan-18Mar-18May-18Jul-18Sep-18Nov-18Jan-19Mar-19May-19Jul-19Sep-19Nov-19Jan-20Mar-20May-20Jul-20Sep-20Nov-20Jan-21Mar-21May-21Jul-21Sep-21Nov-21Jan-22Mar-22May-22Jul-22Sep-22Nov-22 92 94 96 98 100 102 104 106 Jan-18Mar-18May-18Jul-18Sep-18Nov-18Jan-19Mar-19May-19Jul-19Sep-19Nov-19Jan-20Mar-20May-20Jul-20Sep-20Nov-20Jan-21Mar-21May-21Jul-21Sep-21Nov-21Jan-22Mar-22May-22Jul-22Sep-22Nov-22 Brazil Chile Colombia Costa Rica Mexico OECD - Total
Business confidence (index)
Consumer confidence (index)
Figure 1.9. Resilience in Business Confidence, Subdued Consumer Confidence
a.
b.
22 cHAPT e R I | sTR eng TH en I ng Res I l I ence, Boos TI ng gR ow TH The promise of in T egraT ion
Labor Markets and Social Conditions
Incoming data provide a clearer picture of the social costs of the pandemic and how the region has recovered. Employment recovered remarkably fast in LAC. As figure 1.10 shows, by the third quarter of 2021, a little over a year after the collapse driven by the pandemic, employment had recovered its pre-pandemic levels in most of the countries in the region. To put this in perspective, LAC countries’ recovery, which started from a significantly lower level, preceded the US recovery by at least one quarter.
Unfortunately, the good news on the growing numbers of employed workers has been eclipsed by an apparent deterioration in the quality of employment. Using the Job Quality Index, which combines income, benefits, security, and satisfaction as the main set of dimensions that characterize a good job (Brummund, Mann, and Rodriguez-Castelan 2018), figure 1.11 shows lower benefit and job security levels than in pre-pandemic times. These measures have reverted on average to levels seen more than a decade ago (in 2009). Peru, Bolivia, Colombia, and Panama have had the most significant declines in the Job Quality Index due to worsening benefits and job security. This implies that workers in these countries face higher levels of vulnerability and are more exposed to shocks. There have also been cuts in benefits in Ecuador, the Dominican Republic, and Paraguay. Income makes a smaller contribution to the drop in the index than the other three dimensions across countries, with the largest declines in Ecuador, Panama, and Peru.
Although the significant drop in benefits seems to point toward an overall increase in labor informality in the region, figure 1.12 shows that the changes in the percentage of informal workers over the past three years have been heterogeneous across the region. While informality increased in Ecuador (11 p.p.) and Argentina (3.4 p.p.), it remained at similar levels in Brazil and Colombia and decreased in Chile (4.4 p.p.) and Paraguay (2.9 p.p.).
While already large gender gaps in employment grew after the pandemic across the region (World Bank, 2022a), splitting informality data by gender shows similar levels of informality among female workers and relative to pre-pandemic times.
60 65 70 75 80 85 90 95 100 105 110 2019:Q1 2019:Q2 2019:Q3 2019:Q4 2020:Q1 2020:Q2 2020:Q3 2020:Q4 2021:Q1 2021:Q2 2021:Q3 2021:Q4 2022:Q1 2022:Q2 2022:Q3 2022:Q4 Argentina Brazil Chile Colombia Mexico Peru United States Index, 2019:Q1 = 100
Figure 1.10. Strong Employment Recovery… Total Employment
cHAPT e R I | sTR eng TH en I ng Res I l I ence, Boos TI ng gR ow TH The promise of in T egraT ion 23
Sources: International Labour Organization ILOSTAT database; World Bank staff calculations.
Andean region
Southern Cone
Brazil
Source: CEDLAS and World Bank, forthcoming.
Note: The values are the share of informal employment in total employment. Informality refers to workers ages 15–64 who do not receive a pension. In Argentina, Chile, Ecuador, and Paraguay, self-employed workers are not asked about pensions; therefore, in this figure, self-employed workers in these countries who have completed tertiary education are considered formal workers. The data are from February 13, 2023.
As illustrated in figure 1.13,8 the pandemic did not lead to a significant change in poverty rates compared with 2019–20. However, excluding Brazil and its generous family support programs, the picture is decidedly less positive. The region’s poverty rate, measured at $6.85 a day (2017 purchasing power parity (PPP)), increased from 29.7 percent in 2019 to 34.4 percent in 2020, with approximately 19 million people falling into poverty and setting back previous gains by seven years or more.
The transfers in Brazil served to diminish the impact on the middle class (per capita income between $14 and $81 per day in 2017 PPP). The vulnerable population, those with a high probability of falling into poverty, increased in Brazil but arguably not by as much as in other countries. This was because in Brazil, government support prevented many from crossing the threshold. This did not happen in the rest of the region, resulting in 13 million
2021-19 -20 -15 -10 -5 0 5 Ecuador Panama Peru Costa Rica Colombia Dominican Republic Latin America and the Caribbean Paraguay Uruguay Brazil Bolivia El Salvador Argentina Income Benefits Satisfied Security Percent change
Figure 1.11. … But Not the Same Quality of Employment Change in Job Quality Index and components,
Sources: World Bank estimates based on data from the Socio-Economic Database for Latin America and the Caribbean; CEDLAS and World Bank, forthcoming.
59.3 59.5 61.0 57.3 55.8 61.7 66.3 66.5 0 10 20 30 40 50 60 70 80 90 100 Q1 Q2 Q3 Q4 Q1 Q2 Q3 Q4 Q1 Q2 Q3 Q4 Q1 Q2 Q3 2019 2020 2021 2022 Colombia Ecuador 43.9 35.5 43.0 47.3 31.6 21.7 25.9 27.2 69.7 68.3 69.0 66.8 0 10 20 30 40 50 60 70 80 90 100 Q1 Q2 Q3 Q4 Q1 Q2 Q3 Q4 Q1 Q2 Q3 Q4 Q1 Q2 Q3 2019 2020 2021 2022 Argentina Chile Paraguay
Figure 1.12. Small Changes in the Already High Level of Informality (percent)
a.
36.5 33.8 36.2 35.4 0 10 20 30 40 50 60 70 80 90 100 Q1 Q2 Q3 Q4 Q1 Q2 Q3 Q4 Q1 Q2 Q3 Q4 Q1 Q2 Q3 2019 2020 2021 2022
b.
c.
24 cHAPT e R I | sTR eng TH en I ng Res I l I ence, Boos TI ng gR ow TH The promise of in T egraT ion
Figure 1.13. COVID-19 Reversed a Decade of Progress in Decreasing Poverty in Most Countries but Not in Brazil
a. Poverty in LAC at $6.85 per day, 2017 PPP (percent)
b. Vulnerability in LAC at $6.85-$14 per day, 2017 PPP (percent)
c. Middle class in LAC at $14-$81 per day, 2017 PPP (percent)
Sources: SEDLAC; CEDLAS and World Bank, forthcoming.
Note: The LAC aggregate is based on 18 countries in the region for which microdata were available. In cases where data were unavailable, values were interpolated or extrapolated using data from the World Development Indicators and then pooled to create regional estimates (from 2014 backward) and microsimulations (from 2015 onward). Due to important methodological changes in Mexico’s official household survey in 2016, which created a break in the poverty series, a break was created in the LAC-18 aggregate. The values for 2021 are based on SEDLAC’s preliminary data for 11 countries and micro-simulations for the remaining countries. The data are from October 3, 2022. SEDLAC = Socio-Economic Database for Latin America and the Caribbean. LAC = Latin America and the Caribbean; PPP = purchasing power parity.
people dropping from the middle class. In Brazil, the transfers increased the size of the middle class by 2.1 p.p. The country not only protected families from falling into poverty, but also lifted many people out of poverty in 2020.
As shown in figure 1.14, Brazil’s transfers during 2020 had a significant effect on inequality. The Gini coefficient for the region including Brazil dropped a full point during the pandemic. This was achieved by protecting the most vulnerable during the worst of the pandemic, while the highest income deciles were heavily affected. For the LAC region excluding Brazil, inequality increased during the pandemic despite generalized government efforts to cushion the impact of the health crisis in most countries. The Gini coefficient (excluding Brazil) increased by 0.9 point during the pandemic, from 48.8 in 2019 to 49.7 in 2020.
Figure 1.14. Overall Inequality Remains at Pre-Pandemic Levels
a. LAC Gini coefficient trends
b. LAC growth incidence curves
Gini (with Brazil) Gini (without Brazil)
Sources: SEDLAC; CEDLAS and World Bank, forthcoming.
2019-2020
2020-2021
Note: In panel a, the LAC aggregate is based on 18 countries in the region for which microdata were available. In cases where data were unavailable, the values were interpolated or extrapolated using data from the World Development Indicators and then pooled to create regional estimates (from 2014 backward) and microsimulations (from 2015 onward). Due to important methodological changes in Mexico’s official household survey in 2016, which created a break in the poverty series, a break was created in the LAC-18 aggregate. The values for 2021 are based on SEDLAC’s preliminary data for 11 countries and microsimulations for the remaining countries. The data are from October 3, 2022. For panel b, The LAC aggregate is based on nine countries in the region for which microdata were available for 2019, 2020, and 2021. LAC = Latin America and the Caribbean; SEDLAC = Socio-Economic Database for Latin America and the Caribbean.
28.4 28.6 30.3 28.8 29.7 34.4 31.4 31.0 25 26 27 28 29 30 31 32 33 34 35 36 37 38 39 40 2015 2016 2017 2018 2019 2020 20212022e 2015 2016 2017 2018 2019 2020 20212022e 2015 2016 2017 2018 2019 2020 20212022e Poor (with Brazil) Poor (without Brazil) 30.8 32.6 31.9 31.5 32.7 32.2 32.5 32.9 25 26 27 28 29 30 31 32 33 34 35 36 37 38 39 40 Vulnerable (with Brazil) Vulnerable (without Brazil) 38.6 36.8 35.9 37.6 36.2 32.1 34.8 34.6 25 26 27 28 29 30 31 32 33 34 35 36 37 38 39 40 Middle Class (with
Middle Class (without
Brazil)
Brazil)
-8 -7 -6 -5 -4 -3 -2 -1 0 1 2 3 1 2 3 4 5 6 7 8 9 10 Growth Rate (Annualized) Deciles of Per Capita Household Income 51.0 50.0 50.6 50.8 48.8 49.7 48.7 48.8 47 48 48 49 49 50 50 51 51 52 52 2015 2016 2017 2018 2019 2020 2021 2022e
cHAPT e R I | sTR eng TH en I ng Res I l I ence, Boos TI ng gR ow TH The promise of in T egraT ion 25
Effects of the Russian Invasion of Ukraine
The Russian invasion of Ukraine slowed LAC’s poverty recovery by increasing food and energy prices, which led to a reduction in household purchasing power. Domestic fertilizer prices for farmers in LAC are still around 2.5 times higher than pre-pandemic levels. The higher costs of such inputs (coupled with droughts in some areas) are adversely affecting farmers’ livelihoods and reducing planting areas and/or yields. The food crisis may turn from issues of affordability (food access) to issues of availability (food production) in 2023 in some countries and subregions where harvests may be below average.
As shown in figure 1.15, panel a, the impacts on poverty vary significantly within the region. Countries and subregions are experiencing exacerbated poverty (Colombia, Peru, and Costa Rica), social tensions (Panama), and food insecurity (Central America, Haiti, and Andean countries).
Source: World Bank estimations based on microsimulation.
Note: The figures compare 2022 (considering the scenario with additional inflation based on Annual Meetings assumptions) vs. 2022 (considering the scenario with baseline inflation according to Spring Meetings assumptions). LAC = Latin America and the Caribbean; p.p. = percentage points; PPP = purchasing power parity.
In absolute terms, an estimated 5.5 million people have been pushed into poverty, with the countries with the largest populations, like Mexico, Brazil, and Colombia, seeing the largest increases. Simulation results indicate that the inflation crisis has also exacerbated inequality (as measured by Gini coefficient points), with varied impacts across countries. In Colombia and Nicaragua, the estimated rise in inequality is triple the regional average; in Brazil, Uruguay, and Panama, it is less than half the rise in the region (figure 1.15, panel b).
2.3 2.2 1.8 1.8 1.4 1.3 1.3 1.2 1.2 1.0 0.9 0.8 0.5 0.4 0.3 0.2 0.0 0.5 1.0 1.5 2.0 2.5 CostaRica Peru ColombiaDominicanRepublicNicaragua Paraguay MexicoElSalvador Ecuador LAC Honduras Chile BrazilGuatemala Uruguay Panama 0.5 0.5 0.3 0.2 0.2 0.2 0.1 0.1 0.1 0.1 0.1 0.1 0.1 0.1 0.0 0.0 0.0 0.1 0.2 0.3 0.4 0.5 0.6 Colombia Nicaragua ParaguayElSalvador Mexico ChileCostaRica HondurasGuatemala LACDominicanRepublic Ecuador Peru Brazil Uruguay Panama
Poverty at
(p.p.
Inequality (p.p. change)
Figure 1.15. Estimated Social Costs of Food Inflation in the Region: Changes in Headcount Poverty and Inequality, 2022 (percentage point change)
a.
$6.85 per day, 2017 PPP
change) b.
26 cHAPT e R I | sTR eng TH en I ng Res I l I ence, Boos TI ng gR ow TH The promise of in T egraT ion
Policy responses in the region continue to be dominated by subsidies and price controls, tax measures, and social assistance (in that order). Within subsidies and price controls, fuel subsidies are still the leading response (44 percent of the subsidy response), more than in any other region. Inertia in policy measures remains a concern and many measures are not timebound, with the concomitant risk of long-term policy distortions and fiscal pressures.
The Macro Panorama: Difficult but Resilient
The region’s fiscal and monetary authorities continue to manage a difficult combination of higher interest rates, complicating the service on a higher stock of public debt, and resistant inflation. Both restricted fiscal space and tight monetary policy are likely to remain the norm going forward. However, the region’s resilience and success relative to historical experience have provided a level of almost normalcy in LAC policy that would have been unimaginable a generation ago. Preserving the hard-won gains in macroeconomic management and credibility over the past decades is as critical as increasing vaccinations is for resilience in the health sphere.
Fiscal Space Continues to Be Limited, with Heavy Financing Costs, but the Markets Remain Calm
LAC’s regional fiscal deficit widened significantly to 8.7 percent of GDP in 2020 as governments struggled to protect their citizens from the effects of the COVID-19 pandemic. Helped by the growth rebound, significant fiscal retrenching occurred in 2021. The regional deficit decreased to 4.4 percent of GDP, although further progress in consolidating public balances was minimal in 2022 as the region’s fiscal deficit for 2022 is estimated at 4.4 percent of GDP.
At the country level, the efforts of large economies, such as Brazil, Colombia, Mexico, and Peru, to post a primary surplus or near surplus in 2023 will be insufficient to offset growing interest payments on elevated
Fiscal Balance in LAC - 2023 Forecast Percent of GDP
Overall Fiscal Balance Primary Fiscal Balance -10 -8 -6 -4 -2 0 2 4 6 8 BrazilBolivia St.Vincentand
ElSalvadorMexicoArgentinaHondurasDominicanRepublicHaitiPanamaCostaRicaAverageLACUruguayParaguayChileNicaraguaPeruSt.LuciaGuatemalaSurinameBarbadosBelizeDominicaJamaicaEcuadorGrenada Source: World Bank, Macroeconomics, Trade, and Investment Global Practice–Latin America. Note: Values are based on projections (as of March 24, 2023). GDP = gross domestic product; LAC = Latin America and the Caribbean. cHAPT e R I | sTR eng TH en I ng Res I l I ence, Boos TI ng gR ow TH The promise of in T egraT ion 27
Figure 1.16. Increased Primary Surpluses Are Insufficient to Cover Growing Interest Payments
theGrenadinesBahamasGuyanaColombia
public debt stocks, resulting in relatively large overall deficits (figure 1.16). The large deficits continued to erode the already tight fiscal space across the region, driven by the increased expenditures during the pandemic, which raised average indebtedness in 2022 by 17.9 p.p. of GDP compared to 2010. Most of the increase accumulated since the start of the pandemic, with an average increase of 7.5 p.p. of GDP since 2019. Among the large economies, the public debt-to-GDP ratios of Argentina, Bolivia, Brazil, Colombia, and Ecuador have increased by more than 20 p.p. since 2010 (figure 1.17), with most of the increase again concentrated during the past three years.
While economies like Brazil, Colombia, and Mexico are starting to see relatively large increases in financing costs (figure 1.18), these increases seem to be associated with the mechanical adjustment to higher interest rates in advanced economies and the aggressive rate hikes conducted by domestic central banks in response to accelerating inflation. The increases are less related to large market-imposed risk premiums.
International investors have remained calm in the wake of the region’s current debt challenges, reflecting broad confidence in the overall management strategy. Sovereign spreads remain higher than they were during the period preceding the pandemic, but not dramatically so. To put this in perspective, both levels and increases in spreads for the large economies in the region are of the same order of magnitude as those currently faced by Southern European economies (figure 1.19) and are rated “above investment” grade.
The situation will become more difficult should interest rates continue to rise in advanced countries, and the search for fiscal space will continue as will the search for new sources of revenues and savings. These issues were discussed in the October 2022 LACER (World Bank 2022b). However, at present, the markets seem to deem that the situation is manageable.
Figure 1.17. Public Debt Is Significantly Higher Than It Was a Decade Ago General Government Debt
ElSalvador
theGrenadines JamaicaBahamasSt.LuciaDominicaBarbadosSuriname Percent of GDP 2022e 2010 2019 0 20 40 60 80 100 120 140 160
Note: GDP = gross domestic product. e = estimate. 28 cHAPT e R I | sTR eng TH en I ng Res I l I ence, Boos TI ng gR ow TH The promise of in T egraT ion
Guyana Haiti Guatemala PeruParaguayChileMexicoHondurasEcuadorDominicanRepublicPanamaUruguayColombiaNicaraguaGrenadaCostaRica LatinAmericaandtheCaribbean BrazilArgentinaBelizeBolivia
St.Vincentand
Source: Macro Poverty Outlook, 2023.
Figure 1.18. Interest Rates Are Increasing… Implicit Interest Rates
Figure 1.19. … But the Increases Are Not Mainly Driven by Risk Spreads Sovereign Spreads
Progress on Reducing Inflation
For the region excluding Argentina and the República Bolivariana de Venezuela, inflation closed out 2022 at an average of 7.9 percent, which was below that of the Organization for Economic Co-operation and Development and Eastern Europe but above that of East Asia (figure 1.20). Monthly inflation peaked in April 2022 at 1 percent and fell to 0.4 percent in January 2023 (figure 1.21); yearly inflation is expected to fall to 5.0 percent in 2023.
Although inflation pressures remain formidable, expectations remain well anchored at historically low levels, ranging from 2 to 4.5 percent (figure 1.22).
LAC’s relative success in fighting inflation is largely due to early action on the part of regional central banks, which reacted up to a year earlier than the US Fed in the case of Brazil and increased rates much more aggressively than in past episodes (figure 1.23). However, as shown in figure 1.24, in no case is a large economy in LAC expected to
0 2 4 6 8 10 12 Brazil Chile Colombia Mexico Peru Percent 2010-2019 2021 2023f
Sources: World Bank, Macroeconomics, Trade, and Investment Global Practice–Latin America; World Bank staff calculations.
Note: Values are based on projections (as of March 28, 2023). f = forecast.
50 150 250 350 450 Brazil Chile Colombia Mexico Peru Greece Portugal Spain Basis points 2015 - 2019 2021 2022 - 2023
Source: JP Morgan.
cHAPT e R I | sTR eng TH en I ng Res I l I ence, Boos TI ng gR ow TH The promise of in T egraT ion 29
Note: The figure shows Emerging Market Bond Index global diversified spreads for Latin America and the Caribbean, and the spreads for 10-year government bonds against 10-year German bonds for Greece, Portugal, and Spain.
Figure 1.20. LAC Kept Inflation below the Rates in OECD Countries in 2022 Annual Inflation in 2022
PanamaBoliviaEcuadorEastAsia Brazil BelizeElSalvadorMexicoDominicanRepublicCostaRicaLAC(mean) withoutArgentinaParaguayUruguay PeruGuatemalaJamaicaOECD-TotalHondurasNicaragua ChileColombiaEasternEuropeArgentina
Sources: Macro Poverty Outlook, World Bank (2023); OECD (2023); World Economic Outlook database (October 2022). Note: The annual inflation rate represents the percent change in end-of-period consumer prices. Aggregates are calculated by taking simple averages of the countries in the group. LAC = Latin America and the Caribbean; OECD = Organization for Economic Co-operation and Development.
Figure 1.21. Inflation Rates Declined Sharply in the Second Half of 2022
monthly inflation (Median, sa m-o-m)
Sources: National authorities; Haver Analytics.
Note: LAC = Latin America and the Caribbean; sa m-o-m = seasonally adjusted month-over-month.
Figure 1.22: Long-Term Inflation Expectations Remain Anchored at Historical Lows Long-term Inflation Expectations (6 to 10 years)
Source: Consensus Economics.
Note: Inflation expectations represent the average long-term forecasts (6 to 10 years) of consumer price inflation (percent change from previous December). y-o-y = year over year.
Jan Dec Nov Oct Sep Aug Jul Jun May Apr Mar Feb 2022 2023 0.5 0.4 0.5 0.4 0.5 0.5 0.7 0.7 0.8 0.6 1.0 0.9 0 0.2 0.4 0.6 0.8 1 1.2
LAC
1.0 1.5 2.0 2.5 3.0 3.5 4.0 4.5 5.0 5.5 2010 2011 2012 2013 2014 2015 2016 2017 2018 2019 2020 2021 2022 Brazil Chile Colombia Mexico Peru Percent,
y-o-y
95 0 5 10 15 20 25 30 35 40
Percent
30 cHAPT e R I | sTR eng TH en I ng Res I l I ence, Boos TI ng gR ow TH The promise of in T egraT ion
Figure 1.23. Aggressive Rate Hikes Are Starting to Soften. Does This Reflect a Change in the Cycle?
meet its official inflation target before 2024; therefore, even if they do not increase, policy rates will remain high. The situation puts economies in the standard trade-off of risking slower growth or risking inflation remaining unchecked. There are heated discussions on this trade-off in some parts of the region.
1.24. Inflation Is Still Too High, but Countries Are Expected to Meet Their Central Bank Targets in 2024
Latin American central banks have particular experience in managing inflation. The so-called Developing Country Monetary Policy Dilemma (Vegh et al. 2017) has long required monetary policy to move pro-cyclically, in contrast to the advanced countries—that is, as the economy weakens, interest rates are frequently raised. For instance, a fall in the terms of trade would not only depress growth, but also require a further depressing (procyclical) rise in interest rates to defend the exchange rate. This is necessary to prevent inflation pass-through, minimize increased pressure on servicing largely foreign-denominated debt, and bolster confidence that the situation was being stabilized and exchange rates would not depreciate further. As a result, whereas in the advanced countries, monetary policy moves countercyclically, dampening excessive exuberance and mitigating downturns, the reverse has been the case in LAC. To illustrate, figure 1.25, panel b, shows that in advanced countries, as growth falls, inflation also falls, consistent
a story
raise interest rates to reduce excess demand. However, panel a shows that in LAC, as inflation rises, interest rates rise and growth falls. This pattern is clear across countries in the region (annex 1A).
As previous issues of LACER have documented (for example, World Bank 2017), since roughly 2004, LAC’s monetary authorities have moved toward a countercyclical policy.9 This change has allowed the region’s central banks to lean more against downturns and the resulting unemployment, instead of aggravating them.
with
where authorities
Inflation Forecasts
Targets Brazil Chile Colombia Mexico Peru Inflation Target Range Long-term Forecast Forecast for December 2023 Forecast for December 2024 Percent, y-o-y 0 1 2 3 4 5 6 7 8 9 Source: Consensus Economics. Note: The survey date was March 20, 2023. y-o-y = year over year.
Figure
and Central Bank
Brazil Chile Colombia Costa Rica Mexico Peru Percent Episodes of monetary tightening (months) Current Episode Previous Episode 0 2 4 6 8 10 12 14 M0 M2 M4 M6 M8 M10 M12 M14 M16 M18 M20 M22 M24 M0 M2 M4 M6 M8 M10 M12 M14 M16 M18 M20 M22 M24 M0 M2 M4 M6 M8 M10 M12 M14 M16 M18 M20 M22 M24 M0 M2 M4 M6 M8 M10 M12 M14 M16 M0 M2 M4 M6 M8 M10 M12 M14 M16 M18 M20 M22 M24 M0 M2 M4 M6 M8 M10 M12 M14 M16 M18 M20
Haver Analytics. cHAPT e R I | sTR eng TH en I ng Res I l I ence, Boos TI ng gR ow TH The promise of in T egraT ion 31
Source:
Figure 1.25. LAC Countries Suffer from a Different Relationship between Recessions and Inflation
a. Average business cycle: LAC
b. Average business cycle: Advanced countries
Source: Rojas, Vegh, Vuletin (2023).
Note: After identifying the different episodes of recessions, each “trough” is defined as the quarter with the minimum growth rate during an episode. The quarters are labeled as the moment zero on the x-axis. Then, for each quarter around the “trough,” the difference between the growth rate in that quarter and the growth rate at the trough is calculated. To normalize the growth rates, the deviation from the trough is then divided by the standard deviation of the growth rate (calculated over all quarters). A similar expression is calculated for (annual) inflation. Average weighted by population. GDP = gross domestic product; LAC = Latin America and the Caribbean.
The experience managing the monetary dilemma has also led to a policy pattern termed “the cycle within the cycle,” which is appropriate for the present context (Rojas, Vegh, Vuletin (2023)). As inflation increases, so does the policy rate, but once inflation stabilizes and/or decreases, the monetary authority can pause and eventually decrease rates to stimulate production. After the recovery in 2021, growth decelerated over 2022, while at the same time inflation has risen across the region in the standard pattern. As in the past, policy rates have been increasing to stabilize inflation (figure 1.26). As inflation levels off and decreases, as in the cases in Brazil, Chile, Mexico, and Peru, history suggests that there will be a reversal in monetary policy across the region as countries start to address subdued demand issues by loosening their monetary grip. Chile and Brazil have already announced pauses in further rate increases. Although the region is not out of the inflationary difficulties and further adverse shocks can be expected, LAC is miles away from the inflations of decades past.
The Need to Defend Hard-Won Economic Resilience
While in no sense is LAC out of the macroeconomic difficulties, it is clear that the region has made great strides toward a more macroeconomic “normalcy” as seen in the three areas discussed above, i.e. overall decrease macroeconomic volatility, price stability, countercyclical monetary policy. The rise in interest rates and slow growth compound increased debt difficulties. However, international markets are calm and this is the second major crisis when Latin America has not fared especially worse than average. These are signs of increased resilience and reflect the region’s respectable performance in fighting inflation and its move toward countercyclical monetary policy.10,11
The improvement in macro performance and resilience is largely due to reforms implemented over the past 25 years, in response to the raging inflation of the 1970s and 1980s, which led to a deep slump in real incomes and social discontent. The improved performance reflects three main changes.
Increased professionalization of authorities and stronger institutionalization. Finance ministries and monetary and supervisory authorities have become more professional, and regulation has become more effective, gaining in institutional strength over time. Often, central banks and ministries of finance are staffed
-0.5 -0.4 -0.3 -0.2 -0.1 0 0.1 0.2 0 0.2 0.4 0.6 0.8 1 1.2 1.4 1.6 1.8 -3 -2 -1 0 1 2 3 Inflation and Policy rate Growth -0.2 -0.1 0 0.1 0.2 0.3 0.4 0.5 0 0.2 0.4 0.6 0.8 1 1.2 1.4 -3 -2 -1 0 1 2 3 Inflation and Policy rate Growth Growth Policy rate Inflation
32 cHAPT e R I | sTR eng TH en I ng Res I l I ence, Boos TI ng gR ow TH The promise of in T egraT ion
Figure 1.26. Current Policy Dilemma for LAC: Actual Inflation, Target, and Policy Rate
Rojas, Vegh, Vuletin (2023).
Note: Inflation refers to the percentage change in the Consumer Price Index with respect to the same month in the previous year. Similarly, growth refers to the percentage change in quarterly real gross domestic product with respect to the same quarter in the previous year. LAC = Latin America and the Caribbean.
-20 -15 -10 -5 0 5 10 15 20 0 10 20 30 40 50 60 70 80 90 100 Growth (percent) Inflation and Policy rate (percent) Inflation and Policy rate (percent) Inflation and Policy rate (percent) Inflation and Policy rate (percent) Inflation and Policy rate (percent) -10 -5 0 5 10 15 0 2 4 6 8 10 12 14 Growth (percent) Growth (percent) -20 -15 -10 -5 0 5 10 15 20 2 3 4 5 6 7 8 9 10 Growth (percent) -38 -28 -18 -8 2 12 22 32 42 0 1 2 3 4 5 6 7 8 9 10 Growth (percent) Inflation Lower Bound Upper Bound Policy rate Growth a. Argentina b. Brazil c. Chile d. Mexico e. Peru 2019 2020 2021 2022 Jan Mar May Jul Sep Nov Jan Mar May Jul Sep Nov Jan Mar May Jul Sep Nov Jan Mar May Jul Sep Nov 2019 2020 2021 2022 Jan Mar May Jul Sep Nov Jan Mar May Jul Sep Nov Jan Mar May Jul Sep Nov Jan Mar May Jul Sep Nov 2019 2020 2021 2022 Jan Mar May Jul Sep Nov Jan Mar May Jul Sep Nov Jan Mar May Jul Sep Nov Jan Mar May Jul Sep Nov 2019 2020 2021 2022 Jan Mar May Jul Sep Nov Jan Mar May Jul Sep Nov Jan Mar May Jul Sep Nov Jan Mar May Jul Sep Nov 2019 2020 2021 2022 Jan Mar May Jul Sep Nov Jan Mar May Jul Sep Nov Jan Mar May Jul Sep Nov Jan Mar May Jul Sep Nov -20 -15 -10 -5 0 5 10 15 20 -1 1 3 5 7 9 11 13 15
Source:
cHAPT e R I | sTR eng TH en I ng Res I l I ence, Boos TI ng gR ow TH The promise of in T egraT ion 33
by economists who have graduated from the best regarded universities in the world, and LAC economists are full partners in global macroeconomic debates. This has led to both better management and enhanced credibility.
Central bank independence and inflation targeting. In the 1990s, most of the region’s central banks were granted political and operational independence to enhance their inflation-fighting powers. Studies have shown this has led to decreased inflation over time and reduced the incidence of inflationary outbreaks.12 Institutionality, which is the rule among advanced countries, has been central. The adoption of clear inflation targets also enhances predictability. The tensions seen with some political authorities today is also “normal” in the sense that the most important purpose of independence everywhere is precisely to insulate the longterm goal of price stability from pressures arising from short-term output concerns or the need to finance fiscal deficits, and to create expectations that this is, in fact, the case.
Increased armor. Regional authorities have taken steps to build a better defense against shocks. Foreigndenominated debt has nearly halved since 2004, falling from 60 to 35 percent of total debt in 2021. As shown in figure 1.27, the currency denomination of public debt varies substantially among LAC economies, but in the two powerhouses in the region, Brazil and Mexico, public debt is mostly denominated in domestic currency (94 and 81 percent, respectively).
In addition, central bank reserves have almost doubled, from 12 percent of GDP in 2004 to 20 percent in 2021, and they have remained high after the pandemic (figure 1.28).
Lower foreign exposure and more tools to defend currencies have significantly reduced the risk of unsustainable currency mismatches, which caused a lot of trouble in the past.
Taken together, the historically modest rates of inflation, increased resilience to shocks (and the relative calmness of international markets), and ability to use monetary policy countercyclically all reflect a hardwon increased confidence in the region’s institutions and policies. These gains and the consolidation of institutionality face challenges in the context of political tensions in the region. However, they need to be defended as macroeconomic stability is a critical foundation for the investment and innovation that are necessary to take advantage of changes in the global environment and the region’s emerging areas of green comparative advantage.
debt by currency of denomination 8 9 26 33 49 52 53 57 60 65 81 94 92 91 74 67 51 48 47 43 40 35 19 6 0 10 20 30 40 50 60 70 80 90 100 Nicaragua Paraguay Dominican Republic Honduras Peru St. Lucia
Guatemala
Percent of total Domestic
34 cHAPT e R I | sTR eng TH en I ng Res I l I ence, Boos TI ng gR ow TH The promise of in T egraT ion
Figure 1.27. Less Balance Sheet Exposure to Exchange Rate Risk…
Public
Costa Rica
Colombia Barbados Mexico Brazil
currency Foreign currency Source: Macro Poverty Outlook, 2023.
Figure 1.28. …And More Self-Insurance through International Reserves Total Reserve Assets as Percent of Trend Component of
Is Resilience Enough? The Paradox of LAC’s Declining Integration into the World Economy
The combination of LAC’s resilience and declining integration into the world economy poses a paradox that the exit from pandemic crisis mode should bring to the fore. The region has limited fiscal space and extraordinary needs in infrastructure, but investment and growth remain low. LAC will need foreign capital and know-how to take advantage of the reorganization of global value chains and unlock the vast potential of its green industry. At the same time, the region’s increased stability should provide domestic and foreign investors a more secure platform to take advantage of this potential. However, LAC’s trade has largely stagnated and, with some notable exceptions, the region seems to be losing the interest of foreign investors. As figure 1.29 shows, foreign direct investment inflows have dropped by 35 percent over the past decade. This is not simply a trend shared globally as flows to developing countries have continued to increase—the region is dramatically losing share. At its peak in the late 1990s, LAC commanded 43 percent of global flows destined to emerging economies; today, these flows are roughly 15 percent, a fall of 28 p.p. in two decades. Chapter 2 explores what recent research suggests about LAC’s welcoming environment for foreign investors.
for Long-Term Investments
5 10 15 20 25 30 35
Percent 1995-2004 2015-2019 2023f
GDP
Argentina Brazil Chile Colombia Mexico Peru Average LAC(6)
Sources:
World Economic Outlook database (October 2022); World Bank staff calculations.
Note: GDP = gross domestic product; LAC = Latin America and the Caribbean. f = forecast.
Inward Foreign Direct Investment Flows 0 100000 200000 300000 400000 500000 600000 700000 800000 900000 0 5 10 15 20 25 30 35 40 45 19901991199219931994199519961997199819992000200120022003200420052006200720082009201020112012201320142015201620172018201920202021 Millions of Dollars Percent LAC share of EM Flows Developing economies (RHS) Latin America and
Caribbean (RHS)
UNCTAD 2022.
Figure 1.29. Foreign Investors Are Losing Interest in LAC
the
Source:
EM = Emerging Markets; LAC
cHAPT e R I | sTR eng TH en I ng Res I l I ence, Boos TI ng gR ow TH The promise of in T egraT ion 35
Note:
= Latin America and the Caribbean; RHS = right-hand scale.
Annex 1A: Origins of the Cycle-within-the-Cycle Dilemma: Why Are Emerging Markets Different?
Figure 1A.1 shows a strikingly different pattern of inflation behavior during recessions between LAC countries (panel a) and advanced economies (panel b).
a. LAC economies -0.9 -0.8 -0.7 -0.6 -0.5 -0.4 -0.3 -0.2 -0.1 0 0 0.2 0.4 0.6 0.8 1 1.2 1.4 1.6 Argentina Brazil Chile Mexico -3 -2 -1 0 1 2 3 (GrowthGrowth in Trough)/S.D. (GrowthGrowth in Trough)/S.D. (GrowthGrowth in Trough)/S.D. (GrowthGrowth in Trough)/S.D. (GrowthGrowth in Trough)/S.D. -0.5 -0.4 -0.3 -0.2 -0.1 0 0.1 0.2 0 0.2 0.4 0.6 0.8 1 1.2 1.4 1.6 1.8 -3 -2 -1 0 1 2 3 (InflationInflation in Trough)/S.D (InflationInflation in Trough)/S.D (InflationInflation in Trough)/S.D (InflationInflation in Trough)/S.D (InflationInflation in Trough)/S.D -0.3 -0.25 -0.2 -0.15 -0.1 -0.05 0 0.05 0.1 0 0.2 0.4 0.6 0.8 1 1.2 1.4 1.6 -3 -2 -1 0 1 2 3 -0.35 -0.3 -0.25 -0.2 -0.15 -0.1 -0.05 0 0.05 0 0.2 0.4 0.6 0.8 1 1.2 1.4 1.6 -3 -2 -1 0 1 2 3 -0.7 -0.6 -0.5 -0.4 -0.3 -0.2 -0.1 0 0 0.2 0.4 0.6 0.8 1 1.2 1.4 1.6 1.8 -3 -2 -1 0 1 2 3 Growth Inflation Peru 36 cHAPT e R I | sTR eng TH en I ng Res I l I ence, Boos TI ng gR ow TH The promise of in T egraT ion
Figure 1A.1. Patterns of Inflation and Growth over the Average Business Cycle
Figure 1A.1. Patterns of Inflation and Growth over the Average Business Cycle (continuation)
Source: Rojas, Vegh, Vuletin (2023).
Note: After identifying the different episodes of recessions, each “Trough” is defined as the quarter with the minimum growth rate during an episode. These quarters are label as the moment zero in the x-axis. Then for each quarter around the “Trough”, the difference between the growth rate in the particular quarter and the growth rate at the Trough is calculated. To normalize the growth rates, this deviation from the Trough is then divided by the standard deviation of the growth rate (calculated over all quarters). The graphs show the average over the entire period for each quarter around the Trough. A similar expression is calculated for (annual) inflation.
b. Advanced economies -0.2 -0.1 0 0.1 0.2 0.3 0.4 0.5 0 0.2 0.4 0.6 0.8 1 1.2 1.4 1.6 -3 -2 -1 0 1 2 3 -0.1 -0.05 0 0.05 0.1 0.15 0.2 0 0.2 0.4 0.6 0.8 1 1.2 1.4 -3 -2 -1 0 1 2 3 -0.05 -0.03 Germany France United Kingdom Italy (Growth-Growth in Trough)/S.D. (Growth-Growth in Trough)/S.D. (Growth-Growth in Trough)/S.D. (Growth-Growth in Trough)/S.D. (Growth-Growth in Trough)/S.D. (Inflation-Inflation in Trough)/S.D (Inflation-Inflation in Trough)/S.D (Inflation-Inflation in Trough)/S.D (Inflation-Inflation in Trough)/S.D (Inflation-Inflation in Trough)/S.D United States -0.01 0.01 0.03 0.05 0.07 0.09 0.11 0.13 0.15 0 0.2 0.4 0.6 0.8 1 1.2 1.4 1.6 -3 -2 -1 0 1 2 3 -0.2 -0.15 -0.1 -0.05 0 0.05 0.1 0.15 0.2 0.25 0 0.2 0.4 0.6 0.8 1 1.2 1.4 1.6 -3 -2 -1 0 1 2 3 0 0.2 0.4 0.6 0.8 1 1.2 1.4 1.6 -0.15 -0.1 -0.05 0 0.05 0.1 0.15 0.2 0.25 -3 -2 -1 0 1 2 3 Growth Inflation
cHAPT e R I | sTR eng TH en I ng Res I l I ence, Boos TI ng gR ow TH The promise of in T egraT ion 37
What explains this difference in behavior? External conditions are among the most important drivers of the business cycle in LAC. Variables such as the terms of trade and the growth rate of industrial countries are closely associated with business cycles in the region, and with the policy dilemma (figure 1A.2).
Figure 1A.2. Factors Affecting LAC’s Average Business Cycle
Terms of trade Growth rate of industrial countries
Source: Rojas, Vegh, Vuletin (2023).
Note: After identifying the different episodes of recessions, each “Trough” is defined as the quarter with the minimum growth rate during an episode. These quarters are label as the moment zero in the x-axis. Then for each quarter around the “Trough”, the difference between the growth rate in the particular quarter and the growth rate at the Trough is calculated. To normalize the growth rates, this deviation from the Trough is then divided by the standard deviation of the growth rate (calculated over all quarters). The graphs show the average over the entire period for each quarter around the Trough. Average weigthed by population. LAC = Latin America and the Caribbean; S.D. = standard deviation; ToT = terms of trade.
Negative external conditions can drive the economy and inflation in opposite directions. As the terms of trade deteriorate or the cost of financing increases, exchange rates tend to depreciate, creating a passthrough inflation effect into the economy, making foreign imports and foreign financing more expensive.
0 0.1 0.2 0.3 0.4 0.5 0.6 0.7 0.8 0 0.2 0.4 0.6 0.8 1 1.2 1.4 1.6 -3 -2 -1 0 1 2 3 Industrial countries LAC -0.2 -0.1 0 0.1 0.2 0.3 0.4 0.5 0.6 0 0.2 0.4 0.6 0.8 1 1.2 1.4 1.6 1.8 2 -4 -3 -2 -1 0 1 2 3 Terms of trade LAC LAC Terms of trade LAC Industrial
38 cHAPT e R I | sTR eng TH en I ng Res I l I ence, Boos TI ng gR ow TH The promise of in T egraT ion
References
Brummund, P., Mann, C., and Rodriguez-Castelan, C. 2018. “Job quality and poverty in Latin America”. Review of Development Economics 22(4): 1682-1708.
CEDLAS (Center of Distributive, Labor and Social Studies) and World Bank. Forthcoming. “A Global Pandemic and Then a War: Effects on the Poor and Vulnerable in Latin America and the Caribbean.” World Bank, Washington, DC.
CEPAL (Economic Commission for Latin America and the Caribbean). 2021. The Prolongation of the Health Crisis and Its Impact on Health, the Economy and Social Development. Santiago, Chile: CEPAL.
Fiolet, T., Y. Kherabi, C.-J. MacDonald, J. Ghosn, and N. Peiffer-Smadja. 2022. “Comparing COVID-19 Vaccines for Their Characteristics, Efficacy and Effectiveness against SARS-CoV-2 and Variants of Concern: A Narrative Review.” Clinical Microbiology and Infection (2): 202–21.
Forchette, L., W. Sebastian, and T. A. Liu. 2021. “A Comprehensive Review of COVID-19 Virology, Vaccines, Variants, and Therapeutics.” Current Medical Science 41 (6): 1037–51.
Herrera, Cristian A., Jeremy Veillard, Nicole Feune de Colombi, Sven Neelsen, Geoff Anderson, and Katherine Ward. Building Resilient Health Systems in Latin American and the Caribbean: Lessons Learned from the COVID-19 Pandemic. 2022. Washington DC: World Bank
Jácome, L. I., and S. Pienknagura. 2022. “Central Bank Independence and Inflation in Latin America—Through the Lens of History.” Working Paper No. 2022/186, International Monetary Fund, Washington, DC. https://www.imf.org/en/Publications/WP/Issues/2022/09/16/CentralBank-Independence-and-Inflation-in-Latin-America-Through-the-Lens-of-History-523542
Rojas, D., C. Vegh, and G. Vuletin. Unplublished manuscript. “Monetary Policy Dilemma in Emerging Markets: The Cycle within the Cycle.” World Bank, Washington, DC.
UNCTAD (United Nations Conference on Trade and Development). 2022. UNCTAD World Investment Report 2022. Geneva: UNCTAD.
Urrunaga-Pastor, D., G. Bendezu-Quispe, P. Herrera-Añazco, A. Uyen-Cateriano, C. J. Toro-Huamanchumo, A. J. Rodriguez-Morales, A. V. Hernandez, and V. A. Benites-Zapata. 2021. “Cross-Sectional Analysis of COVID-19 Vaccine Intention, Perceptions and Hesitancy across Latin America and the Caribbean.” Travel Medicine and Infectious Disease 41: 102059.
Urrunaga-Pastor, D., P. Herrera-Añazco, A. Uyen-Cateriano, C. J. Toro-Huamanchumo, A. J. Rodriguez-Morales, A. V. Hernandez, V. A. BenitesZapata, and G. Bendezu-Quispe. 2021. “Prevalence and Factors Associated with Parents’ Non-Intention to Vaccinate Their Children and Adolescents against COVID-19 in Latin America and the Caribbean.” Vaccines 9 (11): 1303.
Vegh, C. A., L. Morano, D. Friedheim, and D. Rojas. 2017. “Between a Rock and a Hard Place: The Monetary Policy Dilemma in Latin America and the Caribbean.” LAC Semiannual Report, October. World Bank, Washington, DC. https://openknowledge.worldbank.org/handle/10986/28443.
World Bank. 2017. Latin America and the Caribbean Economic Review: Dynamics of the Current Economic Cycle and Policy Challenges for Boosting Investment and Growth. Washington, DC: World Bank.
World Bank. 2022a. Uneven Recovery in Latin America and the Caribbean: Are Women Being Left Behind? Washington, DC : World Bank. World Bank. 2022b. New Approaches to Closing the Fiscal Gap. LAC Semiannual Update; October 2022. Washington, DC : World Bank.
Notes
1 Urrunaga-Pastor, Bendezu-Quispe, et al. (2021).
2 Urrunaga-Pastor, Herrera-Añazco, et al. (2021).
3 CEPAL (2021).
4 Fiolet et al. (2022).
5 Forchette, Sebastian, and Liu (2021).
6 https://www.nytimes.com/2023/02/03/opinion/bird-flu-h5n1-pandemic.html?smid=em-share
7 https://www.worldbank.org/en/news/press-release/2023/02/03/the-pandemic-fund-announces-first-round-of-funding-to-help-countries-build-resilience-to-future-pandemics.
8 CEDLAS and World Bank (forthcoming, chapter 1).
9 Vegh et al. (2017).
10 Vegh et al. (2017).
11 Rojas, Vegh, and Vuletin (forthcoming).
12 Jácome and Pienknagura (2022).
cHAPT e R I | sTR eng TH en I ng Res I l I ence, Boos TI ng gR ow TH The promise of in T egraT ion 39
c HAPT e R II
REENGAGING A CHANGING WORLD ECONOMY

40 The promise of in T egraT ion
latin America is again reappraising how it engages with the global economy. Despite decades of trade reforms and free trade agreements, the region remains under-diversified and vulnerable to commodity price shocks, and, as chapter 1 showed, growth remains too low to reduce poverty and alleviate social tensions. The context of rising questions about the adequacy of the outward-oriented model, domestic shortages arising from broken supply chains during the pandemic, talk of the end of globalization, and fragmentation of the global economic order has prompted thoughts of turning inward again. The region remains one of the least integrated regions by global standards, and, with a few exceptions, trade openness and foreign direct investment (FDI) flows have been stagnant or decreasing over the past 20 years.
This evolution is occurring against a background where there is increasing evidence of faster growth arising from openness, greater access to new technologies and foreign investment, taking advantage of scale economies, and the stimulating benefits of competition. South-North trade is particularly associated with larger impacts on growth and the complexity of exports, consistent with greater possibilities for knowledge transfer from the frontier (box 2.1).
Further, examples from generations of East Asian miracles, the most recent being China and Vietnam, become more compelling with each decade.1 The East Asia region has seen rapid convergence toward the levels of income of the Group of Seven (G7) over the past 40 years, as Latin America has slipped from close to 44 to 32 percent of G7 incomes (figure 2.1).
The question cannot be whether Latin America and the Caribbean (LAC) should go back to the more inward-looking stance, which generated poor growth and macro instability. Both LAC’s history and the Asian experience firmly reject that option. Rather, the question should be why the supposedly outward-looking reforms of the past 40 years did not produce better outcomes, and what needs to be done to leverage the region’s areas of comparative advantage.
This question becomes critical for two additional reasons. First, the evolution of the world economy suggests that there are opportunities, but also new challenges, for the region. Forces toward nearshoring away from Asia are already favoring Mexico and could potentially partially reverse the deindustrialization proceeding in the region if conditions allowed. However, global flows of FDI to the region have been falling for a decade even as the advanced countries are reshoring; the region needs to increase its attractiveness to position itself well.
5 10 15 20 25 30 35 40 45 50 1980 1981 1982 1983 1984 1985 1986 1987 1988 1989 1990 1991 1992 1993 1994 1995 1996 1997 1998 1999 2000 2001 2002 2003 2004 2005 2006 2007 2008 2009 2010 2011 2012 2013 2014 2015 2016 2017 2018 2019 2020 2021 2022f 2023f Emerging and Developing Asia Latin America and the Caribbean Sources:
and
cHAPT e R II | Reeng Ag I ng A cHA ng I ng w o R ld e conomy The promise of in T egraT ion 41
Figure 2.1. Gross Domestic Product per Person as a Share of the G7 Average (percent)
World Economic Outlook database (October 2022)
World Bank staff calculations.
Second, the dramatic potential for green energy points to new opportunities for the region. Latin America’s green energy grid gives it a comparative advantage in all energy intensive products; its extraordinary endowments of wind and sun offer great potential for exporting green energy; its abundance of lithium, copper, and other essential inputs to electrification of the global economy, if extracted sustainably, offer new growth opportunities; and its abundant natural capital could support a variety of new industries. To exploit this new green comparative advantage and ensure that it is leveraged to diversify and energize the economy requires answering the same initial question: what should be done differently?
This chapter offers an overview of the major trends in trade and presents suggestions for the agenda for further reforms, based on recent work at the World Bank.
The Changing Global Context: Challenges and Opportunities for LAC
Despite several decades of reforms oriented toward increasing the region’s engagement with the rest of the world, LAC trades little. Exports plus imports as a share of gross domestic product (GDP) in both merchandise trade and services are low compared to any other region (figure 2.2).
The region also under-trades relative to its predicted potential, accounting for distance from markets, special trade arrangements, common language, partners’ economic size, and other trade fundamentals. Paraguay, Bolivia, Mexico, Chile, and Nicaragua are exceptions (figure 2.3).
Further, over the past 25 years, trade growth has been largely stagnant (figure 2.4), with some reorientation. There has been an uptick in the total volume of trade since 2020 of approximately 10 percent, but the region remains 10 percent below where it was a decade ago. There has also been a shift in the center of gravity of trade. The United States in aggregate remains the largest export destination for the region, but China is now the dominant destination for the region excluding Mexico (figure 2.5). China has free trade agreements with
34.3 37.1 43.6 43.6 45.9 47.8 65.0 10.8 6.9 13.6 10.5 7.4 10.9 17.7 0.0 10.0 20.0 30.0 40.0 50.0 60.0 70.0 South Asia Latin America and the Caribbean OECD members Sub-Saharan Africa East Asia and Pacific (excluding high income) Europe and Central Asia (excluding high income) Middle East and North Africa
Figure 2.2. Trade in Goods and Services as a Share of Output, 2010–19 Average (percent of GDP)
Service trade Merchandise trade
Source: World Development Indicators.
42 cHAPT e R II | Reeng Ag I ng A cHA ng I ng w o R ld e conomy The promise of in T egraT ion
Note: Trade in goods and services is the sum of exports and imports of goods and services. GDP = gross domestic product; OECD = Organisation for Economic Co-operation and Development.
Source: Beaton et al. 2017.
Note: The values are percent deviations of actual exports compared to predicted exports. The predictions for nominal exports were obtained from a nonlinear specification of the gravity model, estimated with the Poisson pseudo-maximum likelihood estimator. The Caribbean region excludes the Dominican Republic, which is shown separately.
and the Caribbean
Sources: World Bank World Integrated Trade Solution; World Bank staff calculations.
Note: GDP = gross domestic product; LAC (6) = Argentina, Brazil, Chile, Colombia, Mexico, and Peru.
and the Caribbean
Chile, Costa Rica, and Peru and, in February 2022, launched talks with Ecuador, which reportedly were almost complete as of December 2022.
The region’s comparative advantage in resources has left it still highly dependent on commodities and food exports (figure 2.6). With the exceptions of Mexico and Costa Rica, LAC is less integrated into global value chains (GVCs) compared to other regions across all sectors. As Rocha and Ruta (2022) show, in 2015, forward participation, which is importing components for use in the assembly of exports, was 19 percent of total exports for LAC; it was close to 30 percent for Europe and Central Asia (ECA) and East Asia and Pacific (EAP).
-100 -80 -60 -40 -20 0 20 40 60 Paraguay
ChileNicaraguaSurinameGuyana BrazilVenezuelaCostaRica PeruArgentinaElSalvadorHondurasColombiaGuatemalaUruguayDominicanRepublic BelizePanamaCaribbean
Figure 2.3. Actual Exports Relative to Predicted Exports to All Trading Partners (percent deviation)
Bolivia Mexico
Total trade of LAC (6) (percent of GDP) 0 20 40 60 80 2000 2001 2002 2003 2004 2005 2006 2007 2008 2009 2010 2011 2012 2013 2014 2015 2016 2017 2018 2019 2020 2021 Argentina Brazil Chile Colombia Mexico Peru Latin America
(aggregate) Latin America
(aggregate) without Mexico
Figure 2.4. LAC Trade Has Been Stagnant Since 2000, Except for Mexico
cHAPT e R II | Reeng Ag I ng A cHA ng I ng w o R ld e conomy The promise of in T egraT ion 43
Value of exports from LAC (6) (US$, millions)
Sources: World Bank World Integrated Trade Solution; World Bank staff calculations. Note: LAC (6) = = Argentina, Brazil, Chile, Colombia, Mexico, and Peru.
Backward participation, which is the production of intermediate components for export markets, was 16 percent of total exports for LAC; it was 20 percent for EAP and 30 percent for ECA.
Moving up the value chain has also been a struggle. Except Mexico, which is integrated into advanced manufacturing and services GVCs, LAC countries mostly specialize in commodity and limited manufacturing GVCs. Since the 1990s, only Argentina, Costa Rica, and El Salvador have been able to upgrade from commodities to limited manufacturing. It could be argued that this simply reflects comparative advantage. However, it is fair to ask why Colombia, with ports on both coasts and a mass of underemployed labor, or more of the Caribbean and Central America should not also be in Mexico’s position.
Figure 2.5. The United States Remains the Region’s Primary Export Destination, but Excluding Mexico Leaves China Dominant
0 50000 100000 150000 200000 250000 300000 350000 400000 450000 500000 2000 2015 2019 2021 2000 2015 2019 2021 2000 2015 2019 2021 China European Union members (excl. UK) United States Argentina Brazil Chile Colombia Mexico Peru
0 10 20 30 40 50 60 70 Manufactures 0 5 10 15 20 25 30 35 East Asia and Pacific Europe and Central Asia Latin America and the Caribbean Commodities 0 5 10 15 20 25 30 35 Food Source:
Figure 2.6. Shares of Commodities, Food, and Manufactured Goods in Merchandise Exports, 2018 (percent)
Rocha and Ruta 2022.
44 cHAPT e R II | Reeng Ag I ng A cHA ng I ng w o R ld e conomy The promise of in T egraT ion
Note: Commodity exports cover agricultural raw materials, fuel, and ores and metals. The regional aggregates are based only on information for countries that were eligible for World Bank lending as of 2000 and part of the global value chain taxonomy.
In addition, although in LAC services account for 60 percent of economic activity and the region has liberalized services trade, its share remains lower than that of other regions, averaging just 6.9 percent of GDP during the 2010s (figure 2.2). The role of services in GVCs has increased globally, but LAC lags behind other regions in terms of its integration: while in EAP backward and forward participation in services represents 31 percent of gross intraregional exports, the share is only 16 percent in LAC, and it has stagnated since the early 2000s.2
LAC’s current trade profile reflects both local policies and global trends. Employment in urban tradables, especially manufacturing, plummeted during the 1990s and 2000s, especially in the largest cities (figure 2.7) (Jedwab, Ianchovichina, and Haslop 2022). As described in Beylis et al. (2020) and elsewhere, part of this was necessary. Mounting debt and recurring crises signaled that the policies supporting import substitution industrialization had been costly and inefficient, failing to establish globally competitive domestic manufacturing firms that could withstand increased foreign competition. In addition, the adoption of labor-saving manufacturing technologies across the world has reduced manufacturing globally (Beylis et al. 2020). At the same time, the rise of East Asia and other emerging markets as manufacturing powerhouses generated demand for commodities and opened opportunities for the growth of the Latin American mining and agrobusiness sectors in the 1990s and 2000s. During the Golden Decade (2003–13), strong demand for commodities and a resource windfall allowed the economies of LAC to increase their consumption of imported manufactured products and domestic services, further eroding the international competitiveness of the region’s manufacturing sectors.
However, the urgent need to shift toward a greener global economy presents tremendous opportunities for the region (box 2.2), in manufactures, commodities, and services. The fact that currently LAC has the world’s cleanest electricity grid offers potential for a green premium on the region’s exports across all sectors. The abundance of wind and sun positions the region as the dominant producer of green hydrogen and renewable energy generally. LAC is also well endowed with lithium, copper, and other inputs that are used intensively in green technologies. Hence, in principle, the climate crisis offers an entirely new source of comparative advantage to be exploited.
1980
Before Early 1990s c.~2010 10 20 30 40 50 60 Share of employment (percent) 11 12 13 14 15 16 17 Log Population Size (Inh.) of Agglomeration
Figure 2.7. Evolution of the Share of Employment in Urban Tradables, by City Size and Decade in LAC
or
Source: Jedwab, Ianchovichina, and Haslop 2022, based on IPUMS survey data.
cHAPT e R II | Reeng Ag I ng A cHA ng I ng w o R ld e conomy The promise of in T egraT ion 45
Note: LAC = Latin America and the Caribbean. MFGFIRE stands for manufacturing and tradable services (such as finance, insurance, and real estate services, or FIRE). The size of the agglomeration is proxied with the log of the population size of the agglomeration in terms of number of inhabitants (Inh.)
Box 2.1. Benefits of South-North Trade Agreements
International trade has been associated with welfare, economic development, and growth since the times of Adam Smith. In an early seminal work, Frankel and Romer (1999) estimate that a one-percentage-point increase in the trade share (ratio of exports or imports to gross domestic product (GDP)) raises income per person by 2 percent. In a recent paper, Irwin (2019) reviews a variety of studies using different measures of policy and finds that economic growth is roughly 1.0 to 1.5 percentage points higher than a benchmark after trade reform. Several studies suggest that this gain cumulates to about 10 to 20 percent higher income after a decade.
As shown in a recent World Bank report, while Latin America and the Caribbean has signed a good number of trade agreements over the past decades, not all trade agreements provide the same benefits (World Bank 2020a). Trade agreements are typically thought to create export opportunities and potential for growth through the productivity transfers embedded in the exchange of goods and services. For emerging markets, trading with developed economies (South-North trade for short) provides access to bigger and richer markets, which enables knowledge exchange with more advanced economies once implemented.
To highlight the importance of South-North agreements, after weighting by the corresponding shares of global GDP, the 110 bilateral trade agreements embedded in the Latin American Integration Association become equivalent to the two agreements signed by Mexico under the North American Free Trade Agreement.
Figure
a. The agreements involve greater
0 50 100 150 200 250 300 350 0 10 20 30 40 50 60 197319811988199019911993199419951996199719981999200020012002200320042005200620072008200920102011201220132014201520162017 Accumulated (ines) Agreements weighted by GDP per year (bars) South-South South-North Total, accumulated South-South, accumulated South-North, accumulated Latin America Integration Association Mercosur NAFTA Andean CommunityMercosur ChileEU , ChileUS Central AmericaUS ChileJapan CARIFORUMEU MercosurIndia , PeruUS MercosurSouthern Africa Customs Union ColombiaUS EcuadorEU MexicoJapan Mexico - EU 46 cHAPT e R II | Reeng Ag I ng A cHA ng I ng w o R ld e conomy The promise of in T egraT ion
B2.1.1. LAC’s South-North Trade Agreements
market size...
and ECI per year (bars)
by
EU
US
EU ,
South-South South-North Total, accumulated South-South, accumulated South-North, accumulated
Sources: Estimates based on data from the World Trade Organization, World Development Indicators, and Atlas of Economic Complexity.
Note: Each agreement is multiplied by the product of the share of global GDP and the Economic Complexity Index of the two signing parties. CARIFORUM = the Caribbean Forum; ECI = Economic Complexity Index; EU = European Union; GDP = gross domestic product; Mercosur = the Southern Common Market; NAFTA = North American Free Trade Agreement.
Another advantage stemming from South-North agreements is the transfer of technology and knowhow. Complex economies produce sophisticated and innovative products and services that are sold at a premium in global markets. A country can import knowledge not only from these more complex economies, but also indirectly from their trading partners (Grossman and Helpman 1991; Coe and Helpman 1995).
Using the Economic Complexity Index created by Hausmann et al. (2013) as a measure of the degree of economic sophistication of a country further increases the weight of South-North trade agreements. Counting this way, more than two-thirds of the market access and potential knowledge transfer from trade agreements signed by countries in the region originated from just a few South-North deals (figure B2.1.1). Thus, it takes the equivalent of two Latin American Integration Association deals to reach the same economic potential as the North American Free Trade Agreement.
The estimates also suggest a positive impact of trade openness on economic growth, and especially with countries with the potential to transfer technology and know-how. In the medium term, a SouthSouth agreement raises a developing country’s annual growth rate of GDP by about 0.2 percentage point, whereas a South-North agreement leads to an increase in the growth rate of GDP by about 0.85 percentage point.
Box 2.1 (continuation)
....
Latin America Integration Association 0 20 40 60 80 100 120 140 0 5 10 15 20 25 30 35 197319811988199019911993199419951996199719981999200020012002200320042005200620072008200920102011201220132014201520162017 Accumulated (lines)
GDP
Sources: Frankel and Romer (1999), Hausmann et al. (2013), World Bank (2019). b.
And increased exposure to economic complexity
Agreements weighted
Mercosur NAFTA Andean Community -
Chile -
Chile -
Central America -
ChileJapan CARIFORUMEU MercosurIndia , Peru -
MercosurSouthern Africa Customs Union Colombia -
EcuadorEU MexicoJapan Mexico
Mercosur
US
US
US
-
cHAPT e R II | Reeng Ag I ng A cHA ng I ng w o R ld e conomy The promise of in T egraT ion 47
The Promise of Nearshoring and Declining FDI in LAC
FDI can be a source of capital and technology that stimulates growth and creates jobs at scale. The period from 1988 to 1992 saw an explosion of capital flows to China and other parts of Asia, which fueled close to double-digit growth rates. Empirical evidence shows a heterogeneous but typically positive impact of FDI on growth,3 ranging from 0.1 to 0.8 percentage point increases in per capita GDP growth, with a 1 percentage point increase in the ratio of FDI to GDP for developing economies.4,5
Geopolitical tensions and the logistical complications arising from the COVID-19 pandemic are leading to a desire for greater diversification of production sources closer to home. In theory, this could offer a tremendous opportunity for LAC, which has greater “proximity” to the United States and Europe along many dimensions.
Is LAC Missing the Opportunity of Nearshoring?
However, figure 2.8 shows that FDI inflows to the region have steadily decreased over the past decade. This partly reflects a more general retrenchment and reshoring by the sending countries. Global FDI inflows, led by high-income economies, drastically decreased from their peak of US$2 trillion in 2015 to just below US$1 trillion during the depths of the pandemic (a 77 percent decrease). The reduction in flows to LAC was similar in magnitude, with a total reduction of 75 percent, from US$202 billion in 2012 to just over US$86 billion in 2020, by far the largest drop among developing regions. Although FDI inflows recovered in 2021, the recovery was just enough to put the region back on its downward trend.
Greenfield investment is when a foreign company builds its operations from the ground up. The most dramatic, steady pullback in greenfield investment was in Asia. LAC’s greenfield investment underwent a similarly dramatic decline in 2019, and so far, the region shows no sign of becoming a new destination of choice (figure 2.9).6
0 20000 40000 60000 80000 100000 120000 140000 160000 180000 200000 2000 2001 2002 2003 2004 2005 2006 2007 2008 2009 2010 2011 2012 2013 2014 2015 2016 2017 2018 2019 2020 2021 2022 East Asia and Pacific Europe and Central Asia Latin America and the Caribbean Middle East and North Africa South Asia Sub-Saharan Africa China Source: Calculations using UNCTAD FDI data. Note: FDI = foreign direct investment. 48 cHAPT e R II | Reeng Ag I ng A cHA ng I ng w o R ld e conomy The promise of in T egraT ion
Figure 2.8. Regional Declines in FDI Inflows Are Widespread in Emerging Markets Except China Inflow of FDI by region, developing economies (US dollars at current prices, millions)
Figure 2.9. Greenfield Investment Did Not Recover after the Pandemic Decline Number of greenfield projects, by region
A simple back-of-the-envelope calculation using the aforementioned range of elasticities shows that LAC could be missing between 0.08 and 0.64 percentage point of GDP growth per capita every year due to the drop in FDI since 2012 (around US$60 billion). The effectiveness of FDI may depend on various co-factors. For example, better absorption capacities are related to higher FDI productivity (Crespo and Fontoura 2007). The same applies to human capital (Borensztein, De Gregorio, and Lee 1998), deeper financial systems (Alfaro et al. 2004), institutional quality (Busse and Groizard 2008), and the stability of the regulatory and political systems (Choe 2003). In LAC, Mexico, El Salvador, and the Dominican Republic, to name a few, have benefitted from similar flows.
Mexico is the striking exception to these trends as it experienced an increase in FDI inflows of almost 40 percent over 10 years, while South America experienced a decline of 8.6 percent (table 2.1). The decreases over the past 10 years have been primarily driven by a 14 percent fall in European investment, especially from the Netherlands (31 percent) and Spain (15 percent), with the United States contributing a measly 1.5 percent increase over a decade. The decreases have been offset by dramatic increases from the same countries with FDI flows going to Mexico. The holdings in Mexico are of a similar magnitude as the entirety of those in South America. Despite China’s role as the premiere export market and import source for LAC excluding Mexico, the official statistics, which may not fully capture inflows, suggest that China role is still relatively small. Central America shows large increases. However, the aggregate numbers conceal large financial flows to Panama, much as they do in the Caribbean.
The comparison of greenfield investment in Mexico and Brazil tells a similar story (figure 2.10, panels a and b). The overall picture appears to be one of nearshoring, but it is from Brazil to Mexico. Announcements from the United States to Brazil fell to their lowest point in a decade, dropping by more than US$5 billion, while the reverse was true in Mexico.
The past five years have also shown significant changes in the composition of FDI (figure 2.11). Most noticeably, since 2017 there has been a large increase in foreign investment in renewable energy across the region. Box 2.2 suggests that this offers major opportunities as a driver of growth. Although the large push for renewables diminished somewhat during the pandemic, the levels of investment remain significantly higher than in the previous decade. However, the Ukrainian conflict reset foreign interest in the coal, oil, and gas sector, which had registered a gradual decline since 2018. There was a big jump in 2022, with coal, oil, and gas becoming the main FDI sector. Metals also saw a sustained recovery, after their big fall in 2020.
0 500 1000 1500 2000 2500 3000 2010 2011 2012 2013 2014 2015 2016 2017 2018 2019 2020 2021 2022 East Asia
Europe and Central Asia Latin America and the Caribbean Middle East and North Africa South Asia Sub-Saharan Africa
and Pacific
cHAPT e R II | Reeng Ag I ng A cHA ng I ng w o R ld e conomy The promise of in T egraT ion 49
Source: Calculations using data from the fDi Markets database.
Note:
High income countries are excluded.
Table 2.1. Foreign Investment Positions in LAC Are Decreasing and Moving North (US$, millions)
Source: International Monetary Fund Coordinated Direct Investment Survey. Note: South America includes Argentina, Brazil, Chile, Colombia, Ecuador, Paraguay, Peru, Uruguay, and the República Bolivariana de Venezuela.
Figure 2.10. Trends in Greenfield Foreign Direct Investment in Mexico and Brazil, from Selected Main Countries of
south America mexico central America 2012 2021 % change 2012 2021 % change 2012 2021 % change World 990,172 904,960 -8.61 426,101 592,221 38.99 37,687 72,869 93.35 Europe 524,132 454,991 -13.19 197,315 310,069 57.14 12,370 30,655 140.8 United States 156,296 158,668 1.52 185,764 207,360 11.63 10,459 12,002 14.75 Netherlands 216,092 148,241 -31.40 58,405 115,280 97.38 2,823 12,207 332.42 Spain 101,243 85,895 -15.16 68,976 99,766 44.64 3,283 8,393 133.61 South America 44,425 52,010 17.07 3,906 7,553 93.36 5,335 13,576 154.49 Brazil 9,749 11,397 16.91 1,628 2,946 80.99 2,101 9,823 367.45 Mexico 19,397 11,200 -42.26 4,637 5,019 8.23 China 3,622 2,930 -19.1 458 1,085 137.07 1,498
Origin (US$, millions) a. Mexico 0 2000 4000 6000 8000 10000 12000 14000 2010 2011 2012 2013 2014 2015 2016 2017 2018 2019 2020 2021 2022 United States Spain Germany Japan China b. Brazil2,000 4,000 6,000 8,000 10,000 12,000 1 2 3 4 5 6 7 8 9 10 11 12 13 United States Spain Germany China France United Kingdom Source: Calculations using data from the fDi Markets database. 50 cHAPT e R II | Reeng Ag I ng A cHA ng I ng w o R ld e conomy The promise of in T egraT ion
How Can LAC Attract More Foreign Investment...
How can LAC attract the foreign capital it needs to help stimulate both old and new areas of comparative advantage? The somewhat good news is that Asia no longer holds an obvious advantage over the region as wages in China have risen above those even in Mexico and Brazil, and Vietnam is not far behind (figure 2.12). Unfortunately, the region’s wage competitiveness is not enough to make it attractive to investors. A cost of manufacturing operations index calculated by KPMG and the Manufacturing Institute offers a window
0 5000 10000 15000 20000 25000 30000 35000 2010 2011 2012 2013 2014 2015 2016 2017 2018 2019 2020 2021 2022 Metals Coal, oil & gas Renewable energy Communications Automotive OEM + Components
Calculations using data from the fDi Markets database.
LAC = Latin America and the Caribbean; OEM = original equipment manufacturer.
Figure 2.11. LAC’s Top Five Foreign Direct Investment Sectors (US$, millions)
Source:
Note:
1.4 1.5 1.2 1.7 1.6 1.6 1.5 1.5 1.2 1.4 2.0 1.2 1.2 1.3 1.8 1.1 1.1 1.5 1.0 1.1 1.1 1.3 1.3 1.6 1.6 1.3 2.1 2.3 2.2 2.4 0 1000 2000 3000 4000 5000 0.0 0.5 1.0 1.5 2.0 2.5 3.0 3.5 4.0 4.5 Canada Korea,Republicof MalaysiaUnitedStatesUnitedKingdom Germany Ireland France China Italy Japan Mexico Vietnam India Brazil Average monthly earnings of employees (US$)Total2020 CoDB Index Score by Country (1=best, 5=worst) Primary Secondary Earnings (right-axis) Sources: KPMG 2020; ILOSTAT 2023; OECD 2023. Note: CoDB = Cost of Doing Business. cHAPT e R II | Reeng Ag I ng A cHA ng I ng w o R ld e conomy The promise of in T egraT ion 51
Figure 2.12. Costs of Manufacturing Operations and Average Real Wages, 2020 CoDB Index score and average monthly earnings of employees (US$)
into how investors evaluate destinations that sheds light beyond the manufacturing sector. It shows how countries with very high wages, like Canada or the United States, still perform better than emerging markets with relatively cheap labor, like Mexico or Brazil. This is because although the primary costs of operations, such as labor and real estate, are relatively low in emerging markets, corporate taxes and financing are not. Further, secondary or indirect disincentives, such as weak education among the work force, difficulties in the business climate and infrastructure, political risk, and weakness of institutions, are much higher in developing nations. Figure 2.12 shows that relatively high primary costs (the blue portion of the bars in the figure) in Canada are more than compensated by the inflated indirect costs in Mexico or Brazil. Clearly, there is a high degree of subjectivity in these rankings, and the weights used to create the indexes can be disputed. Nonetheless, they suggest some areas where LAC needs to improve to provide both domestic and foreign investors a more welcoming climate.
... And Leverage The Region’s Comparative Advantages for Faster Growth?
Faster growth will also require a strategy to leverage the region’s existing and future comparative advantages better than in the past. For instance, in contrast to the resource curse literature, Wright (1999) notes that in the 19th century, the United States leveraged copper to create a knowledge network of engineers and chemists that laid the groundwork for the country’s industrialization and diversification. In the same period, Japan was also an important exporter of copper, generating the copper companies Sumitomo, Fujitsu, and Hitachi. These major, diversified, and high-tech conglomerates are now household names. By contrast, the LAC region’s experience with mining has been focused on pure extraction, with little diversification and no analogues to the Japanese business conglomerates (Maloney and Zambrano 2021). In more contemporary times, Norway has created a diversified economy around its gas and petroleum endowments that has only a distant echo in the LAC region. Again, this is not just a resource curse issue as it occurs across sectors: the Republic of Korea and Guadalajara, Mexico, started exporting assembled electronics in the early 1980s. But there is no Mexican analogue to Samsung. The “how” appears to be as important as the “what,” as argued by Lederman and Maloney (2012), and understanding what is missing in current regional policies is critical. As the region begins to explore its new areas of comparative advantage in commodities, such as lithium, or energy, such as green hydrogen, understanding how to improve on past experience will help determine how diversified and dynamic the economies that build upon them will be.
The next section presents selected insights from recent World Bank work into areas necessary for the region to work on, some with very long horizons, some with shorter.
52 cHAPT e R II | Reeng Ag I ng A cHA ng I ng w o R ld e conomy The promise of in T egraT ion
Box 2.2. Opportunities for Latin America and the Caribbean in the Greening Global Economy
Latin America and the Caribbean (LAC) has tremendous comparative advantage in the green economy. Thus, the region has globally and perhaps historically unprecedented opportunities for new growth and export opportunities.
Many adaptation and mitigation policies aim to improve efficiency and productivity—thereby promoting growth as well as sustainability. Ultimately, building the capabilities and institutions that facilitate low-carbon technology adoption will enable the region to approach the technological frontier and become an innovator itself—laying the foundation for future growth.
First, with an electricity generation matrix based mostly on hydropower, the region already has one of the greenest electricity grids in the world. This means that any energy intensive export can potentially capture a green premium, permitting expansion into new markets and avoiding carbon border adjustment taxes.
Second, the region is endowed with vast potential in nonconventional renewable energy, including geothermal, wind, solar, tidal, wave, biomass, and small hydroelectric plants that can deepen this comparative advantage. Innovative mechanisms in several LAC countries have added large amounts of nonconventional renewable energy and created some of the most dynamic renewable energy markets in the world. Such abundant, reliable, and green electricity can be a major competitive advantage in the production of new energy vectors—such as green hydrogen and synthetic fuels—and other downstream products, like ammonia and other green fertilizers and chemicals. The competitive advantage in the production of green hydrogen can also help decarbonize sectors that are hard to abate in industries such as steel and cement, and may eventually be used to power freight ships, airplanes, and other transport vehicles that cannot be easily electrified.
Third, the region is blessed with huge reserves of lithium—mostly concentrated in Argentina, Bolivia, and Chile—and is dominant in the production of copper. These two critical metals are key in the new decarbonization and electrification technologies. Analysts expect that in the short and medium term, demand growth will outstrip supply, thus putting pressure on prices. The current dynamics in mineral and metal markets suggest that, if mined in a sustainable manner, the region will potentially benefit from increased export revenues.
Finally, LAC has some of the highest levels of natural capital in the world. It has more than one-quarter of the world’s forest area, possesses some of the highest levels of renewable freshwater resources, and holds about half of the world’s biodiversity. To sustain its position as a net exporter of food and agricultural commodities, LAC’s agriculture sector will need to adapt to the effects of climate change and work to prevent its worsening. Fortunately, evidence suggests that many climate-smart agricultural technologies and practices can help the region adapt to climate change and mitigate adverse effects while improving yields and reducing costs, benefiting the bottom line for producers. For example, transitioning toward electrically powered farming machinery and equipment, fed by renewable sources, can save millions in fuel costs while abating emissions (McKinsey & Company 2020). Reforestation, afforestation, and the recovery of degraded land can help ecosystems adapt
cHAPT e R II | Reeng Ag I ng A cHA ng I ng w o R ld e conomy The promise of in T egraT ion 53
Box 54 cHAPT e R II | Reeng Ag I ng A cHA ng I ng w o R ld e conomy The promise of in T egraT ion
2.2
and abate emissions. These actions can also create jobs and develop new markets, particularly in sustainable forestry. Eco-tourism initiatives may also become attractive as tourists become more concerned about their environmental impacts. The nascent voluntary carbon markets and payment for ecosystem services schemes also provide an avenue to monetize these efforts. With appropriate, credible mechanisms to certify, monitor, and verify projects, the region has the natural capital to become an exporter of environmental services through the sale of carbon credits to international firms and governments.
How Can LAC Engage More Successfully in the Global Economy?
The KPMG measures of the costs of working in difficult business climates can only be suggestive, but it highlights key considerations that domestic and foreign investors should keep in mind.
Will Increased Country Risk Deter Further Investment?
Political and policy risks are regularly mentioned as deterrents to investments by both domestic and foreign actors. What is not clear yet is how much these risks may have increased in recent years. As chapter 1 showed, global financial markets, as captured by Emerging Market Bond Index spreads, remain cautious but not alarmed at present.
Much of the overall resilience and success in managing inflation reflects continued confidence in the authorities tasked with maintaining macroeconomic stability and the continued independence of the central banks. They have managed inflation and proven to be important bulwarks against global shocks and their ripple effects. The question is how resilient these institutions will be to persistent and intensifying economic and political shocks. On this, the markets are unsure.
Fitch compiles measures of long-term risk, comprising indicators of political stability (including democratic norms), societal stability, the efficacy of the state, and policy continuity, as well as measures of “short-term” risk, comprising policy-making processes (institutionality), social stability, unemployment, inflation, and again, policy continuity. As shown in figure 2.13, while longer term measures of political risk remain stable, although with some degradation, short-term risk (longer than the conjunctural risk discussed above) measures have deteriorated in most countries, with the exception of Brazil, over the past years and may eventually become long-term risk.
One channel is through the degradation of macro policy and other institutions as social tensions ramp up across the region. Strong signaling about the stability of the broad policy framework can help mitigate concerns on this front. (continuation)
Figure 2.13. While Long-Run Political Risk Remains Stable, Short-Run Risk Is on the Rise
Thick Borders Restrict Trade and Investment
LAC’s underperformance in trade and FDI partly reflects the region’s “thick borders”—the combination of the economic policy stance and the costs incurred to comply with regulatory requirements at the border. These costs rise with higher tariffs, when a large share of trade is subject to non-tariff barriers requiring inspections at the border or in other locations, and the inefficiency of a country’s trade facilitation process.
In LAC, average tariff barriers have declined substantially since 2000 (figure 2.14), reaching levels observed in other emerging markets. However, they remain relatively high in some countries, including in the largest South American economies, Brazil and Argentina (figure 2.15). Similarly, the prevalence of non-tariff barriers is relatively low, except in the countries in the Southern Common Market (MERCOSUR), where non-tariff barriers cover more than 66 percent of imported products and 77 percent of the imported value (table
2.2).
45 50 55 60 65 70 75 80 85 90 95 2001 2002 2003 2004 2005 2006 2007 2008 2009 2010 2011 2012 2013 2014 2015 2016 2017 2018 2019 2020 2021 2022 2023 2001 2002 2003 2004 2005 2006 2007 2008 2009 2010 2011 2012 2013 2014 2015 2016 2017 2018 2019 2020 2021 2022 2023 Long-Term Political Risk Index (0 = worst, 100 = best) Argentina Brazil Chile Colombia Mexico Peru Argentina Brazil Chile Colombia Mexico Peru 40 45 50 55 60 65 70 75 80 85 90 Long-Term Political Risk Index (0 = worst, 100 = best) Average LAC(6) Average LAC(6) 2014 2015 2016 2017 2018 2019 2020 2021 2022 2023 Short-Term Political Risk Index (0 = worst, 100 = best) 45 50 55 60 65 70 75 80 85 Short-Term Political Risk Index (0 = worst, 100 = best) 2001 2002 2003 2004 2005 2006 2007 2008 2009 2010 2011 2012 2013 2014 2015 2016 2017 2018 2019 2020 2021 2022 2023 40 45 50 55 60 65 70 75 80
Source: Fitch.
cHAPT e R II | Reeng Ag I ng A cHA ng I ng w o R ld e conomy The promise of in T egraT ion 55
Note: LAC (6) = Argentina, Brazil, Chile, Colombia, Mexico, and Peru. The grey lines in the right panel represent one standard deviation from Average LAC (6).
Source: World Bank World Integrated Trade Solution.
Note: The LAC regional averages include Argentina, Aruba, Belize, Bolivia, Brazil, Chile, Costa Rica, Colombia, the Dominican Republic, Ecuador, El Salvador, Guatemala, Honduras, Jamaica, Mexico, Paraguay, Peru, and St. Lucia. The most recent data are Dominican Republic (2017), Guatemala (2015), Honduras (2015), Jamaica (2016), and St. Lucia (2016).
Source: World Bank World Integrated Trade Solution.
Note: The most recent data are Dominican Republic (2017), Guatemala (2015), Honduras (2015), Jamaica (2016), and St. Lucia (2016). Red dots represent most favored nation tariffs and green dots represent applied tariff rates. LCR = Latin America and the Caribbean region.
However, other costs of trade, such as compliance with norms at the border for both imports and exports, remain among the highest in the world (table 2.3). In theory, such costs can be reduced quickly as they are largely bureaucratically determined.
A new measure of border thickness, which captures the additional cost incurred when trading with neighbors versus domestically,7 suggests that for LAC, intraregional trade faces significantly higher barriers than domestic trade (map 2.1). These costs go beyond tariff and non-tariff barriers and include border delays, trade finance, and insurance costs. In LAC, the borders are thickest between the countries in Central America and between Brazil and its neighbors to the west and the north.
0 5 10 15 20 25
Figure 2.14. Most-Favored Nation Tariff Rate, by Region (percent, weighted average)
Middle East and North Africa Sub-Saharan Africa South Asia Latin America and the Caribbean Europe and Central Asia East Asia and Pacific
North America World 2000 2018
0 2 4 6 8 10 12 14 Argentina BelizeSt.Lucia Ecuador Brazil Jamaica Aruba BoliviaParaguay
Mexico Peru LAC
Figure 2.15. Most-Favored Nation Tariff Rate, by Country (percent, weighted average)
DominicanRepublicColombiaElSalvadorHonduras ChileCostaRicaGuatemala
56 cHAPT e R II | Reeng Ag I ng A cHA ng I ng w o R ld e conomy The promise of in T egraT ion
Table 2.2. Non-Tariff Barrier Coverage and Frequency Ratios, by Region, Latest Available Period (percent)
No data are available for Chile, the Dominican Republic, Panama, and Uruguay. CAFTA-DR = Dominican Republic–Central America Free Trade Agreement; NTB = non-tariff barrier.
Table 2.3. Costs of Trading across Borders, 2020
Region Time to export: Border compliance (hours) cost to export: Border compliance (us$) Time to import: Border compliance (hours) cost to import: Border compliance (us$)
Source: World Bank, Doing Business Indicators 2020.
Note: The table reports regional simple averages. Border restrictions include customs clearance and inspection procedures conducted by other agencies at the port, border, or another location. When all inspections occur at the border, the estimate factors in this simultaneity. If some inspections occur in other locations, the estimates for the time and cost of these procedures are added to those that occur at the border. If fees are determined by the value of the shipment, the value is assumed to be US$50,000. The region is ranked similarly in the Logistics Performance Index. CAFTA-DR = Dominican Republic–Central America Free Trade Agreement; OECD = Organisation for Economic Co-operation and Development.
Thick borders make it difficult for countries to participate in limited manufacturing GVCs and upgrade their GVC participation to advanced manufacturing because trade costs escalate when goods must cross borders multiple times.8 As shown in table 2.3, it takes much longer and costs a lot more to comply with border regulations for exporting and importing goods in LAC than in ECA and Organisation for Economic Co-operation and Development (OECD) countries, which specialize in advanced manufacturing and services. Although LAC is at par with EAP in terms of the time it takes to comply with border restrictions, it costs more to clear customs in LAC, and it takes considerably less time to clear customs in the fast-growing EAP economies. Despite the fact that Mexico struggles with many of the longer term primary and secondary considerations
Region nTm coverage ratio nTm frequency radio Europe and Central Asia 69 61 East Asia and Pacific 60.1 50.4 Middle East and North Africa 59 47 Sub-Saharan Africa 52.6 36.7 Latin America and the Caribbean 41.5 33.8 Mercosur 77.2 65.7 Pacific Alliance 59.4 49.6 CAFTA-DR 12.2 8.5 South Asia 39.7 28.2
Source: World Bank World Integrated Trade Solution.
Note: Coverage is proxied by the share of import value subject to NTBs, while frequency is measured by the share of imported products subject to NTBs.
Europe and Central Asia 16.1 10 20.4 158.8 OECD (high income) 12.7 136.8 8.5 98.1 East Asia and Pacific 57.5 381.1 68.4 422.8 Latin America and the Caribbean 55.3 516.3 55.6 628.4 Mercosur 71.5 716.3 30 643.8 Pacific Alliance 60 487.5 70.5 496.3 CAFTA-DR 42.9 355.3 57.7 426.4
cHAPT e R II | Reeng Ag I ng A cHA ng I ng w o R ld e conomy The promise of in T egraT ion 57
of the region, the growing integration with the US economy is importantly due to ongoing efforts to reduce these costs, and the rest of the region could benefit from doing the same.
A recent World Bank publication, Deep Trade Agreements: Anchoring Global Value Chains in Latin America and the Caribbean, discusses how deepening and expanding agreements on trade can reduce these costs, facilitate participation in global production networks, increase trade, and attract more FDI (Rocha and Ruta 2022) (see box 2.3). Participation in deep trade agreements (DTAs) can help countries thin their borders and promote GVC-related trade9 because cooperation on border and behind-the-border policies is needed for GVCs to operate efficiently.10 However, deeper preferential trade agreements (PTAs) can also promote and secure market access, attract vertical FDI,11 and address a broader set of objectives related to health and environmental standards.12
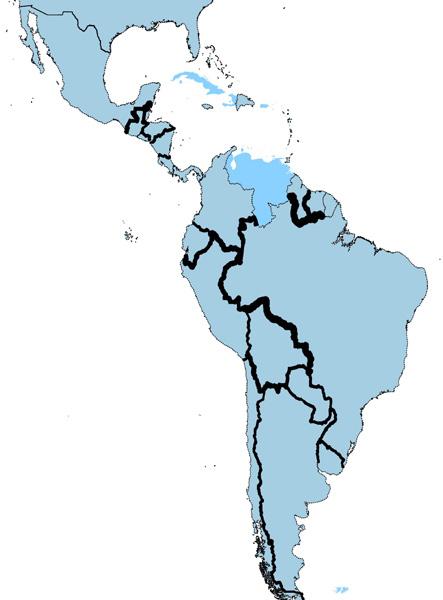
Improving trade facilitation should be a priority in LAC, where trading across borders is often a costly and time-consuming process. Trade facilitation should aim to reduce border-crossing costs by improving, simplifying, and harmonizing the procedures and controls governing cross-border trade flows. DTAs can advance trade facilitation through solutions that promote coordination, collaboration, information sharing, and the establishment of governance structures that support implementation and work toward continuous improvement of border procedures, compliance, and enforcement. Although they are easier to implement than raising workforce quality or building roads, trade facilitation reforms are nonetheless not easy. They require major investments over a period of several years, and reform progress may be threatened in politically volatile environments. In addition, negotiating and implementing these provisions can be challenging due to differences in the levels of development of member countries and participation in multiple PTAs. Successful implementation requires coordination of efforts to identify the most suitable solution for the different country contexts.
Non-tariff measures (NTMs), in the form of technical barriers to trade (TBTs) or sanitary and phytosanitary (SPS) standards, impose significant compliance costs.13 Divergent regulations may also segment markets and raise the fixed cost of entry for foreign companies. However, compliance with NTMs can improve market access by ensuring that traded goods meet the quality, safety, and compatibility standards in destination markets. The percentage of imports subject to TBT and SPS requirements increases with the complexity of the GVC. Thus, the inclusion of NTM rules in PTAs promotes transparency, leads to regulatory cooperation through harmonization or mutual recognition of standards, and ultimately improves the enforcement of these rules.
Border thickness 11 - 57 57 - 94 94 - 134 134 - 480
Map 2.1. Bilateral Border Thickness (percent, ad valorem)
58 cHAPT e R II | Reeng Ag I ng A cHA ng I ng w o R ld e conomy The promise of in T egraT ion
Sources: Lee, Checcucci, and Alfaro de Morán 2022, using the World BankUNESCAP bilateral trade costs database (2018) and World Bank Deep Trade Agreements Database (Mattoo, Rocha, and Ruta 2020). Note: Light blue indicates countries without data.
Box 2.3. The Promise of Deep Trade Agreements
Countries in Latin America and the Caribbean (LAC) started signing bilateral and regional preferential trade agreements (PTAs) that went beyond tariff cuts more than two decades ago (in the late 1990s). These deeper PTAs increasingly included a set of border and behind-the-border policies regulating customs, services trade, technical barriers to trade, sanitary and phytosanitary measures, rules on investment, intellectual property rights protection, competition policy, and labor and environmental standards, among others.
Although participation in PTAs has increased in LAC, the depth of these agreements—measured by the number of enforceable policy areas—varies considerably. Mexico and Peru have signed the deepest PTAs with the largest number of policy areas (18), followed by Colombia and Chile (17 and 15, respectively), and the Caribbean countries (on average, 16). By contrast, MERCOSUR countries have signed mostly shallow PTAs with other members of the trade bloc (only six implemented policy areas) and with the rest of the world (map B2.3.1).
LAC countries tend to have shallower agreements within the region than with the rest of the world. Intraregional PTAs typically include policy areas that currently fall under the mandate of the World Trade Organization. They do not include areas that are often included in PTAs with countries outside the region, such as investment, capital mobility, and competition policy. In addition, the detailed content of these policy areas and how they translate into national laws vary greatly, making it challenging to assess the overall depth of the PTAs.
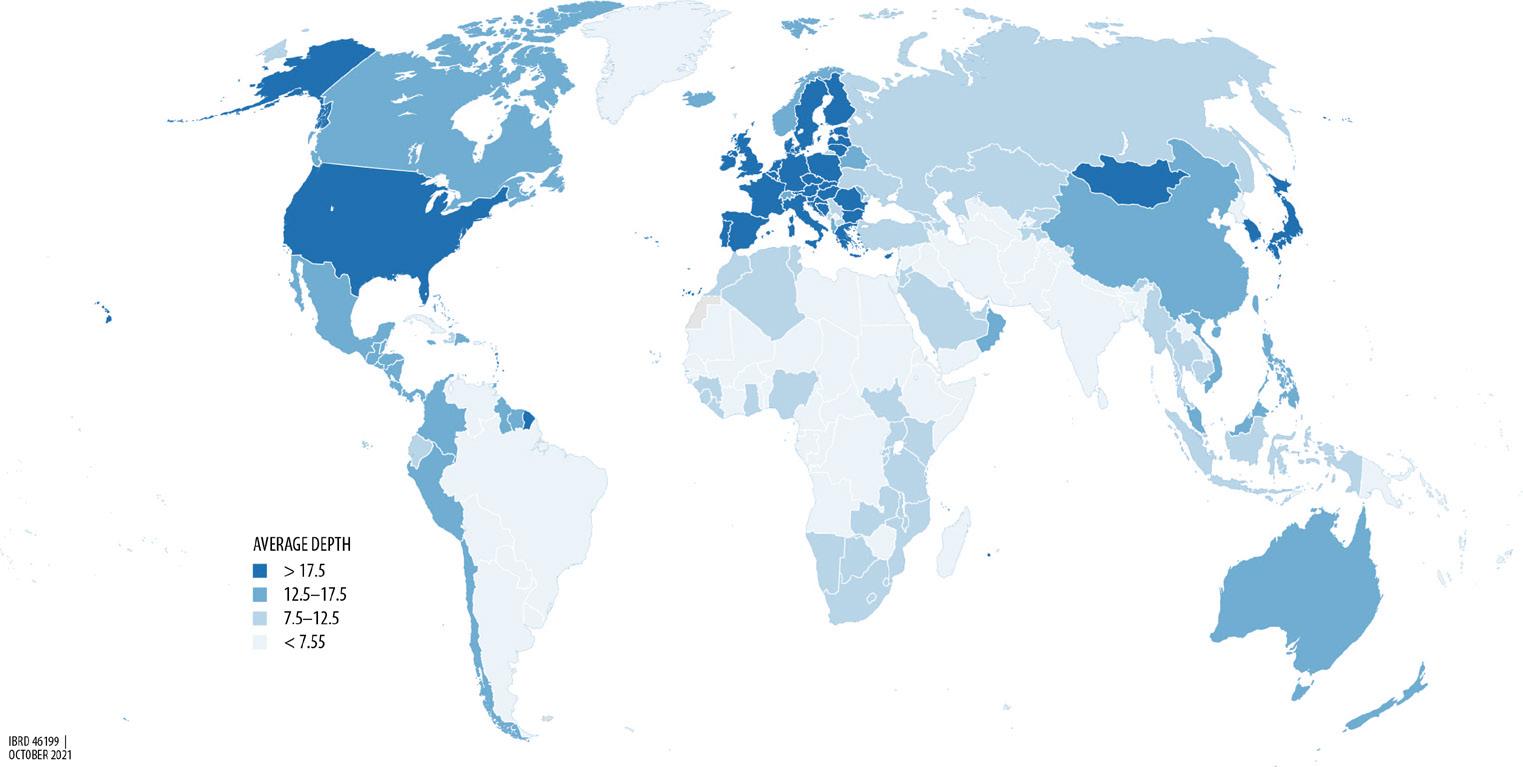
 Map B2.3.1.
Source: Calculations based on the World Bank Deep Trade Agreements Database (Hofmann, Osnago, and Ruta 2017).
Note: The depth of an agreement refers to the number of enforceable policy areas in the agreement. World Bank Copyright. Further permission is required for reuse.
Map B2.3.1.
Source: Calculations based on the World Bank Deep Trade Agreements Database (Hofmann, Osnago, and Ruta 2017).
Note: The depth of an agreement refers to the number of enforceable policy areas in the agreement. World Bank Copyright. Further permission is required for reuse.
cHAPT e R II | Reeng Ag I ng A cHA ng I ng w o R ld e conomy The promise of in T egraT ion 59
Box 2.3 (continuation)
Recent analysis quantifies the depth of existing trade agreements and offers insights about the merit of signing new deep trade agreements (Fontagne et al. 2021). The results indicate that greater PTA depth, measured by the number (or share) of legally enforceable provisions in an agreement, is associated with higher levels of global value chain (GVC)–related trade both globally and regionally (figure B2.3.1), as well as with GVC upgrading or increased participation in advanced manufacturing and services GVCs. GVC-related trade is estimated to increase by 0.3 percent after adding one extra provision to an agreement and by 12 percent after countries without a PTA in place sign the deepest possible PTA (with 30 or more provisions).
In LAC, provisions encouraging GVC participation and upgrading concern four policy areas: (i) trade facilitation, (ii) non-tariff measures, (iii) services trade, and (iv) state intervention and competition. However, successful implementation of this agenda also depends on improvements in the competitiveness of the private sector, especially in terms of institutional quality and the ability of firms to adopt new technologies and innovate.
A lower percentage of imports are subject to TBT and SPS requirements in LAC than in ECA and EAP,14 but LAC faces significant SPS and TBT barriers in destination markets. Although LAC countries have rapidly increased the number of SPS and TBT provisions included in their PTAs, the region’s record on reducing trade costs through regulatory cooperation is mixed as implementation remains a challenge and differences persist. Still, firm-level evidence from Chile, Colombia, and Peru shows that the inclusion of SPS and TBT provisions in PTAs boosts the exports of smaller firms relatively more than those of larger firms. These provisions not only reduce the NTM-related fixed entry costs of exporting, which are particularly burdensome for small exporters, they also improve the predictability of foreign market conditions by promoting transparency in NTM measures.15
Unrestricted trade in services, rules on investment, and policies in support of fair competition also enable countries to scale up and upgrade their GVC participation. A large literature provides evidence on the positive
0 2 4 6 8 10 12 14 No PTA Low depth of agreement Medium depth of agreement High depth of agreement a.
Avg. GVC related trade (log) No PTA Low depth of agreement Medium depth of agreement High depth of agreement 0 2 4 6 8 10 12 14
Figure B2.3.1. Deep PTAs and GVC-Related Trade. Simple Correlations
World
b. Latin America and the Caribbean
Source: Laget et al. 2018.
60 cHAPT e R II | Reeng Ag I ng A cHA ng I ng w o R ld e conomy The promise of in T egraT ion
Note: GVC-related trade is measured as trade in parts and components. Low-depth agreements have 15 or fewer provisions; medium-depth agreements have between 16 and 29 provisions; and high-depth agreements have 30 or more provisions. GVC = global value chain; PTA = preferential trade agreement.
links between services liberalization and productivity growth and manufacturing exports.16 The liberalization of trade in transport and telecommunications services, for example, boosts productivity in the manufacturing sectors as these services are crucial for the timely flow of goods and information between manufacturing GVC participants.
One explanation for the low integration through services trade, especially regionally, is the limited depth of LAC’s PTAs, especially with partners in the region. LAC’s PTAs with external partners tend to be more ambitious in content than those with regional ones.17 The role of services in GVC trade can be boosted by implementing a more liberal set of service sector policies, such as setting a horizontal standstill on discriminatory measures and quantitative restrictions, including provisions related to investment and the movement of people in PTAs,18 and putting in place enforcement mechanisms to address problems related to implementation.
Competition
Policies that support fair competition, such as competition policy, laws limiting the use of subsidies, and regulations on state-owned enterprises (SOEs), can improve the quality of the institutional environment and help expand GVC participation and upgrading, and permit the entry of new domestic firms.19
LAC lags behind ECA and EAP in terms of domestic competition, according to the World Economic Forum’s composite measures, although there is considerable country heterogeneity that often confuses the issue. On the one hand, some sectors have been challenged by Asian competition, particularly from China. Chilean manufacturing firms, for example, experienced the same increase in import penetration from 1995 to 2007 as the United States. Although figure 2.3 suggests a less open stance, the same pressure has been documented in the auto parts sector in Colombia (Iacovone, Maloney, and McKenzie 2022).
On the other hand, the recent literature measuring markups—a common measure of the lack of competitive pressure—suggests that the growing markups over the past 40 years in Europe and North America have just reached South America’s traditional levels (figure 2.16). It has been documented that efforts to reduce anti-competitive behavior in Peru have had positive effects on productivity, entry, and innovation (Schiffbauer, Sampi, and Coronado 2022). Further, key input sectors—digital or telecommunications provision and energy—remain highly concentrated. As documented in the subsection below on Infrastructure: Digital Connectivity, for example, LAC has the most expensive and least coverage of digital technologies. Having low fossil fuel costs but high costs of communications technology gives the region a comparative advantage in 19th century industries, but it deters entry into 21st century industries. The region also devotes considerable resources to subsidies, which are in the range of 4 percent of GDP in the countries that report these data, compared to an average of just 1.4 percent in the European Union. SOEs also play an important role in many LAC countries, where SOEs often benefit from subsidies and other government concessions, and thus potentially affect market competition.
In addition to more active competition authorities, including provisions that regulate state support to enterprises in DTAs can reduce the harm of state support policies on market competition and the negative effect such policies may have on foreign entry. DTAs could include commitments to adopt competitive neutrality in national legislation; regulate competition, subsidies, and SOEs; operate SOEs on a commercial and nondiscriminatory basis; and broaden the mandate of competition authorities to govern subsidies and SOEs. Institutional quality can also improve if DTAs require policy transparency, especially transparency on subsidies and SOEs; promote evidence-based policy impact assessments; and create frameworks for public-private partnerships.
cHAPT e R II | Reeng Ag I ng A cHA ng I ng w o R ld e conomy The promise of in T egraT ion 61
Figure 2.16. Evolution of Markups in World Regions Europe North America South America
Deficiencies in Physical and Digital Infrastructure
A recent study prepared for the report Productivity through a Territorial Lens: Leveraging Spatial Development for Economic Growth in Latin America (World Bank, forthcoming) documents how costly and deficient intercity transport costs limit market access and the ability of firms to trade, specialize, and scale up their operations (Conte and Ianchovichina 2022). In Latin America, where most cargo is transported by trucks and railways remain underdeveloped, costly transportation services, especially between large urban areas, reflect both limited competition among transportation carriers (Allen and Atkin 2022) and underinvestment in maintaining and expanding intercity road networks (Gorton and Ianchovichina 2021). Figure 2.17 shows these costs, adjusted for distance. There are many more pairs of urban locations in Brazil where these bilateral trade frictions are higher than those in the United States or China (figure 2.17, panel b). Transportation costs are also high for road shipments across national borders, making it costly to trade with regional partners. The costs of shipments between the largest cities in the region are both higher on average and much higher on the highest cost routes than in Europe or Southeast Asia (figure 2.17, panel a).
Studies from other regions suggest that making additional investments to widen and improve the conditions of highways can generate efficiencies and raise aggregate welfare in an equitable way. In India, China, and Korea, highways connecting major and intermediate economic centers have contributed to higher employment, output, and plant entry in denser and more literate districts along the highway network.20 Recent analysis suggests that Türkiye’s program to upgrade the national highway system between 2005 and 2010 has generated aggregate real income gains of between 2 and 3 percent through reduced trade costs and travel times and expanded employment at the district level.21 In LAC, a recent study estimated that the welfare gains from investments that improve intercity highways are on average around 1.6 percent of regional consumption.22 However, the dynamic gains are expected to be considerably larger as they include gains due
Asia Oceania Africa 1980 1990 2000 2010 1980 1990 2000 2010 1980 1990 2000 2010 1980 1990 2000 2010 1980 1990 2000 2010 1980 1990 2000 2010 1.8 1.6 1.2 1.0 1.4 1.8 1.6 1.2 1.0 1.4
62 cHAPT e R II | Reeng Ag I ng A cHA ng I ng w o R ld e conomy The promise of in T egraT ion
Source: De Loecker and Eeckhout 2018. Note: The firm’s markup is defined as the ratio of the output price to the marginal cost. The aggregate markup is the sales-weighted average of all firms’ individual markups in the geographical area in a given year.
Figure 2.17. Distribution of Trade Costs between Large Urban Areas after Controlling for Distance, by Region and Country
By country
to specialization and agglomeration of economic activity in areas with better market access and technological diffusion into neighboring areas.23 Upgrading transnational highways to correct for inefficiencies could boost welfare by an estimated 1.9 percent per year on average for the MERCOSUR bloc of countries and 1.5 percent for the Andean Community group of countries. Landlocked members of each bloc are estimated to benefit the most from these improvements, reflecting their dependence on transnational road transport for access to ports.
Deficiencies in the road networks can be attributed to persistently low levels of public investment (figure 2.18), but also the spatial misallocation of these investments (map 2.2). The October 2022 Latin America and the Caribbean Economic Review and figure 2.18 show that LAC has invested roughly 3 percent of GDP in public investments, compared to almost 20 percent in East Asia or even 7 percent in Africa. Further, the investment that has occurred has been poorly targeted, as shown in World Bank (forthcoming). The typical Latin American country has underinvested along road segments connecting larger urban areas and overinvested in road links in peripheral regions.24 For instance, in the case of Mexico, there is a need to upgrade the road network connecting the core of the country, centered on Mexico City, with cities along the eastern half of the country, extending to Monterrey and cities along the border with the United States, as well as cities in the South (map 2.2)—but this is not where investments have gone. Within MERCOSUR, additional investments are needed along links connecting Recife in the Northeast of Brazil with São Paulo and Coritiba via Belo Horizonte and in improvements along roads linking Coritiba with Montevideo via Porto Alegre, Asunción via Ciudad del Este, and Buenos Aires via cities in Northern Argentina (map 2.3, panel b). Within the Andean Community, additional optimal investments are needed to improve road connectivity between La Paz in Bolivia, along the coast of Peru to Lima, and through Quito to Medellín (map 2.3, panel a).
It is also the case that poor regulation and competition lead to increased transport costs (Teravaninthorn and Raballand 2009). Such factors can be addressed, in theory, more quickly than the actual physical provision of infrastructure.25
b.
EU LAC SEA BRA CHN USA -5.0 0.0 0.1 0.2 0.3 Density Density 0.4 -2.5 0.0 2.5 5.0 -5.0 0.0 0.1 0.2 0.3 -2.5 0.0 2.5 5.0 Bilateral
Bilateral
a. By region
trade friction, net of euclidean distance
trade friction, net of euclidean distance
cHAPT e R II | Reeng Ag I ng A cHA ng I ng w o R ld e conomy The promise of in T egraT ion 63
Source: Conte and Ianchovichina 2022, using the least-cost route methodology in Allen and Arkolakis (2014). Note: Bilateral trade costs reflect the geography of locations, the availability of different types of connectivity infrastructure, and the prices of different transportation service modes. BRA = Brazil; CHN = China; EU = European Union; LAC = Latin America and the Caribbean; SEA = Southeast Asia; USA = United States.
Figure 2.18. Public Investment Rates (percent of GDP)
a. Median level of public investment in developing countries
countries


Source: International Financial Statistics, International Monetary Fund. Note: Regional aggregates are weighted averages. GDP = gross domestic product; LAC =


Map 2.2. Overinvestment and Underinvestment in Roads in Mexico


Source: Gorton and Ianchovichina 2021. Note: Red links indicate overinvestment; green links indicate underinvestment.


0% 1% 2% 3% 4% 5% 6% 7% 8% Latin America and the Caribbean Europe and Central Asia South Asia Sub-Saharan Africa East Asia and Pacific Middle East andt North Africa 1% 1% 1% 2% 2% 2% 2% 3% 3% 3% 3% 3% 3% 3% 4% 4% 4% 4% 4% 4% 5% 5% 5% 5% 5% 6% 7% 9% 10.8% Aruba Brazil Mexico Antigua and Barbuda Costa Rica Bahamas Uruguay Guatemala Barbados Honduras Trinidad and Tobago Dominican Republic Argentina Paraguay Jamaica Chile Suriname St. Lucia St. Kitts and Nevis Belize Nicaragua Grenada Peru Colombia Panama Ecuador Haiti Dominica Bolivia 10% 9% 8% 7% 6% 5% 4% 3% 2% 1% 0%
in LAC
b. Public investment
Latin
and the
America
Caribbean.
64 cHAPT e R II | Reeng Ag I ng A cHA ng I ng w o R ld e conomy The promise of in T egraT ion
Source: Gorton and Ianchovichina 2021, using the spatial general equilibrium model of Fajgelbaum and Schaal (2020).
Infrastructure: Digital Connectivity
Fast, reliable, and affordable internet infrastructure is an essential ingredient in a strategy to modernize the economy and create more and better jobs in manufacturing and services, especially urban tradables.
Most LAC countries appear ill-equipped to scale up modern economic activity through digital means. Cost remains high compared to other regions, and broadband subscriptions per 100 people remain low (figure 2.19).
Source:
Note:
Map 2.3. Links Identified to Receive Additional Investments in Transnational Road Networks in the Andean Community and MERCOSUR
b. MERCOSUR
a. Andean Community
0 5 10 15 20 25 30 35 40 Sub-Saharan Africa South Asia Middle East and North Africa Latin America and the Caribbean East Asia and Pacific Europe and Central Asia
broadband subscriptions per 100 inhabitants, 2020 Averge price, $ per month
Figure 2.19. Internet Connectivity. Low Coverage, High Cost
Fixed
International Telecommunication Union.
broadband subscriptions
2020. The red
average price per month in 2020
fixed broadband connection. cHAPT e R II | Reeng Ag I ng A cHA ng I ng w o R ld e conomy The promise of in T egraT ion 65
The blue bars represent fixed
per 100 inhabitants, as reported in
markers depict the
for a
LAC’s Unproductive Cities: Weak Platforms for Launching Service or Manufacturing Ventures
Cities are important engines of economic growth as they are often the center of manufacturing and high-end services generation that would lead to diversification away from non-urban-based commodities. This could be a comparative advantage for LAC as it has some of the highest urbanization rates in the world and a large share of the workforce is concentrated in large and dense cities. The percentage of people living in cities with more than 1 million residents is higher in LAC than anywhere else in the world (United Nations 2016). Regionwide, more than 70 percent of urban areas have population densities above the global median (Roberts 2018).
In advanced countries, increased urban density increases productivity through higher density and better sharing, matching, and learning. This is also the case in many growing Asian cities, where population concentration went hand in hand with structural transformation (Grover, Lal, and Maloney 2021), becoming what Gollin, Jedwab, and Vollrath (2016) call production cities. This concentration of production cities was most pronounced along the coastal areas of China, where easy access to ports, the decline in trade costs, and the rise of information and communications technology enabled the rise of export-oriented industries.26 The importance of this compositional effect is found in the developing world by Burger, Ianchovichina, and Akbar (2022), who show in figure 2.20 that agglomeration externalities are especially high in manufactures, exporting, and foreign ownership. However, in many parts of the developing world, concentration results from the distribution of commodity rents and deindustrialization (Jedwab, Ianchovichina, and Haslop 2022) or aid flows, access to political power, or the attraction of public services in what have been called “consumption cities.” Here, as box 2.4 shows, production gains from agglomeration may be low or even negative, giving rise to what Grover and Maloney (2022) term “sterile agglomerations.”
Younger than average Older than average Smaller than average Larger than average Less experienced than average More experienced than average Domestic−owned Foreign−owned Exporter Non−exporter Services Manufacturing −.2 0 .2 .4 .6 95% Confidence Interval Average Effect
Figure 2.20. “Pure” Returns to Density in Developing Countries, after Controlling for Agglomeration Costs, by Type of Establishment
Source: Burger, Ianchovichina, and Akbar 2022.
66 cHAPT e R II | Reeng Ag I ng A cHA ng I ng w o R ld e conomy The promise of in T egraT ion
Note: The estimations are from using geo-coded data from World Bank Enterprise Surveys of more than 51,000 establishments in 649 metropolitan areas and 98 developing countries. The figure shows “pure” agglomeration effects by type of firm. The “net” agglomeration economies can be substantially lower due to agglomeration costs.
Source: Jedwab, Ianchovichina, and Haslop 2022, using IPUMS census data and the Global Human Settlements Layer database. Note: Blue shades identify production cities with a disproportionately large employment share in urban tradables. Orange shades identify consumption cities with a disproportionately high employment share in urban nontradables. Grey shades identify neutral cities. Paler shades of each color indicate lower values for the extent to which a city can be classified as each specific type.
Unsurprisingly, most large production cities—defined in Jedwab, Ianchovichina, and Haslop (2022) as cities with a disproportionately large employment share in urban tradables—are located in China, India, and Europe (map 2.4). The returns to density are weaker in LAC where the share of tradables, particularly manufactures and exports, show the highest gains from agglomeration (figure 2.20) has fallen in many countries (figure 2.7). Latin America’s cities are not more productive than rural areas, they are merely crowded. As Productivity through a Territorial Lens shows (World Bank, forthcoming), average urban location premia—wages after controlling for human capital—are not much higher than location premia in rural areas (figure 2.21), mostly due to weak net returns to density, as shown by Ferreyra and Roberts (2018). The returns to agglomeration,
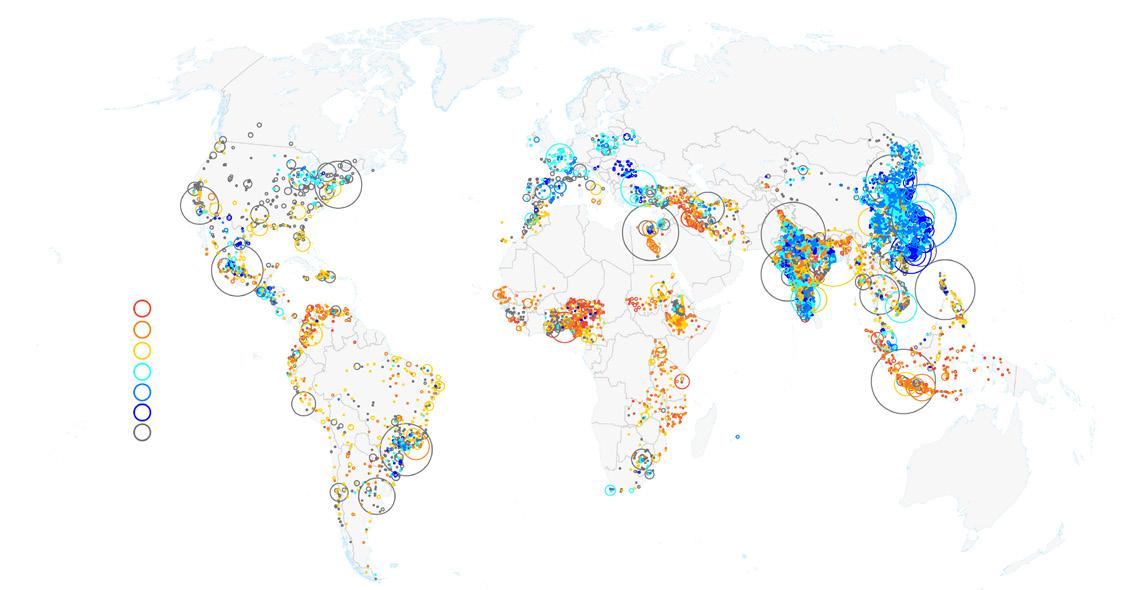
Cons- High Cons- Mid Cons- Low Prod- Low Prod- Mid Prod- High Neutral City Population 10,000,000 5,000,000 1,000,000 500,000 100,000
0 1 2 3 4 5 6 Brazil Mexico Costa Rica Dominican Republic Ecuador Honduras Chile Peru Urban Rural
Figure 2.21. Average Productivity in Rural and Urban Municipalities (percent)
cHAPT e R II | Reeng Ag I ng A cHA ng I ng w o R ld e conomy The promise of in T egraT ion 67
Source: D’Aoust, Galdo, and Ianchovichina 2023. Note: The bars represent the fraction of per capita household income that cannot be accounted for by the household’s observable, portable characteristics.
measured by the elasticity of wages with respect to density, are statistically zero in many LAC countries (figure 2.22). Further, as box 2.4 shows, even this measure overstates the true gains—higher wages may simply be capturing rising costs with agglomeration, while actual efficiency measures, such as physical total factor productivity, may be declining.
Peru Brazil Ecuador Colombia Chile
As shown in World Bank (forthcoming), this is a result of weak urban policy, but also the economic structure. Of the 25 largest cities in Latin America, only two are production cities (Guatemala City and San Salvador), seven are consumption cities with disproportionately large employment shares in urban nontradables (Rio de Janeiro, Bogotá, Belo Horizonte, Recife, Fortaleza, Salvador, and Guayaquil), and the rest are neutral cities with a balanced employment mix between tradables and nontradables. Most Latin American production cities are smaller and located in Mexico, Central America, and Southern Brazil (Jedwab, Ianchovichina, and Haslop 2022).
This means that Latin America is missing out on a growth-promoting virtuous circle. Countries with globally significant production cities can catch up faster because productivity in urban tradables varies little across countries27 and international trade positively affects endogenous innovation and growth in a country.28 This makes production cities attractive to investment, compounding their status as production cities. A deficit of large production cities of global importance makes it difficult for Latin America to catch up to the high-income status of the developed countries.
Indeed, the reverse effect has been at play. Structural transformation through deindustrialization and commodity exports has shifted the employment composition of urban centers toward nontradable services. Deindustrialization did not lead to deurbanization but to the decline in urban employment in tradables, especially in the largest LAC cities, where the decline in manufacturing employment was large and the increase in employment in tradable services could not offset the loss of these jobs (figure 2.7). Looking at the glass being half full, Box 2.5 shows that the lack of urban dynamism, combined with high degrees of labor mobility, have led to the convergence of urban and rural incomes.
Figure 2.22. Estimated Elasticity of Productivity in Urban Areas
ElSalvador CostaRica
Elasticity 0.15 0.10 0.05 0 -0.05 -0.10 Population density
HondurasDominicanRepublic Mexico
Guatemala Nicaragua
68 cHAPT e R II | Reeng Ag I ng A cHA ng I ng w o R ld e conomy The promise of in T egraT ion
Source: Quintero and Roberts 2018.
High urban density has also given rise to costs associated with traffic congestion, crime, pollution, and increased competition for customers and real estate in central urban locations. These agglomeration costs may be so high that they surpass the pure benefits from density, resulting in “sterile” net agglomeration economies (Grover and Maloney 2022) (box 2.4).29 While congestion presents a serious problem in LAC’s mega cities, which are among the most congested cities in the world, new evidence presented in World Bank (forthcoming) suggests that traffic is slow in dense cities not because of congestion but because of low uncongested mobility—that is, it is hard to move around even when it is not rush hour.30 Urban planning and investments in connectivity infrastructure have not kept pace with urbanization. Thus, in addition to measures to address congestion and improve public transportation services, municipal authorities will need to improve city planning and set aside resources for expansion and upgrades of urban connectivity infrastructure. To ignite a virtuous circle—increased tradables production, leading to greater productivity, leading to more investment in tradables production—LAC cities will need to become more attractive.
Weak Capabilities for Leveraging Comparative Advantage: Skills, Managerial Capabilities, and National Innovation Systems
Leveraging LAC’s comparative advantage, whether in natural resources, manufacturing, tourism, or services, requires the capability of agents to recognize, adapt, and implement new ideas, techniques, processes, and products. Here, the region faces significant shortfalls across the spectrum of human capital/capabilities— basic human capital, managerial capital, higher-order technical skills, and innovation systems.
At the most basic level, the region’s chronically low-quality public education leaves too many behind and is a major barrier to growth: 29 percent of firms report that growth is stymied by a lack of qualified employees, compared to 12 percent in East Asia, and there is a perennial shortfall of both mid-level technical skills and engineers.
Brazil, Chile, Colombia, Uruguay, and Panama are beginning to address the perennial shortfalls in midlevel technical graduates through short-cycle programs , which are comparable to community colleges in advanced countries. Many public worker training programs in the region remain costly and weakly aligned with the needs of the private sector. Although tremendous progress has been made, particularly in the quality of the region’s universities, LAC universities fail to place among the top 100 in the world, while East Asia has several at this level. Universities in LAC continue to graduate relatively few engineers and scientists—18 percent of graduates in LAC versus 25 percent for the world and 28 percent for East Asia. 31
Taking a historical view, arguably, this lack of technical capability explains why the United States and Japan could leverage copper to diversify and energize their economies and Chile (and other countries) could not. Latin America entered the Second Industrial Revolution unarmed, with one-fifth the number of engineers per capita of the United States and other countries with incomes similar to Chile’s, like Sweden and Denmark (Maloney and Valencia 2022). The literature also suggests that the impact of FDI depends importantly on complementary human capital factors (De Gregorio and Lee 1998). As the region sees the development of green investments, ensuring the necessary stock of technical capital will be key to leveraging these sectors for broader development.
cHAPT e R II | Reeng Ag I ng A cHA ng I ng w o R ld e conomy The promise of in T egraT ion 69
Box 2.4. Resolving the Urban Productivity Paradox
There is overwhelming evidence of the economic benefits of agglomeration, arising from shared factors of production, improved matching of firms and workers, and externalities related to knowledge spillovers. The canonical measure of such agglomeration effects is the elasticity of wages with respect to density, and the estimates are large: 0.043 in the United States, 0.03 in France, and 0.025 in Spain. Recent findings suggest that these effects are even larger in developing countries: 0.1 to 0.19 in China, 0.12 in India, and 0.17 in Africa—that is, a given increase in density increases wages by four times more in Africa than in the United States. This poses something of a paradox given that other sources of on-the-ground information suggest that developing country cities are not so much extraordinarily productive as just crowded, congested, and even dysfunctional.
However, higher wage elasticities might reflect not increased productivity but just rising costs for which workers need to be compensated. Using firm-level data with product price data from Ethiopia, Indonesia, Colombia, and Chile, Grover and Maloney (2022) estimate physical total factor productivity (TFPQ), or efficiency—which should capture the effects of better matching and externalities—and marginal costs, thereby showing how they contribute to the counterintuitive wage elasticity estimates. They first confirm the literature’s findings of high elasticities of wages and revenue total factor productivity in the poorer countries: wage elasticity estimates using plant-level data for Ethiopia of 0.052 and for Indonesia of 0.057 are not as high as those for China, India, and Africa estimated using the labor surveys mentioned above, but they are three times the estimates for the richest country in the sample, Chile (0.017), which is close to the estimates for more advanced countries.
Elasticity Estimates with Respect to Wages, Marginal Cost, and TFPQ
Source: Grover and Maloney 2022, using industrial census data and estimating TFPQ following Foster, Haltiwanger, and Syverson (2008) and De Loecker et al. (2016).
Note: Each dot presents the point estimate from regressing the log of wages, firm-level physical total factor productivity (TFPQ), and marginal costs on the log of population density at the district level. All regressions include firm age and 4-digit industry-year fixed effects. Population density is the population in each administrative location.
However, these measured benefits largely disappear after accounting for the concomitant rise in prices—efficiency gains measured as the elasticity of TFPQ with respect to density show negative elasticities for the three lower income countries and significantly so in some specifications for Ethiopia and Colombia. Rather, the findings show that the elasticity of marginal cost is strongly positive for these countries, suggesting that the costs of operating in developing country cities increase sharply with population, and this pushes up prices and hence wages. The estimates suggest that the TFPQ elasticity increases with development, while the marginal cost elasticity decreases (figure B2.4.1). The net benefit to firms of operating in a city rises steeply with development, with the elasticity of gains in productivity exceeding that of increasing costs likely occurring only at middle income.
Chile Colombia Colombia Indonesia Chile Ethiopia Ethiopia Ethiopia Chile Indonesia Indonesia Colombia −.05 0 .05 .1 Estimated elasticity 6.6 7.6 8.6 9.6 Logged average GDP per capita for the estimation period TFPQ TFPQ fitted Marginal cost Marginal Cost fitted Wage Wage fitted
Figure B2.4.1. Agglomeration
70 cHAPT e R II | Reeng Ag I ng A cHA ng I ng w o R ld e conomy The promise of in T egraT ion
Box 2.5. Regional Convergence: Low Urban Productivity Growth, Free Migration, and Increases in Commodity Rents Have Led to Lower Geographic Inequality in Latin America and the Caribbean
Greater integration with the global economy typically widens spatial inequality within countries. As Grover, Lall, and Maloney (2021) argue, in China, the emergence of dynamic coastal cities specializing in manufactures for export broke the older patterns where transport costs were higher where manufacturing served local markets. Here, income growth concentrated in the coastal cities, and interior rural areas were left behind, worsening urban-rural inequality.32 Similarly, urban-rural wage gaps grew in India, following its trade liberalization in the 1990s,33 and in Ethiopia, where trade-related industrial policies increased concentration in the capital.34 Following more than three decades of reform, liberal migration policies and good urban planning allowed the Republic of Korea to absorb domestic migrants and close the urban-rural wage gap by 1994. By contrast, in China, the “hukou” system restricted spatial mobility and contributed to the persistence of regional and urban-rural gaps in labor incomes.
By contrast, in Latin America, income inequality decreased over the past decades as lagging regions grew faster than leading urban areas (figure B2.5.1). Weak agglomeration forces did not create dynamic income poles, while rising commodity rents fueled the growth of geographically dispersed rural and mining areas. Meanwhile, deindustrialization led to the decline of manufacturing employment and the rise of the nontradable economy as workers who lost their manufacturing jobs switched to lower quality employment in the nontradable sector.35 Thus, the leveling up reflected both the catch-up of lagging rural areas and the slowdown of economic growth in the largest and relatively affluent urban municipalities.
Source: D’Aoust, Galdo, and Ianchovichina 2023. Note: Reg refers to regions in Chile.
Amazonas Ancash Apurimac Arequipa Ayacucho Cajamarca Cuzco Huanuco La Libertad Moquegua Piura San Martin Tumbes Ucayali .03 .04 .05 capita income growth to 2017−19 Aguascalientes Baja California Baja California Sur Campeche Coahuila Colima Chiapas Chihuahua Distrito Federal Durango Guanajuato Guerrero Hidalgo Jalisco Mexico Michoacan Morelos Nayarit Nuevo Leon Oaxaca Puebla Queretaro Quintana Roo San Luis Potosi Sinaloa Sonora Tabasco Tamaulipas Tlaxcala Veracruz Yucatan Zacatecas −.02 −.01 0 .01 .02 .03 Annual per capita income growth 1990 to 2015 4.5 5 5.5 6 6.5 log (real per capita income, 1990) Atlantico Boyaca Caldas Cauca Cesar Cundinamarca Huila Magdalena Meta Nariño Sucre .03 .04 .05 capita income growth to 2017−19 Rondônia Acre Amazonas Roraima Pará Amapá Tocantins Maranhão Piauí Ceará Rio Grande do Norte Paraíba Pernambuco Alagoas Sergipe Bahia Minas Gerais Espírito Santo Rio de Janeiro São Paulo Paraná Santa Catarina Rio Grande do Sul Mato Grosso do Sul Mato Grosso Goiás Distrito Federal 0 .01 .02 .03 .04 Annual per capita income growth 2002−04 to 2014−15 5.5 6 6.5 7 log (per capita income, 2002−04) c.
Figure B2.5.1. Absolute Convergence in Real per Capita Labor Income, by First Administrative Region
Colombia d. Peru by department a. Mexico by state b. Brazil by state
cHAPT e R II | Reeng Ag I ng A cHA ng I ng w o R ld e conomy The promise of in T egraT ion 71
Source: D’Aoust, Galdo, and Ianchovichina 2023.
Note: The leading areas and first and last periods in each country shown in the figure are the City of Buenos Aires, 2003–05, 2017–19, in Argentina; Belo Horizonte, São Paulo, and Rio de Janeiro, 2012–14, 2017–19, in Brazil; Santa Cruz, 2001–02, 2015–19, in Bolivia; Santiago, 2000 and 2003, 2015 and 2017, in Chile; Bogotá, 2001–03, 2017–19, in Colombia; urban Central Valley region (includes San José and other main cities), 2001–03, 2008–09, in Costa Rica; City of Santo Domingo, 2000–02, 2014–16, in the Dominican Republic; Quito (Urban Pichincha), 2003–04, 2017–19, in Ecuador; urban Tegucigalpa (Francisco Morazan), 2004–06, 2017–19, in Honduras; Mexico City metropolitan area, 2000, 2002, and 2004, 2016 and 2018, in Mexico; urban Panama province, 2001–03, 2017–19, in Panama; Ascunsion, 2002–04, 2017–19, in Paraguay; Lima, 2000–03, 2017–19, in Peru; and Montevideo, 2000–02, 2017–19, in Uruguay.
a. This result—reported in Conte and Ianchovichina (2022)—is attributed to the small dispersion of entry costs across locations within countries. Yet, the increase in aggregate welfare is larger because reduced frictions allow people to move to areas with better amenities.
Box 2.5 (continuation)
0 50 100 150 200 FirstperiodLastperiodFirstperiodLastperiodFirstperiodLastperiodFirstperiodLastperiodFirstperiodLastperiodFirstperiodLastperiodFirstperiodLastperiodFirstperiodLastperiodFirstperiodLastperiodFirstperiodLastperiodFirstperiodLastperiodFirstperiodLastperiod BOL BRA CHL CO L CRI DO M ECU HND MEX PA N PER PRY Per Capita Labor Income Gap (%) 0 50 100 150 FirstperiodLastperiodFirstperiodLastperiodFirstperiodLastperiodFirstperiodLastperiodFirstperiodLastperiodFirstperiodLastperiodFirstperiodLastperiodFirstperiodLastperiodFirstperiodLastperiodFirstperiodLastperiodFirstperiodLastperiodFirstperiodLastperiodFirstperiodLastperiodFirstperiodLastperiod ARG BOL BRA CHL COL CRI DO M ECU HND MEX PAN PER PRY URY Income gap Endowments Returns to endowments Per Capita Labor Income Gap (%)
Figure B2.5.2. Average Income Gap with the Leading Metropolitan Area, by Country
cHAPT e R II | Reeng Ag I ng A cHA ng I ng w o R ld e conomy The promise of in T egraT ion 73
The World Management Survey suggests that the region continues to lag in entrepreneurial skills, which are, on average, at the level of Kenya or India. This is due to weaknesses in both the worst and best managed firms (Maloney and Sarrias 2017).36 Historically, a lack of “entrepreneurial capital” may explain, for example, why a disproportionate share of the region’s industry was started by immigrants and foreigners. In modern times, it is common for multinationals to work with local suppliers to raise managerial quality, to ensure the quality, efficiency, and timeliness of inputs and raise the capacity of local firms to engage in more productive endeavors than, for instance, local content quotas. Recently, managerial skill has been documented as important for promoting exports (Bloom et al. 2021) in the United States and China. Preliminary evidence points to managerial skill as being important in Colombia, explaining not only the amount of exports (figure 2.23), but for entering markets with more sophisticated clients, those further away, and those with non-Spanish-speaking populations, as well as the quality of exports.
Capabilities Are Critical for Meeting and Benefitting from Global Competition
Management and technical capability appear to be important for how countries benefit from greater competition. A well-cited conceptual framework by Aghion et al. (2005) notes two types of reactions to increased competition. Firms that are close to the technological and managerial frontier—“leading” firms—are able to invest in innovation to “escape” competition through lowering costs, changing products, or increasing quality. However, “lagging” firms—those that are further from the frontier—behave more in the way that Josef Schumpeter imagined 100 years ago: the reduced rents lead to a halt in innovation and even contraction of the firm. For the United States and France, the share of all manufacturing firms that are leaders is around 50 percent, and they command a large share of the value added in a sector. In China, research suggests that this number is closer to 25 percent. In Chile, which faces increased Chinese competition, World Bank work suggests that the share is around 10 percent, encompassing only about 25 percent of value added, while the remainder of firms are decreasing their innovation on average.37 This makes sense—from the point of view of global competition, what is relevant is the share of firms close to the global frontier, and developing countries are further from it almost by definition. But the implication is that countries with fewer leaders will get much less of a growth kick from increased competition, compared to those with more leaders. This implies that increased competition will have more salutary effects the higher is the level of firm capabilities to innovate, and improving these needs to be part of the competition reform package.
12 14 16 Ln Exports Ln Employment Management 3 4 5 6 0.2 0.4 0.6 0.8 Management 0.2 0.4 0.6 0.8
Figure 2.23. Managerial Quality Is Associated with Higher Income and Exports in Colombia
74 cHAPT e R II | Reeng Ag I ng A cHA ng I ng w o R ld e conomy The promise of in T egraT ion
Source: Fernandez, Iacovone, and Maloney 2023. Note: The figure shows the correlation between management quality and employment and exports.
Numerous studies, including on Latin America, have demonstrated that managerial consulting services can help firms benchmark themselves, improve managerial practices, and raise productivity.38 However, more fundamental barriers to deepening the pool of capable entrepreneurs are posed by the weak pipeline from the education system.
Systems
Clearly, entrepreneurs do not work in isolation. The literature on national innovation systems stresses the importance of the often-non-market linkages between firms, universities, and the state in ensuring their success. Various studies show that managerial consulting services can help firms prepare to export,39 and historically such programs have been hugely important. Between 1952 and 1958, the United States sponsored training trips for European managers to learn modern management practices at US firms; those managers saw their firms’ productivity rise by 50 percent. Firms that received management training not only adopted the most advanced managerial practices, but also undertook structural changes in their organization and improved access to the credit market (Giorcelli 2019). The Japanese government established institutions in the post-war period precisely to improve the productivity of their firms, the quality of their output, and their export capabilities. Firms built on these techniques, distilling them into the Kaizen Approach, which strives for steady improvements in firm productivity punctuated by occasional innovation-driven jumps. This model was exported throughout the Association of Southeast Asian Nations region and parts of Latin America as well. Perhaps most illustratively, in the 1980s, after successfully attracting high levels of FDI, Singapore found that national firms were being left behind and were not upgrading or becoming suppliers to multinationals. The Singaporean government contracted the Japanese Productivity Center40 for help constructing a local capacity building institution, the Standards, Productivity and Innovation Board (SPRING), as well as implementing a productivity movement much as Japan had. Firms enter a highly subsidized platform to receive a basic diagnostic and plan for improvement, and as they become more sophisticated, they can contract progressively more intensive services, including support from several world-class research institutes.
10 6 2 -5 0 5 8 4 Log of Export Promotion Agency budget per capita Log of Export of Good and Services per capita Lowess smoother SLE YEM PRY DAZ TUR BFA UGA MOZ MW NER GHAKEN KEN ZMB ZMBCHM URY JORGHY COL ECU CIV GTM WBG RWA OG DMR MEX PAN TTO DEU SVN SVK GRD THA FJI TUNLBNZAF JAM CHLCBL MUS HUN MYS NLD CHE ISRFRA ESP CZE BLZLVA BWA VEN PRT AUS GBR GBRTWNFIN SEW IRL PRADNK ISL MLT NOR HKG DMA EST LTU URY ARM SLV BRABRA EGY HNDASDGAGER NTC BGDTZA Bandwidth = 0.8
Figure 2.24. Exports Increase with the Export Promotion Budget
cHAPT e R II | Reeng Ag I ng A cHA ng I ng w o R ld e conomy The promise of in T egraT ion 75
Source: Lederman, Olarreaga, and Payton 2006. Note: The lowess smoother used involves running a weighted regression of the log of exports of goods and services per capita on the log of the export promotion agency budget per capita for small subsamples of data.
Such programs can range from subsidies to private sector providers, generally ex-managers at major multinationals, to more structured agencies, like SPRING. Elements can also be embedded in government export promotion agencies (EPAs), to help with market intelligence; promote the image of the country (think the iconic coffee farmer Juan Valdes who graced the back page of the New York Times magazine for years); provide consultancy services to firms, such as employee training and technical assistance; or provide marketing services, such as exposure in trade fairs and missions. Based on a survey conducted by the World Bank in collaboration with the US Trade Commission in 2010, most EPAs are public-private institutions, with half of their executive board members representing, on average, the private sector. EPAs are charged with market diversification and attend to the needs of typically well-established small and medium-size exporting firms. Most of the EPAs’ budgets are dedicated to the provision of marketing services (for example, trade missions) and export support services (for example, training and technical assistance).41 These agencies have been documented to have a strong, positive impact of existing EPAs on exports.42 For each $1 spent on export promotion, the study estimates there is a $40 increase in exports for the median EPA. These results depend heavily on levels of development and types of instruments.
In turn, such agencies can be located within a larger national innovation system or ecosystem that encompasses universities43 and think tanks, which in the advanced countries work closely with the private sector to identify and transfer technologies and develop new products for export. Here, LAC does relatively poorly (figure 2.24). Surveys of the private sector on opinions about the quality of scientific research done in the country and the degree of collaboration between the research institutes and the private sector place LAC substantially below the advanced countries (World Economic Forum 2022). Further, in the recent Times Education ranking, research institutes in LAC are tied with Africa for a distant last place in terms of working with the private sector and facilitating knowledge and technology flows, while East Asia dominates globally.44
In sum, strengthening entrepreneurial and innovation systems requires an urgent agenda of prosaic but often politically difficult reforms of schools; universities; training programs; firms; and managerial, technical, and export support agencies, all located within the broader concept of a national innovation/entrepreneurial system.
Finance: Liquidity and Diversification of Risk
In developing countries, these systems must necessarily be more encompassing. Despite the supposed higher returns to innovation of all types from being a follower nation, market failures in markets that are assumed functional in the advanced countries can make these returns hard to realize. Along with access to skilled workers, intermediate inputs, skilled managers, and financial markets emerge as critical sources of liquidity. Cusolito and Didier (forthcoming) draw from a newly constructed data set of 2.5 million private firms across middle- and high-income countries, to analyze financial market inefficiencies. They find that these inefficiencies—namely, financial frictions and market failures—constrain financial flows to firms and, consequently, negatively affect individual firm performance (the “within” margin) and the allocation of resources across firms (the “between” margin). These findings show that the allocation of resources across firms has large implications for productivity growth. This is particularly true for firms with fewer than 100 workers.
But it is not just a problem for small and medium-size enterprises. The reason domestic capital markets rank among the “primary” considerations of foreign investors is precisely that they borrow heavily in destination markets to mitigate exchange rate risk. Hence, as much as FDI is valued as a source of capital, it also requires well-functioning financial markets. However, financial markets also serve critically as a mechanism for diversifying risk. By its nature, the development process is one of placing informed bets—on new processes,
76 cHAPT e R II | Reeng Ag I ng A cHA ng I ng w o R ld e conomy The promise of in T egraT ion
products, industries, or markets. As the region seeks to export more and more sophisticated products, it must make existing industries more efficient and greener, by investing in smart agriculture or big ticket investments in solar, wind, or green hydrogen. Placing these complex and risky bets requires the support of well-functioning financial markets.
This challenge can be seen through the lens of the rise in product quality, which, like rises in productivity, occurs across the development process. Higher quality products are more profitable, mechanically raise productivity, and are necessary to enter more sophisticated markets and become suppliers to FDI.
Quality upgrading, measured by the export prices of countries’ goods commanded in the US market— whether wine or cellular telephones—also requires placing risky bets.45 Figure 2.25 shows that there is a positive relationship between the growth rate of the quality of a nation’s basket of exports and the variance in the growth rate of prices—a proxy for risk—much as is found for financial assets. As an example, the quality of mobile handsets has risen sharply over time, but the price of a Nokia handset varied so much that the firm had to exit the market, illustrating that high tech is indeed a risky business. Low-end manufactures and commodities show less variance, but also less quality growth potential. Countries that are able to diversify risk in deep financial markets engage in riskier processes within product categories, but also riskier products, and hence they grow faster (Krishna et al. 2023).
Latin America’s position in the lower half of the curve in figure 2.25 is partly the result of insufficient progress in financial development. Part of the increased macro resilience of the region is due to the deepening of domestic capital markets both in volume and coverage over the past decades, including that institutional investors have grown more important relative to banks, diversifying the system. This has resulted from improvements in the enabling environment, reductions in macro-volatility, financial liberalization, better supervision and regulation, and advances in infrastructure (including trade, payment, custody, clearing, and settlement).46 However, financial markets remain shallow compared to comparable countries; hence, LAC’s financial markets are unable to provide the risk diversification and liquidity that are necessary for firms contemplating increasingly complex investments of long gestation. Credit to the private sector by financial institutions and stock market capitalization as a share of GDP, even in Chile, Brazil, and Peru, are roughly half that found in comparable countries, such as Korea, Malaysia, and Thailand, and tilted toward consumption instead of long-term finance for firms or infrastructure. Further, Cusolito and Didier (forthcoming) show that deepening markets has a disproportionate impact on relieving financial constraints on small firms.
The roots of both the slow deepening and particularly short maturity structure are many and constitute a reform agenda in themselves. Collateral laws need to be strengthened, including the creation of secured transactions and the monitoring of collateral. Contract enforcement costs 30 percent more in both time and share of the claim recovered than in the OECD; insolvency resolution takes almost twice as long, and investors can expect to recover only 30 cents on the dollar, compared to 71 cents for the OECD. The LAC region also lags in the depth of financial reporting standards. Progress on these and other fronts could contribute to deepening financial markets and extending maturities. In the medium term, Cusolito and Didier (forthcoming) suggest that targeting access for small and medium-size enterprises has disproportionate impacts on productivity and growth.
Clearly, structuring increasingly technologically sophisticated projects of long gestation requires increasingly sophisticated managers and firms. In this sense, improving the quality of entrepreneurial capital and increasing entrepreneurs’ access to finance at all stages are important for diversifying based on the region’s comparative advantages and moving up in quality and productivity.
cHAPT e R II | Reeng Ag I ng A cHA ng I ng w o R ld e conomy The promise of in T egraT ion 77
This symbiosis between finance and capabilities of managers is nowhere more evident than in the twenty-fold boom in venture capital (VC) that the region has experienced over the last decade (Rudolph, Miguel, Gonzalez Uribe 2022). First, 90 percent of VC projects involved non-domestic actors and the vast majority of the capital itself has come from four large international firms which have deep experience in managing high risk projects. Generating VC firms is not simply about allowing pension funds to take more risk, it involves generating a cadre of experienced entrepreneurs with the capability to offer venture management support. But second, two-thirds of founders of unicorns in the region studied abroad, learning new technologies, how to manage a high-risk firm, but also how to plug into finance and technology networks that may be of use in growing their enterprise. Both suggest that, at present, cultivating high risk finance and ventures require tight integration in the global economy until both capital and capabilities are consolidated locally.
Economic Zones and Corridors
In an attempt to resolve market failures on a manageable scale and create incentives for FDI, governments often try to set up an economic zone or corridors.
Grover, Lall, and Maloney (2022) offer a detailed discussion of both the rationale and ex ante evaluation of targeted policies. What can be called special economic zones (SEZs) include industrial districts, free trade zones, export processing zones, or any locale with favorable fiscal or institutional treatment. SEZs often employ a range of “hardware” and “software” policies in a well-defined geographical area or areas. Hardware policies include (i) liberal treatment of imports and exemptions from customs duties, particularly (but not only) in the export processing zones and free trade zones that were precursors to the current SEZs; (ii) tax incentives, particularly holidays from corporate income taxes; (iii) provision of infrastructure, including electric power, transport, water, and sanitation; (iv) distinct regulatory regimes, often involving laxer labor regulations, restrictions on union activity, and different land tenure systems; and (v) provision of large parcels of land, often with industrial sheds built in advance of occupation. Software policies include (i) management of SEZs that seeks out and works closely and effectively with private sector investors, (ii) effective implementation and management, and (iii) labor training.
0.8 0.6 0.4 0.2 0.1 0.3 0.4 0.5 0.6 0.7 0.8 0.9 0.10 0.2 Standard deviation Quality growth Portugal Hong Kong SAR, China Dominican Republic Macao SAR, China Costa Rica Belgium and Luxembourg Honduras Bangladesh Egypt, Arab Rep. Sri Lanka Peru Guatemala El SalvadorVenezuelaIndonesia PolandPhilippines Brazil RB ThailandColombia Taiwan, China Spain Israel Canada Italy Sweden France Argentina Australia Australia Ireland Netherlands Denmark Switzerland Japan United Kingdom Germany Norway Finland Singapore Mexico Korea, Rep. India China United Arab Emirates Turkey Malaysia South Africa Pakistan
Figure 2.25. The Quality of Growth. Level and Variation
78 cHAPT e R II | Reeng Ag I ng A cHA ng I ng w o R ld e conomy The promise of in T egraT ion
Source: Krishna et al. 2023.
The number of SEZs has sextupled over the past two decades, reaching 5,400 across 147 economies as of 2018 (figure 2.26). There are many successful cases, in China clearly, and also the SEZ in Costa Rica (box 2.6), but that is often the exception. The disappointing performance results from a combination of poor design and execution, but two other factors impinge as well. The first is that export processing zones are frequently used to ameliorate spatial inequalities, but often the targeting is done with an incomplete understanding of the forces that lead to spatial inequalities in the first place that might undermine the success of the SEZ. The second is more generally the absence of a framework to structure sound cost-benefit analysis of often complex projects. Such a framework could help counterbalance the overly optimistic predictions of success (optimism bias, or wishful thinking) by the advocates of place-based policies or lobbying by self-interested individuals, sectors, private interests, and regions expecting to be beneficiaries. These factors determine whether investment will be attracted and have spillovers to local areas, or if they will become expensive but inert real estate.
Many SEZs have been hobbled because key elements of the ecosystem are absent. First, SEZs need to be located in places that are consistent with their objectives and long-term economic viability. If they are export oriented (or import dependent), they need to have good access to port infrastructure. In countries where even well-located regions have difficulty attracting investment, SEZs in backward or remote regions are unlikely to succeed.
However, finding a “good location” is necessary but not sufficient for success. SEZs often offer firms generous tax incentives to locate in their jurisdictions. Yet, there is considerable evidence that tax incentives alone are insufficient for success. Assessing the marginal impact of one policy is difficult given the complementarities between it and the country context (policies in place outside the SEZ). Nevertheless, Farole (2011) looks at data across 77 countries and finds that infrastructure and trade facilitation have a significant positive impact, while tax and other financial incentives are much less important. In some situations, SEZs may be able to remedy a key bottleneck for development. For instance, the main advantage of SEZs in Bangladesh seems to be their ability to offer well-serviced land to manufacturing investors.
Effective implementation of policy also matters. This requires action that is coordinated across functions (tax, land, and infrastructure)—and thus requires that the organization running the SEZ be empowered to deliver these functions. There must also be credible commitment to policy for many years ahead. Taken together, these considerations mean that commitment is needed from the highest level of government. At the same time, the SEZ authority needs to be responsive to the concerns of the firms in the zone.
0 1000 2000 3000 4000 5000 6000 0 50 100 150 200 250 300 1975 1986 1985 1997 2002 2006 2008 2014 2018 Number of economies with SEZs Number of SEZs (right axis)
Figure 2.26. Special Economic Zones Have Increased Sixfold over the Past Two Decades
cHAPT e R II | Reeng Ag I ng A cHA ng I ng w o R ld e conomy The promise of in T egraT ion 79
Source: UNCTAD 2019. Note: SEZs = special economic zones.
Beyond the direct effects of attracting investment and creating jobs, a successful SEZ will have an internal dynamic of spillovers between firms, agglomeration, and productivity growth. This will have a horizontal element, with a large number of firms in the same sector building up thick labor markets and other agglomeration economies. It will also have a vertical element, with co-location of input suppliers and the growth of forward and backward linkages. This process encounters the first-mover or “all-at-once” coordination problem—it is hard to start a cluster. Involvement of one or several large firms is one route to kick-start this process, as with the multinational electronics companies (including AMD, Fairchild Semiconductor, and Intel), which were initially attracted to the free economic zone in Penang, Malaysia. Attracting such companies requires governments to deliver intensive packages of soft policy, working closely with the companies and committing to meet international standards. Links from the SEZ to the local economy include developing skills in the local labor market, expanding the technological capabilities of local firms, increasing the use of local firms as suppliers and customers, and leading to entrepreneurial spinoffs from firms in the zone. In successful SEZs, the share of activity in the SEZ being undertaken by local firms increases—sometimes as part of a maturing and upgrading process. In Mauritius, the SEZ upgraded from low-value textiles to higher value and more skill intensive products (off-shoring low-value production to the SEZ in Madagascar). In Malaysia, the Penang SEZ focused from the start on electronics, but upgraded from basic assembly to more advanced and skill intensive goods. Both of these sectoral transitions were accompanied by a transition toward locally owned firms.
The role of government in this process is important and needs to be based on recognition that there are mutual benefits—for firms in the SEZ and the local economy—from developing these spillovers. Thus, rigid domestic content requirements are likely to be viewed as a cost to firms in the SEZ and may transfer little learning to firms outside the SEZ. Working to bring local firms up to the level where they are chosen suppliers is of mutual benefit. The knowledge transfer also benefits the government itself because SEZs can provide a vehicle for learning about what makes an effective business environment.
Attracting FDI through Investment Promotion Agencies
Improving investment promotion agencies (IPAs) can help increase FDI inflows, attract higher quality FDI, and transform the economies of their home countries (figure 2.27). These agencies range in functions but generally work to improve the image of the host country, identify possible investors, support project management, and some play an advocacy role in promoting reforms of the overall business climate. They play an important role in matching investors with local suppliers, providing information, facilitating transactions (securing permits and negotiating bureaucracies), and managing investment incentives. Estimates of these effects show that US$1 spent on investment promotion could yield up to US$189 in FDI inflows and spending a relatively modest US$78 in investment promotion creates one additional job in the promoted sectors.47 The number of IPAs has increased significantly since 1980, especially in developing countries, where investors suffer from obstacles imposed by institutional and cultural differences from their home countries as well as have less information about local regulation.
Although IPAs can be a useful tool to attract foreign investment, recent studies have shown that in developing countries they frequently lack strategic focus, failing to provide the services most valued by investors, such as advocating for improvements in the business climate. Sharpening their focus, building a coherent institutional framework, and strengthening their delivery of investor services can improve their efficacy. A recent World Bank report48 recommends that IPAs should (i) focus on a limited number of mandates and target segments, (ii) adopt institutional features common to private companies, and (iii) offer relevant and high-quality investor services across the investment life cycle. The report concludes that to maximize IPAs’
80 cHAPT e R II | Reeng Ag I ng A cHA ng I ng w o R ld e conomy The promise of in T egraT ion
Box 2.6. Successful Export Processing Zones in Costa Rica: Critical Elements of Success
The Coyol Free Zone (CFZ) in Alajuela, Costa Rica, has won numerous awards, including being named Best Free Trade Zone in Latin America by The European and a Top 10 Free Trade Zone by fDi Intelligence magazine. Established in 2007, the zone focuses on the life sciences cluster and includes such clients as Abbott, Cardinal Health, Medtronic, and Philips. In 2019, the zone exported nearly $2.1 billion in medical devices, amounting to 58 percent of manufacturing exports in Costa Rican free trade zones. It employs 16,000 people.
The CFZ is part of Costa Rica’s free trade regime, which provides incentives for international companies to locate in the country. In the CFZ, these incentives include permanent exemptions from customs on imports and exports, tax on royalties and fees, sales tax on local products, and stamp duty. In addition, there is a 10-year exemption from taxes on property transfers. For service and manufacturing projects, there is a 100 percent exemption from income taxes for eight years, followed by a 50 percent exemption for four more years.
Several infrastructure advantages help make the CFZ successful. First, it is only five miles from Costa Rica’s main airport, the Juan Santamaría International Airport. It has easy access to three highways, allowing for access to the coast and shipment by sea. Second, within the park, much of the essential infrastructure contains several backup systems. The electric grid has three backup substations in addition to the main station, and underground connections, which minimize the risk of weather damage. The water system is similarly redundant, with four wells devoted to the CFZ, and the water both inside and outside the CFZ is potable. Third, the fiber optic network is fully redundant and serviced by five different telecom providers. Together, these redundancies enable companies to feel secure that they will have continual access to power, water, and internet service if they choose to locate in the CFZ. In addition to these redundancies, the CFZ also contains on-site sterilization companies. This represents a cost savings for medical device companies that choose to locate there. It is possible to produce a device in the CFZ, sterilize it, and ship it to its final destination rather than paying for an intermediate stop for sterilization. The CFZ has partnered with the Costa Rica Investment Promotion Agency to create a database of people looking for jobs in the zone, making it easy for companies to find qualified workers.
Benefits—direct and indirect quantity effects. Beyond the direct effects of providing the infrastructure that makes the zone attractive for companies to locate there and create jobs, the CFZ has potential positive spillovers to the local area. First, Procomer, the agency in Costa Rica responsible for promoting the country’s free trade zones, believes that indirect employment generated by all the free trade zones in the country amounts to at least 50,000 workers, some of which is due to indirect employment around the CFZ. Indirect employment could stem from several sources, including utility companies that hire additional staff to deal with the increased demand from the zone and restaurants and shops that provide goods and services to the workers. Partnerships between local universities and the CFZ also have human capital spillovers. The CFZ has agreements with multiple universities in the area, which offer training for bachelor’s and master’s degrees as well as technical skills training on-site at the CFZ. The University of Minnesota has collaborated with a local university, Technologico de Costa Rica, to offer a master’s degree in engineering with a focus on medical devices. Programs such as these
cHAPT e R II | Reeng Ag I ng A cHA ng I ng w o R ld e conomy The promise of in T egraT ion 81
Box 2.6 (continuation)
allow the CFZ to offer high-skilled jobs in areas where locals may not have degrees without these partnerships. Locals, even if they are not ultimately employed by companies in the CFZ, still have access to science, technology, engineering, and mathematics degrees, which will make them attractive to other companies as well. If these degrees would not exist in the absence of the CFZ, these human capital spillovers can be considered to be an indirect benefit of the CFZ. The companies in the CFZ also have partnerships with technical high schools to hire students as interns, which may lead to permanent employment.
Costs. While the CFZ yields numerous benefits, it also has costs. First, the incentive programs limit potential government revenue from the program. Tax incentives for companies that locate in the CFZ are lost tax revenue, especially if the companies would have located in Costa Rica regardless of the incentives. In addition to the lost revenue, another potential cost of the CFZ is increased traffic congestion as trucks transport exports from the CFZ to the airport, or as people commute to jobs in the CFZ. Rush hour commutes in the Central Valley (the region in which the CFZ is located) have increased 40 percent since 2015. This increase is not necessarily only related to the CFZ, but the zone could be contributing to the severe traffic congestion in the area. Similarly, the jobs created by the CFZ would be attractive to residents of other parts of Costa Rica. If the CFZ induced migration through direct or the indirect jobs, this would put upward pressure on the cost of living in the region as people move in and demand housing. The final potential cost is environmental. The manufacturing processes in the CFZ generate environmental pollutants, which are thus a consequence of the CFZ that should be taken into account. However, the CFZ has committed some of its acreage to maintaining the ecosystem of the area. Further, Costa Rica is generally committed to environmentalism, and pledged to become one of the first carbon neutral countries in the world by 2021.
impact, policy makers should (i) provide high-level government support (from the president or prime minister); (ii) foster strong, strategic focus and alignment; (iii) grant a clear, uncontested mandate for investment promotion and a high degree of autonomy; (iv) facilitate collaboration with governments’ other investment institutions; and (v) provide sufficient and sustained financial resources.
Source: Quoted from Grover, Lall, and Maloney (2022).
82 cHAPT e R II | Reeng Ag I ng A cHA ng I ng w o R ld e conomy The promise of in T egraT ion
Figure 2.27. Higher Quality IPAs Can Attract More FDI
Source: World Bank 2020b.
Note: The dependent variable is the average FDI inflow received by each country during 2000–10 as reported in the International Monetary Fund’s International Financial Statistics. IPA service quality is measured based on ratings on a scale from 0 to 100 from World Bank (2012). FDI = foreign direct investment; IPA = investment promotion agency.
30 25 20 15 10 20 30 40 50 60 70 80 90 100 IPA quality (score) Average FDI inflow, 2000-10 (log) NIC CYP FIN TUR DNK PRT GRC ISL NZL CRISVNLTULMA EST SVK POL SRB KOR ISR CZE SGP IRL NLD LUX USA MEX ITA SAU CHL THA MYS JPN COLARG PER PAKROMLBNZAFPHLBGR TUN VEN GHAGTMBWABHRTTO JOR URYJAM MKD ARM MDA BRN MUS GRD LCA FJI BRB SLVKSV BIH LKAHGAHNDALBECU GEO MNE OMN HRV BLR IRQ TZA KHMBGD MNG PRY ATG KEN SYC GUYMCTBLZ SEN VUTDMA WSM KNA MDG WBGSWZ DOM DZAIDN EGY UKR KIAZ IND NGA VNM SDN LBY AGO PAN MAR ZMB YEM ETH TJKLAO PNG LSO DJI IRN RWA GMBMWI TON NPL SLBKWT MDV MLIO LBR NAM TGO BEN SLE HTI BTN BFA KGZ COG CMR GAB NER ERI GNB BDI GIN BOL SYRMOZ RUS CHN BHS AZE CHE FRA ESP HKG BRA AUS CAN GBR DEU HUN SWE AUT
cHAPT e R II | Reeng Ag I ng A cHA ng I ng w o R ld e conomy The promise of in T egraT ion 83
Conclusion
LAC has tremendous potential both in its traditional areas of comparative advantage and the new sources arising from opportunities in the green economy. The challenge remains to mobilize the investment and know-how to leverage these opportunities to generate diversified and dynamic economies.
However, over the past two decades, LAC has not exploited the gains from greater integration in the global economy in terms of scale economies, transfer of know-how and technology, and capital. Trade exposure has largely stagnated and FDI has fallen for most countries, even as reshoring and nearshoring have become more common. Expanding trade exposure and leveraging comparative advantages are critical as the region seeks to raise its growth rates, expand into new areas of services, reduce its environmental footprint, and take advantage of its new areas of green comparative advantage.
Many of the necessary reforms involve those traditionally on the agenda that have a long gestation period: reducing systemic risk, raising the level and quality of education, investing in infrastructure both traditional and digital, making cities better platforms for manufacturers and services, raising capabilities across the whole spectrum of human capital, and ensuring well-functioning financial markets to provide liquidity and diversify risk. These all require long and sustained effort, but they are essential for productive integration.
There are also interventions with a shorter time horizon. The first, following Hippocrates, is do no harm: to preserve the reputational gains of the past 20 years in terms of macro stability.
Second, regulatory gains in customs and transport are, in principle, low in cost and could be done over a short time scale. These can be done in the context of DTAs that both provide a framework for the component reforms and add to confidence in the basic rules of the game.
Finally, both EPAs and IPAs have a proven track record. The former have a component of managerial consulting services to get potential exporters over the hump. However, in LAC, both types of agencies can be unfocused and hence less effective than the potential.
A comprehensive approach to both shorter- and longer-term reforms could move LAC toward a renewed and more dynamic engagement with the global economy.
84 cHAPT e R II | Reeng Ag I ng A cHA ng I ng w o R ld e conomy The promise of in T egraT ion
Notes
1 The East Asian miracles include Japan; the Republic of Korea; Taiwan, China; Hong Kong SAR, China; and Singapore.
2 Borin and Mancini (2019).
3 See, for example, Li and Liu (2005) and Carkovic and Levine (2005) for summaries of the literature.
4 See Baiashvili and Gattini (2020) for a recent estimation across different income levels.
5 The elasticities are typically found to be highly nonlinear for various important development co-factors. Here, a range of average elasticities across low-income and upper-middle-income countries are used.
6 World Economic Forum (2022).
7 The measure is calculated as the ad valorem equivalent “wedge” between intraregional trade and domestic commerce.
8 See Christ and Ferrantino (2011), Hummels and Schaur (2013), Arvis, Raballand, and Marteau (2010), and Fernandes, Kee, and Winkler (2020).
9 See Osnago, Rocha, and Ruta (2017) and Orefice and Rocha (2012).
10 See Ruta (2017).
11 Vertical FDI refers to investment made within the supply chain.
12 For details, see Mattoo, Rocha, and Ruta (2020).
13 Portugal-Perez, Reyes, and Wilson (2009) show that certification and auditing can generate additional costs.
14 See Kee and Forero (2020) for details.
15 Fernandes, Lefebvre, and Rocha (2021).
16 See Nicoletti and Scarpetta (2003), Arnold et al. (2015), Hoekman and Shepherd (2017), and Winkler (2019).
17 Rocha and Ruta (2022).
18 These have been found to be associated with higher value added in services exports.
19 Rocha and Ruta (2022).
20 See Ghani, Goswami, and Kerr (2016) for India; Baum-Snow et al. (2017) for China; and Henderson, Lee, and Lee (2001) for Korea.
21 For details, see Coşar et al. (2021).
22 Gorton and Ianchovichina (2021) provide additional details.
23 See Conte and Ianchovichina (2022) for details.
24 See the analysis in Gorton and Ianchovichina (2021) for more details.
25 See, for example, World Bank (2012).
26 See Coşar and Fajgelbaum (2016).
27 See Duarte and Restuccia (2010, 2020).
28 See Melitz and Redding (2021).
29 See Grover, Lall, and Maloney (2021).
30 See Akbar (2022) for details.
31 Times University Rankings 2023, https://www.timeshighereducation.com/world-university-rankings/2023/world-ranking.
32 See Baum-Snow et al. (2017).
33 See Dasgupta and Grover (2021).
34 See Grover (2019).
35 Dix-Carneiro and Kovak (2017).
36 World Management Survey, worldmanagementsurvey.org, https://www.sciencedirect.com/science/article/pii/S0167268117300021?casa_token=PaS80nuKFOwAAAAA:5q6CHyVuQOXCe7YJGfUUkkFOIpbomwnrPMmUH2GJd2z-PqRdqAlktHpxdEEjXekxqDjvVGi36qY.
37 Cusolito, Garcia-Marin, and Maloney (2023).
38 https://academic.oup.com/qje/article-abstract/128/1/1/1838606?redirectedFrom=fulltext; https://academic.oup.com/restud/article-abstract/89/1/346/6149318?redirectedFrom=fulltext&casa_token=liSox_19T_kAAAAA:62A4GeIFoUny0VjKZ33VEip89zBFiidRkU2QqmdC5jIOjb_12RjPL-qSebXq4OAc7L8z1QY-jhe2Ogs
39 See Cirera and Maloney (2017) for a review of evidence on this.
40 https://jpc.jpc-net.jp/eng/
41 Cruz, Lederman, and Zoratto (2018).
42 Lederman, Olarreaga, and Payton (2006).
43 See Cirera and Maloney (2017).
44 Times University Rankings 2023, https://www.timeshighereducation.com/world-university-rankings/ world-university-rankings-2023-trends-working-industry.
45 Krishna et al. (2023).
46 de la Torre, Ize, and Schmukler (2011).
47 Harding and Javorcik (2011).
48 World Bank (2020b).
cHAPT e R II | Reeng Ag I ng A cHA ng I ng w o R ld e conomy The promise of in T egraT ion 85
References
Aghion, P., N. Bloom, R. Blundell, R. Griffith, and P. Howitt. 2005. “Competition and Innovation: An Inverted-U Relationship.” Quarterly Journal of Economics 120 (2): 701–28.
Akbar, P. 2022. “Mobility and Congestion in Urban Areas in Latin America and the Caribbean.” Background note for the LAC regional flagship on Spatial Development and Economic Growth. World Bank, Washington, DC.
Alfaro, L., A. Chanda, S. Kalemli-Ozcan, and S. Sayek. 2004. “FDI and Economic Growth: The Role of Local Financial Markets.” Journal of International Economics 64 (1): 89–112.
. 2006. “How Does Foreign Direct Investment Promote Economic Growth?” Weatherhead Center for International Affairs, Harvard University, Cambridge, MA.
Allen, T., and C. Arkolakis. 2014. “Trade and the Topography of the Spatial Economy.” Quarterly Journal of Economics 129 (3): 1085–1140.
Allen, T., and Atkin, D. (2022) “Trucks,” mimeo.
Arnold, J., B. Javorcik, M. Lipscomb, and A. Mattoo. 2015. “Services Reform and Manufacturing Performance: Evidence from India.” Economic Journal 126 (590): 1–39.
Arvis, J.-F., G. Raballand, and J.-F. Marteau. 2010. The Cost of Being Land-locked: Logistics Costs and Supply Chain Reliability. Directions in Development Trade No. 55837. Washington, DC: World Bank.
Baiashvili, T., and L. Gattini. 2020. “Impact of FDI on Economic Growth: The Role of Country Income Levels and Institutional Strength.” Working Paper 2020/-2, European Investment Bank, Kirchberg, Luxembourg.
Baum-Snow, N., L. Brandt, J. V. Henderson, M. A. Turner, and Q. Zhang. 2017. “Roads, Railroads, and Decentralization of Chinese Cities.” Review of Economics and Statistics 99 (3): 435–48.
Beaton, K., A. Cebotari, X. Ding, and A. Komaromi. 2017. “Trade Integration in Latin America: A Network Perspective.” IMF Working Paper WP/17/148, International Monetary Fund, Washington, DC.
Beylis, G., R. F. Jaef, R. Sinha, and M. Morris. 2020. “Going Viral: COVID-19 and the Accelerated Transformation of Jobs in Latin America and the Caribbean.” World Bank, Washington, DC.
Bloom, N., K. Manova, J. Van Reenen, S. T. Sun, and Z. Yu. 2021. “Trade and Management.” Review of Economics and Statistics 103 (3): 443–60.
Borensztein, E., J. De Gregorio, and J. W. Lee. 1998. “How Does Foreign Direct Investment Affect Economic Growth?” Journal of International Economics 45 (1): 115–35.
Borin, A., and M. Mancini. 2019. “Measuring What Matters in Global Value Chains and Value Added Trade.” Policy Research Working Paper 8804, World Bank, Washington, DC.
Burger, M., E. Ianchovichina, and P. Akbar. 2022. “Heterogenous Agglomeration Economies in the Developing Countries: The Roles of Firm Characteristics, Sector Tradability, and Urban Mobility.” Policy Research Working Paper 9954, World Bank, Washington, DC.
Busse, M., and J. L. Groizard. 2008. “Foreign Direct Investment, Regulations and Growth.” World Economy 31 (7): 861–86.
Carkovic, M., and R. E. Levine. 2005. “Does Foreign Direct Investment Accelerate Economic Growth?” In Does Foreign Direct Investment Promote Development? Edited by T. H. Moran, E. M. Graham, and M. Blomstrom, 195–220. Washington, DC: Institute for International Economics and Center for Global Development.
Choe, J. I. 2003. “Do Foreign Direct Investment and Gross Domestic Investment Promote Economic Growth?” Review of Development Economics 7 (1): 44–57.
Christ, N., and M. Ferrantino. 2011. “Land Transport for Exports: The Effects of Cost, Time, and Uncertainty in Sub-Saharan Africa.” World Development 39 (10): 1749–59.
Cirera, X., and W. F. Maloney. 2017. The Innovation Paradox: Developing-Country Capabilities and the Unrealized Promise of Technological Catch-Up. Washington, DC: World Bank. https://openknowledge.worldbank.org/handle/10986/28341
Coe, D. T., and E. Helpman. 1995. “International R&D spillovers.” European Economic Review 39 (5): 859–87.
Conte, B., and E. Ianchovichina. 2022. “Spatial Development and Mobility Frictions in Latin America: Theory-Based Empirical Evidence.” Policy Research Working Paper 10071, World Bank, Washington, DC.
Coşar, K., B. Demir, D. Ghose, and N. Young. 2021. “Road Capacity, Domestic Trade, and Regional Outcomes.” Journal of Economic Geography 22 (5): 901–29.
Coşar, A. K., and P. D. Fajgelbaum. 2016. “Internal Geography, International Trade, and Regional Specialization.” American Economic Journal: Microeconomics 8 (1): 24–56.
Crespo, N., and M. P. Fontoura. 2007. “Determinant Factors of FDI Spillovers—What Do We Really Know?” World Development 35 (3): 410–25. Cruz, M., D. Lederman, and L. Zoratto. 2018. “Anatomy and Impact of Export Promotion Agencies.” Policy Research Working Paper 8470, World Bank, Washington, DC.
Cusolito, A. P., and T. Didier. Forthcoming. Misallocation of Finance: Evidence and Policies to Close the Finance Productivity Divide. World Bank Productivity Project. Washington, DC: World Bank.
86 cHAPT e R II | Reeng Ag I ng A cHA ng I ng w o R ld e conomy The promise of in T egraT ion
Cusolito, A. P., A. Garcia-Marin, and W. F. Maloney. 2023. “Proximity to the Frontier, Markups, and the Response of Innovation to Foreign Competition: Evidence from Matched Production-Innovation Surveys in Chile.” American Economic Review: Insights 5 (1): 35–54.
D’Aoust, O., V. Galdo, and E. Ianchovichina. 2023. “Territorial Productivity Differences and Dynamics within Latin American Countries.” World Bank, Washington, DC.
Dasgupta, K., and A. Grover. 2021. “Trade, Transport and Territorial Development.” World Bank, Washington, DC.
Borensztein, E., De Gregorio, J. and Lee, J.W. 1998. “How does foreign direct investment affect economic growth?.” Journal of International Economics, 45(1), pp.115-135.
de la Torre, A., A. Ize, and S. L. Schmukler. 2011. Financial Development in Latin America and the Caribbean: The Road Ahead. Washington, DC: World Bank.
De Loecker, J., and J. Eeckhout. 2018. “Global Market Power.” NBER Working Paper w24768, National Bureau of Economic Research, Cambridge, MA.
De Loecker, J., P. K. Goldberg, A. K. Khandelwal, and N. Pavcnik. 2016. “Prices, Markups, and Trade Reform.” Econometrica 4 (2): 445–510.
Dix-Carneiro, R., and B. Kovak. 2017. “Trade Liberalization and Regional Dynamics.” American Economic Review 107 (10): 2908–46.
Duarte, M., and D. Restuccia. 2010. “The Role of the Structural Transformation in Aggregate Productivity.” Quarterly Journal of Economics 125 (1): 129–73.
———. 2020. “Relative Prices and Sectoral Productivity.” Journal of the European Economic Association 18 (3): 1400–43.
Fajgelbaum, P., and E. Schaal. 2020. “Optimal Transport Networks in Spatial Equilibrium.” Econometrica 88 (4): 1411–52.
Farole, T. 2011. “Special Economic Zones: What Have We Learned?” Economic Premise, No. 64 (September), Poverty Reduction and Economic Management Network (PREM), World Bank, Washington, DC.
Fernandes, A., H. Kee, and D. Winkler. 2020. “Determinants of Global Value Chain Participation: Cross-Country Evidence.” Policy Research Working Paper 9197, World Bank, Washington, DC.
Fernandes, A., K. Lefebvre, and N. Rocha. 2021. “Heterogeneous Impacts of SPS and TBT Regulations: Firm-Level Evidence from Deep Trade Agreements.” World Bank, Washington, DC.
Fernandez, A., L. Iacovone, and W. Maloney. 2023. “Management and Exports Performance: Evidence from Colombia.” World Bank, Washington, DC.
Ferreyra, M. M., and M. Roberts (eds.). 2018. Raising the Bar for Productive Cities in Latin America and the Caribbean. Washington, DC: World Bank.
Fontagne, L., N. Rocha, M. Ruta, and G. Santoni. 2021. “A General Equilibrium Assessment of the Economic Impact of Deep Trade Agreements.” Policy Research Working Paper 9630, World Bank, Washington, DC.
Foster, L., J. Haltiwanger, and C. Syverson. 2008. “Reallocation, Firm Turnover, and Efficiency: Selection on Productivity or Profitability?” American Economic Review 98 (1): 394–425.
Frankel, J. A., and D. H. Romer. 1999. “Does Trade Cause Growth?” American Economic Review 89 (3): 379–99.
Ghani, E., A. Goswami, and W. Kerr. 2016. “Highway to Success: The Impact of the Golden Quadrilateral Project for the Location and Performance of Indian Manufacturing.” Economic Journal 126 (591): 317–57.
Giorcelli, M. (2019). The long-term effects of management and technology transfers. American Economic Review, 109(1), 121-52.
Gollin, D., Jedwab, R. and Vollrath, D. 2016. “Urbanization with and without industrialization.” Journal of Economic Growth, 21:35-70.
Gorton, N., and E. Ianchovichina. 2021. “Trade Networks in Latin America: Spatial Inefficiencies and Optimal Expansions.” Policy Research Working Paper 9843, World Bank, Washington, DC. https://openknowledge.worldbank.org/handle/10986/36555
Grossman, G. M., and E. Helpman. 1991. “Trade, Knowledge Spillovers, and Growth.” European Economic Review 35 (2-3): 517–26.
Grover, A. 2019. “Firms Far Up: Productivity, Agglomeration, and High-Growth Firms in Ethiopia.” Policy Research Working Paper 9099, World Bank, Washington, DC.
Grover, A., S. Lall, and W. Maloney. 2022. Place, Productivity, and Prosperity: Revisiting Spatially Targeted Policies for Regional Development Washington, DC: World Bank. https://openknowledge.worldbank.org/handle/10986/36843
Grover, A., and W. Maloney. 2022. “Proximity without Productivity: Agglomeration Effects with Plant-Level Output and Price Data.” Policy Research Working Paper 9977, World Bank, Washington, DC.
Harding, T., and B. S. Javorcik. 2011. “Roll Out the Red Carpet and They Will Come: Investment Promotion and FDI Inflows.” Economic Journal 121 (557): 1445–76.
Hausmann, R., C. Hidalgo, S. Bustos, M. Coscia, A. Simoes, and M. Yildirim. 2013. The Atlas of Economic Complexity: Mapping Paths to Prosperity. Cambridge, MA: MIT Press.
Henderson, V., T. Lee, and Y. J. Lee. 2001. “Scale Externalities in Korea.” Journal of Urban Economics 49: 479–504.
Hoekman, B., and B. Shepherd. 2017. “Services Productivity, Trade Policy and Manufacturing Exports.” Special Issue: Services and Manufacturing Activity. World Economy 40 (3): 499–516.
cHAPT e R II | Reeng Ag I ng A cHA ng I ng w o R ld e conomy The promise of in T egraT ion 87
Hofmann, C., A. Osnago, and M. Ruta. 2017. “Horizontal Depth: A New Database on the Content of Preferential Trade Agreements.” Policy Research Working Paper 7981, World Bank, Washington, DC.
Hummels, D., and G. Schaur. 2013. “Time as a Trade Barrier.” American Economic Review 103 (7): 2935–59.
Iacovone, L., W. Maloney, and D. McKenzie. 2022. “Improving Management with Individual and Group-Based Consulting: Results from a Randomized Experiment in Colombia.” Review of Economic Studies 89 (1): 346–71.
Irwin, D. A. 2019. “Does Trade Reform Promote Economic Growth? A Review of Recent Evidence.” NBER Working Paper 25927, National Bureau of Economic Research, Cambridge, MA.
Jedwab, R., E. Ianchovichina, and F. Haslop. 2022. “Consumption Cities versus Production Cities: New Considerations and Evidence.” Policy Research Working Paper 10105, World Bank, Washington, DC. https://openknowledge.worldbank.org/handle/10986/9371.
Kee, H.-L., and A. Forero. 2020. “Non-Tariff Measures of Colombia.” World Bank, Washington, DC.
KPMG. 2020. “Cost of Manufacturing Operations Around the Globe.” KPMG, Amstelveen, Netherlands
Krishna, P., A. Levchenko, L. Ma, and W. F. Maloney. 2023. “Growth and Risk: A View from International Trade.” NBER Working Paper 30915, National Bureau of Economic Research, Cambridge, MA. http://www.nber.org/papers/w30915
Laget, E., A. Osnago, N. Rocha, and M. Ruta. 2018. “Deep Trade Agreements and Global Value Chains.” Policy Research Working Paper 8491, World Bank, Washington, DC.
Lederman, D., and W. F. Maloney. 2012. Does What You Export Matter? In Search of Empirical Guidance for Industrial Policies. Washington, DC: World Bank. https://openknowledge.worldbank.org/handle/10986/9371
Lederman, D., M. Olarreaga, and L. Payton. 2006. “Export Promotion Agencies: What Works and What Doesn’t.: Policy Research Working Paper 4044, World Bank, Washington, DC.
Lee, W., E. Checcucci, and M. Alfaro de Morán. 2022. “Trade Facilitation: Simplifying and Harmonizing Procedures.” In Deep Trade Agreements: Anchoring Global Value Chains in Latin America and the Caribbean, edited by N. Rocha and M. Ruta, 95–136. Washington, DC: World Bank.
Li, X., and X. Liu. 2005. “Foreign Direct Investment and Economic Growth: An Increasingly Endogenous Relationship.” World Development 33 (3): 393–407.
Maloney, W. F., and M. Sarrias. 2017. “Convergence to the Managerial Frontier.” Journal of Economic Behavior & Organization 134: 284–306.
Maloney and Valencia 2022 “Engineering Growth” Journal of the European Economic Association.
Maloney, W. F., and A. Zambrano. 2021. “Learning to Learn: Experimentation, Entrepreneurial Capital, and Development.” Policy Research Working Paper 9890, World Bank, Washington, DC. https://openknowledge.worldbank.org/handle/10986/36782.
Mattoo, A., N. Rocha, and M. Ruta. 2020. Handbook of Deep Trade Agreements. Washington, DC: World Bank. McKinsey & Company. 2020. “Agriculture and Climate Change.” McKinsey & Company.
Melitz, M., and S. Redding. 2021. “Trade and Innovation.” NBER Working Paper 28945, National Bureau of Economic Research, Cambridge, MA.
Nicoletti, G., and S. Scarpetta. 2003. “Regulation, Productivity and Growth: OECD Evidence.” Economic Policy 18 (36): 9–72.
Orefice, G., and N. Rocha. 2012. “Deep Integration and Production Networks: An Empirical Analysis.” Staff Working Paper ERSD-2011-11, World Trade Organization, Geneva.
Osnago, A., N. Rocha, and M. Ruta. 2017. “Do Deep Trade Agreements Boost Vertical FDI?” World Bank Economic Review 30 (Suppl 1): S119–S125.
Portugal-Perez, A., J. Reyes, and J. Wilson. 2009. Beyond the Information Technology Agreement: Harmonization of Standards and Trade in Electronics. Washington, DC: World Bank.
Quintero, L., and M. Roberts. 2018. “Explaining Spatial Variations in Productivity: Evidence from Latin America and the Caribbean.” Policy Research Working Paper 8560, World Bank, Washington, DC.
Roberts, M. 2018. “The Many Dimensions of Urbanization and the Productivity of Cities in Latin America and the Caribbean.” In Raising the Bar for Productive Cities in Latin America and the Caribbean, edited by M. M. Ferreyra and M. Roberts, 49–86. Washington, DC: World Bank.
Rocha, N., and M. Ruta (eds.). 2022. Deep Trade Agreements: Anchoring Global Value Chains in Latin America and the Caribbean. Washington, DC: World Bank.
Rudolph, H. F. Miguel and J, Gonzalez-Uribe. 2023. Venture Capital in LAC, mimeo, World Bank.
Ruta, M. 2017. “Preferential Trade Agreements and Global Value Chains: Theory, Evidence, and Open Questions.” Policy Research Working Paper 8190, World Bank, Washington, DC.
Schiffbauer, M., J. Sampi, and J. Coronado. 2022. “Competition and Productivity: Evidence from Peruvian Municipalities.” Review of Economics and Statistics
Teravaninthorn, S., and G. Raballand. 2009. “Transport Prices and Costs in Africa: A Review of the International Corridors.” World Bank, Washington, DC.
United Nations. 2016. The World Cities Data Booklet. New York: United Nations.
88 cHAPT e R II | Reeng Ag I ng A cHA ng I ng w o R ld e conomy The promise of in T egraT ion
Winkler, D. 2019. “Productivity Spillovers from Services Firms in Low- and Middle-Income Countries: What Is the Role of Firm Characteristics and Services Liberalization?” In Leveraging Services for Development: Prospects and Policies, edited by M. Helble and B. Shepherd, chapter 7. Tokyo: Asian Development Bank Institute.
World Bank. 2012. “Global Investment Promotion Best Practices 2012.” World Bank, Washington, DC.
. 2019. Trade Integration as a Pathway to Development? LAC Semiannual Report. Washington, DC: World Bank.
. 2020a. The Cost of Staying Healthy. Semiannual Report of the Latin America and the Caribbean Region. Washington, DC: World Bank.
. 2020b. Global Investment Competitiveness Report 2019/2020: Rebuilding Investor Confidence in Times of Uncertainty. Washington, DC: World Bank.
. Forthcoming. Productivity through a Territorial Lens: Leveraging Spatial Development for Economic Growth in Latin America. Washington, DC: World Bank.
World Economic Forum. 2022. Global Investment Competitiveness Report 2021–22. Geneva: World Economic Forum.
Wright, G. 1999. “Can a Nation Learn? American Technology as a Network Phenomenon.” In Learning by Doing in Markets, Firms, and Countries, edited by N. R. Lamoreaux, D. M. G. Raff, and P. Temin, 295–332. University of Chicago Press.
cHAPT e R II | Reeng Ag I ng A cHA ng I ng w o R ld e conomy The promise of in T egraT ion 89

LATIN AMERICA AND THE CARIBBEAN ECONOMIC REVIEW | APRIL 2023