LearningModelsforForecastingHospitalResource
UtilizationforCOVID-19PatientsinCanada
JianfeiZhang 1,2 ,HariniSanjayPathak 1 ,AnneSnowdon 3,4 ,andRussellGreiner 1,2,*
1 DepartmentofComputingScience,UniversityofAlberta,Edmonton,Alberta,Canada
2 AlbertaMachineIntelligenceInstitute(Amii),Edmonton,Alberta,Canada
3 OdetteSchoolofBusiness,UniversityofWindsor,Windsor,Ontario,Canada
4 SupplyChainAdvancementNetworkinHealth(SCANHealth),Windsor,Ontario,Canada
* Correspondingauthoremail:rgreiner@ualberta.ca
ABSTRACT
COVID-19pandemichasoverwhelmedhealthsystemsandhospitalcapacityinCanada.Hospitalsarefacingacrisis-lev elshortage ofcriticalsupplies( e.g. ,hospitalandICUbeds)andequipment( e.g. ,ventilators).Thismotivatesourneedformodelsthatcan accuratelyforecastregionaldemandforhospitalresources.ThisworkaimstocreatepredictivemodelsthatcanuseC anada COVID-19dataandpandemic-relatedfactorstoaccuratelyforecast5quantities–threerelatedtohospitalresource utilization ( i.e. ,numberofhospitalbeds,ICUbeds,andventilatorsthatwillbeneededbyCOVID-19patients)andtwotothepandemic progress( i.e. ,numberofCOVID-19casesandCOVID-19deaths)–severalweeksinadvance.Wedevelopedamachinelearning methodthatcanuseinformation( i.e. ,resourceutilization,pandemicprogress,populationmobility,weathercondition,andpublic policy)currentlyknownaboutaregionsinceMarch2020,tolearn116temporalconvolutionalnetwork(TCN)modelseve ryweek; eachusedforforecastingtheweeklyaverageofoneofthese5quantitiesinCanada(respectively,insixspecificprovi nces)for eachofthenext4weeks– e.g. ,on20Nov2020,forecastingtheaveragenumberofICUbedsthatwillbeneededbyCOVID-19 patientsintheregionofOntariofortheweekendingon18Dec2020.Wecomparedourmethod,versusotherstandardmodel s, ontheCOVID-19dataandhospitalresourcedata,onthetasksofpredictingthese116values,everyweekfromOct2020to July 2021.Experimentalresultsshowthatour4640TCNmodels(eachforecastingaregionaltargetforaspecificfuturetime ,ona specificdate)canproduceaccurateforecastsofdemandforeveryhospitalresource( i.e. ,hospitalbeds,ICUbeds,andventilators) andpandemicprogress( i.e. ,numberofCOVID-19casesandCOVID-19deaths)foreachweekfrom2Oct2020to2July2021. Comparedtootherstate-of-the-artpredictivemodels,ourTCNmodelsyieldthelowestmeanabsolutepercentageerro r(MAPE). WedevelopedandvalidatedanaccurateCOVID-19forecastingmethodbasedontheTCNmodelsthatcaneffectivelyforeca st thehospitalresourceutilizationandpandemicprogressforCanadaandforeachofsixprovinces.
1Introduction
Background Asof15Oct2021,theCOVID-19hasinfectedmorethan1.6millionandkilledmoreth an28Kpeoplein Canada 1 .Therapidincreasesinpatientvolumesduringwavesofthispandemicoverwhelmedhea lthsystemsandhospital capacityinmanyregions( e.g. ,Ontario).Healthsystemleadersanddecisionmakerswereunabletoanticipateorpr edictthe surgeincasesduringthepandemic,norweretheyabletoaccuratelypreparefort hecriticalsupplies( e.g. ,hospitalandICU beds)andequipment( e.g. ,ventilators)necessarytocareforpatientsinfectedwiththevirus.Ther eisnowanurgencyfor creatingpredictivetoolstoaccuratelypredicttheriskforsurgeindemand forhealthservicestoinformleadershipdecisions thatenablehealthorganizationstoadvancepreparednesseffortstoenablethede liveryofqualitycare,inatimelymanner–e.g. ,toadequatelypreparehospitalbedstomeetpatientcaredemandsproac tively( e.g. ,fourweeksinadvance).Hence,many previousprojectshaveattemptedtoforecastregionaldemandforcri ticalcareresources 2 – e.g. ,personalprotectiveequipment (PPE) 3 andhospitalbeds 4 inOntario.However,thereremainsignificantgapsinresearchonthehospitalca pacitytoeffectivelyrespondtosuddensurgeindemandforpatientcareduringthepandemic.
Tasks Inthiswork,wemakemultipletarget-region-horizon-specificforecastsinvolvin gthefollowing5targets,7regions, and4timehorizons(summarizedinTable1):
•Fiveforecasting targets :forecastingthenumberofhospitalbeds,ICUbeds,andventilatorsr equiredtoaccommodate COVID-19patients,inadditiontothenumberofCOVID-19casesandCOVID-19deathsthatishighl yrelevanttothe surgeindemandforhospitalresources.
•Sevenforecasting regions :duetotheunevenspreadofthediseaseacrosstheCanadianprovinces,itisu sefultoaccurately forecasthospitalresourceutilizationnotonlyforallofCanada,buta lsoforeachprovinceindividually–here,weforecast
Table1. The5targets,7regions,and4horizonsofourforecastinginterest.
Target Hospitalbeds
ICUbeds Ventilators
Cases
Deaths
Region(Abbreviation)
Canada(CA)
Alberta(AB)
BritishColumbia(BC)
Manitoba(MB)
Ontario(ON)
Québec(QC)
Saskatchewan(SK)
Horizon(daysinthefuture)
1-week(day1–day7)
2-week(day8–day14)
3-week(day15–day21)
4-week(day22–day28)
eachtargetforCanadaandforthesixmajorprovinces:Alberta(AB),British Columbia(BC),Manitoba(MB),Ontario (ON),Québec(QC),andSaskatchewan(SK).
•Fourforecasting horizons :forecastingeachregionaltargetforeachofthenext4weeks( i.e. ,1-,2-,3-,4-week,respectively) becauseforecastingoverthesetimehorizonsisneededforadjusting hospitalcapacityinadvance.
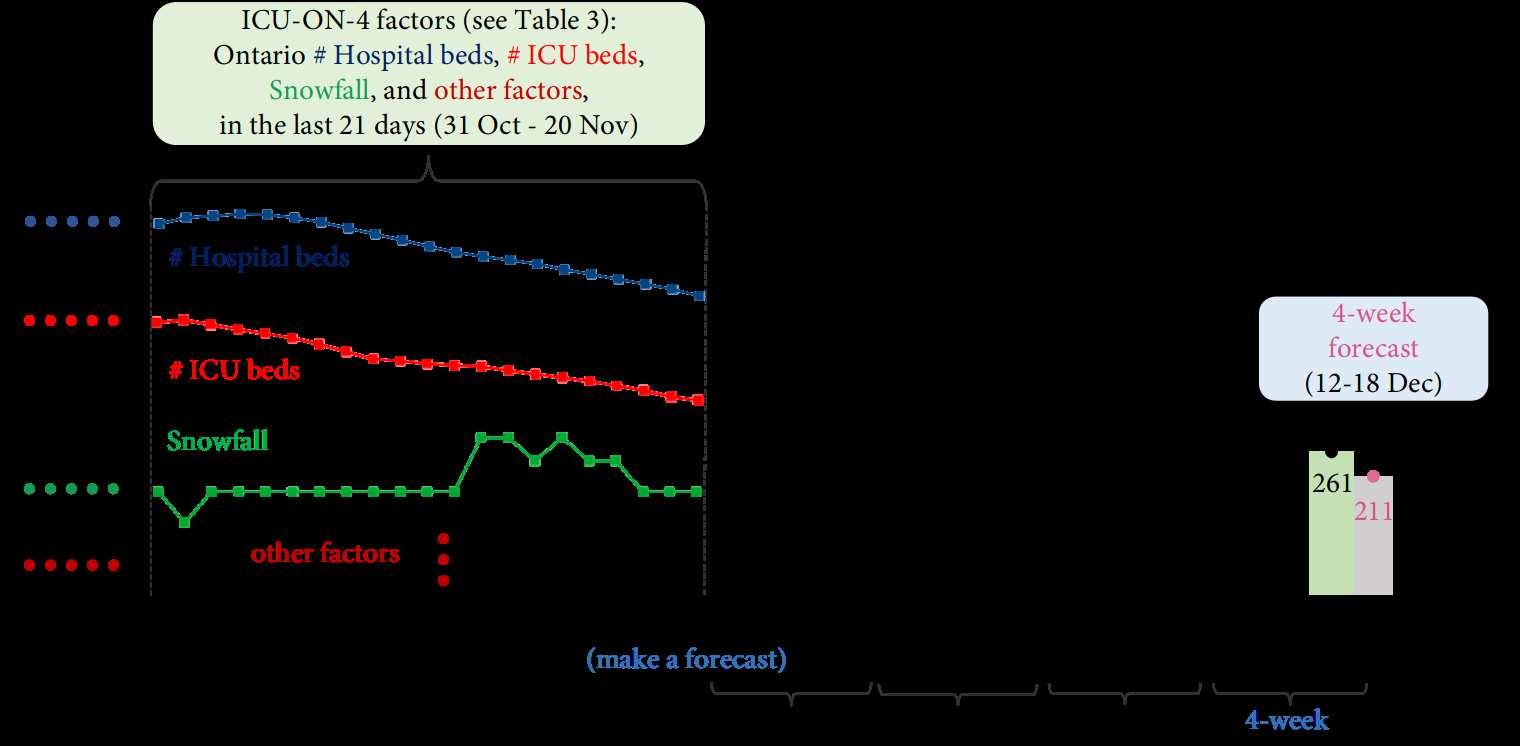
Foreachtarget,wefocusontheweeklyaverageandthereforedefineeachfo recastingtaskaspredictingthe7-dayaveragedata, where7-dayaveragemeanstheaveragedailynumberovera7-dayperiod, e.g. ,the7-dayaveragenumberofnewcasesfor7 Janistheaverageofthenumberofdailynewcasesfor1Janthrough7Ja n.Consequently,the1-,2-,3-,4-weekforecastsare weeklyaveragefor1-week( i.e. ,day1[“ tomorrow ”]–day7),2-week( i.e. ,day8–day14),3-week( i.e. ,day15–day21),and 4-week( i.e. ,day22–day28),respectively–alwaysmadeonaFriday( N.b. :TheforecastingmodelsaretrainedonFridays; seesubsection2.3).Hence,eachtarget-region-horizon-specificforecastmeansthe forecastofthe target ina region fora specific horizon .Figure1showsanexampleof ICU-ON-4 forecast– i.e. ,theforecastoftheweeklyaveragenumberof ICU beds( target )neededin Ontario ( region )for 4 -week( horizon ):the ICU-ON-4 (20Nov2020)modelbuiltonFriday20Nov 2020predictsthatOntariomayneed211ICUbedsfortheweekof12-18Dec( i.e. ,the7-dayaveragenumberfor18Decis 211.),whichis4weekslater.Figure1showsthatthispredictionisclose:onaverage,261 ICUbedswereactuallyoccupied inOntariobyCOVID-19patientsforthatweek.Thelearnedmodelmadethisforecas tbasedonthetask-specificdata–the numberofhospitalbedsandICUbeds,snowfall,andthevalueofotherfacto rsoverthe21daysof20Nov2020( i.e. ,31Oct20Nov).(Table3presentstheactual24factorsusedforthisforecast,whicha rediscussedlater.)Besidesthis4-weekforecast numberofICUbedsinOntario,wealsousedotherlearnedmodelstomakeI CU-ON-1,-2,-3forecastson20Nov2020.(See discussionbelowaroundFigure2.)Infact,wehave116taskson20Nov2020for5targets, 7regions,and4horizons– e.g. , Hospital-MB-1,Ventilators-CA-2,Deaths-QC-3.Here,foreachforecastinghorizon, wehave29tasks( i.e. ,6provinces × 4 tasks/province+5Canadaforecastingtasks)everyweek,wheretheprovinci alnumberofventilatorsisnotavailable.
Methodology Forecastingtheresourceutilization(aswellaspandemicprogress)isespecial lychallengingasthespreadof thediseasehasbeenhighlyvariableoverbothtimeandregion.Hence,onawe eklybasis,weusedifferentmodels,eachwith itsspecificindividualinputfactors,toforecasteachregionaltargetforeac htimehorizon– e.g. ,themodelanditsinput(which includesthenumberofcasesandhospitalbedsinAlberta)usedfortheHosp ital-AB-1forecastisdifferentfromtheICU-ON4modelanditsinput( i.e. ,thenumberofhospitalandICUbeds,snowfall,etc.,inOntario);seeFigure1.
• Data :Overall,webuildaspecificmodelforeachforecastbasedontask-specificfact ors,whichareaspecificsubsetofthe following27factors:
– the3resourceutilizationfactors,includingthenumberofhospitalbeds,ICUbed s,andventilatorsoccupiedbyCOVID19patientsinaregion, n.b. :theprovincialnumberofventilatorsisnotavailable,
– the2pandemicprogressfactors(theregionalnumberofCOVID-19casesandCOVID-19death s),
– otherfactors(seeTable3)foreachregion,including5populationmobilityfac tors,5weatherconditionfactors,and12 publicpolicyfactors.
• TCNModels :Webuilt temporalneuralnetwork (TCN) 5 modelsforthefollowingreasons:
– AsshowninFigure1,theinputdataisasetoftimeseries,suchasthenumberofI CUbedsanddeaths,thesnowfall,and others.Consequently,wecanvieweachofourforecastingtasksasamul tivariatetime-seriesforecastproblem 6 –utilizing multiplefactors( i.e. ,multipletimeseries)topredictasinglefuturetargetvalue.Ofcourse,weneed tolearnthesemodels –herefromthesametypeofdata;seeTable3.Asadeeplearningmodel,TCNh asbeenproventoperformeffectivelyin
2/12
Figure1. Anexampleoftarget-region-horizon-specificforecast:forecastingtheweeklya veragenumberofICUbeds( target ) neededinOntario( region )for4-week( horizon ).
manymultivariatetime-seriesmodelingandforecastingtasks, e.g. ,stockprediction 7 ,energyforecasting 8 ,andtrafficflow forecasting 9 .
– TCNmodelsbenefitfromtheirspecialneuralnetworkarchitecture(whichissho wninSupplementalFigureS1),which allowsthissystemtoeasilylookfarbackthepastvaluesandexplorepredictivep atternsfromthetimeseries.Bai etal . 5 proveempiricallythatTCNsworkbetterthanmanystate-of-the-arttempora lneuralnetworkmodels( e.g. ,theLSTM model 10 )intime-seriesforecast.
• OtherModels :TounderstandtheeffectivenessandreliabilityoftheTCNmodels,wecomp areerrors(definedbelow) yieldedbyTCNmodels,totheerrorsbythefourwidelyusedpredictivemodel s:
– The“susceptibleexposedinfectiousremoved”(SEIR)compartmentalmodel,whichi sanepidemiologicalmodelthatis oftenusedtodescribethespreadofadisease 11–13
– The“autoregressiveintegratedmovingaverage”(ARIMA)model,whichcancapturea suiteofdifferentstandardtemporalstructuresinCOVID-19timeseriesdata 14
– The“extremegradientboosting”(XGBoost)method,whichcaneffectivelyidentifypatt ernsintemporaldataandoften providesfairlyaccurateCOVID-19predictions 4
– The“longshort-termmemory”(LSTM)neuralnetwork,whichisanobviouscandidatefo ranalyzingCOVID-19time seriesduetoitsnotablesuccessinsequencemodelingproblems 10
Experiments Webuilt116TCNmodelseveryweekbasedontheweeklydatatoforecas tthe5targets(theweeklyaverage numberofhospitalbeds,ICUbeds,ventilators,cases,anddeaths)ineachof the7regions(Canadaandsixprovinces)for eachofthe4forecastinghorizons( i.e. ,1-,2-,3-,4-weekthereafter).Hence,forthe40weeksbetween2Oct2020and2 July2021,weconducttotal4640(40weeks × 116tasks/week)experiments(seethepreviousdiscussionaroundTasks).The experimentalresultsbelowdemonstratethattheTCNmodelscanproducemore accurateforecastsforeachtask, i.e. ,with lower MeanAbsolutePercentageError (seeMAPEdefinedbybelowEquation1),incomparisonwiththecompetingmodels.
2Methodology
2.1DataCollection
Duringtheperiodbetween2Oct2020and2July2021,wecollectknowndata(since21Ma rch2020)aboutthedailystatistics onthe27factors(presentedinTable2),including3resourceutilizationfactors,2pa ndemicprogressfactors,5population
3/12
Table2. The27factorsintermsofresourceutilization,pandemicprogress,populationmobili ty,weathercondition,and publicpolicy.Thenumericvalueforeachfactor,foreachtimeandeachregion,ist heaverageofthe7dailyvalues,associated withthe7thday.
mobilityfactors,5weatherconditionfactors,and12publicpolicyfactors.Theres ourceutilizationandpandemicprogress areourtargetsandthereforetheirhistoricaldataarecollectedforfor ecastingtheirfuturevalues.Forexample,weforecast the future numberofdeathsbasedonthe currentlyknown numberofdeaths,aswellasotherfactors.Wealsocollectthose otherfactors–themobility,weather,andpolicyfactors–astheyhave effectsontheaveragecontactratesandthereforeonthe resourceutilizationandpandemicprogress.
• Resourceutilization :ThedailynumberofhospitalbedsandICUbedsoccupiedbyCOVID-19patientsin Canadaandin eachprovinceareprovidedbythegeographicinformationsystemArcGIS 15 .ThedailynumberofventilatorsisonlyavailableforCanadaandreleasedbythePublicHealthAgencyofCanada 1
• Pandemicprogress :ThedailynumberofnewCOVID-19cases,andnewCOVID-19deaths,inCanadaandineach province, isprovidedbyArcGIS 15 .
• Populationmobility :Themobilitydata,availablefromthecommunitymobilityreports 16 ,provideinsightsintothedaily communitymovementtrendsovertimebygeography,acrossdifferentcategoriesofplaces, suchasretailandrecreation, groceriesandpharmacies,parks,transitstations,andresidential.
• Weathercondition :TheweatherdatafromNOAA 17 includedailymeteorologicalinformationaboutCanadaandprovinces: averagetemperature,rainfall,relativehumidity,dewpoint,andsnowfall.(Note theonlyfieldwithmissingvaluesisfor snowfall;wefillinthemissingvaluesvia �� -nearest-neighborimputation 18 ,where �� =3.)
• Publicpolicy :ThepolicydataprovidedbytheUniversityofOxford 19 aremeasuresofgovernmentdailyresponsesto COVID-19,whicharerecordedonordinalorcontinuousscalesfor12policyareas;see Table2.
Category Total#offactors Factors Hospitalbeds ICUbeds Resourceutilization 3 Ventilators Cases Pandemicprogress 2 Deaths Retailandrecreation Groceriesandpharmacies Parks Transitstations Populationmobility 5 Residential Averagetemperature Rainfall Relativehumidity Dewpoint Weathercondition 5 Snowfall Schoolclosing Workplaceclosing Cancelpublicevents Restrictionsongatherings Publictransportclosing Stayathome Restrictionsoninternalmovement Internationaltravel Publicinformationcampaigns Testingpolicy Contacttracing Publicpolicy 12 Facialcoverings
4/12
Eachfactorhasanumericvalueeachdayfrom21March2020tothecurrentdate(th etimewhenwemaketheforecast–e.g. ,20NovinFigure2).Eachforecastismadebasedonthepastvaluesofthetask-s pecificfactors(whichwillbediscussed insubsubsection2.2.2,Table3,andTable4).
2.2ForecastingTask
2.2.1Outputs
Everyweek,welearned116differentforecastingmodels.Figure2(whichextendsFigure1)p resentstheICU-ON-1,-2,-3,-4 forecastsmadebythefourmodelsbasedonthedataknownon20Nov2020.Eac hofthesefourdifferentmodelsusesthe knownvaluesofitsownfactors(showninTable3)andspecificpastvalues(shown inTable4)toforecastthenumberofICU bedsthatwillbeneededinOntario,whichispredictedtobe170for1-week(21 –27Nov),234for2-week(28Nov–4Dec), 280for3-week(5–11Dec),and230for4-week(12–18Dec).ThetruenumberofICUbedsfo rthese4weeksis151,207, 235,and261,respectively.
• MAPE: Foreachtask,weperformtheweeklyforecasts(oneveryFriday)forth e40weeksfrom2Oct2020to2July2021. Then,wecomputethemeanabsolutepercenterror(MAPE) 20 ofthe40forecastsforeachtask.(NotesmallerMAPEvalues arebetter.)Letting �� �� and �� �� �� ( �� indicatestheforecastinghorizon–here, ��∈{1,2,3,4} for1-,2-,3-,4-week)berespectively thetrueandtheforecasttarget( e.g. ,numberofICUbeds)forthe �� th ( ��∈{1,…,40} )week,thentheMAPEofthe40 �� -week forecasts(eachpredicted �� week(s)inadvance)is
• Example: Figure3showssixICU-ON-4forecastsmadefrom20Nov(whichistheexampleshowninFigure1) to18Dec 2020.Everyforecastforatimepointismade4weeksbeforethattime.TheMAPEo fthesesix4-weekforecastsis
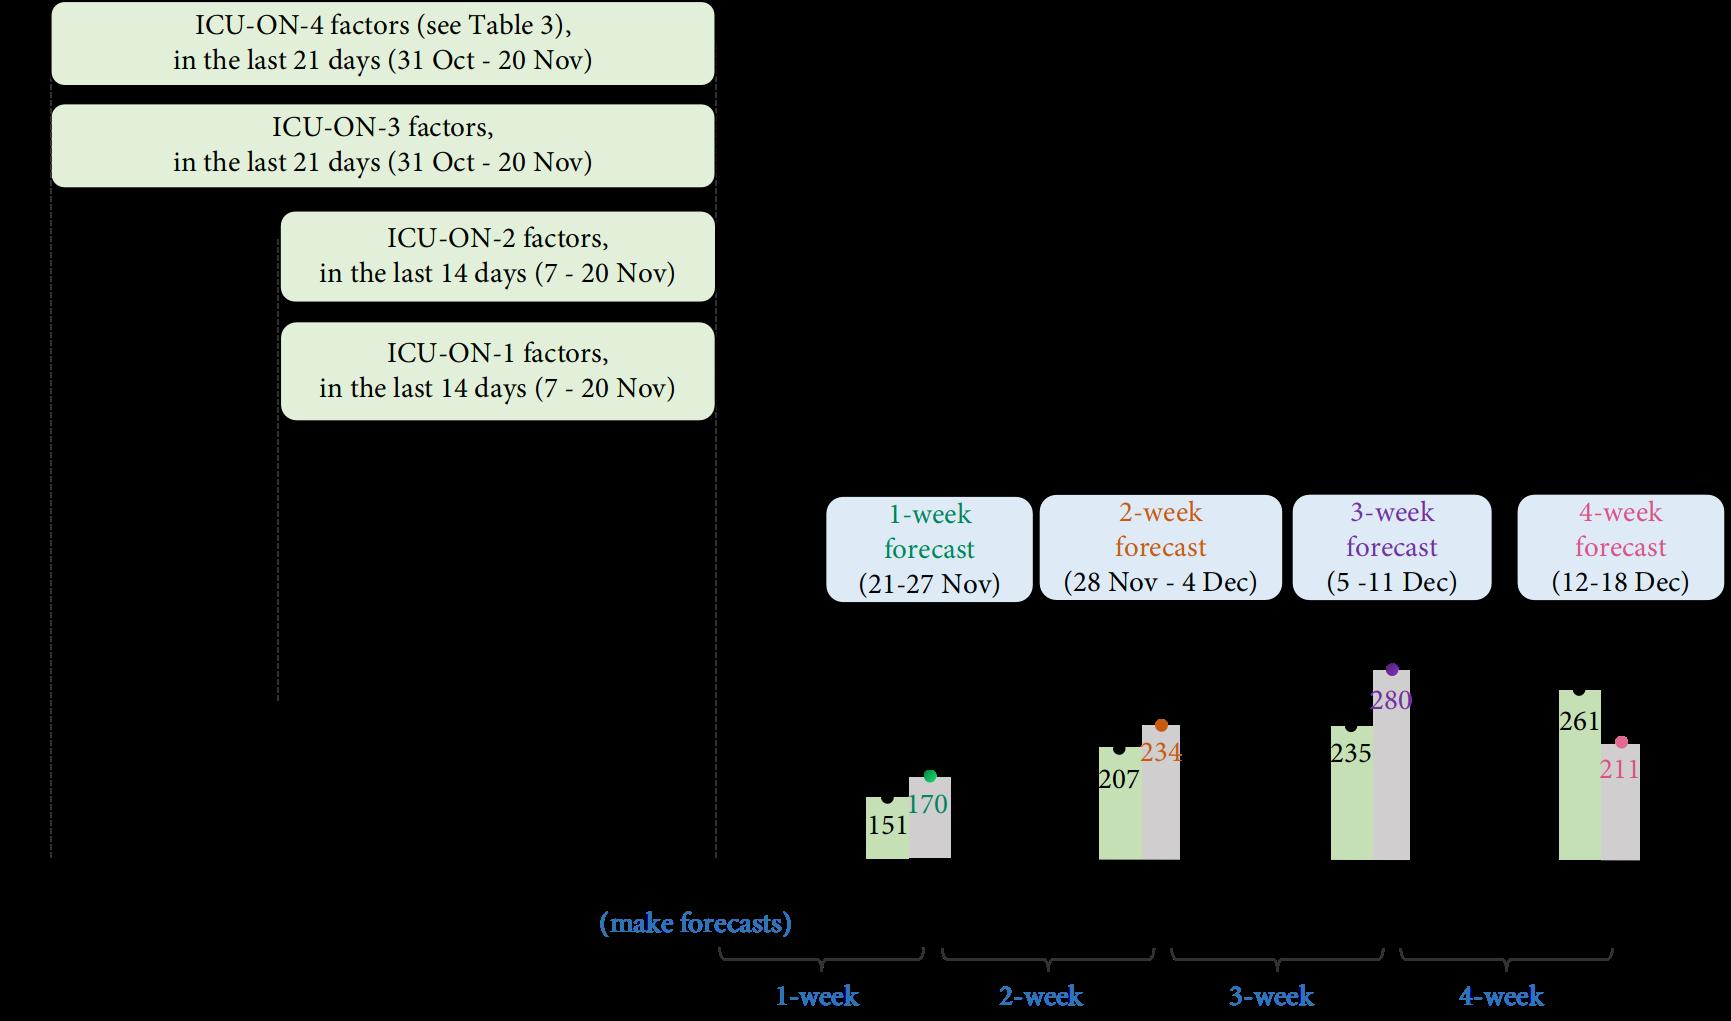 Figure2. ICU-ON-1,ICU-ON-2,ICU-ON-3,ICU-ON-4forecastsmadeon20Nov2020.
MAPE ( 40target-region-horizon-specificforecasts )= MAPE ( ( �� �� 1 ,�� 1 ) ,…, ( �� �� 40 ,�� 40 ) ) = 1 40 40 ∑ ��=1 | | | �� �� �� −�� �� �� �� | | | ×100. (1)
MAPE ( 6ICU-ON-4forecasts )= MAPE ( ( �� 4 1 ,�� 4 1 ) ,…, ( �� 4 6 ,�� 4 6 ) ) = MAPE ( (211,261),…,(405,383) ) = 1 6 ( |211−261| 261 +⋯+ |405−383| 383 ) =7.9%. 5/12
2.2.2Inputs
Eachofthe116differentforecastingmodelsusesasinputadifferentsetoffactors – i.e. ,specificfactorsandtheirspecificpast values.(WepresenttheperformanceofTCNmodelsusingvarioussetsoffactorsand differentpastvaluesinSupplemental FigureS2.)
ForecastingTask
FactorsusedforForecastingTask
Task-specificfactors: Foreverytarget,wedecidetoincludethattargetfactor( e.g. ,weusethe currentlyknown numberof deathsinthecurrentweek,whenestimatingthe future numberofdeaths)andsomeotherfactors(showninTable3),rather thanallthefactors(showninTable2)foreveryforecastingtask.Wes electthese task-specific factorsbasedonourpriorknowledgeandcausalassumptionaboutthesefactors:
•Weassumethechangeinmobility,weather,andpolicywillaffect future ( i.e. ,1weeklater)pandemicprogressandhospital resourcedemand– e.g. ,adjustingthepolicy internationaltravelrestrictions maynotalterthetrendofresourceutilization until1weeklater.Hence,weusethesefactorsforall2-,3-,4-weekforecasts(s ee†inTable3,thedeathforecastexcluded), ratherthanfor1-weekforecast.
•Foreachtimeseries,weassumethattheprecedingandfuturevaluesarehighly correlated.Hence,toforecastthefuture targetvalues( e.g. ,numberofICUbeds),weusecurrentlyknowntargetvalues( e.g. ,currentlyknownnumberofICUbeds), see✓inTable3.
•Weassumethefivetargetfactorsarecausallyrelated.
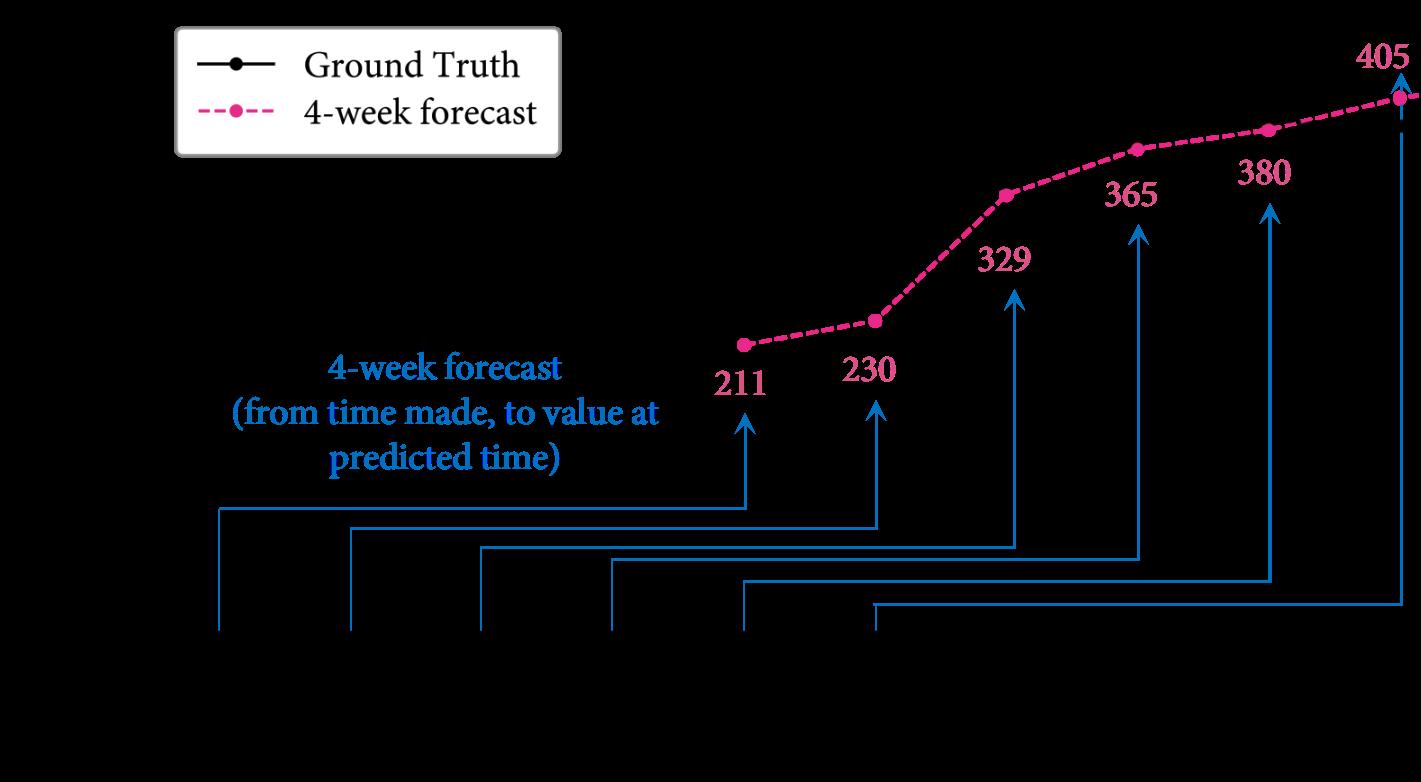 Figure3. ThetrueandICU-ON-4forecastnumberofICUbedsbetween18Dec2020and22Jan2021.
Table3. Thefactorsusedforvarioustarget-region-horizon-specificforecastingtasks.
Figure3. ThetrueandICU-ON-4forecastnumberofICUbedsbetween18Dec2020and22Jan2021.
Table3. Thefactorsusedforvarioustarget-region-horizon-specificforecastingtasks.
Target Region Horizon Resource Pandemic Mobility Weather Policy (#of) (7regions) (week) Hosp. ICU Vent. Cases Deaths 5factors 5factors 12factors 1 ✓ ∨ Hosp. foreach 2,3,4 ✓ ∨ † † † 1 ‡ ✓ • ICU foreach 2,3,4 ‡ ✓ † † † 1 ‡ ✓ • Vent. foreach 2,3,4 ‡ ✓ † † † 1 ✓ Cases foreach 2,3,4 ✓ † † † 1,2 ★ ✓ Deaths foreach 3,4 ⊙ ✓
6/12
Theprojecteddemandofhospitalbedsfor1-,2-,3-,4-weekisalwaysdependentoncurren tnumberofcasesbecausea largenumberofcasesmaycausemorehospitalizationsinnext1-,2-,3-,4-week,respect ively(see ∨ inTable3).
– TheprojecteddemandofICUbedsandventilatorsfor1-,2-,3-,4-weekreliesonthe currenthospitalizations(see‡),where the1-weekdemandisalsoaffectedbythenumberofdeaths(see•inTable3), astheICUbedsandventilatorswouldbe availablesoonafterthedeathofpatientsinICUoronventilators.
– ConsideringICUpatientsareusuallyathighriskofdeath,weassumethedeath occurswithin2weeksafterenteringICU. Therefore,weusethenumberofoccupiedICUbedsforforecastingnumbero fdeathsin1or2weeks(see ★ inTable3), butinsteadusethenumberofcasesfor3-weekand4-weekforecasts(see ⊙ inTable3),asweassumethatafewofthe patientswhowereinfected,willdie3or4weekslater.
Task-specificvalues: GivenalearnedTCNmodel,itusesthevaluesofallthe task-specific factorsinthepastfewdaysto makeaforecast( i.e. ,foreachofthe5targetsandforeachofthe7regions),asshowninTable4 :
•Tomakea1-weekforecastforeachregionaltarget,thelearned1-weekT CNmodelusesthevaluesinthepast14daysofthe predictiontime– e.g. ,tomaketheICU-ON-1forecastshowninFigure2,thetrainedICU-ON-1(20Nov)modelus esthe valuesoftheICU-ON-1-specificfactorsinthepast14days(7-20Nov).Similarly,thelear ned2-weekTCNmodelalsouses thevaluesofthetask-specificfactorsinthepast14days,for2-weekforecast.
•Tomakea3-weekforecastforeachregionaltarget,thelearned3-weekT CNmodelusesthevaluesinthepast21daysofthe predictiontime– e.g. ,tomaketheICU-ON-3forecastshowninFigure2,thetrainedICU-ON-3(20Nov)modelus esthe valuesoftheICU-ON-3-specificfactorsinthepast21days(31Oct-20Nov).Similarly,the learned4-weekTCNmodel alsousesthepast21-dayvaluesofthetask-specificfactors,for4-weekforec ast.
Inthelearningprocess,theTCNmodelexploresthepredictivepatterns– i.e. ,therelationshipbetweenthepastfactorvalues( i.e. ,thefactorvaluesinthepast2or3weeks)andfuturetargetvalues( i.e. ,thetargetvaluesinthenext1,2,3,and4 weeks).(NoteBai etal. 5 demonstratedthatusingadditionalpastfactorvalues– e.g. ,thevaluesinpast10weeks–increases thecomputationcostbutdoesnotfurtherimprovethemodel’spredictivea bilityinatimeseriesforecastingtask.)
Table4. Thevaluesoftask-specificfactorsusedasinputfordifferentforecastingtasks.
2.3Training
Ateachpredictiontime( i.e. ,everyFriday),weneedtotrain116TCNmodels,eachforatarget-region-horizon-specific forecastingtask.AsTCNisasupervisedmodel,itcannotdirectlylearnfro mtime-seriesdata–whichmeanswemustfirsttransformthegiventimeseriesintosuperviseddata– i.e. ,asetof( input,output )pairsthattheTCN-learner( i.e. ,trainingalgorithm)canusetoproduceamodel.Afterwards,giventheinput– i.e. ,thevaluesoftherelevantfactorsspecifiedinTable3 andTable4–thismodelforecaststheoutput.
Anexampleof( input , output )pair TotraintheICU-ON-4(20Nov2020)modelshowninFigure1,weusethe( input,output ) pairsasofFriday20Nov2020astraininginstances;foreach( input,output )pair,thetimelagbetween input and output is 4weeks.Here,thelasttraining output isthenumberofICUbedsfor20Nov2020(whichis128)andthecorresponding training input isalinearizedversionofthematrix(showninEquation2)composedof24factor s( i.e. ,thenumberofhospital bedsandICUbeds,snowfall,facialcoverings,etc.)foreachofthe21daysfrom3O ctto23Oct2020–hence,the input isa 504=24×21 elementvector( i.e. ,24factors × 21values/factor).
–
Target Region Horizon (week) #ofpastvaluesofthetask-specificfactors 1,2 valuesinthepast14days foreach foreach 3,4 valuesinthepast21days
⎛ ⎜ ⎜ ⎜ ⎝ ⎞ ⎟ ⎟ ⎟ ⎠ #Hospitalbeds 145153⋯263265 #ICUbeds 3436⋯7173 Snowfall 10.1610.16⋯28.4516.93 ⋮⋮⋮⋯⋮⋮ Facialcoverings 1.01.0⋯1.01.0 3Oct4Oct 22Oct23Oct (2) 7/12
This ( input , output )=([145,153,…,265,34,36,…,73,10.16,…,16.93,…,1.0,…,1.0],128) pairisasinglelabeledtraininginstance; otherICU-ON-4labeledtraininginstancescorrespondtootherdates– e.g. ,thereisanotherpairwhoseinputisa504-tuple andoutputis123,forOntarioICUbedsfor19Nov,andsoforth,for196dat es( i.e. ,everydayfrom8May2020through 20Nov2020).( N.b. :WhileweonlymakeforecastsforFriday,ourtrainingdatacorrespondst oforecastsmadeonalldaysof theweek)Together,thesepairsformthetrainingsetusedfortrainingtheICU-ON-4(20 Nov)model.WethenlearnaTCN modelfromthistrainingdata(whichinvolves196instancepairs,wheretheinputo feachpairis 504 -dimensional).Notethis specificlearnedTCNmodelwillonlymaketheICU-ON-4forecastfor18Dec,gi ventheinput–theelementvectorinterms ofthesametask-specificfactorsfor21daysfrom31Octto20Nov2020(seeFigure1).( N.b. :thisICU-ON-4(20Nov)model differsfromtheotherICU-ON-4modelsbuilttomakepredictionsfordifferenttimes– e.g. ,itisdifferentfromICU-ON-4(27 Nov),etc.)Here,weuseaslidingwindowmethod 21 – e.g. ,forICU-ON-4forecast,weusea21-dayinputwindowanda1dayoutputwindow(whichis4weeksapartfromtheinputwindow)tosliceeacht imeseries:thetwowindowsmoveforward simultaneouslyovertheICU-ON-4factorsandgeneratethe( input,output )pairs.
TrainingandValidation Aftertheabovedatatransformation,wedividetheknowndata( i.e. ,traininginstances)intoatrainingsetandadisjointvalidationset,whichareusedtolearnandoptimizeaTCNmode l.Welearnamodelonthetraining set, i.e. ,usingthe( input,output )pairstoestimatethemodelparameters( i.e. ,theweightsofaneuralnetwork;seethediscussionaroundSupplementalFigureS1).Ingeneral,thislearningprocessinvolvesasetofh yperparameters,suchasthenetwork depthandkernelsize(whichwillbediscussedlater).Weseekthehyperparameter sthatproducethemostaccuratemodelthat canmakeaccurateforecastsforthevalidationset.Thevalidationmimicstheout-of-sam pleforecastingscenarioandreduces thechangethattheoptimizedmodelwilloverfit 22 whenitmakesaforecastgiventhenewinput.Motivatedbyourrecently developedCOVID-19forecastmethod–LaPoFaPo 23 –weusethe“mostrecent”10%ofthetraininginstancesasvalidation data– e.g. ,intheexampleshowninFigure1,ofthedataknownasof20Nov2020,weusethe( input,output )pairswhose outputscorrespondtothedatesbefore23Oct2020astrainingdataandthepa irswhoseoutputscorrespondtothe28days between23Octand20Nov2020asthevalidationdata.
25 EachTCNmodelistrainedfor500epochsbyusingtheAdamoptimizer 26 .WeemploytheBayesianoptimizer 27 tochoosea valuefrom{2,3,4,5,6,7}forkernelsize( i.e. ,howmanydifferentkernelweightsusedintheTCN,seeSupplementalFigure S1formoredetails),avaluefrom{2,4,8,16}fordilationrate( i.e. , �� inSupplementalFigureS1),andadropoutrateinthe range[0.01,0.1],sothattheTCNmodelcanleadtothelowestlossonthevalidationdat a.Here,thedropoutimplementsa regularizationthatcanimprovethemodelperformance(seetheresultssh owninSupplementalFigureS2c).
OtherModelsandTheirSettings Additionally,wetrainSEIR 13 ,ARIMA 14 ,XGBoost 4 ,andLSTM 10 modelseveryweekto forecastresourceutilizationinCanada.ForSEIR,wesettheaverageincubatio nperiodandaverageinfectionperiodas5days and10days,respectively.Wesetthenumberofautoregressiveterms,nons easonaldifferences,andlaggedforecasterrorsfor ARIMAas4,0,and1,respectively.ForXGBoost,wesetmaximumdepthto2,learningratet o0.2,treeestimatorsto150, observationfractionandcolumnfractionto0.9.WetraintheLSTMmodelwithtwohiddenla yers,eachincluding20fullyconnectedneurons,for500epochsviatheAdamoptimizer 26 witha0.1learningrate.TomatchourTCNsystem,thesefour competitorsusedthetask-specificfactors(showninTable3)fortrainingandf orecasting.LSTMusesthepastvaluesshown inTable4.
3Results
TCN’sforecasts Figure4showstheforecastnumbers(dottedlines)ofhospitalbeds,ICUbeds,an dventilatorsutilizedby COVID-19patients(aswellascasesanddeaths)duringtheperiodbetween2Oct2020an d2July2021,incomparisonwith theirtruenumbers(solidlines).WeseethatTCNcanaccuratelyforecastresourceut ilizationinadvance:foranytargetin anyregion,theforecastsareclosetothetruevalues,throughouttheforec astingperiod.Asexpected,weseethatforecasting furtherinthefuture( e.g. ,4-week)ismorechallengingthanforecastingthenearfuture( e.g. ,1-week).Wealsopresentthe forecastsforsixprovincesinSupplementalFiguresS3-S8.
MAPE Table5presentstheMAPEsoftheforecastnumberofhospitalbeds,ICUbed s,ventilators,cases,anddeaths(respectivelycalled‘Hosp.’,‘ICU’,‘Vent.’,‘Cases’,‘Deaths’)inCa nadaandineachofthesixprovinces.(Notethatwecouldnot forecasttheprovincialnumberofventilators.)ThelowMAPEsindicatethat TCNcaneffectivelyofferhealthprovidersaccurateforecastsofresourceutilizationandthereforeallowthemtoprecise lypreparetheneededhospitalresourcesinadvance. ComparisonbetweenTCNandothermodels InFigure5,wecomparetheMAPEsyieldedbyourTCNmodelsandthefour competitors(LSTM,SEIR,XGBoost,andARIMA).Ourmodelsconsistentlyoutperformal lthesecompetitorsforallforecastingtasks.Inparticular,comparedtoLSTM,TCNachievesanaverageof10%MAPEdecre ase(acrossthefourhorizons)for
SettingsforTCNLearning WeimplementtheTCNinTensorFlow
,witha0.01learningrateandthesigmoidactivation
24
8/12
Figure4. TCN’s1-,2-,3-,4-weekforecastsoftheweeklyaveragenumberofhospitalbeds,ICU beds,ventilators,cases,and deathsin Canada between2Oct2020and2July2021. 9/12
Table5. MAPEs(%)ofTCN’s1-,2-,3-,4-weekforecastsfor Canada (CA)and sixprovinces (AB,BC,MB,ON,QC,SK) between2Oct2020and2July2021.
forecastingthenumberofhospitalbeds,4%decreaseforICUbeds,and5%de creaseforventilators.Thesecomparisonsreveal theeffectivenessofourTCNmodels.
MoreresultsyieldedbyTCN’svariants WealsoexploreothervariantsoftheTCNlearningalgorithmwithdifferentsettin gs –differentmodelinputs(whichwerediscussedinsubsubsection2.2.2)– e.g. ,usingallfactors(ratherthanthetask-specific factorsshowninTable3)anddifferentnumberofearlierweeksforeachfactor(noto nlythevaluesinthepast14or21days, asshowninTable4)–anddifferentmodelhyperparameters– e.g. ,changingthedropoutrate.Theresultsoftheseempirical studies(showninSupplementalFigureS2)forCanadaduringtheperiodbetween2Oct2020a nd2Jul2021demonstratethat oursettingsforTCNmodelsareeffective.
4Conclusions
ThispaperprovidedaTCN-basedpredictivemethodtoforecastthehealth systemcapacityrequiredtorespondtosurgein demand,includinghospitalbeds,ICUbeds,andventilators,whicharerequire dtoeffectivelyrespondtothepandemic.The modelingoutcomesreflectthecomplexinterplayofcriticalfactorsthatcanoff erdecisionsmakersapredictiveandproactive toolthatconsidersdataandinformationaboutregionalmobility,weath er,andpolicy.WehaveprovidedamethodforeffectivelylearningtheseTCNmodelsforvarioustarget-region,andhorizon-spe cificforecasts,includingtheweeklyaverage numberofhospitalbeds,ICUbeds,ventilators,cases,anddeathsinCanada andsixprovinces(AB,BC,MB,ON,QC,SK) forup-to-fourweeksinthefuture.Thenumerousexperimentsdemonstratedthatourm ethodismoreaccurate(interms ofMAPE)thanfourstate-of-the-artpredictivemodels.Wealsodemonstratedth atourmethodcanaccuratelyforecastthe weeklyaveragenumberofcasesanddeathsinthefuture.
Target Hosp. ICU Vent. Cases Deaths Hosp. ICU Vent. Cases Deaths Horizon 1-week 2-week CA 6.08.386.5510.2117.72 14.2313.7513.2919.3822.51 AB 8.5316.39–15.6745.55 18.8122.14–29.6146.08 BC 8.2713.33–12.5040.61 16.8121.65–26.5134.00 MB 14.6823.33–19.0739.15 24.8828.66–34.3148.73 ON 29.359.45–12.3032.77 19.0516.93–20.5528.60 QC 8.9213.89–14.2221.81 18.0918.80–22.4327.79 Region SK 14.8927.57–18.9038.14 26.5630.00–23.8239.21 Horizon 3-week 4-week CA 22.5520.0727.4829.9834.67 32.4227.2633.2637.7256.53 AB 24.6834.79–42.6961.77 37.1345.80–52.6297.42 BC 25.1333.18–28.5353.42 29.8528.70–37.7275.64 MB 31.6246.23–37.7837.68 52.2850.36–66.11100.81 ON 29.9722.88–32.1352.12 38.2028.76–27.1451.88 QC 24.3937.89–35.6645.76 33.6035.04–42.9584.08 Region SK 30.2335.65–39.3358.05 35.3345.23–40.8479.19
Figure5. Models’performance,intermsofMAPE(%)ofthe1-,2-,3-,4-weekforecastsofresourceu tilizationin Canada
10/12
References
1. COVID-19dailyepidemiologyupdate(october15,2021).https://health-infobase.c anada.ca/covid-19/epidemiological-s ummary-covid-19-cases.html.
2. Rahimi,I.,Chen,F.&Gandomi,A.H.AreviewonCOVID-19forecastingmodels. NeuralComput.Appl. 1–11(2021).
3. Shoukat,A. etal. ProjectingdemandforcriticalcarebedsduringCOVID-19outbreaksinCanada. Can.Med.Assoc.J. 192 ,E489–E496(2020).
4. Snider,B. etal. ArtificialintelligencetopredicttheriskofmortalityfromCOVID-19:Insightsfr omaCanadianapplication. medRxiv (2020).
5. Bai,S.,Kolter,J.Z.&Koltun,V.Anempiricalevaluationofgenericconvolut ionalandrecurrentnetworksforsequence modeling(2018).
6. Torres,J.F.,Hadjout,D.,Sebaa,A.,Martínez-Álvarez,F.&Troncoso,A.Deeplear ningfortimeseriesforecasting:A survey. BigData 9 ,3–21(2021).
7. Deng,S. etal. Knowledge-drivenstocktrendpredictionandexplanationviatemporalconvol utionalnetwork.In WWW , 678–685(2019).
8. Lara-Benítez,P.,Carranza-García,M.,Luna-Romera,J.M.&Riquelme,J.C.Temporalconvolutio nalnetworksappliedto energy-relatedtimeseriesforecasting. Appl.Sci. 10 ,2322(2020).
9. Zhao,W. etal. Deeptemporalconvolutionalnetworksforshort-termtrafficflowforecasting . IEEEAccess 7 ,114496–114507(2019).
10. Shahid,F.,Zameer,A.&Muneeb,M.PredictionsforCOVID-19withdeeplearningmodel sofLSTM,GRUandBi-LSTM. Chaos,Solitons&Fractals 140 ,110212(2020).
11. Radulescu,A.,Williams,C.&Cavanagh,K.ManagementstrategiesinaSEIR-typemodelo fCOVID-19community spread. Sci.Reports 10 ,1–16(2020).
12. López,L.&Rodo,X.AmodifiedSEIRmodeltopredicttheCOVID-19outbreakinSpainand Italy:simulatingcontrol scenariosandmulti-scaleepidemics. ResultsPhys. 21 ,103746(2021).
13. Arik,S.Ö. etal. InterpretablesequencelearningforCovid-19forecasting.In NIPS (2020).
14. Malki,Z. etal. ARIMAmodelsforpredictingtheendofCOVID-19pandemicandtheriskofsecondrebo und. Neural Comput.Appl. 33 ,2929–2948(2021).
15. ArcGIS.COVID-19Resources,CanadianOutbreakAt-A-Glance.https://resources-covid19canada.hub.arcgis.com.
16. Google.CommunityMobilityReports.https://www.google.com/covid19/mobility.
17. NationalCentersforEnvironmentalInformation.https://www.ncei.noaa.gov.
18. Batista,G.E.,Monard,M.C. etal. AstudyofK-nearestneighbourasanimputationmethod. HIS 87 ,48(2002).
19. VariationingovernmentresponsestoCOVID-19.https://www.bsg.ox.ac.uk/research/publica tions/variation-governmen t-responses-covid-19.
20. Armstrong,J.S.&Collopy,F.Errormeasuresforgeneralizingaboutforec astingmethods:Empiricalcomparisons. Int. journalforecasting 8 ,69–80(1992).
21. Chu,C.-S.J.Timeseriessegmentation:Aslidingwindowapproach. Inf.Sci. 85 ,147–173(1995).
22. Hawkins,D.M.Theproblemofoverfitting. J.Chem.Inf.Comput.Sci. 44 ,1–12(2004).
23. Ramazi,P. etal. Accuratelong-rangeforecastingofcovid-19mortalityintheusa. Sci.Reports 11 ,1–11(2021).
24. Tensorflow-TCN.https://github.com/Baichenjia/Tensorflow-TCN.
25. Narayan,S.Thegeneralizedsigmoidactivationfunction:Competitivesupervisedlea rning. Inf.Sci. 99 ,69–82(1997).
26. Kingma,D.P.&Ba,J.Adam:Amethodforstochasticoptimization. arXivpreprintarXiv:1412.6980 (2014).
27. Wu,J. etal. HyperparameteroptimizationformachinelearningmodelsbasedonBayesianoptimizat ion. J.Electron.Sci. Technol. 17 ,26–40(2019).
11/12
Acknowledgments
ThisworkwaspartiallysupportedbytheCanadianInstituteofHea lthResearch(CIHR)OperatingGrant:COVID-19May 2020RapidResearchFundingOpportunity-SocialPolicyandPublicHealthRespo nses.RGgratefullyacknowledgesfunding fromtheNaturalSciencesandEngineeringResearchCouncilofCanada(NSERC)andA lbertaMachineIntelligenceInstitute (Amii).WealsoacknowledgeGoogleCloudplatformanddataprovidersArcGISandPu blicHealthAgencyofCanada.
Authorcontributions
J.Z.designedthemodelingsystem,implementedexperiments,andpreparedallfigures.J.Z.andH.P. performeddatacollectionandpreprocessing.J.Z.andR.G.ledtheinterpretationofresultsandthew ritingofthemanuscript.Allauthorsreviewed themanuscript.
Dataavailability
Allthedatausedinouranalysesareavailableonline,wherethelinkshave beenpresentedinthepaper.
Competinginterests
Theauthorsdeclarenocompetinginterests.
12/12
