14 minute read
What is At Risk?
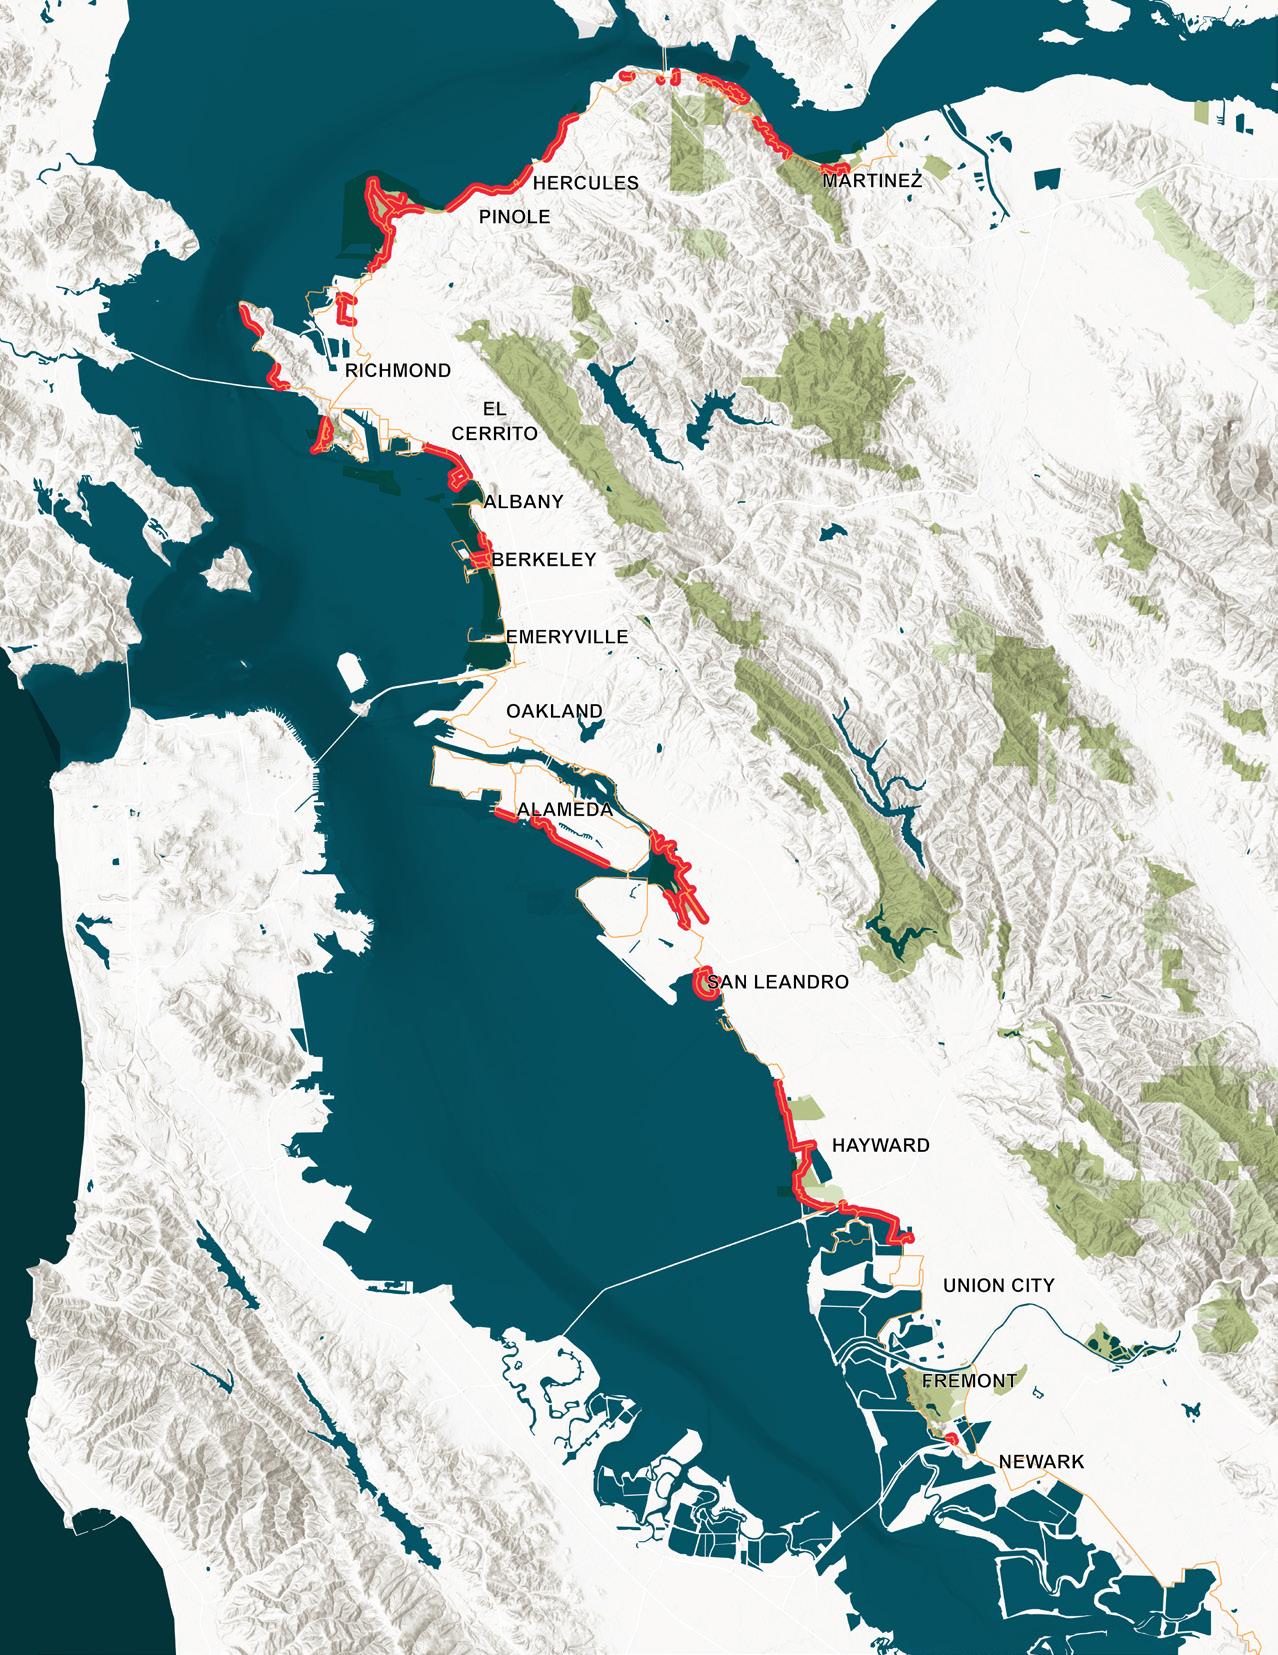
FIGURE 2-1: BAY TRAIL OPERATORS
Source: East Bay Regional Park District

As part of the initial phase of the risk assessment, the overall shoreline analysis summarizes the data gathered to characterize impending coastal hazards to the Bay Trail. Coastal hazards documented in this study include permanent tidal inundation, storm inundation, groundwater emergence, and wave exposure. Other aspects of the shoreline context mapped in the following series relate to the overarching project goals and include: restoration potential, impact on nearby communities, especially disadvantaged communities, and the proximity and exposure of critical infrastructure that may be adjacent to the Bay Trail.
The following series of maps illustrate the overall analysis which provided the foundation for the selection of the East Bay's top eight most at-risk priority Bay Trail sites.
Bay Trail Operators
The Bay Trail Operators map to the left illustrates the full extent of the Bay Trail in the East Bay and highlights the segments which are currently operated by the Park District. In addition to those segments highlighted, other areas are in management transition and will soon be operated by the Park District. For this reason, the analysis was not initially limited to areas under Park District jurisdiction only, although they did receive additional consideration when prioritizing sites for adaptation.
This map also highlights the relationship between the Bay Trail segments and the major open spaces managed by the Park District along the shoreline.

Source: LIDAR & SFEI Shoreline Inventory / ART & CoSMoS


RICHMOND

EL CERRITO
BERKELEY
EMERYVILLE

OAKLAND
ALAMEDA
SAN LEANDRO
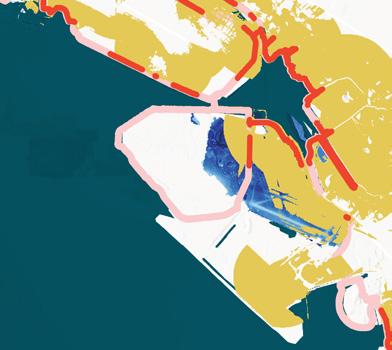
Coastal Hazards +3 FT Sea Level Rise
Mapping of coastal hazards includes factors such as permanent tidal inundation, storm inundation, groundwater emergence, and wave exposure. The Bay Trail segments have been analyzed based on the total percent of inundation across these factors and weighted in the risk assessment accordingly.
In the mid-century scenario shown in Figure 2-2, the analysis illustrates the coastal impacts related to three feet of sea level rise. Areas of permanent tidal inundation and areas of potential groundwater shallowing and emergence are mapped for reference.
More information related to the planning horizons and anticipated time ranges associated with mid-century and end-of-century sea level rise are described in Chapter One.

Source: LIDAR & SFEI Shoreline Inventory / ART & CoSMoS
RICHMOND

EL CERRITO
BERKELEY
EMERYVILLE

OAKLAND
ALAMEDA
SAN LEANDRO

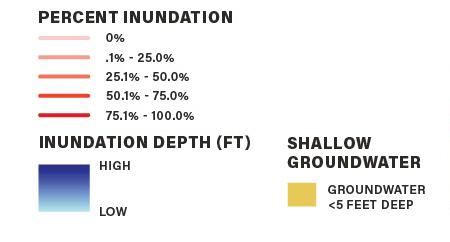
Coastal Hazards +6 FT Sea Level Rise
Mapping of coastal hazards includes factors such as permanent tidal inundation, storm inundation, groundwater emergence, and wave exposure. The Bay Trail segments have been analyzed based on the total percent of inundation across these factors and weighted in the risk assessment accordingly.
In the end-of-century scenario shown in Figure 2-3, the analysis illustrates the coastal impacts related to six feet of sea level rise. Areas of permanent tidal inundation and areas of potential groundwater shallowing and emergence are mapped for reference.
More information related to the planning horizons and anticipated time ranges associated with mid-century and end-of-century sea level rise are described in Chapter One.

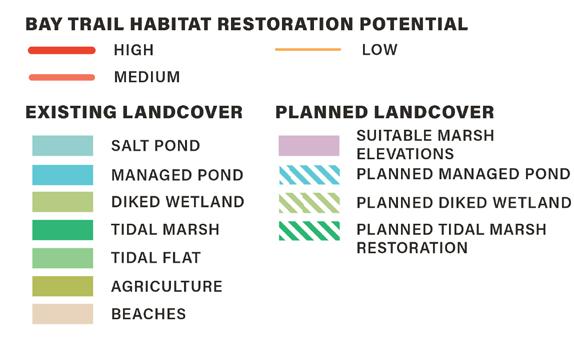
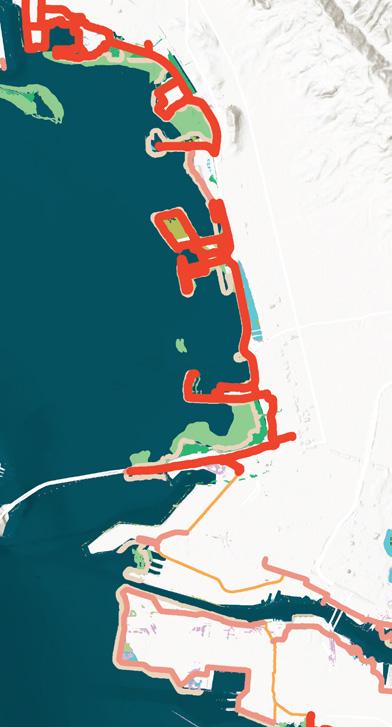
FIGURE 2-4: HABITAT RESTORATION POTENTIAL
Source: SFEI
RICHMOND

EL CERRITO
BERKELEY
EMERYVILLE
OAKLAND
ALAMEDA
SAN LEANDRO
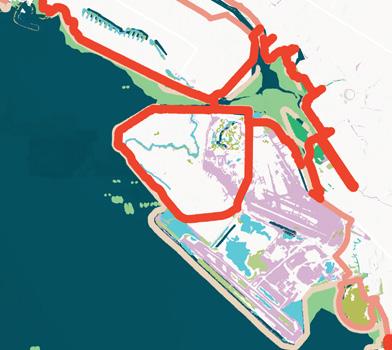
Habitat Restoration Potential
Ecological conditions along the East Bay shoreline are diverse and the Bay Trail is integrated into many different land types. The Habitat Restoration Potential map analysis focuses on the Bay Trail's proximity to existing ecological resources, opportunities for restoration of existing habitats, and the potential for new habitat areas adjacent to the Bay Trail. With the support of SFEI, the habitat data was reviewed and integrated into the risk assessment. In this category, trail segments adjacent to existing habitats received a high ranking, adjacency to areas that could be suitable for future habitat as sea levels rise received a medium ranking, and all others received a low ranking.
Integrating opportunities for restoration into the Bay Trail adaptation approach provides multiple benefits for the region within each project and is an important part of the Park District's project goals.
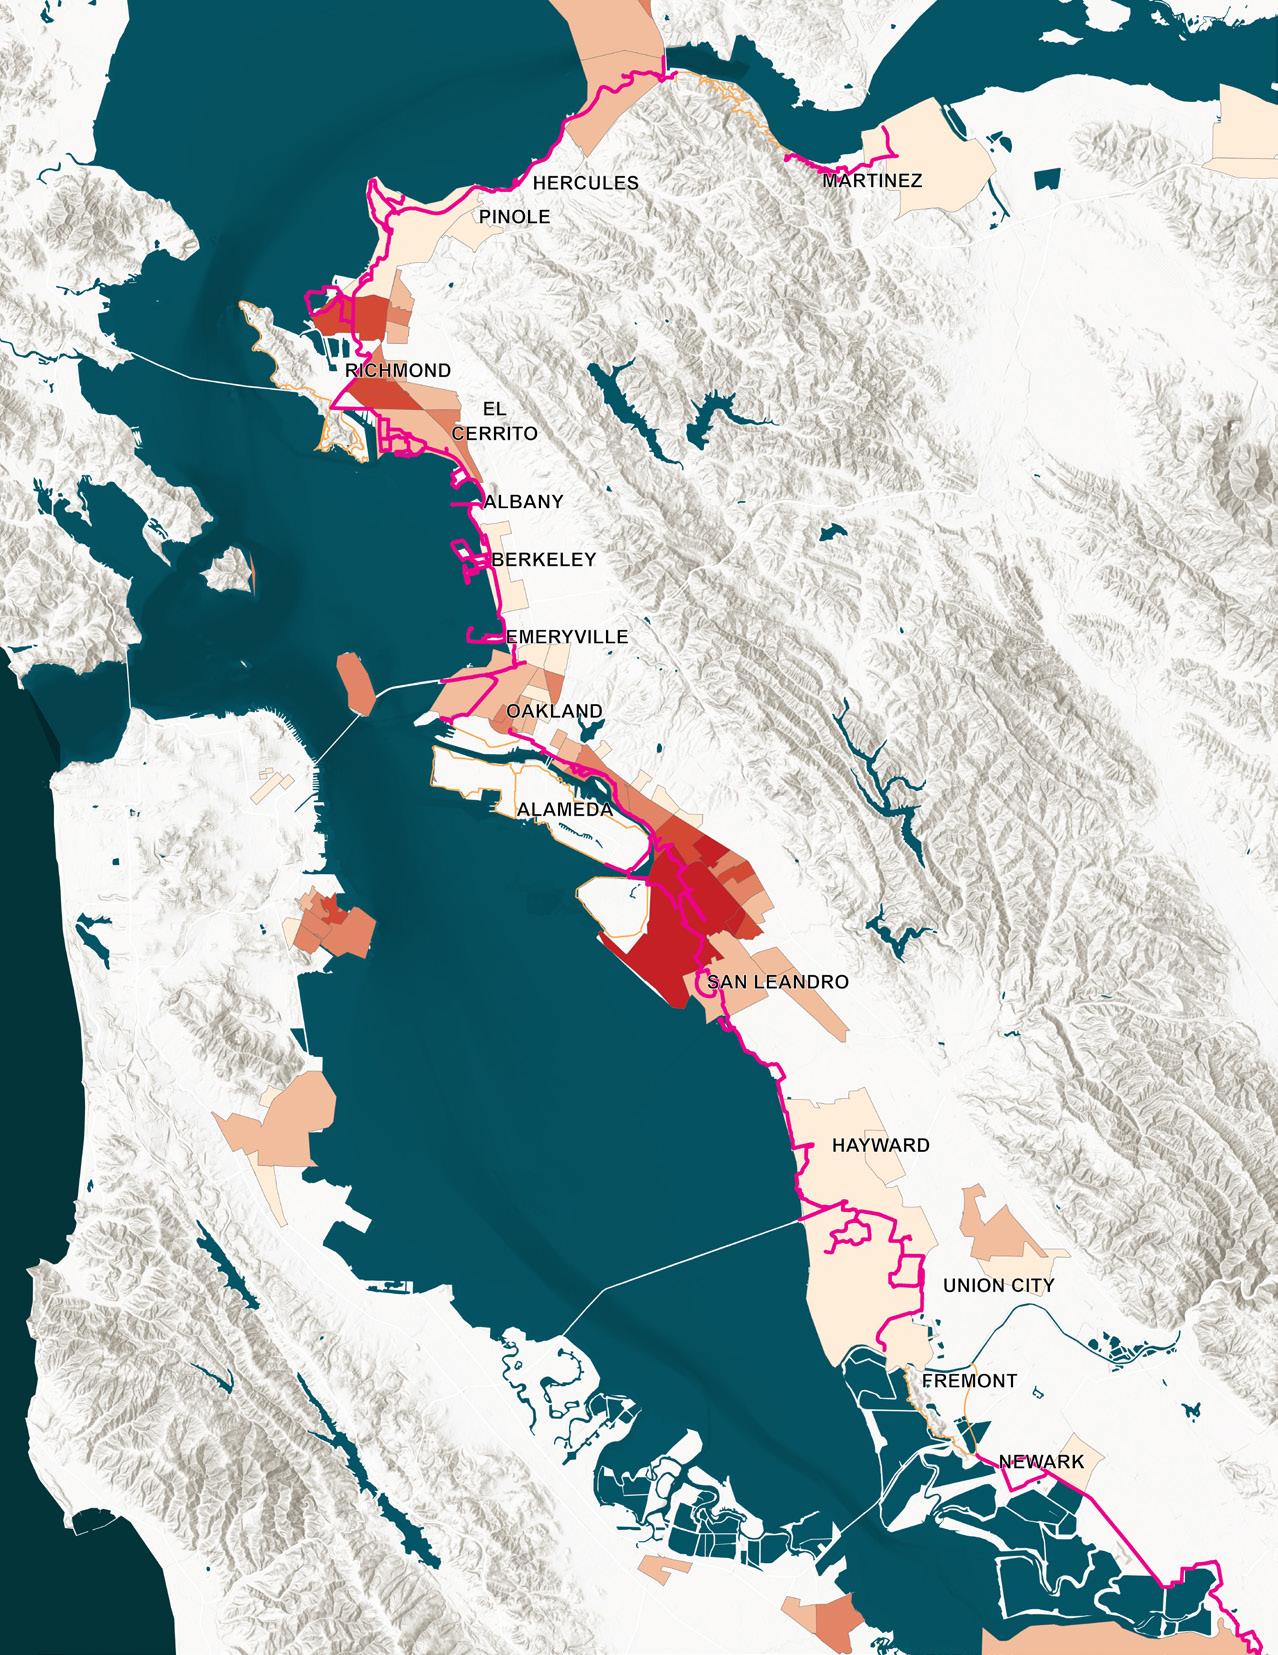
FIGURE 2-5: BAY TRAIL DISADVANTAGED COMMUNITIES
Source: CalEnviroScreen 3.0

RICHMOND

EL CERRITO
BERKELEY
EMERYVILLE

OAKLAND
ALAMEDA
SAN LEANDRO

Opportunity to Improve Public Health & Serve Disadvantaged Communities
The East Bay Shoreline And nearby communities impacted by sea level rise are also areas where additional community challenges exist today, including multiple socio economic and environmental health factors as have been documented by the state in the CalEnviroScreen dataset.
The Disadvantaged Communities map analysis assessed which trail segments were adjacent to the census block groups identified as being in the 75th percentile and above of social disadvantage. The percentages in the map show the population of each block group that identify as disadvantaged. It is notable that these communities are concentrated along the shoreline areas. Trail adaptation projects provide opportunities to better serve the adjacent communities, especially those most vulnerable.

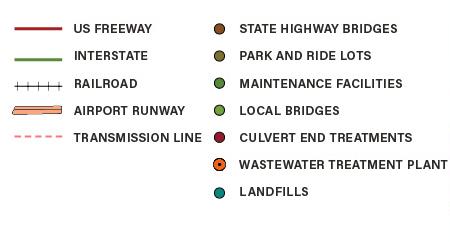
FIGURE 2-6: CRITICAL INFRASTRUCTURE
Source: Caltrans, California Enery Commission DATA, BART, AC Ttransit, County Connection, SFEI
RICHMOND

EL CERRITO
BERKELEY
EMERYVILLE

OAKLAND
ALAMEDA
SAN LEANDRO

Critical Infrastructure
In additon to the Bay Trail, the East Bay shoreline has an extensive network of regionally-significant critical infrastructure which will be impacted by sea level rise. The Critical Infrastructure map illustrates highways, railroads, airports, utilities, wastewater treatment plants, and landfills in the region. The map shows that the extent of infrastrructure along the shoreline is pervasive. Future trail adaptation projects will likely need to be integrated into larger infrastructure improvements and could be designed in a way that improves shoreline access for the region.
How is Risk Measured?
After conducting the shoreline analysis, the team applied the Park District goals and priorities described earlier, to screen trail segments within the project boundary and narrowed them down to eight sites for further study.
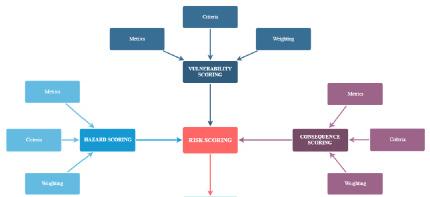
The general approach used for assessing risk of coastal flooding and sea level rise across the eight Bay Trail segments involves four steps:
• Assigning hazard scores • Assigning vulnerability scores • Assigning consequence scores • Integrating all of the scores to reveal one final risk score
The risk assessment involved the development of a risk matrix structure to collate data and compare segments based on exposure to flooding, landscape response to flooding, and potential impacts that may result from flooding both in the near-term and long-term considering sea level rise.
Hazard Assessment
The hazard assessment estimates the relative likelihood and corresponding intensity of different hazards affecting each site segment. The natural hazards quantified include tidal inundation, storm flooding, extreme wave conditions, and groundwater emergence. The segments are assigned a score for each metric which add up to one hazard score for each. A weighting is then applied to the scores to allow for different explorations of the hazard results. The different weightings include mid-century focus, end-of-century focus, or present-day focus. Each weighting reveals answers to different questions.
Different weightings were applied to hazard, vulnerability, and consequence scores allow the risk matrix to be tested against dynamic priorities. In addition to developing thematic weightings based on unique needs for each assessment, Arup administered a survey of the project team to narrow in on important preferences from subject matter experts. Recognizing that this weighting approach has limitations related to potential bias, we included a ‘team weighting’ which was developed from the results of this survey. The hazard assessment reveals that the Martin Luther King Jr. Regional Shoreline has the highest overall hazard score based on both end-of century weighting and present-day weighting while Coyote Hills/Hayward received the highest hazard score when the mid-century weighting is applied. Coyote Hills and Alameda Point receive the highest hazard scores based on team weighting.
Every site received its highest hazard score when the end-of-century weighting was applied, pointing to the importance of planning for adaptation strategies today in anticipation of increased sea level rise and coastal flooding in the future.
Vulnerability Assessment
The vulnerability assessment considers the susceptibility of each segment to damage with a focus on potential for erosion and overtopping from flooding. The assessment takes into account the various elements of green and gray infrastructure present along the shoreline to determine how vulnerable each segment is, looking at everything from mudflats to trail composition. The same method that is used in the hazard assessment is applied here except with different weighting schemes: outboard protections, trail focus, or marsh focus.
Risk = Hazard x Vulnerability x Consequence
Metrics Metrics Criteria
VULNERABILITY SCORING
Weighting
Metrics
Criteria
HAZARD SCORING
RISK SCORING CONSEQUENCE SCORING
Criteria
Weighting
PRIORITIZATION
Weighting
Funding / Financing

FIGURE 2-7: RISK MATRIX STRUCTURE
Source: San Francisco Bay Trail Risk Assessment Methodology and Results Political Priorities Ownership / Partnering
The vulnerability assessment exposes Alameda Point and Miller Knox as particularly vulnerable trail segments with high scores across all weighting schemes, elevating the need for more shoreline protection along these segments. This result also highlighted the lack of protective natural infrastructure at these sites, such as outboard marshes or wetlands.
Consequence Assessment
The consequence assessment measures the expected severity and extent of the impact of hazards on the trail and surrounding communities. The weighting applied to the consequence scores include economic, environmental, and social equity focuses. The different weightings allowed the Park District to tailor their decision-making around specific and dynamic priorities,
ensuring the tool is flexible enough to meet their needs in the context of a changing climate and a changing funding landscape.
The consequence assessment shows the Coyote Hills/Hayward segment as having the highest consequence scores for most weighting schemes, likely caused by its proximity to nearby neighborhoods and community places, while Miller Knox and Crown Beach show low scores across all weighting schemes both of which are further removed from population centers. With a social equity weighting, however, the Spine Trail score spikes as the segment with highest consequences given its proximity to a disadvantaged community. Of note, economic and environmental weighting schemes yield almost identical scores across all sites.
Risk Assessment
Finally, the Risk Assessment integrates all the scores from the assessment to reveal one final risk score for each segment. Over 15 weighting schemes were developed and ultimately, after incorporating feedback from the project team and consolidating all results, a list was developed for first, second, and third priority sites ranked according to risk. The section of the Bay Trail that runs along the East Bay is varied and complex, with differing exposure levels to hazards from the Bay, differing coverage and quality of green and gray infrastructure that determine vulnerability, and differing surroundings that define how consequential the impacts of sea level rise and coastal flooding will be on community resources. We know the impacts from climate change will change our relationship with the Bay as it threatens public access along the shoreline. This assessment reveals how truly diverse the conditions along the shoreline are and as a result, how diverse the impacts will be, providing a roadmap for the Park District and its stakeholders to
BAY TRAIL - HAYWARD SHORELINE
Source: WRT
prioritize adaption interventions in the near-term to achieve long-term benefits for the region.
Following the Risk Assessment, segments of the Bay Trail within the Park District’s purview found to be at the highest risk of coastal flooding and sea level rise were prioritized for additional adaptation design visioning. Segments were ranked based upon their risk level, funding needs, ownership structure and partnership opportunities, political support, and co-benefits resulting from adaptation. The risk assessment is useful in that it establishes a clear and objective baseline for where to focus attention when pursuing projects with the greatest potential co-benefits across the categories of economic, environmental, social equity, recreational, and connectivity. Risk assessment also gives an early indication of which projects may yield the most favorable benefitcost relationships, which is critical for capital planning. Ultimately, this risk assessment provides a critical foundation for risk-informed, strategic decision making around how and when to address sea level rise by leveraging the Bay Trail within the Park District’s 55-miles of East Bay shoreline.
See Appendix: San Francisco Bay Trail Risk Assessment Methodology and Results, November 6, 2020; Arup for detailed description of the methodology
Application of Prioritization Matrix
The prioritization matrix combines the outcomes of risk assessment with the Park District's goals, and the potential for funding and partnership. The sites that had a higher cumulative score rose to the top. This scoring informed the selection of three prototype sites for developing adaptation concepts within the scope of the RAAPP. An additional consideration that informed the prototype site selection was whether or not planning and design work was currently underway for any of those sites. Sites where planning wasn't currently in process were prioritized.
TABLE 2-1: ADAPTATION PRIORITIZATION MATRIX

FIGURE 2-8: BAY TRAIL PRIORITY SITES
In summary, the risk assessment process involved creating evaluation criteria to compare Bay Trail segments under the Park District management based on exposure to flooding, landscape response to flooding, and potential impacts that may result from flooding both in the near-term and long-term considering sea level rise.
Metrics were developed to measure hazard, vulnerability, and consequences from sea level rise and coastal flooding to assess the eight priority sites and assign risk profiles to each. Through that analysis the sites were grouped into tiers of prioritization for the Park District to consider in future planning efforts.
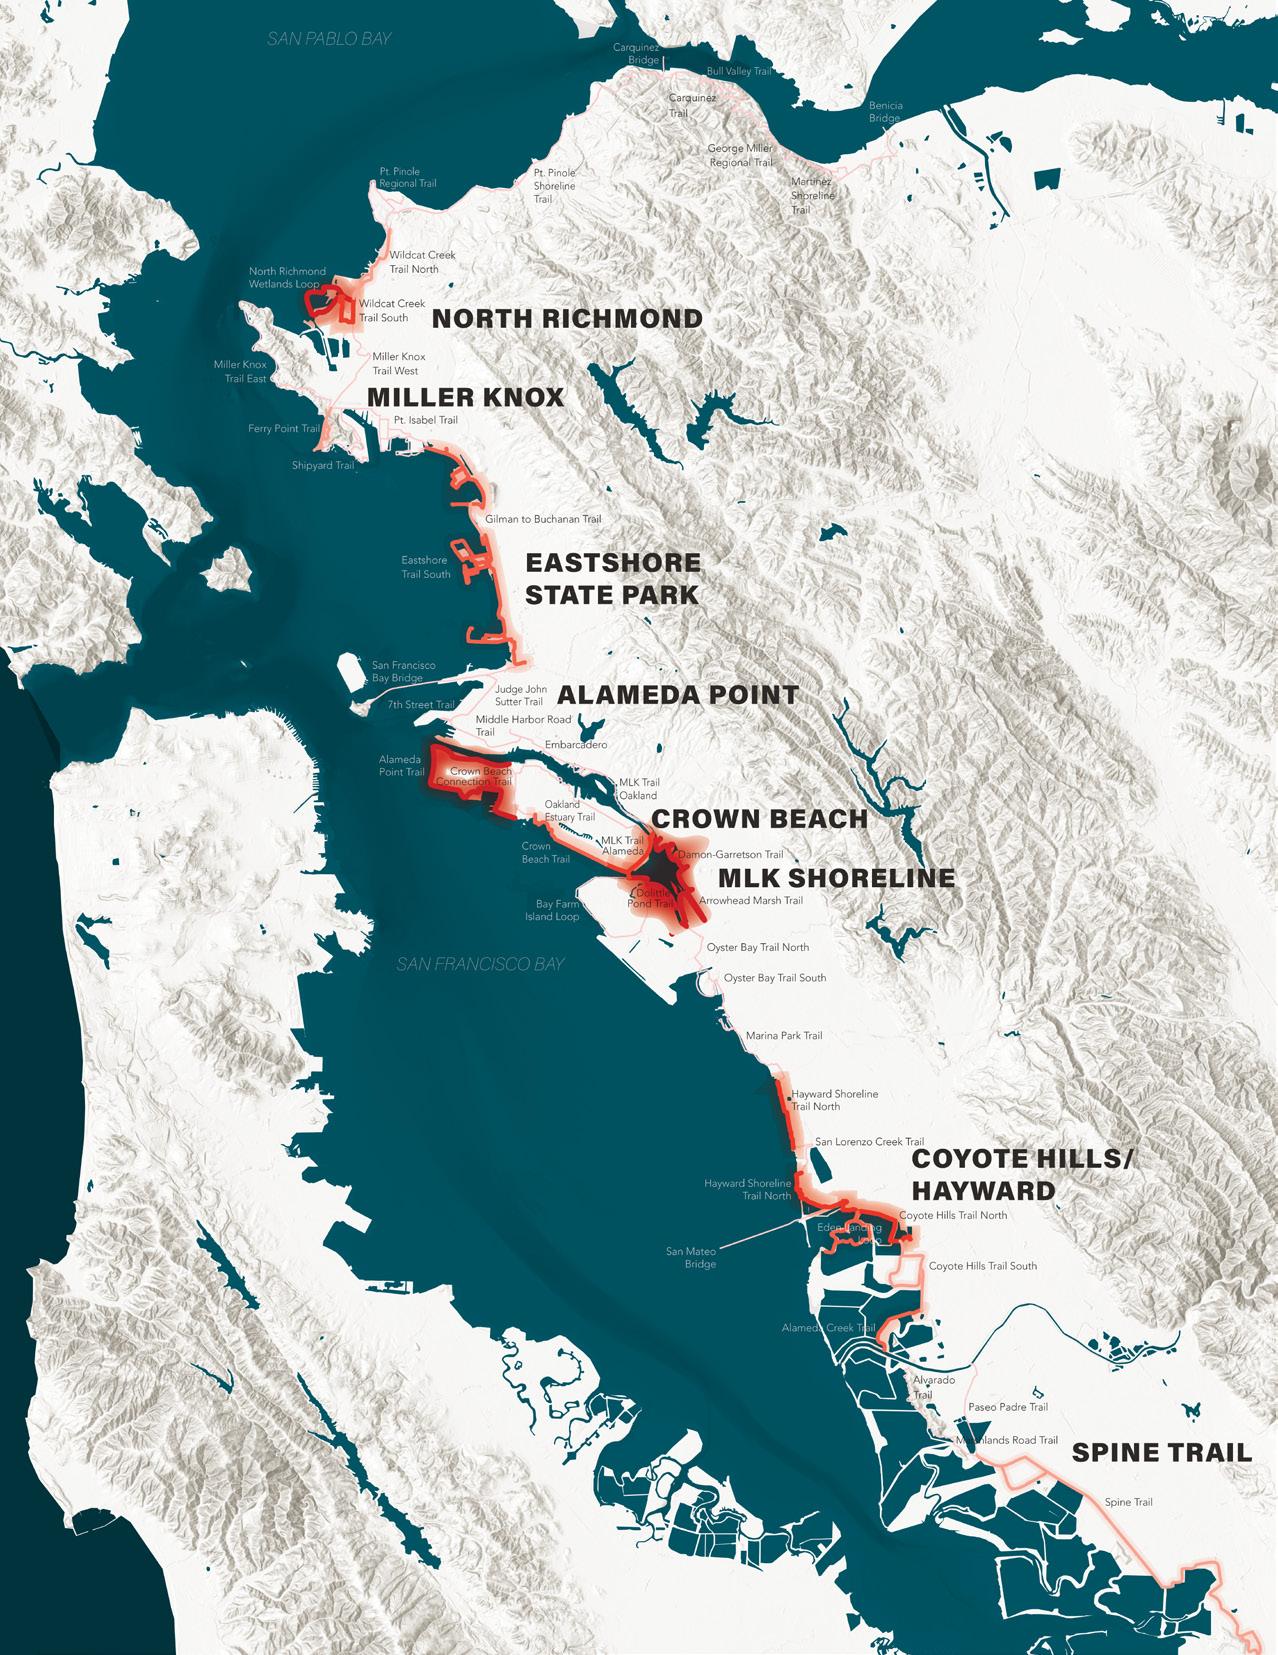
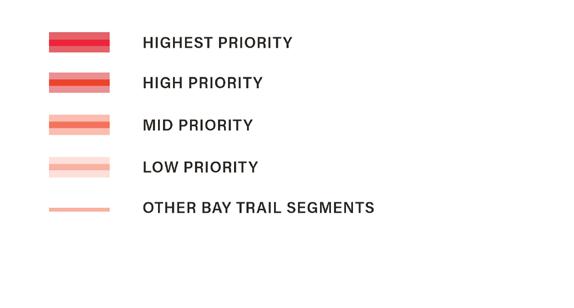
Figure 2-8 illustrates locations of the eight priority Bay Trail sites identified and studied in detail as part of the Risk Assessment.
The results of the risk assessment and prioritization process were subsequently used to identify three prototype sites for developing adaptation concepts. The adaptation concepts for the three sites depict a range of strategies and partnership potential and are illustrated in more in the Prototype Sites chapter.
Bay Trail Tiers of Priority
FIRST TIER PRIORITY SITES
1. Martin Luther King Jr. Regional Shoreline 2. Alameda Point 3. Coyote Hills/Hayward
SECOND TIER PRIORITY SITES
4. North Richmond 5. Eastshore State Park 6. Spine Trail
THIRD TIER PRIORITY SITES
7. Crown Beach 8. Miller Knox
3
ADAPTING THE BAY TRAIL
The San Francisco Bay shoreline exhibits great diversity along its entire extent, due to varying geology, hydrology, ecology, microclimate, land use and development patterns, demographics, and opportunities for access, which influences the types of vulnerabilities found along the shoreline. This diversity calls for a range of responses and adaptation strategies that address specific local conditions.
In addition to understanding the diverse conditions and processes that shape the existing shoreline, assessing the extent of risk along various segments of the Bay Trail was an important step in the process to prioritize responses.


