TIBURON GENERAL PLAN 2040
| MAY 2023
ADOPTED

ADOPTED | MAY 2023
TOWN OF TIBURON
Town Council
Jack Ryan, Mayor
Noah Griffin, Vice Mayor
Alice Fredericks
Holli P. Thier, J.D.
Jon Welner Planning Commission
Erica Williams, Chair
Daniel Amir, Vice Chair
Jeff Tsai
Kathleen Defever
Eric Woodward
Staff
Greg Chanis, Town Manager
Dina Tasini, Planning Director
Christy Fong, Senior Planner
Sam Bonifacio, Assistant Planner
Patrick Kerslake, Superintendent of Public Works
O’Rourke & Associates
Sustainable Community Planning
WRT
DeNovo Planning Group
TJKM Transportation Consultants
Ricardo Huerta Niño
1 Introduction ....................................................................09
1.1 Setting and Planning Area
1.2 What is a General Plan?
1.3 The General Plan Legacy
1.4 The General Plan Update Process
1.5 General Plan Guiding Principles
1.6 General Plan Organization
1.7 Administering the Plan
2 Land Use ..........................................................................25
2.1 Purpose of the Chapter
2.2 Development Trends
2.3 Land Use Categories and Land Use Map
2.4 Development Projections
2.5 Goals, Policies, and Programs
3 Downtown........................................................................41
3.1 Purpose of the Chapter
3.2 Downtown Setting
3.3 Vision for Downtown
3.4 Goals, Policies, and Programs
4 Housing ............................................................................75
4.1 Purpose of the Chapter
4.2 2023-2031 Housing Element
4.3 Housing Opportunity Sites
4.4 Goals, Policies, and Programs
LIST OF FIGURES
Figure IN-1 Regional Setting
Figure IN-2 Town Limits and Planning Area
Figure IN-3 Downtown Plan from 1970 Tiburon General Plan
Figure LU-1 Land Use Map
Figure DT.1 Downtown Location
Figure DT.2 Downtown Subareas
Figure DT.3 Local Historic Resources
Figure DT.4 Downtown Circulation Network
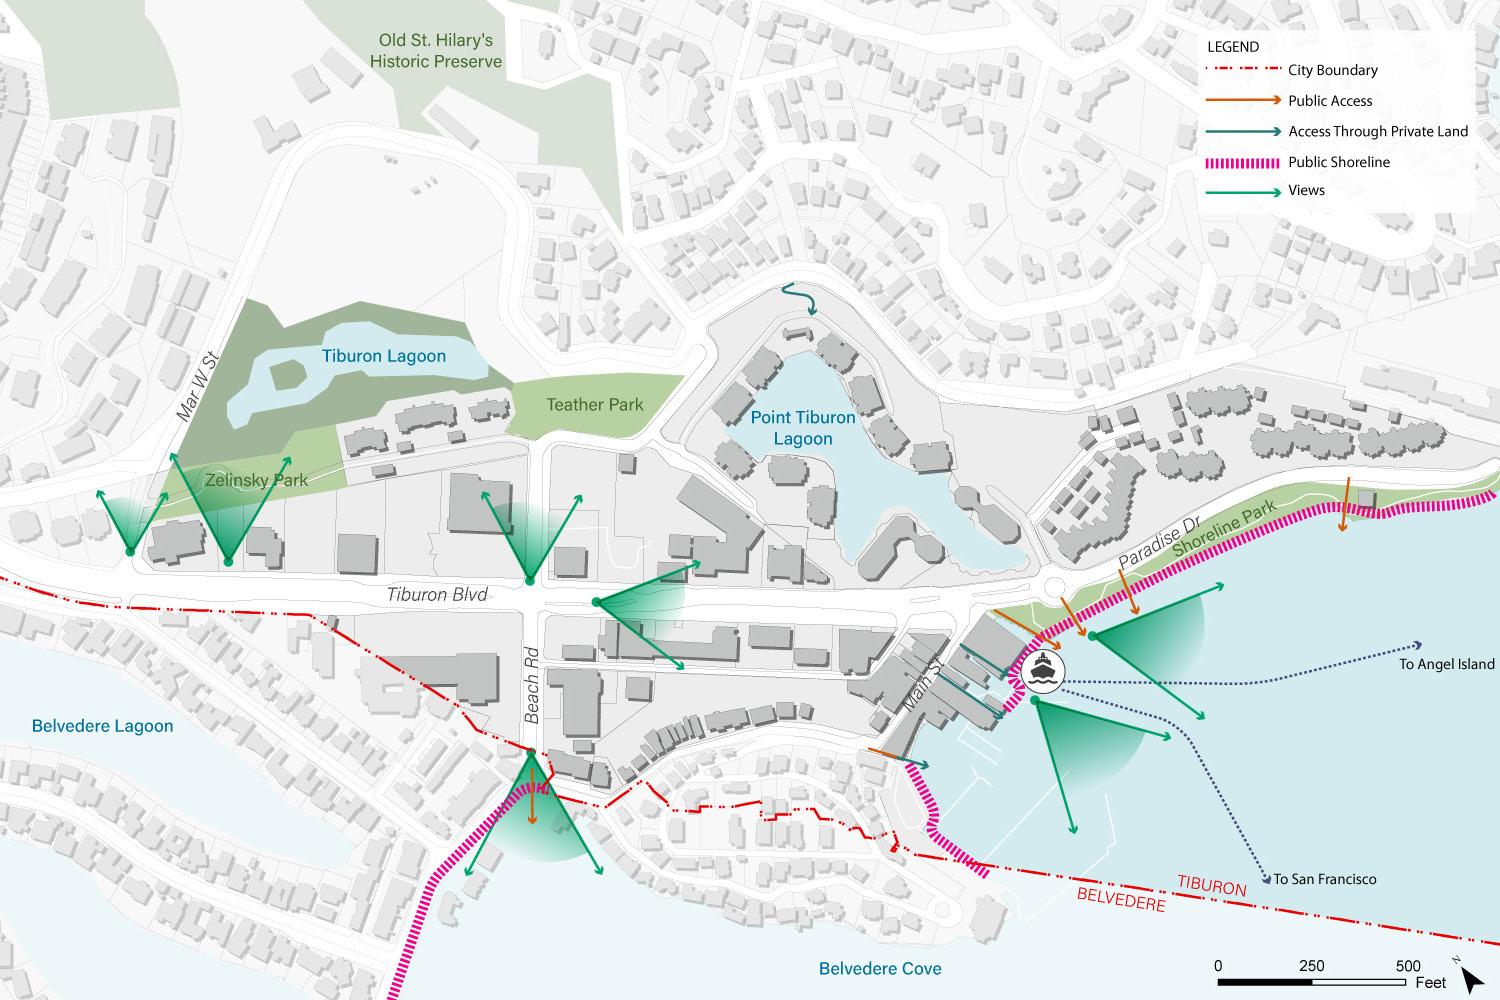
Figure DT.5 Shoreline Access and Views
Figure DT.6 Projected Sea Level Rise, Downtown Tiburon
Figure DT.7 Main Street Adaptation Concept
Figure DEI-1 US Census Tracts in Tiburon, 1241 & 1242
Figure DEI-2 Racial Composition of Tiburon
Figure DEI-3 Places of Birth of Foreign-born Population of Tiburon
Figure M-1 Regional Transportation Setting
Figure M-2 Street Classification Map
Figure M-3 Sidewalks & Paths
Figure M-4 Bikeway Network Map
Figure M-5 Transit Route Map
Figure M-6 Daily Traffic Volumes
Figure M-7 Motor Vehicle Collision Locations (2015-
Figure N-1 Existing Noise Contours
Figure N-2 Projected Future Noise Contours
Figure N-3 Projected Future Noise Contours
Figure C-1 Land Cover Types
Figure C-2 Sensitive Natural Communities and Wetlands
Figure C-3 Watershed
Figure OS-1 Open Space Areas and Parks
Figure OS-2 Ridgelines and Scenic Characteristics
Figure SR-1 Earthquake Faults and Significant Earthquakes With A Magnitude of 4.0 or Greater Since 1906
Figure SR-2 Liquefaction Potential
Figure SR-3 Tsunami Inundation Zones
Figure SR-4 Landslide Potential
Figure SR-5 FEMA Flood Hazard Zones
Figure SR-6 Baywave Sea Level Rise Projections and State Guidance
Figure SR-7 Baywave Scenarios 1 and 2 In Tiburon
Figure SR-8 Baywave Scenarios 3 and 4 In Tiburon
Figure SR-9 Baywave Scenarios 5 and 6 In Tiburon
Figure SR-10 Wildland Urban Interface Areas
Figure SR-11 Fire Hazard Severity Zones
Figure SR-12 Fire Threat
Figure SR-13 Fire Protection Districts And Fire And Police Stations
LIST OF TABLES
Table IN-1 Location of State-Mandated Elements
Table LU-1 General Plan Land Use Acreage
Table LU-2 Land Use Categories
Table LU-3 Residential Planned Development Maximum Allowed Densities
Table LU-4 Development Projections
Table H-1 Housing Sites
Table DEI-1 Demographic Comparison of Census Tracts in Tiburon
Table M-1 Street Classifications
Table M-2 Bikeway Network Miles
Table M-3 Work Commute Characteristics
Table M-4 Proposed Circulation Improvements
Table S-1 Community-Wide GHG Emissions by Sector, 2020
Table C-1 Special-Status Animal and Plant Species Present or Potentially Present In The Tiburon Vicinity
Table C-2 Local Historic Inventory for Downtown Tiburon
Table OS-1 Public Open Space in The Planning Area
Table OS-2 Parks in The Planning Area
Table SR-1 Baywave Sea Level Rise & Storm Scenarios
Table SR-2 Crime Statistics
Tiburon is a town in southern Marin County located on the Tiburon Peninsula and includes Angel Island and portions of the Raccoon Strait and San Francisco Bay. As shown in Figure IN-1, Tiburon is generally bordered by unincorporated Marin County to the west, east and north; the City of Belvedere to the west and southwest; and San Francisco and Richardson Bays.
The Tiburon Peninsula is accessible by ferry from downtown San Francisco, by road from Highway 101 and Highway 131 (Tiburon Boulevard), and by bicycle through the San Francisco Bay Trail. Apart from San Francisco, other nearby cities include Belvedere, Corte Madera, Mill Valley, and Sausalito.
The modern history of Tiburon began in 1834 when John Thomas Reed was formally granted permission by the Mexican authorities to occupy the Rancho Corte de Madera del Presidio, which was a vast area of redwood groves and grassland that included the Tiburon Peninsula, Belvedere, and major portions of Mill Valley, Corte Madera, and Larkspur.
The area which currently contains the Town of Tiburon began to grow with the establishment of a railroad line in 1884 between Tiburon Point and San Rafael with a ferry connection to San Francisco. Early growth centered around marine, commercial, and industrial development. In the 1940s, growth occurred in association with World War II and the presence of Navy and Army facilities on the

Tiburon Peninsula and Angel Island. Beginning in the 1950s, Tiburon’s growth became that of a bedroom community of San Francisco, with the development of residential subdivisions and a transition to commerciallyoriented development along Tiburon Boulevard and Main Street. By the beginning of the 2000s, the majority of the developable land in the Tiburon had been developed. Growth from the last two decades has been limited to the redevelopment and/or expansion of existing properties, development of infill properties, and development of planned development properties with site challenges, such as steep slopes, ridgelines, wildlife habitats, and trees and woodlands.
Elevations on the Tiburon Peninsula range from sea level to about 650
feet, and it is drained by multiple small watersheds on the north and south sides. Vegetation occurring within the planning area primarily consists of agricultural, ruderal, riparian, and landscaping vegetation.
The Town of Tiburon comprises approximately 4.5 square miles of land area and 8.75 square miles of submerged land. The Town limits are shown in Figure IN-2.
The “Planning Area” for the General Plan update is greater than the Town limits and includes the Town’s sphere of influence (SOI), which defines the probable future physical boundaries
and service area of the Town as determined by the Marin Local Agency Formation Commission. The SOI includes the unincorporated areas along Paradise Drive, Paradise Cay, and land near the Highway 101/ Tiburon Boulevard interchange. The Town’s planning area also includes open space land on Ring Mountain, as shown on Figure IN-2.


A general plan is a town’s road map for the future. It describes a community’s long-term vision and sets forth goals, policies, and programs to manage growth, direct land use decision making, and preserve the environment and character of the community. The State of California requires every town, city, and county to have a general plan to guide future development, preserve open space, conserve resources, and provide for public health, safety, and welfare. Local ordinances and other plans must be generally consistent with the general plan and applicable policies and programs. This comprehensive update of the Tiburon 2020 General Plan provides goals and policies that reflect presentday community values and priorities and compliance with current State laws and local ordinances.
General Plan 2040 is the third such plan in the Town’s history.
The 1970 General Plan included a plan to transform the former Northwest Pacific railyard into a development with a boat basin, museum, restaurant, and shops; an inn and conference center with shops and a 300-car garage; another extensive shopping area with parking for 550 cars; an office center; several new streets, and three housing developments. By 1973, there was concern that the Town would be overwhelmed with commercial development. A petition signed by almost one-third of the population requested that the Town maintain the small town character of Tiburon; limit automobile traffic and visitors;
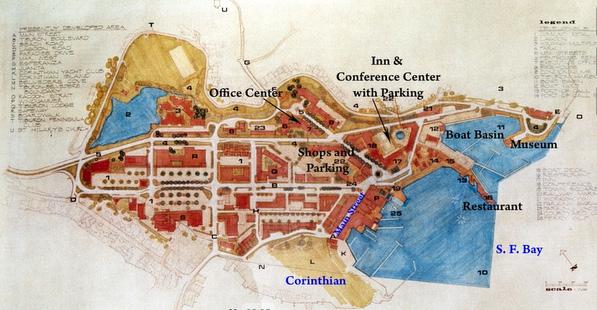
preserve the waterfront; and retain the downtown area primarily for residents, rather than visitors. Eventually, the Point Tiburon condominiums and commercial plaza and Shoreline Park were developed in the early 1980s. The 1989 General Plan was adopted following a bitter and divisive political
battle over the appropriate amount of new development that should be allowed in the community. The 1989 General Plan made sweeping reductions in allowable densities on the planning area’s major undeveloped residential properties, and the stringent limitations of commercial intensity in
Source: Belvedere-Tiburon Landmarks Society
Downtown Tiburon, first set forth in the 1975 Downtown Plan, were carried over and strengthened.
Tiburon’s General Plan 2020, adopted in 2005, emphasized planning for the future while preserving the characteristics that make Tiburon unique and special, including its views and natural beauty, small-town village character, and network of open space.
General Plan 2020 acknowledged that the Town was predominately built out. The Land Use element focused on limiting development and preserving important environmental characteristics on the remaining 21 large parcels of vacant land within the Town’s planning area. Of these properties, six located within the Town limits remain undeveloped.
In response to State law requirements, the Town adopted updated versions
of the General Plan’s circulation and housing elements in 2016. The Town adopted an updated Tiburon Bicycle and Pedestrian Plan (2016), which provides guidance and programs for enhancing the pedestrian and bicycle network and facilities in Tiburon. Other adopted plans include the Open Space Resource Management Plan (2010), the Marin County Multi-Jurisdictional Local Hazard Mitigation Plan (2018), and the Town of Tiburon Climate Action Plan (2022) with measures aimed at reducing community and municipal greenhouse gas emissions. These plans have been incorporated in this General Plan update.
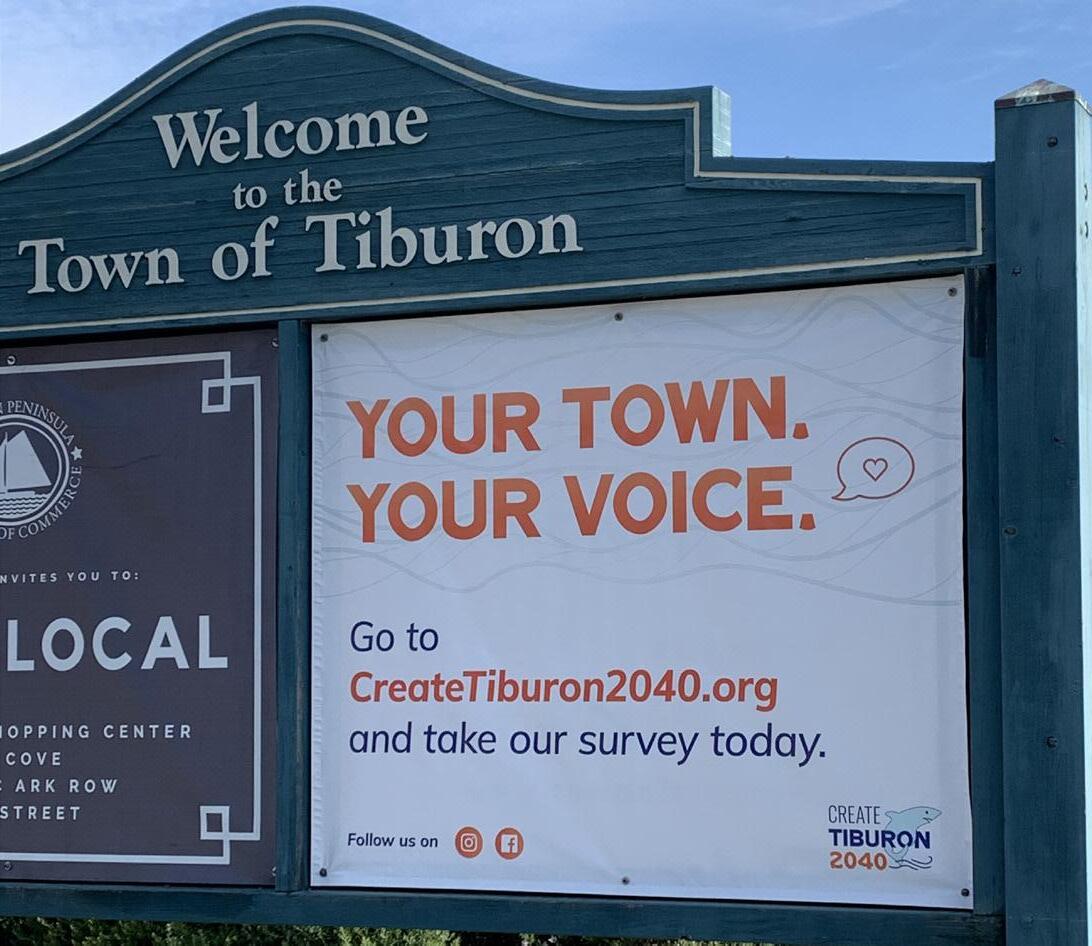
The General Plan Update process, known as “Create Tiburon 2040,” was a community-wide journey to ensure that Tiburon retains its unique character well into the future. It was a two-year planning process used to help define community values and explore future options. It was a public process, one that has sought to engage the community.
Each step of the Create Tiburon 2040 process was supported by extensive community outreach and participation. Community members provided their input and feedback through a series of public workshops, meetings, and surveys. The Town created a website dedicated to the Create Tiburon 2040 effort and provided online surveys and virtual workshops to expand community
participation during the COVID-19 pandemic. The Town utilized the Town’s website, newsletter, mailing, banners, email, social media, local newspapers, and printed materials to publicize community workshops and public meetings.
The Create Tiburon 2040 process began with a series of stakeholder interviews and a “Setting Priorities” survey to identify special characteristics about the Town, key issues to address, and potential areas for change or improvement. Residents said they prized Tiburon’s scenic beauty, natural environment, and location. The Town’s excellent schools, historic downtown,
abundance of open space, and smalltown feel were also noted.
Key issues facing the Town included: ensuring the vitality of the downtown; managing tourism; emergency preparedness; climate change and sea level rise; traffic; downtown parking; bicycle and pedestrian mobility and safety; diversity and inclusion; affordable housing; and protection of open space.
A series of seven community workshops were held between February 2021 and March 2022.
Workshops focused on specific elements of the General Plan as follows:
• Safety, Parks, and Open Space
• Sea Level Rise
• Downtown
• Housing I and II
• Sustainability
• Mobility and Noise
Online surveys were provided after each workshop to engage community members who could not participate during the scheduled event.
Throughout the update process, the Town’s boards and commissions reviewed existing General Plan policies and programs related to their area of expertise, considered public input, and provided recommendations. These commissions and boards included the Planning Commission; Parks, Open Space, and Trails Commission; Heritage
& Arts Commission; and the Diversity Inclusion Task Force.
The Design Review Board was instrumental in developing objective design and development standards for Downtown zoning districts, a key piece to ensuring housing sites identified in the Housing chapter will complement and improve the look and feel of the Downtown.
Each step of the Create Tiburon 2040 process was supported by community outreach and participation.

The Create Tiburon 2040 planning process was shaped by the following guiding principles which defined the major themes for the General Plan update and served as touchstones during the process of developing and refining goals, policies, and programs.
• Preserve and enhance Tiburon’s intimate small-town feel and bayside village charm.
• Preserve and enhance access to the Town’s scenic public open spaces and bay front.
• Preserve and protect important historic, cultural, and artistic resources that serve as significant, visible reminders of the Town’s social and architectural history.
• Support a local economy that is vibrant and provides a wide range of services.
• Encourage Downtown vitality and redevelopment with a more diverse array of uses and amenities to serve the local population, while retaining and building upon its unique historic character and attractiveness.
• Gracefully accommodate tourism, balancing it with local needs and retaining the community’s character.
• Focus new development in Downtown and in areas adjacent to Tiburon Boulevard while preserving existing neighborhoods and open space.
• Provide a balanced transportation system, including public transit, that accommodates the needs of automobiles, pedestrians, bicycles, and new transportation technology.
• Reduce dependence on the automobile by providing a complete
network of sidewalks, pathways, and transit services that are safe and convenient for all residents.
• Promote physical health and wellness by improving outdoor recreational facilities, trail connections and signage, and by providing quality recreation programs to residents of all ages, abilities, and economic means.
• Strengthen community connections by providing activities and outdoor public gathering places.
• Promote social equity and inclusiveness in creation of public policies.
• Ensure the just and equitable provision of public facilities and services.
• Protect and enhance the quality of life within residential neighborhoods.
• Support the development of more diverse and affordable housing opportunities.
• Provide a safe community through public safety services, resilient infrastructure, and public preparedness.
• Protect and enhance open spaces and natural resources that contribute to Tiburon’s unique identify and scenic beauty.
• Reduce greenhouse gas emissions and increase community resilience by preparing for the effects of climate change, including increased wildfires and sea level rise.
The General Plan is organized into eleven chapters:
1. Introduction provides background information on the General Plan.
2. Land Use describes land use in Tiburon and how and where new development will occur.
3. Downtown describes the Downtown’s geography, history, built character, circulation patterns, and role as a commercial, cultural, and recreational destination.
4. Housing describes the need for housing, especially housing affordable to lower and moderateincome households, and sites available for housing.
5. Diversity, Equity + Inclusion addresses environmental justice and how the Town will build a more diverse, equitable and inclusive community.
6. Mobility provides an overview of the circulation network and traffic operations, and parking,
public transportation, bicycle, and pedestrian facilities.
7. Noise identifies existing and future noise sources and levels in Tiburon.
8. Sustainability describes concepts of sustainability, provides an overview of climate change impacts, and addresses how the Town will reduce greenhouse gas emissions and become a more sustainable community.
9. Conservation covers natural communities and ecological resources, watersheds and waterways, water resources, water and air quality, and cultural and historical resources.
10.Open Space, Parks + Recreation addresses the protection, maintenance and enhancement of Tiburon’s open space areas, parks, recreational facilities, and scenic resources.
11. Safety + Resilience describes environmental and human-caused hazards, including earthquake,
flood, sea level rise, and fire, and addresses potential risks to the community.
Each chapter describes existing conditions and context for the related topic area, followed by goals, policies, and programs to guide the Town’s
management and development. State law requires Tiburon’s General Plan to cover eight topics, also known as “elements.” Table IN-1 shows the relationship of the General Plan chapters to the State-mandated elements.
Land Use
Circulation
Open Space
Conservation
Safety
Noise
Housing
Environmental Justice1
Land Use; Safety + Resilience
Mobility
Open Space, Parks + Recreation
Conservation
Safety + Resilience
Noise
Housing
Diversity, Equity + Inclusion
1 An environmental justice element is required if a local jurisdiction has a disadvantaged community as defined by state law. Although Tiburon does not contain any such disadvantaged communities, environmental justice policies and programs are included in the General Plan.
The General Plan is supported by separately-published documents that provide background information and environmental analysis. The Existing Conditions Report contains detailed information for each of the topic areas covered in the General Plan and was used as a reference document during the development of the Plan. The Environmental Impact Report determines the type and extent of environmental impacts that would result from implementation of the General Plan. It identifies requirements for more detailed environmental analysis that may be required for specific projects considered in the future.
The General Plan is used in a variety of ways. Town planning staff use the General Plan when evaluating development proposals to ensure that projects are consistent with the General Plan land use designations and applicable goals, policies, and programs. The Town Council and the Town’s boards and commissions use the document to guide decision making. Importantly, the General Plan empowers the Town, public agencies that work with the Town, and private developers to invest in and plan for a future in accordance with the plan’s goals and policies.
Each chapter of the General Plan contains a series of goals, policies, and programs that provide guidance to the Town on how to direct change, manage growth, and manage resources over the life of the General Plan.
The following provides a description and explains the relationship of each:
• A goal is a description of the general desired result related to a particular topic or issue that the Town seeks to create through the implementation of the General Plan.
• A policy is a specific statement that guides decision-making as the Town works to achieve its goals. The General Plan’s policies set out the standards that will be used by Town staff, the Planning Commission, and the Town Council in its review of land development projects, resource protection activities, infrastructure improvements, and other Town actions. Policies are ongoing and require no specific action on behalf of the Town.
• A program is an action, procedure, or technique to be undertaken by the Town to help achieve a specified goal or implement an adopted policy.
The following words are used to indicate whether a particular policy or program is mandatory, advisory, or permissive:
• “Must” or “shall” means an action the Town is required to follow.
• “Should” means an action the Town is advised to follow.
• “May” means an action which is left to the discretion of the Town.
The General Plan contains a series of figures and maps depicting existing and proposed or future conditions of areas within and near Tiburon. These maps and diagrams are intended to provide the reader with a general understanding of the extent of land uses and conditions. Figures are not intended to be used for development, permitting, or investment purposes for specific parcels. More detailed printed maps may be available at the Town of Tiburon.
The General Plan’s programs set forth a work program for the Town, guide
capital improvement projects, and prioritize Town expenditures. Some actions call for additional analysis, studies, and implementing ordinances. Town staff will regularly report to the Town Council on the progress of the Plan’s implementation.
The Town should periodically review the entire General Plan to determine whether it still reflects community concerns and goals. The Housing Element is required to be updated according to a schedule established by the State Department of Housing and Community Development. The next revision of the Housing Element is scheduled for 2031.
Known for its scenic bayfront location, extraordinary views, historic downtown, and exceptional quality of life, Tiburon seeks to protect its character through land use planning.
This chapter presents a framework for governing future decisions about appropriate land uses and desirable development patterns to maintain and enhance the character of Tiburon. This framework aims to effectively manage growth and provide needed housing and services, while guiding the use of quality design for new development. The chapter partially addresses State requirements for the land use element of the general plan. Areas subject to flooding are discussed in the Safety + Resilience chapter.
The Land Use chapter includes the following sections.
2.2 Development Trends. Discusses how land use in Tiburon has changed over time.
2.3 Land Use Categories and Land Use Map.
Describes land use designations within residential, commercial, mixed use, community, and natural resource categories, and identifies specific land uses on the Land Use Map.
2.4 Development Projections. Identifies additional residential and commercial development projections based on the theoretical build out of all vacant and underutilized land in Tiburon.
2.5 Goals, Policies, and Programs. Identifies goals, policies, and programs to guide growth, maintain community character, and balance residential and commercial uses.
Like many other towns, large and small, throughout California, development in Tiburon reflects two distinctly different eras of planning and development. The land of the Tiburon Peninsula was first awarded by the Mexican government to John Thomas Reed in 1834 as the Rancho Corte de Madera del Presidio. Reed cleared the peninsula of timber, built a sawmill, and began a dairy. By the 1880s, the peninsula was also home to codfish canneries and military installations. In 1882, the Reed family made a deal with Peter Donahue for a right-of-way for the San Francisco and North Pacific Railroad (name later changed to Northwestern Pacific). The railroad company built a large railroad yard and ferry terminal, with ferries taking passengers and vehicles to San Francisco and Sausalito. St. Hilary’s Mission Church was built in 1888, and the first Tiburon school in 1901.
For many years, most of the land of the peninsula was controlled by descendants of the Reed family and used for cattle ranching. In the 1940s, growth occurred in association with World War II and the presence of Navy and Army facilities on the Tiburon Peninsula and Angel Island. The first apartment complex in Tiburon, Hilarita Housing, was built in 1942 to house military families, and single family housing development began in earnest after World War II on what had been dairy ranches. The first subdivisions were built in the 1950s, and the Boardwalk Shopping Center was constructed in 1955 to service the new Tiburon residents.
In 1964, the Town of Tiburon was incorporated. By 1967, train service ended in Tiburon and a planning process began to redevelop the 38 acres containing the abandoned railyard. A plan adopted in the 1970 General Plan was rejected by residents, and eventually a new plan was approved in 1981 with significantly
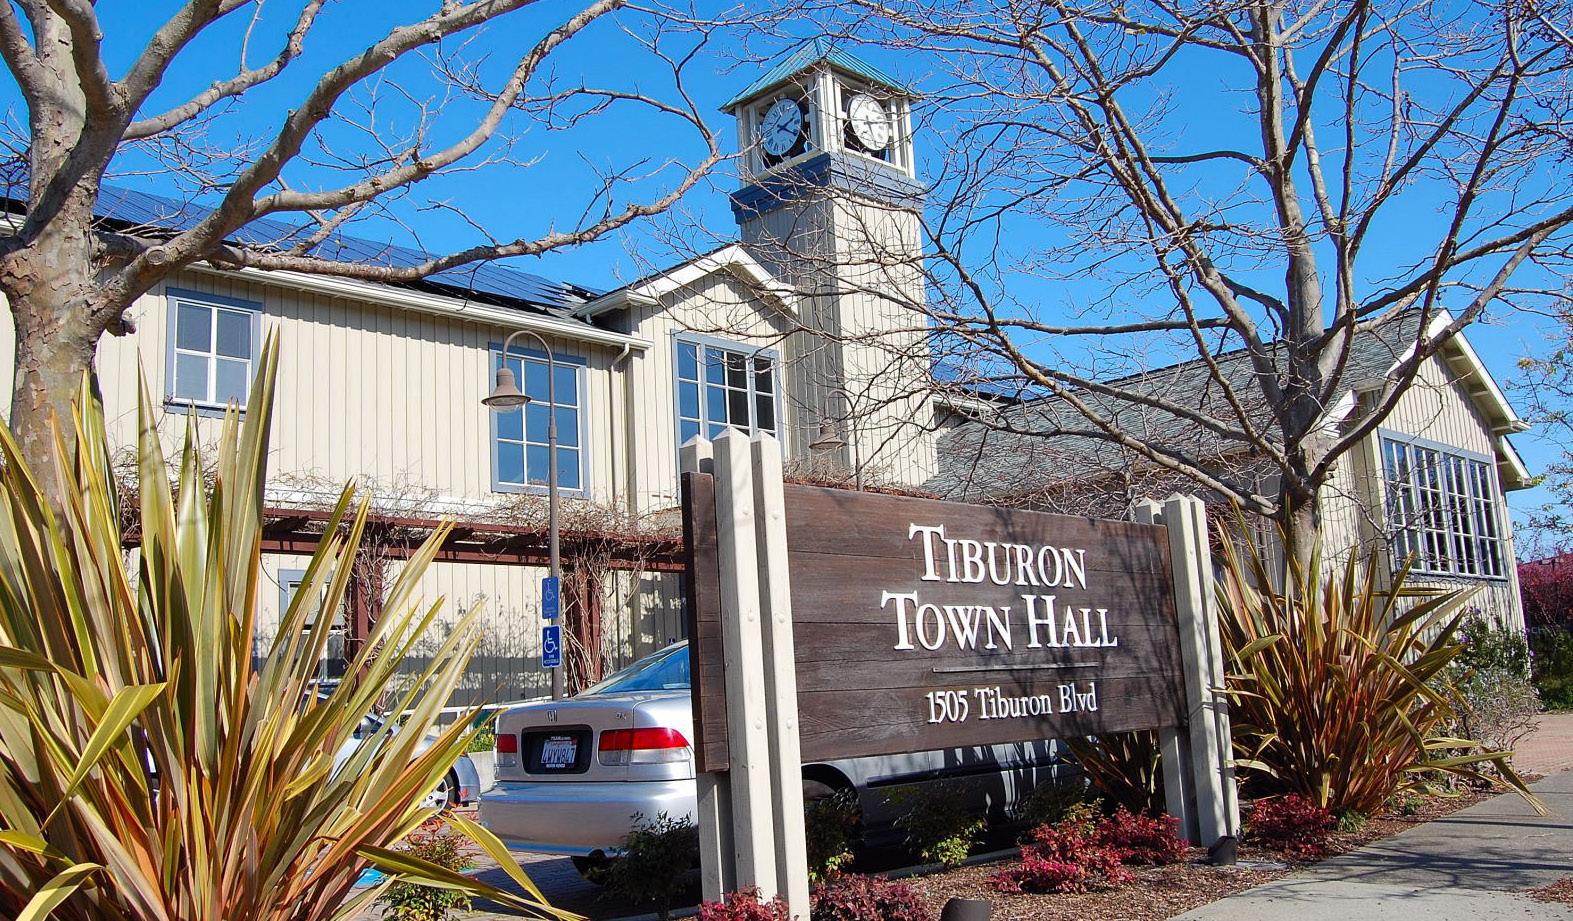
reduced development, laying the foundation for what is now Point Tiburon and the Shoreline Park. Many of the existing commercial buildings along Tiburon Boulevard were built in the 1960s and 1970s, and new development has been slow to occur, with the notable exceptions of the Tiburon Fire Station in 1993, and the Belvedere Tiburon Library and Tiburon Town Hall in 1997. In recent years, a few downtown buildings have been redeveloped, including 1696 Tiburon Boulevard and 5 Main Street, home to two new restaurants, the Petite Left Bank and The Bungalow Kitchen.
Most of the Town’s single family homes were built between 1950 and 1980. The first subdivisions were developed in the flatter areas of Town, including the Bel Aire Gardens, Belveron Gardens, Hawthorne, Del Mar, and Reed subdivisions. Development continued into the hills in the 1960s, and then extended further into the hills from 1970 through 1999 as lots with steeper
topography were developed. Several multifamily developments were also developed at this time. By the beginning of the 2000s, most of the residential land had been developed.
There is now little vacant land left in Tiburon that is not otherwise protected as open space. A handful of vacant residential parcels are scattered throughout the peninsula; these are primarily located in the hills and are challenging to develop due to steep slopes, limited access, ridgelines, trees, woodlands, and wildlife habitat. While there are no vacant commercial parcels in Town, several downtown properties have promising redevelopment potential for mixed uses, providing both needed housing and opportunities to revitalize the Downtown. This potential is explored in greater detail in the Downtown and Housing chapters.
Land in Tiburon is classified according to three broad land use categories: residential areas, commercial areas, and community and natural resource areas.
Residential land use designations are applied to areas appropriate for single-family, two-family, multifamily, manufactured home, and accessory dwelling housing options. The Town’s residential neighborhoods support a range of lifestyles and household income levels.
Mixed-Use and Commercial land use designations are applied to areas appropriate for retail and commercial services to serve residents and visitors and multifamily residential uses mixed in with commercial uses.
Community and Natural Resource land use designations apply to open space, parks, and submerged and partially submerged lands. Natural areas, such as the woodlands,
grasslands, and waterways, offer opportunities for preservation and conservation. Public facilities provide opportunities for social and community interaction and the provision of public utilities and services.
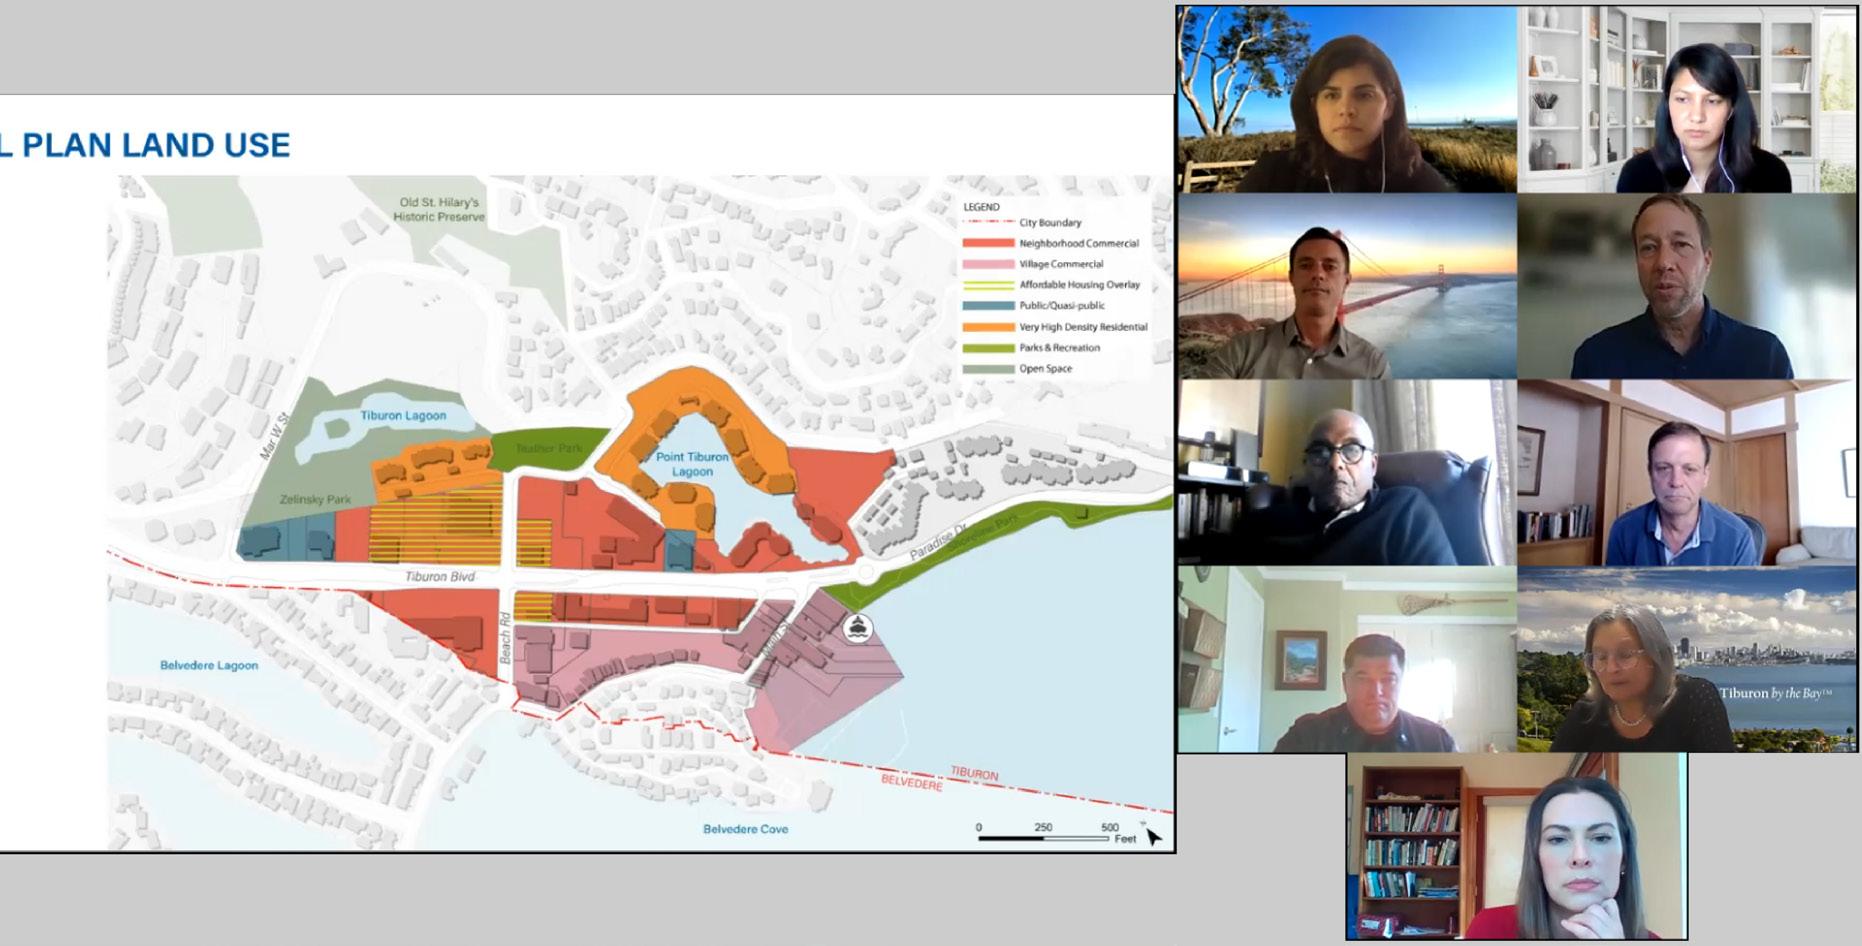
Table LU-1 identifies acreages for each land use designation in the Land Use Map. The greatest amount of land within the Tiburon town limits, excluding submerged and partially submerged land, is designated for residential use, encompassing nearly 51% of Tiburon’s land area. The second largest amount of land is designated for community and natural resource use, including 743 acres for Angel island (designated Public/Quasi Public) and 473 acres for additional open space and parks. Commercial and mixed-use areas comprise only 1 percent of Tiburon’s land area. Figure LU-1 shows the Town’s Land Use Map.
Within each of the land use categories, specific land use designations identify uses and the density and intensity of development allowed in each designation. Density is defined by the number of dwelling units per gross acre, and intensity is defined by the ratio of building square footage to the land area.
Table LU-2 details the Town’s land use designations and describes the general land uses intended for the category and applicable building density and/or intensity. For residential uses, residential density is shown in dwelling units per gross acre. Maximum residential density is calculated based on the gross acreage and then rounded down to the nearest whole number.
In addition to building density, State law requires the General Plan to include a statement of population density for the various land use categories. Population density is determined by multiplying the average household size, as reported by the latest California Department of Finance Population and Housing Estimates for Cities, by the number of dwelling units in a land use category. For example, the average household size in Tiburon was 2.4 persons in 2022. The population
Residential category is therefore up to 7.2 persons per acre.
For non-residential designations, building intensity is defined by Floor Area Ratio (FAR), which is the ratio between the amount of gross floor area and the gross site area. For example, an FAR of 0.5 would allow a one-story building over half of a site, or a two-story building over one quarter of a site. The Zoning Ordinance contains detailed descriptions of land uses permitted in each designation, as well as development standards that implement the General Plan.
Town Of Tiburon
Tiburon Sphere of Influence
Tiburon Planning Area
Assessor Parcel Boundary
Affordable Housing Overlay (AHO)
L - Low Density Residential
ML - Medium Low Density Residential
M - Medium Density Residential
San Francisco Bay
MH - Medium High Density Residential
H - High Density Residential
VH - Very High Density Residential
VH-25 - Very High Density Residential, 25
PD-R - Planned Development Residential
NC - Neighborhood Commercial;
SC - Shopping Commercial
VC - Village Commercial
MU - Mixed Use
MS - Main Street
OS - Open Space
P - Public/Quasi-Public
Park
Marine

to 0.5 dwelling units per acre
The Low Density Residential land use designation is applied to areas suitable for detached single-family homes and related residential uses in low density settings. Other compatible uses may be permitted. PD-R
Up to 1.0 dwelling units per acre – see Table LU-3 for site-specific density limits
Up to 1.1 dwelling units per acre
Open Up to 3.0 dwelling units per acre
Up to 4.4 dwelling units per acre
H High Density Residential R-2 Two-Family Residential Up to 11.6 dwelling units per acre
VH Very High Density Residential
R-3 Multi-Family Residential Up to 12.4 dwelling units per acre
The Planned Development – Residential land use designation is applied to areas that are generally undeveloped or underdeveloped and have natural constraints to development such as steep slopes and environmental resources that warrant site-specific limitations on development intensity.
The Medium Low Density Residential land use designation is applied to areas suitable for detached single-family homes and related residential uses in low density settings. Other compatible uses may be permitted.
The Medium Density Residential land use designation is applied to areas suitable for detached single-family homes and related residential uses in low density settings. Other compatible uses may be permitted.
The Medium High Density Residential land use designation is applied to areas suitable for detached single-family homes and related residential uses in low density settings. Other compatible uses may be permitted.
The High Density Residential land use designation is applied to areas suitable for singlefamily and two-family homes and related residential uses. Other compatible uses may be permitted.
The Very High Density Residential land use designation is applied to areas suitable for residential uses including multifamily dwellings. Other compatible uses may be permitted.
VH-25 Very High Density-25 Residential
R-4 Multi-Family Residential High Up to 25 dwelling units per acre
MU Mixed Use MU Mixed Use Minimum – 30 units per acre
Maximum – 35 units per acre
Maximum FAR is 1.75
The Very High Density-25 Residential land use designation is applied to areas suitable for residential uses including multifamily dwellings at higher densities. Other compatible uses may be permitted.
The Mixed-Use land use designation is applied to commercial areas and intended to encourage development of multifamily dwellings in a pedestrian-oriented setting. Other compatible uses may be allowed.
The Neighborhood Commercial land use designation is applied to neighborhood shopping areas providing for a mix of resident-serving commercial and office uses. Mixed commercial and residential uses may be allowed.
Park Parks and Recreation P Public/QuasiPublic Maximum FAR is 0.1
OS Open Space OS Open Space Maximum FAR is 0.1
Marine Marine M Marine Maximum FAR is 0.0
The Village Commercial land use designation is applied to the Ark Row portion of the downtown area providing for a wide range of resident and tourist-serving commercial uses. Mixed commercial and residential uses may be allowed.
The Main Street land use designation is applied to the downtown area providing for a wide range of resident and tourist-serving commercial uses. Mixed commercial and residential uses may be allowed.
The Public/Quasi-Public land use designation is applied to areas suitable for public land uses including educational facilities, governmental and quasi-public buildings and facilities, and utility facilities
The Parks and Recreation land use designation is applied to areas suitable for parks, playgrounds, and other recreational uses, as well as areas preserved for natural conservation.
The Open Space land use designation is applied to undeveloped areas for the conservation of natural and scenic resources and for limited passive recreation.
The Marine land use designation is applied to all submerged and partially submerged land areas up to the mean high tide line and for water-related recreational activities and facilities including docks and yacht clubs.
à For detailed descriptions of permitted and conditional land uses allowed in each zoning district, refer to Chapter 16 of the Tiburon Municipal Code.
à In addition to the land use districts identified in the table, the following overlay districts may be applied to any General Plan land use designation: Flood Hazard Overlay (F), Affordable Housing Overlay (AHO) and Historic Protection Overlay (HPO).
Development projections for the General Plan are determined by analyzing vacant and underutilized parcels within the Town and the development potential that is allowed under the applicable land use designation. Development projections for residential units and commercial square footage are shown in Table LU-4. These projections are theoretical in nature, as it is unlikely that every parcel in Tiburon will be developed to its maximum potential during the life of the General Plan. Actual future development would depend on market conditions, property owner preferences, site-specific constraints, and other factors.
Manage growth and land use changes to preserve the health, safety, welfare, and natural beauty of the community.
Ensure that new development is sensitive to on-site and surrounding environmental resources and hazards and can be adequately served by public infrastructure.
Address regional issues, such as transportation, infrastructure, housing,
and adaptation to climate change, in coordination with neighboring cities, the county, and other governmental entities.
Allow for a diversity of land uses that provide convenient services to residents and maintain a vital local economy.
Program LU-a Implementation of Land Use Map.
Implement the Land Use Map (Figure LU-1) and associated Land Use Designations (Table LU-2) by approving new development and conservation projects consistent with the adopted land use definitions, densities, and intensities. Ensure consistency between the General Plan, Zoning Ordinance, and other land use regulations.
Use the Zoning Ordinance to specify uses allowed in each zoning district, consistent with Table LU-2.
Allow development at any density or intensity within the range shown by the Land Use Map (Figure LU-1) and Land Use Designations (Table LU-2) provided applicable objectives, policies, and programs of all chapters of the General Plan are met.
Revise the Zoning Map and the Municipal Code to reflect the goals, policies, densities, intensities, and land use designations of the General Plan.
Assure that sewer, water, and other essential infrastructure improvements must be available to the developer to serve new development by the time of completion of construction and that anticipated traffic levels are consistent with adopted Vehicle Miles Traveled (VMT) standards. New development shall pay its fair share of essential expanded infrastructure to the maximum extent allowed by law.
Analyze project impacts on infrastructure capacity and services as part of CEQA review and require mitigation measures as needed in consultation with provider agencies.
Periodically review and update public facilities impact fees to assure that new development pays its fair share of public infrastructure and service costs.
Program LU-g Public Infrastructure Planning.
Coordinate growth projections and infrastructure planning with urban service providers such as Marin Municipal Water District and the sanitary districts to ensure sufficient capacity to serve existing and future development.
Require the undergrounding of all utilities in new developments. Assist existing property owners who wish to establish local undergrounding districts.
Identify priority locations for the use of Rule 20A undergrounding funds.
Encourage the connection of new development to the sanitary sewer system. Where a septic or on-site sewage system is proposed, a soils investigation shall determine that on-site soil conditions are suitable for drainage and will not cause slope instability. All new or improved septic systems shall be designed by a registered civil engineer that specializes in septic design.
Accommodate wireless communications facilities to provide high speed data and communication services to
residents and businesses but encourage the location of new facilities in areas other than protected open space and residential neighborhoods and minimize adverse visual impacts of antennas and appurtenant facilities through architectural and landscape screening and colocation on utility poles.
Adopt zoning regulations and administrative procedures to address wireless telecommunication facilities consistent with federal law which prioritize locations outside of protected open space and residential neighborhoods and encourage colocation of facilities on poles and towers or architecturally screened on existing buildings.
Maintain and enhance the residential character of neighborhoods. Require that new development, remodels, and additions be of a scale, intensity and design that integrates with the immediate neighborhood and natural surroundings.
Program LU-j Residential Hillside Design Guidelines. Update the Design Guidelines for Hillside Dwellings to create more objective standards that meet the requirements of State law but achieve the desired scale and design character that is compatible with existing neighborhoods.
Minimize the reduction of views, privacy, and solar access for neighboring properties. Locate and limit the height of new development and associated landscaping to interfere minimally with existing primary views.
Allow outdoor lighting for safety purposes but limit excessive light spillover and glare.
Review all development proposals and infrastructure projects in accordance with the Town’s Lighting Ordinance to minimize off-site and night sky impacts of outdoor lighting.
Encourage the addition of underrepresented and local-serving retail and service businesses to enhance shopping and service opportunities.
Encourage and support tourist facilities while regulating activities to preserve convenient access to commercial services, harbors, shorelines, local transportation, and parking.
Encourage mixed-use development (combining housing and commercial uses) in Downtown and along Tiburon Boulevard to create opportunities for pedestrian-oriented lifestyles.
Consider annexation and prezoning proposals which materially enhance the community, further the goals and policies of the General Plan, eliminate areas of unincorporated islands in the interest of the orderly provision of government services, are supported by residents, and where the costs of providing public services and infrastructure are fiscally responsible for the Town and do not adversely affect levels of service for existing Town residents.
Work collaboratively with the Marin Local Agency Formation Commission (LAFCO) to concurrently process annexation requests with development applications by the Town and to implement LAFCO’s Dual Annexation Policy. Where immediate annexation
is not appropriate, seek to obtain future annexation agreements.
Support implementation of LAFCO’s Dual Annexation Policy which calls for concurrent or subsequent annexation to the Town of unincorporated land located within the Sphere of Influence in conjunction with annexation to special districts that provide services necessary for urban development.
Consider use of overlay zones or other zoning techniques to ensure that prezoning and annexation of existing established neighborhoods do not result in excessive creation of non-conforming structures, nor unreasonably disrupt the existing pattern of development of such a neighborhood.
Coordinate the Town’s land use and zoning plans with the County of Marin, Strawberry Community, the City of Belvedere, Town of Corte Madera, LAFCO, and other agencies and jurisdictions to provide for more effective comprehensive planning.
Encourage LAFCO to update and to regularly review and update annexation policies for the Tiburon Planning Area that are consistent with General Plan policies.
Work with the County of Marin to approve projects within the Tiburon Sphere of Influence that are consistent
with the Town’s policies and compatible with nearby land uses in Tiburon.
Encourage and support the State in the management of Angel Island State Park to protect the natural character and preserve the historic resources of the island.
Recognize the importance of arts and cultural activities that express the value of diversity, inclusion, and equality in all activities, exhibits, and performances. Increase opportunities, accessibility for, collaboration with, and participation of all people.
Promote inclusion of public art projects in new development projects. Consider
adoption of an ordinance requiring incorporation of public art in new projects with provision of an in-lieu fee.
Program LU-r
Environment. Initiate plans for activities and public art projects that enhance the beauty of the Town. Identify, designate, and utilize available spaces in public parks, commercial areas, and/or private spaces for art. Art projects may be temporary or permanent installations using traditional techniques and/or new technologies in the arts to provide various engaging artistic and cultural experiences.
Program LU-s
Support art education in schools and educational programs for lifelong learning. Involve and cooperate with other learning institutions and organizations.
Consider funding mechanisms to support art and cultural programs such as an in-lieu art fee for new developments, inclusion in the Town’s budget and partnerships with businesses, artists and art organizations and philanthropic sectors.
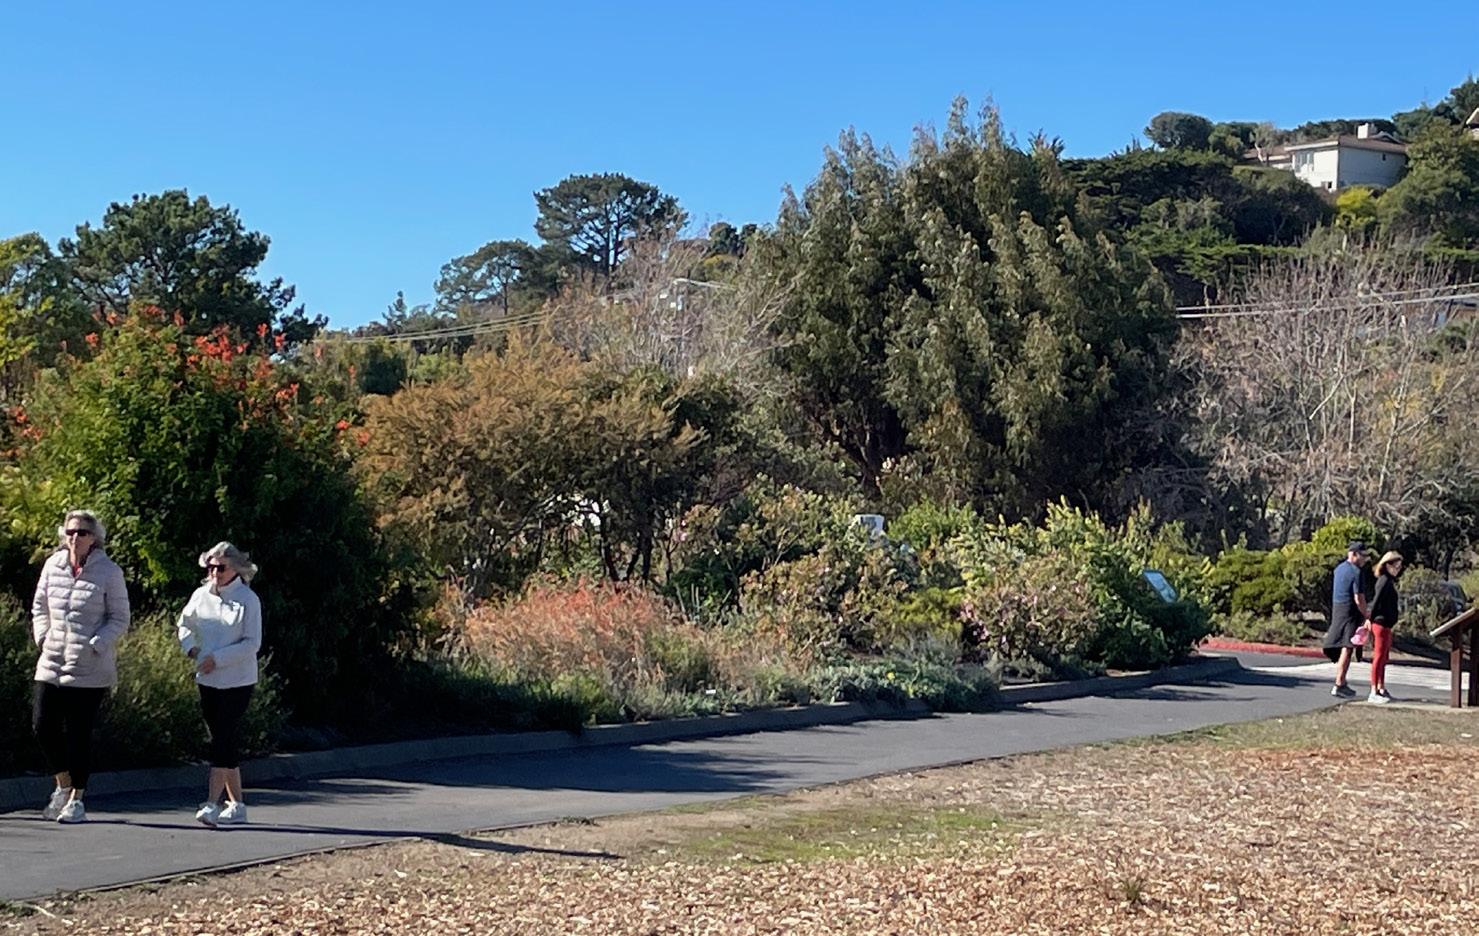
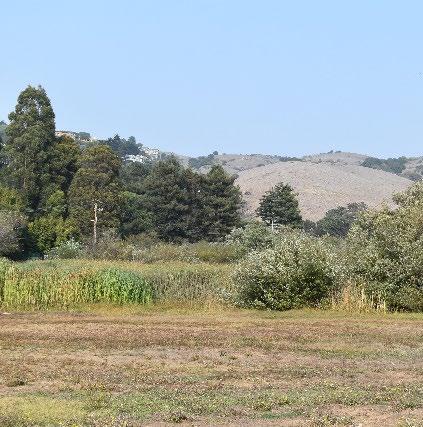
Existing development along Blackie’s Pasture

The Downtown chapter serves as a shared vision of Downtown Tiburon’s challenges and its potential. The chapter provides concise statements that frame key considerations and concerns. It considers Tiburon’s geography, history, built character, circulation patterns, and role as a commercial, cultural, and recreational destination. The Downtown chapter includes the following sections.
The chapter begins by describing Downtown’s geographic setting and historic development, the distinct subareas within Downtown, and an introduction to key issues: historic resources, circulation, shoreline access and views, and vulnerability to sea level rise.
The setting is followed by a presentation of the vision for a better Downtown, developed through community engagement in the planning process. Downtown is envisioned as a center of community life, a walkable district, a place resilient to environmental and economic change, and a great neighborhood with a connection to its past.
The chapter’s goals express aspirations for Downtown. Each goal is accompanied by policies that articulate strategic objectives and programs for implementation.
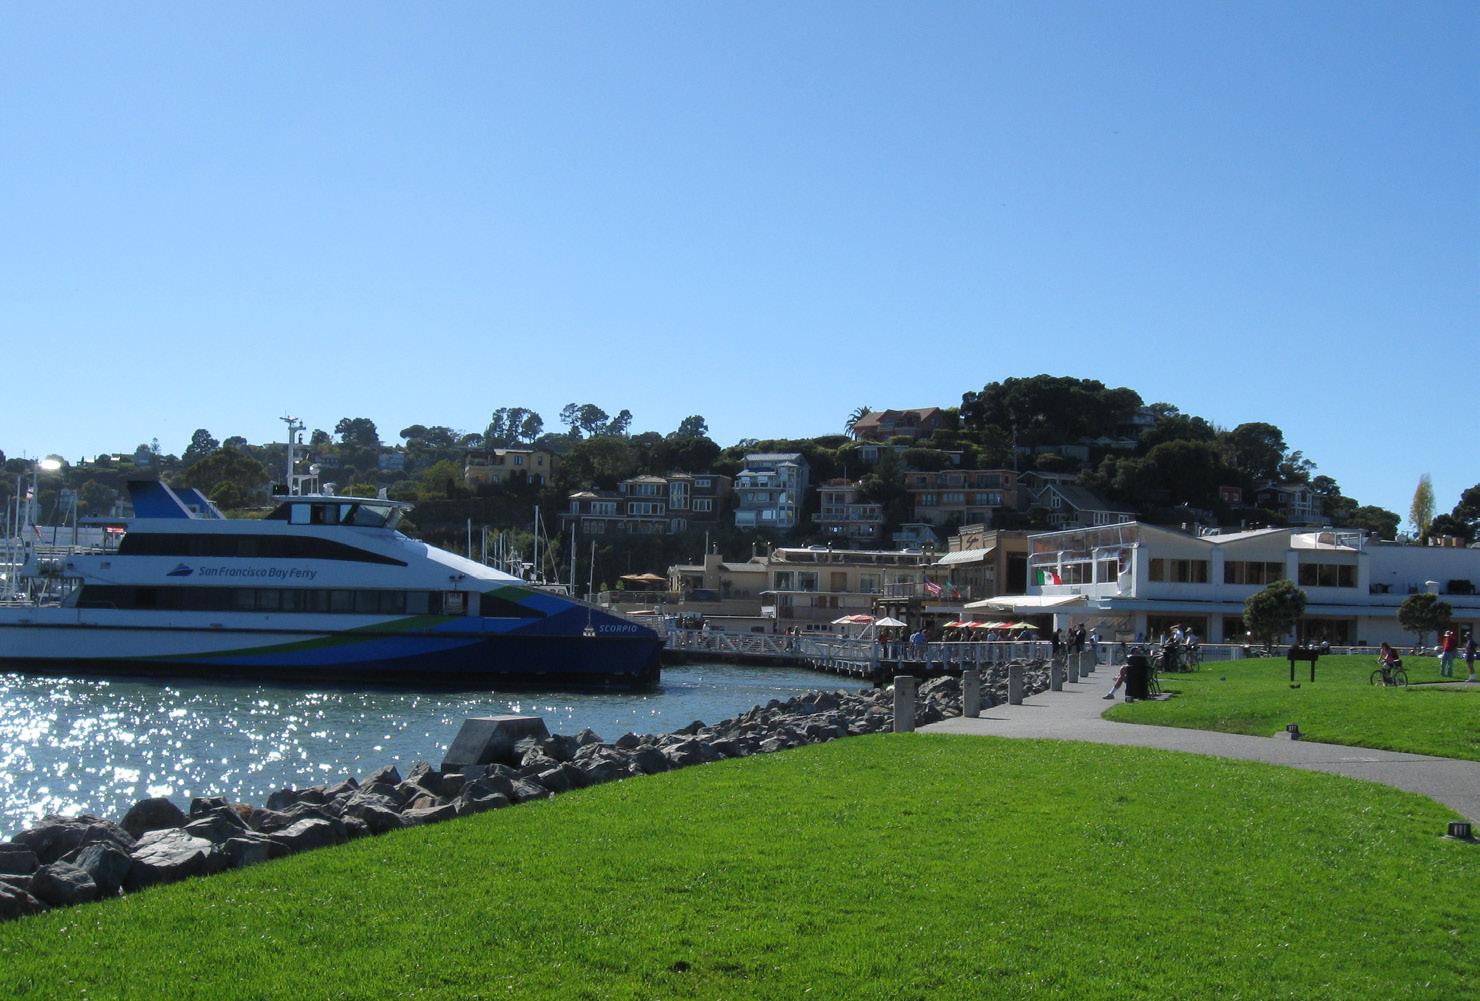
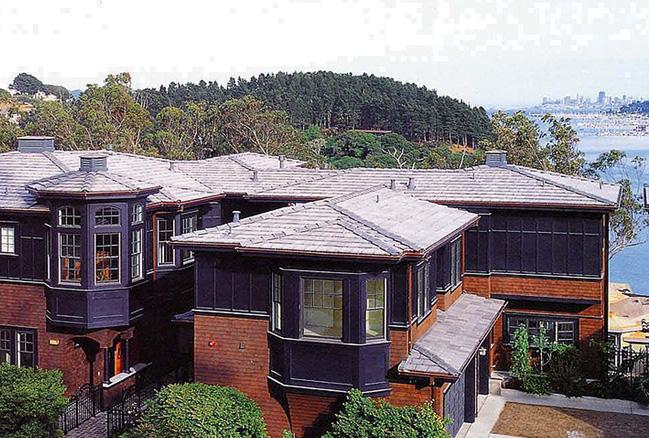
Downtown is the heart of Tiburon, where people enjoy community life and charm in an extraordinary locale connected to San Francisco Bay and rooted in history. It is a place of culture, commerce, and civic engagement. Downtown is where residents, visitors, and workers come for enjoyment and to meet daily needs. It offers diverse eateries, markets, shops, services, and community activities. Ferry service connects Tiburon’s center with San Francisco and Angel Island State Park.
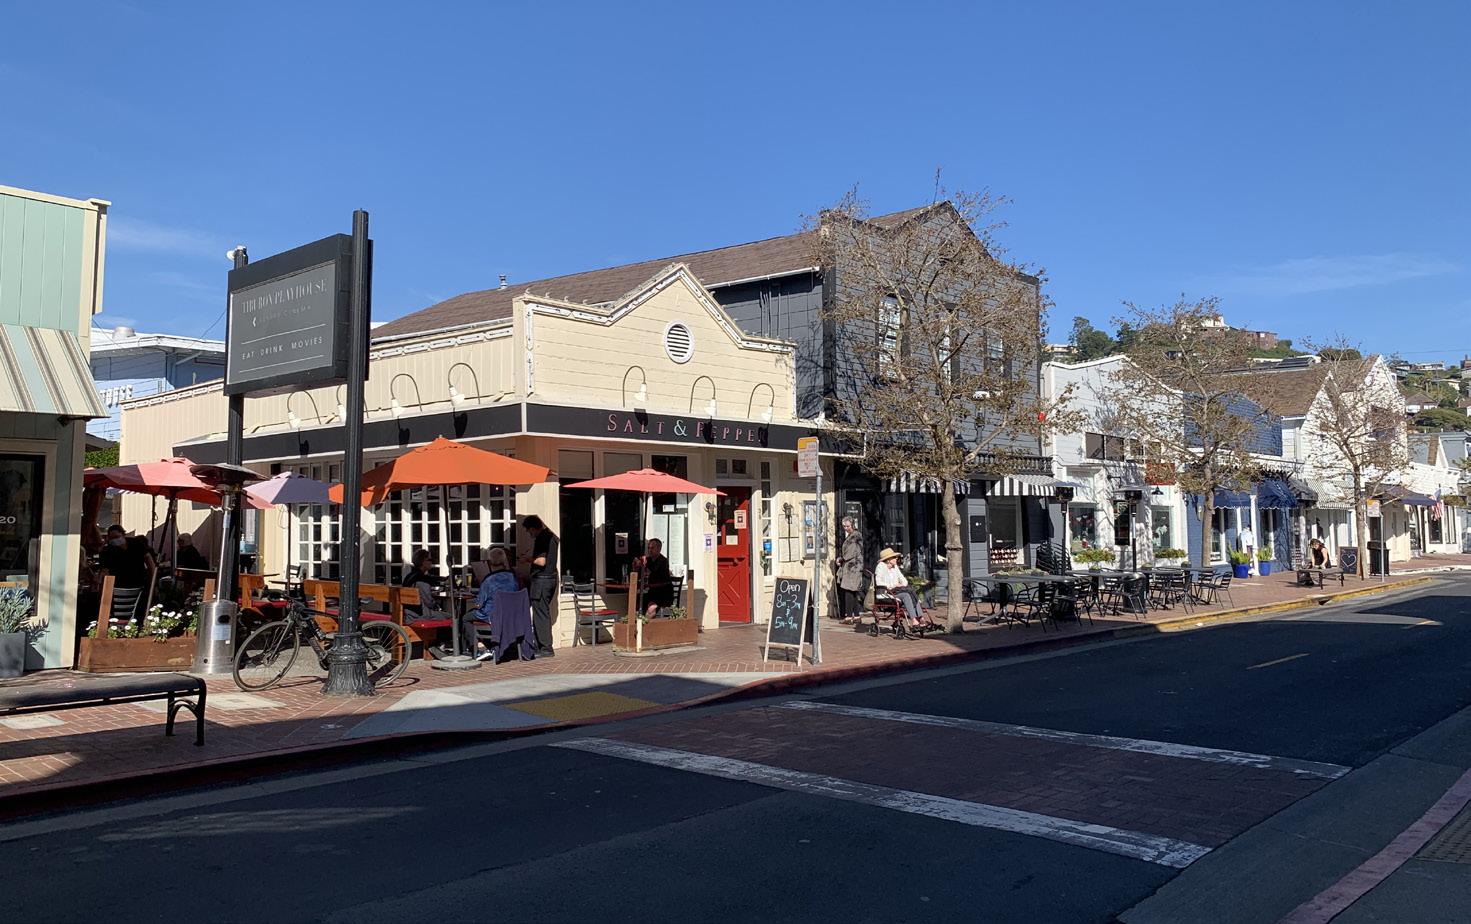
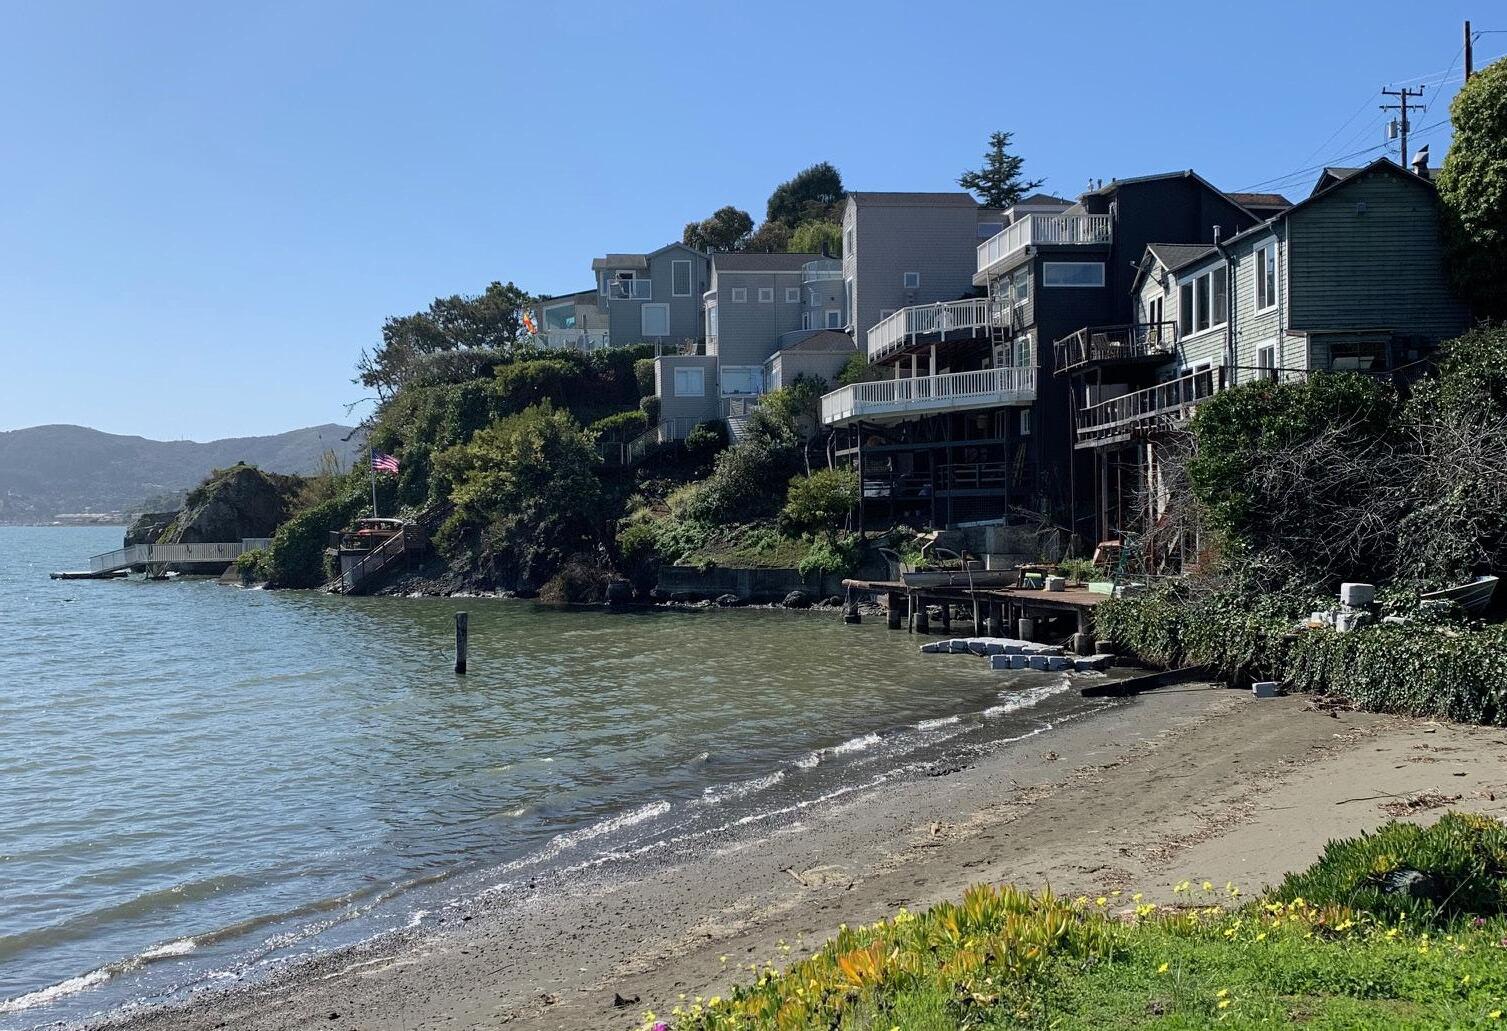
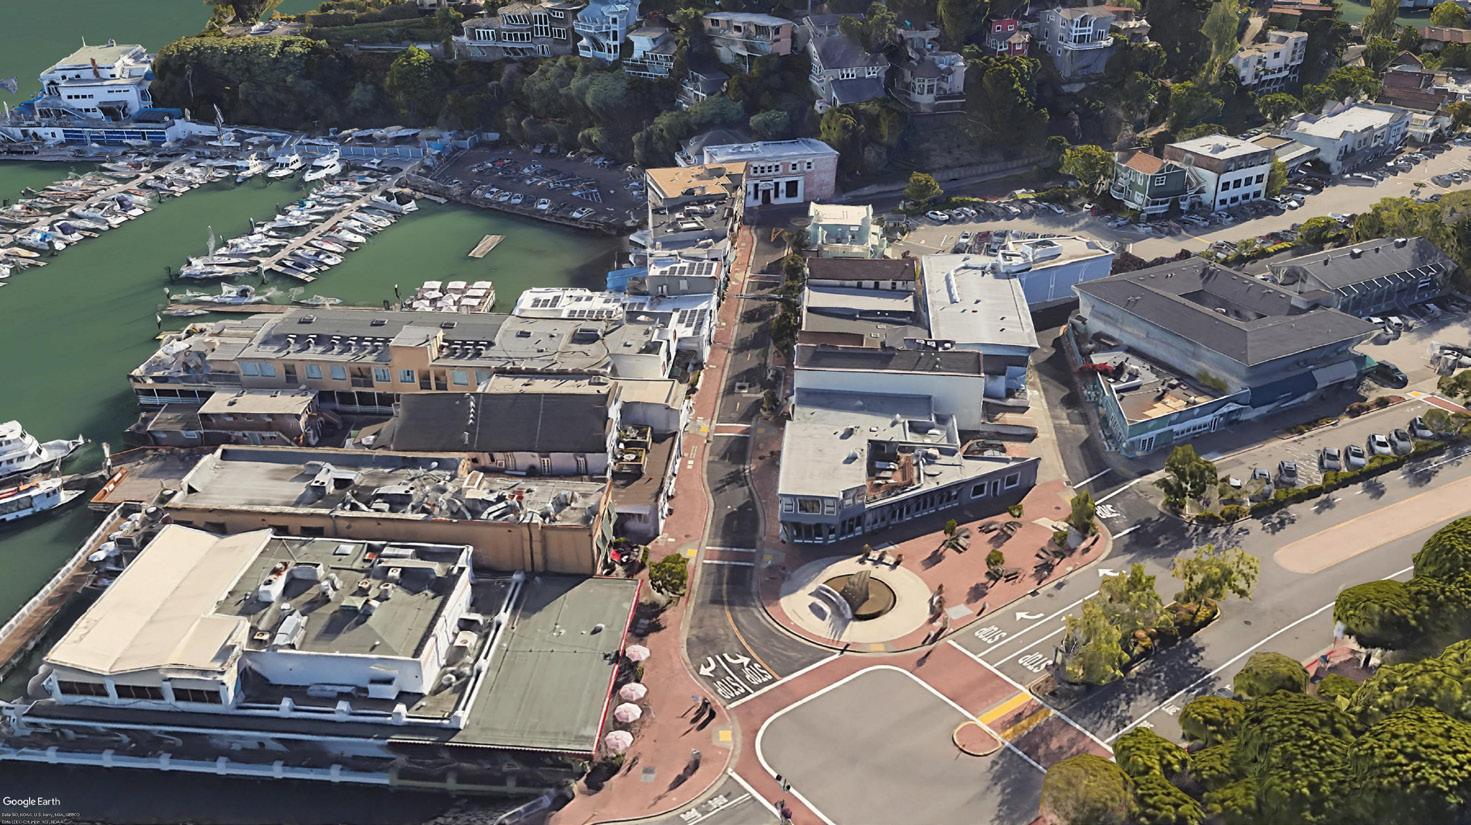
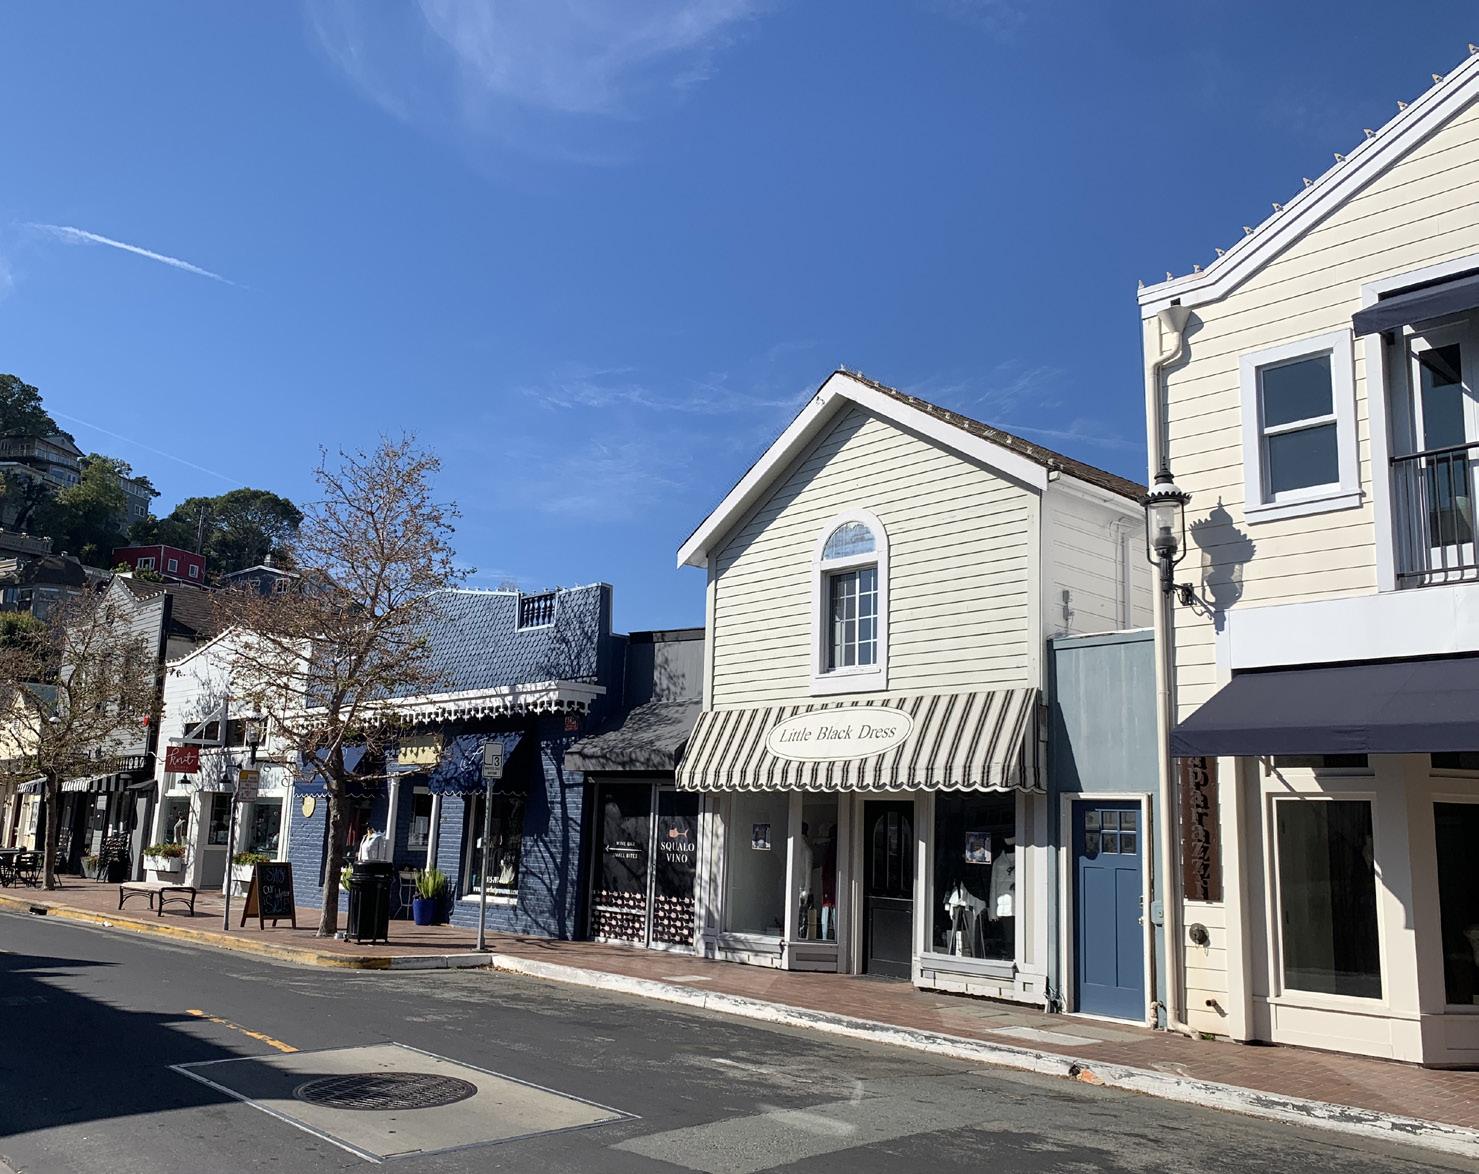
Downtown Tiburon is a set of connected yet distinct places. Tiburon’s history as a compact harbor town is most evident along Main Street, where buildings on the south side of the street edge San Francisco Bay. In this historic core, commercial activity brought buildings close together and created an intimate outdoor room that continues to frame daily activity. To the west, Ark Row’s unique, small-scale buildings extend the village-like character along the base of Corinthian Hill.
Tiburon Boulevard leads into Downtown from the northwest, a wide arterial with an auto-oriented development pattern, with buildings set back from the street behind parking and landscaped areas. This part of downtown now offers an opportunity for pedestrian-oriented infill development. This is a principal consideration of the General Plan.
Downtown also includes Shoreline Park, where expansive views across the Bay give Tiburon a strong sense of place in the region. Finally, Point Tiburon is a distinct, more contemporary district with residential and office buildings around a landscaped lake.
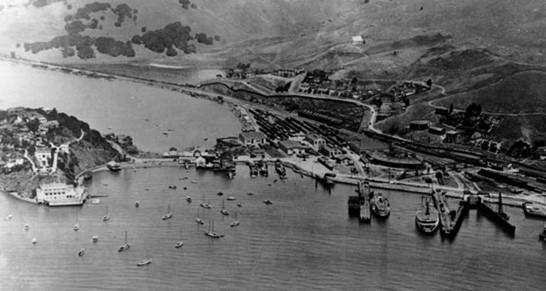
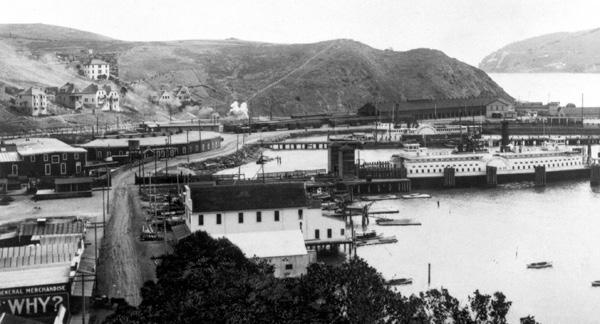
Downtown is situated where deep water in Belvedere Cove touches the southeast tip of the Tiburon Peninsula, thus connecting the Bay with the interior of Marin County. The San Francisco
and North Pacific Railroad terminated at what is now the Tiburon Railroad & Ferry Depot Museum. Goods that arrived on barges were loaded onto to rail cars and shipped inland; Marin’s agricultural and natural resources were moved in the opposite direction.1
Downtown Tiburon emerged at the water’s edge adjacent to the Depot and ferry terminal. Along Main Street, businesses provided materials and supplies for the needs of the port and railroad, workers, residents, and travelers. This bustling point of commercial convergence offered dry goods, liveries, taverns, eateries, and entertainment.
Tiburon Boulevard was developed in 1930, establishing auto access to Tiburon from the north; Golden Gate Bridge was completed in 1937, extending that access to San Francisco. Passenger ferry service from the Depot ended in 1941. (Ferry service was resumed later, in the 1960s, from its current location.)
Northwest of Tiburon’s historic core, land remained sparsely developed into the 1950s, when a growing system of freeways made Tiburon attractive to developers. Along Tiburon Boulevard, the Boardwalk shopping center and a variety of small office and commercial buildings were built.
Beginning in 1971, train tracks and the railyard were removed, ending the era of freight and barge shipping in Tiburon and opening up land for what came to be the Point Tiburon development and Shoreline Park. In 1997, Tiburon’s Town Hall and Library opened. Since the beginning of the 21st century, a small number of new buildings have been added along Main Street and lower Tiburon Boulevard, including a small hotel and mixed-use development with shops below and residential above.
1Tiburon 2020, Town of Tiburon General Plan, 2005.
Looking northeast down Main Street, with Tiburon’s wharf coming to the edge of Main Street and the railroad and railroad depot in the distance.
Source: Belvedere-Tiburon Landmark Society
Downtown Tiburon was connected to Corinthian Island by a narrow isthmus, with a lagoon beyond. The railroad terminated at a depot at the waterfront.
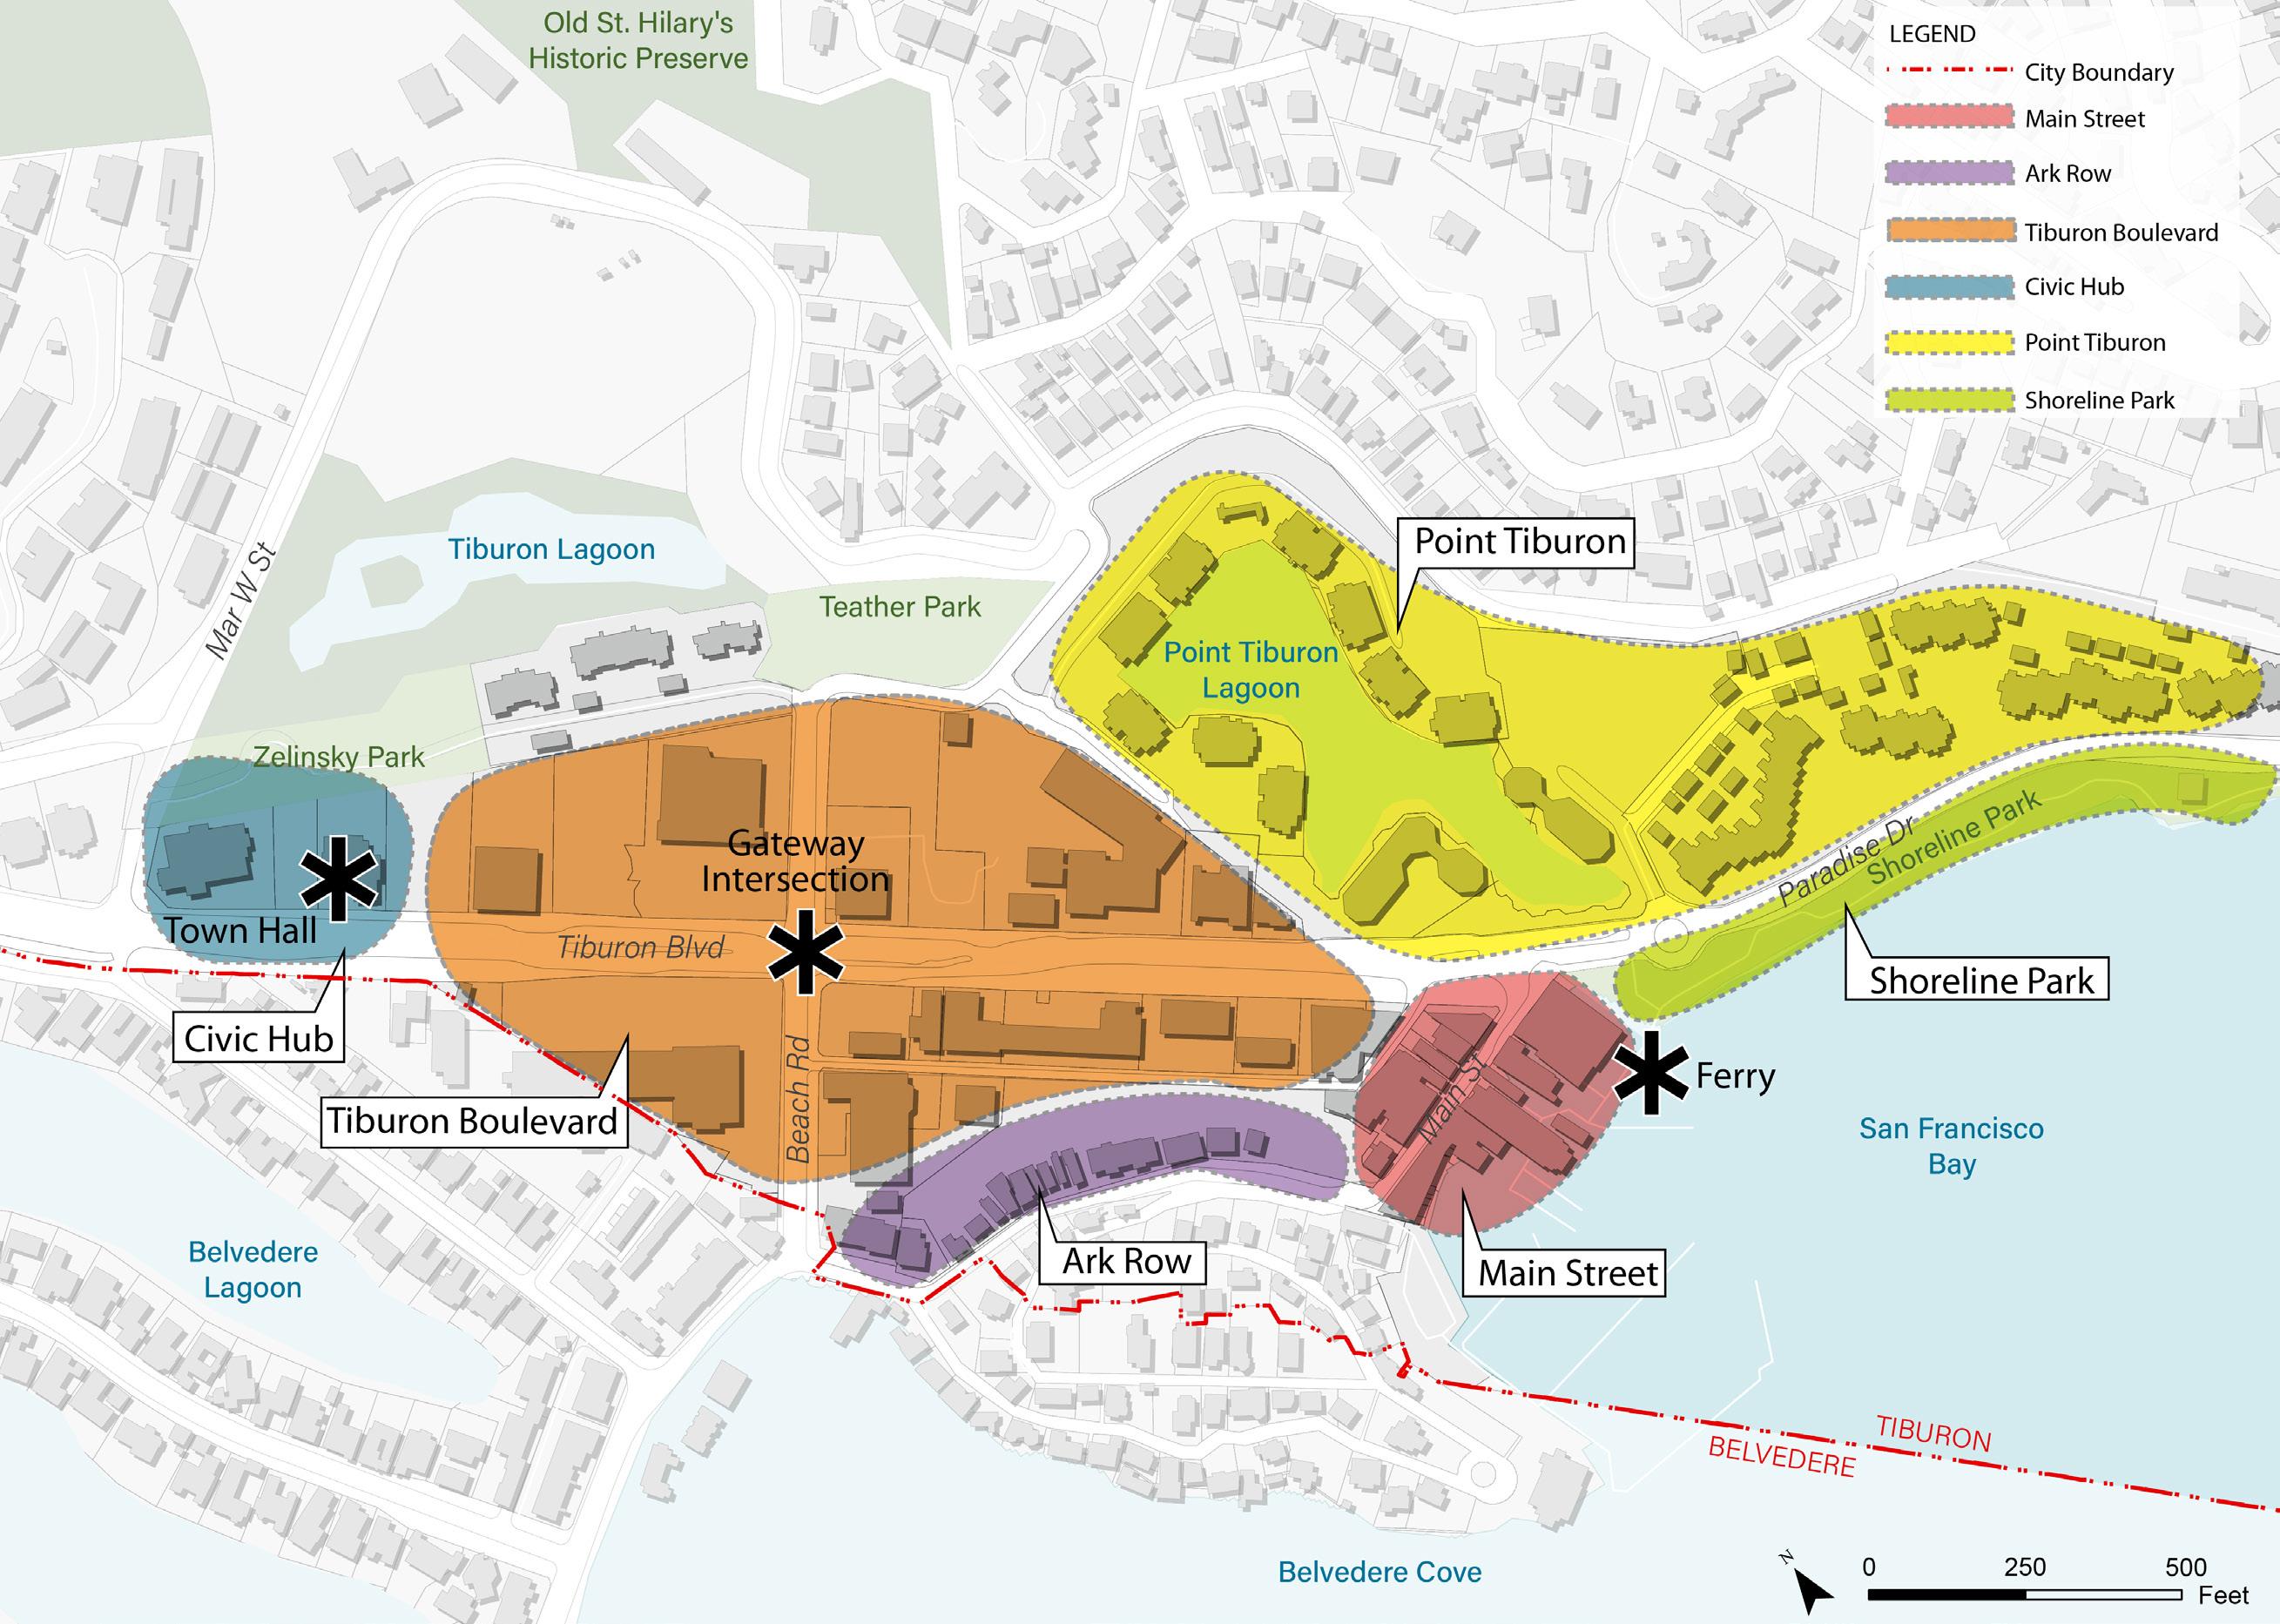
Downtown Tiburon has six distinct subareas, each defined by its unique character. The General Plan will seek to preserve these distinctions and allow the character areas to evolve in a way that makes each better.
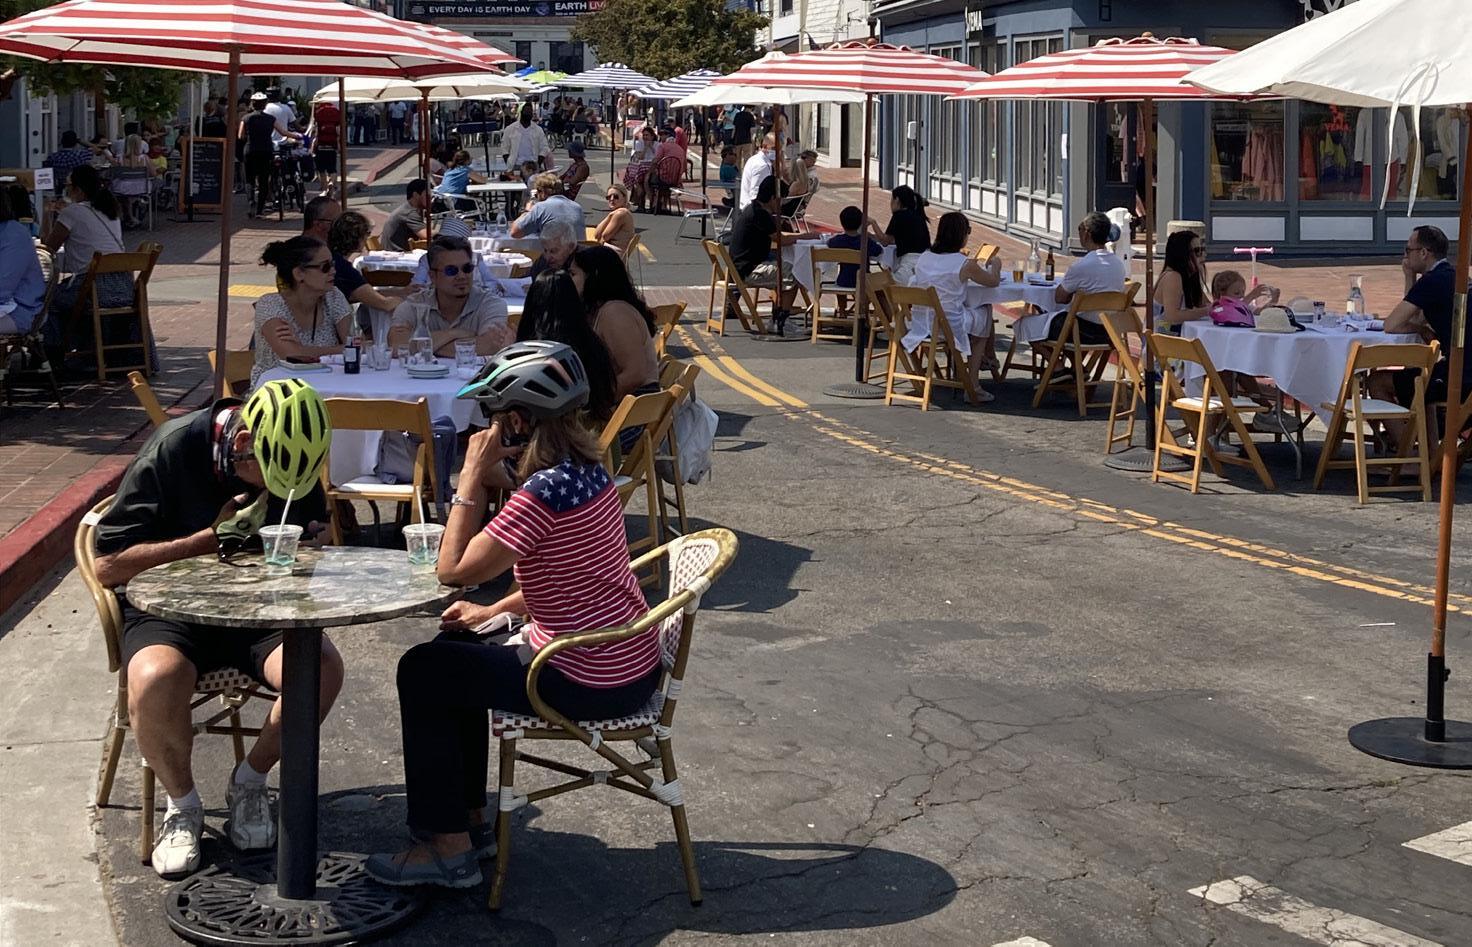
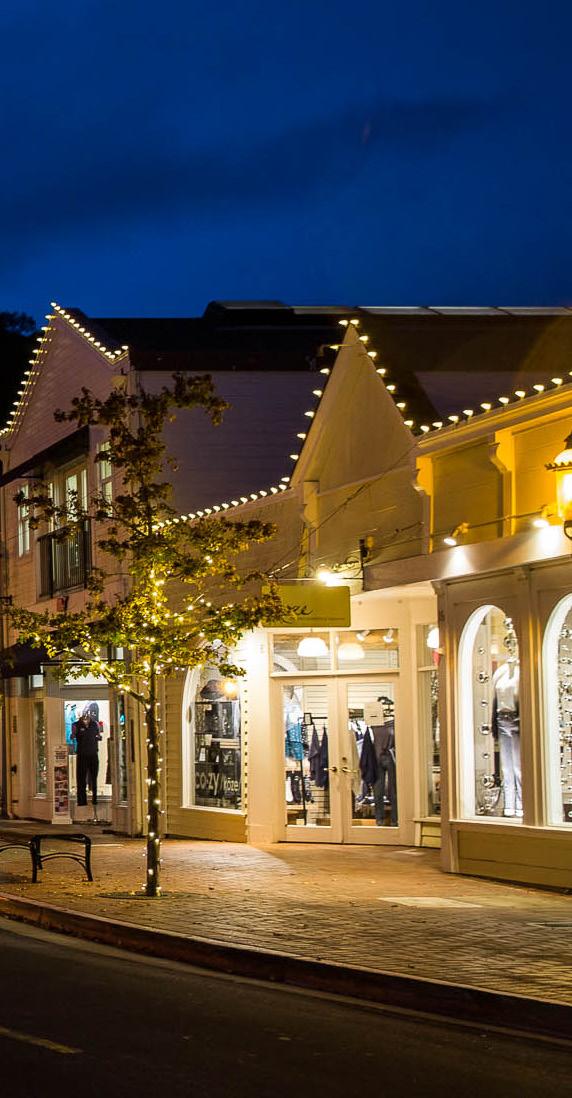
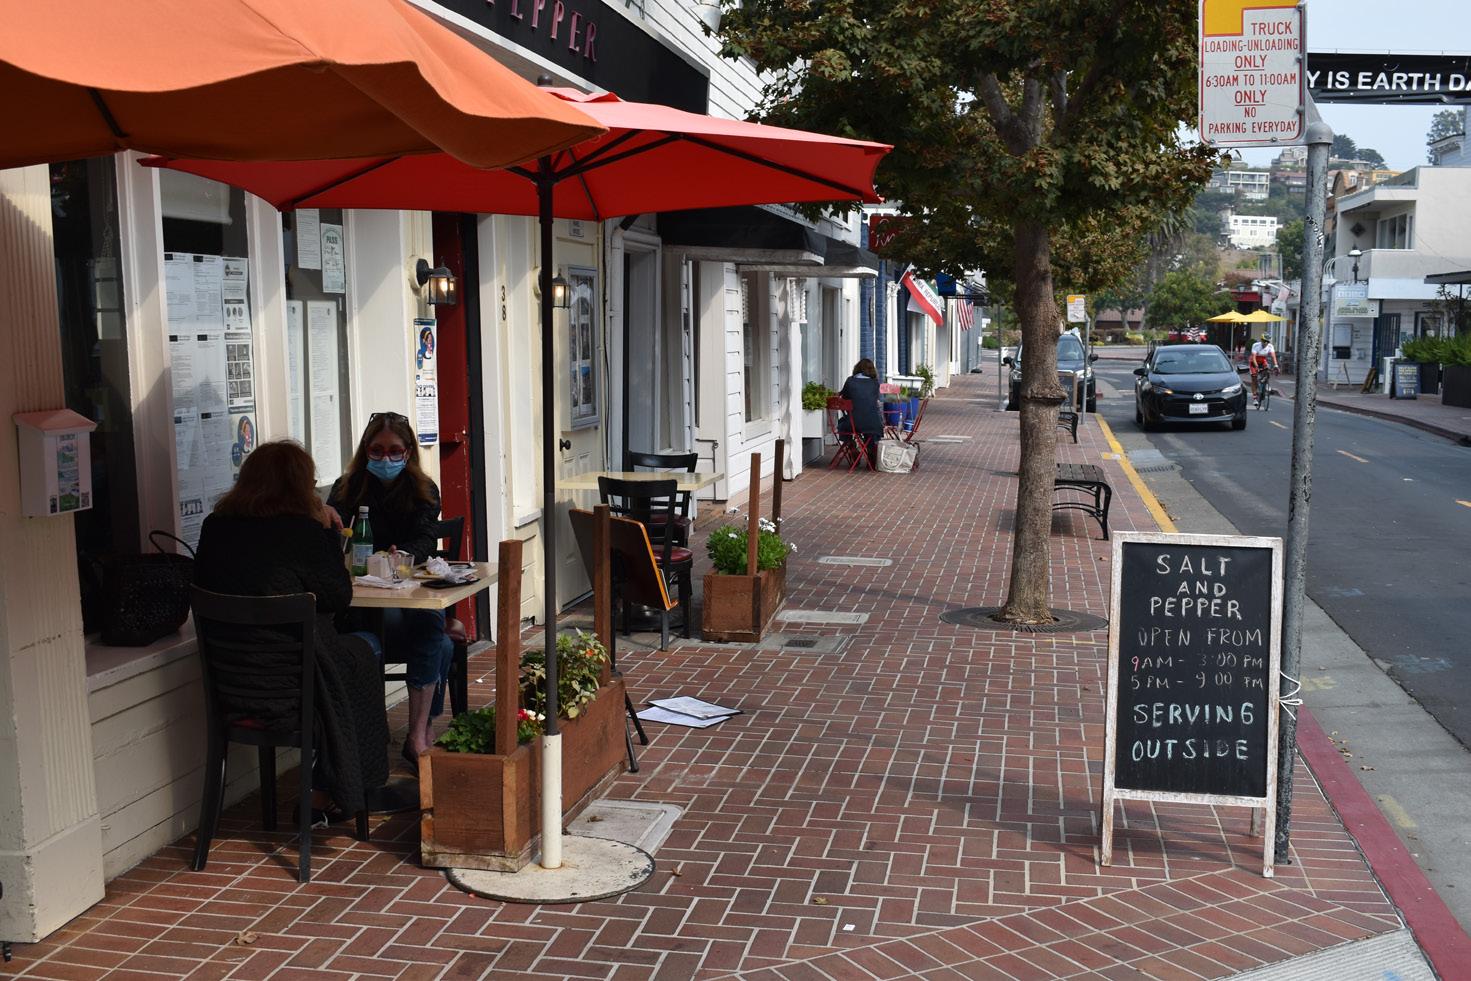
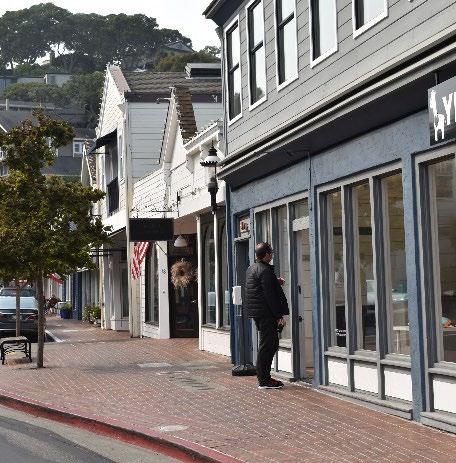
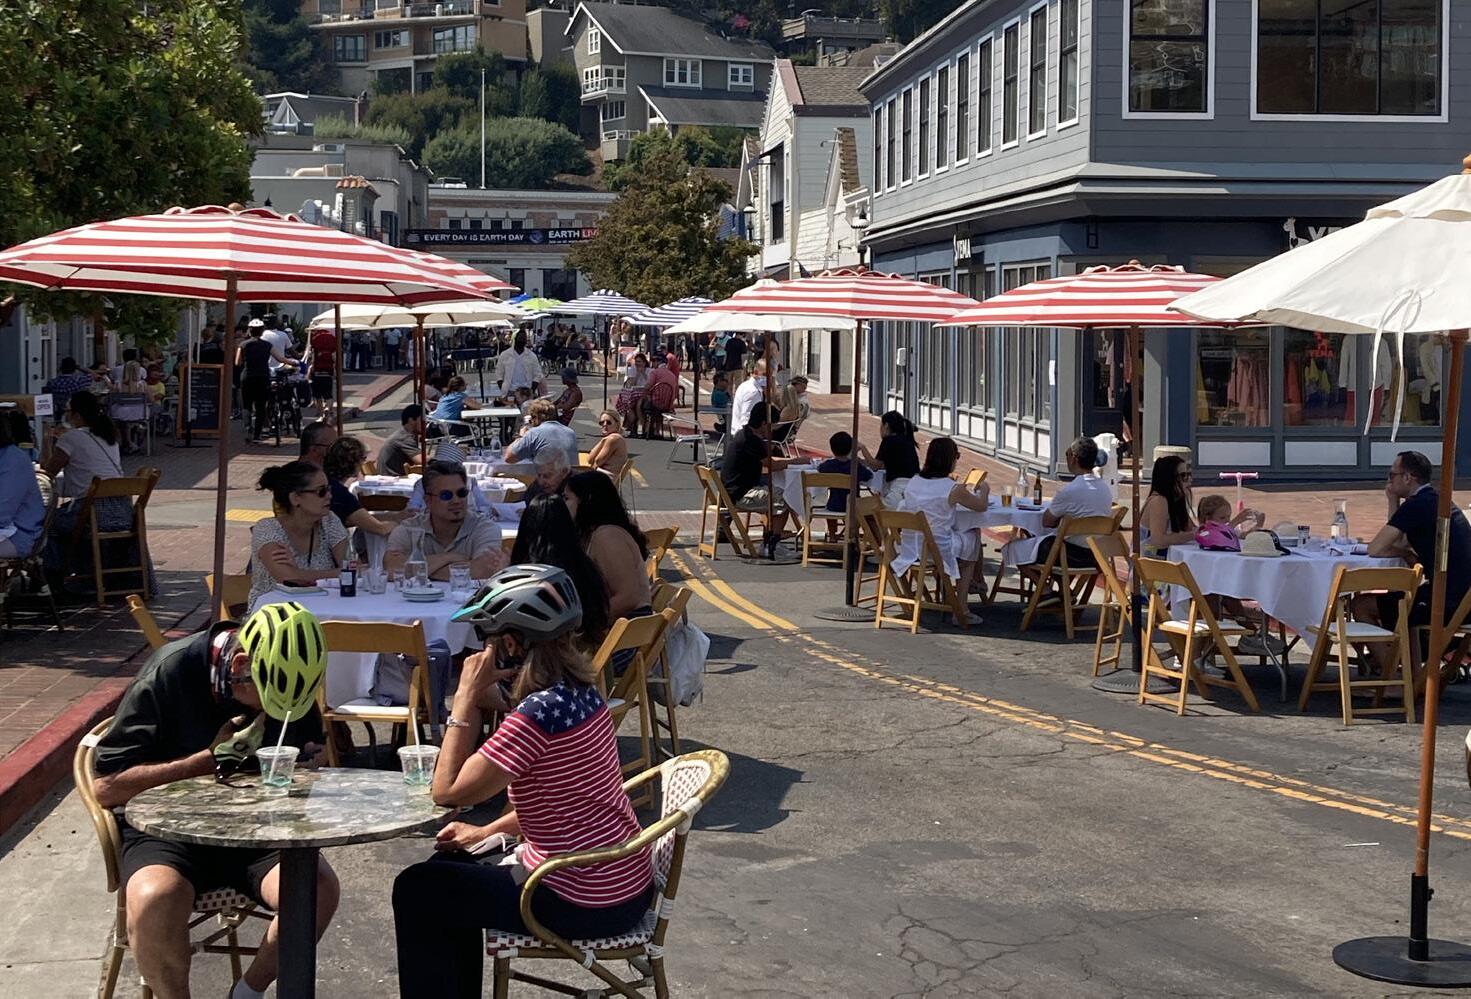
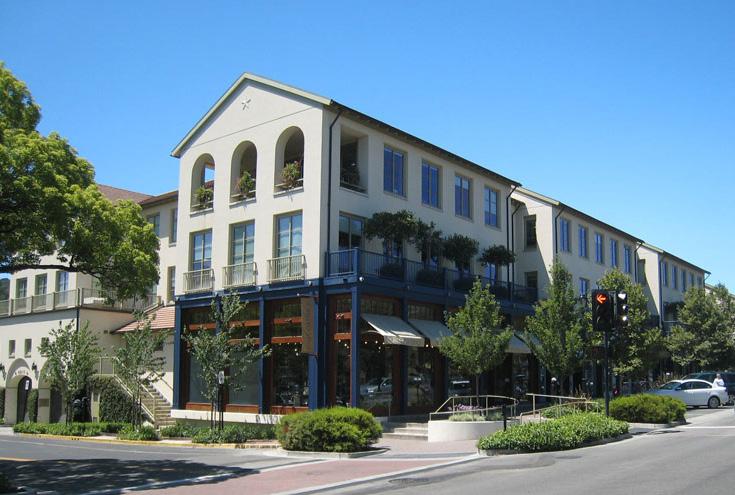
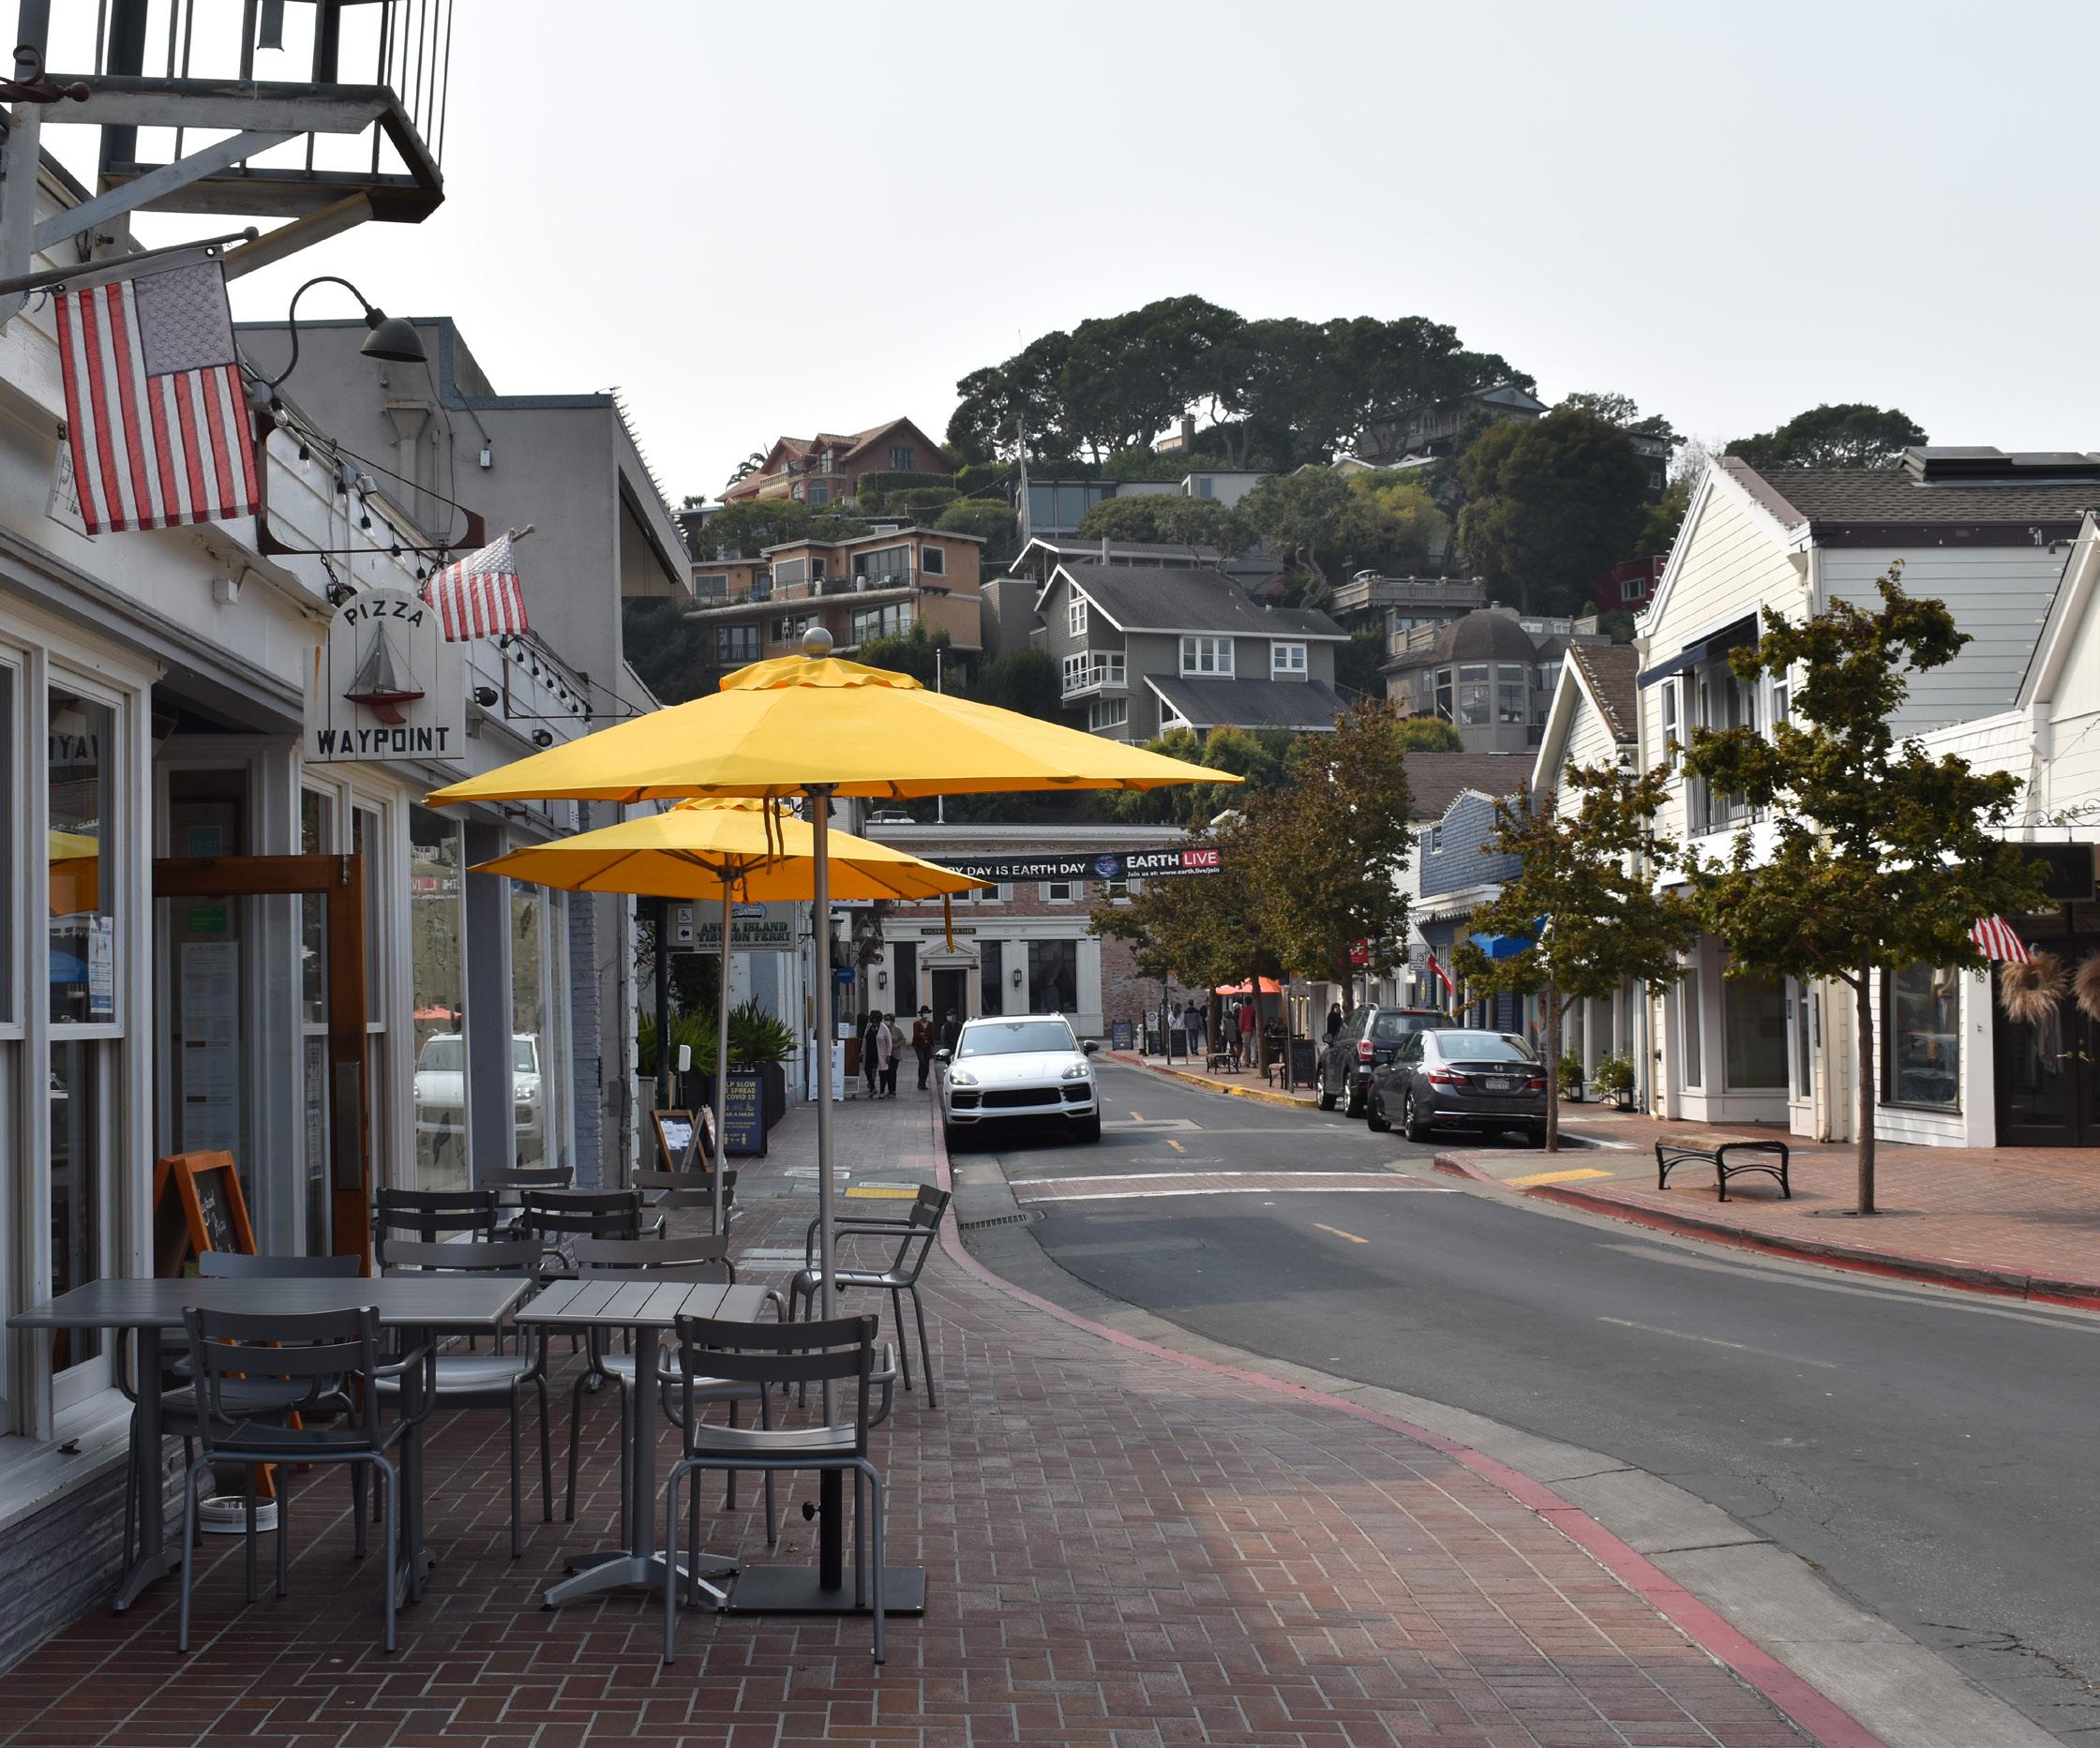
Main Street is framed by older one- to three-story buildings, many of them now considered historic, that put shops and commercial spaces immediately adjacent to the street. Main Street has a traditional urban fabric and human scale. Because Main Street is narrow, traffic moves slowly and pedestrians feel at ease. Small storefronts and generous display windows and amenities create visual interest. In recent years, the Town has closed Main Street to traffic on Friday nights, allowing locals and visitors to enjoy outdoor dining, music, and community life.
Recent construction in Downtown Tiburon has maintained Main Street’s historic scale and character (Above).
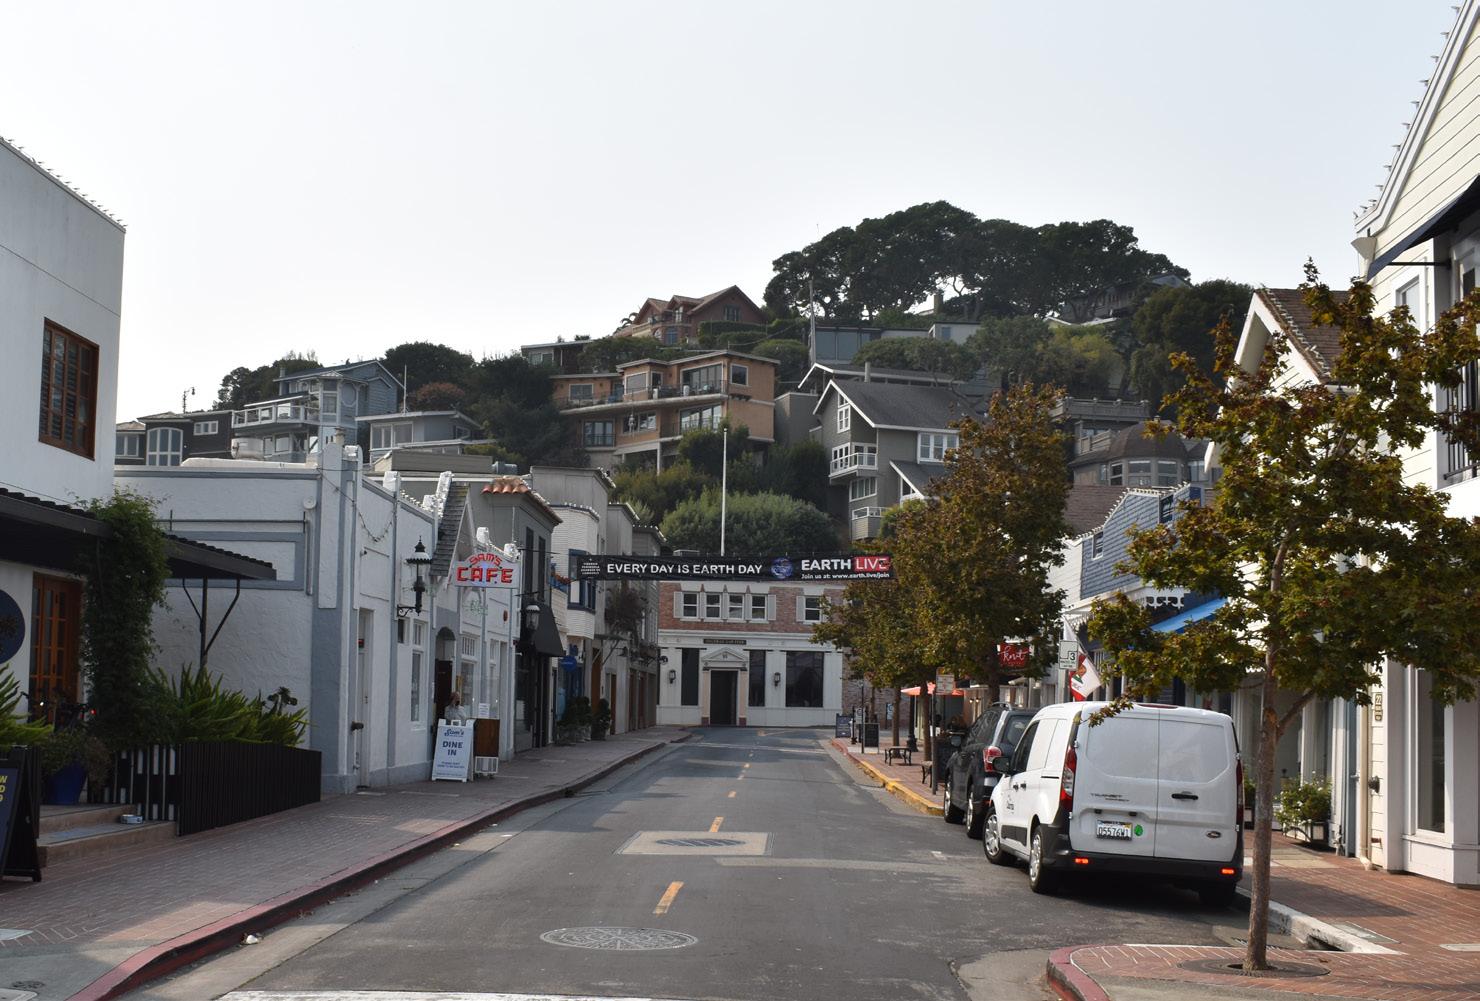
An older building is at left and more recent construction at right (Below).
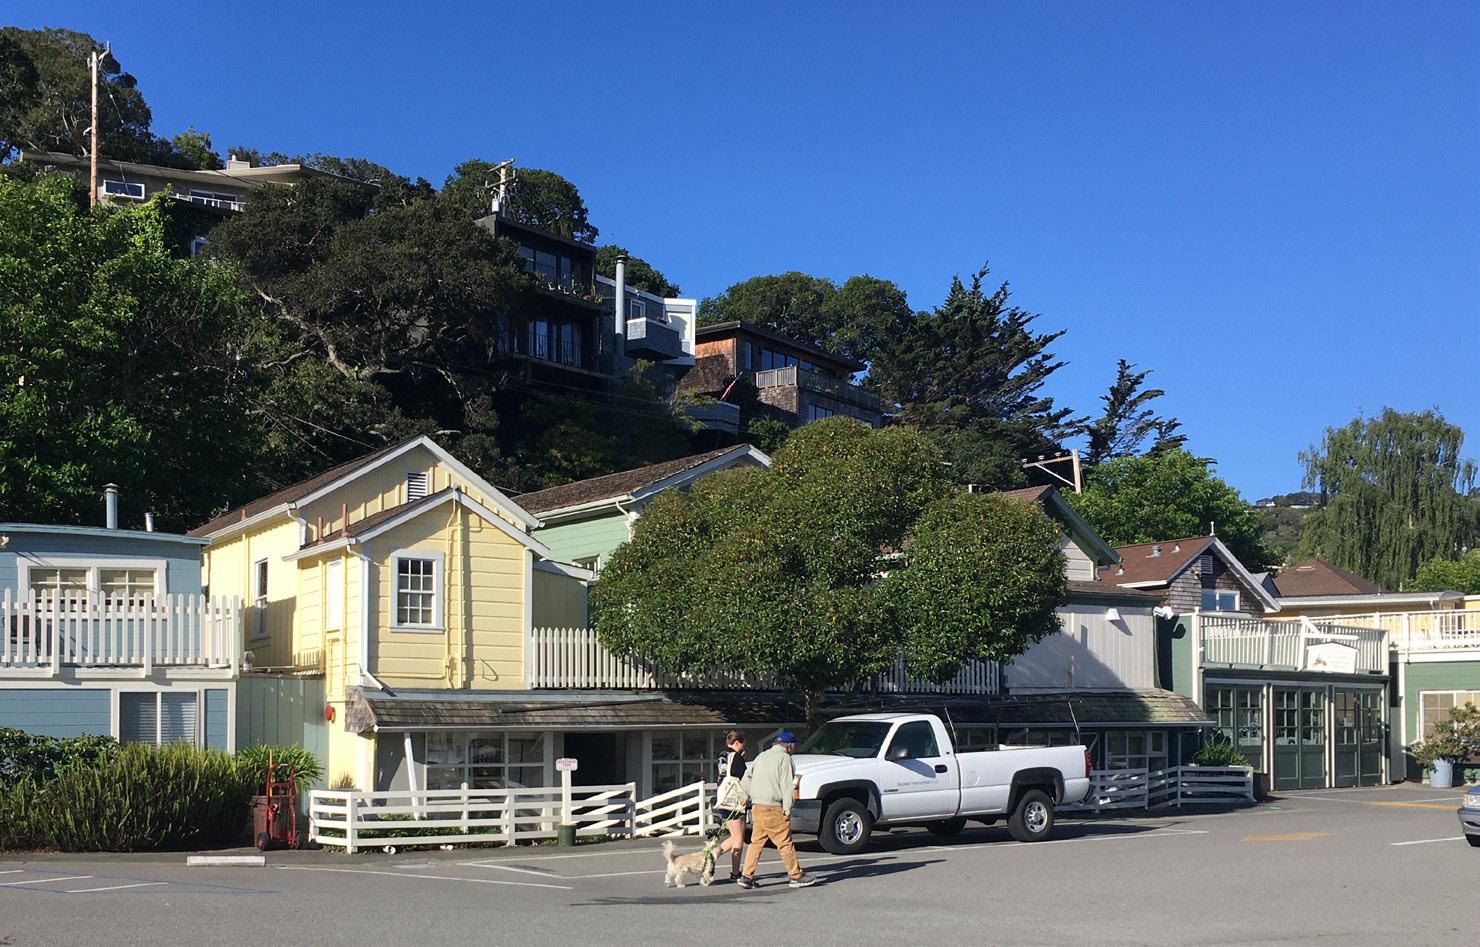
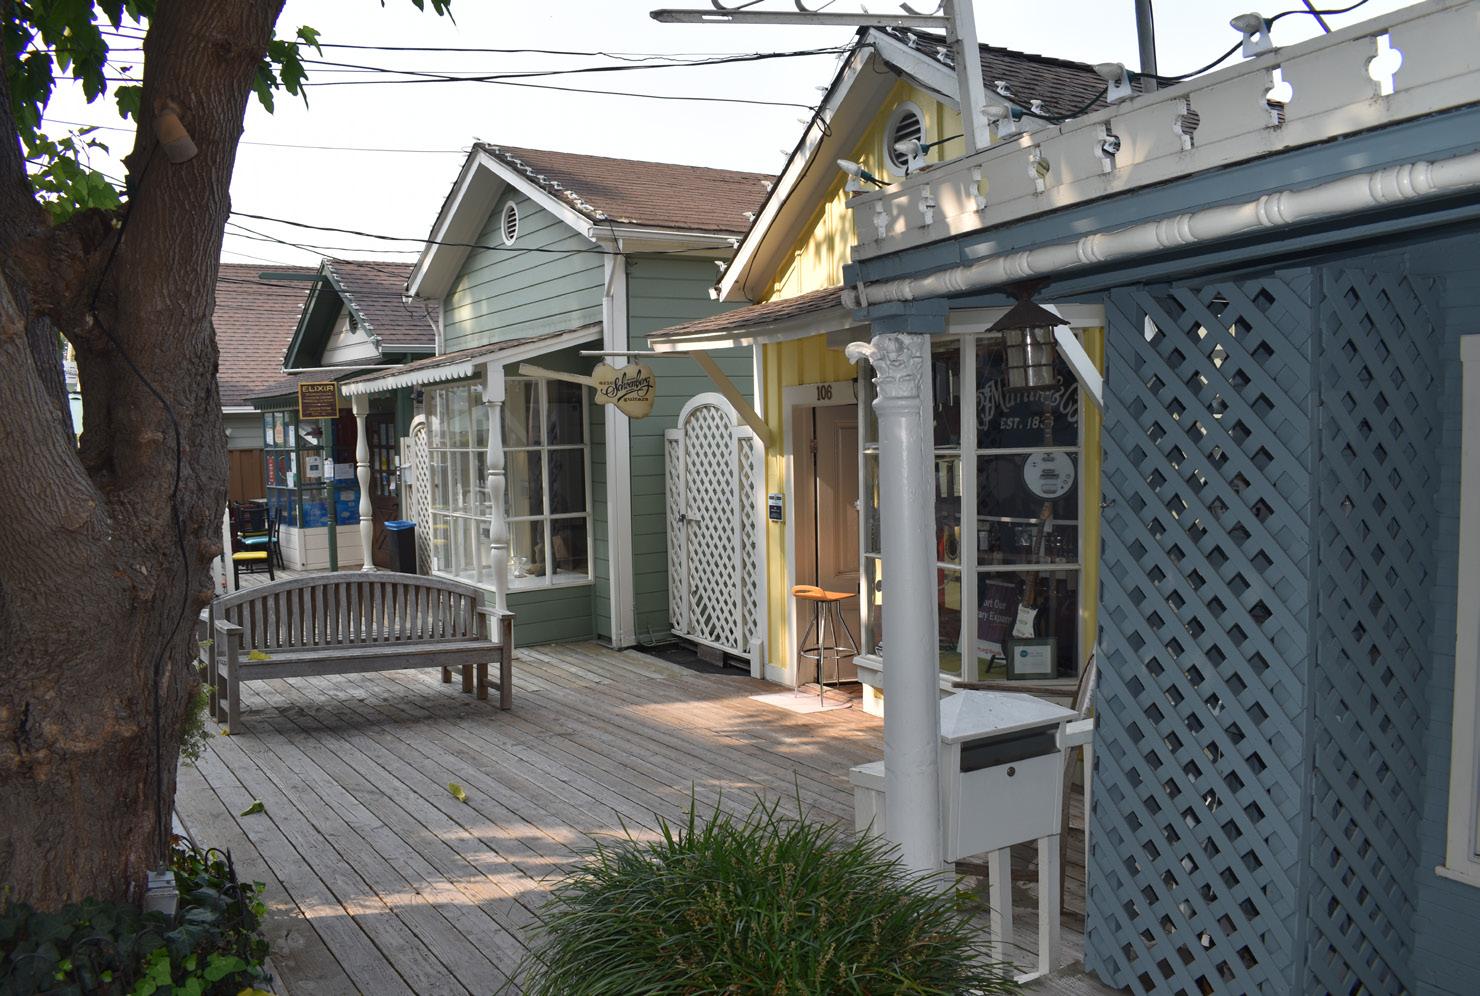
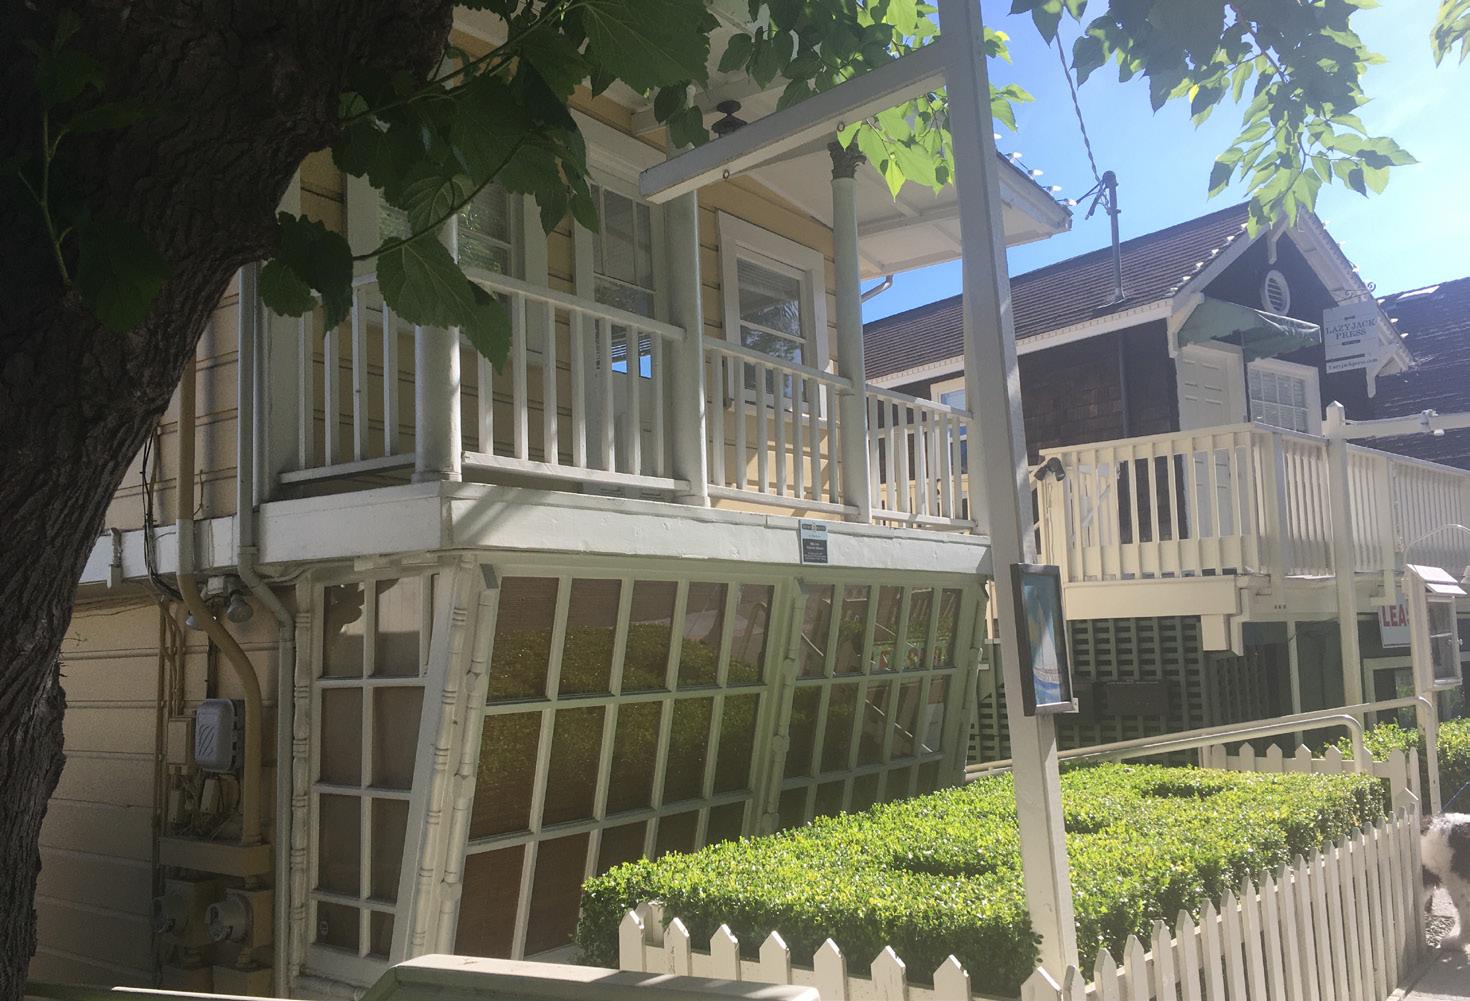
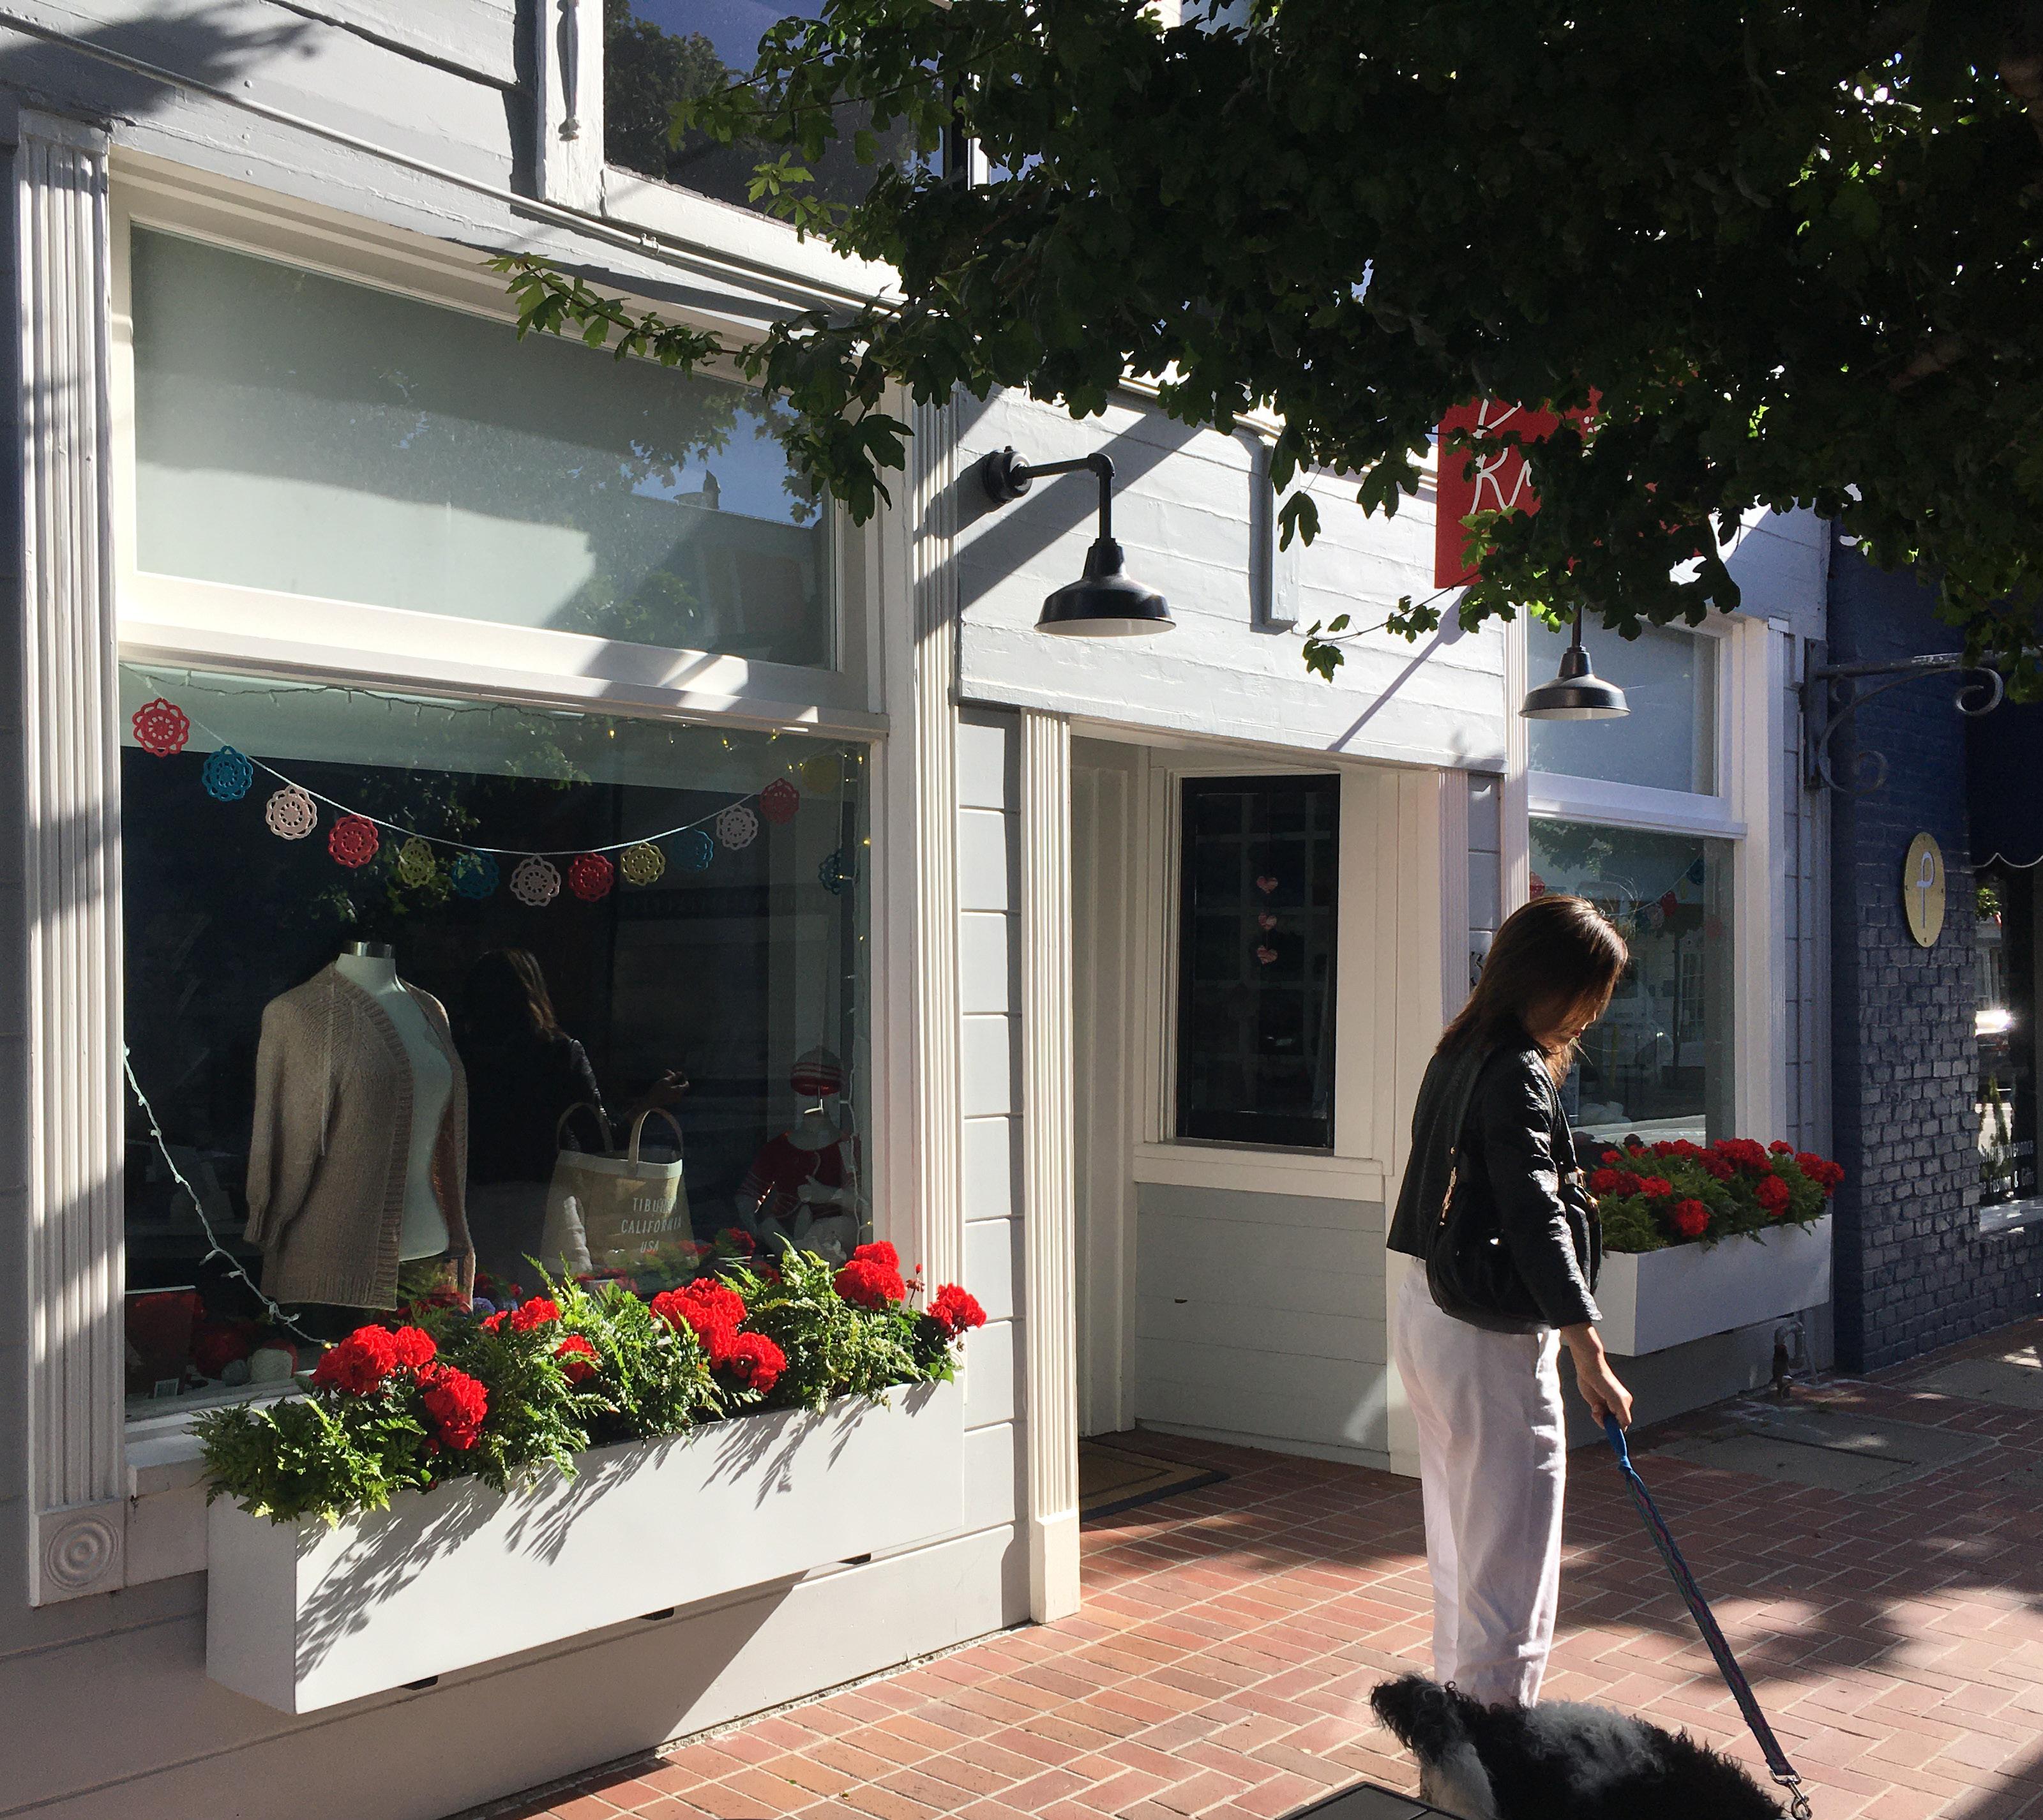
Ark Row is the local name for the segment of Main Street that curves along the base of Corinthian Hill. Ark Row’s name hints at its origin as a place where houseboats—or “arks”— were brought onto land to live in, set alongside summer cottages in the early days when Belvedere was an attractive summer get-away. Today, these buildings offer a welcoming place that draws locals and travelers to Downtown to shop or enjoy a meal. Front yards have become versatile decks and entry areas, while paseos connect down to a large parking area below and behind the buildings, accessed at the bend in Main Street or from Juanita Lane.
What were once vacation cottages have been converted into commercial space along Ark Row and has been accompanied by sympathetic new construction.
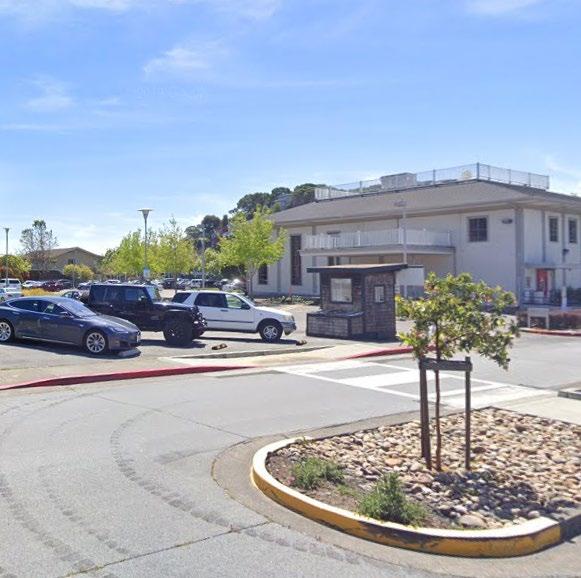
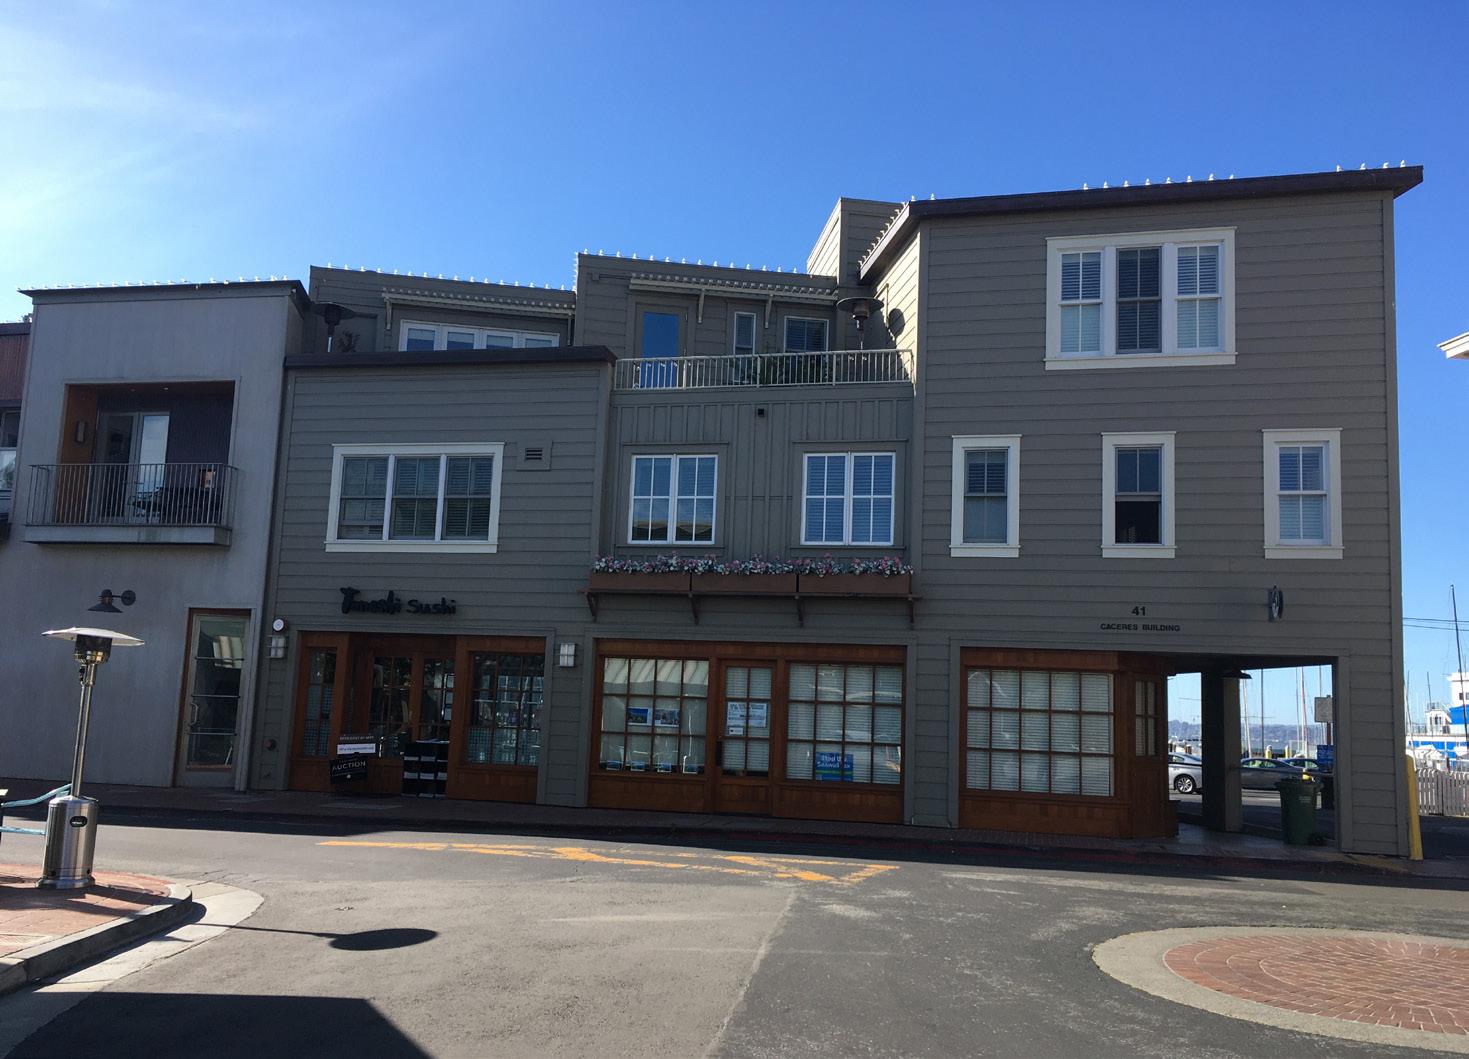
The largest of Downtown’s subareas, Tiburon Boulevard features shopping centers, office buildings, banks, and a hotel, in a linear auto-oriented development pattern. Much of the subarea is comprised of parcels an acre or greater in size, although lots are smaller near Main Street. Singlestory commercial buildings with large parking lots present significant opportunities for new investment and redevelopment.
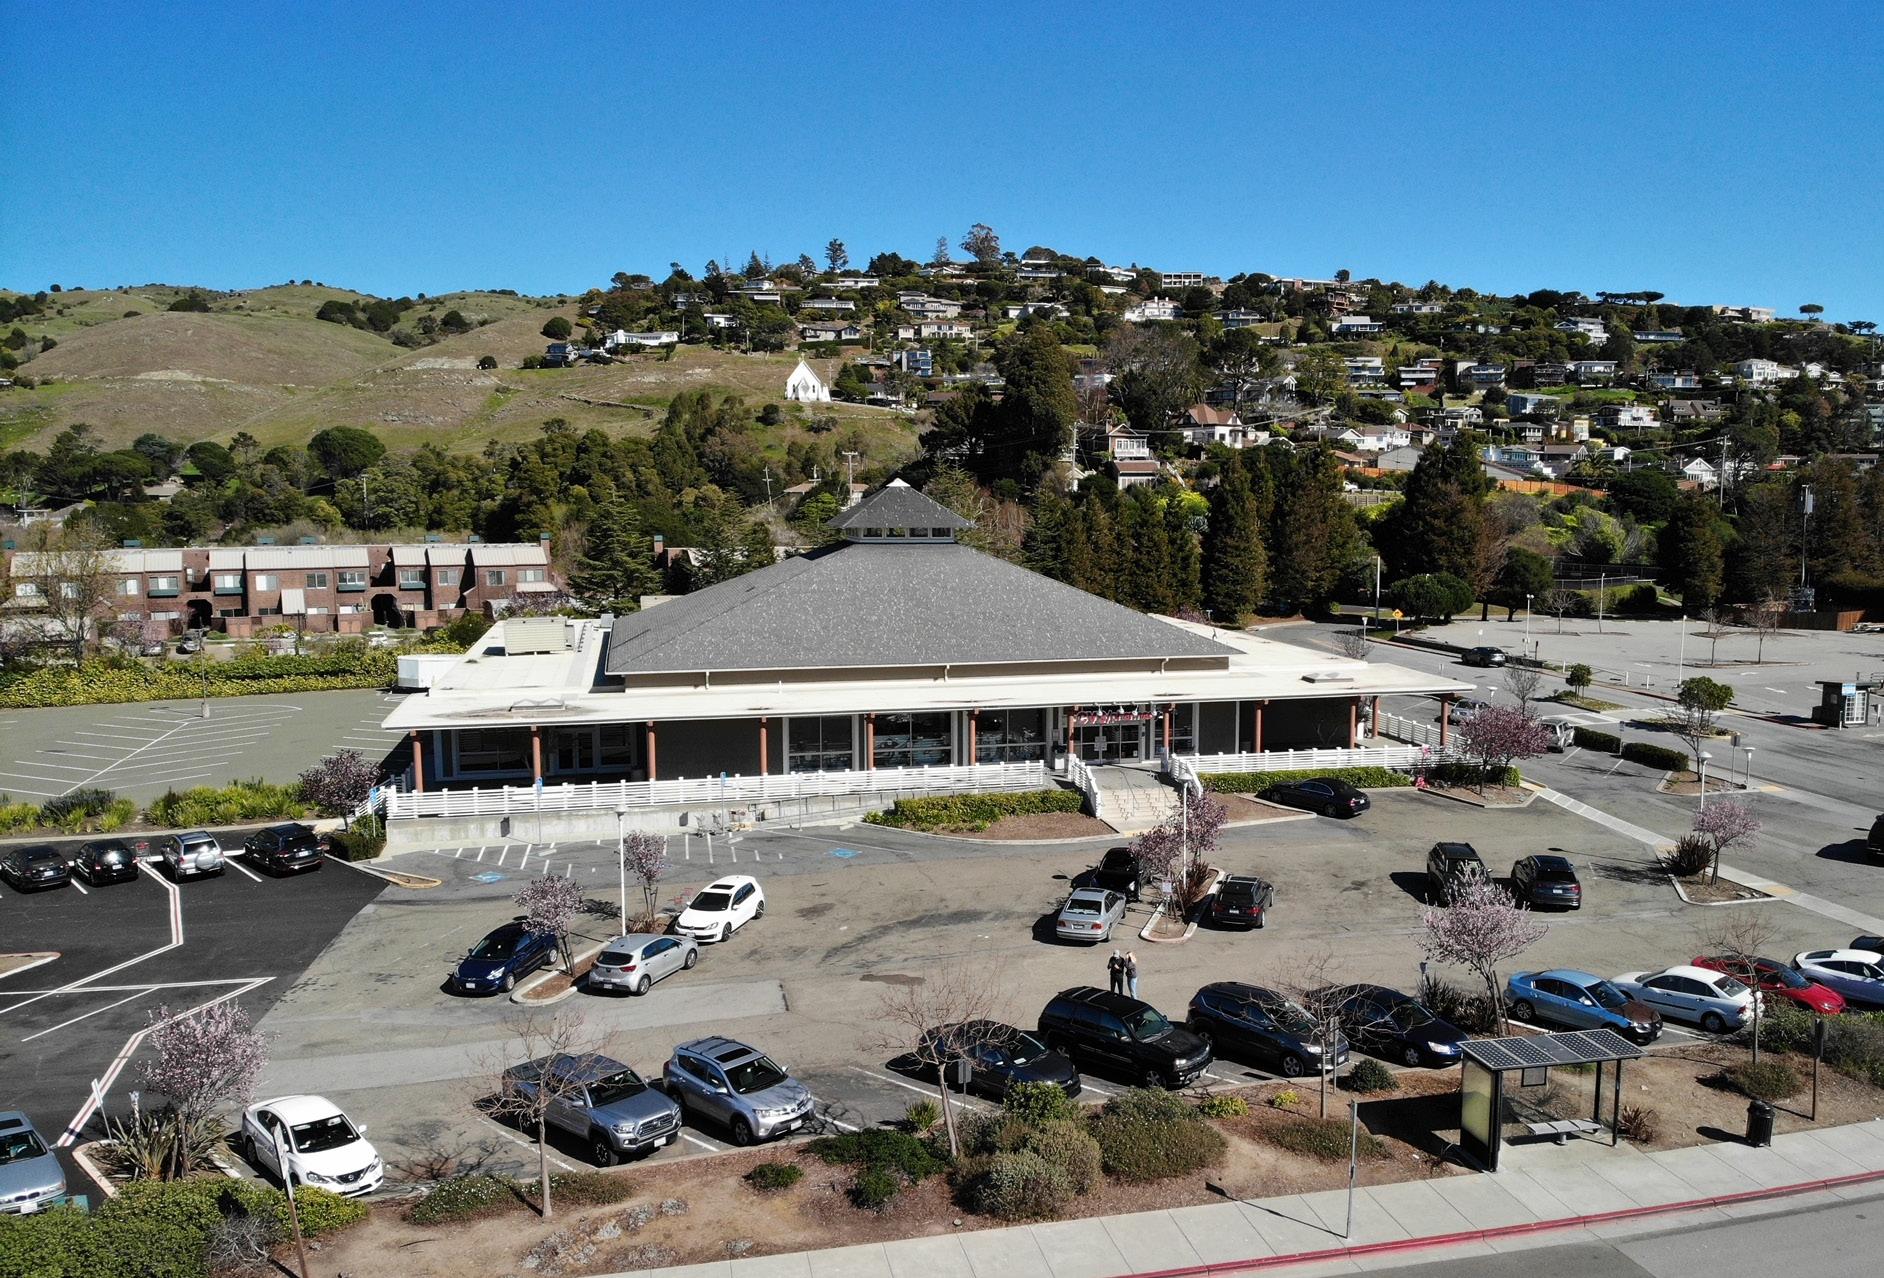
The existing development pattern is also characterized by 1-2 stories and surface parking lots that separate buildings from street sidewalks and buildings from other buildings. While buildings are larger than in the Main Street and Ark Row subarea, Tiburon Boulevard development is at a lower intensity. Because the intensity of development is lower in the Tiburon Boulevard subarea, private investment in redevelopment in the subarea can be expected in the future.
The Town of Tiburon created a new civic hub west of the Tiburon Boulevard subarea, corridor, which is comprised of Town Hall, the Library, and Zelinsky Park.

Recent construction in Downtown Tiburon has maintained Main Street’s historic scale and character. An older building is at left and more recent construction at right
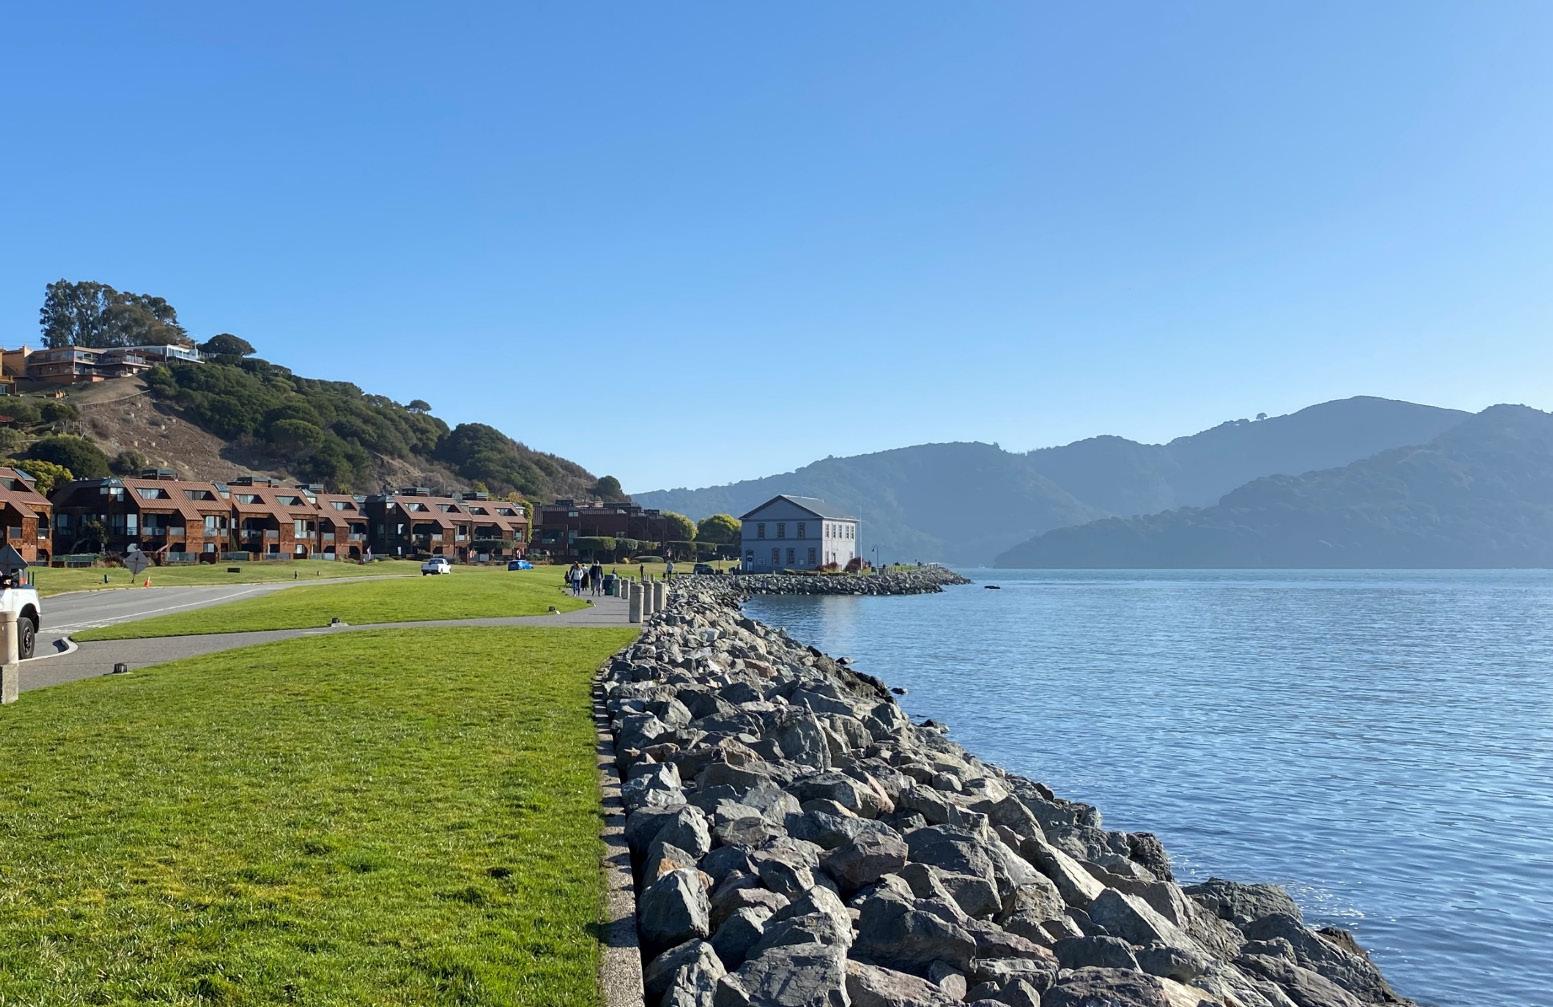
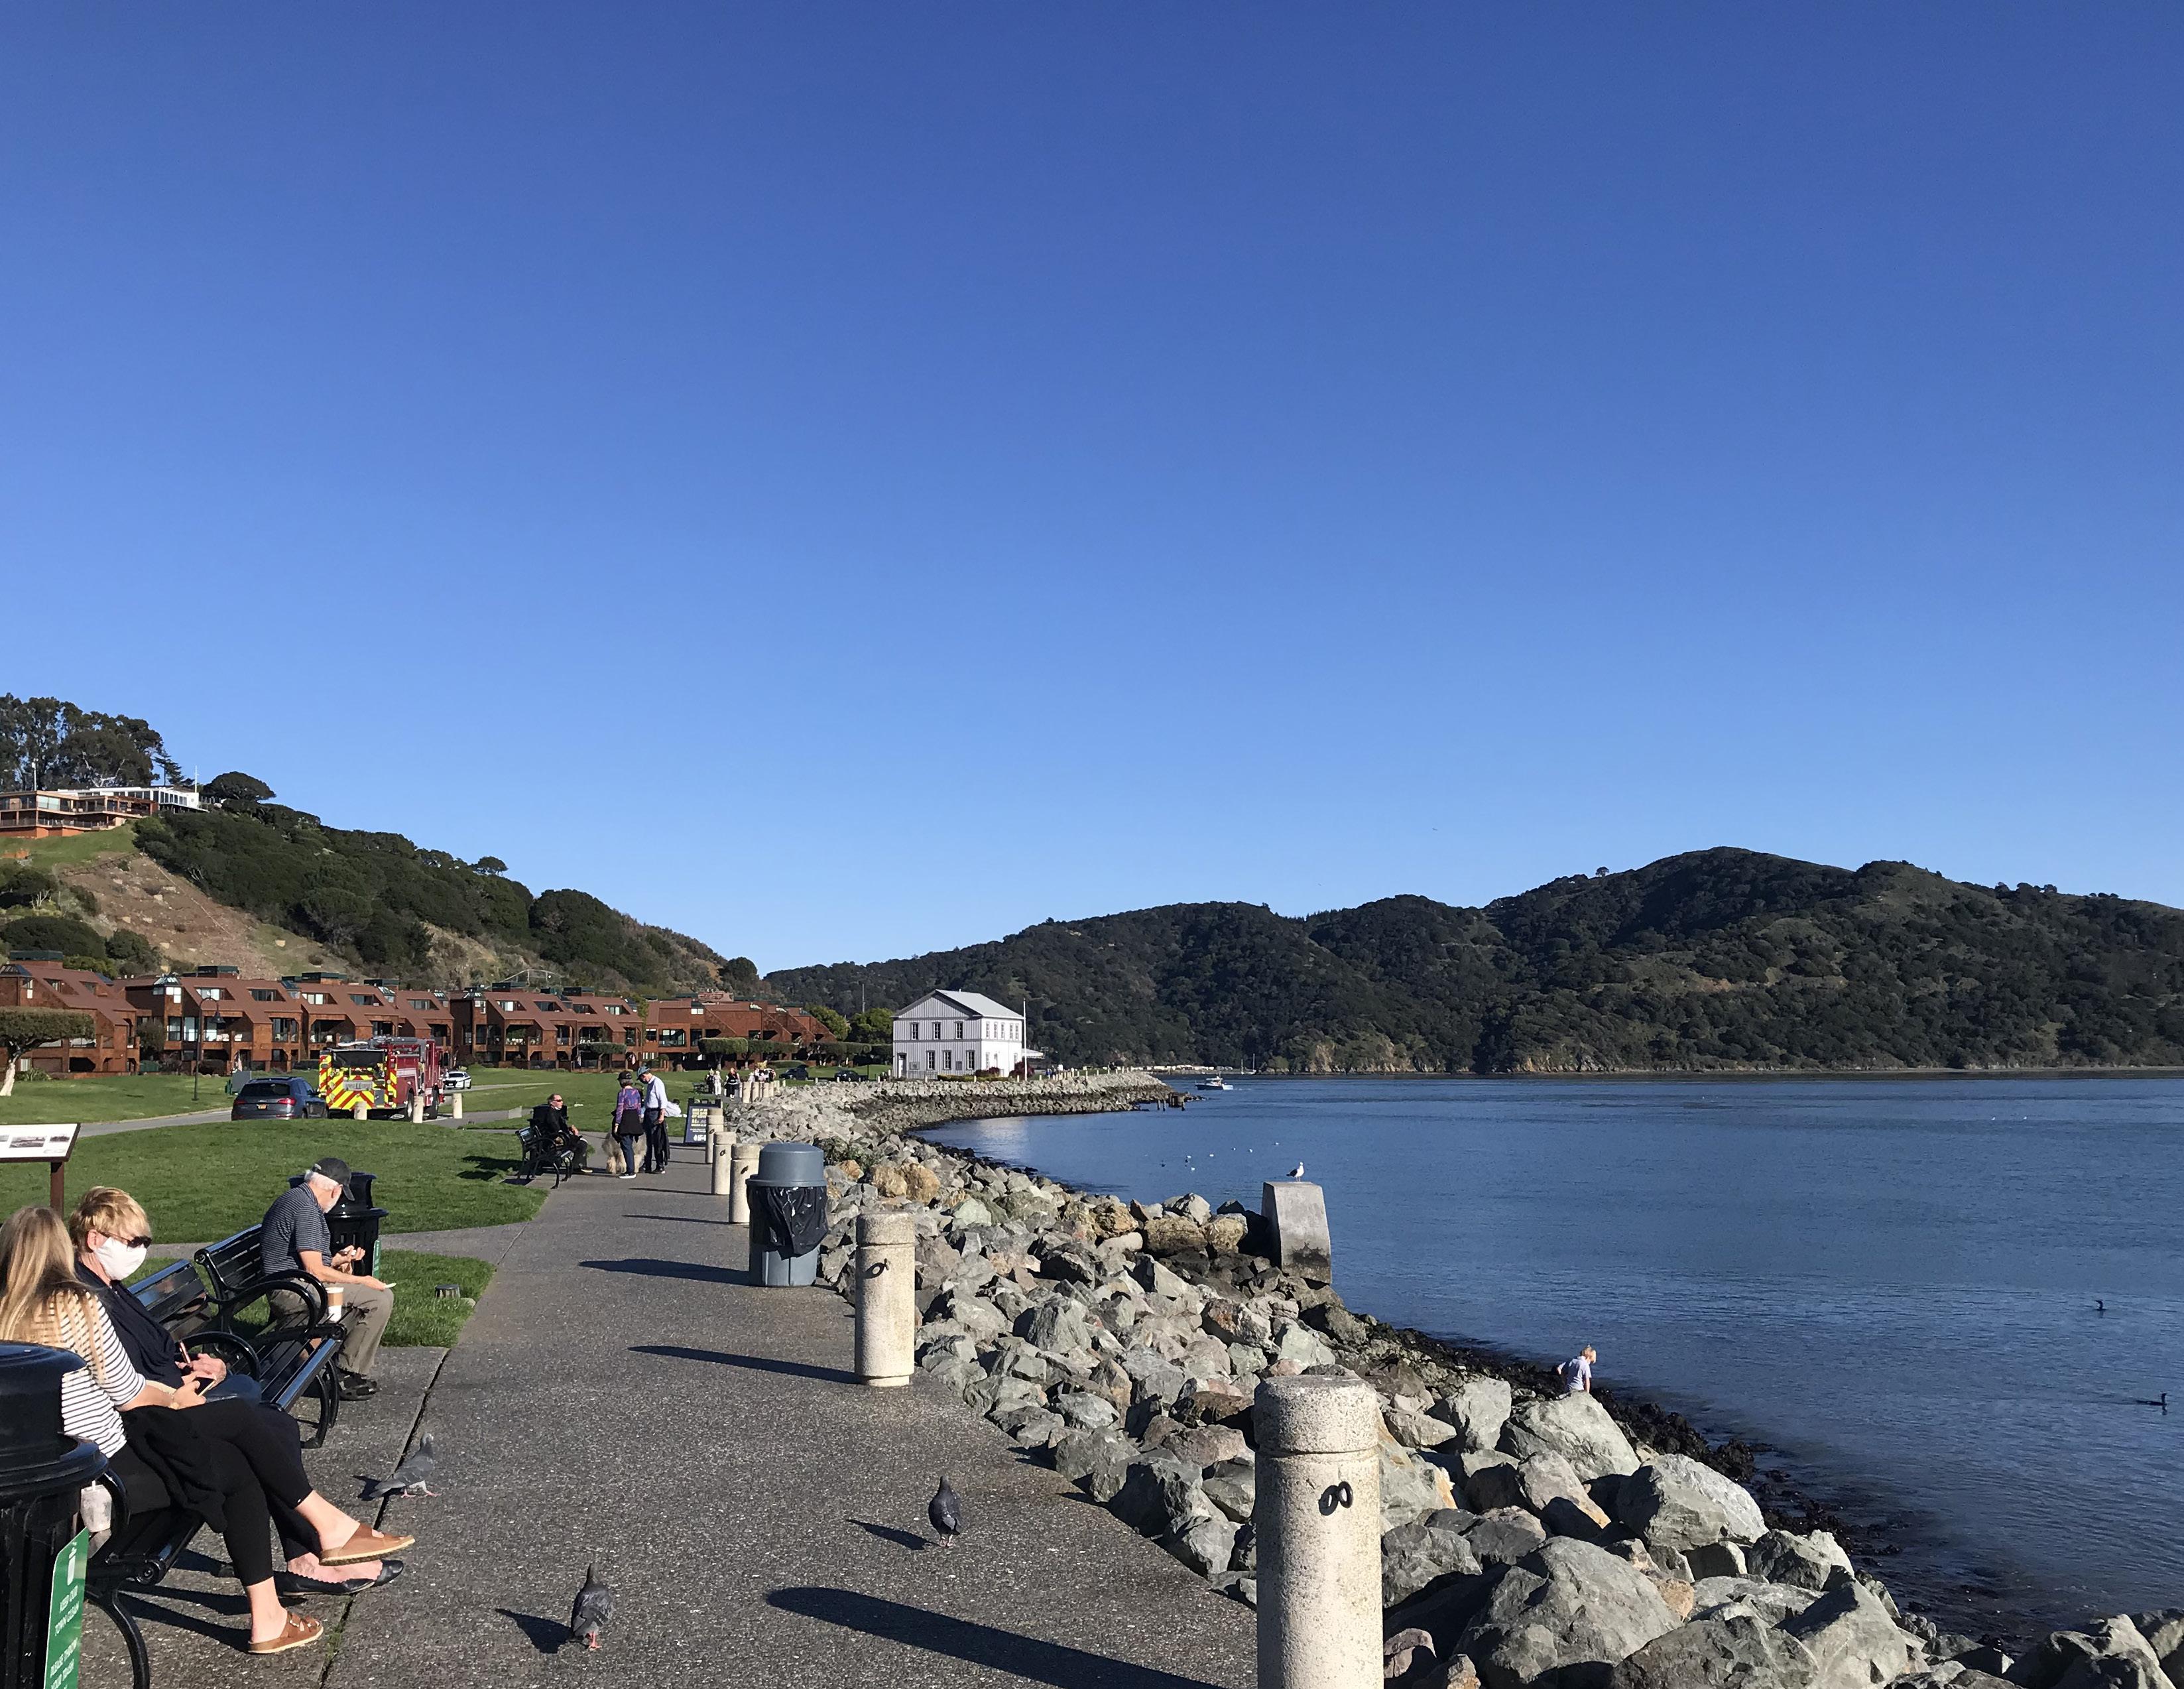
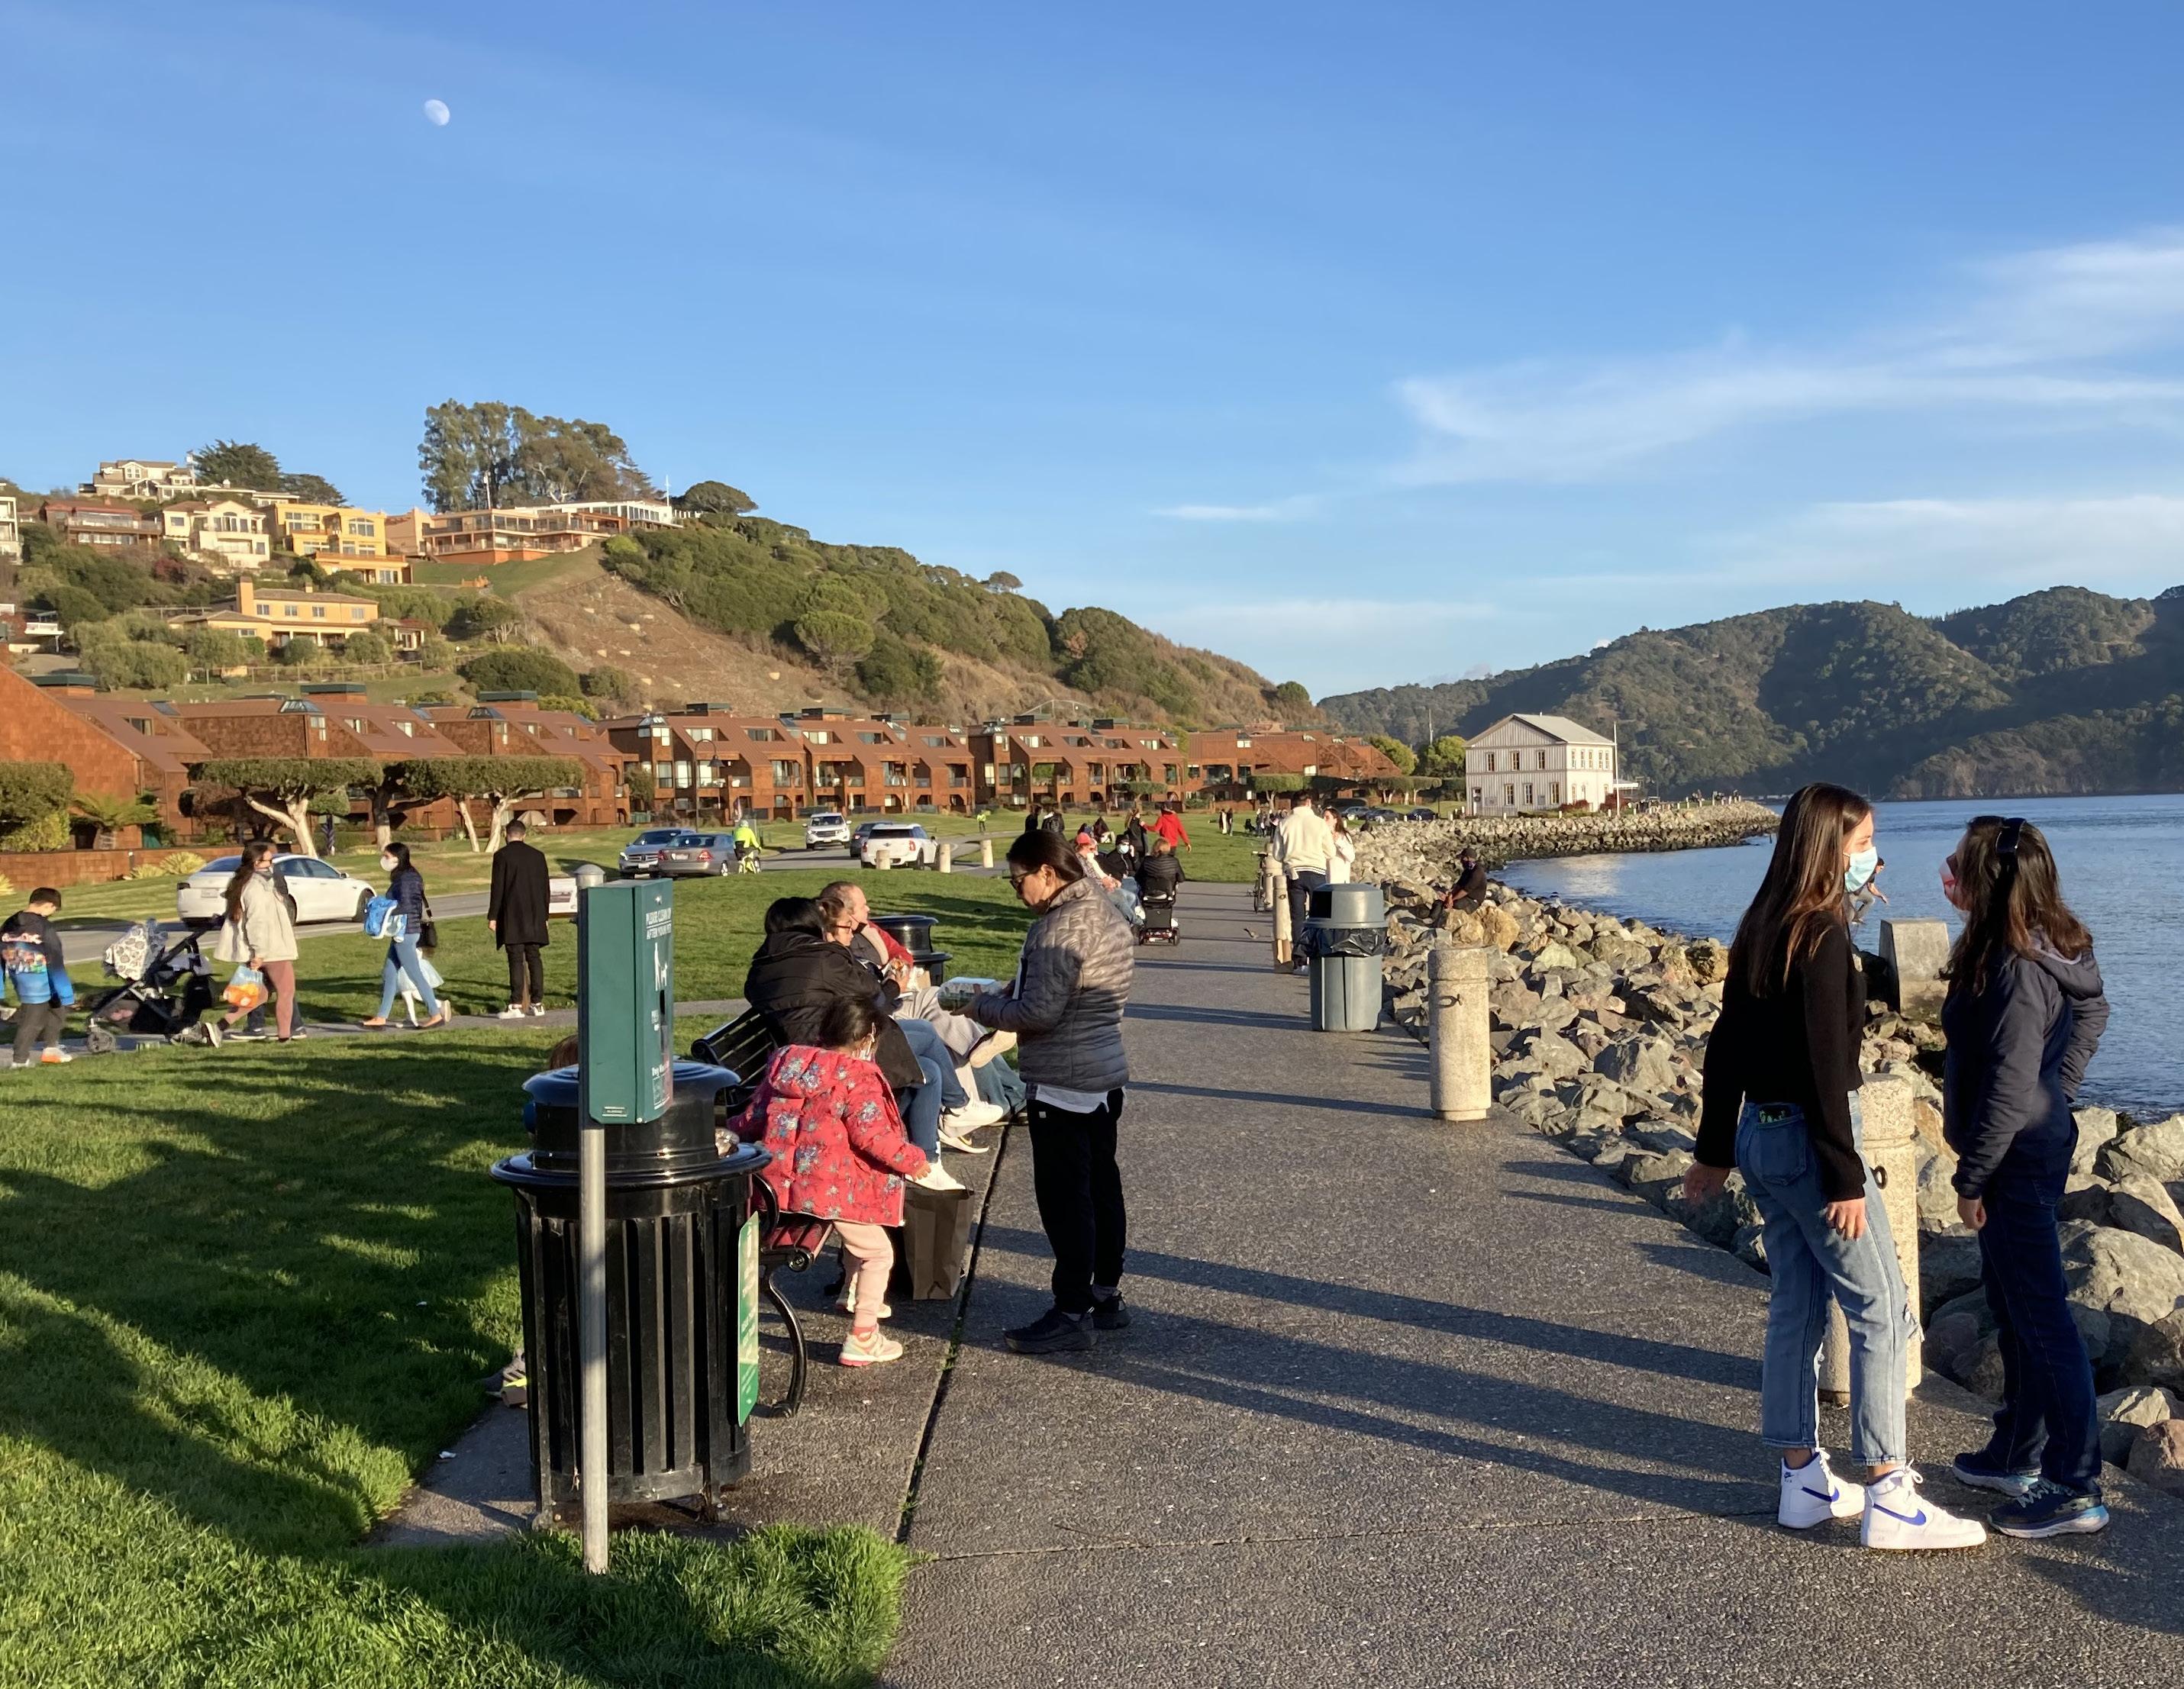
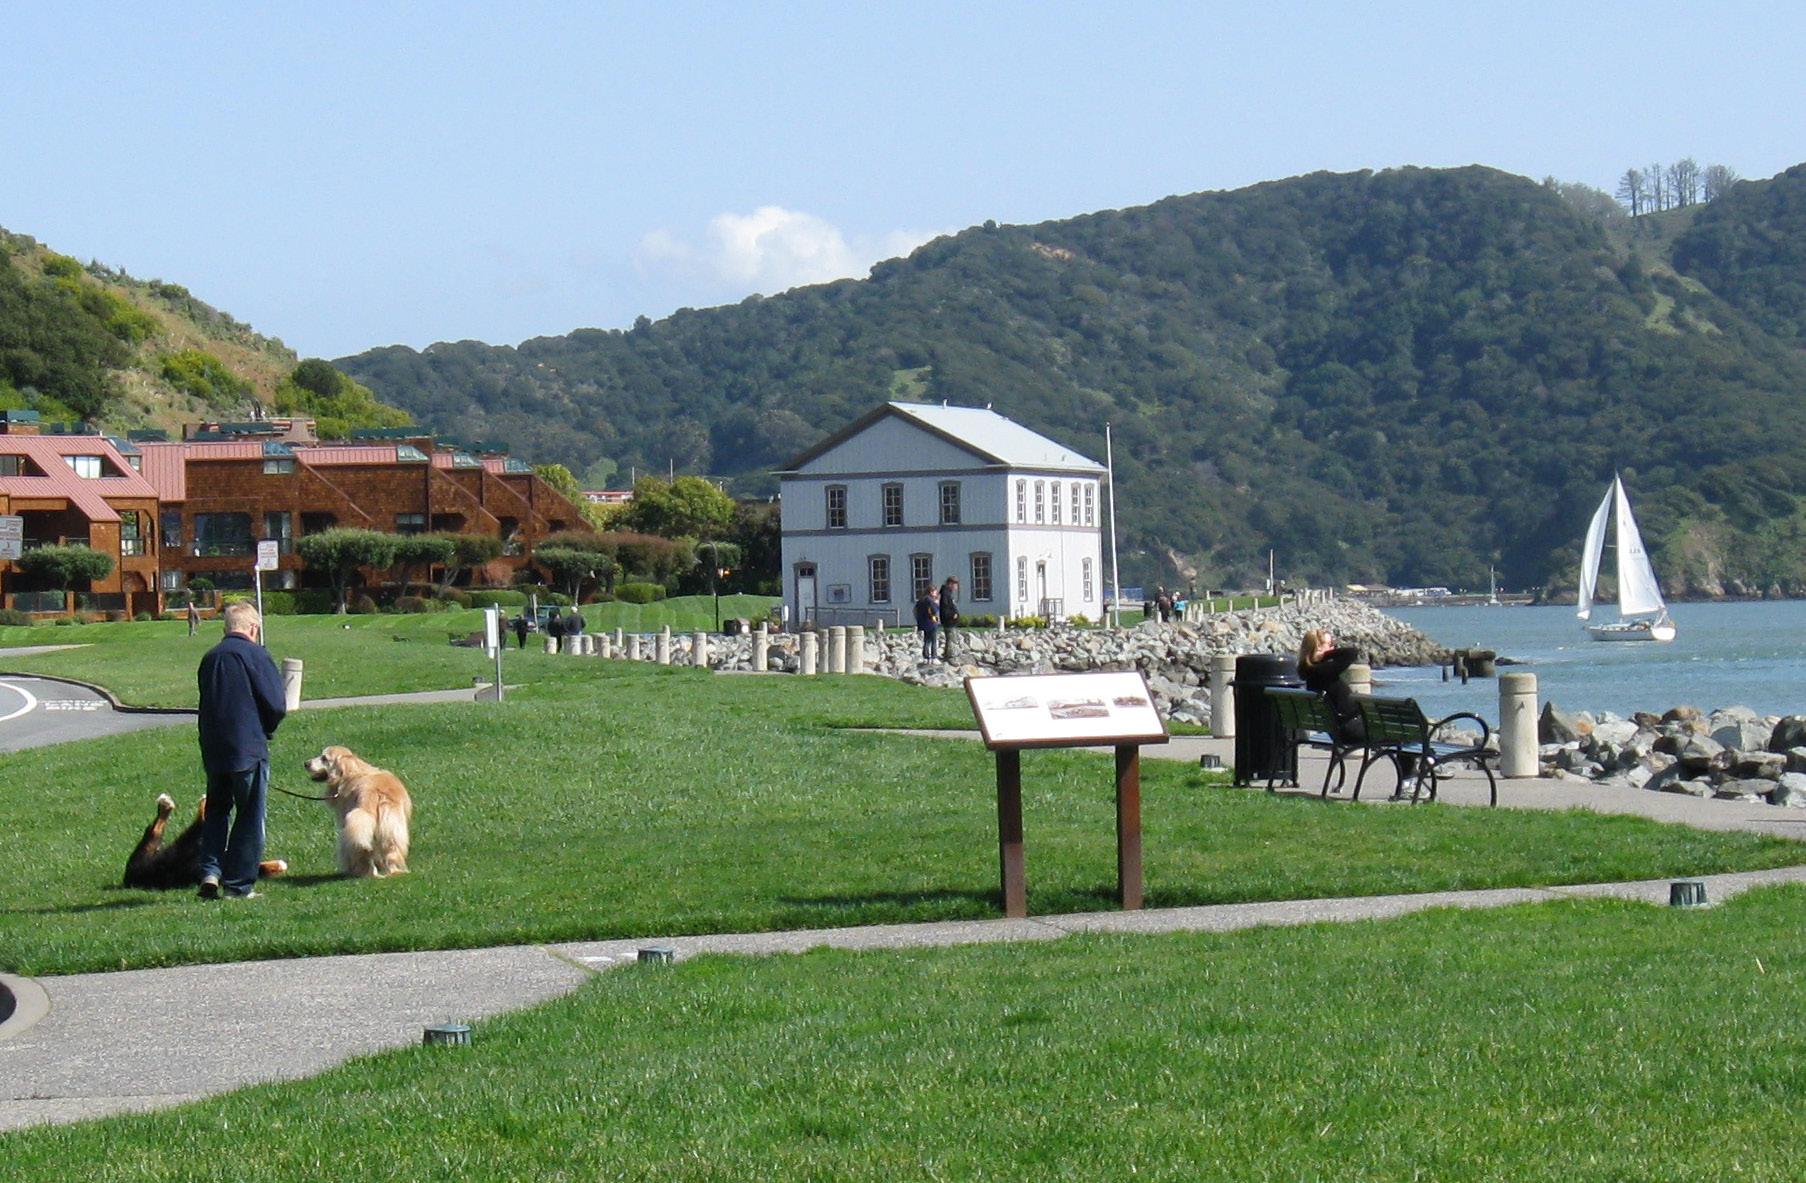
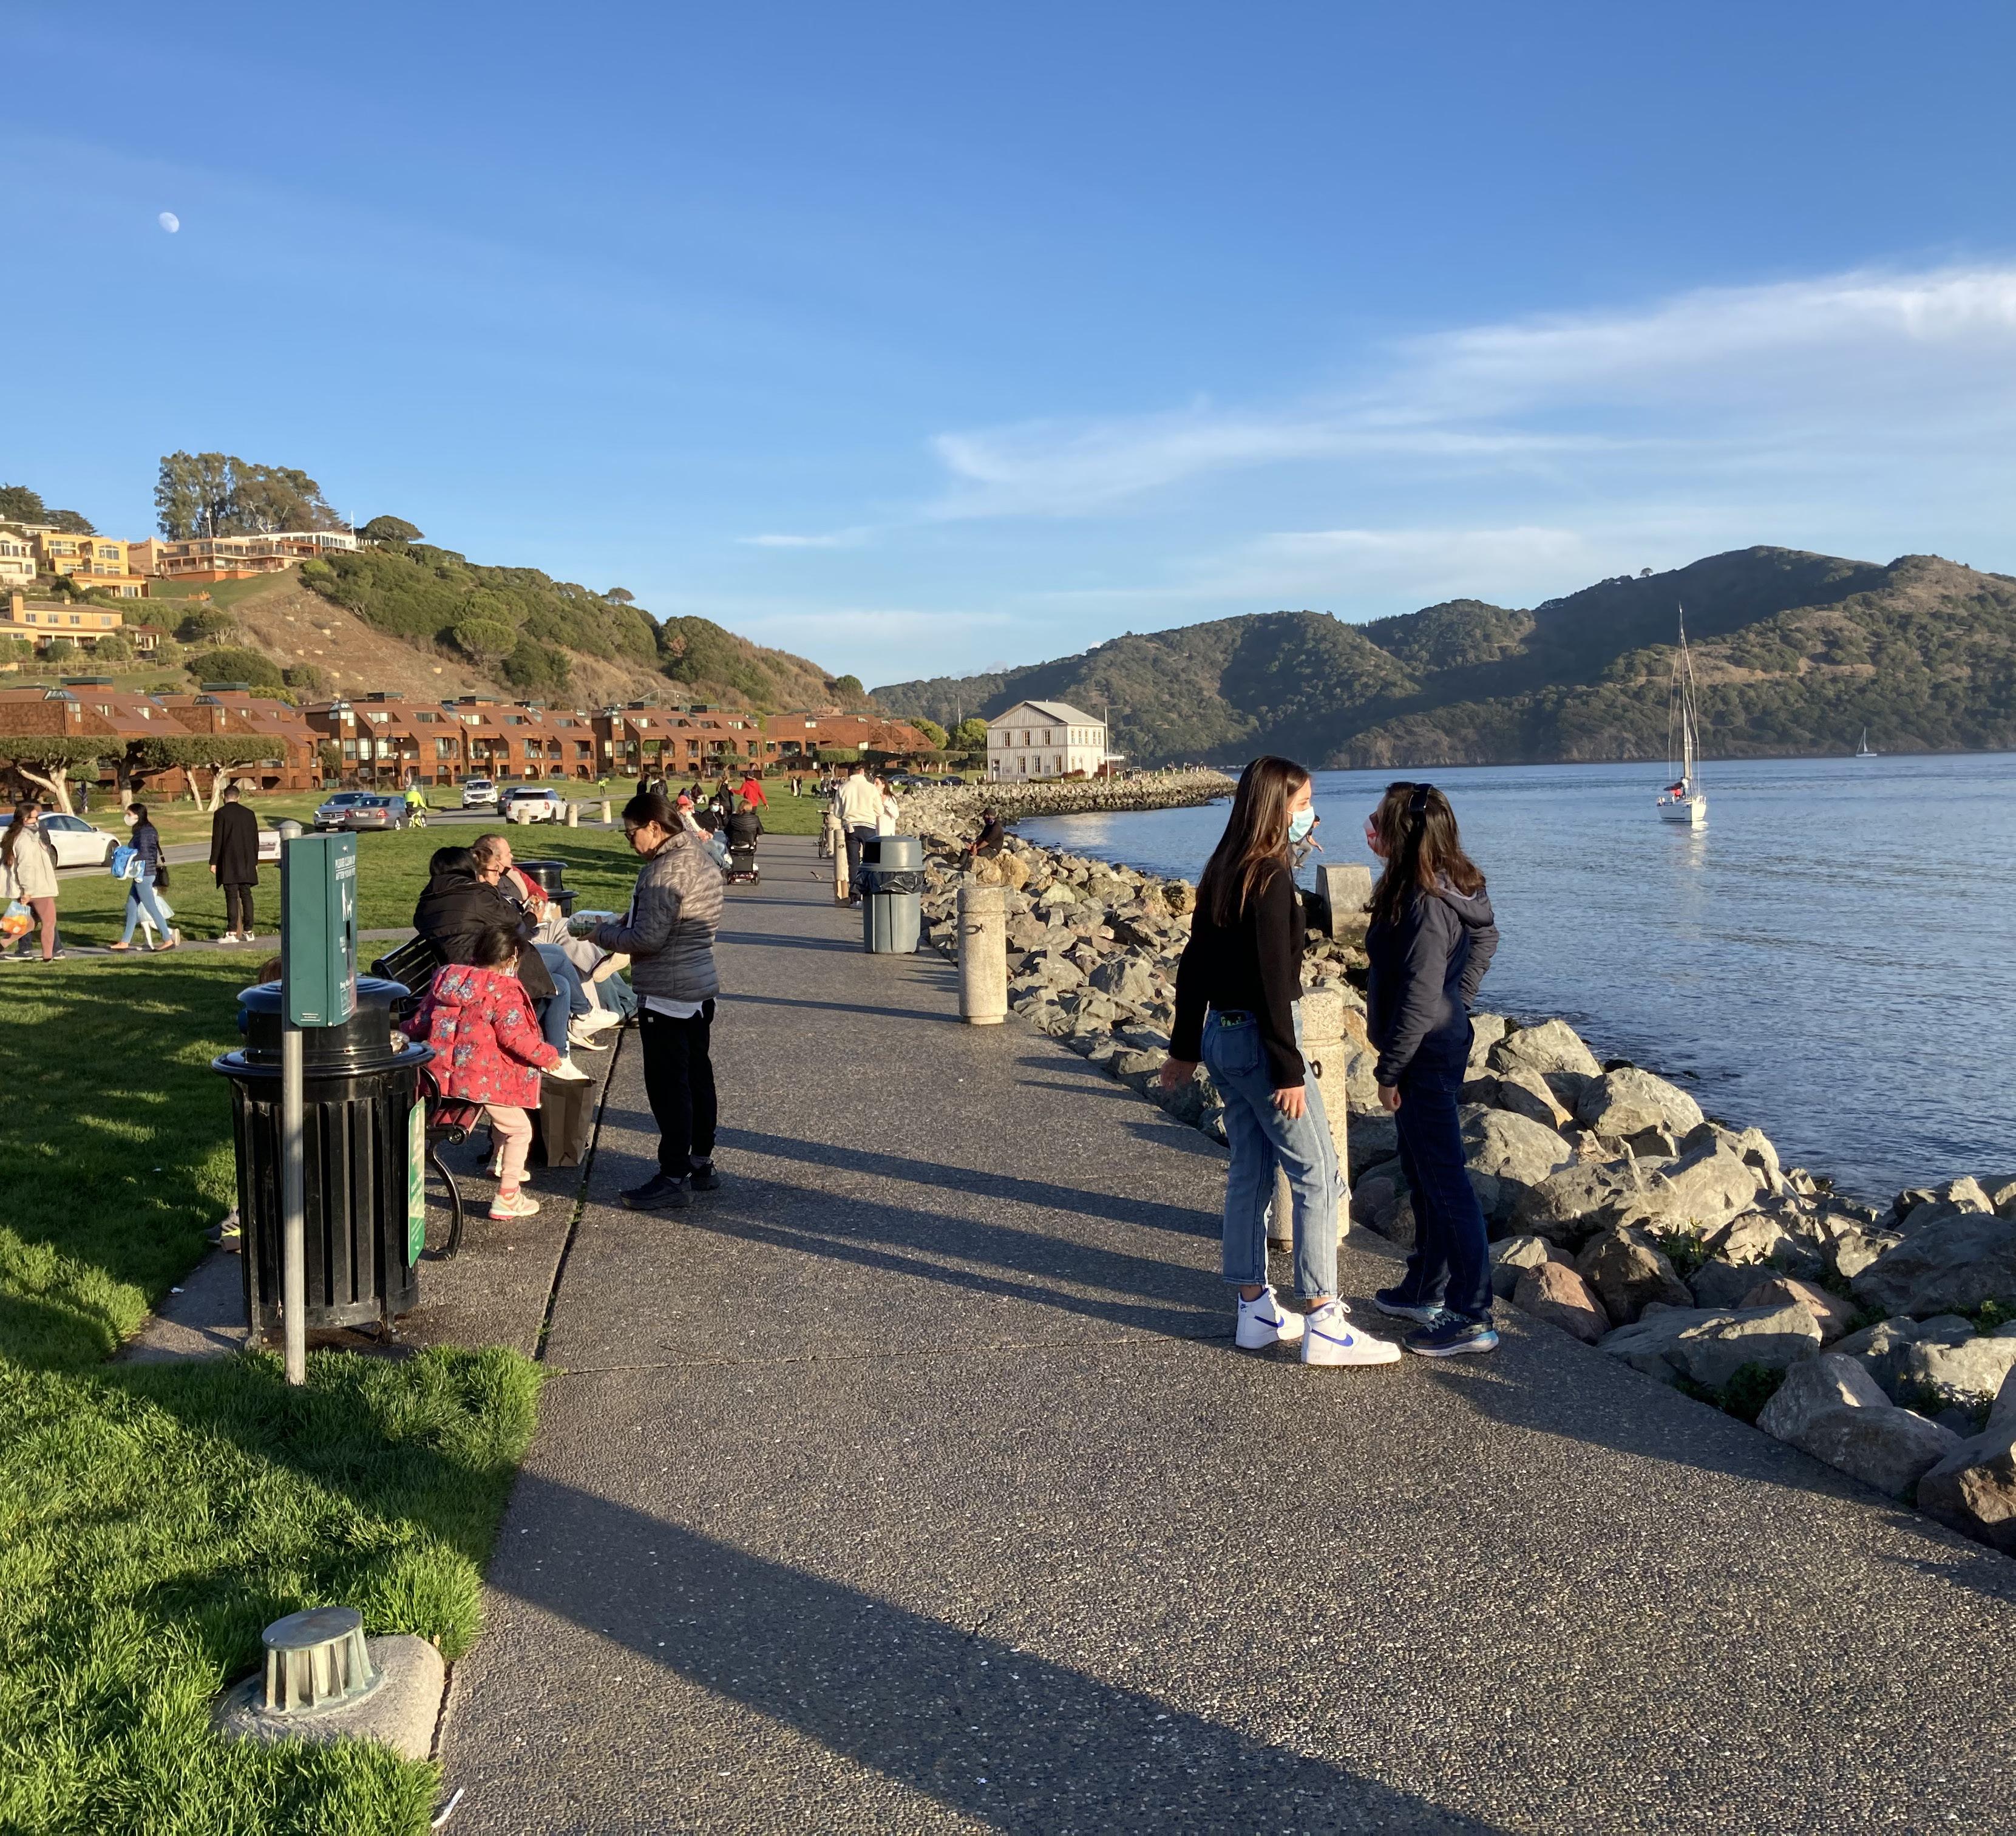
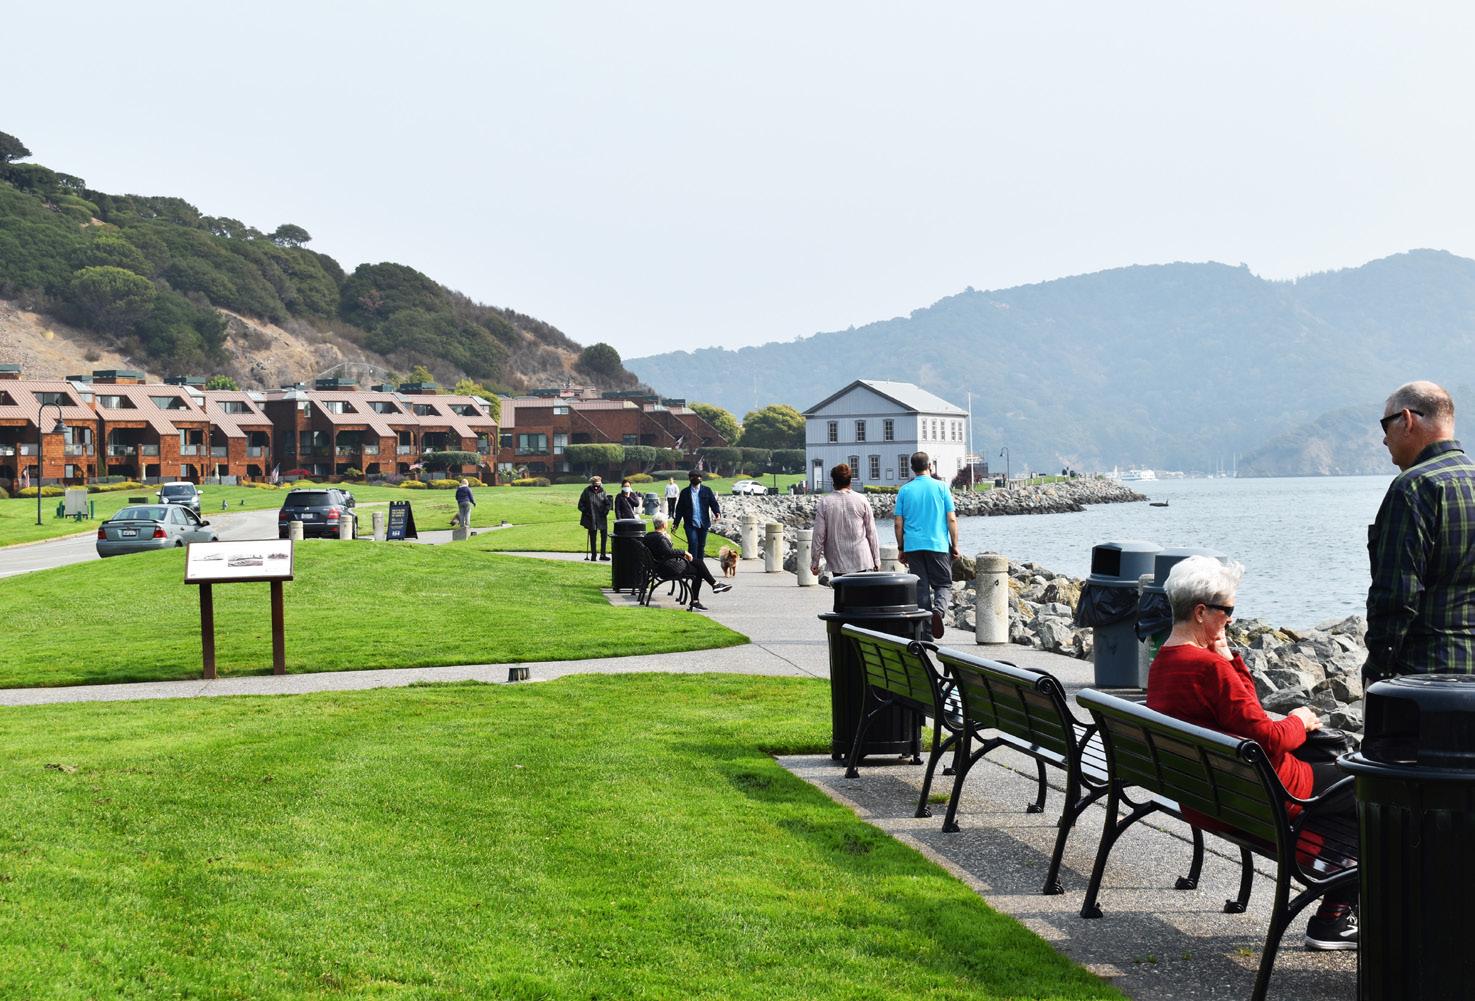
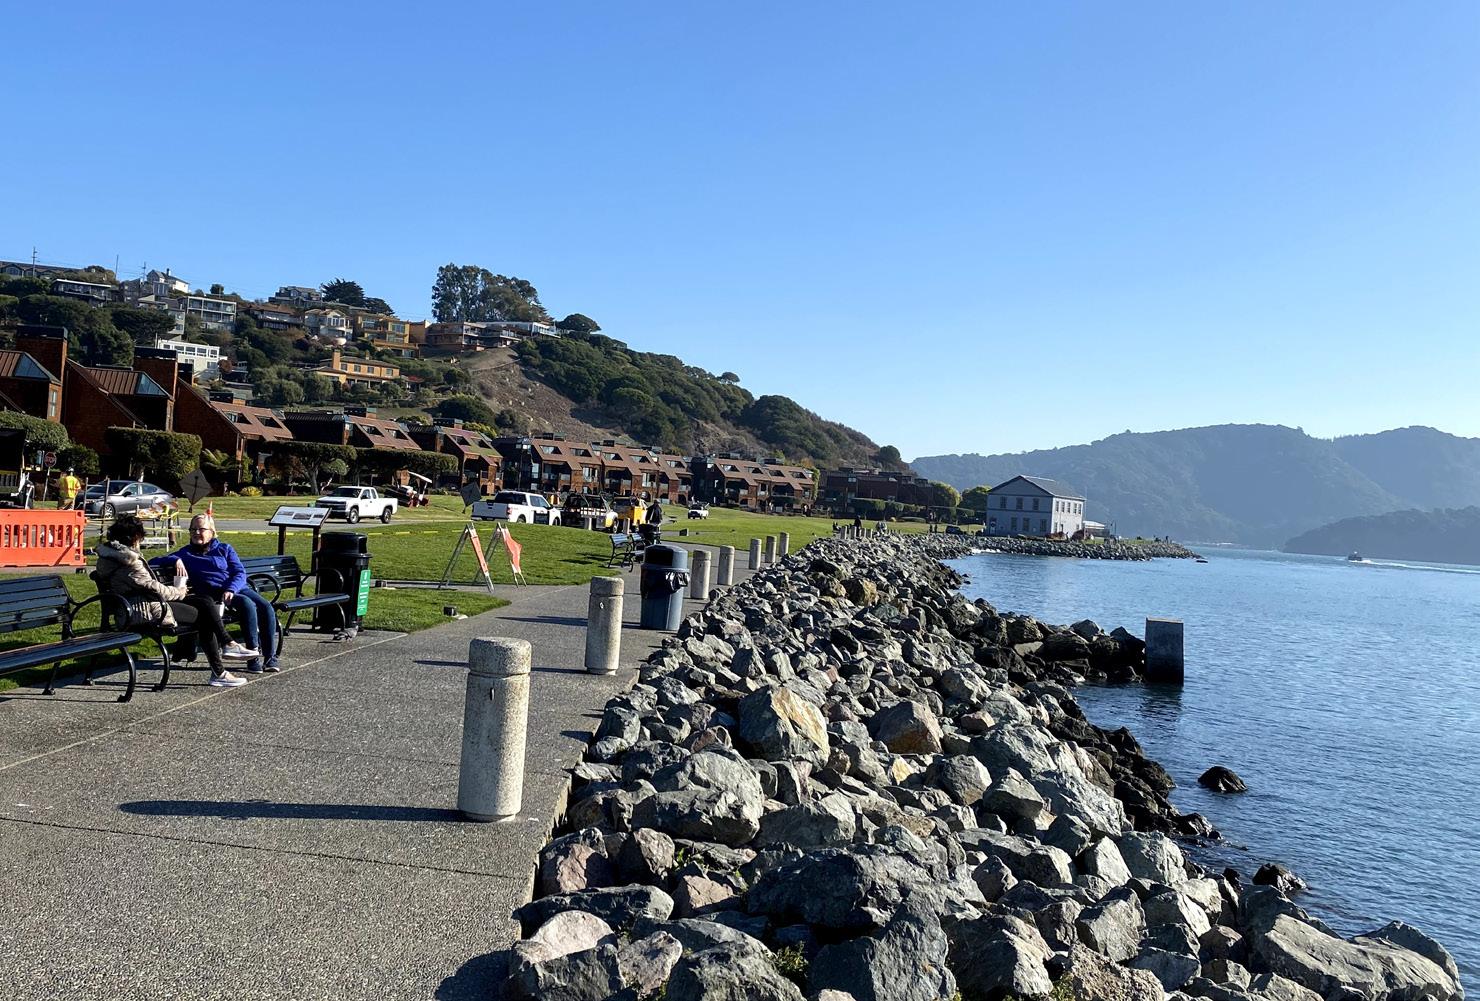
Shoreline Park runs along an edge of San Francisco Bay and bestows expansive views of the Bay Area. The Park is a favorite destination for strolling along its waterfront trail and includes the Railroad & Ferry Depot Museum to the east end and touches the Main Street subarea to the west. The Park was created in 1985 after train tracks leading to the Depot were removed in the 1970s.
The waterfront trail at the edge of Shoreline Park is a popular destination for Tiburon community members and visitors. The trail connects Main Street to the Tiburon Railroad & Ferry Depot Museum, which appears in the distance.
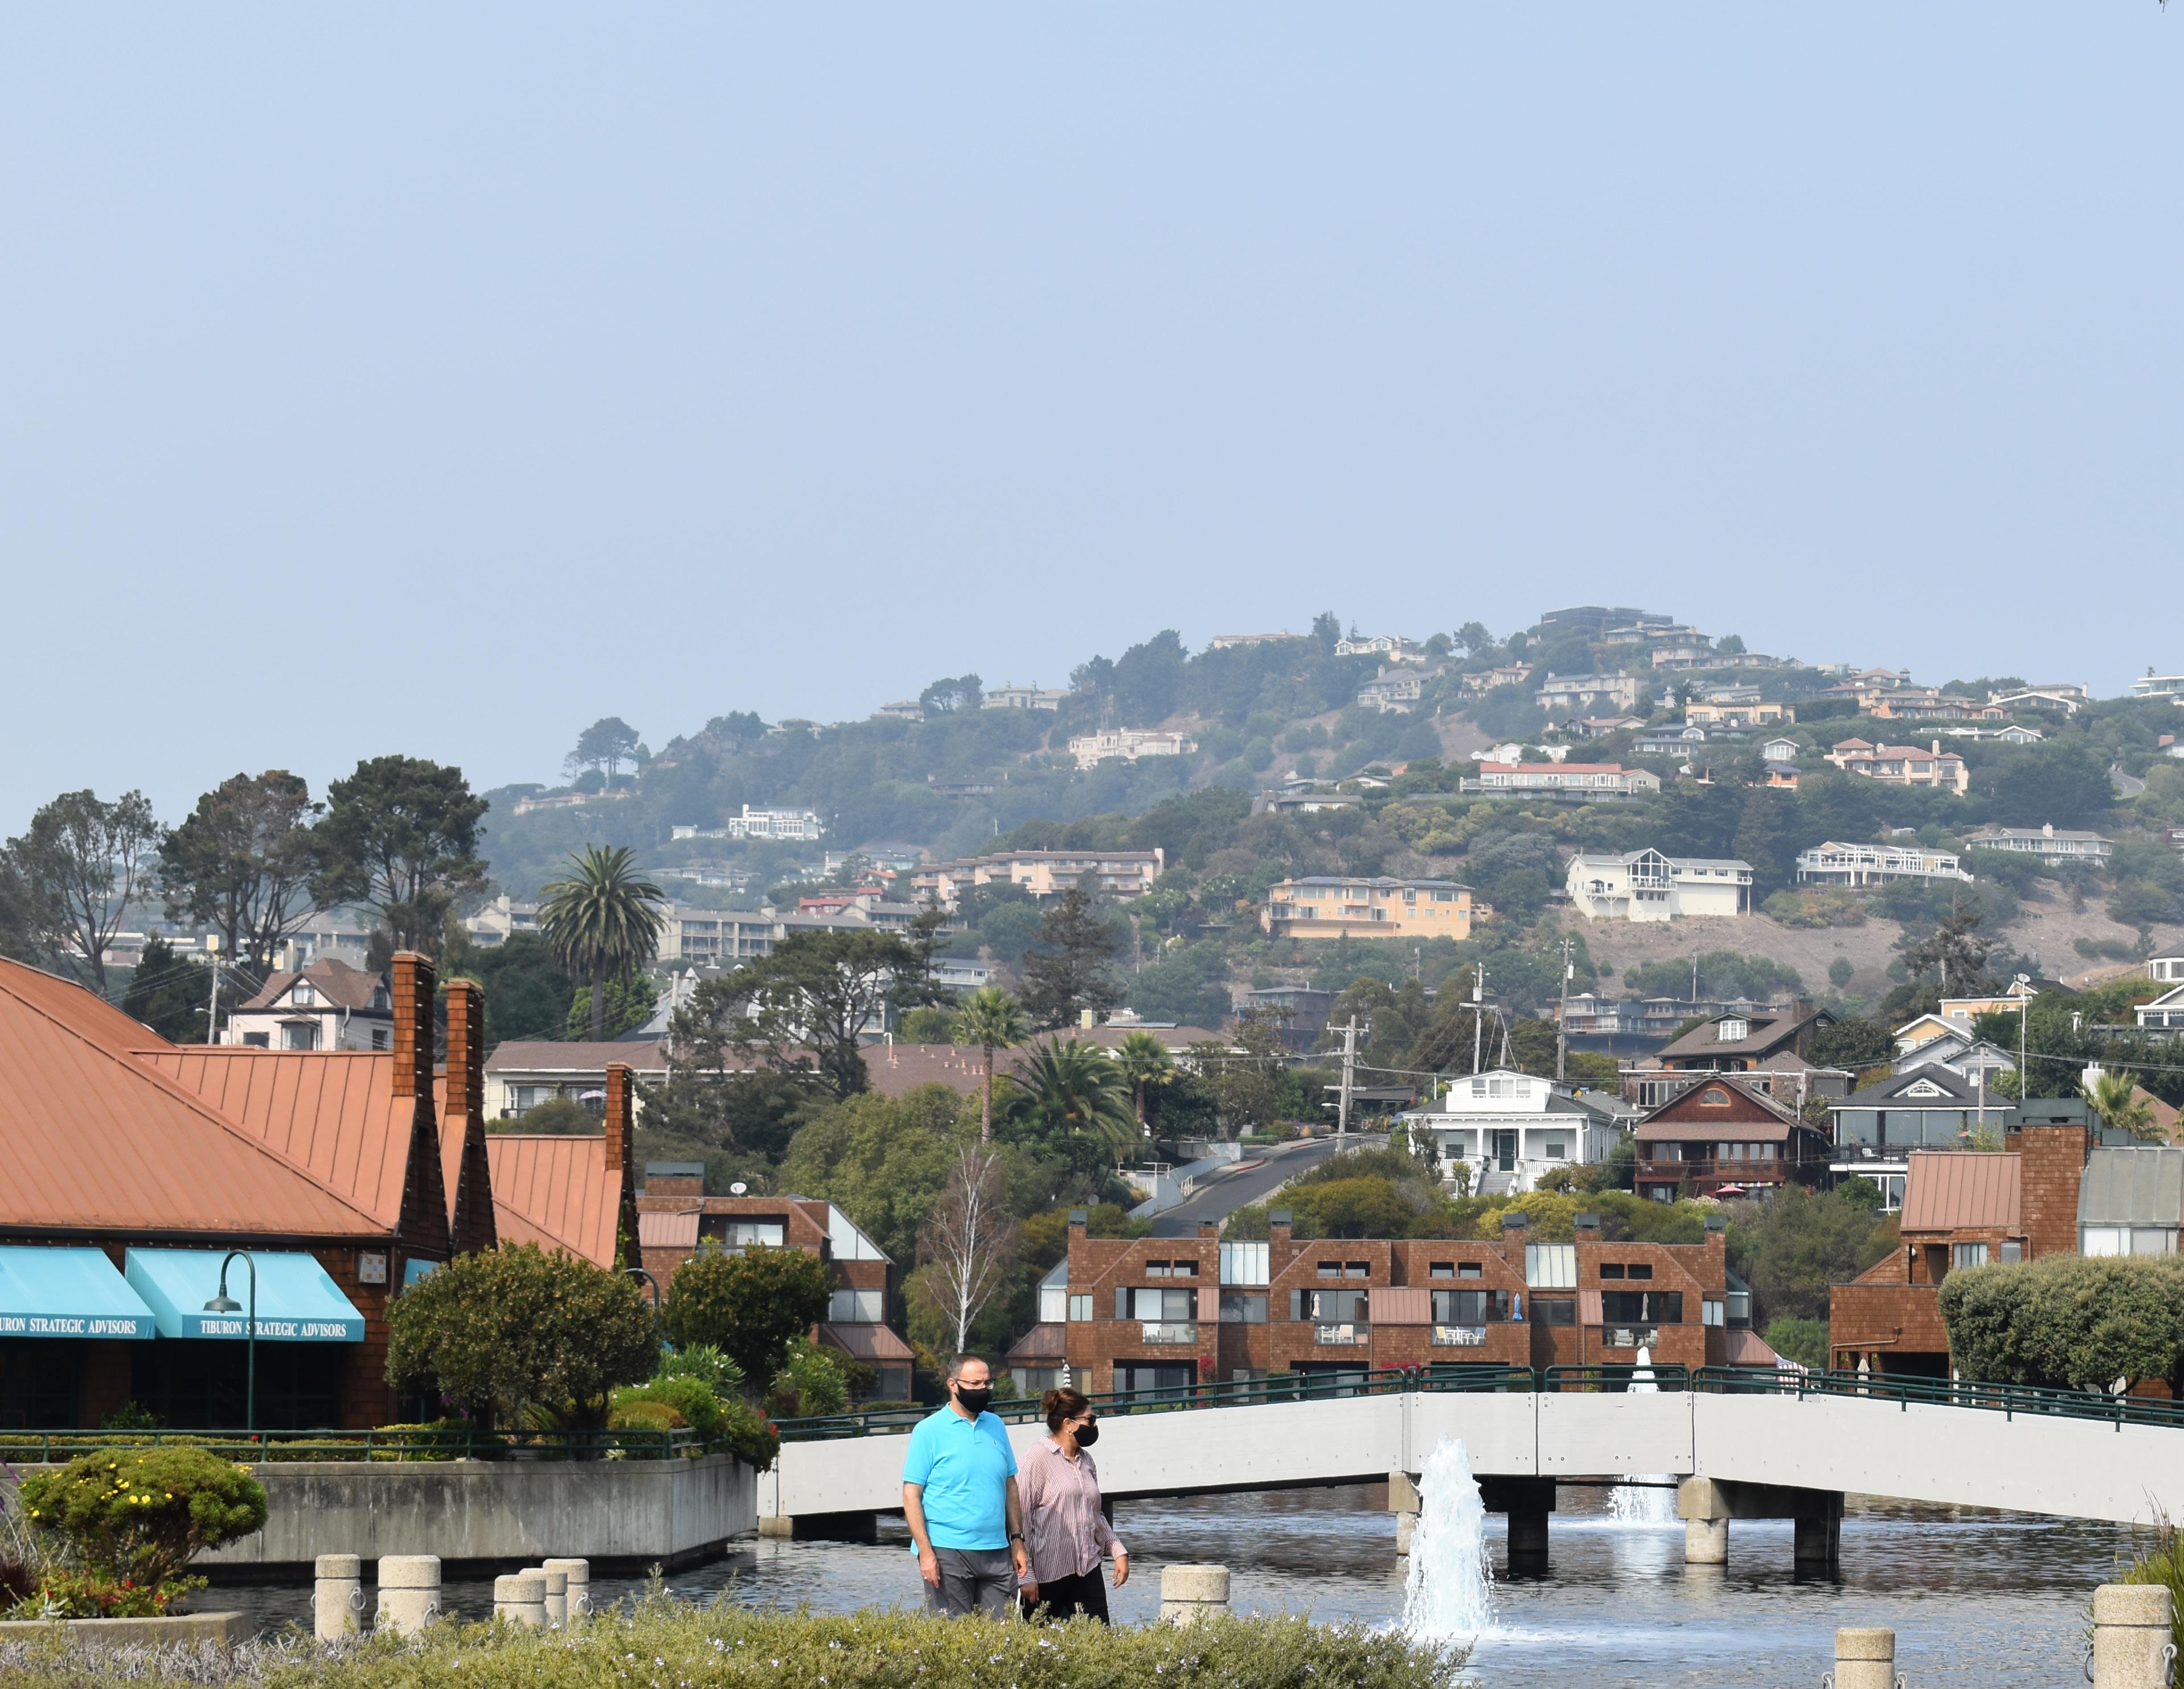
The Point Tiburon neighborhood, across Paradise Drive from Shoreline Park, was built in the 1980s when the former Northwestern Pacific Railroad Yard was redeveloped. The development features commercial buildings and public spaces around a small lake, with residential buildings designed with views to the lake, the Tiburon Lagoon, and the Bay.
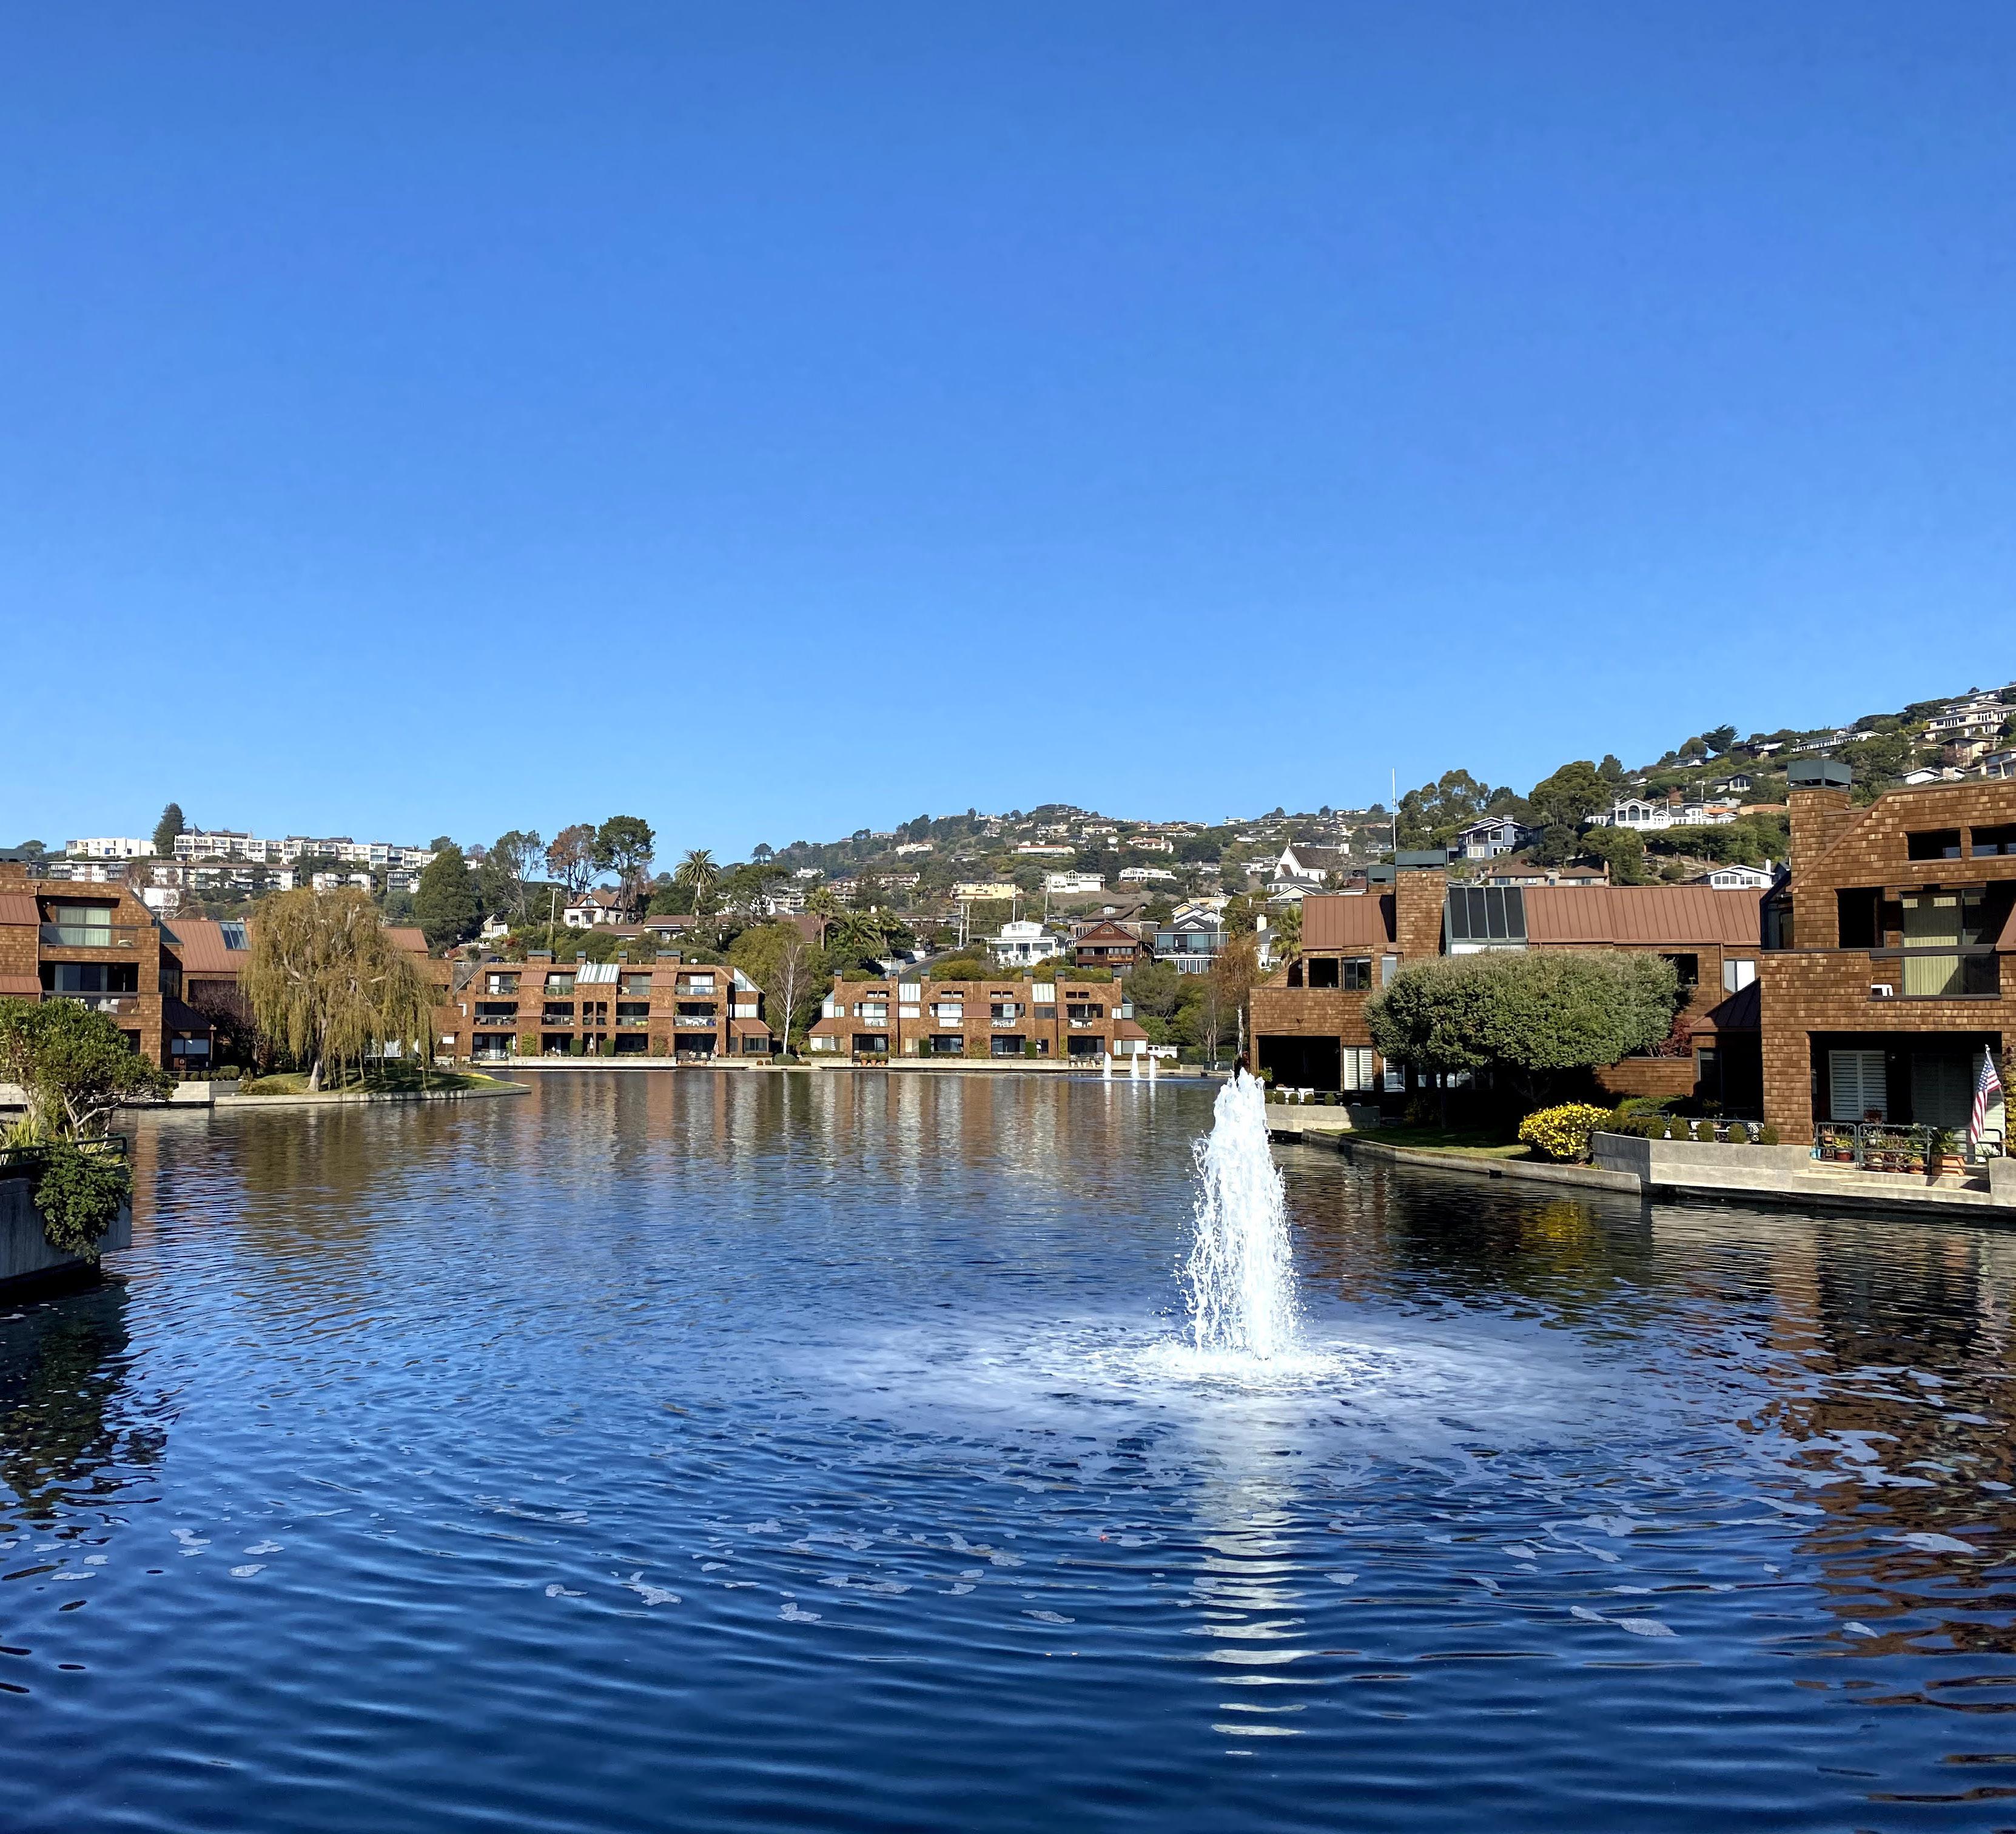
The lake serves as a focal point for the multifamily residential and commercial buildings, which surround it.

The Main Street and Ark Row subareas serve as a reminder of Tiburon’s origins as a small port and railroad town. While of modest construction, older buildings, and the new buildings that emulate them, present a village atmosphere that is human in scale and rooted in the past.
In 1999, forty buildings were evaluated for the Downtown Tiburon Historic Resources Study and in 2001 the Town adopted a Local Historic Inventory for Downtown Tiburon including 23 buildings. In 2010, the Town updated the inventory by resolution and removed the Harbor Light Building, 20 Main Street, from the inventory. In 2011, an initial historic evaluation was conducted for the building at 1694-1696 Tiburon Boulevard and found the structure did not possess any characteristics to qualify as a historic resource and the building was subsequently removed from the inventory. The remaining resources listed in the local historic inventory
are identified in Table C-1 in the Conservation chapter and shown in Figure DT-3.
Recent State housing laws require streamlined approval of qualifying projects with relatively few exceptions for local jurisdictions to exercise discretion. One such exception is if development would require the demolition of a historic structure that was placed on a national, state, or local historic register. Per California Public Resources Code Sec. 5020.1, a local register of historical resources means a list of resources that are officially designated or recognized as historically significant by a local government pursuant to a local ordinance or resolution. Thus, the exception would be applicable to the buildings currently listed on Tiburon’s Local Historic Inventory.
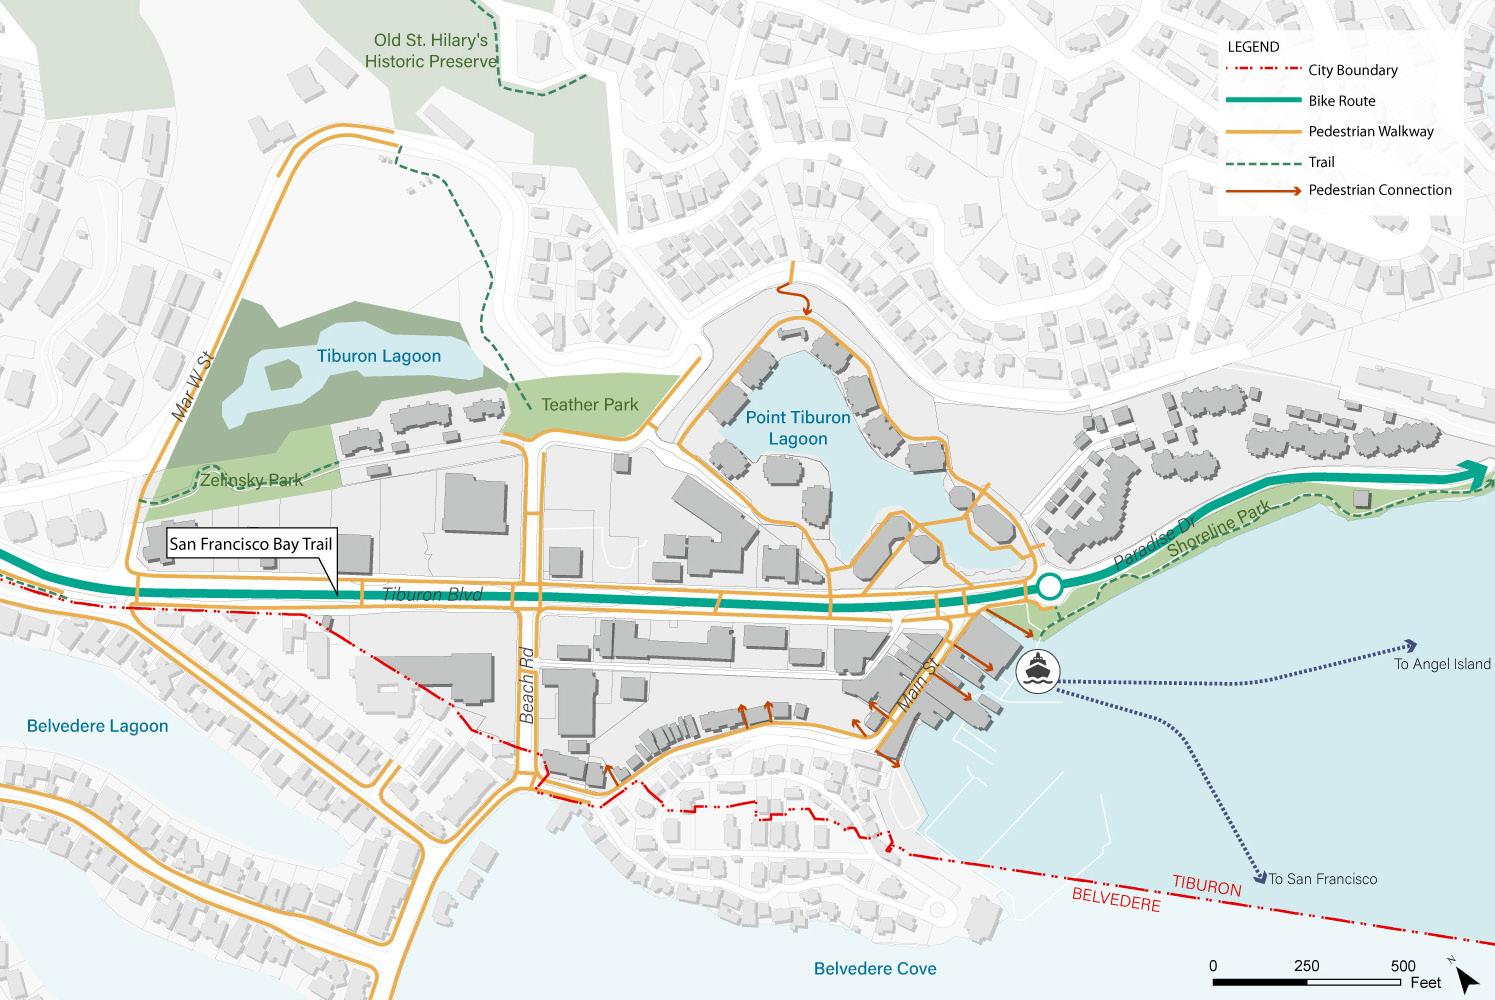
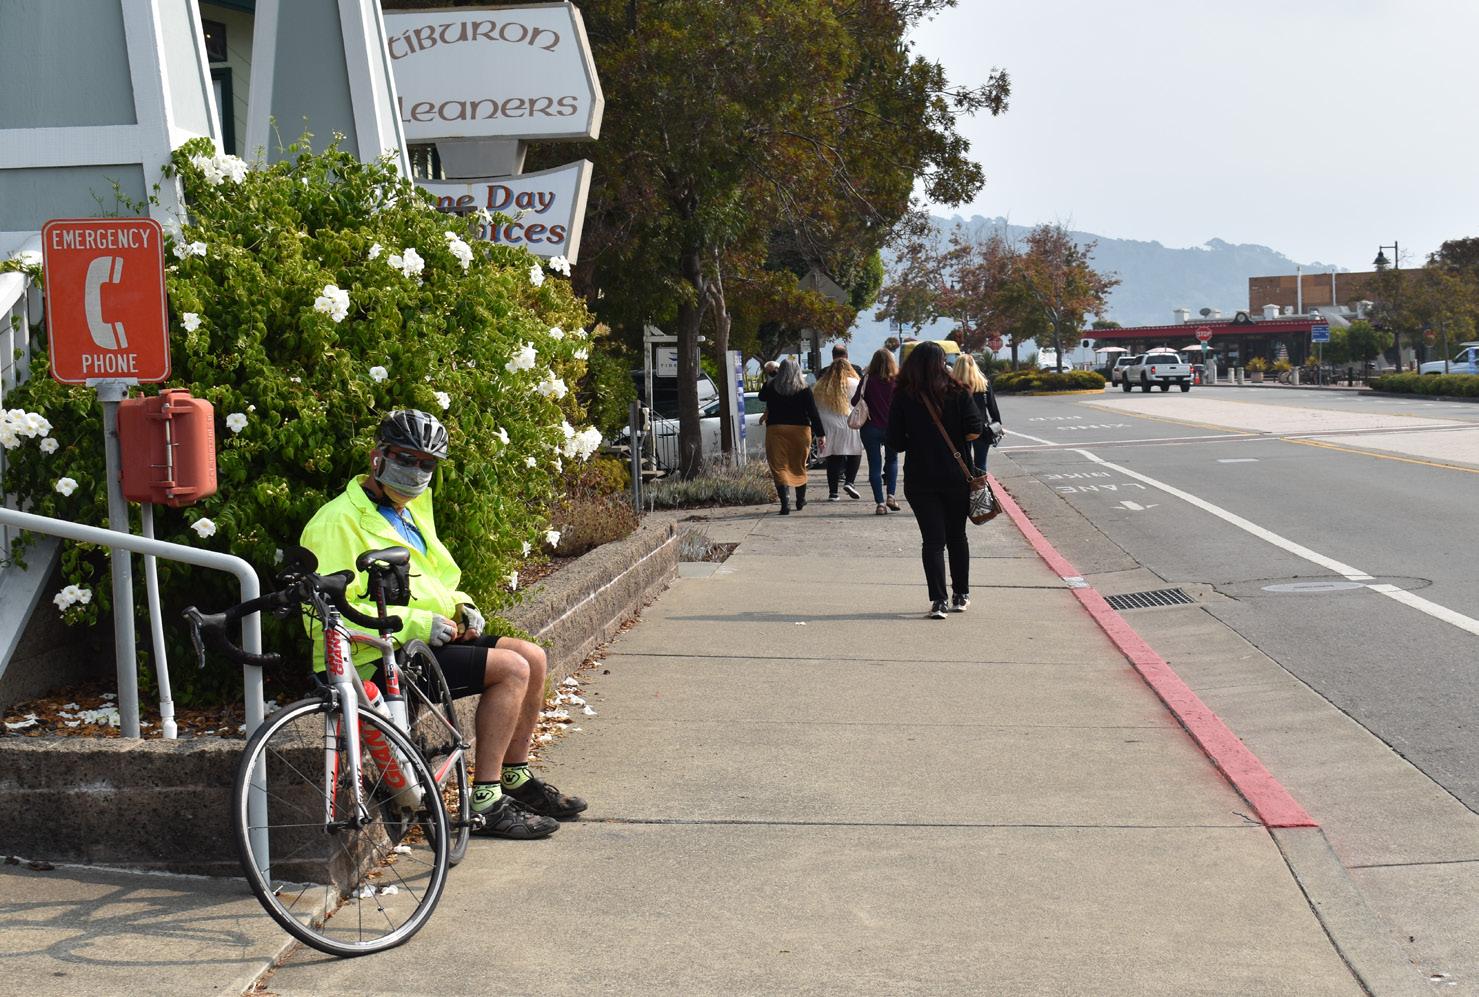
Downtown’s network of streets and paths offer relatively direct connections by car, bicycle, and on foot within Downtown and other parts of the community. Tiburon Boulevard (State Highway 131) provides access to Downtown from US Highway 101 and other parts of Marin County, while ferry service to San Francisco provides a direct connection to the region.
Tiburon Boulevard’s enhanced streetscape supports traffic flow while also providing continuous sidewalks and bicycle lanes, landscaped medians, and paving and special lighting. Still, the wide right-of-way may offer further opportunities for pedestrians, as well as green infrastructure. The Tiburon Peninsula has become a destination for recreational cyclists; this is supported by the bike lanes on Tiburon Boulevard that carry on to Paradise Drive.
Both public and private ferry operators provide service between the privatelyowned Tiburon ferry terminal, San Francisco, and Angel Island. There is no dedicated ferry parking; ferry users use nearby parking lots, are picked up and dropped off, or arrive on bus, bike, or foot.
Downtown provides a unique walking environment, with Main Street’s intimate scale and mix of uses, paths along the wharf, the shoreline, and the lagoon at Point Tiburon. This Plan envisions continued enhancement of the downtown pedestrian environment.
Downtown Tiburon provides a unique walking environment, as well as access for bikes, cars, and ferry connections.
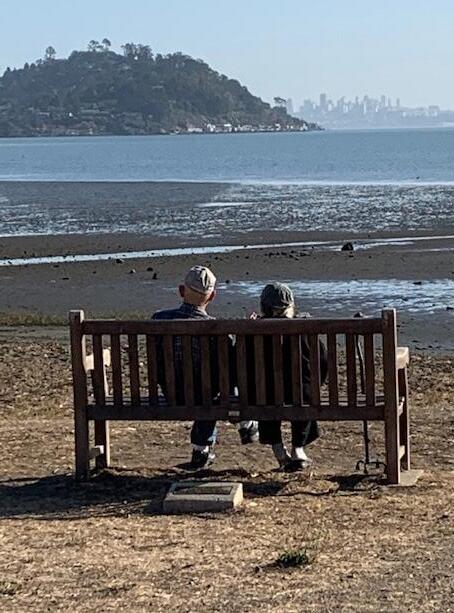
A central part of what makes Downtown Tiburon memorable is its relationship to the Bay. Public access extends along the Downtown shoreline, from the wharf behind Main Street through Shoreline Park and beyond. The Ferry Terminal, and ferry service to San Francisco and Angel Island, allow Tiburon residents and visitors to embark and arrive by water, and to fully experience that connection.
Approaching from the west, Tiburon Boulevard provides a view to the Bay which becomes closer as one travels toward Downtown.
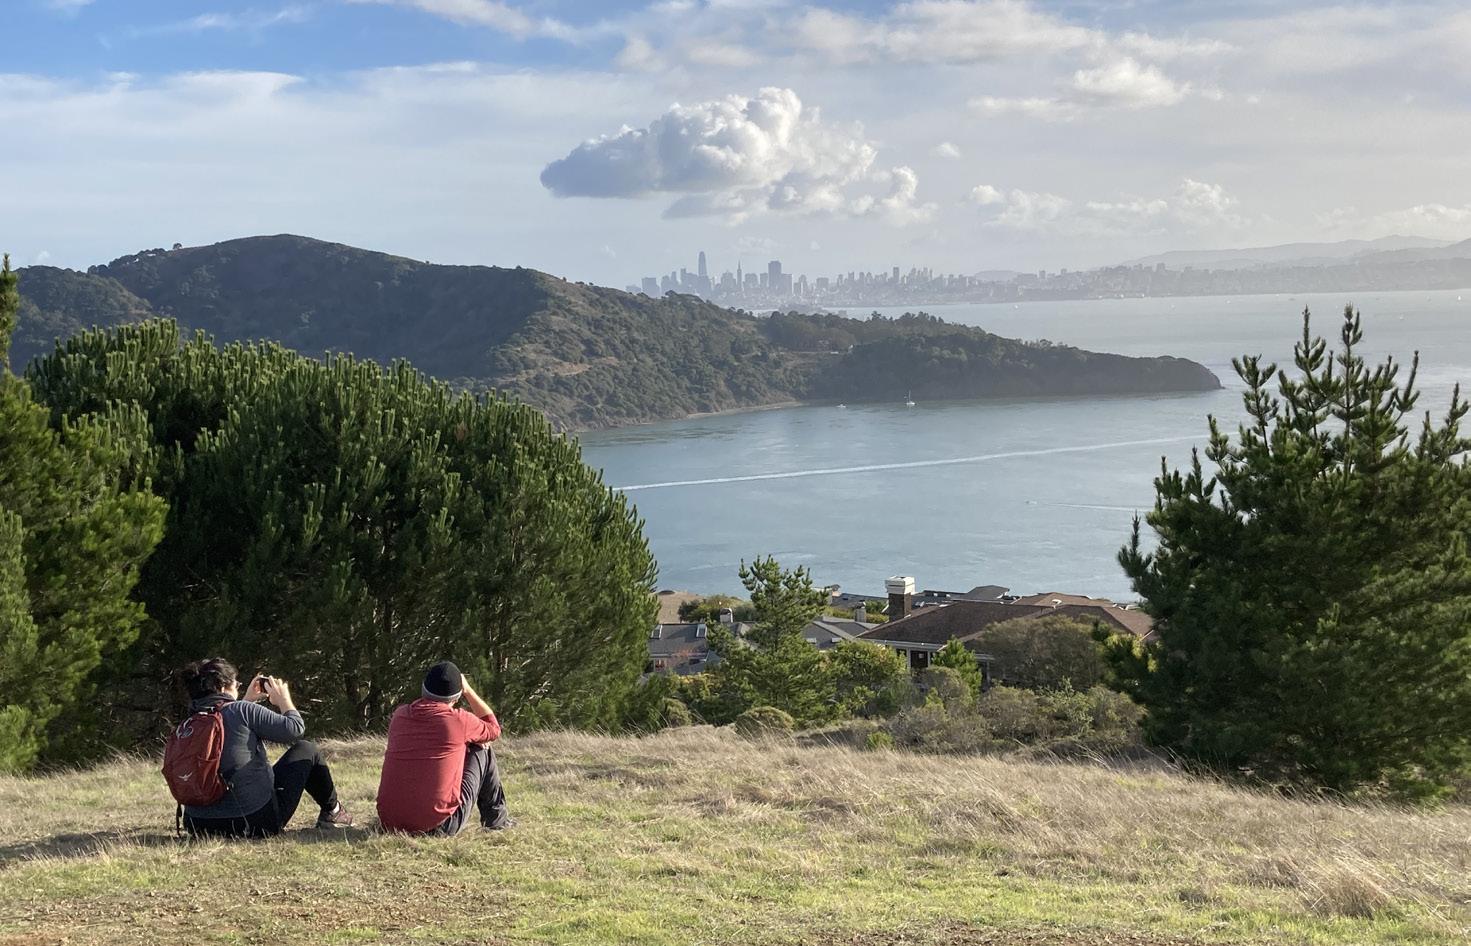
Downtown is also framed by views to Corinthian Hill to the south behind Ark Row, and to the Tiburon peninsula upland neighborhoods and open spaces to the north. These northern views also take in the low-lying parks, open spaces, and lagoons at the base of the ridge.
Downtown Tiburon will continue to be shaped by the experience of its natural context, with support from this Plan.
SHORELINE
Downtown offers memorable views out to the bay and to open spaces on Tiburon Ridge.
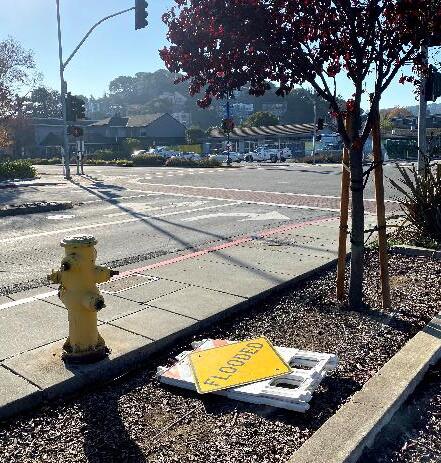
Downtown Tiburon’s low elevation, high water table and proximity to the Bay and the Belvedere Lagoon make it vulnerable to flooding today. Much of Downtown is within the 100-year flood zone, including the Boardwalk Shopping Center, Town Hall, and the Fire Station. During heavy rainfall conditions, and especially when combined with high tides, certain areas are known to flood, including the area around Beach Road and Tiburon Boulevard.
This vulnerability will become more acute as time goes on due to sea level rise resulting from climate change. Marin County established the Bay Waterfront Adaptation & Vulnerability Evaluation (BayWAVE) program to study and address sea level rise. In June 2017, the BayWAVE program delivered the Marin Shoreline Sea Level Rise Vulnerability Assessment. This Assessment seeks to provide context and estimates of the physical and fiscal impacts across the County’s bayside shoreline over the coming decades.
Based on BayWAVE models, about 50 acres in Downtown are likely to be vulnerable in the near- and mediumterm, including buildings along Main Street as well as portions of Bay Road and the Boardwalk shopping center. In the long-term, much of Downtown Tiburon may be vulnerable to inundation. Vulnerable downtown assets include Tiburon Boulevard and other streets; the Bay Trail; the Ferry Terminal; the Tiburon Fire Department, library, and post office; historic buildings along Main Street; hotels, shops, businesses, and housing. (Marin County Department of Public Works, June 2017). While these projections are critical to our ability to prepare and adapt, these projections may not present a complete picture of rising water levels in specific locations. Sea level rise will be accompanied by rising groundwater levels, fluvial flooding, and shoreline erosion. The interaction of these factors – as well as the potential for liquefaction associated with seismic
events—will create localized conditions that are as yet not fully understood. The Safety + Resilience chapter (Chapter 11) provides more detail on flooding and sea level rise.
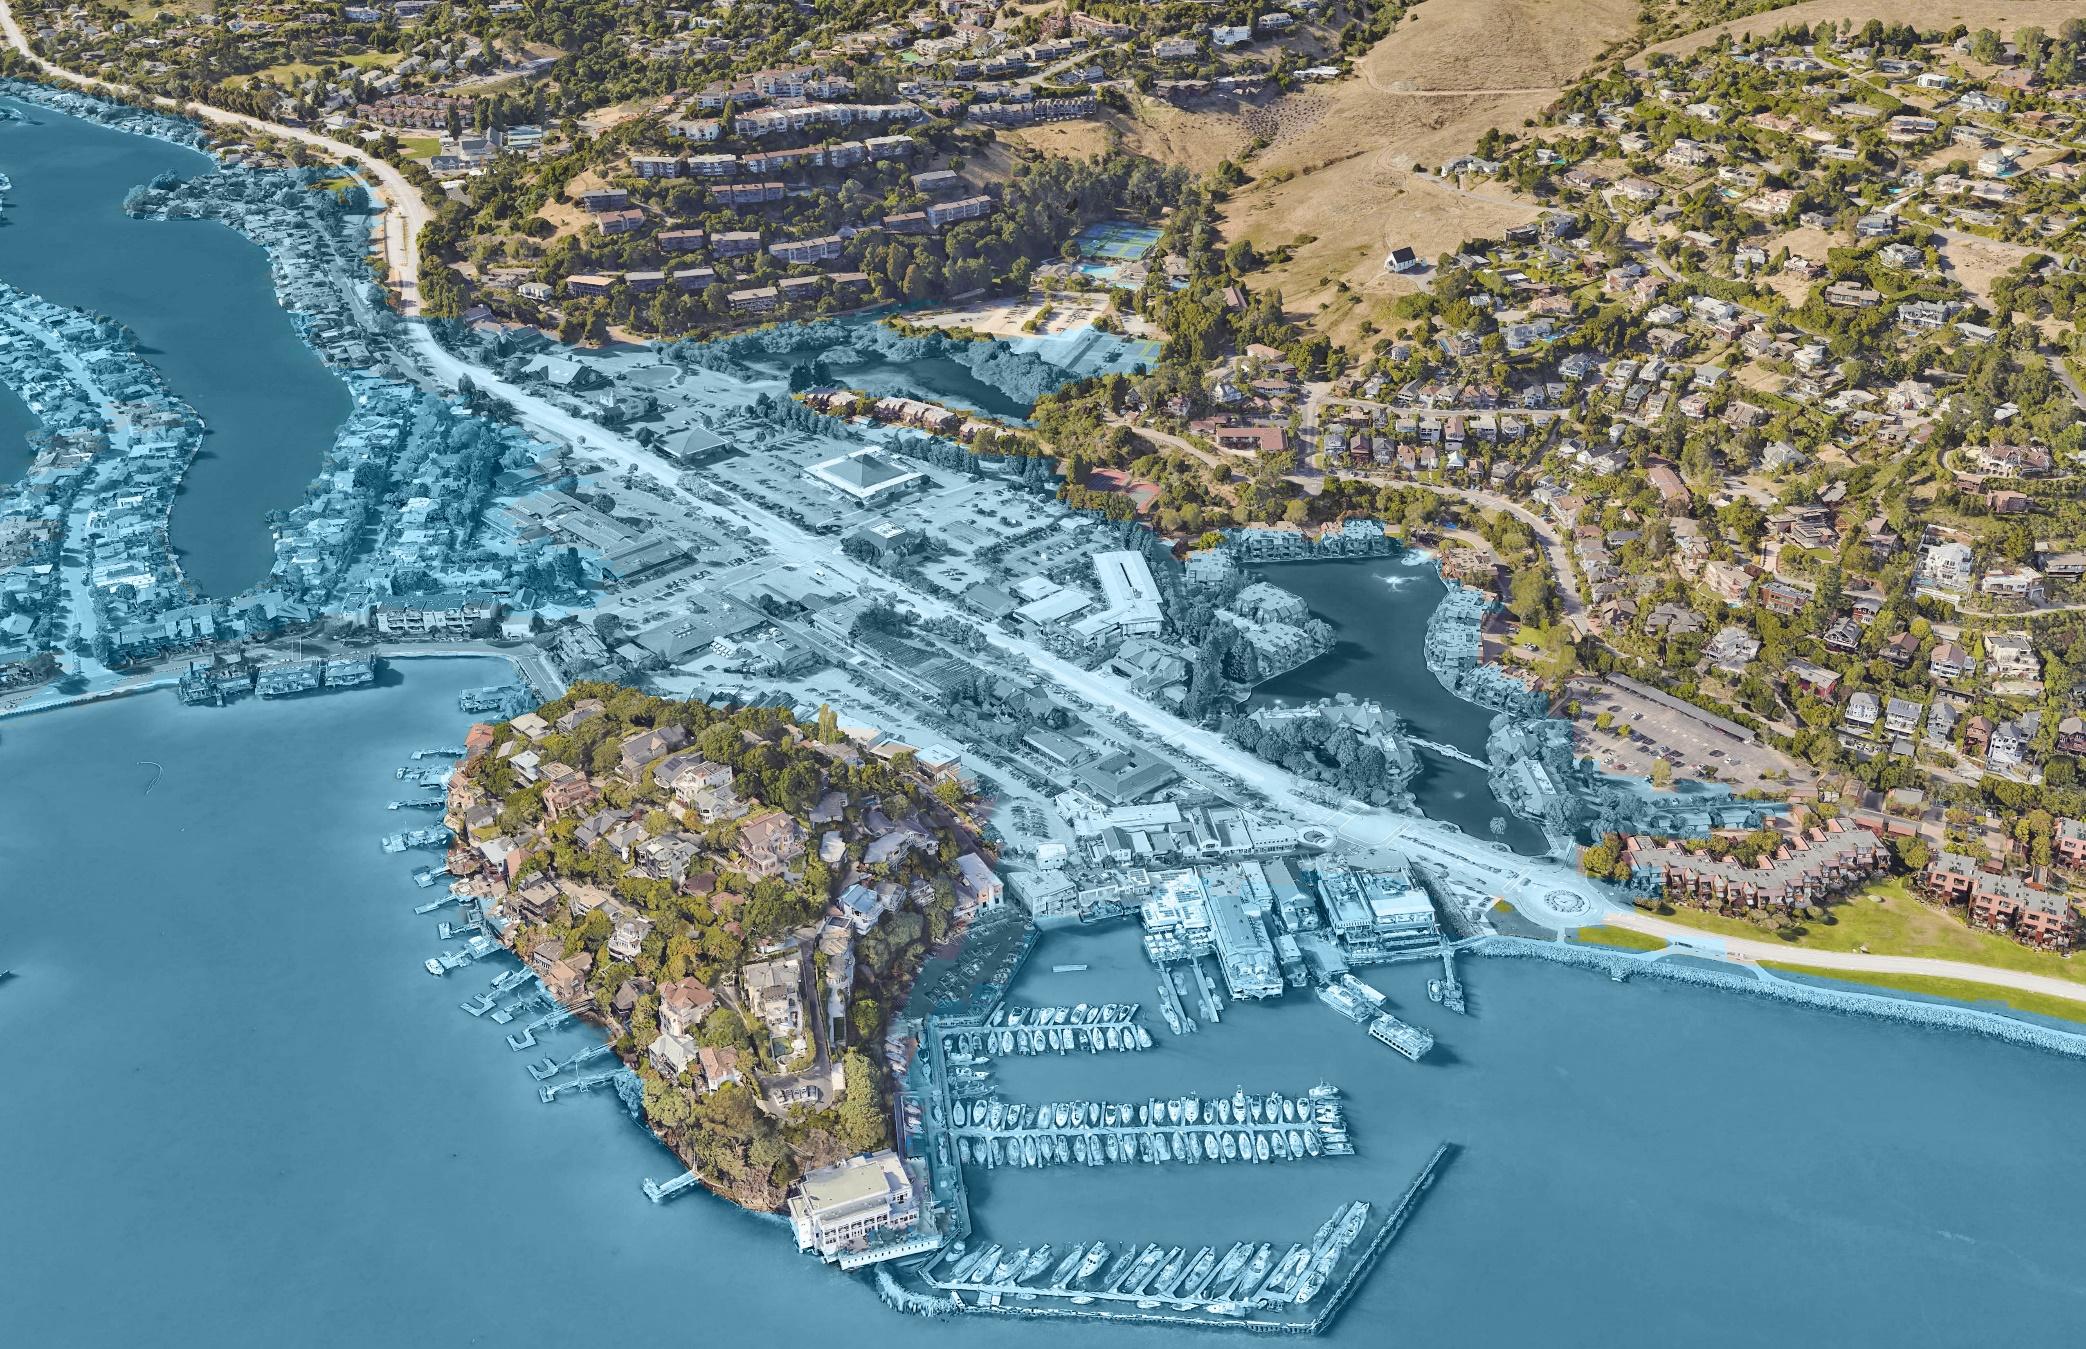
This series shows Downtown Tiburon and vicinity with shallow groundwater intrusion, shown in yellow, and tidal inundation at 10”, 20”, and 50” of sea level rise, shown in green. These modeled levels are based on Marin County’s BayWave model, which projects these levels to be reached in 2030, 2050, and 2100, respectively.
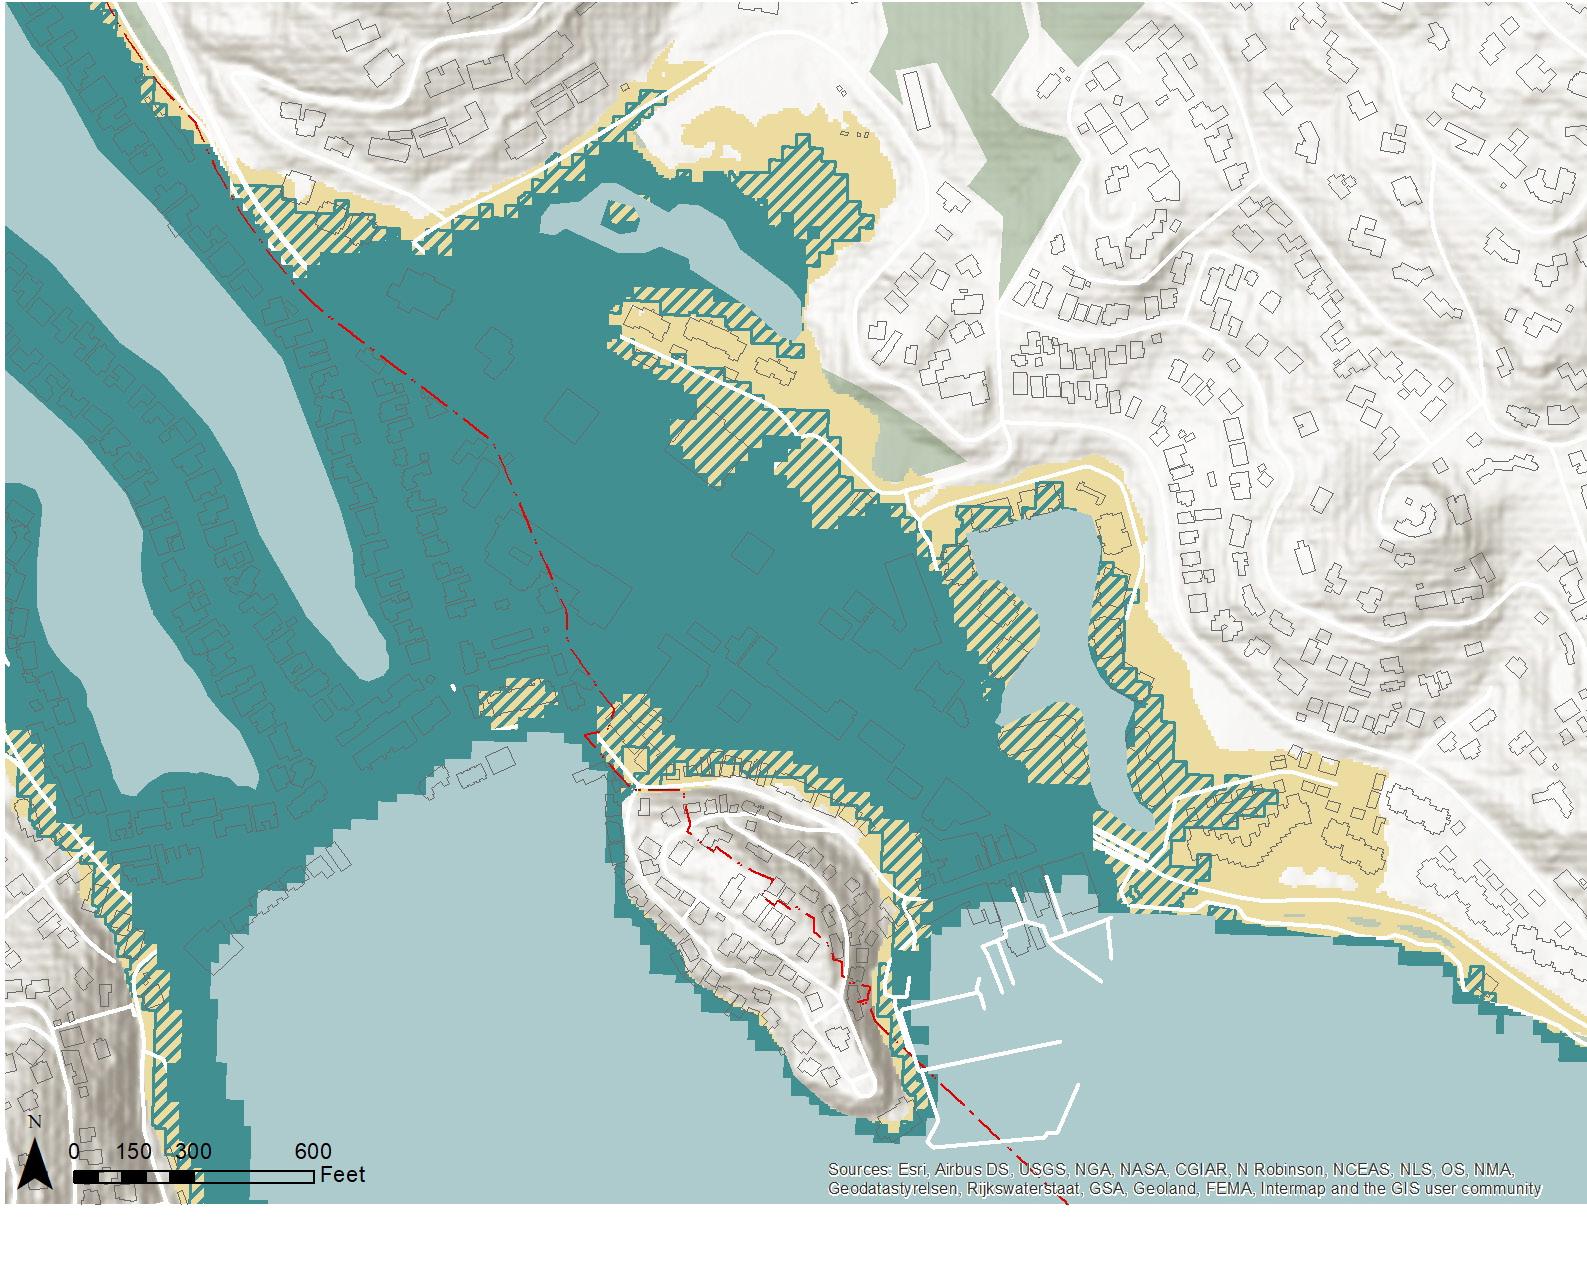
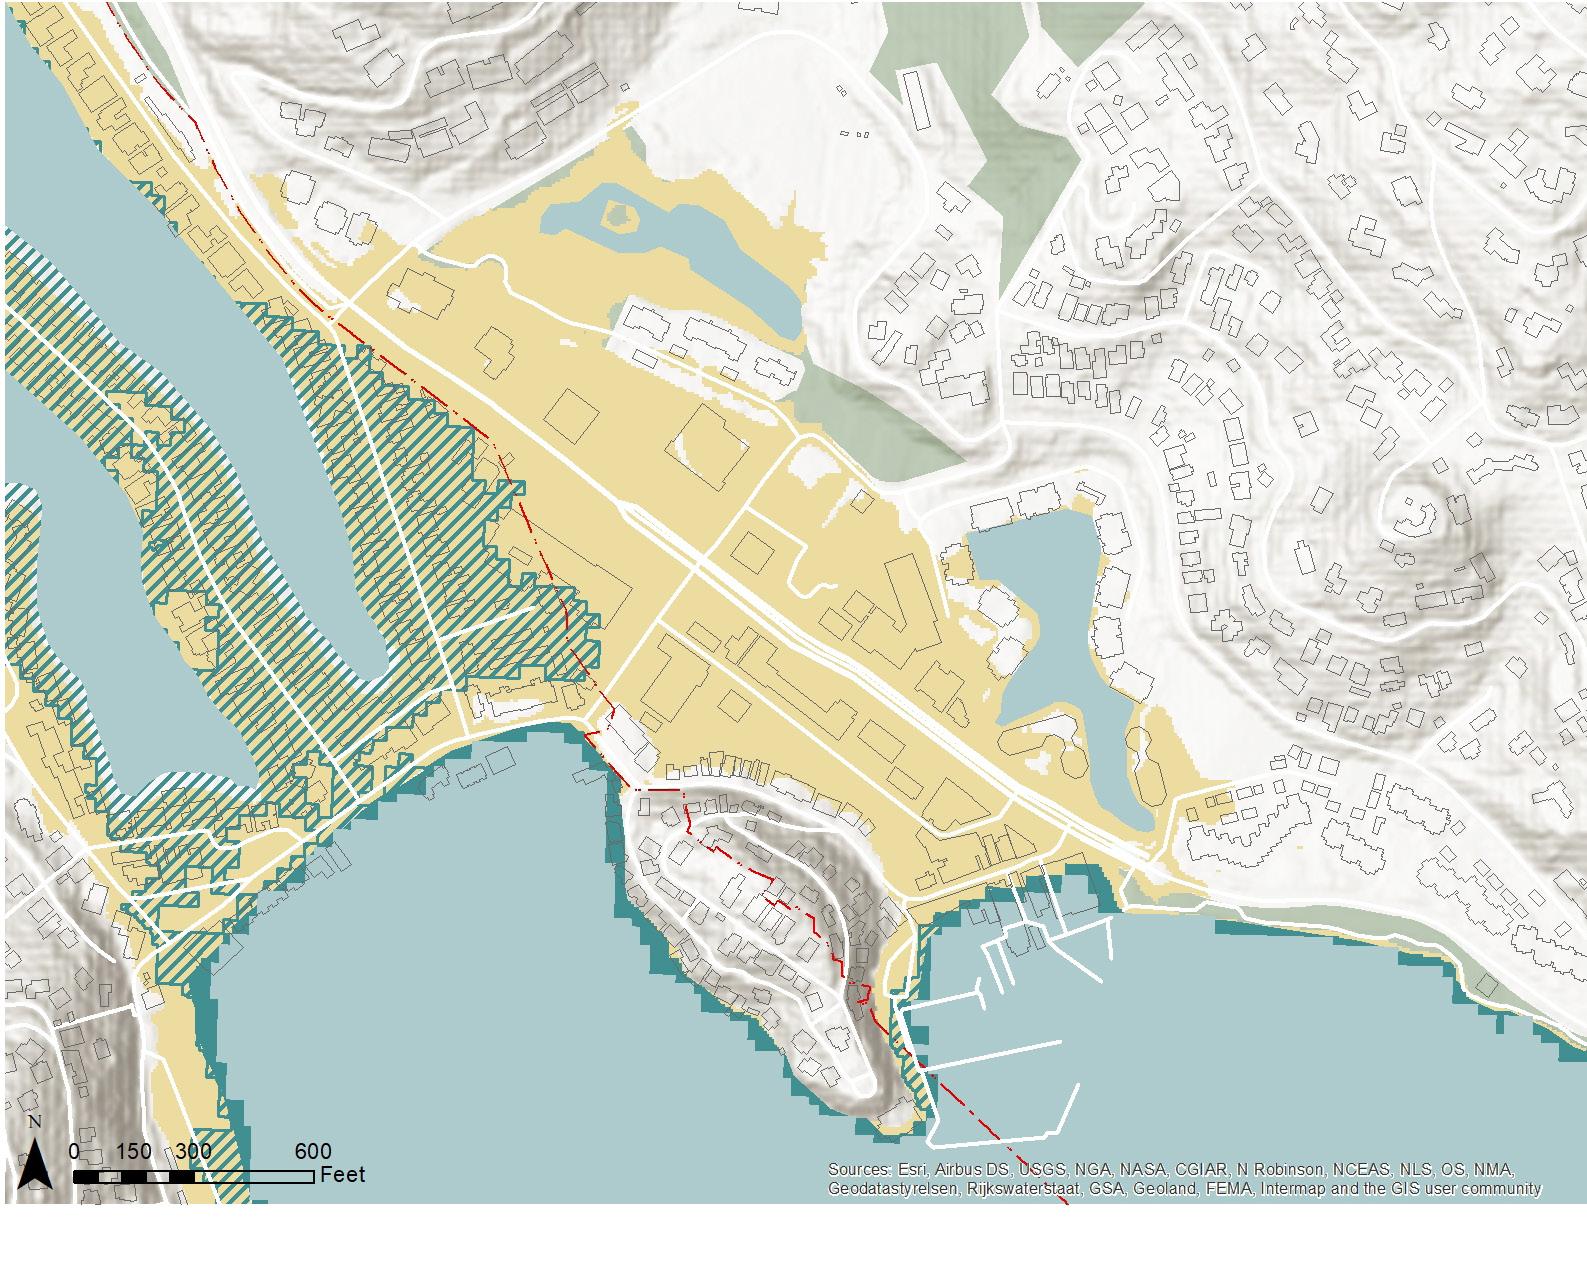
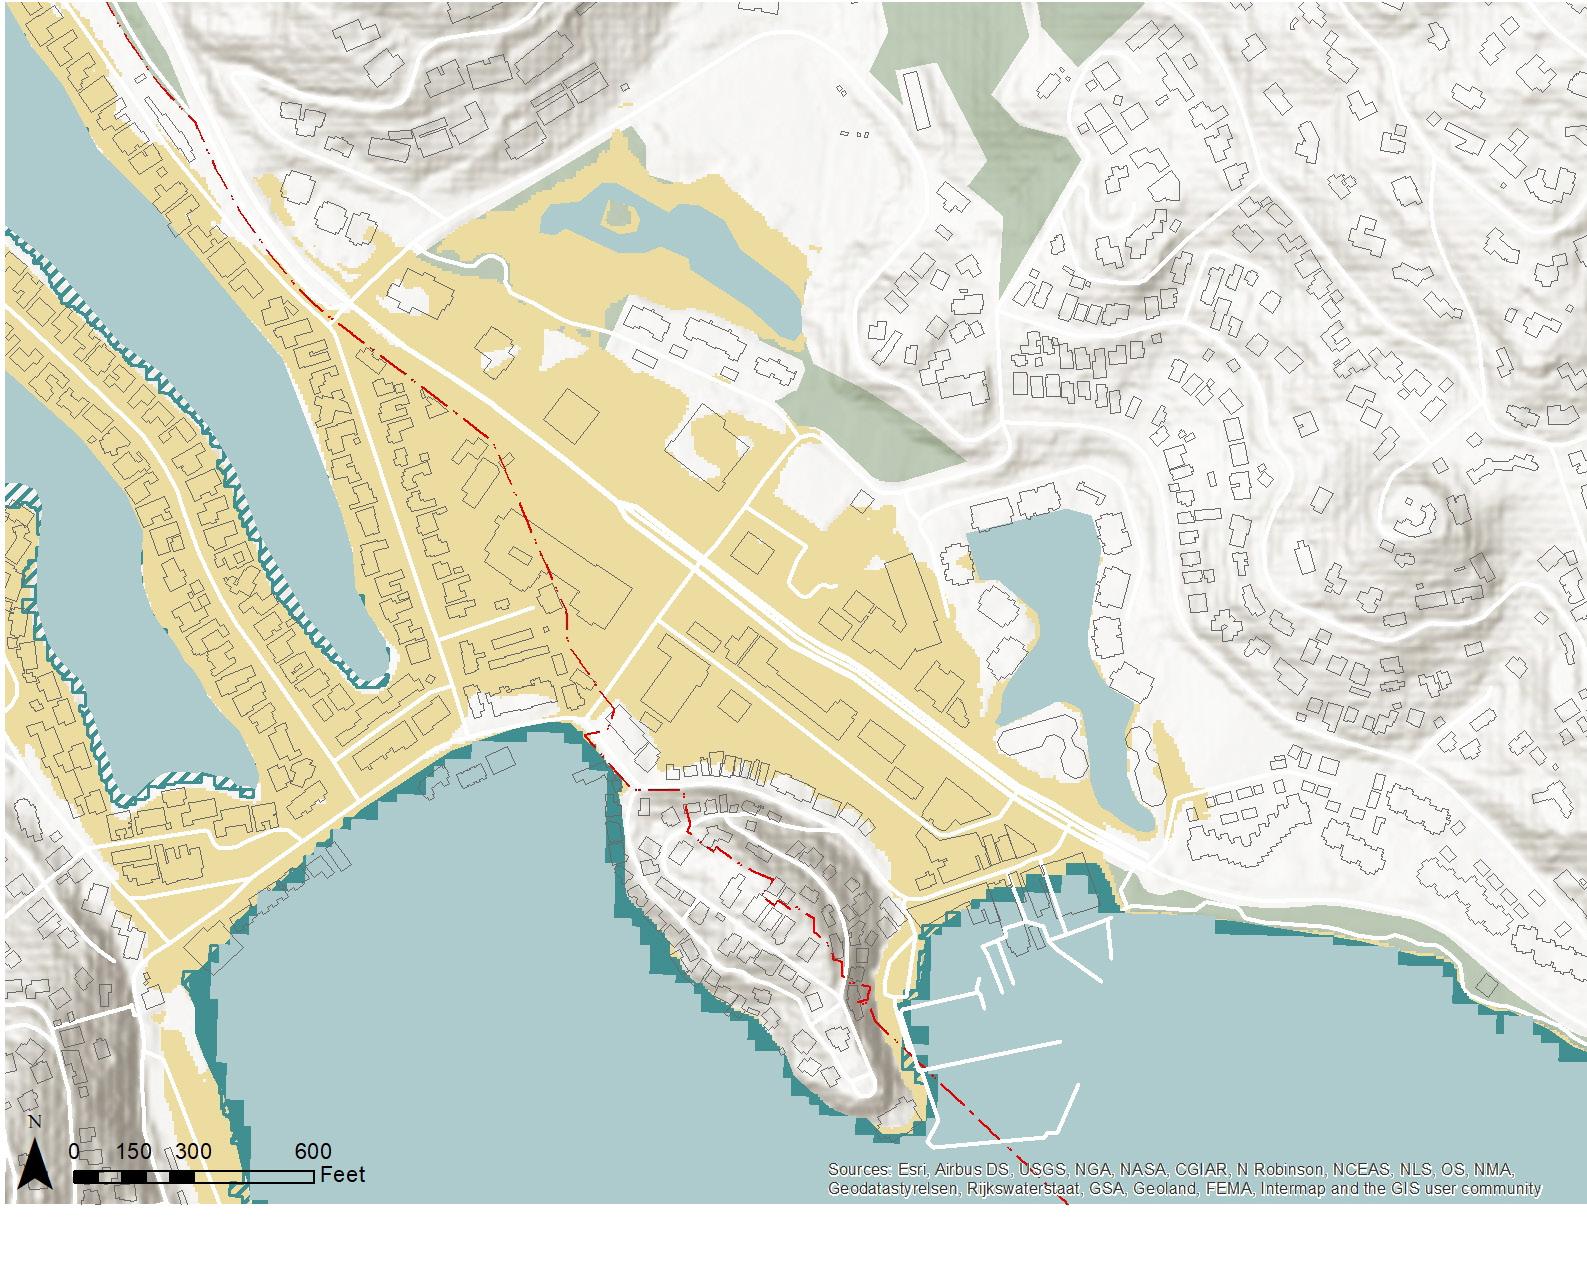
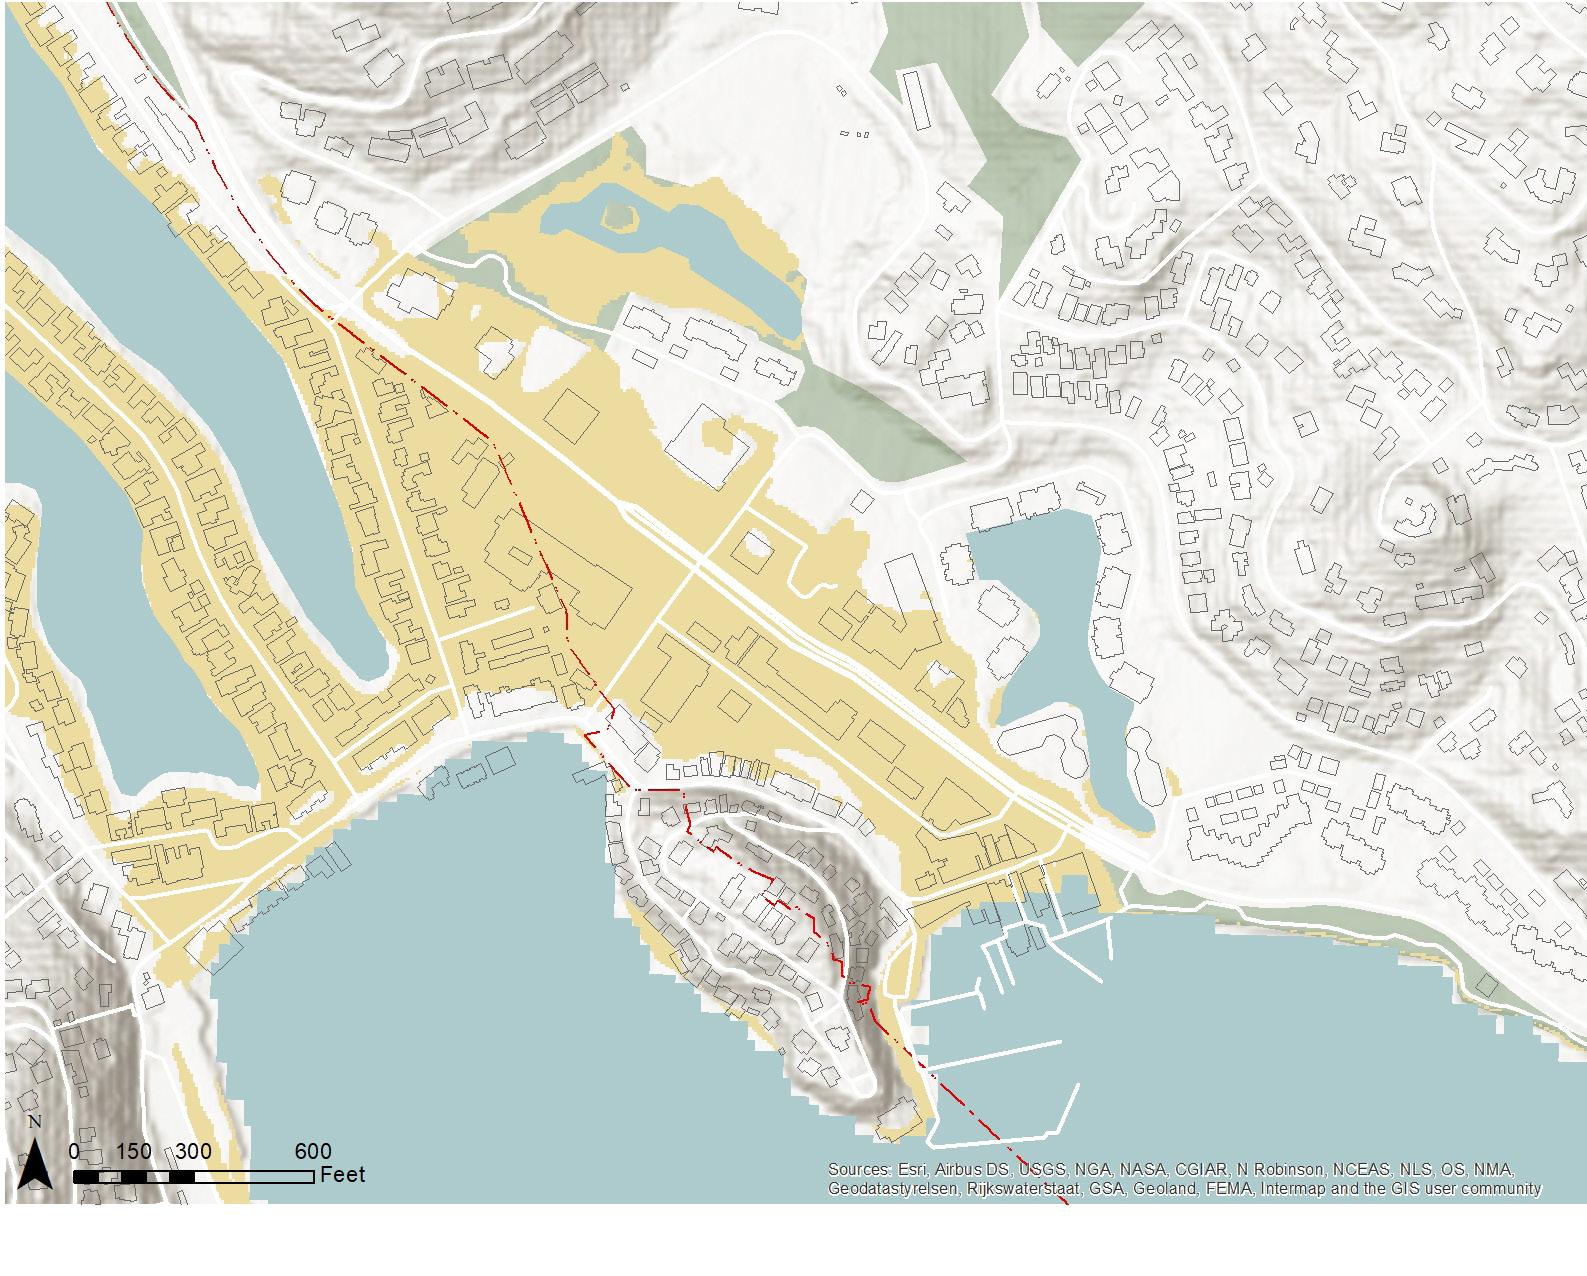
Existing conditions plus shallow groundwater intrusion.
Sea level rise + 100-year flood.
Sea level rise + 100-year flood.
Sea level rise + 100-year flood.
This diagram shows vulnerable assets in downtown Tiburon with 60" of sea level rise scenario combined with 100 year flood as modelled by BayWAVE. Adaptation strategies will address these vulnerabilities.
The General Plan update process, including community engagement through surveys, workshops, Planning Commissions and Council meetings, has revealed a shared vision for Downtown. Elements of this vision are described below.
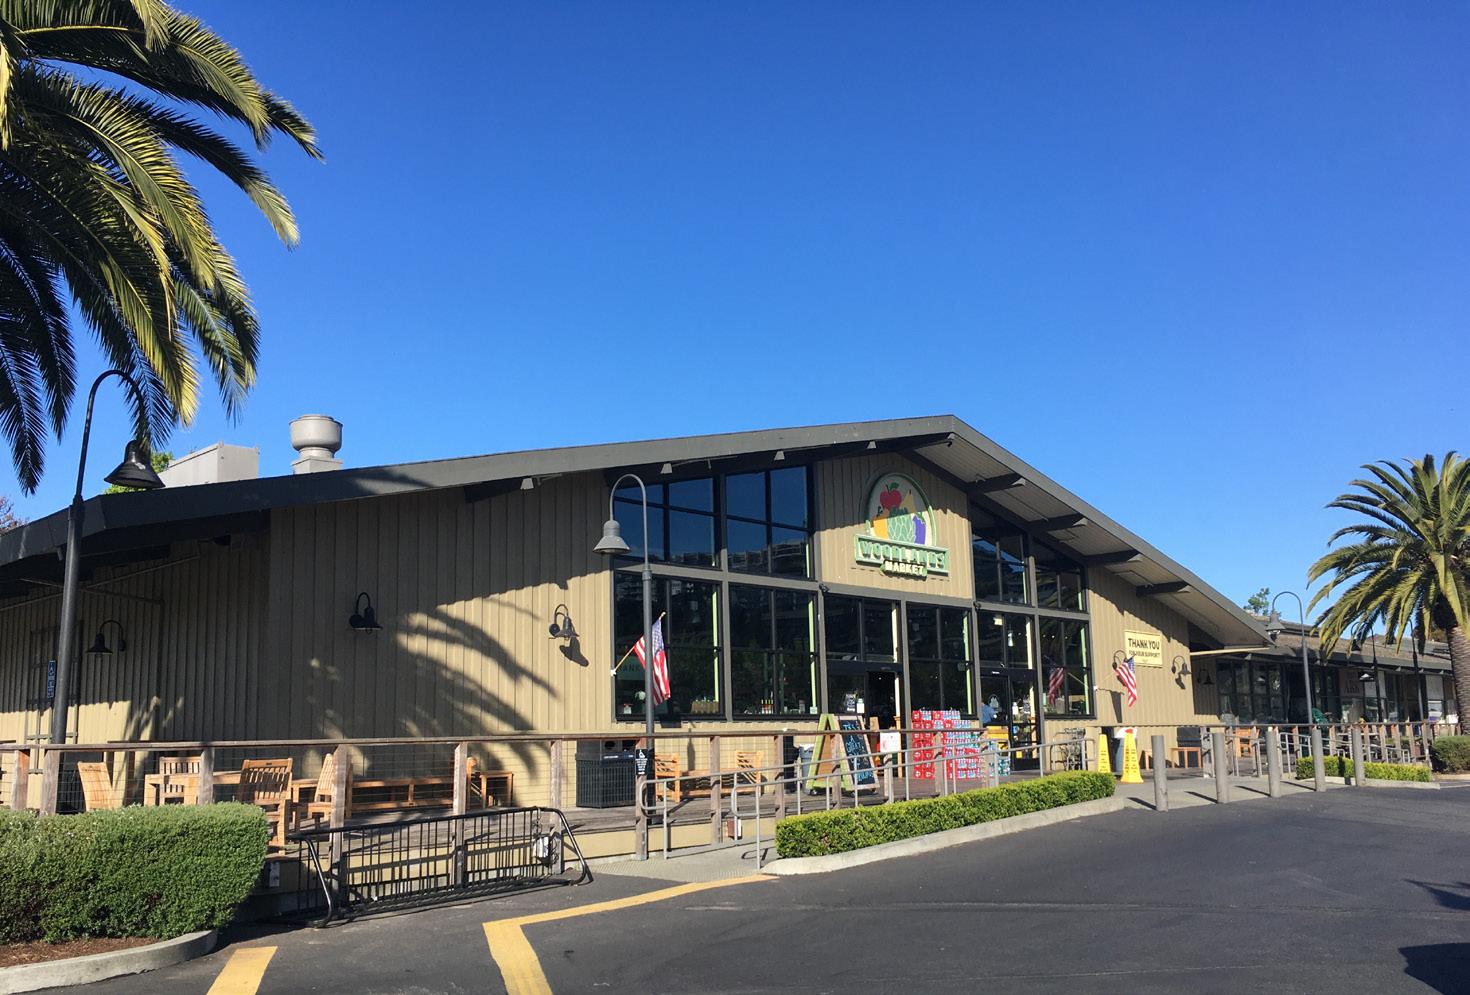
Downtown should be a retail destination with thriving businesses that offer diverse goods and services, from basics like groceries to specialties like galleries, boutiques, cafes, and restaurants. Downtown’s retail experience should be connected by beautiful pedestrian environments that extend along Main Street and Tiburon Boulevard. Downtown also provides space for the professionals, local artisans, and service providers that make a place thrive.
Downtown should be a culturally vital place where people can experience
live performances, good food, and art. Downtown is also a center for civic activity. It is a place for festivals and parades, as well as the nucleus of local government.
Downtown Tiburon is a welcoming place, attracting people from around the Bay Area, the country and the world with its incredible natural setting, smalltown charm, and great offerings.

Downtown Tiburon will be an active hub, with thriving businesses, cultural events, entertainment, and enhanced public spaces and amenities.
Downtown Tiburon is a walkable place. Its walkability is due to its special mix and concentration of businesses and activities, the way its buildings line the street, creating a sense of place, and its safe, comfortable, and attractive sidewalks and public spaces. Main Street is Downtown’s heart, and the recent tradition of closing Main Street to traffic for special events should be continued and further explored, including consideration of redesigning Main Street with a focus on the pedestrian realm. Tiburon Boulevard will also become a better pedestrian environment, with contributions from new street-facing buildings, and streetscape enhancements. Existing and new paseos will create pathways between downtown’s subareas and connect to the Bay and the hills.
Downtown Tiburon’s streets, paseos, and pathways will create a high-quality walking environment.
As a result of climate change, Tiburon must recognize that the shoreline may not be able to be maintained in place without new investments in both traditional and nature-based infrastructure. These investments should be considered in tandem with adjusted expectations for land use and buildings as the community continues to change and develop. Adaptation strategies for Downtown should be designed to protect those assets that are most valued by the community, and to provide multiple benefits, like pedestrian and bike paths, streetscape enhancements, and habitat restoration. Policies and programs in Section 11.8 provide a roadmap for the Town to pursue adaptation in the years ahead.
Downtown
Source: NACTO
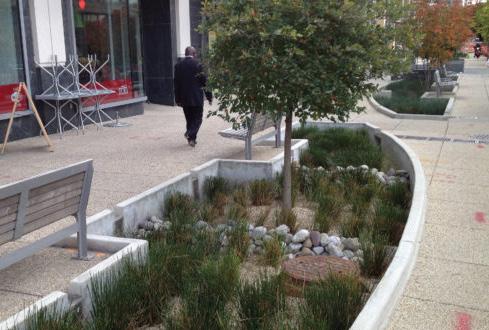
Downtown has the potential to become a vibrant residential neighborhood. Downtown housing can serve Tiburon residents who are aging and would like housing that allows them to walk to cultural attractions and engage in community life. It can serve young adults who grew up in Tiburon and would like to stay. Downtown housing can also invite Tiburon’s teachers, nurses, and workers who presently commute in to be part of the community. While many downtowns “roll up the sidewalks” at night, housing can make Downtown more active and inviting for everyone, increasing patronage of local businesses, and broadening of the types of goods and services offered. In Downtown, new development can fill in street fronts that are now lined by parking lots and, in doing so, create a human-scaled, village-like place. New street-facing buildings can make
it possible to walk to local destinations along sidewalks lined by stores and porches. While larger parcels could result in buildings that are bigger than has occurred historically, design regulations will ensure appropriate scale.
New housing downtown will help nurture a diverse community and a thriving, humanscaled place. Examples shown here are from Lafayette, California (Above), and the unincorporated community of Strawberry, California (Below).
Tiburon has an exemplary, largely intact Main Street, where old, potentially historic buildings frame and activate the street. It gives a glimpse of what life in a small harbor and railroad town might have been like. New development should respect and reinforce this traditional pattern of building, while conserving of Tiburon’s historic resources is of cultural, social, and economic importance.
New development Downtown will honor and complement the Main Street fabric..
GOAL DT-A
Enhance Downtown’s role as the heart of the community and a thriving commercial and visitor destination.
GOAL DT-B
Promote pedestrian activity & enjoyment of life in Downtown through land use, design, & public investment.
GOAL DT-C
Support mixed-use development in Downtown, with an emphasis on
providing housing opportunities.
Promote a Downtown that is attractive to residents and visitors of all ages and backgrounds, with a mix of commercial activities and housing, public spaces, amenities, and events.
Encourage commercial land uses Downtown, including a mix of businesses serving residents & visitors.
Program DT-a Update the Zoning Ordinance and Design Handbook. Update the Tiburon Zoning Ordinance and the Tiburon Design Handbook to be consistent with the goals and policies of this chapter as they pertain to land use mix and activation.
Encourage mixed-use development that includes housing in combination with retail, restaurants, offices, or community uses in Downtown Tiburon.
Where essential to provide foot traffic that supports shops and preserve maintain Main Street’s and Ark Row’s character, require that new development feature commercial street frontages. These ground-floor spaces may be occupied by a wide range of retail and restaurant uses; personal services; or community uses such as daycare or performance spaces.
Limit office uses in existing or new ground-floor spaces to promote active street life.
Create opportunities for a variety of multifamily housing downtown, with or without ground-floor commercial or community uses.
Actively promote the economic vitality of Downtown, in partnership with local businesses and organizations.
Program DT-b Chamber of Commerce.
Sustain partnerships with the Chamber of Commerce to improve the business climate and support local businesses.
Preserve and enhance the historical attributes and small-town character of Downtown that exists on Main Street and Ark Row.
Extend Downtown’s human-scaled small-town environment along Tiburon Boulevard from the Library to the Bay. Encourage an active pedestrian environment and alternative means of transportation.
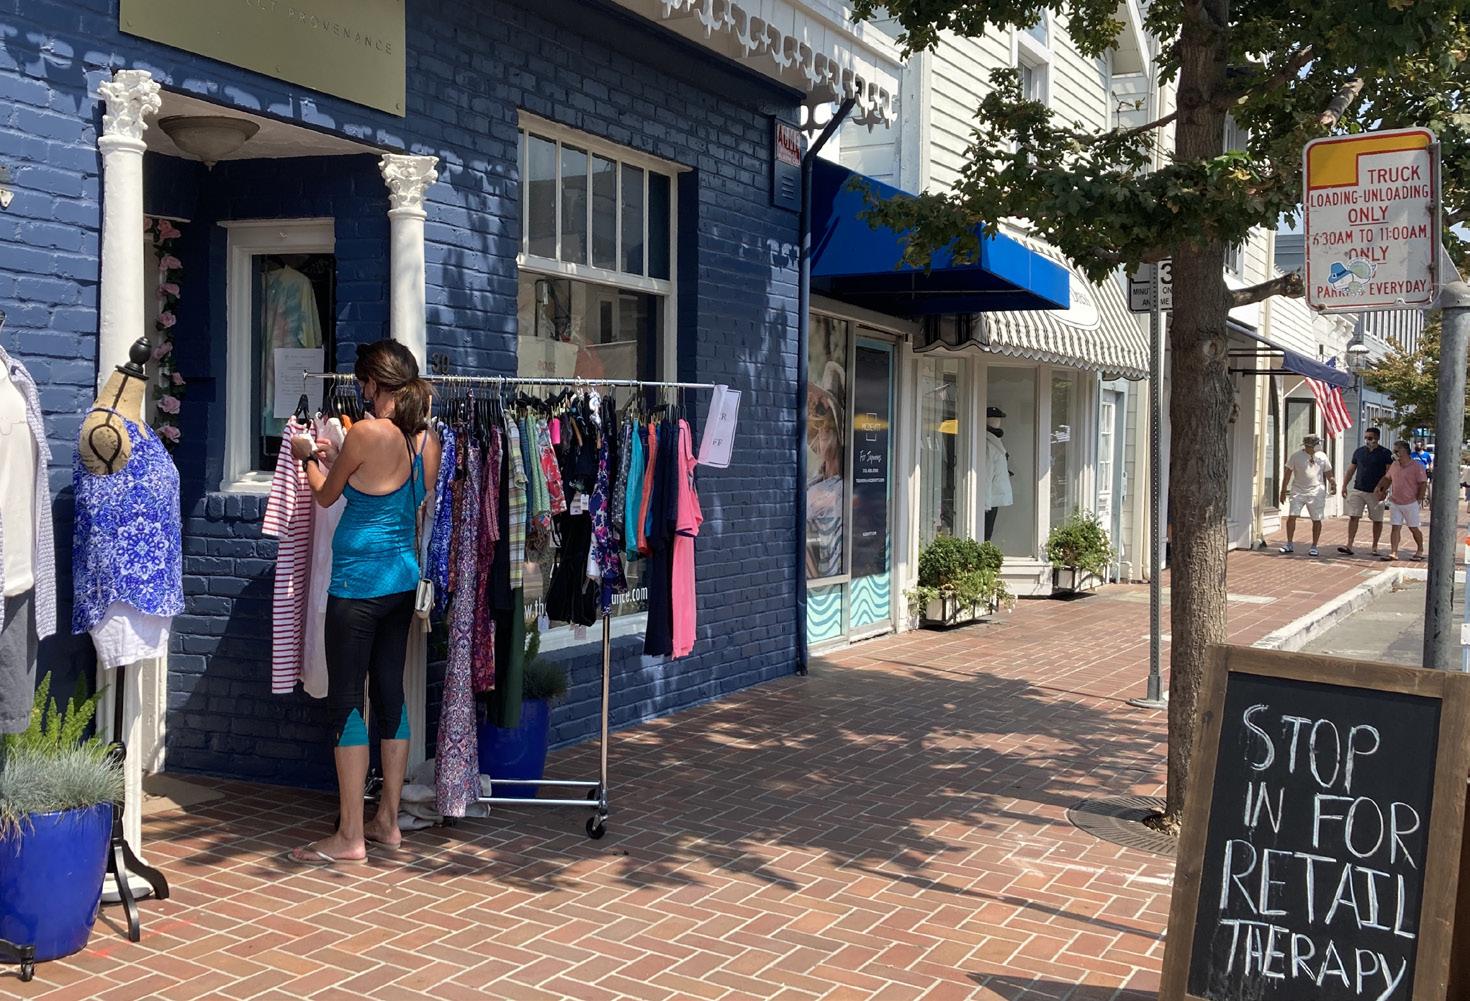
Main Street exhibits mixed-use buildings with active retail.
Support and enhance Tiburon’s distinct small-town character in each of Downtown’s subareas through design of buildings and public space. Reinforce Main Street as a humanscaled community gathering place framed by continuous storefronts. Preserve Ark Row as an intimate assemblage of small buildings with amenity-rich street frontage. Along Tiburon Boulevard, create a villagelike extension of Downtown that maintains Downtown’s scale and sense of place. Celebrate Tiburon’s scenic waterfront and connection to the Bay along Shoreline Park. Maintain a sense of neighborhood in Point Tiburon. Embody Tiburon’s history and aspiration for a more resilient and equitable future in its Civic Hub.
Facilitate development of properties around the intersection of Tiburon Boulevard and Beach Road to create a new activity hub with opportunities for walkable retail and multifamily housing downtown.
Encourage preservation of significant historic buildings and resources Downtown, through implementation of the California State Historic Building Code and additional guidance provided by the Town of Tiburon.
Explore incentives to support the Town’s historic preservation goals.
Character-defining elements of buildings listed on the Town’s Inventory of Local Historical Buildings (Resolution No. 07-2001 as amended) shall be retained, preserved, and restored wherever feasible.
Retain and rehabilitate the historic arks, cottages, and other resources of Ark Row consistent with The Secretary of the Interior’s Standards for Rehabilitation & Illustrated Guidelines for Rehabilitating Historic Buildings.
Ensure that buildings contribute to a lively, active pedestrian environment at street level through build-to lines, setback areas that expand the public
realm, and ground-floor design characteristics including the following:
• storefront and building entrances that directly face the sidewalk;
• floor-to-floor heights that enable flexible commercial use and create a sense of welcome;
• visibility between the sidewalk and building interiors;
• canopies and awnings that provide shade and support business identity;
• harmonious, pedestrian-oriented signage; and
• opportunities for indoor and outdoor display and seating.
Encourage retail storefronts, cultural destinations, and active outdoor spaces for community gathering, such as sidewalk cafes, in order to make walking Downtown a stimulating and enjoyable activity.
Enable a mix of building heights for new construction, creating variety and accommodating a vibrant mix of uses.
Ensure new buildings are attractive additions to the downtown environment. This will be achieved through:
• placing buildings so that they line and define streets & public spaces;
• composing facades in a way that complements adjacent buildings or district character;
• breaking up the massing of large buildings into increments;
• providing variation in building height, allowing for solar access while maintaining a continuous streetwall; and
• incorporating façade projections and recessed storefronts that add variety and pedestrian comfort at street level.
Program DT-d Update the Zoning Ordinance and Design Handbook. Update the Tiburon Zoning Ordinance and the Downtown Tiburon Design Handbook to be consistent with the goals and policies of this Element as they pertain to downtown building design and character and the need to provide objective development standards.
GOAL DT-F
Improve and enhance access to and movement through Downtown for all modes of travel, with an emphasis on pedestrian comfort and safety.
GOAL DT-G
Provide parking, electric vehicle charging stations, bike parking, pick-up/dropoff and loading areas that optimize use of the curbside and access for all.
Pursue potential circulation and design changes to Main Street, Tiburon Boulevard, and other downtown streets that would enhance multimodal access and visibility. Work to calm and minimize traffic.
Program DT-e Main Street Pilot Program.
Initiate a pilot program to test the feasibility of converting lower Main Street to a pedestrian-priority space. Study long-term design options, including the feasibility of a one-way couplet involving Main Street and Juanita Lane if deemed necessary. Redesign of Main Street should emphasize creating a high-quality pedestrian environment, address flood hazards, and respond to the need to adapt to sea level rise
Program DT-f Tiburon Boulevard Design.
Plan, design and implement streetscape improvements to Tiburon Boulevard’s public right-of-way to create a balanced transportation environment. These improvements may include, but are not limited to, traffic calming; widening sidewalks; providing pedestrian amenities; installing new street trees and vegetation; upgrading bike infrastructure; providing vehicle and transit access, on-street parking, and electric vehicle charging; and incorporating stormwater management and flood hazard mitigation.
Ensure that bicycle and e-bike access to and through downtown is safe and comfortable, for local trips and recreation.
Program DT-g Bicycle Infrastructure Improvements.
Initiate improvements to downtown bike facilities including designation and implementation of bike lanes, signage, pavement markings, & bicycle parking.
Program DT-h Bicycle Parking. Provide bike parking as part of streetscape improvements, including secure parking for e-bikes.
Support transit service and increased transit use, through advocacy, promotion and public communications, and contributions to streetscape enhancements that create a better transit user environment.
MAIN STREET TODAY
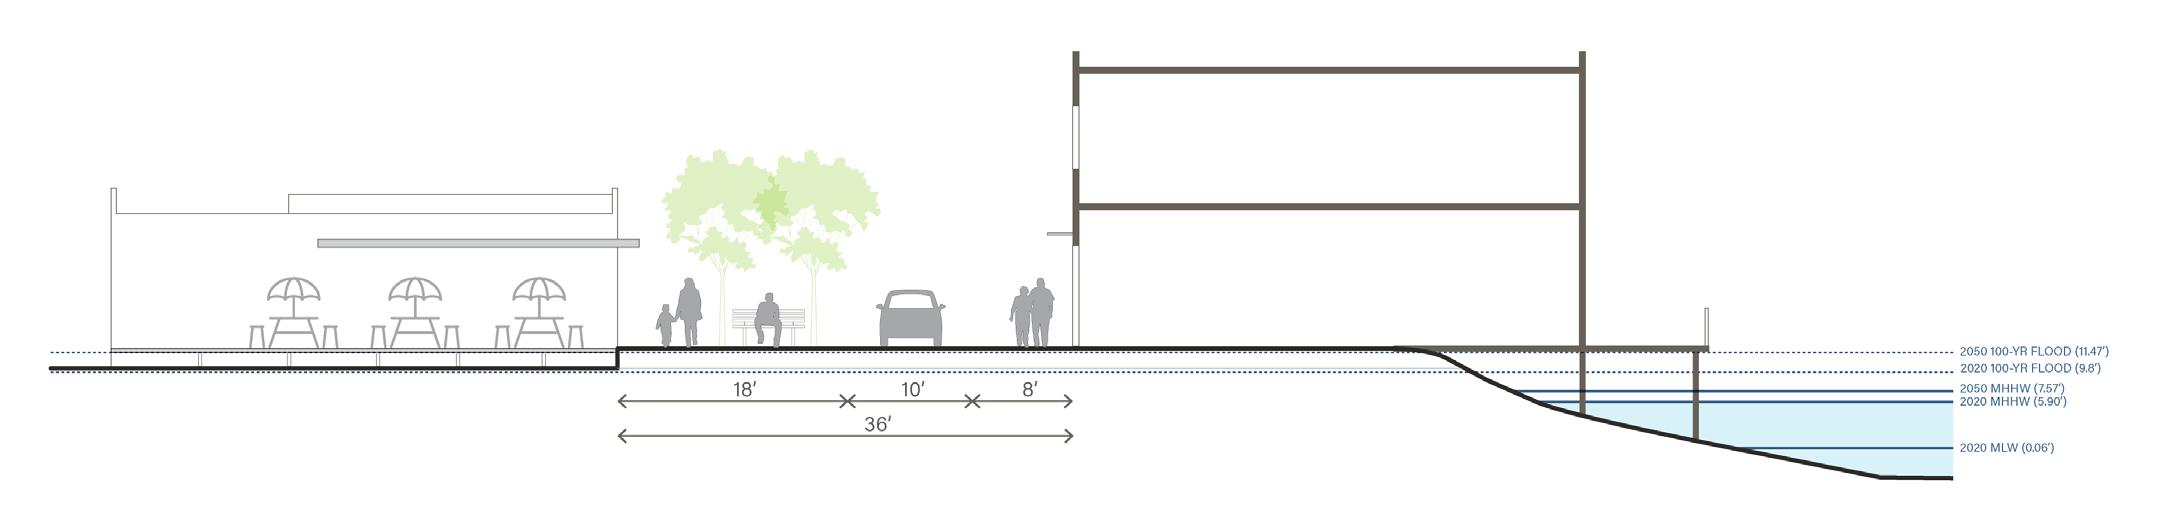
Main Street could be redesigned to have multiple benefits, including supporting more activity
downtown
Main Street could be redesigned to have multiple benefits, including supporting more activity
downtown
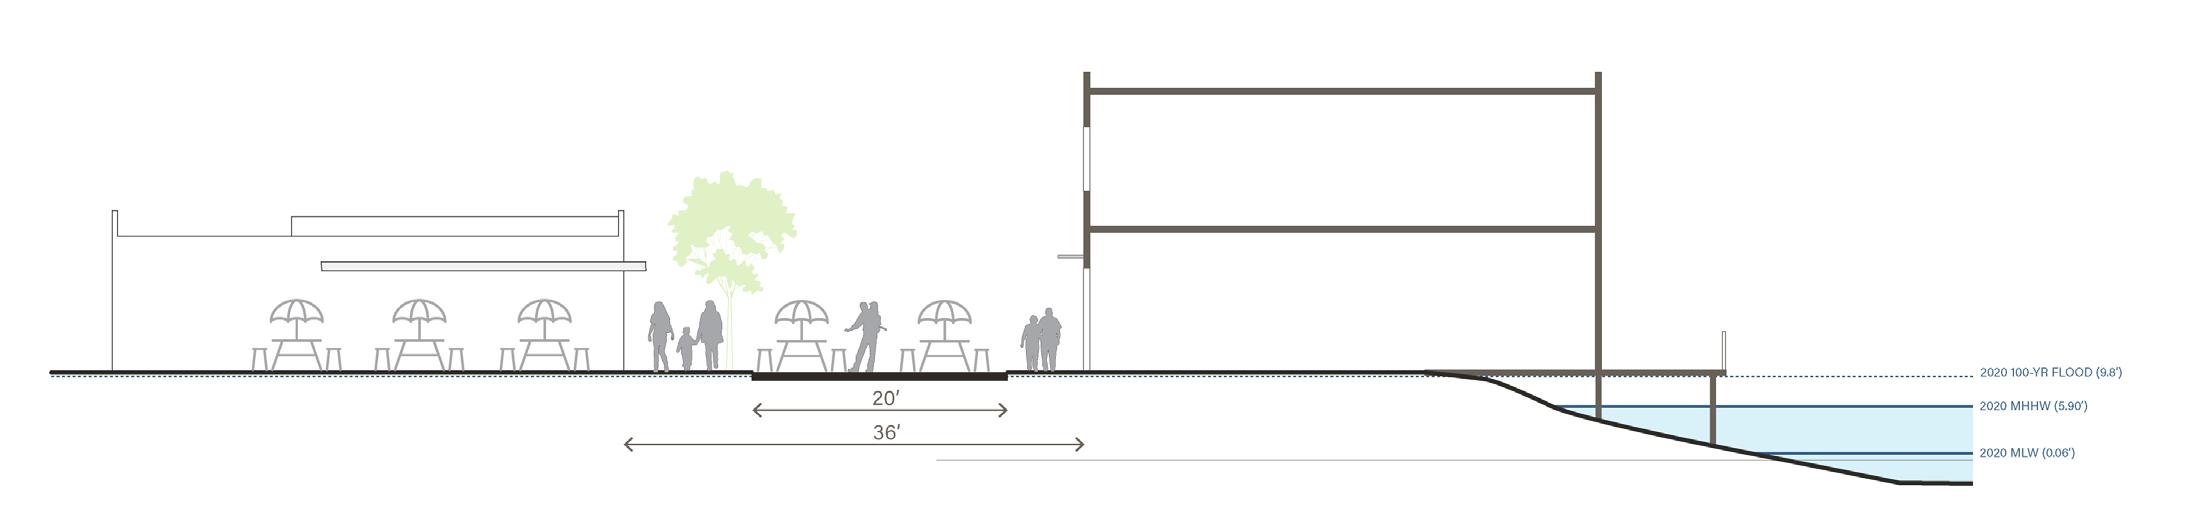

MAIN STREETACTIVATED WITH STREET LIFE
Main Street could be redesigned to have multiple benefits, including supporting more activity
downtown
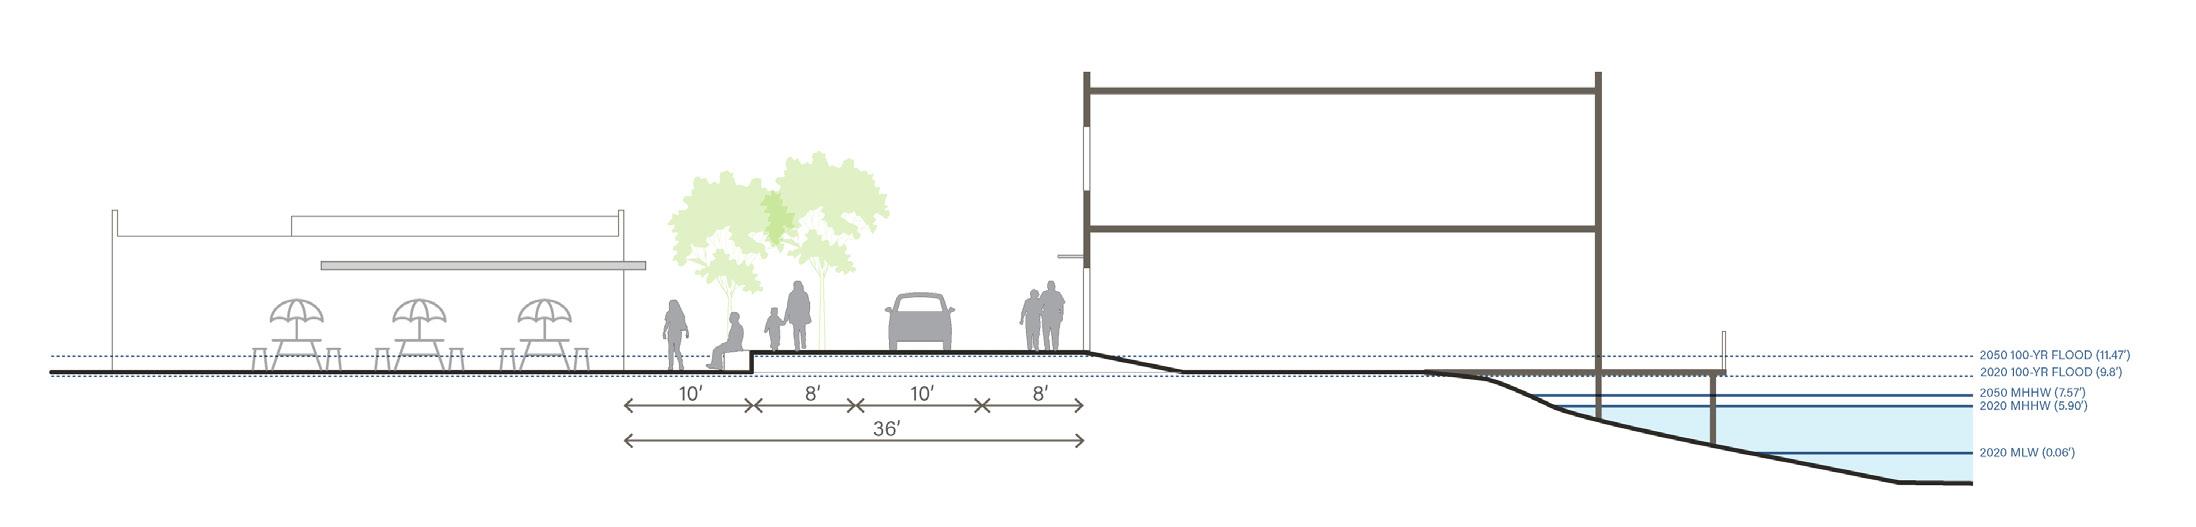
RAISING THE STREET
Main Street Today
Main Street Today
Main Street –Activated with Street Life
Main Street –Activated with Street Life
ADAPTING BUILDINGS OVER TIME
Raising the Street
Raising the Street
Adapting buildings over time
Adapting buildings over time
Program
Actively monitor changes to transit service, advocate for service optimization for Tiburon, and support enhanced transit infrastructure as part of downtown streetscape improvements.
Support ferry service and encourage the use of ferries to create a unique and enjoyable travel option for Tiburon residents and visitors while reducing visitor vehicle traffic and parking demand.
Program DT-j Ferry Service Improvements.
Actively monitor the San Francisco Bay Area Water Transit Authority process and advocate for improved ferry service and facilities.
Enable safe and comfortable pedestrian access throughout downtown and to the downtown waterfront.
Pursue the opportunity to provide increased pedestrian access to the waterfront along Main Street when changes in property use and construction of major additions or substantial redesign of new buildings allow.
Provide paving treatments, landscape elements, street furnishings and street lighting that will enhance use and enjoyment of sidewalks, parks, pedestrian corridors, plazas, and other public areas.
Require new development to contribute to desired downtown streetscape enhancements and midblock paseos.
Program DT-k Update the Zoning Ordinance.
Update the Tiburon Zoning Ordinance to achieve circulation goals and policies for downtown, including requirements for new development to provide streetscape improvements and midblock public paseos, and to adjust vehicle and bike parking requirements.
Pursue opportunities to create new midblock pedestrian connections to enhance the downtown walking experience. Paseos may create new connections between Tiburon Boulevard and Main Street (Ark Row), as well as new connections through future development north of Tiburon Boulevard.
Create pedestrian connections between downtown Tiburon, the Bay, and the hillside open space and trail network. Explore a high-quality pedestrian connection along Beach Road from the Bay to Teather Park, and a trailhead and trail connection between Teather Park and Old St. Hilary’s Preserve.
Integrate green infrastructure into downtown streetscape improvements, helping to protect downtown from flooding hazards and adapt to sea level rise while contributing to an attractive and pedestrian-oriented street environment.
POLICY
Provide adequate on- and off-street public and commercial parking areas to support downtown businesses, destinations, and events, and share parking resources.
Program DT-l Main Street Parking Lot.
For the Main Street Parking Lot, explore partnership with the property owner to support long-term improvements to pedestrian walkways, stairways, lanes and intersection points, directional and parking availability signage,
pavement markings, vehicular access, electric vehicle charging stations, and landscaping.
Program DT-m Review Parking Utilization.
Periodically review, along with Downtown property owners and merchants, the relationship between Downtown businesses and the time limit regulations of on-street parking and study changes to the current public street parking regulations to best serve Downtown merchants and their patrons.
Program DT-n Public Parking. Explore the desirability and feasibility of a public parking facility in Downtown.
Establish parking requirements for new development that ensure that parking demand generated by new uses is
met, helping to facilitate downtown revitalization and without detracting from a cohesive built environment.
Program DT-o Revise Parking Requirements.
Conduct a study of on- and offstreet parking inventory, occupancy, and pricing, and update the Town’s approach to shared parking resources.
Program DT-p Transportation Demand Management. Consider transportation demand management programs when updating parking requirements in Tiburon’s Zoning Ordinance.
Locate parking facilities behind buildings, and provide landscaping and signage that integrates parking into an attractive downtown environment
and helps visitors navigate to parking and destinations. Structured parking should be integrated into buildings, screened, low-key, and not prominently visible.
Provide wayfinding and identity signage that orients visitors to destinations and contributes to an attractive and unified sense of place.
Program DT-q Sign Program. Initiate a wayfinding and identity signage program for downtown.
Public Facilities, Spaces and Amenitiesare the subject of Goals DT-F and DT-G and the policies and programs that follow.
Enhance and program Downtown’s public facilities, public spaces, and amenities to attract Tiburon residents and visitors of all ages and backgrounds.
Maintain Shoreline Park’s historic Donahue Building (currently the Railroad/Ferry Museum) as a public use.
SPACES.
Initiate a study of downtown public spaces to identify opportunities to make these spaces more successful in supporting active and diverse public use.
Add new community amenities downtown, potentially including play areas, restrooms, infrastructure to support temporary events, public art, and a kayak launch.
Program DT-r New Downtown Amenities.
Study options and potential locations and gauge public support for new amenities downtown, potentially including a play area, a small public restroom, plaza improvements to support events, and a kayak launch.
Program DT-s Public Art Ordinance.
Consider adoption of a public art ordinance and establishment of a community program to encourage public art where appropriate.
Facilitate and support programming for downtown public spaces, potentially including a farmers’ market, block parties and concerts, food trucks, and pop-up social spaces.
Program DT-t Support Public Events.
Fund and implement a year-round program of public events downtown, coordinating closely with the Chamber, the Library, and others.
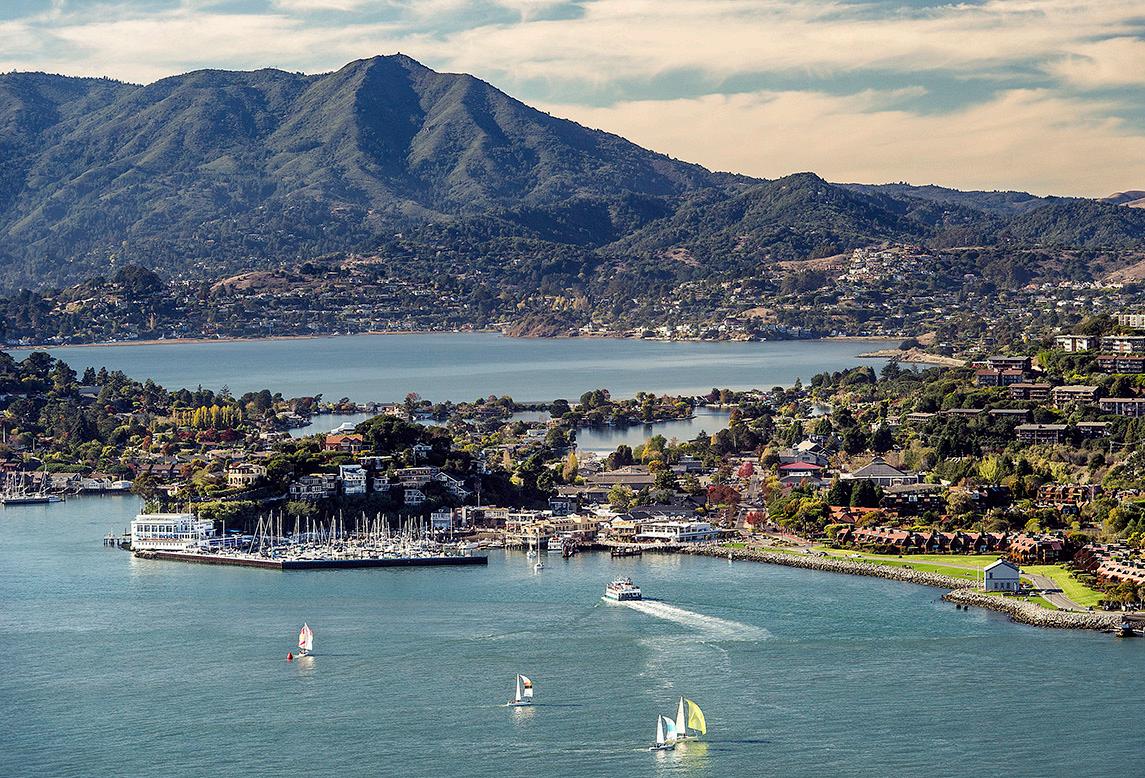
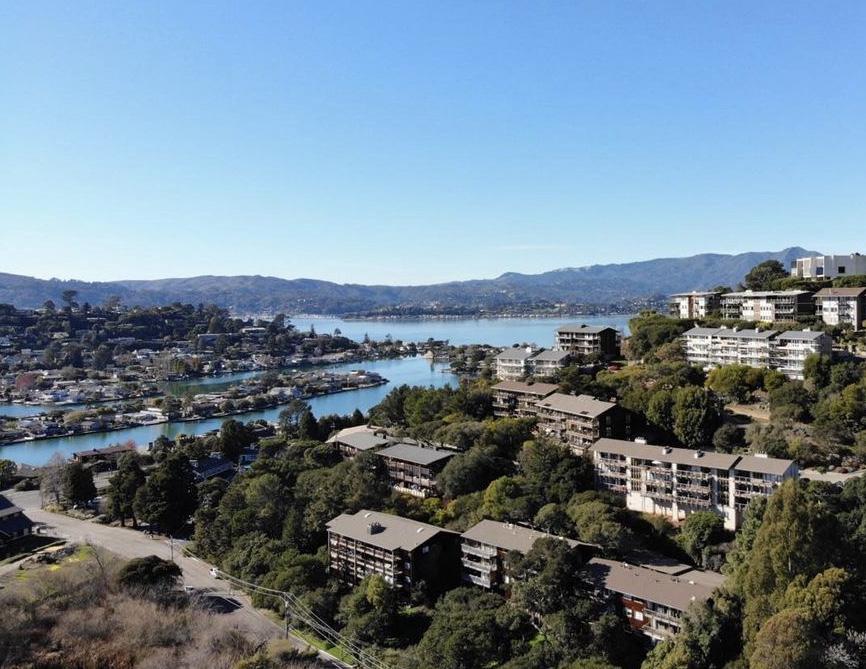
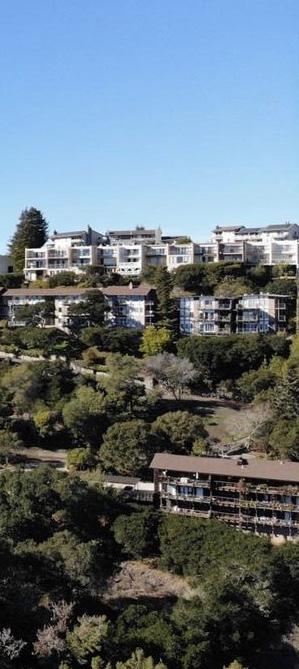
Tiburon’s residents live in a variety of housing types, including single-family homes, duplexes, multifamily buildings, and accessory dwelling units (ADUs). Housing development over the past decade has been slow and limited to single family homes on the few remaining vacant lots in town and a small number of ADUs each year. As a result of the constrained housing supply and the desirability of living in Tiburon, housing is extremely expensive, pricing out younger families, those who work in lower-paying service occupations, and those who have been historically excluded from housing opportunities. The Town recognizes that an adequate supply of housing – and especially affordable housing – is essential to creating and maintaining a vibrant, diverse, and sustainable community.
The Housing chapter includes the following sections.
4.2 2023-2031 Housing Element. Provides an overview of the Statemandated housing element process, the Town’s share of the regional housing need, and the Town’s Housing Element for the 2023-2031 planning period contained in Appendix 1.
4.3 Housing Opportunity Sites. Highlights housing opportunity sites and strategies contained in the Housing Element.
4.4 Goals, Policies, and Programs. Identifies goals, policies, and programs to expand housing opportunities and further fair housing.
The Town addresses its housing challenges through a comprehensive set of goals, policies, and programs in the Housing Element. Because housing is of critical concern to California, the State government requires cities and towns to update their housing element regularly. The Housing Element is subject to detailed statutory requirements and mandatory review by the State Department of Housing and Community Development (HCD).
The Housing Element process begins with HCD allocating a region’s share of the statewide housing need to the local Council of Governments based on State Department of Finance population projections and forecasts used in preparing regional transportation plans. The Council of Governments for Tiburon and the nine-county Bay Area region is the Association of Bay Area Governments (ABAG). ABAG, in collaboration with the Metropolitan
Transportation Commission, develops a Regional Housing Needs Allocation Plan that assigns the regional housing need to the individual cities, towns and counties within the Bay Area. Tiburon’s share of the regional housing need for the 2023-2031 planning period is 639 units, which represents 4.4 percent of the 14,405 units allocated to Marin County. The Town’s Regional Housing Need Allocation (RHNA) is approximately eight times the previous 5th cycle allocation of 78 units. The significant increase was due to a higher regional need as well as ABAG’s 6th cycle allocation methodology, which distributed more of the housing need to jurisdictions that are considered “transit rich” and, in an effort to avoid further segregation and concentration of poverty, “high resource” areas. In Tiburon’s case, ABAG classifies the town as transit-rich because its ferry dock is serviced by public transit. Tiburon is classified as a highest resource area due to factors such as high performing schools, higher employment, a higher percentage of adults with a bachelor’s degree, lower poverty rates, and less exposure to environmental and health hazards.
The regional share is further allocated according to four income levels: very low income, low income, moderate income, and above moderate income. Tiburon’s regional housing need of 639 units is distributed among the four income categories as follows:
• 193 units affordable to very lowincome households (up 50 percent of the area median income)
• 110 units affordable to low-income households (50 to 80 percent of the area median income)
• 93 units affordable to moderateincome households (80 to 120 percent of the area median)
• 243 units affordable to above moderate-income households over 120 percent of the area median income)
Affordable housing is generally defined as housing that costs no more than 30 percent of a household’s gross income. Affordable housing may be market rate housing or income-restricted housing that is required under financing agreements, deed restrictions, and/ or development agreements to provide units affordable to very low-, low-, or moderate-income households. Tiburon has 104 deed-restricted affordable
housing units, including the Hilarita Apartments, Cecilia Place, Bradley House, Tiburon Hill Estates, and Point Tiburon Marsh. The Town owns eight of the twenty affordable units at Point Tiburon Marsh, which provide housing for public employees.
Local governments are not required to build or finance housing, but they are required to ensure there are adequate vacant and underutilized sites, appropriately zoned, to meet the projected housing need. The process provides local control over where and what type of development should occur while creating opportunities for private for-profit and non-profit developers to meet market demand. The Town’s Housing Element demonstrates that the Town can accommodate its projected housing need through a combination of underutilized sites and vacant land.
The Housing Element in its entirety is included as Appendix 1. The Housing Element includes an evaluation of the 5th cycle housing element programs and accomplishments; an overview of the housing element’s public participation process; a detailed analysis of housing needs, including special populations’ needs; a comprehensive description of
housing sites and strategies, including accessory dwelling unit development and utilization of Senate Bill 9; a detailed analysis of governmental and non-governmental constraints to housing production; the newly required Affirmatively Furthering Fair Housing analysis; and goals, policies, and programs with clearly defined objectives and timelines for implementation.
Most of the sites within residential zones in the Town are built out or are not viable for high-density development due to environmental or topographic constraints and therefore offer very limited new housing opportunities. Where there are sites that can accommodate higher residential density, residents have expressed concerns about impacts that may result from the addition of a substantial number of new housing units, including impacts to the water
supply, evacuation and emergency vehicle access, and traffic, as well as the threat of environmental hazards such as flooding, tsunami, sea level rise, and wildfire for new development in flood zones and the wildland-urban interface zone. Nonetheless, the Town recognizes that it must provide opportunities to meet its RHNA. To achieve this goal, the Town increased allowable residential densities on certain housing opportunity sites and identified mixed-use zones in the Downtown along Tiburon Boulevard, Beach Road, and Main Street where new housing can be mixed in with ground-floor commercial uses (see Table H-1). These sites were chosen for their proximity to transit and services, as well as their potential to help revitalize Downtown through careful planning and design standards. In addition to these mixed-use sites, multifamily development is identified for the vacant portion of the Reed School property and the 9.6-acre parcel at 4576 Paradise Drive. Table H-1 also includes a limited number of new single family, duplex, and accessory dwelling units as may be counted per HCD guidelines. While the development capacities shown in Table H-1 reflect the
allowable density ranges, it is important to note that realistic capacities for RHNA purposes are calculated at the lowest end of the range. Also, development capacities do not include additional residential development that may be required under State density bonus law for developers that choose to include specified levels of affordable housing.
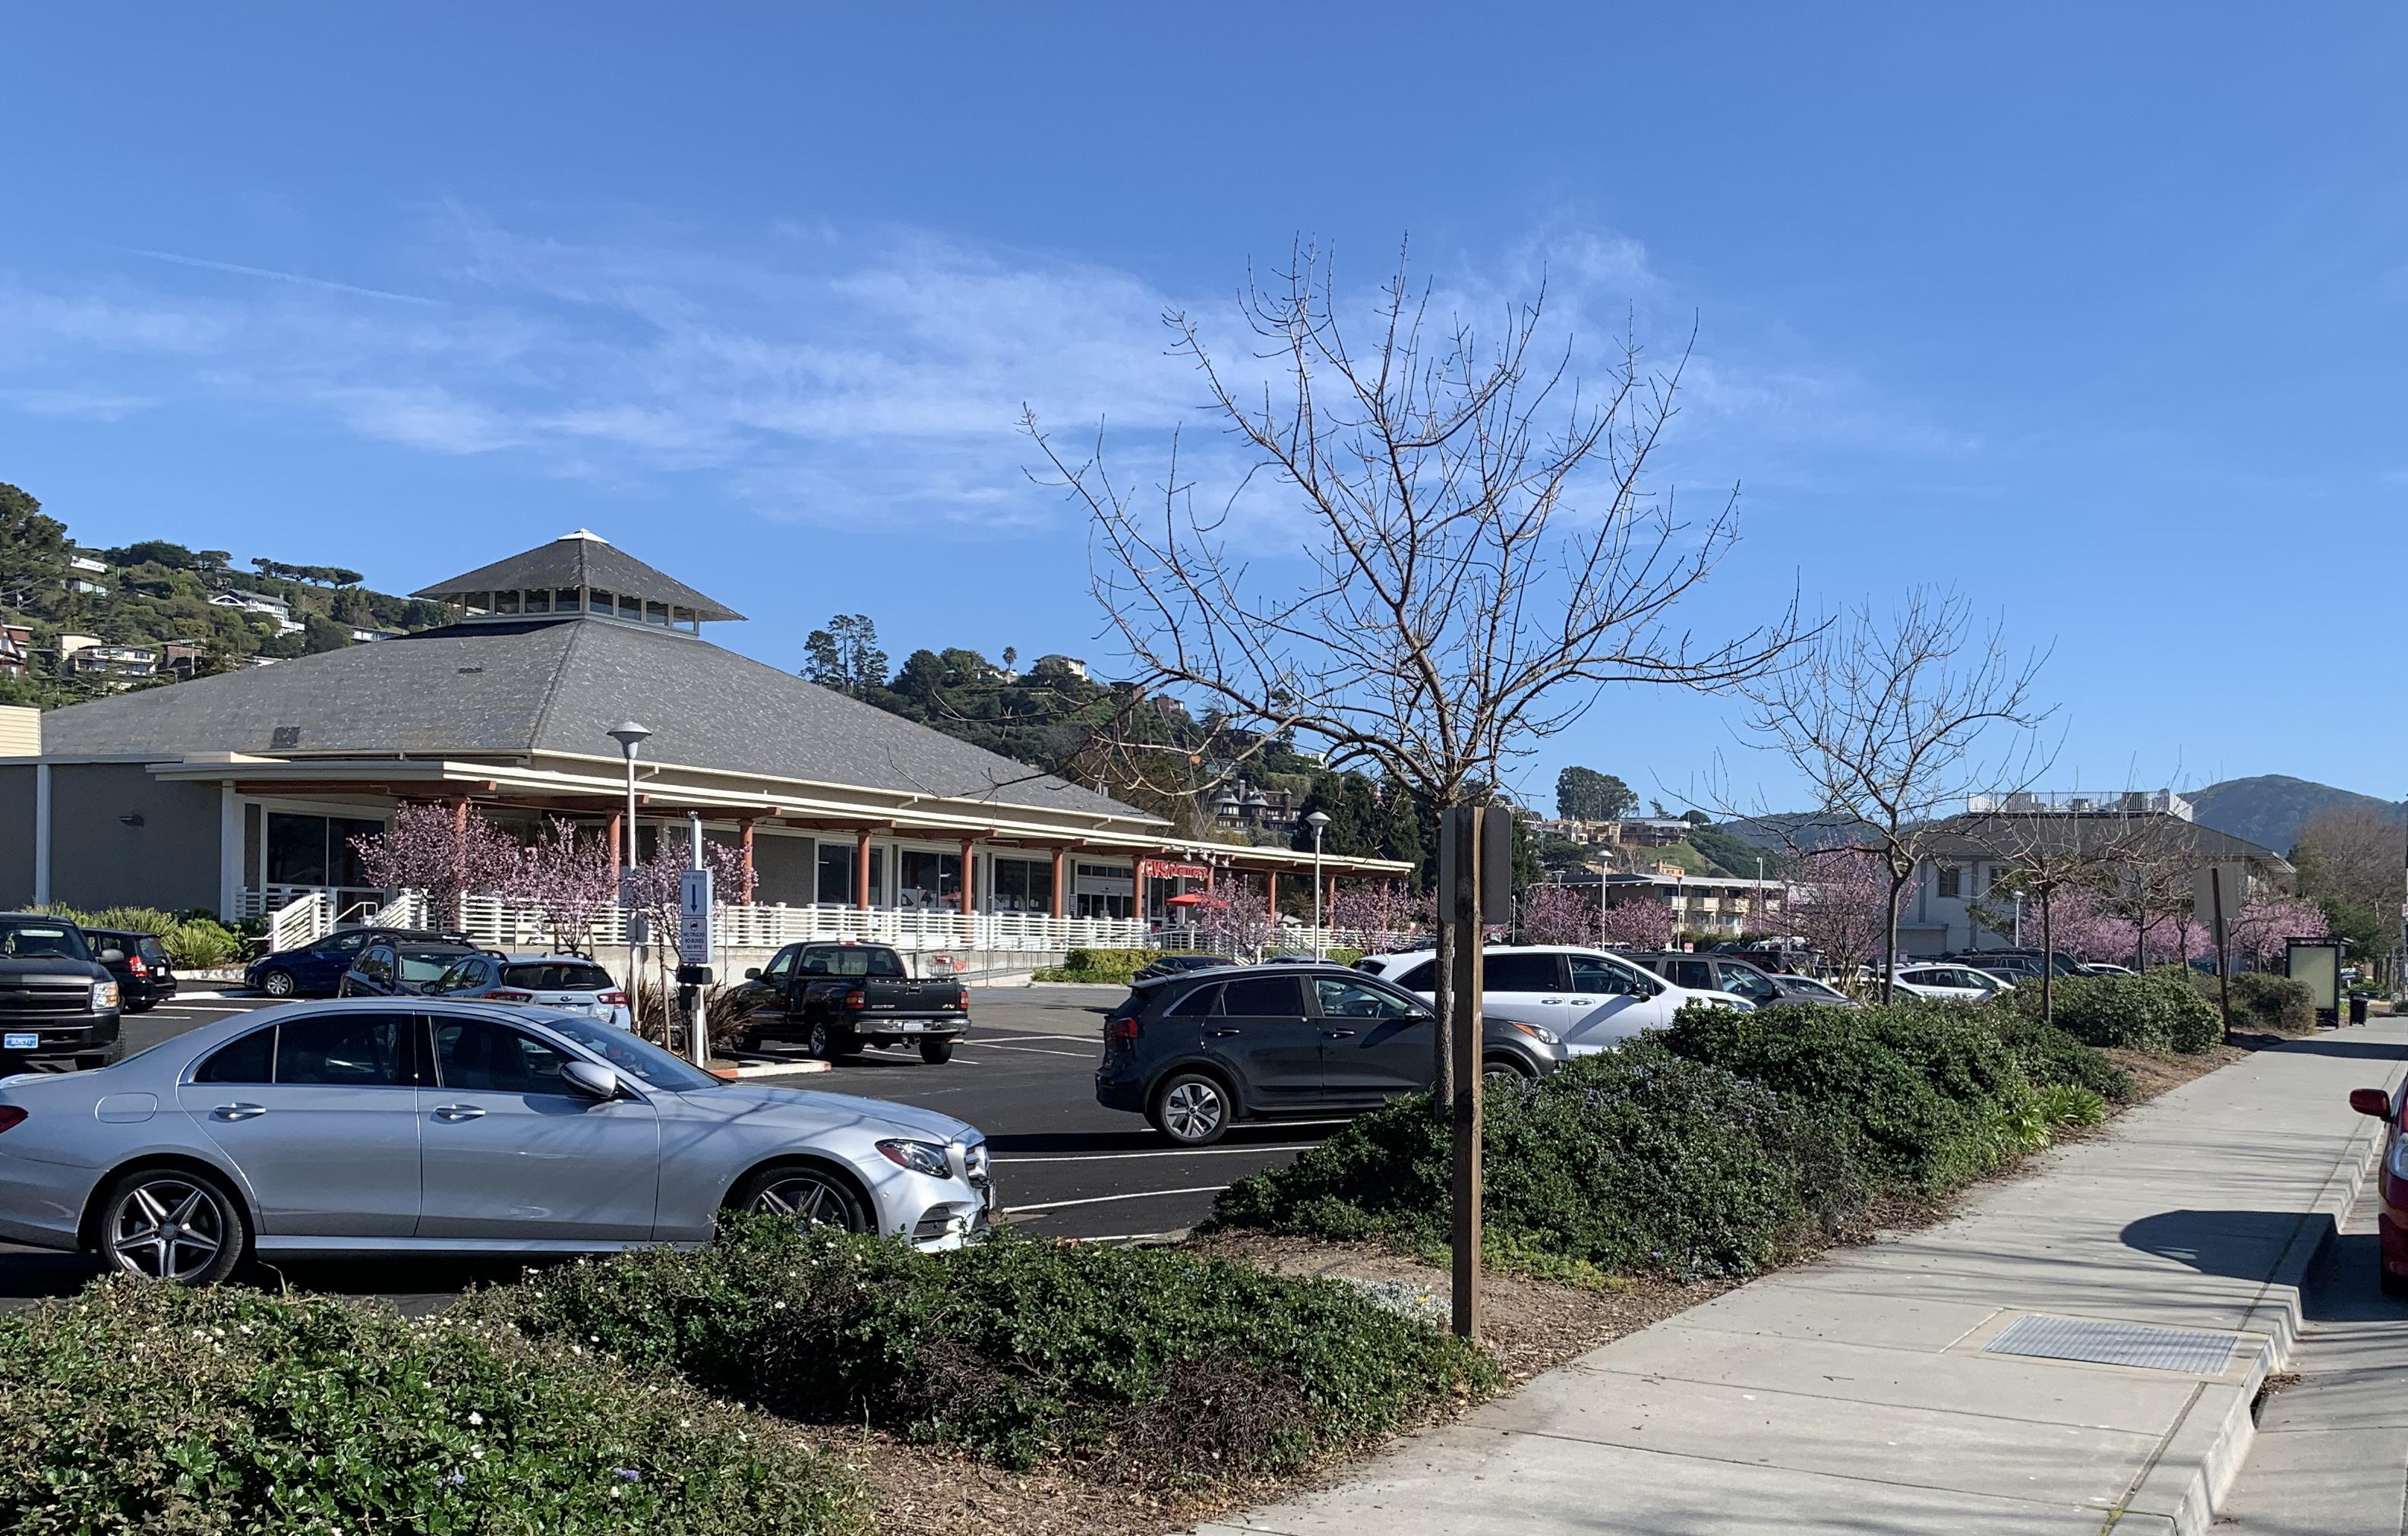
The following goals, policies, and programs are excerpted from the entire Housing Element in Appendix 1. See the Housing Element in Appendix 1 for program responsibility, funding sources, quantified objectives, and implementation timeframe.
Establish a Town leadership role in providing a mix of housing types that matches the needs of people of all ages and income levels.
Establish affordable housing as an important priority, with local government taking a proactive
leadership role in working with community groups, property owners, affordable housing providers, developers, and other jurisdictions, agencies, and stakeholders in implementing the Housing Element. Marshal and commit the Town’s political leadership, staff, funding sources, and available land resources toward the implementation of the Housing Element’s goals, policies, and programs.
Maximize the use of housing set-aside monies in support of affordable housing. Tiburon’s solitary Redevelopment Project Area includes a portion of the Downtown area where several of the sites listed in the Housing Element are located. The Town will seek projects where it can expend its Housing Set Aside funds in conjunction
with the Marin Housing Authority. Those funds will be used toward affordable housing projects in the Tiburon Housing Element area and preferably within the Redevelopment Project Area boundary.
The Town will seek ways to reduce housing costs for lower-income workers and people with special needs by using ongoing local funding resources (Housing In-Lieu Fund) and continuing to utilize other local, state, and federal assistance to the fullest extent. The Town will continue to collect and expend affordable housing in-lieu fees for meritorious affordable housing projects.
Work with private non-profit housing groups to identify opportunities for, and provide and maintain, affordable housing in Tiburon.
The Town will coordinate housing strategies with other jurisdictions in Marin County as appropriate to meet the Town’s housing need. Small municipalities rarely have the staff expertise to maximize assistance to affordable housing developers, especially in the early stages of project formulation and financing. Therefore, the Town supports collaboration of local planners within Marin County to implement Housing Element programs for each jurisdiction.
Ensure equal housing opportunities for individuals and families seeking housing in Tiburon. Ensure that housing seekers are not discriminated against, consistent with the Fair Housing Act.
Take meaningful actions, in addition to combating discrimination, that overcome patterns of segregation and foster inclusive communities free from barriers that restrict access to opportunity based on protected characteristics, which are: race, color, national origin, religion, sex (including identity and sexual orientation), familial status, and disability.
The Town will provide information and promote programs and resources for affordable housing, homebuyer assistance, rental assistance, housing rehabilitation, energy efficiency and decarbonization of homes, fair housing, reasonable accommodation requests, and sources of income laws through the following means:
1. Maintain a page on the Town’s website that describes housing programs (such as Residential Rehabilitation Loans, Housing Choice Vouchers, Home Match, and the Affordable Housing and Home Buyer Readiness Program), affordable housing sources (such as the Below Market Rate Home Ownership Program), senior and disabled housing sources and services, fair housing laws, and landlord and tenant resources and provide direct links to County agencies and other resources
that administer programs and/or provide more detailed information.
2. Include information on housing programs, affordable housing sources, senior and disabled housing sources and services, fair housing laws, and landlord and tenant resources in Town newsletters and other general communications that are sent to residents.
3. Maintain information and handouts at the Town’s public counter, including brochures published by Fair Housing Advocates of Northern California.
4. Train selected Town staff to provide referrals.
5. Distribute information on programs at public locations (library, schools).
6. Collaborate with other agencies and local jurisdictions (County of Marin, Marin Housing Authority, Chamber of Commerce, EAH) to prepare presentations and distribute informational materials to improve awareness of housing needs, issues,
fair housing, and available housing programs.
7. Distribute materials and brochures to neighborhood groups, homeowner associations, property owners and managers, real estate agents, ADU owners, religious institutions, businesses, and other interested groups (Rotary, Chamber of Commerce, etc.).
8. Adopt a Fair Housing Month proclamation each year.
Implementing Housing Element Programs. Coordinate with local businesses, housing advocacy groups, neighborhood groups, and the Chamber of Commerce in building public understanding and support for workforce and special needs housing and other issues related to housing, including the community benefits of affordable housing, mixed-use, and pedestrian-oriented development. The Town will notify a broad representation
of the community when housing programs are discussed by the Planning Commission or Town Council. Specific outreach activities include:
1. Maintain the Housing Element mailing list and send public hearing notices to all interested community members, non-profit agencies, and affected property owners.
2. Post notices at Town Hall, the library, and the post office.
3. Publish notices in the local newspaper.
4. Post information on the Town’s website.
5. Conduct outreach (workshops, neighborhood meetings) to the community as Housing Element programs are implemented. Invite local businesses, housing advocacy groups, neighborhood groups, and the Chamber of Commerce to make presentations and participate in workshops and neighborhood meetings.
6. Utilize local businesses, housing advocacy groups, neighborhood groups, and the Chamber of Commerce when conducting focus groups, surveys, and distributing information to their clients and members.
Conduct targeted outreach to underrepresented community members, including the disabled, seniors, lowincome households, people of color, and people who do not speak English as a first language. Provide housingrelated materials in Spanish and provide language translation on the Town’s website. Provide surveys in Spanish and Spanish translation for workshops and conduct focus groups with underrepresented community members. Utilize the Town’s affordable housing providers, Chamber of Commerce, and community groups representing protected class members to assist in outreach efforts.
Participate in a Housing Working Group that consists of staff at all Marin cities and towns and the County of Marin to participate in countywide housing projects, share best practices, and discuss housing issues.
Work with home match service providers such as Home Match Marin to help match over-housed seniors with potential lower-income tenants or other seniors to save on housing costs. Promote these programs through outreach methods and venues described in Program H-b.
Town staff will meet and work with other public agencies and special districts (water, fire, schools, sanitary districts, etc.) to promote affordable housing
through the provision of fee waivers, fee reductions, development of property, or other assistance for affordable housing projects.
Work with the Golden Gate Regional Center to implement an outreach program that informs families within Tiburon on housing and services available for persons with developmental disabilities. Provide information on services on the Town’s website and distribute brochures supplied by the service providers. The Town will take the following specific actions in 2023:
1. Contact the Golden Gate Regional Center (GGRC) and establish a working relationship with a specific contact person. Inquire about other service providers that should be included in the Town’s outreach.
2. Request written information from the GGRC and other service providers
on housing and services available for persons with developmental disabilities for posting on the Town’s website and inclusion in the Town’s newsletter.
3. Request brochures from the GGRC and other service providers on housing and services at Town Hall.
4. Discuss other actions with the GGRC the Town could take to promote housing and services available for the developmentally disabled and create an outreach program with specific steps for implementation.
As required by State law, the Town will review the status of Housing Element programs and submit a progress report to the State Department of Housing and Community Development and the Governor’s Office of Planning and Research by April 1st.
Program H-i Update the Housing Element.
Update the Tiburon Housing Element consistent with State law requirements.
Program H-j Coordinate with Water and Sewer Providers.
As required by State law, the Town will provide a copy of the adopted housing element update to water and sewer providers, including the Marin Municipal Water District, Sanitary District Number 5 of Marin County, Richardson Bay Sanitary District, and Sanitary District Number 2 of Marin County. The Town will also provide a summary and quantification of Tiburon’s regional housing need allocation.
Apply for state and local affordable housing funds including, but not limited to, the programs listed in Section 4.8. Commit these funds to one or more
projects located on designated housing sites as shown in the Housing Sites Inventory Table 11, to projects targeted for persons with disabilities, including persons with developmental disabilities, and to projects targeted to extremely low-income households.
In conjunction with the Marin Housing Authority, use remaining housing setaside funds to meet existing affordable housing obligations and, once those are met, expend the funds solely for the provision of affordable housing in Tiburon consistent with the Tiburon General Plan.
The Town will work with non-profits to assist in achieving the Town’s housing goals and implementing programs. Coordination should occur on an ongoing basis, and as special
opportunities arise related to specific housing sites and as the Housing Element is implemented. The Town will reach out to developers of supportive housing to encourage development of projects targeted for persons with disabilities, including developmental disabilities. The Town will also reach out to developers of affordable housing for extremely low-income households. The Town will take the following specific actions to facilitate the development and preservation of affordable housing, including housing for extremely lowincome households and persons with disabilities:
1. Develop a list of affordable and supportive housing developers, identify primary contacts, and establish working relationships.
2. Maintain a list of housing opportunity sites and discuss potential housing development on these sites as well as other housing sites and opportunities.
3. Discuss development standards and permit processing procedures relevant to potential housing sites.
4. Discuss incentives the Town can offer, including priority processing, density bonuses and concessions, fee waivers or deferrals, and modification of development standards.
5. Identify available funding sources, including the Town’s Low and Moderate Income Housing Fund, as well as other sources the Town could apply for.
6. Discuss potential community outreach activities to gain community acceptance of affordable housing development.
7. Monitor the potential expiration of HUD-subsidized funding of Bradley House at the end of 2030 and assist in maintaining the affordability of the development by contacting affordable housing developers and assisting in identifying and applying for federal, state, and local financing and subsidy programs.
Continue to implement the agreement with the Marin Housing Authority (MHA) for management of the affordable housing stock to ensure permanent affordability. Implement resale and rental regulations for very low-, low-, and moderate-income units, and assure that these units remain at an affordable price level.
Work with Fair Housing Advocates of Northern California to conduct training sessions for Town employees regarding the receipt, documentation, and proper referral of housing discrimination complaints and other fair housing issues.
Discrimination
Refer discrimination complaints to the appropriate legal service, county, or state agency or Fair
Housing Advocates of Northern California (FHANC). The Community Development Director is the designated person in Tiburon with responsibility to investigate and deal appropriately with complaints. Discrimination complaints will be referred to Fair Housing Advocates of Northern Marin, the Marin Housing Authority, Legal Aid, HUD, or the California Department of Fair Employment and Housing, as appropriate. Information regarding the housing discrimination complaint referral process will be posted on the Town’s website. Encourage FHANC to conduct fair housing testing in Tiburon.
1. Amend the Zoning Code to allow ministerial, staff-level review and approval of minor exterior alterations, such as construction of elevators and ramps, and to provide objective standards to make findings regarding “potential impacts on surrounding uses” and “physical attributes of the property and structures” (subsection A.5 and A.6 of TMC Section 16-90-060).
2. Post information on the Town’s website regarding reasonable accommodation procedures and instructions for submitting accommodation requests.
Provide housing for special needs populations that is coordinated with support services.
Provide opportunities through affordable housing programs for a variety of housing types and affordability levels to be constructed or acquired for special needs groups, including assisted housing and licensed board and care facilities.
Support housing that incorporates facilities and services to meet the health care, transit or social service needs of extremely low-income households and persons, and persons living with disabilities. As appropriate to its role, the Town will assist service providers to link together services serving special needs populations to provide the most effective response to homelessness or persons at risk of homelessness, youth needs, seniors, persons with mental or physical disabilities, substance abuse problems, HIV/AIDS, physical and developmental disabilities, multiple diagnoses, veterans, victims of domestic violence, and other economically challenged or underemployed workers.
¹ The Department of Housing and Urban Development (HUD) allocates HUD homeless assistance grants to organizations that participate in local homeless assistance program planning networks. Each of these networks is called a Continuum of Care. HUD introduced the concept to encourage and support local organizations in coordinating their efforts to address housing and homeless issues. The Marin County Continuum of Care is operated through the County’s Health and Human Services Agency.
² Standards for Emergency Shelters consistent with SB2 are contained in Municipal Code Section 16-40.060 - Emergency Shelters.
The Town will use density bonuses to assist in meeting special housing needs, housing for lower-income elderly and disabled.
In recognition that there is a lack of resources to set up separate systems of care for different groups of people, including homeless-specific services for the homeless or people “at risk” of becoming homeless, local governments in Marin must coordinate efforts to develop a fully integrated approach for the broader low-income population. The Town will support countywide programs Marin County Continuum of Care¹ actions for the homeless including emergency shelter,
transitional housing, supportive housing, and permanent housing.
The Town of Tiburon recognizes the need for and desirability of emergency shelter housing for the homeless and will allow a year-round emergency shelter as a permitted use in commercial zones as established in the Zoning Ordinance.² In addition, the following would apply:
1. The Town will encourage positive relations between neighborhoods and providers of permanent or temporary emergency shelters. Providers or sponsors of emergency shelters, transitional housing programs and community care facilities shall be encouraged to establish outreach programs within their neighborhoods and, when necessary, work with the Town or
a designated agency to resolve disputes.
2. It is recommended that a staff person from the provider agency be designated as a contact person with the community to review questions or comments from the neighborhood.
The Town will ensure that new multifamily housing includes units that are accessible and adaptable for use by disabled persons in conformance with the California Building Code. This will include ways to promote housing design strategies to allow seniors to “age in place.”
The Town of Tiburon recognizes the need for and desirability of transitional and supportive housing and will treat transitional and supportive housing as a residential use that will be subject only to the same restrictions that apply to other residential uses of the same type in the same zone.
Participate and allocate funds, as appropriate, for County and nonprofit programs providing disaster preparedness and emergency shelter and related counseling services.
Program H-r Provision of Affordable Housing for Special Needs Households.
Continue to facilitate programs and projects which meet federal, state, and local requirements to provide accessibility for seniors, persons with disabilities, including developmental disabilities, large families, and singleperson and single parent households. Apply current inclusionary housing provisions that require 10% of new units to be designed for special needs households. Specific types of housing include:
1. Smaller, affordable residential units, especially for lower-income single-person and single parent households.
2. Affordable senior housing to meet the burgeoning needs of an aging population, including assisted housing and board and care (licensed facilities).
3. Affordable units with three or more bedrooms for large family households.
4. Affordable housing that is built for, or can easily and inexpensively be adapted for, use by people
with disabilities (specific standards are established in California Title 24 Accessibility Regulations for new and rehabilitation projects, augmented by Americans with Disabilities Act guidelines) and people with developmental disabilities.
Program H-s Emergency Housing Assistance.
Actively engage with other jurisdictions in Marin to provide additional housing and other options for the homeless, supporting and implementing Continuum of Care actions in response to the needs of homeless families and individuals. Participate and allocate funds, as appropriate, for County and non-profit programs providing emergency shelter and related counseling services.
Program H-t Provide Public Employee Housing Assistance.
Identify opportunities for local government and public agency
Protect and conserve the existing housing stock and mix of unit types.
Pursue funding for conservation and rehabilitation of existing housing to preserve neighborhood character and retain the supply of affordable housing units.
Except for limited equity cooperatives and other innovative housing proposals which are affordable to lower-income households, the Town will prohibit conversion of existing multi-family rental
dwellings to market rate condominium units unless the Town’s rental vacancy rate is above 4.5 percent.
Ensure that affordable housing provided through governmental subsidy programs, incentives and deed restrictions remains affordable, and intervene when necessary to help preserve such housing.
Limit the loss of housing units in “Old Tiburon” through conversion of existing two-family or multi-family dwellings into single-family dwellings or buildings containing fewer units.³
Continue to publicize and create opportunities for using available rental assistance programs for extremely low-, very low- and low-income households in coordination with the Marin Housing Authority (MHA).
Protect and preserve housing units by granting density bonuses that allow the re-establishment of housing developments containing affordable housing units (regardless of the current General Plan density limit for the site) at the pre-existing density, in the event that such developments are damaged or destroyed by fire, earthquake, or similar disaster.
In order to protect and conserve the housing stock, the Town will, to the extent permitted by law, prohibit the conversion of residential units to other uses and regulate the conversion of rental developments to non-residential uses unless there is a clear public benefit or equivalent housing can be provided.
Support good management practices and the long-term maintenance and improvement of existing housing through housing and building code enforcement, rehabilitation programs for viable older housing, and longterm maintenance and improvement of neighborhoods.
Promote development and construction standards that conserve resources and encourage housing types and designs that use cost-effective energy and resource conservation measures (water, electricity, etc.) and therefore cost less to operate over time, supporting long-term housing affordability for occupants.
Continue to impose resale controls and rent and income restrictions to the maximum extent possible (at least 55 years) to ensure that affordable housing, provided through zoning and other government incentives and/or as a condition of development approval,
remains affordable over time to the income group for which it is intended. The Town will implement long-term or in-perpetuity agreements and/or deed restrictions with owners and/or developers to govern the affordability of such units. This assurance will be provided through recorded agreements and by monitoring their continuing affordability, or other equally effective means.4
In cooperation with the Marin Housing Authority (MHA), improve citizen awareness of rehabilitation loan programs. Utilize the Town’s website, newsletter, social media, and counter handout to publicize programs.
The Town will continue to inspect and report on all residential units prior to
resale, with the intent to maintain and upgrade the safety of housing within the town consistent with adopted Building Codes. In addition to health and safety concerns, the residential building report discloses the authorized use, occupancy and zoning of the property and an itemization of deficiencies in the dwelling unit.
Continue to publicize and participate in rental assistance programs such as Section 8 Housing Choice Vouchers in coordination with the Marin Housing Authority (MHA). Utilize the Town’s website, newsletter, social media, and handouts to publicize programs. Provide multilingual links to the California Department of Fair Employment and Housing’s Sources of Income Fact Sheet and FAQ and printed materials. Collaborate with at least two other organization, schools,
or agencies to post handouts at their locations.
Preserve rental housing by enforcement through the Town's condominium conversion ordinance and Housing Element policy.5
Work with affordable housing providers and managers to ensure affordable units are well-maintained. Conduct outreach to affordable housing tenants on code enforcement issues and procedures for filing complaints. Facilitate communication between tenants and affordable housing providers and managers and work to resolve issues of concern.
5 See 16-52.050 - Condominium Use Permit
Work with the County of Marin and other Marin jurisdictions to develop strategies that protect tenants from rapidly rising rents and displacement. These may include:
• Rent stabilization: Currently, the State imposes rent caps on some residential rental properties (AB 1482) through 2030. Consider adopting a permanent policy and/ or expansion to units not covered by AB 1482, as permitted by law.
• Just cause for eviction: AB 1482 also establishes a specific set of reasons that a tenancy can be terminated. These include: 1) default in rent payment; 2) breach of lease term; 3) nuisance activity or waste; 4) criminal activity; 5) subletting without permission; 6) refusal to provide access; 7) failure to vacate; 8) refusal to sign lease; and 9) unlawful purpose. Consider expanding on these protections or extending if State protections expire.
• Local relocation assistance: Consider developing a countywide relocation assistance program that provides greater relocation assistance to special needs groups (e.g., seniors, disabled, female-headed households) and reasonable accommodation for persons with disabilities.
• Right to Purchase: When tenants are being evicted due to condominium conversion or redevelopment, offer first right to purchase to displaced tenants to purchase the units.
• Right to Return: When tenants are being evicted due to rehabilitation/ renovation of the property, offer first right to displaced tenants to return to the improved property.
• Tenant Bill of Rights: Adopt a tenant’s bill of rights that considers extending protections for subletters and family members and addresses severe habitability issues and market pressures. This provision could also provide anti-retaliation protection for tenants that assert their rights and
a right to legal representation in the case of evictions.
The Town will take the following actions:
1. Participate in countywide meetings with planning staff from all Marin jurisdictions to review best practices and develop model ordinances for the tenant protection strategies identified above in 2024. Work with Fair Housing of Northern California and Legal Aid of Marin to develop strategies and prepare model ordinances.
2. Conduct study sessions with the Planning Commission and Town Council to understand needs and best practices for the tenant protection strategies identified above in 2025. Invite Fair Housing of Northern California and Legal Aid of Marin to present at and participate in the study sessions.
3. Prepare ordinances at Town Council direction and bring forward for Planning Commission recommendation and Town Council adoption in 2025.
Standards and Rehabilitation and Energy Loan Programs.
Implement housing, building, and fire code enforcement to ensure compliance with basic health and safety building standards and provide information about rehabilitation loan programs for use by qualifying property owners who are cited. Specific actions include:
1. Coordinate with the Marin Housing Authority and utility providers to publicize available loan programs to eligible owner and renteroccupied housing.
2. Provide public information on alternative energy technologies for residential developers, contractors, and property owners.
3. Publicize tenant assistance and energy conservation programs that are available to provide subsidized or at-cost inspection and corrective action.
4. Provide an informational guide to homeowners explaining the benefits, “best practices” and procedures for adding or legalizing a secondary dwelling unit.
Provide information on available energy efficiency, renewable energy, and decarbonization rebates, incentives, loans, and program, highlighting any programs that serve and/or provide deeper discounts for low-income households. Specific actions include:
1. Coordinate with the County of Marin, the Marin Climate & Energy Partnership, BayRen, and utility providers to identify, fund, design, and publicize programs.
2. Utilize the Town’s website, newsletter, social media, and counter handouts to provide information on alternative energy technologies for residential developers, contractors, and property owners.
Facilitate the development of new infill housing in Downtown Tiburon and on identified underutilized sites throughout the Town that are close to services and transit. Continue to encourage accessory dwelling units to provide additional housing opportunities throughout established neighborhoods.
In response to the broad range of housing needs in Tiburon, the Town will strive to achieve a mix of housing types, densities, affordability levels and designs. This will include an adequate supply and variety of housing opportunities to meet the needs of
Tiburon’s workforce and their families, striving to match housing types and affordability with household income. The Town will work with developers of non-traditional and innovative housing approaches in financing, design, construction, and types of housing that meet local housing needs. Housing opportunities for families with children should not be limited because necessary facilities are not provided on site.
Facilitate the design, approval, and construction of affordable housing projects using a variety of mechanisms, including mixed-use development incentives, inclusionary zoning, density bonus programs, affordable housing overlay zones, and creation of accessory dwelling units.
Given the diminishing availability of developable land, the Town will identify housing opportunity areas and sites where a special effort will be made to provide workforce and special needs affordable housing. The Town will take specific actions to promote the development of affordable housing units on these sites (identified in the Implementing Programs).
The Town will encourage well-designed mixed-use developments (residential mixed with other uses) where residential use is appropriate to the setting. The Town will develop incentives to encourage mixed-use development in appropriate locations, such as in and near to the downtown that are in proximity to transit and services and would support downtown businesses.
The Town will encourage the development of housing in conjunction with the redevelopment of commercial shopping areas and sites when it occurs.
The Town will use density bonuses and other incentives to help achieve housing goals, including provisions consistent with State Density Bonus Law.6
The Town will strive to protect and expand the supply and availability of multifamily and mixed-use infill housing sites for housing. The Town will not redesignate or rezone residential land for other uses or to lower densities without re-designating equivalent land for higher density multifamily development.
Encourage the construction of accessory dwelling units (ADUs) and
junior accessory dwelling units (JADUs) as an important way to provide affordable rental housing opportunities, especially for senior households, single persons, single parents, and young households.
Implement the Town’s inclusionary housing provisions to generate affordable housing units and in-lieu fees that can be effectively used to support affordable housing projects on less constrained housing opportunity sites.
Encourage cooperative and joint ventures between owners, developers, and non-profit groups in the provision of below market rate housing. Work with non-profits and property owners to seek opportunities for affordable housing development on key housing opportunity sites that are close to services, transit, and jobs. Undertake the following actions to encourage development of multi-family, affordable housing, including housing for extremely low-income households:
1. Meet with non-profit housing developers and property owners of Sites 1-9 to identify housing development opportunities, issues, and needs during 2023.
2. Select the most viable sites during 2023 and 2024.
6 State density bonus law, Government Code Section 65915, was first enacted in 1979. The law requires local governments to provide density bonuses and other incentives to developers of affordable housing who commit to providing a certain percentage of dwelling units to persons whose incomes do not exceed specific thresholds. Cities also must provide bonuses to certain developers of senior housing developments, and in response to certain donations of land and the inclusion of childcare centers in some developments. Essentially, state density bonus law establishes that a residential project of five or more units that provides affordable or senior housing at specific affordability levels may be eligible for a “density bonus” to allow more dwelling units than otherwise allowed on the site by the applicable General Plan Land Use Map and Zoning. The density bonus may be approved only in conjunction with a development permit (i.e., tentative map, parcel map, use permit or design review). Under State law, a jurisdiction must provide a density bonus, and concessions and incentives granted at the applicant’s request based on specific criteria.
3. Undertake community outreach in coordination with potential developers and property owners during 2023 and 2024.
4. Complete site planning studies, continued community outreach, and regulatory approvals in coordination with the development application.
5. Facilitate development through regulatory incentives, reducing or waiving fees, fast track processing, lot consolidation (i.e., assistance with the application, and fee reduction or waiver), and assistance in development review.
6. Require affordable units to be affirmatively marketed to communities of color and protected classes. Utilize publications, venues, and community groups that serve Black and Latinx communities, especially outside of Marin County.
7. Provide funding from the Town’s Low and Moderate Income Housing fund for affordable housing developments..
8. Regarding Site 5, work closely with the City of Belvedere to streamline, facilitate, and expedite planning and building permit applications, review, and approval. Work with the City of Belvedere to appoint a joint project manager, and conduct joint design review board, planning commission and city/town council meetings when reviewing and approving development plans.
Ordinance.
Annually monitor and evaluate the effectiveness of the Affordable Housing Overlay Zone and Inclusionary Housing Ordinance as part of the annual Housing Element review (see Program H-i). As part of the annual review The Town will determine if the number and/or percentage of affordable units required by income category need to be adjusted in order to achieve the Town’s affordable
housing goals without unduly impacting overall housing production and supply. The Town will amend the zoning ordinance as necessary.
1. Amend the Inclusionary Housing Ordinance to identify the interior amenities subject to the ordinance and provide objective standards that allow lower-cost substitutions that do not compromise performance or functionality.
2. Amend the Inclusionary Housing Ordinance to include an option to satisfy the inclusionary requirement through provision of units affordable to extremely low-income households.
Housing Projects
Consistent with State Density Bonus Law.
Offer density bonuses consistent with the State Density Bonus Law.
Program H-ff Design of Multifamily Housing.
Conduct design review to assure excellence of design in new multifamily housing development and utilize objective design and development standards for applicable projects.
Encourage and facilitate ADU and JADU development to provide additional housing opportunities throughout established neighborhoods. Take the following actions:
1. Provide information on Tiburon’s ADU standards for posting on the ADUMarin website.
2. Provide ADU and JADU application checklists on the Town’s website.
3. Develop a handout on ADU standards and the application process and distribute at Town Hall.
4. Provide links to the California Department of Fair Employment and Housing’s Sources of Income Fact Sheet and FAQ in Town communications and printed handouts at the building counter. Provide handouts to ADU permit applicants.
5. Promote the ADUMarin website in the Town’s newsletter and ADU handout, on social media, and on the Town’s website.
6. Establish an ADU specialist in the Community Development Department.
7. Reduce the ADU application fee.
8. Amend the ADU Ordinance to comply with state law.
Continue to track ADU and JADU permits, construction, and affordability levels. Review ADU and JADU development at the mid-point of
the planning cycle to determine if production estimates are being achieved as identified in the housing site inventory. Depending on the findings of the review, revise the housing sites inventory to ensure adequate sites are available to accommodate the remaining lowerincome housing need.
Establish new Mixed Use, Main Street, and R-4 zoning districts and objective design and development standards for those districts that facilitate development at the realistic unit capacities and densities established in Housing Element Table 11 for each site. Rezone Sites 1-7, 9, and A-F to Mixed Use, Site 8 to R-4, and Site G to Main Street. As reflected in Housing Element Table 11, Sites 1-9 are identified to accommodate a portion of the lowerincome RHNA. These will be rezoned to:
1. require the minimum density identified in Table 11;
2. permit owner-occupied and rental multifamily uses by right pursuant to Government Code section 65583.2(i) for developments in which 20 percent or more of the units are affordable to lower-income households;
3. allow 100 percent residential use;
4. require residential use occupy at least 50 percent of the total floor area of a mixed-use project.
In an effort to improve housing mobility and provide housing opportunities distributed throughout Tiburon, the Town will identify and rezone, as necessary, additional housing opportunity sites for lower-income households outside the Downtown. Potential sites include, but are not limited to, the Cove Shopping Center and the Tiburon Baptist Church site, if the property owners indicate interest in redeveloping or adding
housing to their sites. In compliance with the No Net Loss Law and Government Code 65863, the Town will identify new housing opportunity sites as development occurs in order to ensure the remaining sites are sufficient to accommodate the remaining RHNA at all income levels.
The Reed Union School District is currently undergoing a Master Facilities Plan which is considering developing a portion of the Reed School site with housing (Site 9 in Housing Element Table 11). The Town will monitor the progress of the Master Facilities Plan and take the following actions:
1. Meet with school district staff at least quarterly beginning in 2023 to discuss progress of the Facilities Master Plan.
2. Participate in School District community meetings during the Facilities Master Plan process to encourage affordable housing on the site.
3. Facilitate meetings with the School District and affordable housing developers during 2023 and 2024 to explore development concepts and feasibility.
4. If the School District makes a formal determination not to pursue housing on the site, the Town will identify and rezone sites, as necessary, to make up for any shortfall in the remaining RHNA for each income category within one year of the School District’s determination, or by May 31, 2026, whichever is later.
5. If the School District does not take any action to develop housing on the site by January 31, 2025, the Town will identify and rezone site(s), as necessary, to make up for any shortfall in the remaining RHNA for each income category by May 31, 2026.
Rezone 4576 Paradise Drive to R-3-10 and require a minimum density of 10 units per acre.
Revise the Zoning Code to make supportive housing a permitted use in all commercial zones that allow multifamily and mixed-use housing, including the Mixed Use, Neighborhood Commercial, Main Street, and Village Commercial districts, pursuant to Government Code 65651.
Revise the Zoning Code to specify parking requirements for emergency shelters that comply with Government Code section 65583, subdivision (a) (4)(A).
Encourage and facilitate SB 9 development on qualifying single family lots to provide additional housing opportunities. Take the following actions:
1. Provide information on Tiburon’s SB 9 standards.
2. Provide SB 9 application checklists on the Town’s website.
3. Develop a handout on SB 9 standards and the application process and distribute at Town Hall and to all property owners of vacant single-family lots.
4. Promote SB 9 potential in the Town’s newsletter and SB 9 handout, on social media, and on the Town’s website.
5. Establish an SB 9 specialist in the Community Development Department.
6. Adopt an ordinance by July 1, 2023, to increase the maximum unit size from 800 square feet to 1,000 square feet.
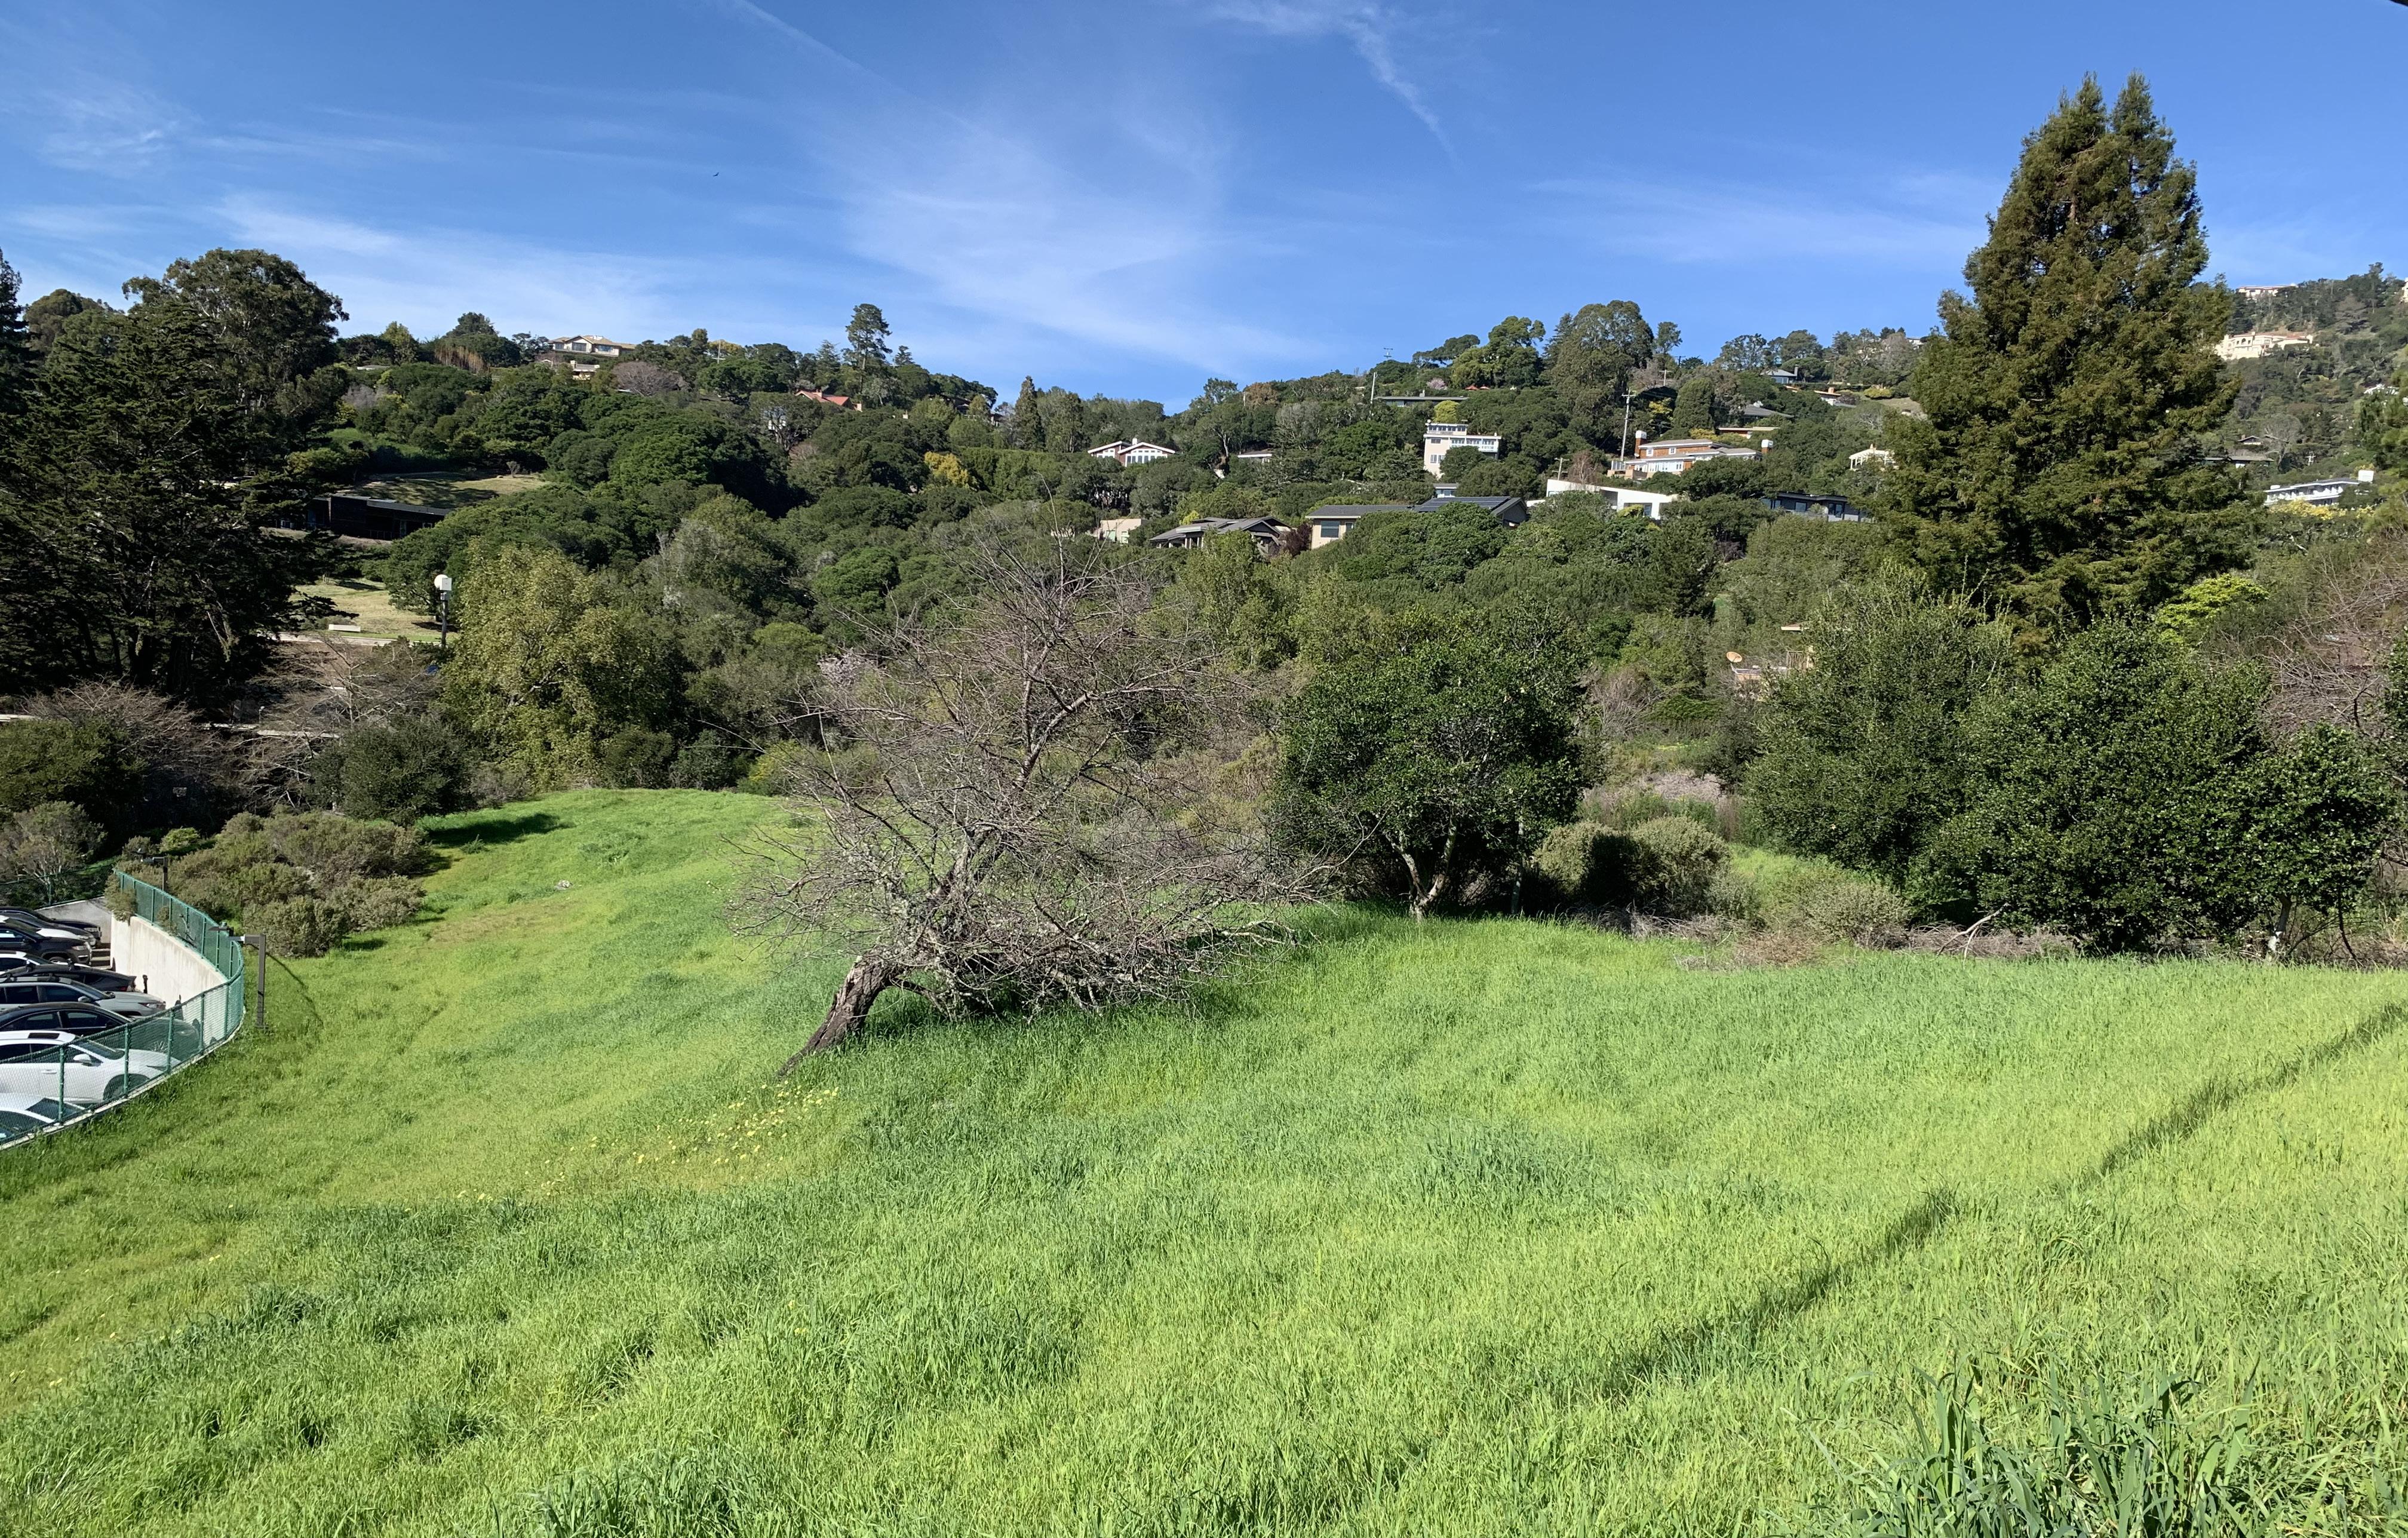
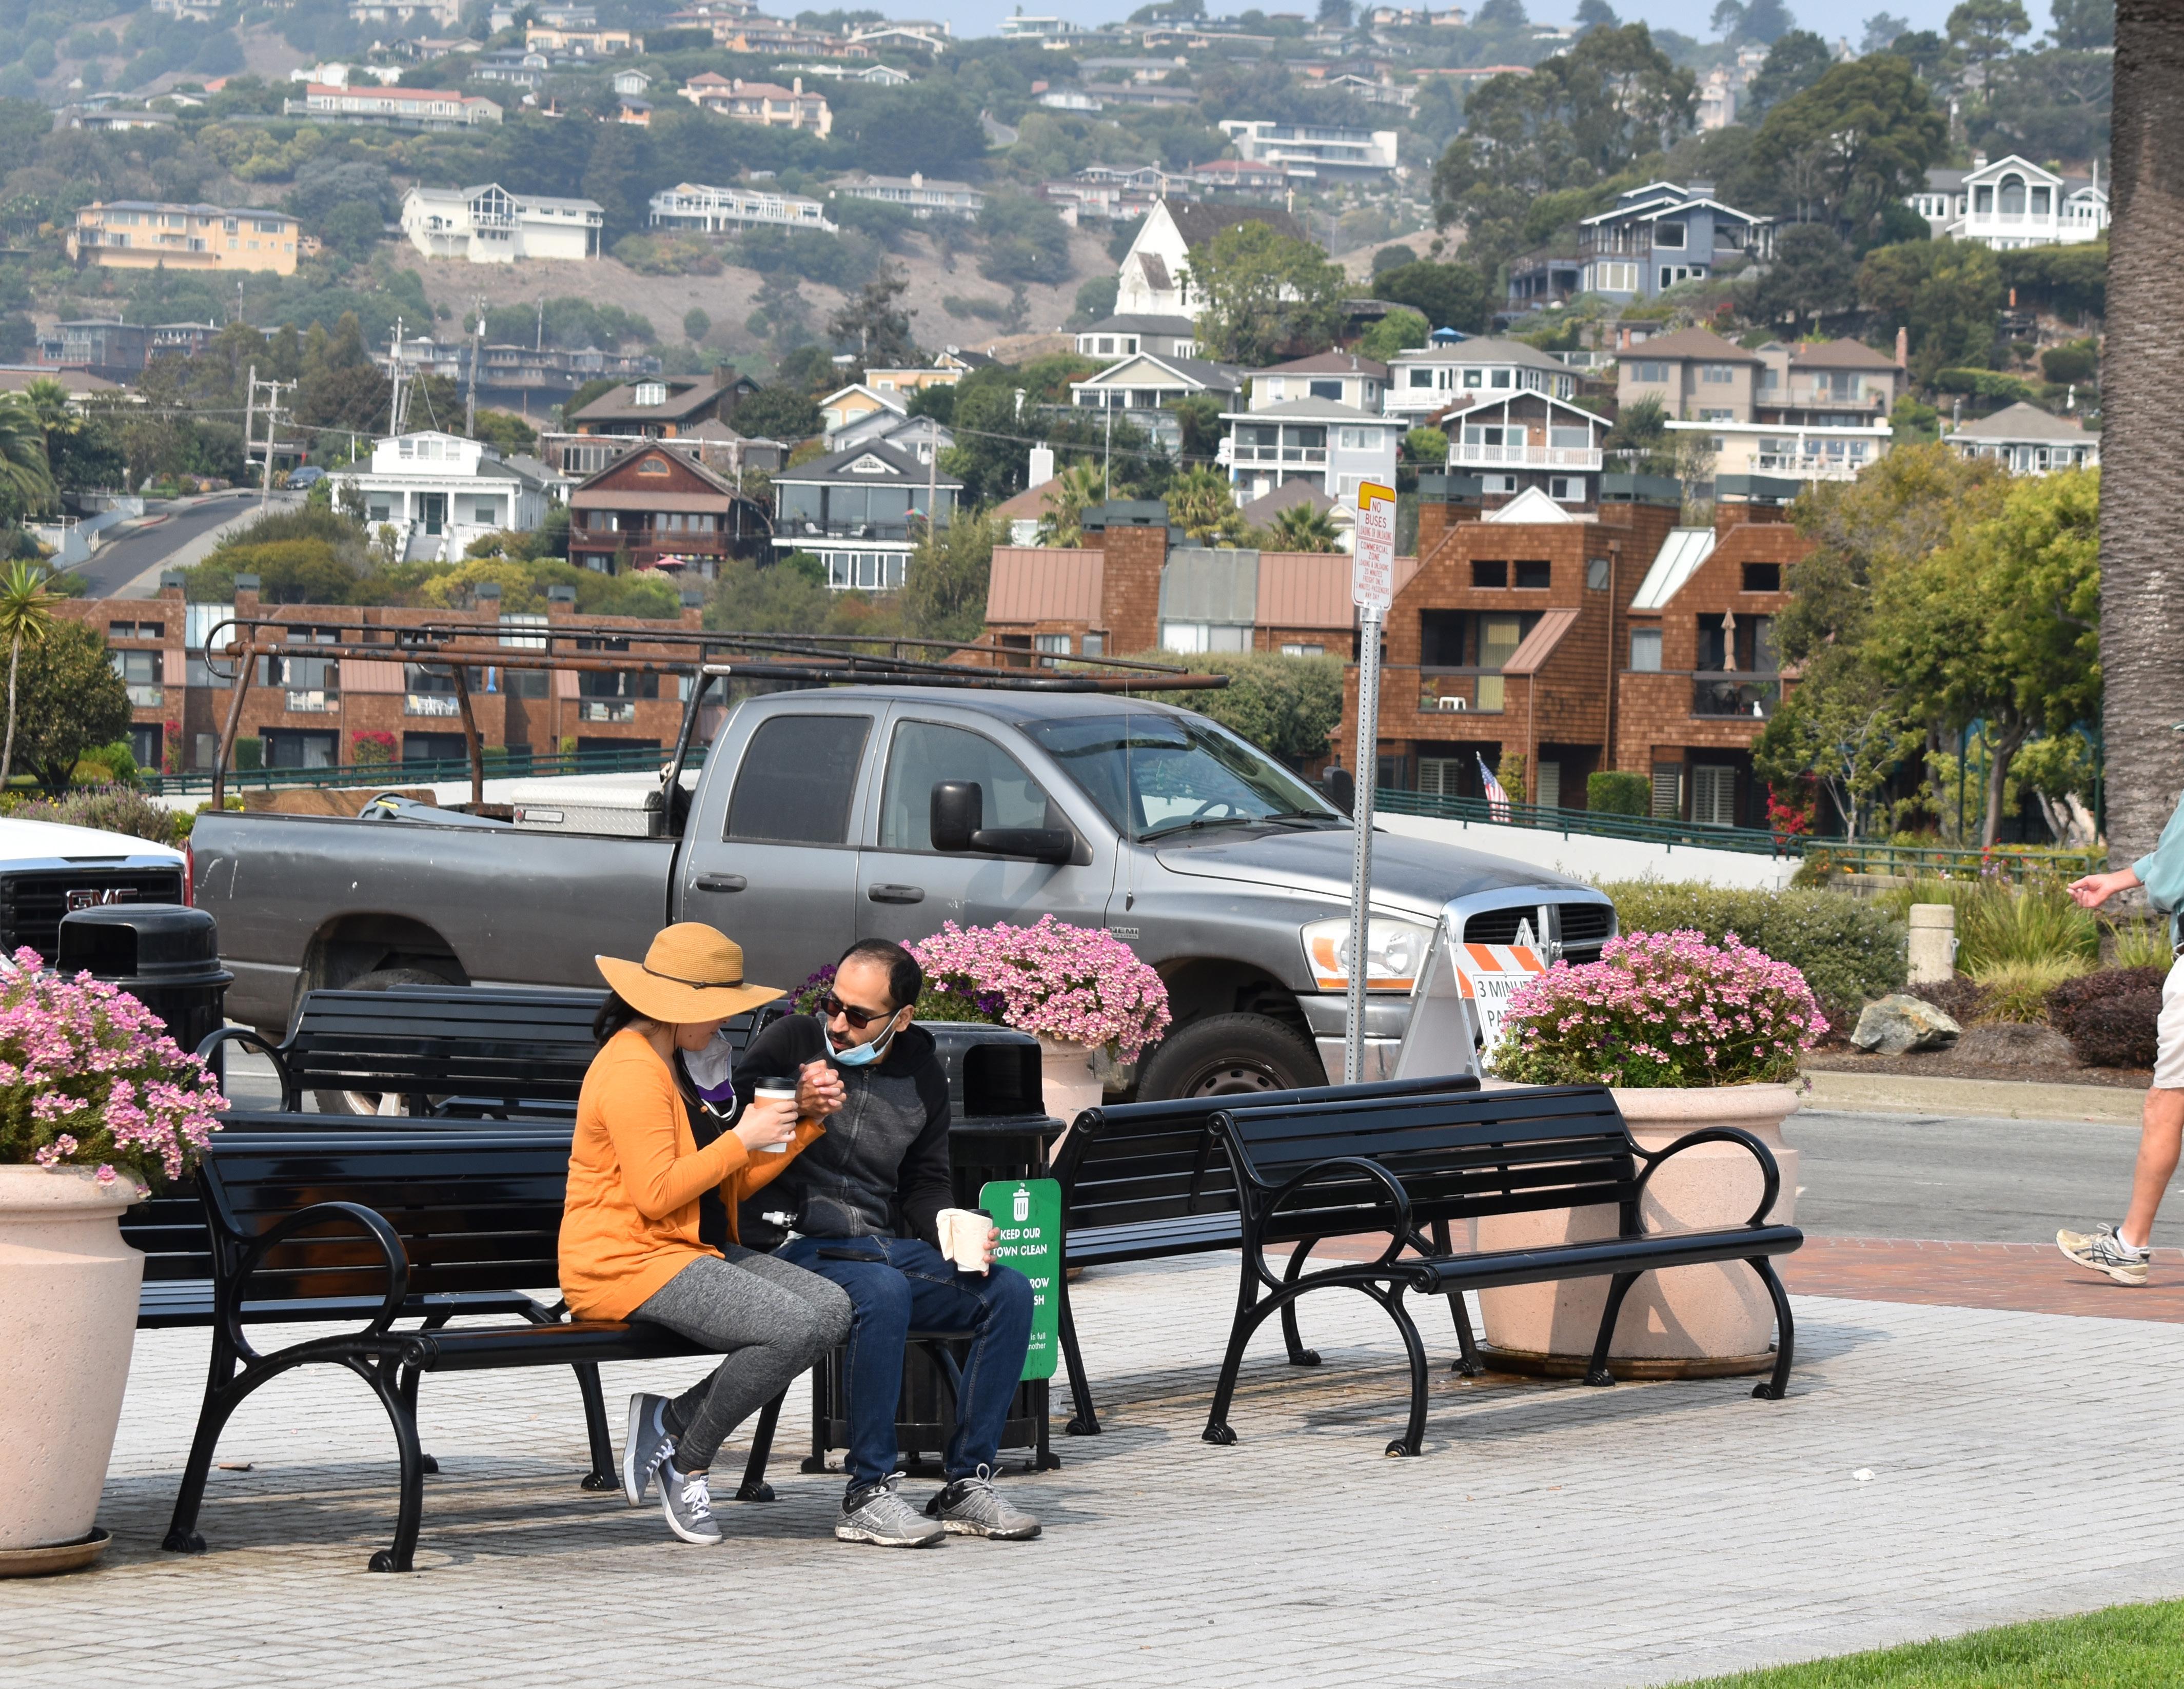
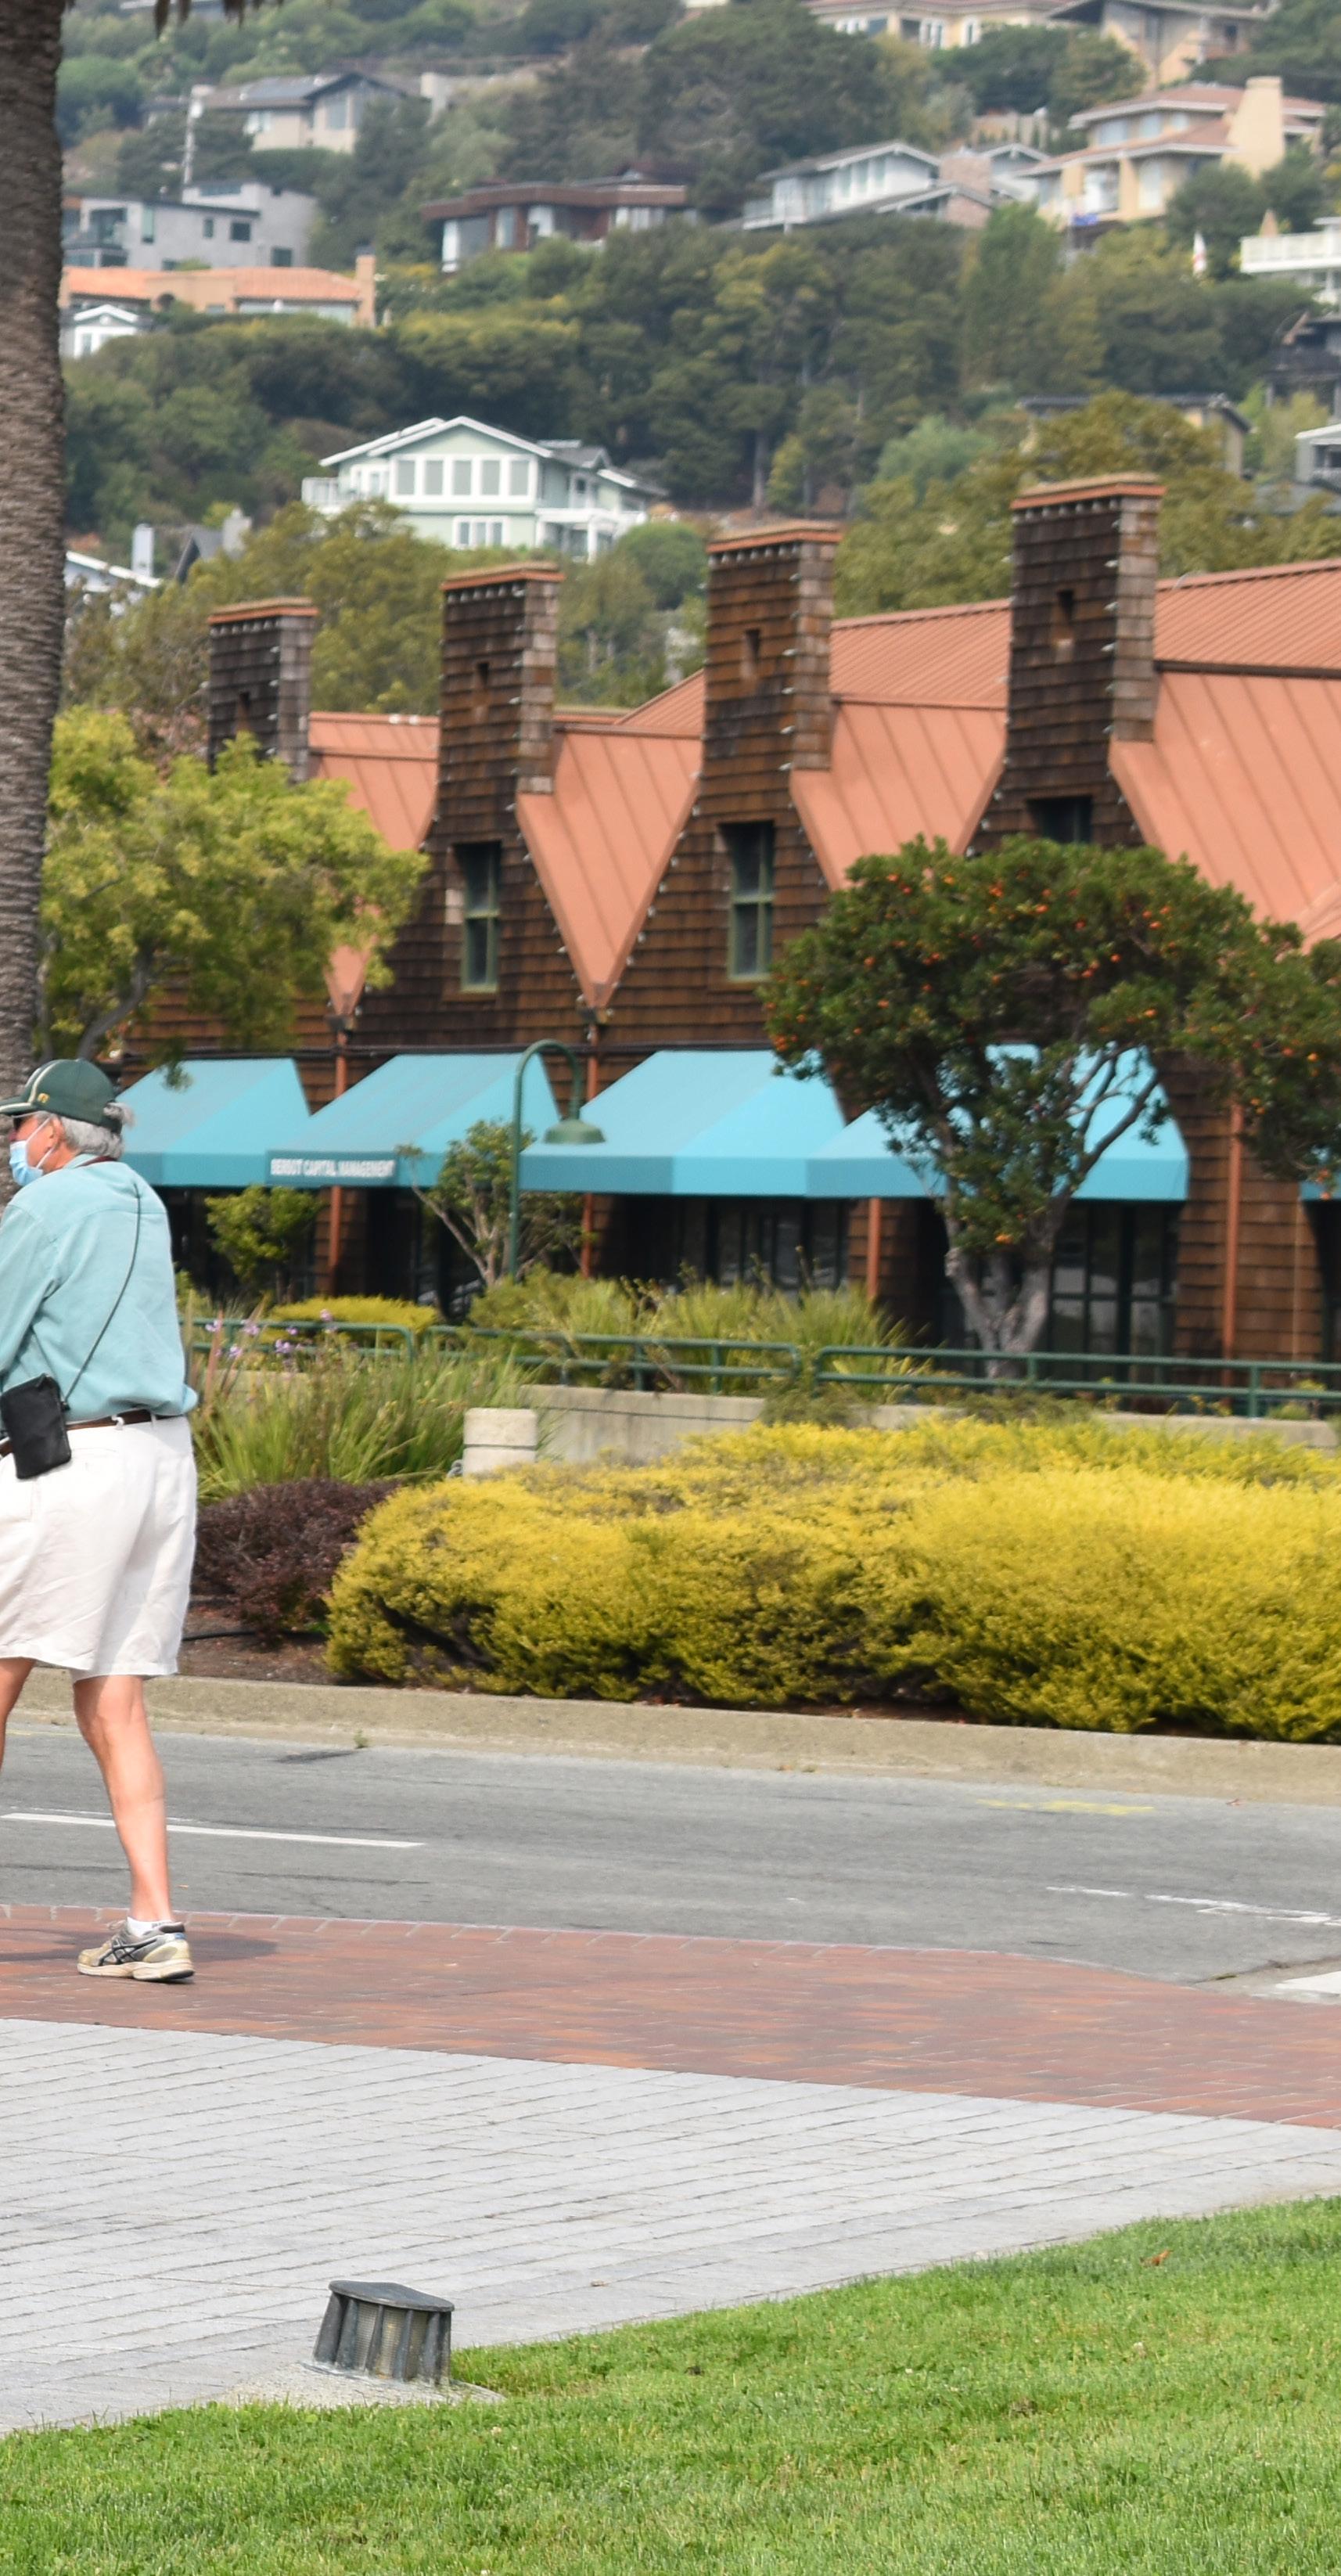
The Diversity, Equity, and Inclusion chapter illustrates the Town of Tiburon’s commitment to building a more diverse equitable, and inclusive community for future generations. By centering the importance of equity and environmental justice in the Town’s General Plan, Tiburon is showcasing its commitment to addressing historical inequities that have disproportionately affected marginalized groups. This commitment includes a substantive focus on environmental justice in accordance with SB 1000, which was passed by the California State Legislature in 2016 to require local governments to identify disadvantaged communities and include environmental justice in general plans. Additionally, many of the people that work in Tiburon’s service and hospitality industries are commuters who reside elsewhere in the San Francisco Bay Area. Including these workers alongside people from marginalized groups within Tiburon will
create a more inclusive environment for all, one in which residents, workers and visitors alike feel a sense of belonging. Many of the structural inequities that have affected marginalized groups such as communities of color, indigenous people, and lower-income individuals have had long-lasting effects. These inequities, both explicit and implicit, have a long history beginning with the displacement of the Coast Miwok people in the 19th century. Throughout the United States, the inequitable land use practice of discriminatory lending, otherwise known as “redlining,” have segregated disadvantaged communities into areas where they are disproportionately at risk from environmental hazards such as air pollution. Tiburon’s history of racial covenants which banned people of color from buying property, as well as exclusionary zoning rules that regulated the community’s socioeconomic diversity, have had long-term effects both locally and regionally, much the
same as other communities throughout the San Francisco Bay Area.

By centering social equity and environmental justice in the General Plan, the Town acknowledges how contemporary policies can disproportionately affect communities that have historically been disadvantaged by structural inequity, discrimination, and exclusion. Equity and justice are foundational commitments in both this element and throughout the Town’s General Plan.
Toward these ends, the Town will work closely with elected officials, community leaders, residents, and employees to identify opportunities to increase the sense of welcoming for residents, employees, tourists, and other visitors who travel to and spend time in Tiburon. Following regional and national movements and models for revising the names of places, buildings, schools, and public structures, Tiburon will develop an approach for identifying and renaming locations and landmarks
in town that can be perceived to have negative connotations. Similarly, the approach will identify landmarks and other built environment objects that similarly may be perceived to have negative connotations or offensive historical uses. The Town can learn from local efforts to rename schools that had been named for Confederate figures and ideas. The Town can also model its efforts on those of the federal government which recently began renaming parks and landmarks that have an anti-Native American racial slur. Whether the names of Tiburon places and landmarks were originally intended to have a link to offensive language, ideas, or practices should not preclude the Town from exploring new names for these places that can be perceived at best as questionable, but at worst as condoning racist practices. The approach the Town will take will include the participation of community leaders and residents to help identify the opportunities to improve the sense of a welcoming community.
This chapter presents Tiburon’s commitment to addressing historical inequities that have disproportionately affected marginalized groups.
Source: Chamber of Commerce
The Diversity, Equity + Inclusion chapter includes the following sections.
5.2 Key Definitions.
Provides definitions for the concepts of equity, diversity, and inclusion as used in this chapter.
5.3 Equity.
Describes the role of equity in planning.
5.4 Environmental Justice.
Provides an overview of disadvantaged communities that are subject to disproportional environmental hazards and impacts and demographic characteristics of Tiburon residents.
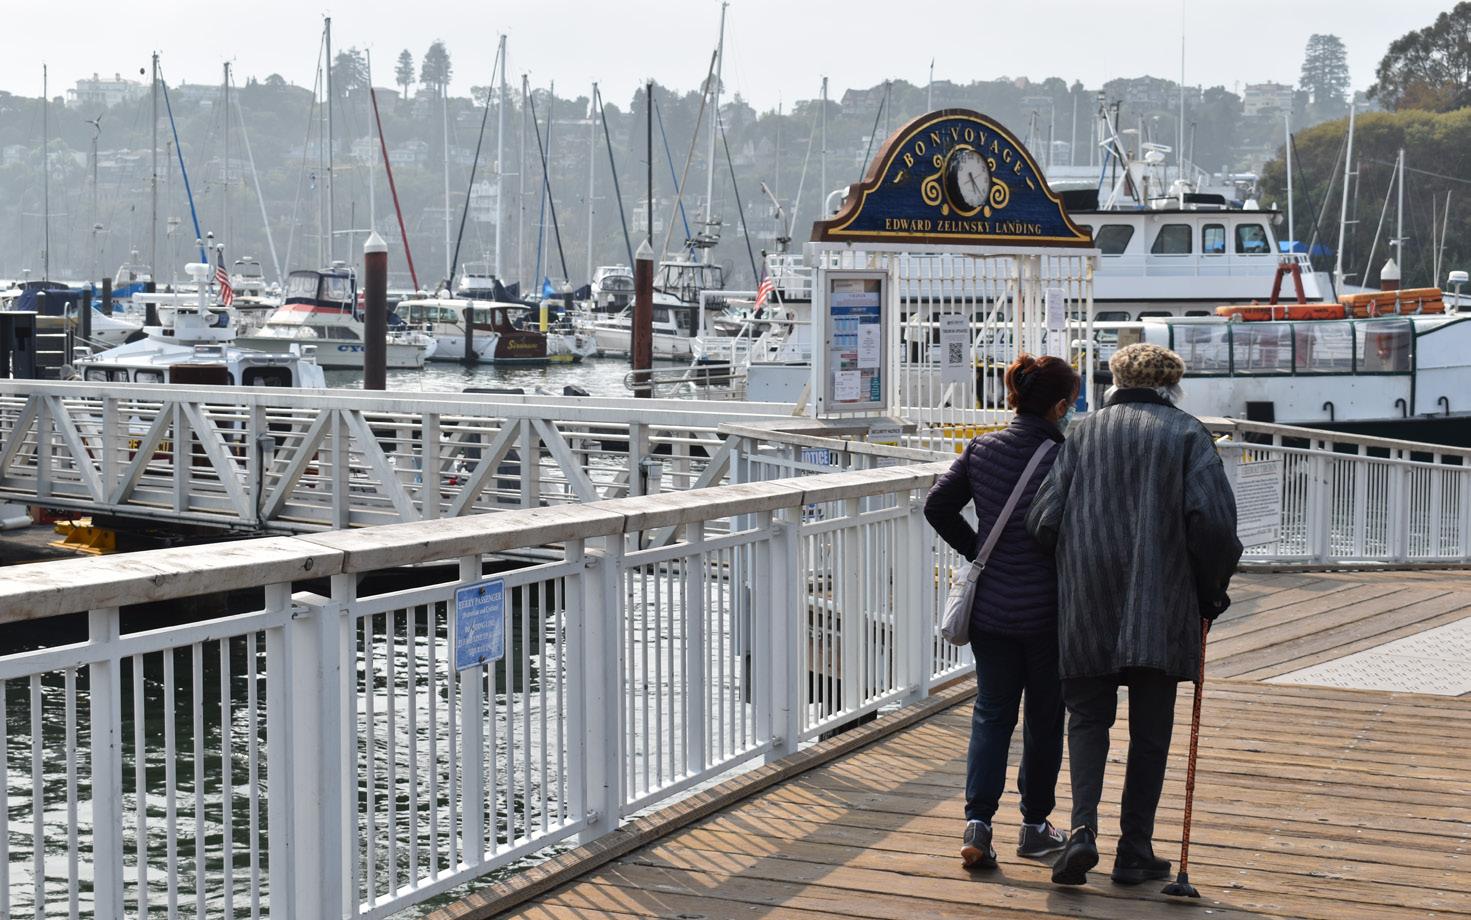
5.5 Planning for a Diverse Community.
Discusses characteristics that define a diverse community, including gender identity, sexual orientation, race, ethnicity, color, sex, national origin, age, income, and ability status.
5.6 Goals, Policies, and Programs.
Identifies goals, policies, and programs to guide growth of a just, equitable, and diverse community.
The presence of a variety of different characteristics that shape identities and characteristics, both individual and communal. Diversity includes more visible characteristics such as race or age as well as less potentially visible elements such as ability status, sexual orientation, gender identity, work experience, language, and socioeconomic status.
The process of giving fair treatment and impartial access to opportunity to all individuals or groups irrespective of different characteristics. This requires the identification and remediation of structural barriers that have historically affected and currently affect disadvantaged communities.
The creation of an environment in which all individuals and groups feel valued, accepted, and supported in participating fully in the greater community.
INCLUSION
All individuals and groups feel valued, accepted, and supported.
Equity means to plan for a just and fair inclusive society in which all can participate and thrive. Planning and the distribution of resources should consider how communities have been historically advantaged and disadvantaged. Emphasis should also be placed on considering the impact of policies on future generations. Ideally, the authentic inclusion of historically disadvantaged communities throughout the planning process is essential to ensuring equitable outcomes. Equity is the acknowledgment of differing circumstances and the allocation of resources to ensure equitable outcomes. This differs from equality, the distribution of the same resources, in that it recognizes how past circumstances have affected present outcomes and corrects for disadvantages.
Environmental justice, as defined by the California Environmental Protection Agency, is “the fair treatment of people of all races, cultures, and incomes concerning the development, adoption, implementation, and enforcement of environmental laws, regulations, and policies.” For treatment to be fair, no group should be disproportionately affected by the negative environmental impacts of policy.
Social, distributive, and procedural justice are related to this concept. Social justice addresses the longlasting intergenerational impacts of historical injustices. These are often distributed along identities such as race, class, national origin, and sexuality. For example, the 1964 Civil Rights Act was an example of social justice that ended open discrimination in the issuing of housing loans to communities of color. Distributive justice addresses the inequitable distribution of systemic advantages and disadvantages across both geographic and identity-
based groups. As an example, disadvantaged families have had less social mobility and wealth transfers between subsequent generations due to lower access to housing and property ownership, both of which are significant drivers of intergenerational wealth. Procedural justice addresses the inclusivity of decision and policymaking processes. A lack of inclusivity can be seen with communities of color and lower-income areas because they are generally not well represented in government as compared to their proportion of the general population.
The Clean Energy and Pollution Reduction Act of 2015, or SB 350, defines “disadvantaged communities” as those which are disproportionately affected by negative economic, health, and environmental conditions. The California Office of Environmental Health Hazard Assessment uses these factors and others such as concentrations of poverty, unemployment, and low educational attainment to identify
disadvantaged communities using their tool CalEnviroScreen. In this tool, each census tract in California is scored on a series of environmental health metrics and then ranked by percentile relative to the state of California.
As of the 2010 US Census, Tiburon is roughly divided into two census tracts: 1241 and 1242, areas that include land outside the Town limits. The 2018 CalEnviroScreen 3.0 describes both Tracts 1241 and 1242 as being in the overall bottom 1-5% percentile of census tracts, meaning that Tiburon is a community that is only marginally affected by environmental and health burdens. From a social perspective, both census tracts score well below the median percentile of California communities that have high rates of poverty and linguistic isolation. According to the metrics designated by SB 350, there are no officially designated disadvantaged communities in Tiburon.
Tiburon residents are generally healthy with rates of asthma, low birth weights, and cardiovascular diseases all being low compared to the rest of the state. Additionally, regarding exposure to pollutants such as PM 2.5, diesel, pesticides, and other toxic materials, both census tracts score below the 50th percentile. One measure that is worth noting is that both tracts score in the 90th percentile with exposure to impaired water bodies that are contaminated by pollutants. The primary reason for this is that Tiburon borders the San Francisco Bay.
Tiburon’s built environment is wellmaintained. AllTransit, a transportation database developed by urban development nonprofit Center for Neighborhood Technology, notes that 72.8% of jobs within Tiburon were within 0.5 miles of transit. The
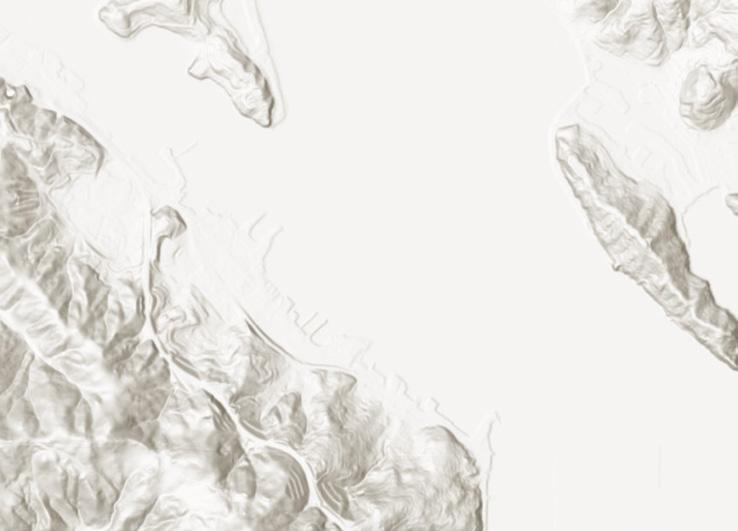

Bay Area Greenprint, a database developed by a collaboration of Bay Area environmental groups and research centers, describes 38% of Tiburon’s 2,873-acre land area as being a “publicly-accessible protected [green] area.” With regards to environmental hazards, 16% of Tiburon has historically been affected by raininduced landslides and 85% of the land is located within the high fire-risk wildland-urban interface.
These are the following most spoken languages after English: 1. Other Indo-European languages, 2. Asian and Pacific Island languages, 3. Spanish.
Source 2020: US Census - American Community Survey 5-Year Estimates
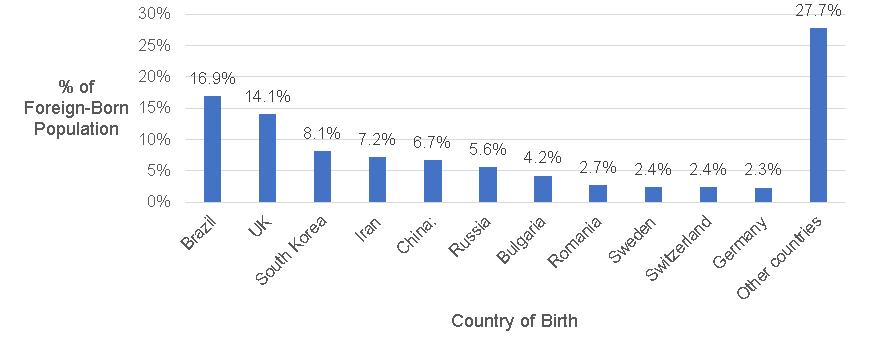
According to the US Department of Housing and Urban Development, diversity refers to the various dimensions which can be used to distinguish between different individuals or groups. These dimensions can include gender identity, sexual orientation, race, ethnicity, color, sex, national origin, age, income, and ability status. Differentiators can also come from other lived experiences such as military service or careers, as well as other everyday routines. Because of the variety of ways in which a community can be diverse, planning for a diverse community must be dynamic, nuanced, and adaptable over a long period of time to changing circumstances. Diversity is also a spectrum with various lived experiences, as can be seen with the different degrees of ability status or in the experiences of multiracial individuals. Tiburon strives to create a community that is inclusive, respectful, and responsive to a variety of different lived experiences.
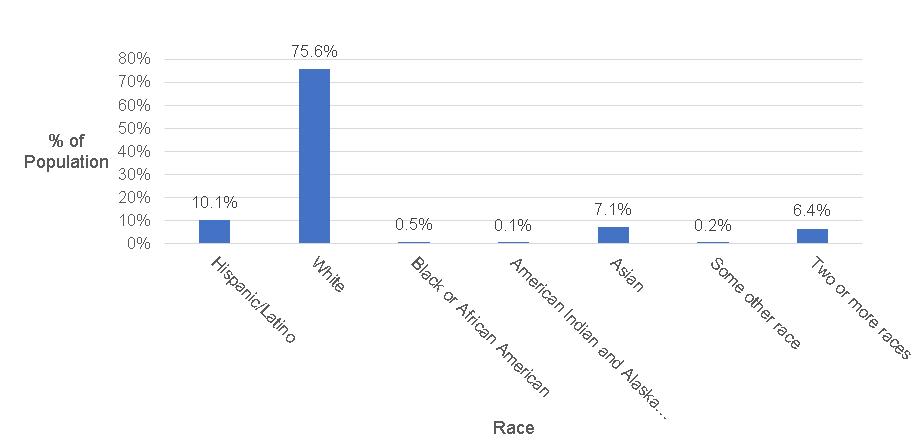
With a median household income of $178,125, Tiburon is well above the state’s median household income of $78,672. Nonetheless, there are lower-income households in Tiburon, as well as residents that come from underrepresented backgrounds. Tiburon should aim to focus on these disadvantaged individuals and families to help address historic inequities and create a Town atmosphere that is inclusive towards all.
In 2020, roughly 33.56% of Tiburon residents, or 1,947 people, were born in a foreign country. The largest plurality, 16.9%, is from Brazil, followed by the United Kingdom, South Korea, and Iran. Nearly 27.7% were born in over a dozen other countries that are not listed (US Census, 2020).
A foundational principle of any diverse city is an ongoing community discussion about social justice. As communities of color have been disproportionately impacted by structural discrimination, Tiburon is committed to addressing
these impacts in sectors such as healthcare, education, housing, and others. This extends to the LGBTQ+ community as well as individuals with multiple identities. Individuals with intersectional identities across different marginalized communities, such as trans women of color, oftentimes face uniquely difficult experiences in accessing basic needs. Acknowledging and accounting for this intersectionality is critical to creating a more just and equitable Town.
Physical and mental ability status are also important considerations for an inclusive city. In Tiburon, 9.9% of the population, or 899 people, identified as having a disability in 2019 (US Census, 2019). Addressing ability status is also important in considering policies for Tiburon’s unsheltered population. A 2019 research survey counted roughly 1,034 unsheltered individuals throughout Marin County, with 38% of these individuals self-reporting at least one disability condition (Jaross, Kwak, and Gallant 2019). While Tiburon is
only one town in the county, it has a responsibility to do its fair share to help these residents and contribute to solving the challenges facing the Bay Area’s houseless population.
According to 2019 data, over 90% of the employees who work in Tiburon live outside of the Town. Of these employees who work in Tiburon but do not live there, 11% live in San Francisco. These workers work predominantly in the service industry and most of them earn about $3,333 a month, or $39,995 annually. Approximately 41% Tiburon renter households are costburdened by paying 30% or more of their income for rent, highlighting the significant need for the development of more affordable workforce housing within the Town. Tiburon’s median 2016-2020 gross rent of $2,537 prevents many of these employees from potentially living within the Town. Notably, people identifying as Hispanic or Latino are disproportionately represented in Tiburon’s worker
population, where they make up 20% of workers when compared to the Town’s general population, where they make up 10.1% of residents.
Ensuring all residents can participate regardless of language, ethnicity, national origin, color, race, sex, age, sexual orientation, income, or citizenship status will ensure that Tiburon grows to become a more inclusively equitable community. Additionally, clarity and transparency throughout the policy-making process will help build public trust while also encouraging further authentic participation by the public. This public trust can be further strengthened through partnerships with local organizations and residents
on developing strategies to meet community needs. This cooperative policymaking and leadership can also elevate historically disadvantaged communities that have previously been unable to participate in government.
Tiburon has been active in engaging local groups and partners in local planning processes. This was the case with the Town’s recent update of its General Plan when it interviewed and surveyed several key stakeholders and organizations to ensure that the update had community input. When conducting this type of community engagement it is also important to include the views of underrepresented perspectives and diverse lived experiences, including those who work in and visit Tiburon as well as residents. Otherwise, traditionally engaged segments of the population will have more influence over the outcomes of policy making.
To access historically unengaged parts of the community, novel approaches are often needed. As an example,
Tiburon’s use of webcasting and other forms of social media helps strengthen public transparency. Other municipalities in Marin County have created public engagement plans to formalize their outreach efforts and adapt them to the needs of their respective communities. Outreach strategies can be customized through tools such as multilingual community organizers or culturally relevant language changes. A lack of participation from historically unengaged communities is more often a reflection of shortcomings in engagement efforts and models, rather than of apathy. Shifting resources to facilitate engagement from all parts of a community is critical to facilitating inclusive public participation.
Serve as a regional and countywide leader in the incorporation of equity and inclusion principles into local decision-making processes.
Provide education and training on inclusion, equity, diversity, and related concepts for Tiburon staff, Boards, Commissions, advisory groups, and other civic bodies. This discussion should include anti-racism education and a specific public place for expression. This could include forums, discussions, or quarterly speaker series. Continue to have a Diversity, Equity, and Inclusion Task Force to make recommendations to educate the community at large.
Collaborate with community-based organizations to engage with historically disadvantaged communities who have been left out of public processes due to language, mobility, race, color, national origin, age, citizenship, income status, or other barriers. This engagement should authentically support community empowerment and self-determination in processes such as those surrounding project planning.
Program DEI-b Community Stakeholders.
Actively facilitate opportunities for all Tiburon residents to engage. These programs should be specifically aimed at under-represented components of the community such as communities of color, immigrant communities, youth, commuters, and younger families. Use community-driven outreach methods
around cultural meeting places and informal social networks to engage under-represented groups. Partner with community organizers in this effort.
Program DEI-c Outreach. Leverage the Town’s social media and website presence to improve transparency and participation in local government. Clearly identify meetings, issues, actions, and ways to comment within all municipal documents, processes, and information to increase access and participation.
Program DEI-d Local Elections. Facilitate opportunities for local elections to increase resident participation in local government, particularly among underrepresented components of the community.
Program DEI-e
Leadership in Local Government. Increase opportunities for BIPOC representation in elected, staff, and appointed positions in local government. Develop more diverse candidate pools and interview panels that elevate the best candidates for the community.
Program DEI-f Removing Language Barriers.
Guarantee that non-English speaking populations can actively participate in local decision-making through accommodations such as translations of meeting materials, bilingual community notices, the use of accessible and culturally competent language, multi-lingual meetings, new online social media commenting platforms, and interpreters at public meetings. Following the Americans with Disabilities Act, local government should address ability
status by incorporating services such as American Sign Language translations, assistive listening devices, real-time transcription, and other accommodations.
Program DEI-g Surveys.
Regularly use community-focused outreach methods such as multilingual and culturally appropriate focus groups, surveys, and other research tools to solicit input from underrepresented communities. When feasible, use community organizations to conduct surveys using grants or stipends to encourage participation.
Program DEI-h Community Meetings.
Conduct meetings with disadvantaged community members to support shared leadership and decisionmaking. Use these opportunities to collaborate with community-based organizations on strategies to identify and engage underrepresented communities.
Support advocacy, training, and education efforts by local social service providers and other groups such as the Canal Alliance, an organization which supports Marin County’s Latino immigrant communities. Identify and collaborate with groups engaging with issues facing Tiburon’s disadvantaged families such as those that are BIPOC, lower income, immigrant, senior, LGBTQ+, and/or have historically faced discrimination. Communities that otherwise require special needs should also be supported.
Use committees, task forces, commissions, boards, & other bodies composed of residents who represent the Town’s demographics and community, to assist Town staff and the local government in decision-making processes.
Program DEI-i Board and Commission Diversity.
Strive to ensure that Town Boards and Commissions are represented by a diverse and inclusive community. Focus recruitment for these bodies on underrepresented groups of the community.
Support and encourage the youth and young adult involvement in government, especially on relevant issues such as climate change, education, transportation, and youth services.
Program DEI-j Youth-Focused Outreach.
Work with local educational institutions, student groups, youth groups, and community-based organizations to increase youth engagement in public processes. This inclusive engagement should reflect Tiburon’s demographics.
In this, a primary focus of the Town’s transportation and development planning should be the fitness of Tiburon’s residents.
Urban design can be used to encourage physical activity such as walking and cycling, which can in turn reduce rates of chronic conditions such as obesity and diabetes. Land use decisions should reduce exposure to pollution and other unhealthy environmental hazards to avoid further compounding health risks in disadvantaged populations. Through this, Tiburon will create a safe environment in which people in every part of the Town can lead healthy, active lives.
Crucial to a healthy environment is access to healthy food. This concept is multidimensional and includes healthy nutrition, ending food insecurity, and encouraging local food production.
Broadly, Marin County has a lower rate of food insecurity than other counties in California and throughout the United States. To further this, increasing acceptance of food stamps at local markets, and access to community spaces to grow healthy food can improve health outcomes. Municipal land use regulations can also be used to prevent concentrations of unhealthy food, alcohol, tobacco, and vaping establishments around areas frequented by children. Similar structural efforts are also needed to address the nutritional needs of unsheltered populations as well as those who may experience temporary periods of need.
Design Tiburon’s neighborhoods to promote physical activity by including opportunities for safe walking and cycling access to essential goods and services.
Program DEI-k Pedestrian and Bicycle Improvements. Implement pedestrian and bicycle improvements, as described in the General Plan’s Mobility chapter and the Tiburon Bicycle and Pedestrian Plan. Improved safety features, streetscape improvements, landscape revitalization, and other changes can make it easier, safer, and more comfortable to be physically active in Tiburon. This implementation should focus on areas that currently have less access to these features. Consider the public provision of bicycles.
Ensure that there are safe physical spaces for families, children, and young adults to be physically active in all neighborhoods, particularly in areas where residents may lack outdoor living space.
DEI-l
Use public health data as a guide when implementing infrastructure improvements such as parks, sidewalks, and bike lanes.
Increase curated public outdoor spaces, especially in higher-density neighborhoods that may develop as part of the affordable housing efforts. Vacant lots or rights-of-way can be opportunities to increase these spaces.
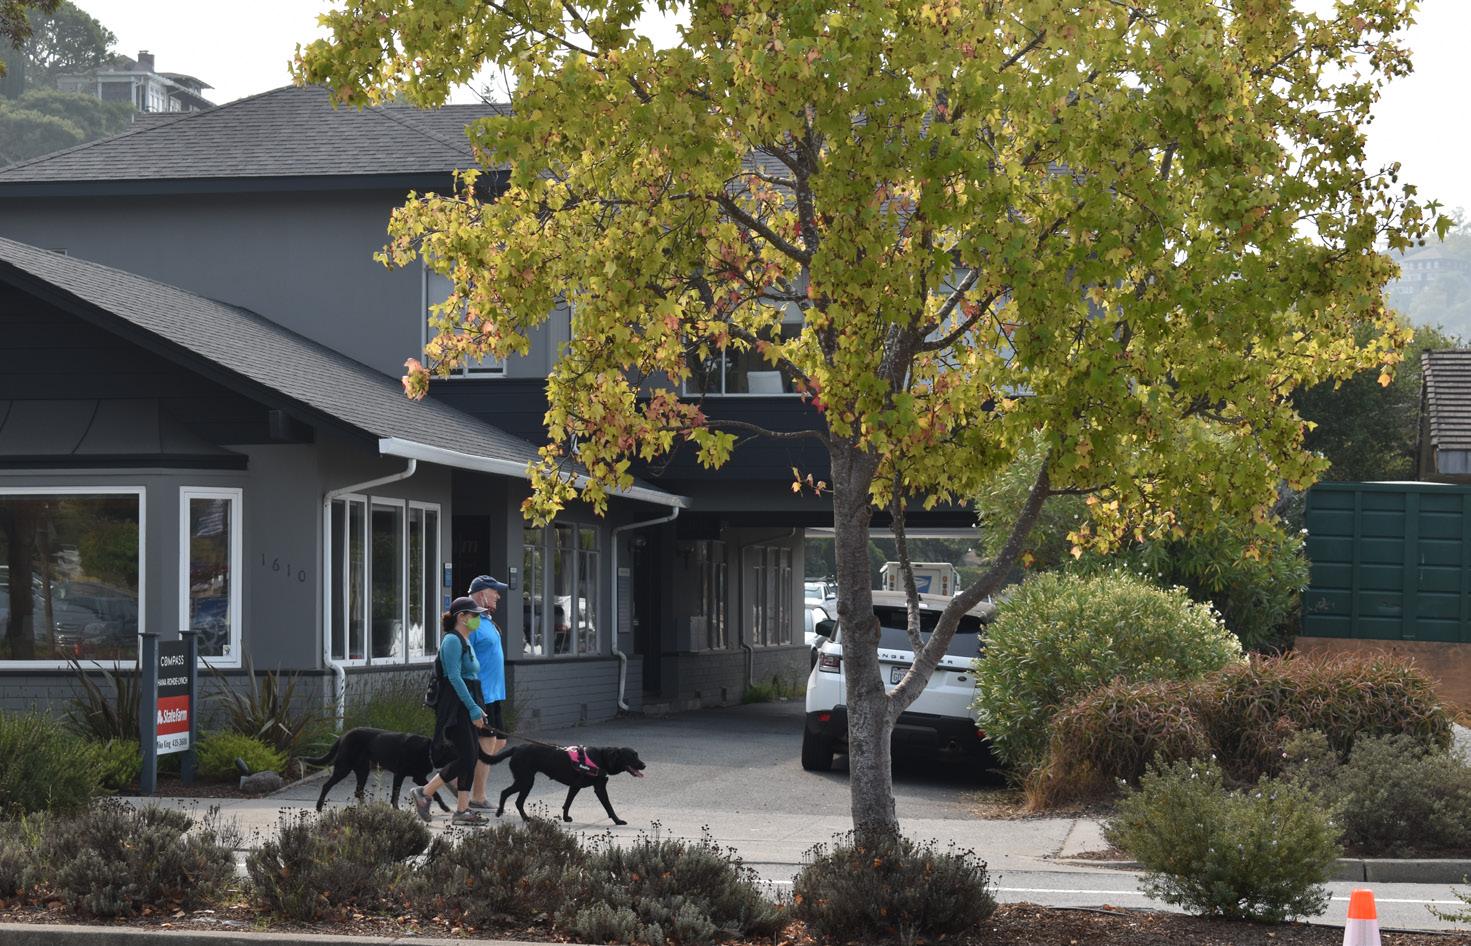

Promote community awareness around maintaining mental and physical health. Incorporate best practices around this in official Town programs and activities.
Design that encourages physical activity such as walking and cycling can help reduce rates of diabetes and obesity.
Program DEI-n HEAL Campaign. Engage in the Marin Countywide Healthy Eating Active Living (HEAL) campaign in supporting actions that improve physical well-being and health through transforming the physical environment.
Program DEI-o Municipal Code Review.
Regularly review municipal codes and regulations for health impacts. This includes provisions around tobacco, vaping, smoking, indoor air quality, and HVAC systems. Update these measures to help sustain safe living conditions during extreme weather events.
Ensure that transportation and land use policies do not create environmental hazards that disproportionately affect vulnerable and low-income populations. Where these conditions currently exist, reduce, or eliminate such hazards.
Program DEI-p Reducing Exposure to Hazards.
Appropriately utilize conditional use permit requirements for businesses near residential neighborhoods to reduce noise, odor, smoke, vibration, and other forms of pollution. When issues arise, work with local business owners and community members to encourage responsiveness.
Program DEI-q Reducing Indoor Air Pollution.
Distribute accessible and multilingual information on indoor air pollution to vulnerable populations, including lower-income communities. In multifamily housing projects, quickly respond to complaints about smoke and odors to address community concerns.
Program DEI-r Environmental Hazard Data.
Maintain data on environmental hazards and vulnerable populations near hazards using tools such as CalEnviroScreen.
Encourage the development of green spaces in Tiburon’s residential neighborhoods. This should include tree planting, landscaping, and other improvements that aesthetically reduce pollutants and increase climate resilience.
Program DEI-s Greening Priorities.
Support Town-sponsored urban greening initiatives in areas that may become high residential density, low tree cover& low access to open spaces.
Expand access to healthy nutritional options in Tiburon with accessible grocery stores, community gardens, farmers' markets, and general markets, to encourage healthier options for
residents. Support and promote small neighborhood-oriented urban agriculture focused on neighborhood gardens and farmers markets. to meet the needs and scale of the Town. New development opportunities could provide rooftop gardens and small community gardens in their design, responsive to both health and climate change needs.
Program DEI-t Obstacles to Food Production.
Support public wellness and health through regularly review and update of zoning regulations to identify and remove barriers to neighborhoodoriented urban gardening and food production in residential neighborhoods.
Increase housing stability for all residents, especially those that come from vulnerable populations that are low-income, senior, or have been historically disadvantaged.
Residents should enjoy this stable housing without fear of displacement by high rents and low affordable housing stock. Tiburon will work with stakeholders such as rental property owners and landlords to develop fair, workable solutions for all parties.
As of 2020, 34.4% of Tiburon’s renter households use more than 35% of their incomes for housing (US Census, 2020). The impact of the pandemic has presumably worsened these
numbers. Rising rent prices often fall disproportionately on vulnerable populations. The COVID-19 pandemic has exacerbated these housing inequities. Moreover, vulnerable community members and families, for both social and economic reasons, may be unable to move to more affordable localities and are often unaware of potentially helpful resources.
Tiburon should orient its planning and development to proactively address these conditions so that these burdens do not disproportionately affect disadvantaged families and individuals. Housing should be produced for all income levels as well as both owners and renters. The Town should also introduce measures to address the displacement of lower-income residents. This is especially important as Tiburon considers the development of more housing. The accelerated production of accessory dwelling units and other innovative forms of housing can also help further housing stability by increasing the supply of affordable housing units.
Restrict the displacement of lowerincome and vulnerable residents that may be affected by rising costs, without-cause evictions, and/or other structural economic factors.
Implement anti-displacement strategies in future development and policies that may result in a decrease in affordable housing, displaced tenants, or economic hardships due to cost-ofliving increases.
Explore and promote the protection of Tiburon renters while also facilitating positive and productive communication between tenants and landlords.
Educate the community and relevant stakeholders about historic housing discrimination and its consequences. Consider the continued impact of this discrimination in Tiburon and the region when developing housing policies. As noted in the Housing Element, affirmatively further fair housing through overcoming historic systemic segregation.
Support the development of affordable rental housing that meets the needs of all Tiburon residents.
Support local community-based organizations and other housing
advocates in their efforts to acquire and convert private market-rate apartment complexes into affordable housing using state and federal tax credit programs. Help create community land trusts that will acquire existing housing and maintain its affordability.
Effectively enforce housing codes in all neighborhoods to prevent unsanitary or unsafe conditions. Ensure that this enforcement does not displace lowerincome residents or increase housing cost burdens.
Support community organizations and groups that provide emergency housing, shelter, and other essential services to vulnerable communities. This includes temporary housing for displaced and unsheltered individuals.
Collaborate with community organizations to support and develop temporary housing solutions for
immigrants, refugees, low-income individuals, seniors, and other vulnerable populations throughout and after an emergency.
these communities face, lower-income neighborhoods may have needs that are different from those of the overall community. Different sources of funding from state, federal, foundation, or other private sources can be leveraged to prioritize development in many disadvantaged areas. These alternative and additional sources of funding should be considered within the planning process.
illegal dumping, roadside garbage, vandalism, graffiti, noise, smoke, and other public nuisances. Maintain objective and transparent data on reports and follow-up actions.
Program DEI-aa Security and Safety Improvements.
Support public safety improvements and maintenance around street lighting, speed control, security cameras, directional signage, and sidewalks.
A key principle of equity-driven planning is prioritizing the distribution of resources to directly benefit underprivileged families. These communities have historically experienced a lack of investments, deferred or otherwise. Due to the various cultures and lived experiences
Ensure that the cleaning of streets, litter, and illegal dumping as well as the maintenance of public streets, sidewalks, streetlights, and other public facilities are performed equitably throughout Tiburon. Responses to public nuisances and violations should also be done without regard to income or location.
Support programs that residents and businesses can use to easily report
Build positive, trustworthy, and safety-oriented relationships between residents, businesses, and law enforcement.
Program DEI-bb Neighborhood Safety Partnerships.
Encourage partnerships between lower-income residents and local police to address law enforcement concerns, including organized events such as neighborhood walks and police “walking the beat” to create personal relationships and learn about community issues. Consider
Support empowering and increasing selfefficiency within disadvantaged and vulnerable communities through ensuring equitable access to services such as health care, education, public safety, social services, and transportation.
a collaborative public and police oversight board.
Program DEI-cc Community Stakeholder Collaboration. Build trustworthy and transparent relationships between law enforcement, local government, residents, and other community stakeholders.
Program DEI-dd Data Collection and Outcomes Analysis.
Support the objective and transparent collection of public safety data. Analyze outcomes and identify ways in which the community can be better served and protected.
Program DEI-ee External Best Practices.
Collaborate with external partners and adopt best practices from other successful community-oriented public safety policies.
Promote community health partnerships, services, and programs that support economically disadvantaged
communities. Facilitate better access to social and medical services, including those regarding mental health.
Program DEI-ff Mobile Health Care.
Support the use of public community facilities for “pop-up” health clinics, services, and other wellness activities. Focus the deployment of these for persons in the community needing assistance.
Increase food nutrition and security, especially among lower-income, senior, and vulnerable populations. Facilitate local access to food assistance resources such as food banks and the Supplemental Nutrition Assistance Program. Support equitable service delivery through increasing the confirming acceptance of food subsidy vouchers at all local grocery and food outlets throughout Tiburon.
Support community organizations and service providers that help disadvantaged families in Tiburon. Nonprofit and public organizations that provide essential services such as health care, housing, transportation, and other social services to lowerincome, unhoused, senior, and other vulnerable populations are valuable partners. The Town should support them as part of Tiburon’s “safety net.”
Spread awareness of social and mental health services by connecting residents and service providers, facilitating communication amongst the providers, and increasing dialogue between residents and local government.
Program DEI-hh
Collaborative Service Model.
Support and encourage collaboration between different stakeholders to address local health and social service needs. Support partnerships between community-based organizations, service providers, Marin County, other North Bay cities, and the
internal components of Tiburon’s local government.
Center equity in Tiburon’s transportation operations and planning. Work with local and regional transit agencies to ensure their services address the needs of households with limited travel options with a focus on increasing mobility for all community members. This should include the development of further transportation options to connect disadvantaged community members with available services and employment within Tiburon.
Work with the Marin Transit Authority, the Golden Gate Bridge, Highway and Transportation District, Golden Gate Ferry, and other relevant transit operators to collect and analyze data on Tiburon’s transit-dependent population to ensure that this population’s needs are met.
Highlight bicycle and pedestrian infrastructure in areas with a high concentration of both and a resident population with fewer transportation options. Support increasing access to bicycles, helmets, and other relevant cycling equipment for lower-income residents.
Reduce educational and economic barriers for all residents.
The Town collaborates with nonprofit, private, and other public partners to support affordable childcare, quality education, after-school programming, vocational training, career advancement, and programs to help residents overcome economic barriers and achieve employment. Residents are entitled to have the resources and opportunities to learn, grow, thrive, and achieve.
As schools are a foundational component of a community, they are a key consideration in an equity-focused General Plan. Aside from educating residents, high-quality educational facilities also affect housing prices and neighborhood desirability. Education develops youth life experiences, increases access to gainful employment, and can ultimately disrupt poverty. Schools also serve as hubs for their communities by providing places to gather as well as community service resources.
Due to their separate governance and administration, education has not always been integrated into local planning processes. While General Plans often address topics around transportation and housing, they are not mandated to address the role of schools or education. Tiburon, the Reed Union School District, and other educational partners can work together through early childhood education, childcare programs, after-school programming, and collaborations between schools, local colleges, and regional universities. The business community can also serve as a partner for future employment. While education is the best starting point for supporting economic
opportunities, other policies and programs can provide substantial economic opportunities. Collaborations with local businesses and entrepreneurs can create new employment and encourage local community investment.
Expand capacity for affordable early childhood development centers and childcare in Tiburon, including public programs.
Develop local employer partnerships to increase the affordability and accessibility of childcare for lowincome workers. Educate employers on the benefits of childcare to convince them to make these services available.
Create safe and affordable after-school opportunities for youth. Advertise these programs to ensure all community
members know of their existence.
Collaborate with the community to identify needs, develop services to address these needs, and increase access to these services.
Collaborate with school districts to develop “host” programs where Tiburon families can support English learners and new students from other countries.
Ensure that the Town of Tiburon uses culturally sensitive communication when providing information to families about extracurriculars.
Help local schools promote among students from different communities and socioeconomic groups and develop programs to help students with special
educational needs or circumstances that put up barriers to learning.
Develop partnerships between schools, community groups, and businesses so Tiburon residents can enter employment in the local and regional economies while also being able to engage with accessible career resources. Invest in services and programs that develop career ladders for lower-income workers to advance to higher-salary jobs and increased economic stability. Encourage local businesses to mentor students and young professionals.
Recognize the local and regional economic contributions of Tiburon’s lower- and moderate-income workers, especially the many essential workers in the local economy. Preserve existing employees and continue to provide employment opportunities for people
with a variety of educational and work experiences.
Use data to quantify the low- and moderate-income workforce’s contributions to both Tiburon and the North Bay’s economies. Leverage this data to create targeted economic development programs and strengthen the “safety net” for essential workers.
Develop a supportive small business environment in Tiburon. Address small business concerns relating to parking, infrastructure, litter, loitering, crime, and similar issues.
Explore policies and partnerships with organizations such as chambers of commerce to support small businesses and entrepreneurs in Tiburon, including
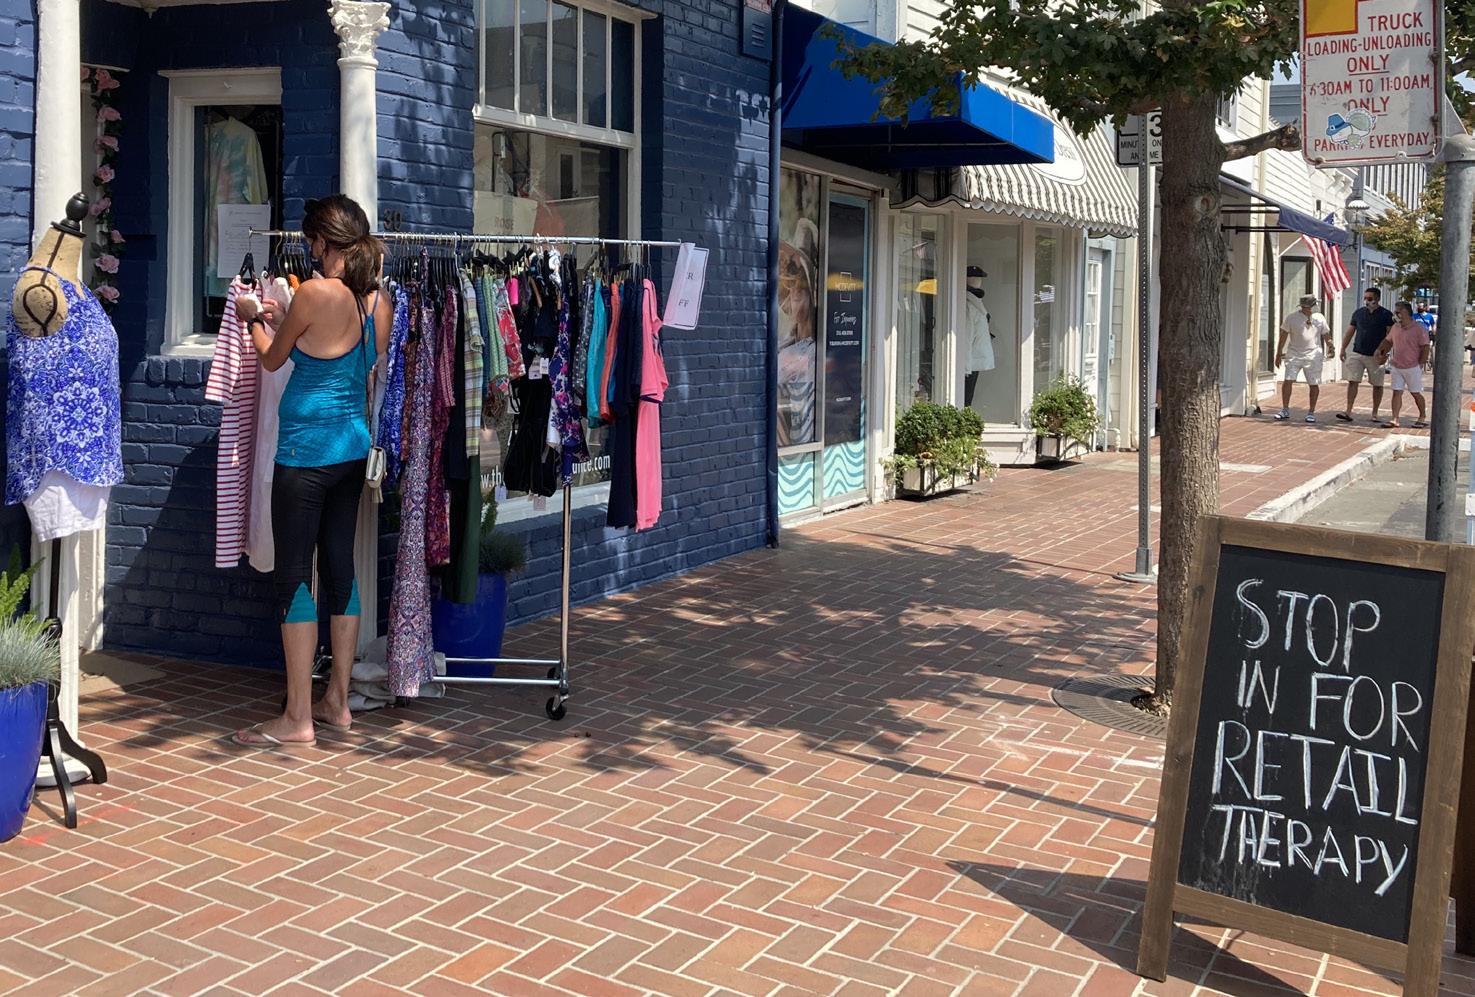
those that are minority-owned businesses.
Create incentives for the hiring of local workers, especially lower-income trades employees. In 2019, according to the US Census, 90.6% of Tiburon’s workforce lived outside of the city. Of Tiburon’s workforce, 9.4% lived in
Town. Conversely, Bay Area Equity Atlas notes that in the same year, compared to the 4% of Californians who commute 90 or more minutes to work one-way, only 2.8% of Tiburon residents have a commute of that length.
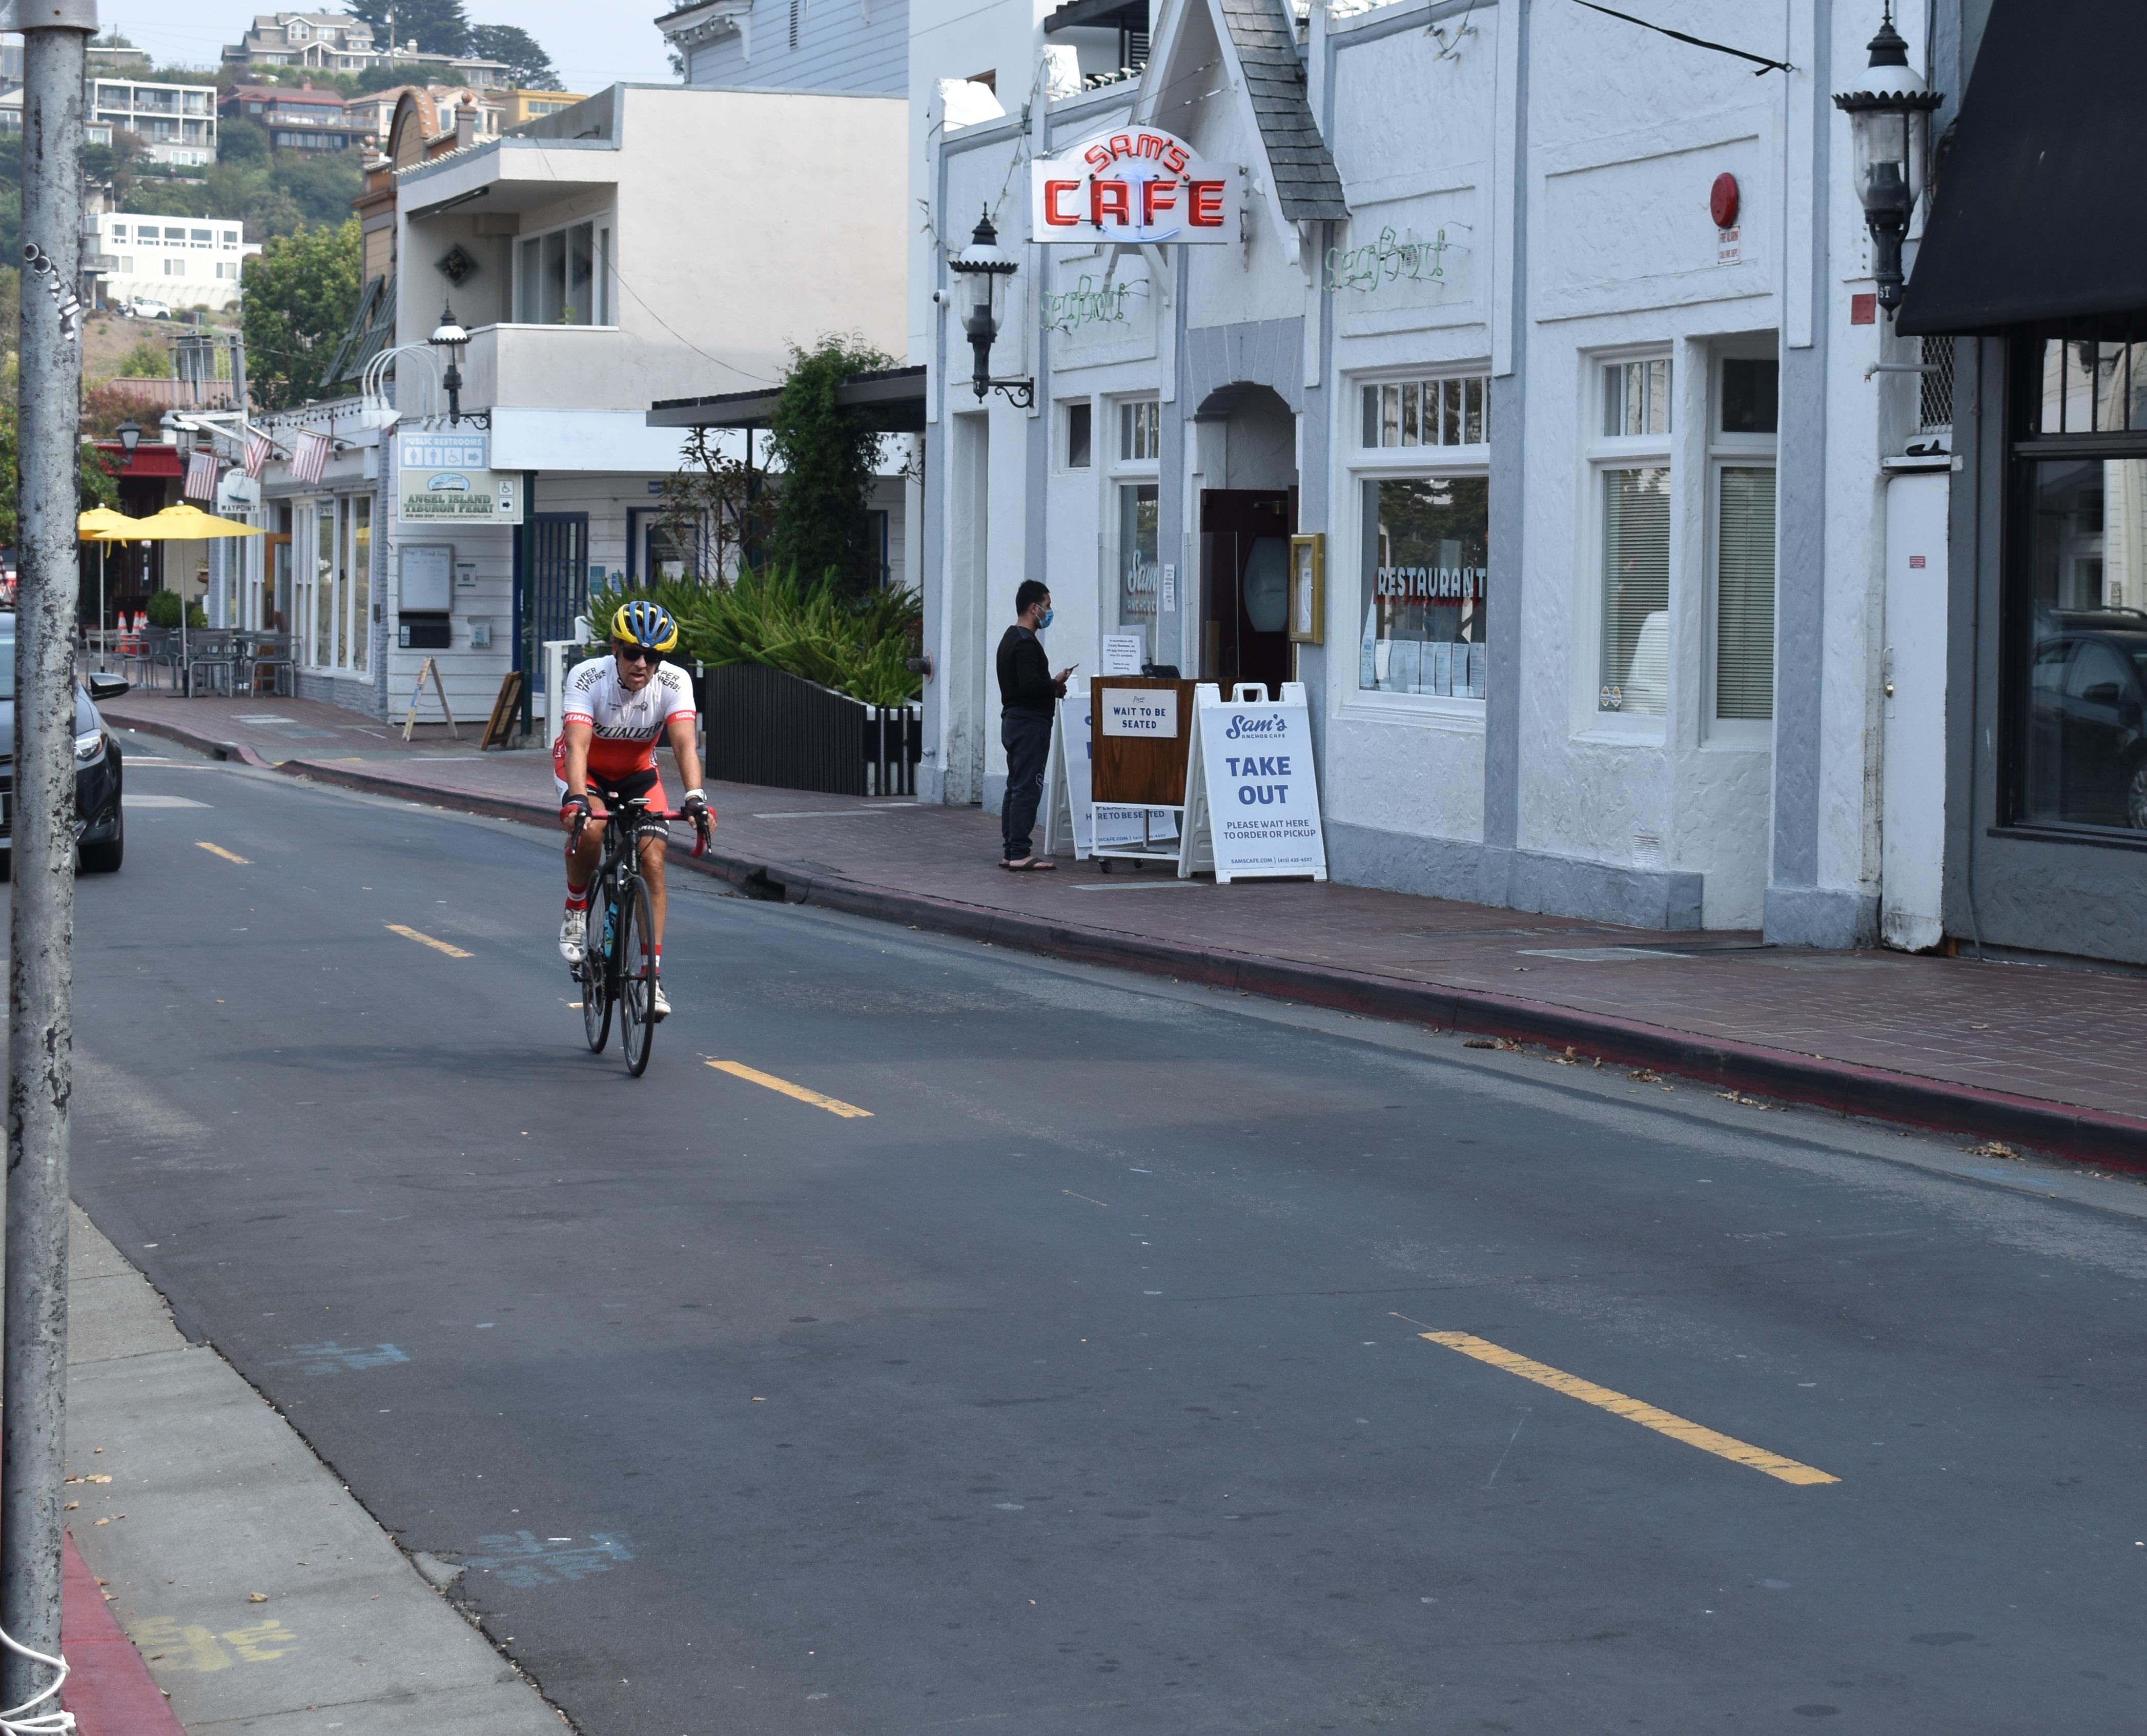
Mobility, or the ability to readily move from one place to another, is made possible in Tiburon through a transportation system that encompasses roadways, transit routes, ferry service, pedestrian paths and sidewalks, and bicycle paths, lanes, and routes. The goal of a well-planned and integrated transportation network is to provide safe and convenient travel for all users—including children, seniors, and persons with disabilities—whether travelling by vehicle, bicycle or foot. A balanced, multi-modal transportation system works to limit congestion, and reduce greenhouse gas emissions, and improve public health.
The Tiburon Peninsula possesses unique constraints and opportunities for circulation. The constraints are largely a function of the relative isolation that results from being a lengthy peninsula and from topography that is dominated by relatively steep hillsides. The unique
opportunities are provided by the navigable waters that surround the peninsula, the clustering of pedestrianoriented development in downtown, and the heavily used Old Rail Trail , a multi-use path that runs most of the length of the peninsula.
The Mobility chapter includes the following sections:
6.2 Vision and Guiding Principles. Sets forth a guiding vision and principles for the transportation system.
6.3 Existing Mobility Conditions. Summarizes existing mobility conditions in Tiburon, including all modes of transportation that residents, visitors, and employees on the peninsula use regularly, and the sources of traffic congestion.
6.4 Circulation Improvements. Presents a list of proposed supply and demand strategies intended to reduce vehicle miles traveled (VMT) and traffic congestion and enhance mobility.
6.5 Goals, Policies, and Programs. Identifies goals, policies, and programs to improve mobility and the transportation system.
Town goals and policies are guided by its overall vision for the transportation system. The following statement provides this vision for this element: The Town of Tiburon envisions a transportation system that supports the Town’s goals for safe and healthy transportation, sustainability, a sense of small-town community character, high quality of life for residents, and economic vibrancy of the downtown area, which will continue to grow as a draw for visitors and residents. The Town furthermore envisions that that its streets and pathways will form a comprehensive and integrated transportation network promoting safe, equitable, and convenient travel for all users while preserving flexibility, recognizing community context, and using the latest and best design guidelines and standards. This entails the integration of Complete Streets
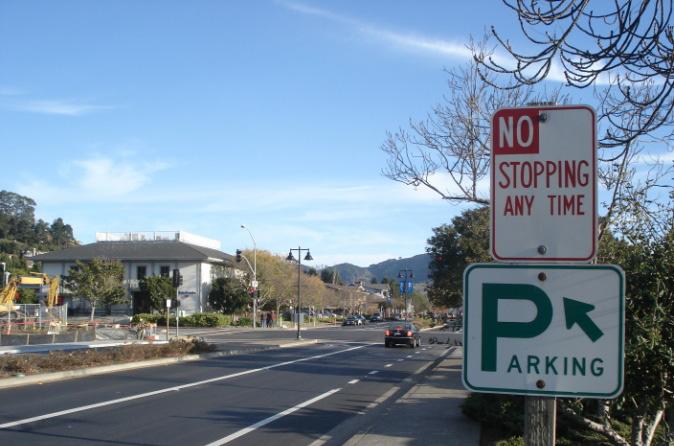
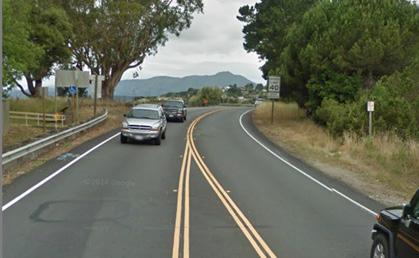
into street designs that are comfortable and convenient for the breadth of travel choices while creating more vital places in fitting with desired community character. Complete Streets are routinely planned, designed, operated, and maintained with the consideration of the needs and safety of all travelers along and across the entire public right of way. Streets will meet the needs of all ages and abilities who are walking, bicycling, using transit, traveling with mobility aids, driving vehicles, and driving commercial freight.
Complete Streets are routinely planned, designed, operated, and maintained with the consideration of the needs and safety of all travelers along and across the entire public right of way. This includes people of all ages and abilities who are walking; driving vehicles such as cars, trucks, motorcycles, or buses; bicycling; using transit, or traveling with mobility aids; and freight shippers. Every street and its environs are different, so physical manifestation of this principle will change based on the local context. However, providing for all users is a core tenet of Complete Streets.
The Complete Streets movement fundamentally redefines what a street is intended to do, what goals a transportation agency is going to meet, and how a community will spend its transportation money. The Complete Streets approach breaks down the traditional separation between highways, transit, biking, and walking, and instead focuses on the desired outcomes of a transportation system that supports safe use of the roadway for everyone.
Complete Streets policies formalize a community’s intent to plan, design, operate, and maintain streets so they are safe and accessible for all users of all ages and abilities. Policies direct decision-makers to consistently fund, plan, design, and construct community streets to accommodate all anticipated users, including pedestrians, bicyclists, public transit users, motorists, and freight vehicles. There are many types of Complete Streets—it does not mean every street has sidewalks, bike lanes, and transit. On streets with low traffic volumes, such as those in Tiburon’s hilly residential neighborhoods, a Complete Street may be a shared space with traffic calming that ensures walking and bicycling is
safe, even without marked bike lanes or sidewalks. On busier thoroughfares such as Tiburon Boulevard, by contrast, separated walking and biking facilities are more appropriate. There is no onesize-fits-all solution, and the design of every street must take into account local land use, traffic volumes, and the role of the street in the overall multimodal network.
To support the vision statement, several principles guide the Mobility Element:
Automobile traffic volumes along major corridors—especially Tiburon Boulevard—should be reduced to improve traffic flow and enhance quality of life and safety. In particular, the Town shall address growing school and contractor traffic on weekdays, and visitor traffic on weekends.
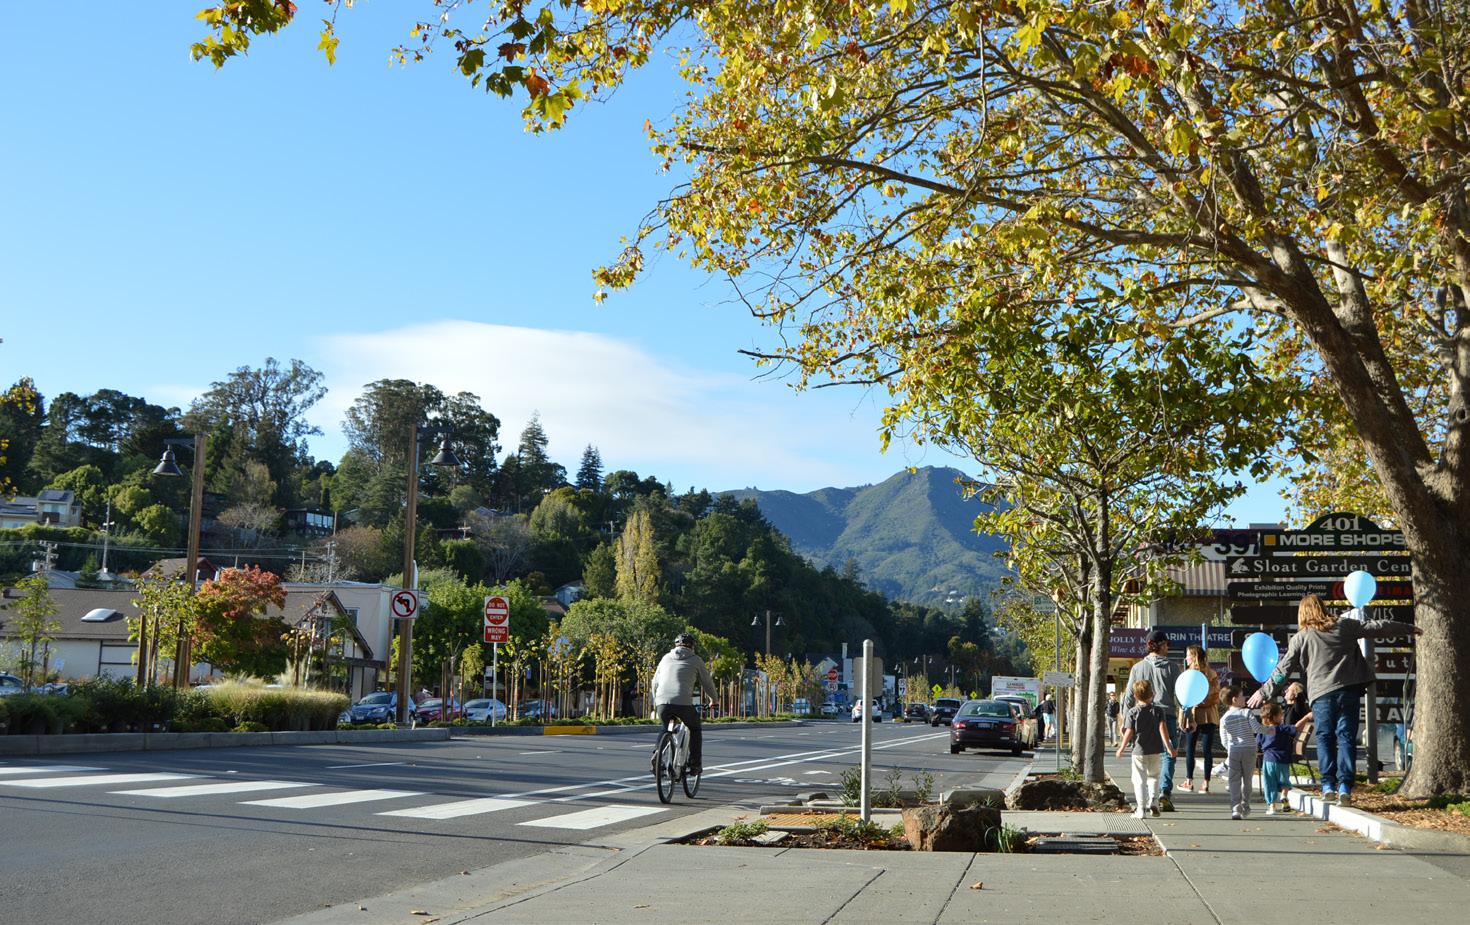
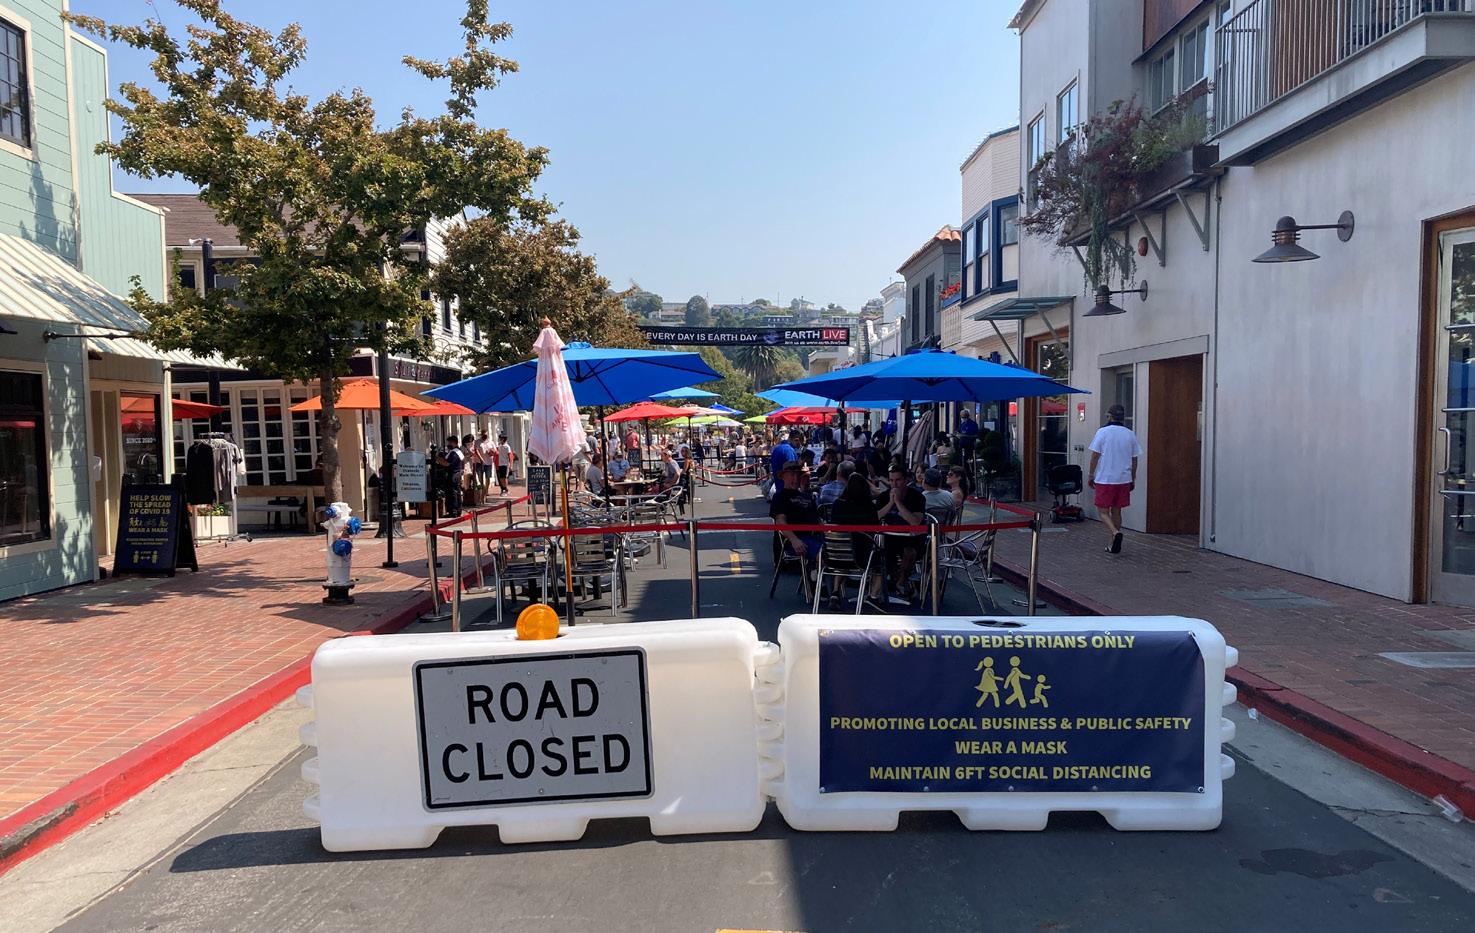
The Town’s transportation system should support opportunities for active transportation choices, including walking and biking, which contribute to the community’s health. Emissions from automobiles should be reduced as much as possible to the lessen the negative health consequences of particulate matter contained in vehicle exhaust.
The Town’s transportation system should support economic development in the Town as well as access to other destinations, which is essential to maintaining the Town’s appeal as a place to live. A variety of safe and reliable transportation connections to destinations across the San Francisco Bay Area are vital the Town’s economic well-being.
The Town values the preservation of local natural resources, such as open space and water quality. The Town also recognizes that local
governments can play a strong role in reducing greenhouse gas emissions and mitigating the potential impacts of global climate change. Transportation policies in the Town should support both of these objectives.
The mobility network and land use pattern should support efforts to reduce VMT, relevant to greenhouse gas emissions.
The Town’s transportation network should be safe for all users, whether walking, biking, driving, or taking transit. People of all ages should feel comfortable biking and walking as a means of transportation as well as recreation.
The transportation network should balance the needs of all users, as well as people of different incomes, who may have limited access to automobiles. Senior citizens and people with disability who are no
longer able to drive should also be served by high-quality transportation options such as paratransit.
Residents and visitors in Tiburon should have the choice to travel by different modes as they see fit, safely, and with convenience and flexibility. Driving is likely to remain the most common mode of travel for the foreseeable future in Tiburon, but walking, biking, and riding transit (as well as carpooling) will become attractive choices for an increasing number of people.
Roadway and circulation network performance metrics—encompassing all modes of travel—should be established and measured. The transportation network should be managed to achieve set targets, such as reducing the number of collisions, improving parking availability, or reducing automobile congestion.
Tiburon has views of natural and urban settings that are among the finest in the world. The design of transportation facilities should take into account and enhance the Town’s setting of residential tranquility intertwined with natural beauty, as well as its vibrant and appealing downtown.
The Tiburon Peninsula possesses unique constraints and opportunities for circulation. The constraints are largely a function of the relative isolation that results from being a lengthy peninsula and from topography that is dominated by relatively steep hillsides. The unique opportunities are provided by the navigable waters that surround the peninsula, the pedestrian-oriented development in downtown, and the heavily used Old Rail Trail, a multi-use path that runs most of the length of the Peninsula.
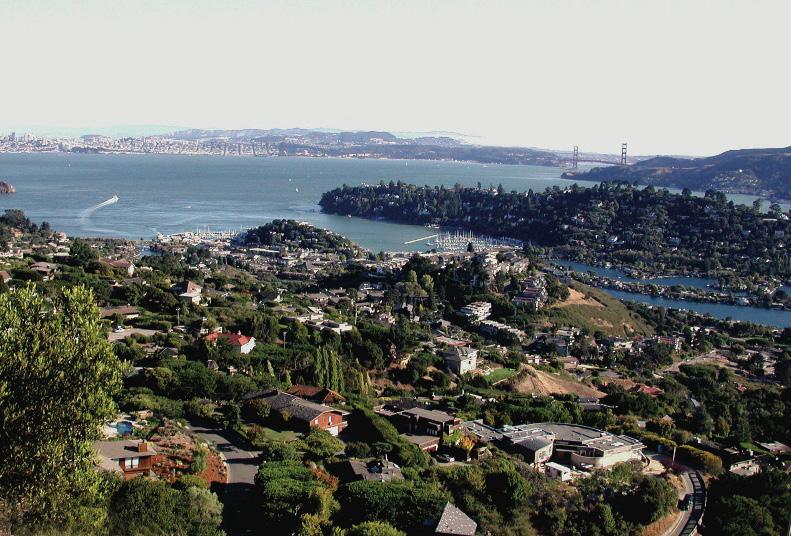
Tiburon’s history of rail and ferry transport shaped the Town’s development patterns, with a walkable downtown located close to the Ferry Terminal and former train station. Located eight miles north of San Francisco, Tiburon is placed in the heart of the San Francisco Bay Area, accessible by ferry from downtown San
Francisco. Figure M-1 shows the major regional transportation facilities.
Tiburon’s topography and pensinsula location constrain transportation. At the same time, the bay presents unique opportunities.
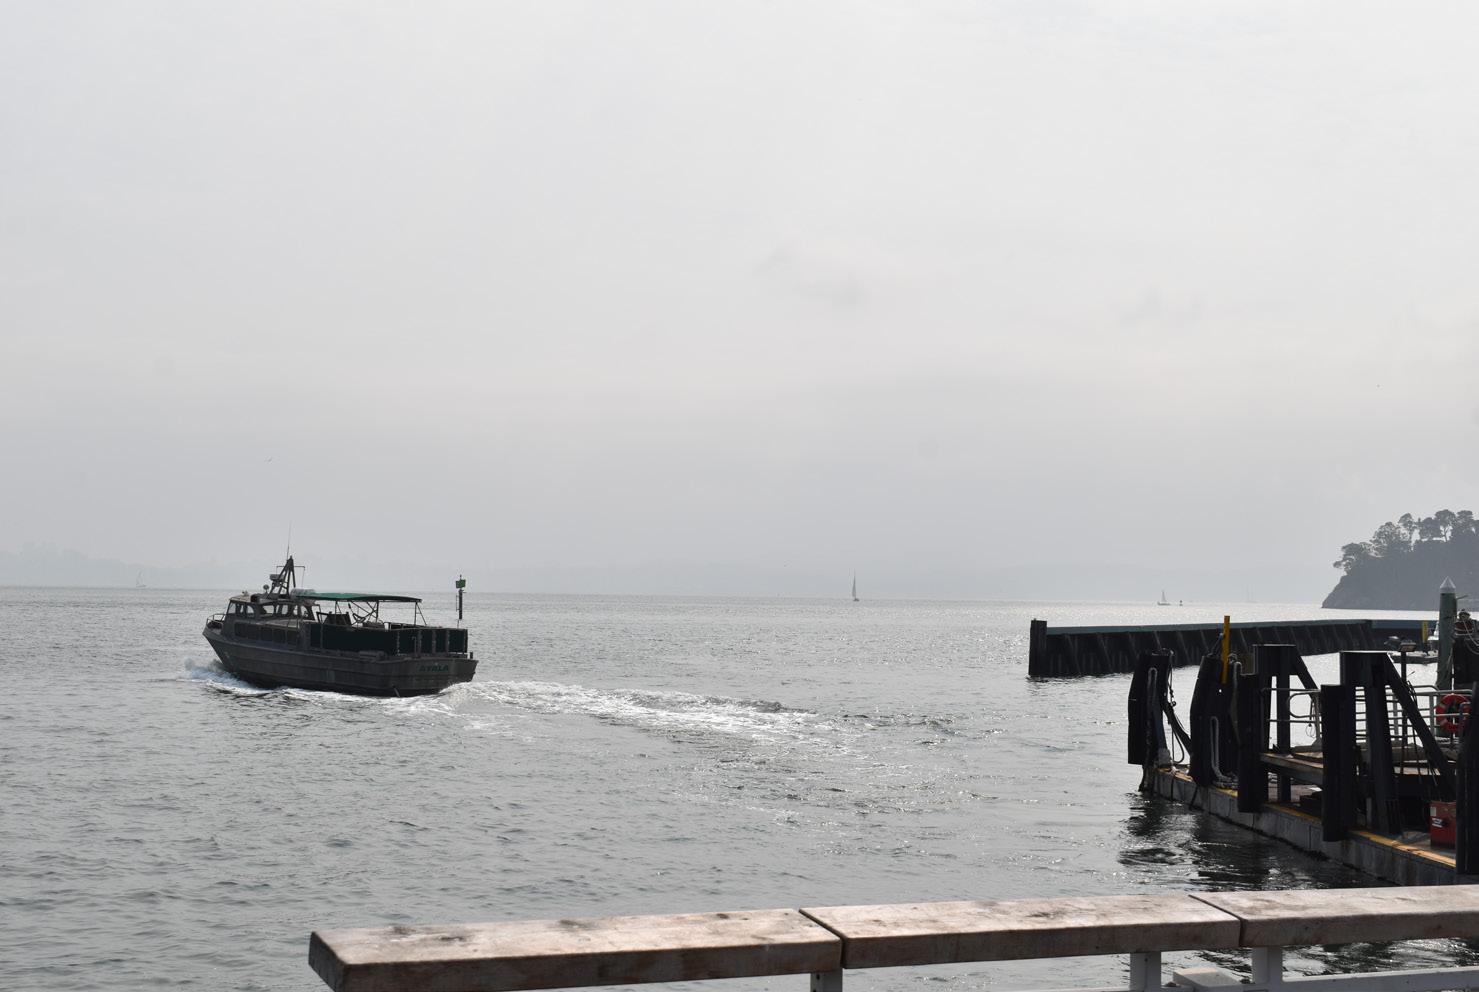
Sources: Esri, Airbus DS, USGS, NGA, NASA, CGIAR, N Robinson, NCEAS, NLS, OS, NMA, Geodatastyrelsen, Rijkswaterstaat, GSA, Geoland, FEMA, Intermap and the GIS user community

The street network in the Tiburon planning area consists of approximately 60 miles of streets. The Town’s street classifications are as follows, further described in Table M-1 and shown in Figure M-2:
A major street providing multi-modal travel and access to key land uses, as well as carrying the traffic of local and collector streets to and from freeways and other major streets, with controlled intersections and generally providing direct access to properties. Safe pedestrian and bicycle facilities, where feasible and appropriate, should be provided along arterials.
A street for travel between arterial and local streets, generally providing direct access to properties. Safe
pedestrian and bicycle facilities should be provided along the collectors where feasible and appropriate.
A street providing direct access to properties and designed to discourage through traffic. Dedicated bicycle and pedestrian facilities may not be necessary if traffic speeds are slow enough to comfortably share the roadway space.
Major Arterial Connects major local activity centers, provides direct multi-modal access to adjacent properties, and connects with U.S. 101 freeway
Blvd., from U.S. 101 to Trestle Glen
Tiburon Blvd., from Trestle Glen to Main St.; Trestle Glen Blvd.
– 4
Blackfield Dr., Reed Ranch Rd., Lyford Dr., Stewart Dr. 2
Local Serves adjacent residential and commercial properties. 2
Sources: Esri, Airbus DS, USGS, NGA, NASA, CGIAR, N Robinson, NCEAS, NLS, OS, NMA, Geodatastyrelsen, Rijkswaterstaat, GSA, Geoland, FEMA, Intermap and the GIS user community

High-use pedestrian areas include the downtown area and crossings of Tiburon Boulevard to assess destinations such as schools, the post office, and library. Pedestrians in Tiburon use a variety of facilities, as shown in Figure M-3, including streets (with and without sidewalks) and multiuse paths, as well as trails designed primarily for recreational purposes. Sidewalks are provided on portions of some arterial and collector streets, but most local streets in Tiburon do not have sidewalks. Some of these walkways do not meet ADA requirements for width, obstructions, tripping hazards, or curb ramps. The Town of Tiburon joined the Reed Union School District (RUSD) and St. Hilary School in forming the Tiburon Peninsula Traffic Committee, which aimed to increase carpooling, walking, and biking to schools and to improve traffic flow around school neighborhoods. From that process, the Town approved a traffic safety
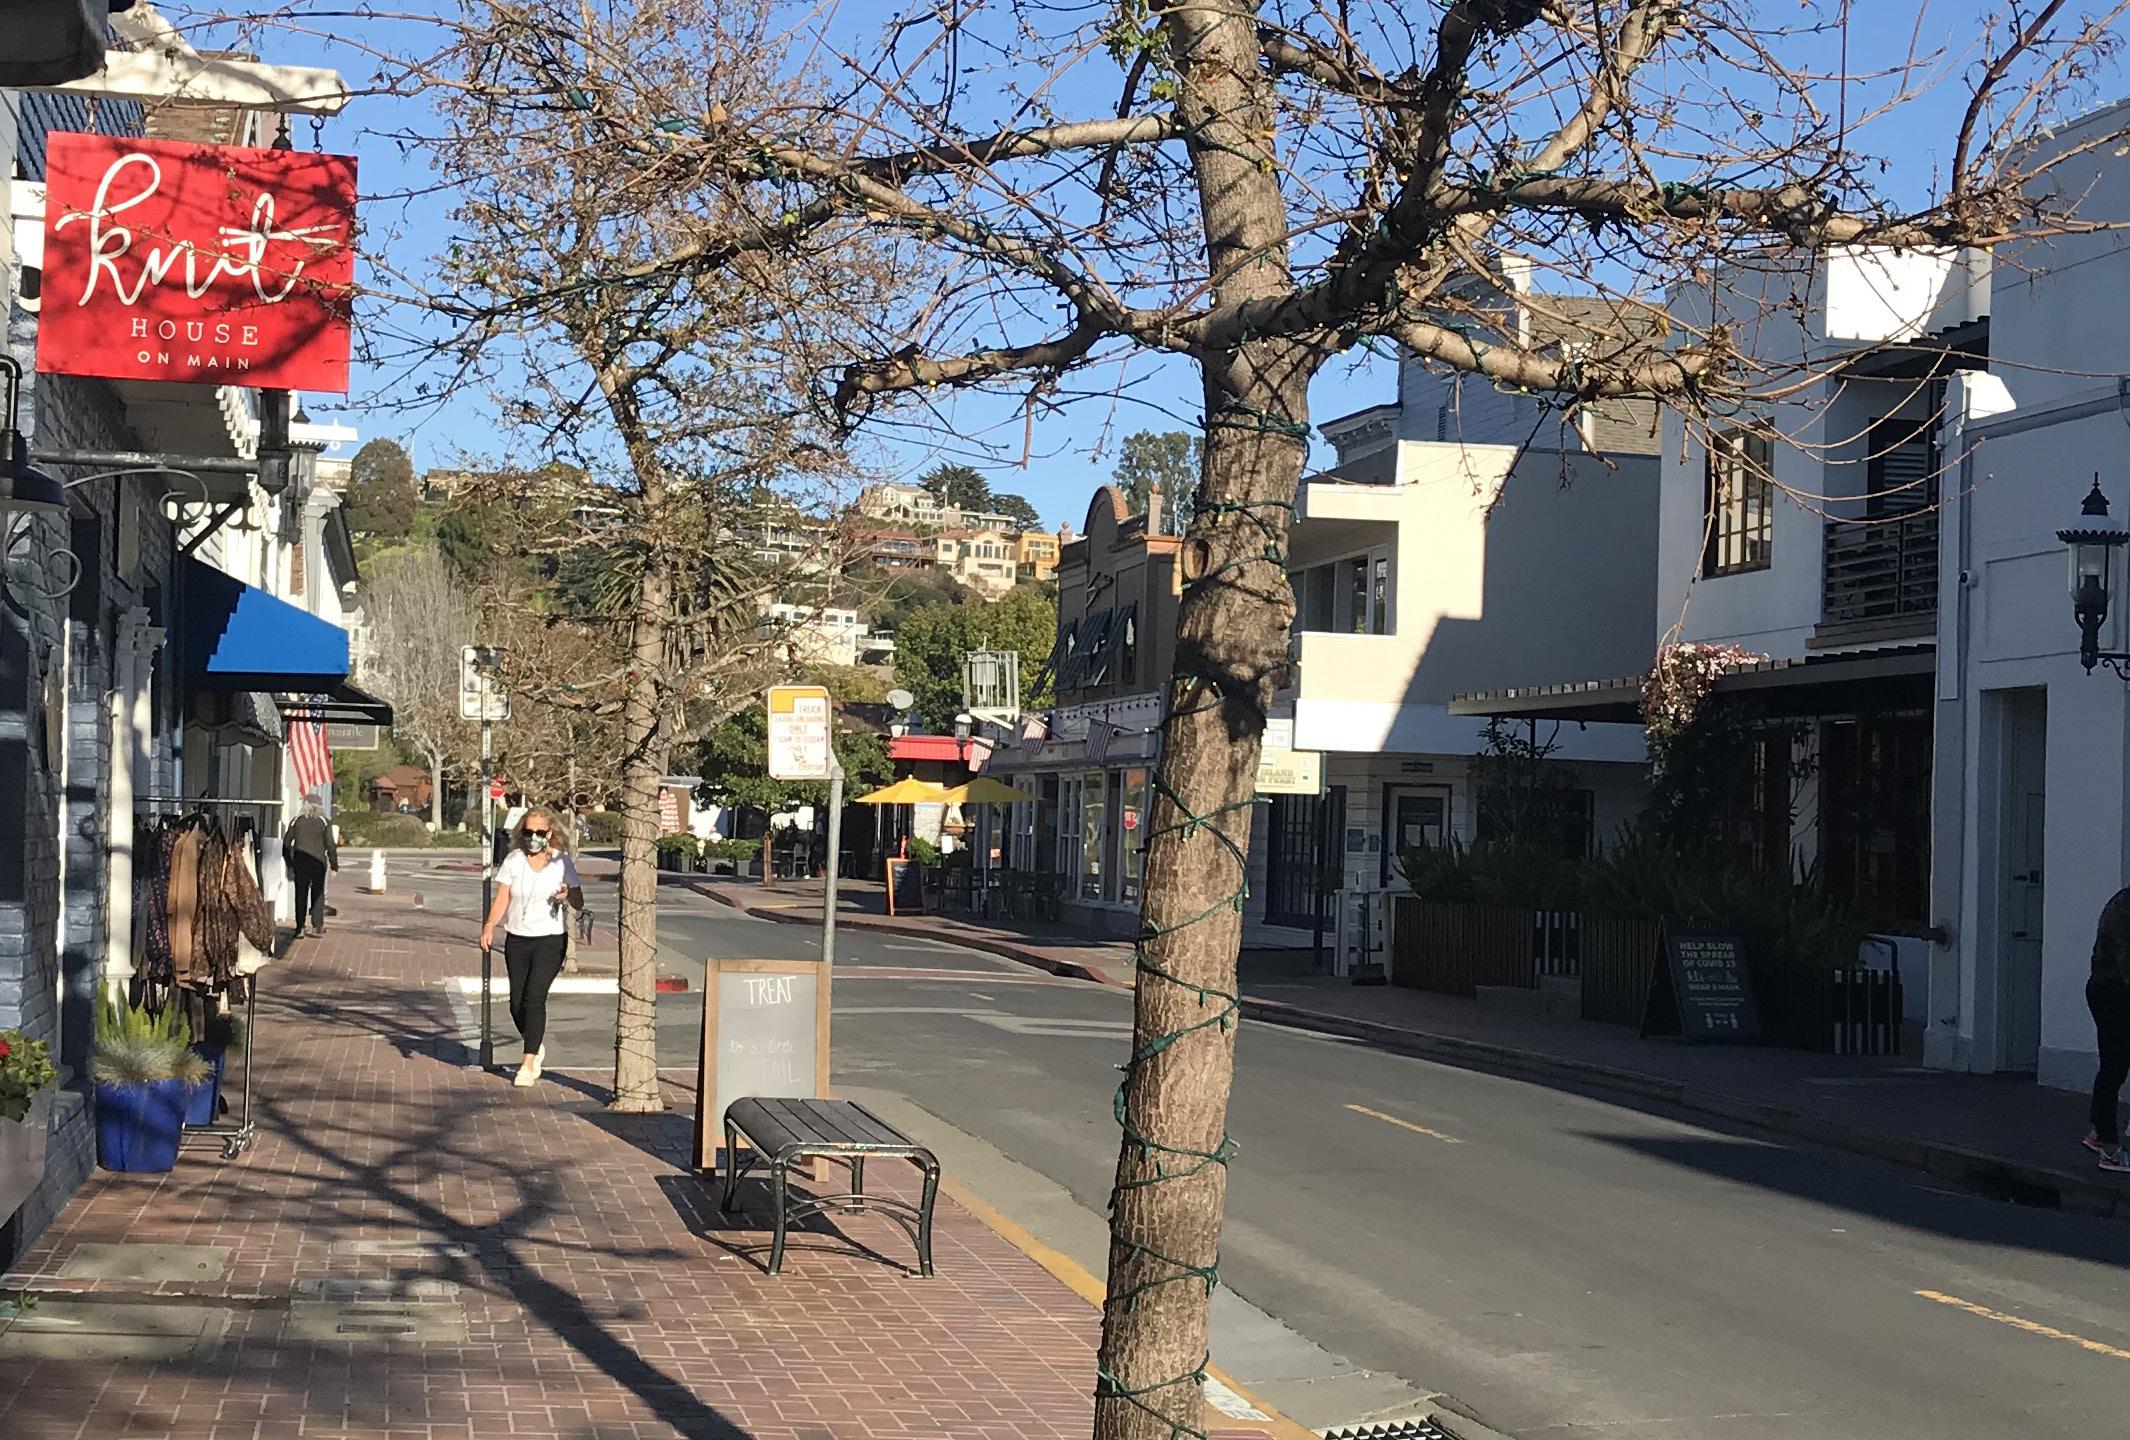
improvement plan for areas around the schools. The improvements, including the installation of sidewalks funded by Safe Routes to Schools grants, are ongoing.
Tiburon’s pedestrian network spans from highuse areas like downtown to open space trails.
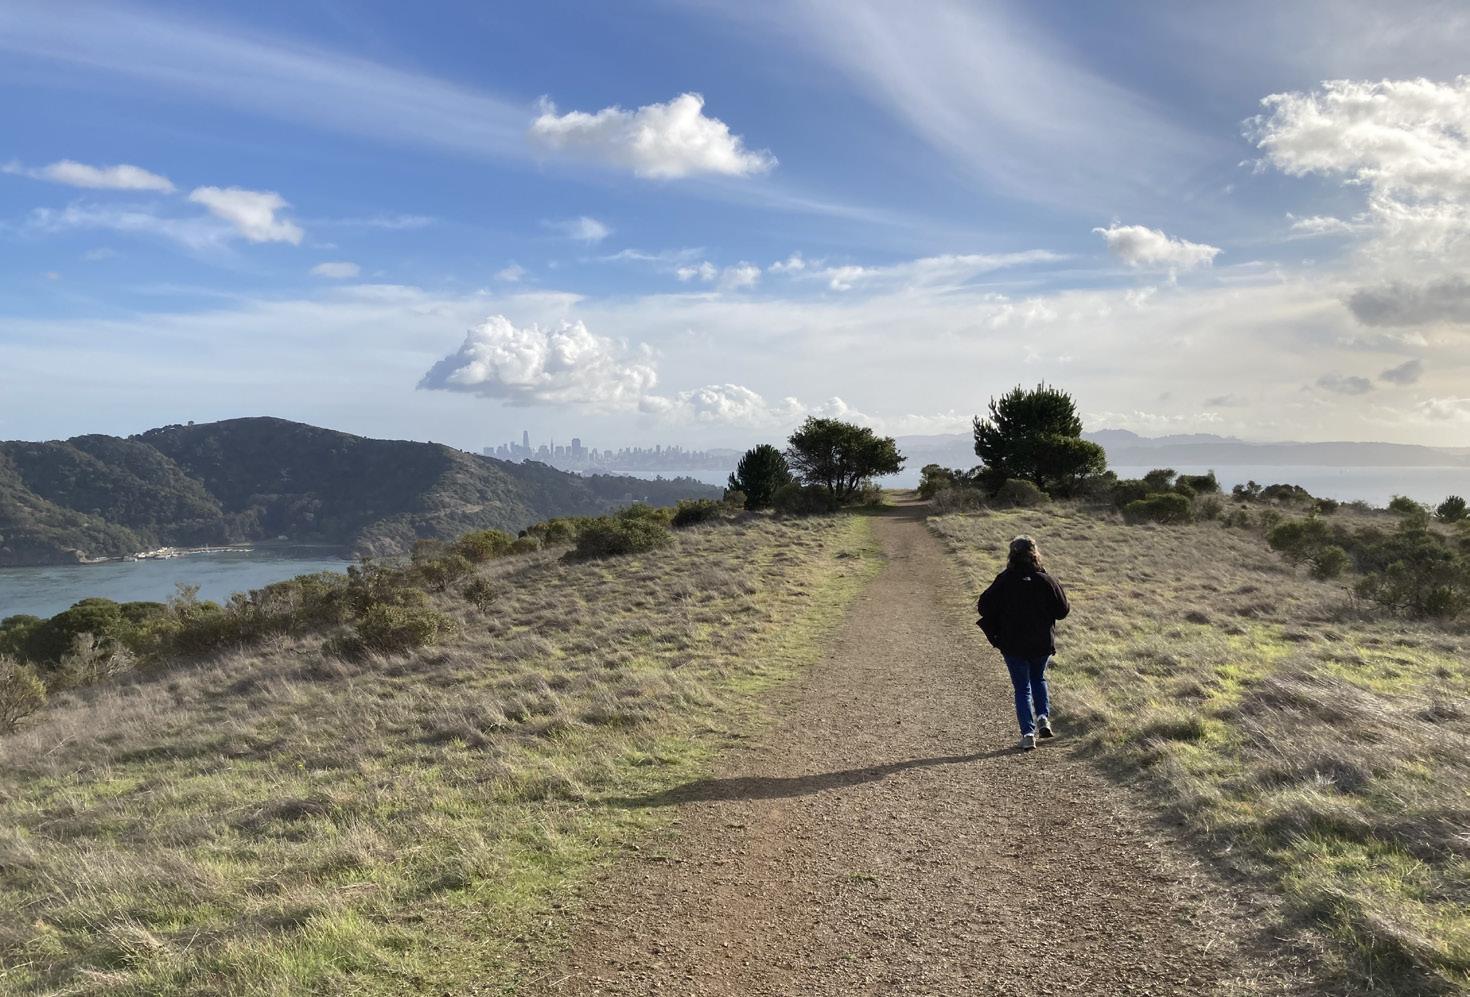
Sources: Esri, Airbus DS, USGS, NGA, NASA, CGIAR, N Robinson, NCEAS, NLS, OS, NMA, Geodatastyrelsen, Rijkswaterstaat, GSA, Geoland, FEMA, Intermap and the GIS user community
One of the underlying goals of “complete streets” requirements is that all modes of travel, including bicycles, should be adequately accommodated on most streets, not just streets that are designated as bikeways. Therefore, the provision of travel accommodations may occur throughout the Town’s transportation network.
Designated bikeways are routes where an additional level of bicycle accommodation is to be provided. There are four classifications of designated bikeway facilities in California, as defined by the California Department of Transportation (Caltrans).
Biking is not a new part of the Tiburon lifestyle. Source: Belvedere-Tiburon Landmarks Society
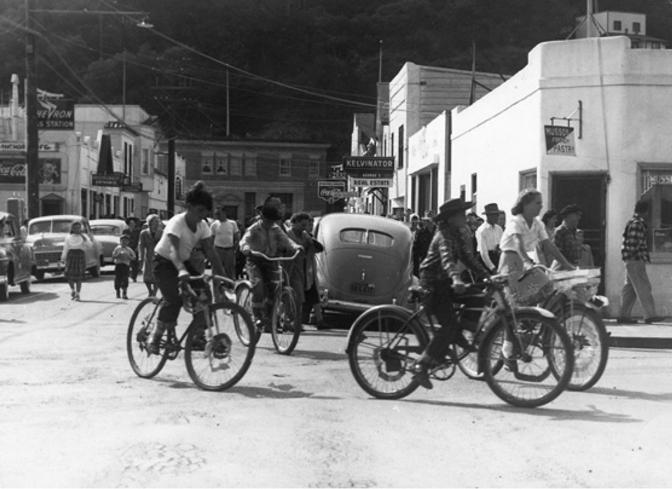
Sources: Esri, Airbus DS, USGS, NGA, NASA, CGIAR, N Robinson, NCEAS, NLS, OS, NMA, Geodatastyrelsen, Rijkswaterstaat, GSA, Geoland, FEMA, Intermap and the GIS user community
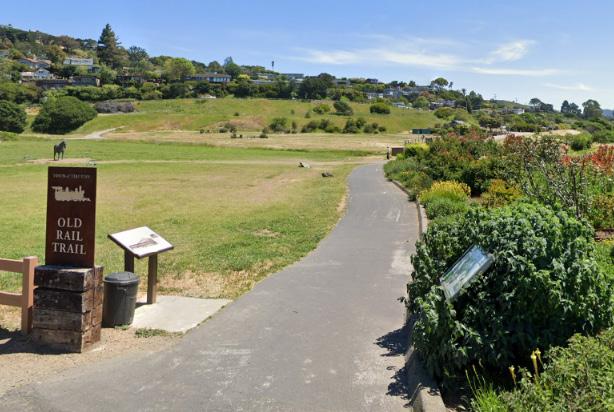
A path physically separated from motor vehicle traffic by an open space or barrier, and either: within a highway right-of-way or within an independent right-of-way used by bicyclists, pedestrians, joggers, skaters, and other non-motorized travelers. Because the availability of uninterrupted rightsof-way is limited, this type of facility may be difficult to locate and more expensive to build relative to other types of bicycle and pedestrian facilities, but less expensive compared to building new roadways. The 2.6mile Old Rail Trail connects Richardson Bay from Blackie’s Pasture, Downtown Tiburon, and Shoreline Park. The Old Rail Trail is in close proximity to schools, shopping areas, parks, and public facilities.
A portion of a roadway that has been set aside by striping and pavement markings for the preferential or exclusive use of bicyclists. Bicycle lanes are intended to promote an orderly flow of bicycle and vehicle traffic. This
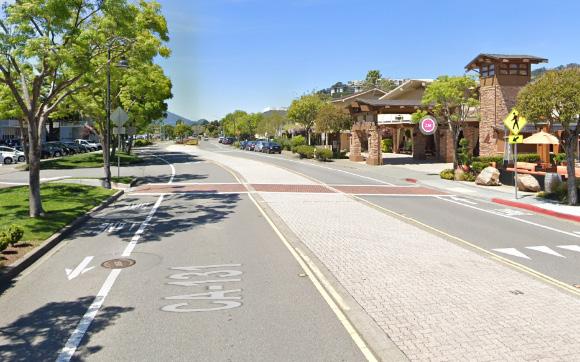
type of facility is established by using the appropriate striping, legends, and signs. Buffered bicycle lanes are further enhanced by providing a designated buffer space, typically with pavement markings, between the bicycle lane and adjacent on-street parking or motor vehicle lane. Buffered bicycle lanes provide greater separation between bicyclists and motorists and/or avoid the door zone adjacent to parked cars.
Class III bicycle routes are facilities where bicyclists share travel lanes with motor vehicle traffic. Bike routes must be of benefit to the bicyclist and offer a higher degree of service than adjacent streets. They provide for specific bicycle demand and may be used to connect discontinuous segments of bicycle lane streets. They are often located on local residential streets. Presently, the Town has 2.8 miles of class III bikeways on Paradise Drive.
A Class IV Bikeway is for the exclusive use of bicycles and includes a separation between the bikeway and adjacent vehicle traffic. The physical separation may include flexible posts, grade separation, inflexible physical barriers, or on-street parking. Separated bikeways generally operate in the same direction as vehicle traffic on the same side of the roadway. However, two-way separation bikeways can also be used, usually in lower speed environments. Presently, there are no class IV bikeways in
Tiburon. However, Tiburon Boulevard between US-101 and Blackfield / Greenwood Cove Drive could be the potential location for class IV bikeways.
Figure M-4 shows the existing and planned bikeway network consistent with the Town’s adopted Bicycle and Pedestrian Plan that was most recently updated in 2016. The existing bicycle facilities follow “Paradise Loop” which runs along Tiburon Boulevard and Paradise Drive and forms the primary bicycle transportation and recreation spine of the Tiburon Peninsula. Table M-2 shows the existing and proposed length of bikeways by class.
Public transportation in Tiburon is provided by Marin Transit, Golden Gate Transit/Ferry and Angel Island/ Tiburon Ferry. Key transit routes are shown in Figure M-5.
Marin Transit is the agency responsible for local transit service within Marin County, including Tiburon. The agency operates local transit services and contracts with other operators for three types of fixed route services within the county: large bus fixed route, shuttle, and rural service. Marin Transit also operates paratransit and dial-a-ride service within Marin County.
Golden Gate Transit operates transit services between Marin County and Sonoma, San Francisco, and Contra Costa Counties. It is one of three operating divisions of the Golden Gate Bridge, Highway, and Transportation District. The agency operates two
inter-county bus services: Transbay Basic Service, and Transbay Commute Service. Prior to the pandemic, one commute bus route was operated between Tiburon and San Francisco with two AM trips and one PM trip.
The Golden Gate Bridge, Highway, and Transportation District operates ferry service between Marin County and San Francisco via conventional and high-speed ferries. Service is provided between the Tiburon Ferry Terminal (located in downtown Tiburon) and the San Francisco Ferry Building Gate B, Monday-Friday.
The Angel Island/Tiburon Ferry operates recreational ferry service between Angel Island and downtown Tiburon.
School bus service in Tiburon is provided by the Yellow Bus program that provides morning and afternoon service to Bel Aire School, Del Mar School, and Reed School.
Marin Access Paratransit offers prescheduled bus transportation for persons with disabilities in Marin County. Service is offered within ¾ mile of fixed route Marin Transit routes and covers portions of Tiburon. Service is provided to paratransit eligible individuals on an on-demand basis, during regular Marin Transit operating hours.

Tiburon has double the rate of people that use public transportation to and from work (18.1 percent) compared to the Marin County average, according to U.S. Census Bureau estimates from 2015-19. Just 54.6 percent of workers drove alone to work which is fairly low as compared to countywide (64.1 percent) and statewide (73.5 percent) averages.
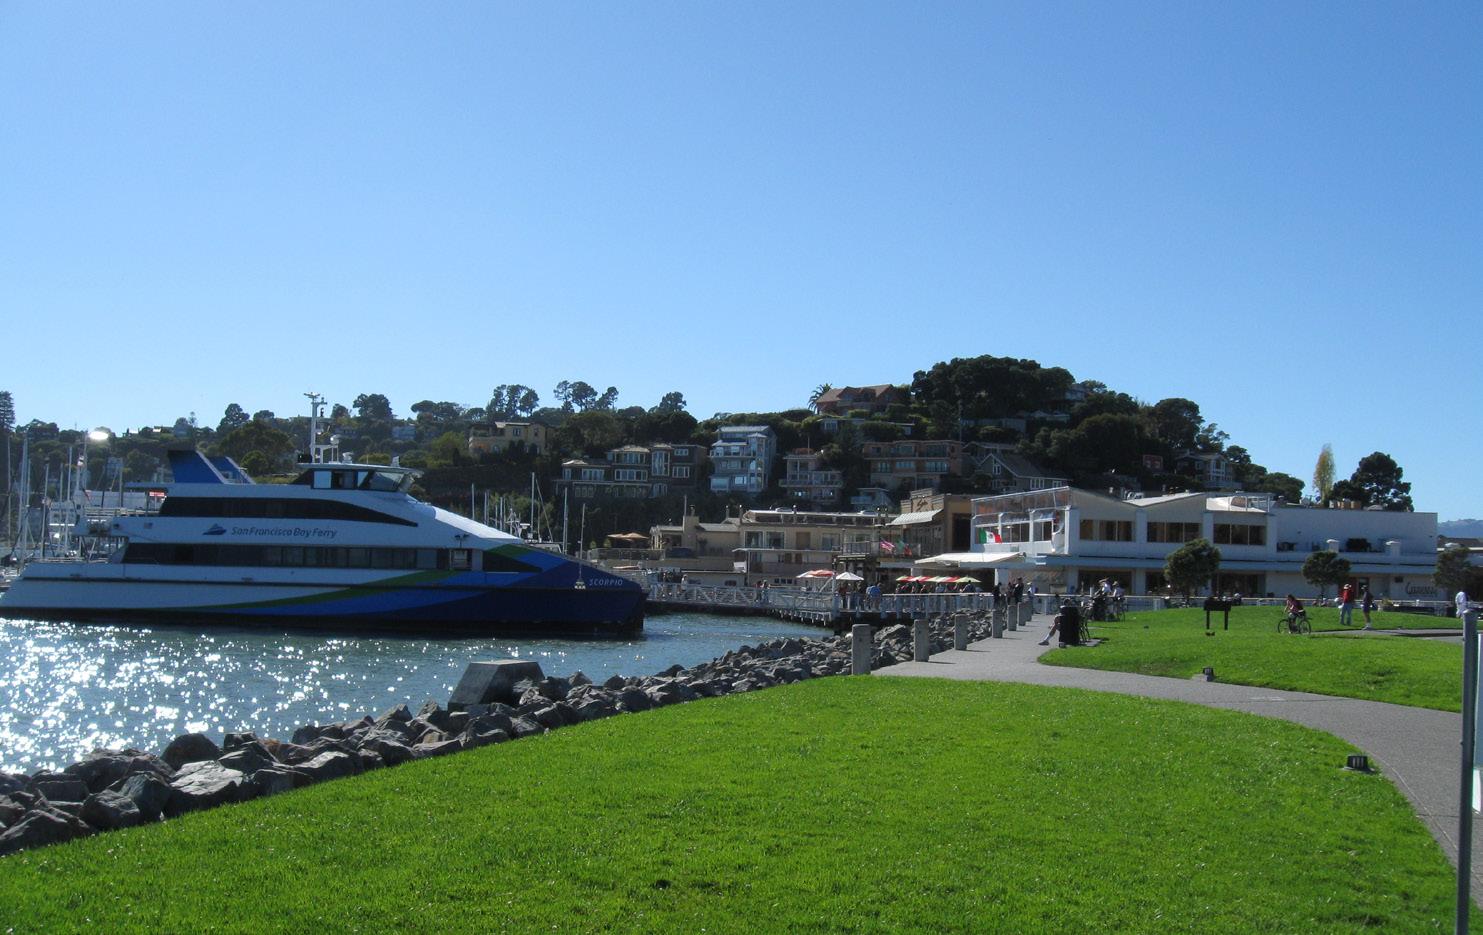
Tiburon also has a higher rate of residents working at home (14.9 percent during the 2015-19 period that predates the COVID-19 pandemic), more than double the Bay Area and statewide averages prior to 2020. The journey to work commute characteristics data is summarized in Table M-3.
Source: U.S. Census Bureau, 2015-2019 American Community Survey 5-Year Estimates
Tiburon Boulevard is the main arterial street serving Tiburon and experiences greater traffic congestion than any other street in the town. The sources of traffic on Tiburon Boulevard are varied. During the school year, traffic is heavily peaked in the morning and mid-afternoon as school pickup and drop-off occurs. Motorists traveling westbound in the morning and eastbound in the afternoon (to/ from U.S. Highway 101) are a major contributor to traffic. Daily (24-hour) traffic volumes on key street segments are illustrated in Figure M-6. Reported collision locations over the 5-year period from January 1, 2015 to December 31, 2019 are identified in Figure M-7. As shown, the highest number of reported collisions occurred at the intersection of Tiburon Boulevard and Blackfield Drive (shown in the aerial photo on the right).
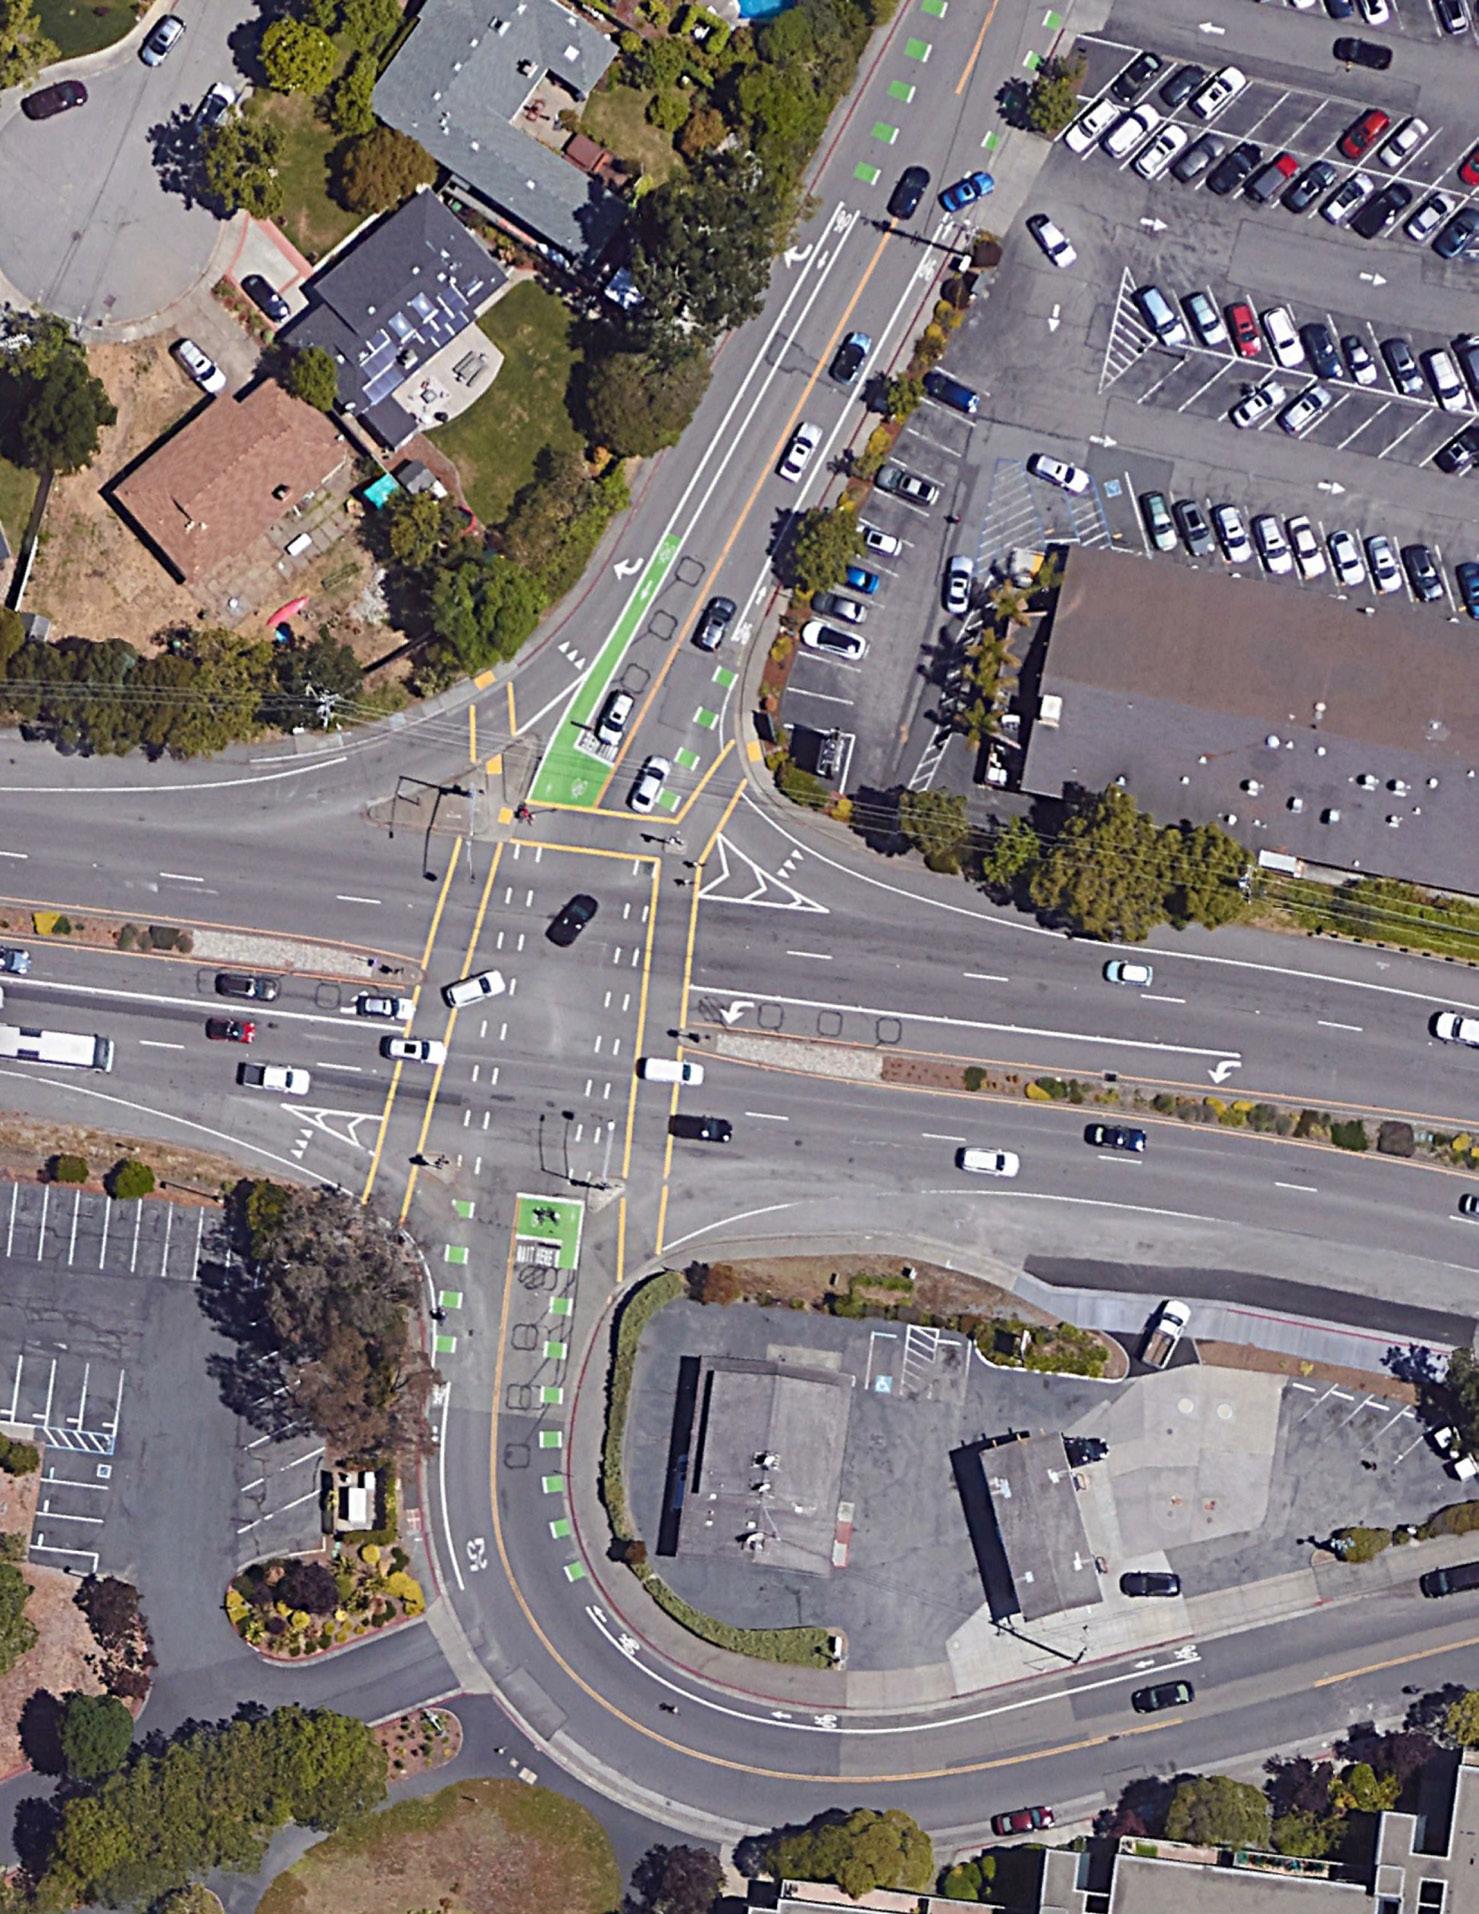
There is no single “silver bullet” solution to mobility constraints on the Tiburon peninsula. The circulation improvements identified In Table M-4 are a mixture of supply and demand strategies intended to reduce vehicle miles traveled (VMT) and traffic congestion and enhance mobility.
Tiburon Boulevard & Blackfield Drive / Greenwood Cove Drive (intersection)
Tiburon Boulevard & Mar West Street (intersection)
Tiburon Boulevard
Consider installation of a roundabout to reduce collisions.
Tiburon Boulevard (from Highway 101 to Trestle Glen Boulevard)
Tiburon Boulevard & Trestle Glen Boulevard (intersection)
Trestle Glen Boulevard
Paradise Drive
Consider installation of a roundabout.
Provide high-visibility crosswalk treatments, including upgrades to existing mid-block crossings in downtown Tiburon. Consider installing pedestrian hybrid signals at some crossings where appropriate.
Provide continuous Class II bicycle lanes with Class IV separated bikeway treatments on some segments and provide pathway segments to eliminate gaps in the pedestrian network.
If feasible, extend the length of the eastbound left-turn pocket on Tiburon Boulevard approaching Trestle Glen Boulevard.
Provide bicycle route improvements, including Class II bicycle lanes where feasible, consistent with the Bicycle and Pedestrian Plan.
Provide bicycle route improvements consistent with the Bicycle and Pedestrian Plan and Bay Trail Plan.
Tiburon Boulevard & Gilmartin Drive Provide a dedicated right-turn lane on Gilmartin Drive approaching Tiburon Boulevard.
Targeted pedestrian improvements identified in the 2016 Bicycle and Pedestrian Master Plan.
• Tiburon Blvd (161 feet west of Juanita Lane): Mid-block crossing upgrade
• Moitoza Lane (between Vistazo West Street and Emperanza Street): installation of steps, lanes and paths identified as top-priority pedestrian project.
• Tiburon Ridge Rail (vicinity of Rabin Property-Town Trail) close trail gaps.
• Las Lomas Trail (weather harden existing trail, Las Lomas Lane at Centro West St)
• Crosswalk enhancements at Tiburon Blvd/Blackfield DrGreenwood Cover Dr intersection
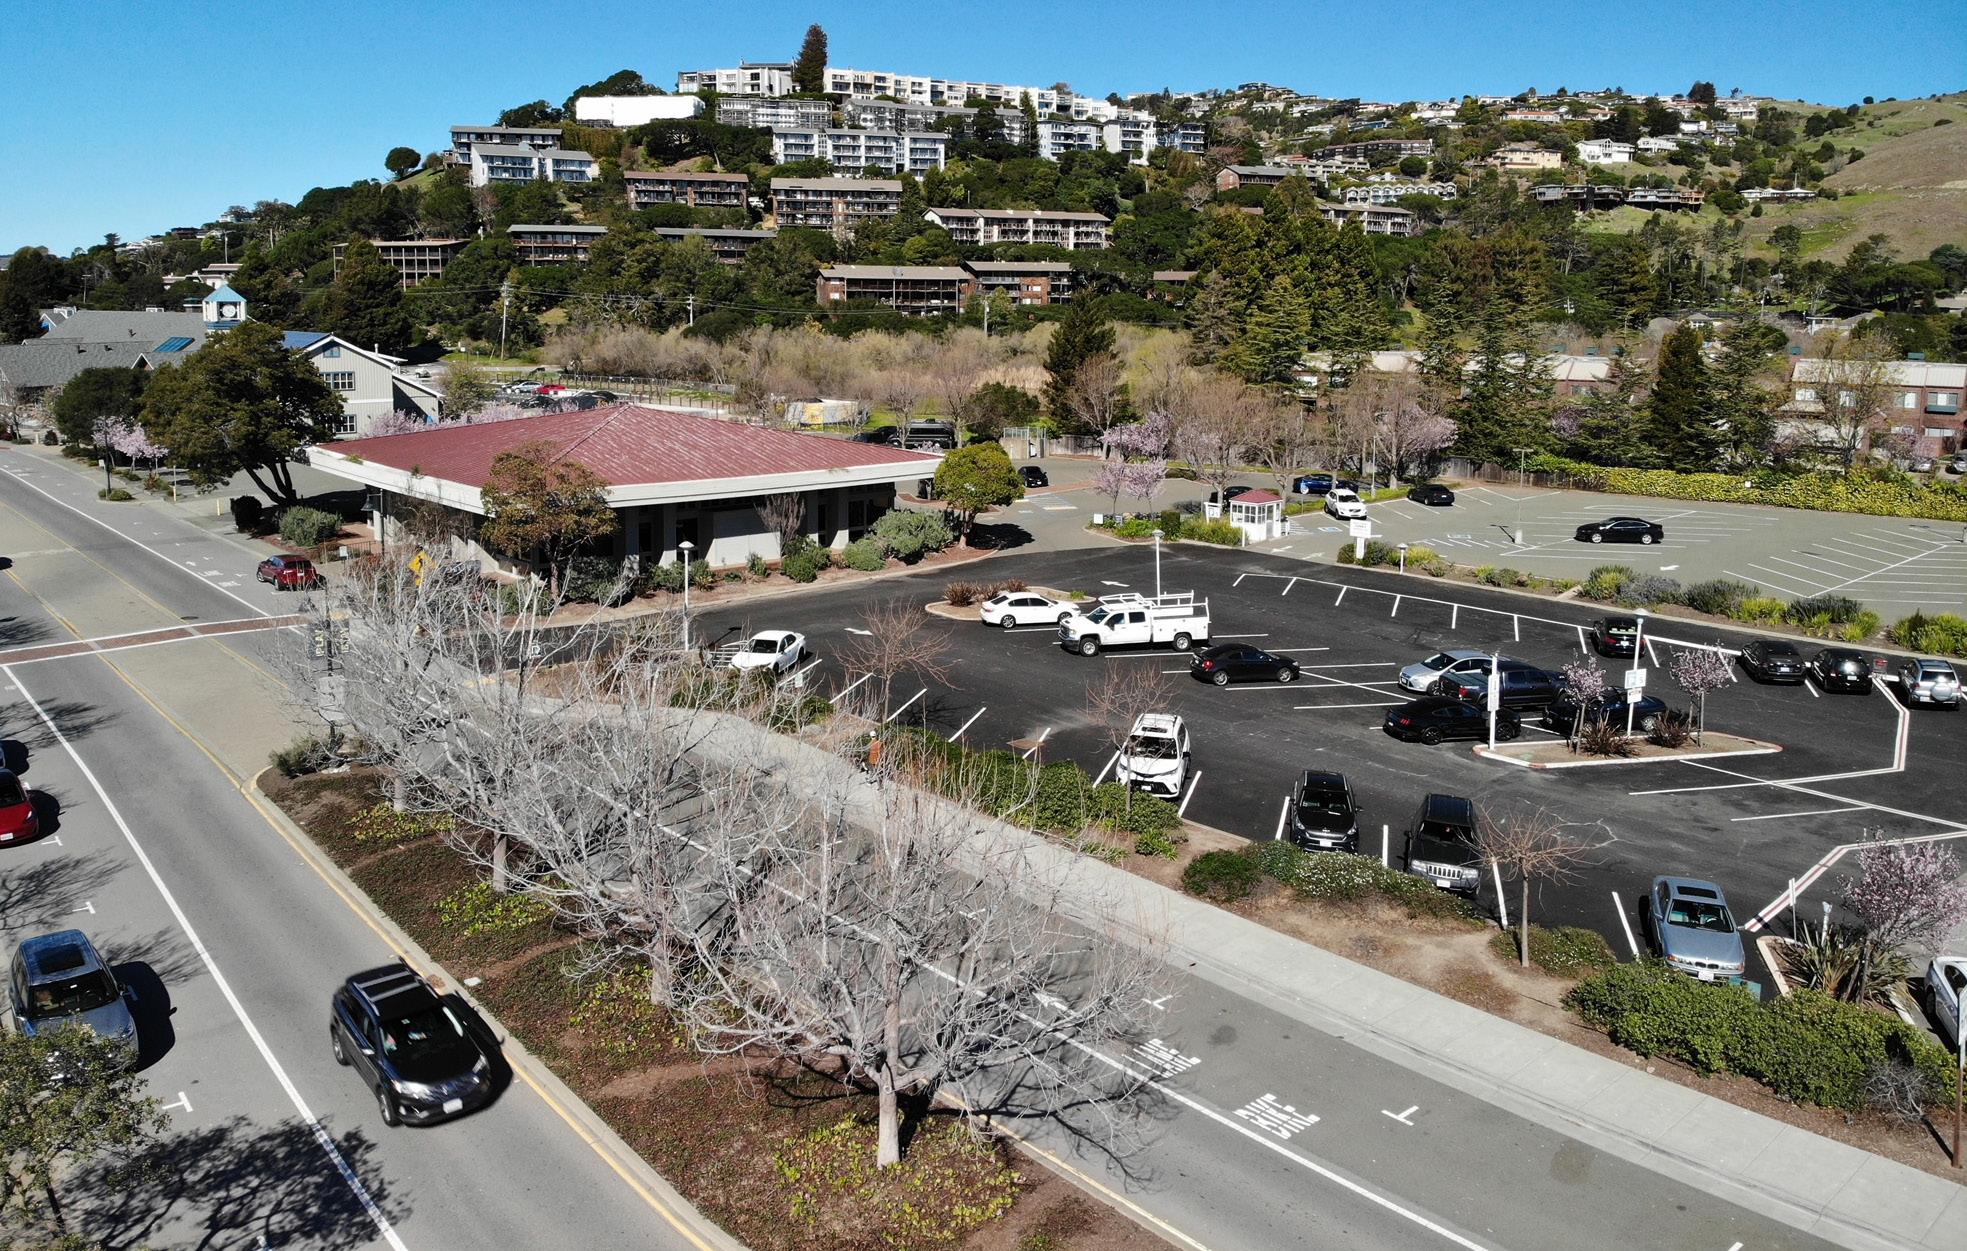
Provide a multimodal transportation system that supports the vision, goals, and objectives of the Town and is effectively planned, funded, operated, and maintained.
Preserve and manage rights-of-way consistent with the goal to provide Complete Streets and the Town's goals for preserving residential quality of life and aesthetics.
EMERGENCY SERVICES.
Prioritize emergency service needs when developing transportation plans and making transportation network changes.
Prioritize the maintenance and operation of the existing transportation network over major expansions to the transportation network when investing discretionary revenue.
Use Table M-4 as the basis for transportation network improvements over the next 20 years, enabling the roadway system to operate safely and efficiently while accommodating future
growth consistent with the General Plan. Prioritize construction of roadway improvements based on consideration of relevant factors including, but not limited to, funding availability, periodic analysis of traffic service levels, the location and timing of new development and safety considerations.
Update and re-evaluate the list of Proposed Circulation Improvements in Table M-4 approximately every five years.
Program M-b Funding for Local Roads and Active Transportation.
Work with transportation funding agencies such as the Metropolitan Transportation Commission and the Transportation Authority of Marin to ensure funding for critical local roads and improvements to the bicycle and pedestrian network.
Increase multimodal accessibility throughout the Tiburon Planning Area with an emphasis on improved walking, bicycling, and transit modes.
Strive to achieve an integrated, multimodal transportation system that improves the attractiveness of walking, bicycling, and riding transit. This would increase travel choices and aid in achieving a more balanced transportation system, thereby reducing air pollution and greenhouse gas emissions.
Facilitate multimodal access along appropriate corridors and to major facilities destinations such as Blackie's Pasture, schools, and Downtown Tiburon.
Program M-c Transit Facilities.
Work with transit agencies and operators to ensure the provision of adequate transit facilities.
GOAL M-C
Improve accessibility and system connectivity by removing physical and operational barriers to safe travel.
Eliminate "gaps" in bikeways and pedestrian networks where feasible and appropriate.
Support Marin Transit and the Golden Gate Bridge, Highway and Transportation District in addressing identified gaps in public transit networks by working together to appropriately locate passenger facilities and stations, providing and maintaining pedestrian walkways and bicycle access to transit stations and stops, and dedicating public rights of way as necessary for transit stops.
Remove barriers, where feasible, to allow people of all abilities to move freely and efficiently throughout the planning area, with the highest priority given to areas that are near Downtown or in other flat areas.
Work to ensure adequate connections to transit stations by identifying, prioritizing, and seeking funding to plan and construct roadway, bikeway, and pedestrian improvements within 1/2 mile of existing and planned transit stations. Such improvements shall emphasize the development of complete streets.
Create a context-sensitive street and roadway system that provides safe access to all users between activity centers within the Planning Area and to destinations across the San Francisco Bay Area, including places of employment, shopping, and recreation. As such, the Town shall strive to balance the needs for congestion relief, personal travel, goods movement, parking, social activities, business activities, and revenue generation, when planning, operating, maintaining, and expanding the roadway network.
Evaluate and strive to address community, environmental, and townwide economic development goals when adding or modifying public rights-of-way.
Take into consideration potential multimodal access and automobile traffic impacts when making land use decisions.
Evaluations of transportation impacts shall take into account the effect on vehicle miles traveled (VMT) and multimodal travel, including the effect on new projects on pedestrians, bicyclists, and transit users. In addition, the Town shall maintain its traffic monitoring program, periodically
measures intersection levels of service and collision data.
Require all new projects to pay a pro rata share of needed multimodal access improvements (a transportation mitigation fee) in accordance with the burden created by such new projects.
Periodically review and update the transportation mitigation fee program to ensure that it is based on current information and continues to provide funds for addressing multimodal transportation impacts generated by new projects.
Coordinate with Marin County for complementary spending of transportation mitigation fees collected from Planning Area projects on improvements within the Tiburon planning area.
Strive to achieve and maintain the average peak hour level of service (LOS) at LOS C for signalized intersections and future roundabout intersections in the Tiburon planning area, with the exception of:
• Intersections from U.S. Highway 101 interchange to E. Strawberry Drive/ Bay Vista Drive (inclusive), which the Town shall strive to achieve and maintain at LOS D.
• Locations where Complete Streets roadway engineering improvements are necessary to ensure safe access for pedestrians and bicyclists, which shall be evaluated on a case-bycase basis, weighing safety with traffic delay considerations.
The Town acknowledges that actual conditions may not meet the above LOS levels during certain peak periods.
At such time as any unsignalized intersection along Tiburon Boulevard meets signal warrants, the Town shall approach Caltrans to approve and/
or provide signalization or other appropriate improvements.
Comply with the Transportation Authority of Marin's Congestion Management Plan (CMP), including adopting and monitoring the level of service (LOS) of the CMP network. As of 2015, the CMP LOS standards are LOS E for U.S. Highway 101 during the P.M. peak hour and LOS D for Tiburon Boulevard during the P.M. peak hour.
In conjunction with Land Use Element policies, encourage overhead utility lines to be placed underground along Tiburon Boulevard, Paradise Drive, and Trestle Glen Boulevard, working with the County of Marin where applicable.
Where feasible, consider roundabouts as an intersection traffic control option
with demonstrated air quality, safety, and mobility benefits. In particular, the Town shall further study installing a roundabout at the intersection of Tiburon Boulevard and Blackfield Drive to reduce collisions, and at the intersection of Tiburon Boulevard and Mar West Street, due to the importance of this location as a gateway to Downtown, and potential traffic flow and safety benefits.
In connection with the ridgeline policies of the Open Space, Parks, and Recreation chapter, ensure that no new streets, driveways, or utilities are installed along or over the Tiburon Ridge or significant ridgelines except for the use of emergency services, or where no other access is viable.
Maintain all existing, as well as to design all future, residential streets with consideration of a combination of residents' safety, cost of maintenance, and protection of residential quality of life.
Consider traffic calming measures, where safe, warranted, and appropriate given topographical and other physical conditions, to increase safety in residential areas by reducing vehicle speeds and volumes and encouraging walking and bicycling. Specific measures may include, but are not limited to, marked crosswalks, curb extensions, raised crosswalks, raised intersections, median islands, tight corner radii, roundabouts, traffic circles, on-street parking, planter strips with street trees, chicanes, and other geometric design features.
Strongly discourages gated streets, roadways, and subdivisions. This policy is not intended to prevent single family homeowners from installing gates on private driveways serving their individual residence.
Install streetlights only at intersections or where required for safety purposes. Light sources shall be of a warm, subdued nature and should be downlights and/or properly shielded.
The Town and other agencies with jurisdiction over roadways within Town limits shall plan, design, operate and maintain all streets and roadways to accommodate and promote safe and convenient travel for all users - pedestrians, bicyclists, transit riders, and persons of all abilities, as well as freight and motor vehicle drivers.
Ensure that, where feasible and appropriate, all new roadway projects and any reconstruction projects designate sufficient travel space for all users including bicyclists, pedestrians, transit riders, and motorists except where pedestrians and bicyclists are prohibited by law from using a given facility.
Implement the complete streets goals and policies set forth in this chapter by utilizing Town Council Resolution No. 42-2012 and referrals to the Parks, Open Space & Trails Commission (acting as the Bicycle and Pedestrian Advisory Committee).
Ensure that all street construction projects support pedestrian travel. Improvements may include sidewalks, roundabouts, traffic circles, narrow lanes and other traffic calming devices, target speeds less than 35 miles per hour, street trees, high-visibility pedestrian crossings, and bikeways.
Improve pedestrian connectivity, linkages and east of movement throughout the Downtown area through various physical and signage improvements.
Identify streets that can be made more "complete" through a reduction in the width of travel lanes, with consideration for emergency vehicle operations. The Town shall consider including new bikeways, sidewalks, and on-street parking on these streets by re-arranging and/or re-allocating how the available space within the public right of way is utilized. All new street configurations shall provide for adequate emergency vehicle operation. The Town shall explore the addition or enhancement of crosswalks on Tiburon Boulevard at key locations in conjunction with safety improvements to ensure that vehicular collisions with pedestrians are reduced.
Tiburon Boulevard has three distinct segments, and future design treatments should reflect the character of each segment. Between Highway 101 and Trestle Glen Boulevard, Tiburon Boulevard is classified as a major arterial with priority for vehicle movement. Between Trestle Glen Boulevard and Mar West Street, Tiburon Boulevard is classified as a minor arterial with consideration for both vehicle traffic and the need for residential access as well as biking and walking. From Mar West Street to Ferry Plaza, Tiburon Boulevard is classified as a downtown thoroughfare (a type
of local street), with priority given to pedestrians and bicyclists.
Additional curb cuts should be discouraged on Tiburon Boulevard except where other access points are not feasible or if necessary for emergency vehicle access. Unnecessary curb cuts should be eliminated.
Discourage parking lots that have substantial frontage on Tiburon Boulevard. Consistent with Downtown Element policies, such parking lots should be located in the rear of buildings to the extent possible. Parking lots should also be screened by buffers or berms where feasible.
Tiburon Boulevard between Rock Hill Road and San Rafael Avenue should
remain free from parking on the water side to enhance and preserve views and the experience of a landscaped waterfront drive.
Water views for pedestrians and drivers shall not be obscured. Overgrown planting shall be trimmed to frame, rather than block, views for pedestrians and drivers to the maximum extent feasible. The Town shall consider approving selective removal or thinning of undesirable trees that block water views.
Cooperatively plan for the maintenance and improvement of Paradise Drive.
Continue to work with the County of Marin to secure safe and reliable access for all users to and from the northeastern side of the Tiburon Peninsula along Paradise Drive. Due to the very high maintenance costs associated with Paradise Drive, the Town will avoid taking on the burden of maintaining additional portions of Paradise Drive unless a suitable and stable ongoing source of funding is established and/or an acceptable joint maintenance agreement is entered into with the County of Marin.
Preserve scenic views from Paradise Drive wherever possible.
Where appropriate, establish scenic overlooks along Paradise Drive.
New driveways and roadways intersecting Paradise Drive shall be kept to the minimum number possible and be situated in safe locations. To meet this objective, to the extent feasible, multiple residences shall be served by a single access from Paradise Drive.
Create turn-outs and widened shoulders on Paradise Drive where possible to protect the health and safety of its users.
Design, construct, and maintain a universally accessible, safe, convenient, integrated, and wellconnected bicycle and pedestrian system that promotes biking and walking. Provide bicycle facilities, programs, and services, and implement other transportation and land use policies as necessary to achieve increased bicycle and walking use.
To reduce single-child automobile trips to schools, the Town shall support infrastructure improvements and programs that encourage children to
bike and/or walk safely to school or ride a bus. This includes installation of sidewalks in critical areas where feasible.
The Town supports, where warranted, the replacement by Caltrans of pedestrian traffic signals with “countdown-style" pedestrian signals, which inform pedestrians of the number of seconds remaining to cross safely.
The pedestrian paths, trails and bicycle lanes in Tiburon should connect with other paths and trails where practical.
Bicycle facilities, including bike racks, shall be included as part of new public and commercial projects, particularly in Downtown Tiburon.
Establish pedestrian routes, particularly for school children, for all neighborhoods where feasible and appropriate. Require that pedestrianoriented streets be designed to provide a pleasant environment for walking and other desirable uses of public space, including such elements as shade trees, plantings, and wayfinding signage where appropriate. Pedestrian routes shall include safe crossings at major intersections.
Develop and implement speed management policies that support driving speeds that are safe for pedestrians and bicyclists, including consideration of bicycle riding speed limits on Old Rail Trail.
In developing capital improvement budgets, the Town shall use the Bicycle and Pedestrian Master Plan as a guide for prioritizing bicycle and pedestrian improvements. New development shall be consistent with applicable provisions of the Bicycle and Pedestrian Master Plan.
Review and update the Bicycle and Pedestrian Master Plan periodically and revise the list of improvements and actions called for in the Master Plan when implementation has occurred, and/or when conditions warrant.
The Town supports the completion and maintenance of the Bay Trail.
Use the designation of Paradise Drive as part of the Bay Trail as a tool in applying for improvement funding for the road, and work cooperatively with ABAG and neighboring jurisdictions to improve the Bay Trail around the Tiburon Peninsula.
Monitor Old Rail Trail and consider periodic improvements that would enhance the safety of its users. Continue to encourage low to moderate bike speeds along Old Rail Trail to ensure pedestrian safety.
Work with local schools to develop maps detailing the safest routes for children to walk and bicycle to school, including trails and other shortcuts.
Promote an integrated transportation system, including the preservation and enhancement of transit as an essential component of a multimodal transportation system, in order that residents and visitors may efficiently, conveniently, and safely connect to, and transfer between, different transportation modes.
Work with Golden Gate Transit and Marin Transit to increase service levels for buses in the planning area when feasible and ensure that bus service provides accessibility and mobility for all Tiburon residents, workers, and visitors. Implementing evening bus service shall be a priority for the Town.
The Town shall ensure high-quality bicycle and pedestrian access to bus stops. The introduction of parking meters may provide a potential source of revenue to finance transit passes for employees, who are a target group for increasing transit ridership. The Town shall continue to identify additional strategies to encourage residents, workers, and visitors to ride buses for trips to, from, and within planning area.
Encourage Marin Transit and Golden Gate Transit to service commutes on Tiburon Boulevard in the morning and evening with buses that would otherwise deadhead (return to their yard empty).
Bus shelters shall be coordinated with Golden Gate Transit and Marin Transit and should receive design review approval. Covered bus shelters are preferred. Benches and paved loading pads should be provided at all bus stops.
The Town supports the installation and maintenance of attractive, covered, unobtrusively lighted seating areas at all bus stops along Tiburon Boulevard and will work with Golden Gate Transit, Marin Transit, and the Transportation Authority of Marin (TAM) to provide them. The Town strongly discourages the placement of commercial advertising on public bus shelters.
New development along transit routes, particularly in Downtown, shall include appropriate provisions for bus stops, including covered waiting areas.
The location of new transit facilities shall emphasize safety and accessibility for the rider so as to encourage transit ridership.
Help ensure that ferry service remains a viable commuter and recreational travel option. This may include helping to coordinate between Golden Gate Transit and Marin Transit bus service and ferry providers. The Town shall encourage the expansion of ferry service to Friday and Saturday evenings.
In cooperation with ferry service and transit bus providers, the Town shall seek to identify public revenue sources to allow ferry service to Tiburon to be offered with lower fares and implement other improvements to increase ridership.
Program M-k Ferry Service Funding.
Actively support efforts to provide resources and secure funding for maintaining and enhancing ferry service.
Support the use of water taxi services, which provide on demand boat trips to
destinations across the Bay Area, as an alternative to driving for recreational and commuting trips when ferry service is not available.
Support the provision of paratransit services for those riders that cannot utilize fixed route bus service.
Senior housing projects shall provide for convenient and accessible paratransit loading and unloading.
GOAL M-K
Provide facilities and incentives to reduce reliance on the private automobile throughout the planning area.
Seek to reduce the number of auto trips made by parents who are picking-up and dropping-off children at local schools by supporting programs that provide viable & attractive alternatives to driving children to school.
Program M-l School Bus Service Funding.
Actively support efforts to provide resources and secure funding for maintaining and enhancing school bus (“Yellow Bus”) service.
Coordinate with the Transportation Authority of Marin to encourage employers to work together to identify programs that provide incentives for employees to use alternative transportation, including carpools.
Support transportation demand management (TDM) programs and measures, including promoting the 511 Rideshare program to employers and employees as a resource for exploring ways to reduce traffic and parking congestion.
Encourage contractors working on building renovations and repairs to arrive and depart outside of peak travel periods to reduce congestion on Tiburon Boulevard. The Town shall consider allowing contractors to use the Blackie’s Pasture overflow parking lot as a park-and-ride location.
Provide and manage parking such that it balances the Town goals of economic development, livable neighborhoods, convenience, sustainability, and public safety throughout the planning area.
Manage public parking and regulate the provision and management of private parking to support parking availability and auto access to neighborhoods across the Planning Area, with consideration for access to existing and funded transit service and shared parking opportunities.
Continue to encourage and allow reciprocal parking facilities for those
businesses located near one another with different peak hour operating demands.
Parking and loading should be provided for new uses and expansion of existing uses in Downtown Tiburon with the intent of providing adequate but not excessive amounts of parking in locations that do not visually dominate the streetscape. Provide for alternative parking solutions such as mechanical stackers or tandem parking in appropriate situations.
Program M-n Review and Revise Parking Regulations for Downtown.
Review and revise the parking regulations set forth in the Tiburon Zoning Ordinance to better reflect the realities and uniqueness of Downtown Tiburon’s parking milieu and to encourage increased activity near streets, such as outdoor dining.
The Town should consider the acquisition of Town-owned and/or operated downtown parking facilities. In addition, the Town should support the provision of electric vehicle charging facilities.
Program M-o EV Charging.
Encourage the provision of electric vehicle charging facilities in multi-family residential, commercial, and public parking lots.
Engage in good faith, participatory planning efforts with the Transportation Authority of Marin and other agencies working toward alleviating congestion in the U.S. Highway 101 Corridor.
Program M-p U.S. Highway 101 Corridor Planning.
Maintain an active role in the Transportation Authority of Marin and/ or U.S. Highway 101 Corridor planning program with the purpose of ensuring that improvements enhance inter-city movement.
Maintain a good working relationship with Caltrans to ensure that improvements proposed by Caltrans are sensitive to the Tiburon community and to facilitate expeditious consideration of Town requests for improvements.
To support statewide and regional efforts to reduce greenhouse gas emissions, the Town shall strive to ensure that rates of VMT are below regional averages on a “per resident” and “per employee” basis.
Support and prioritize land use and transportation provisions that help reduce VMT.
Consider the effect of planned circulation improvements on VMT when updating the Town’s capital improvement program.
Support car sharing and bicycle sharing opportunities in Downtown Tiburon.
Encourage programs and prioritize circulation improvements aimed at reducing collisions and eliminating traffic fatalities.
Monitor collision data to assist in prioritizing mobility improvement options.
Identify and/or pursue funding for safety improvements, particularly along Tiburon Boulevard, including such improvements as pedestrian crossing improvements, separated bikeway segments, and the installation of roundabouts where feasible.
Be proactive in ensuring the circulation system adequately accommodates emerging technologies and services, including driverless vehicles and ridesharing services, in a safe and efficient manner.
Continue to promote Safe Routes to School programs, and installation of physical improvements to enhance walking and bicycling to schools.
Continue to work with the Reed Union School District, Tamalpais Union High School District, St. Hilary School, and with the Transportation Authority of Marin as the administrator of the County’s Safe Routes to Schools Program, to promote alternative transportation programs that reduce traffic congestion around schools. This will include improving safe access routes for children walking and biking, as well as developing appropriate measures identified by the Community Action to Reduce Traffic (CART) committee.
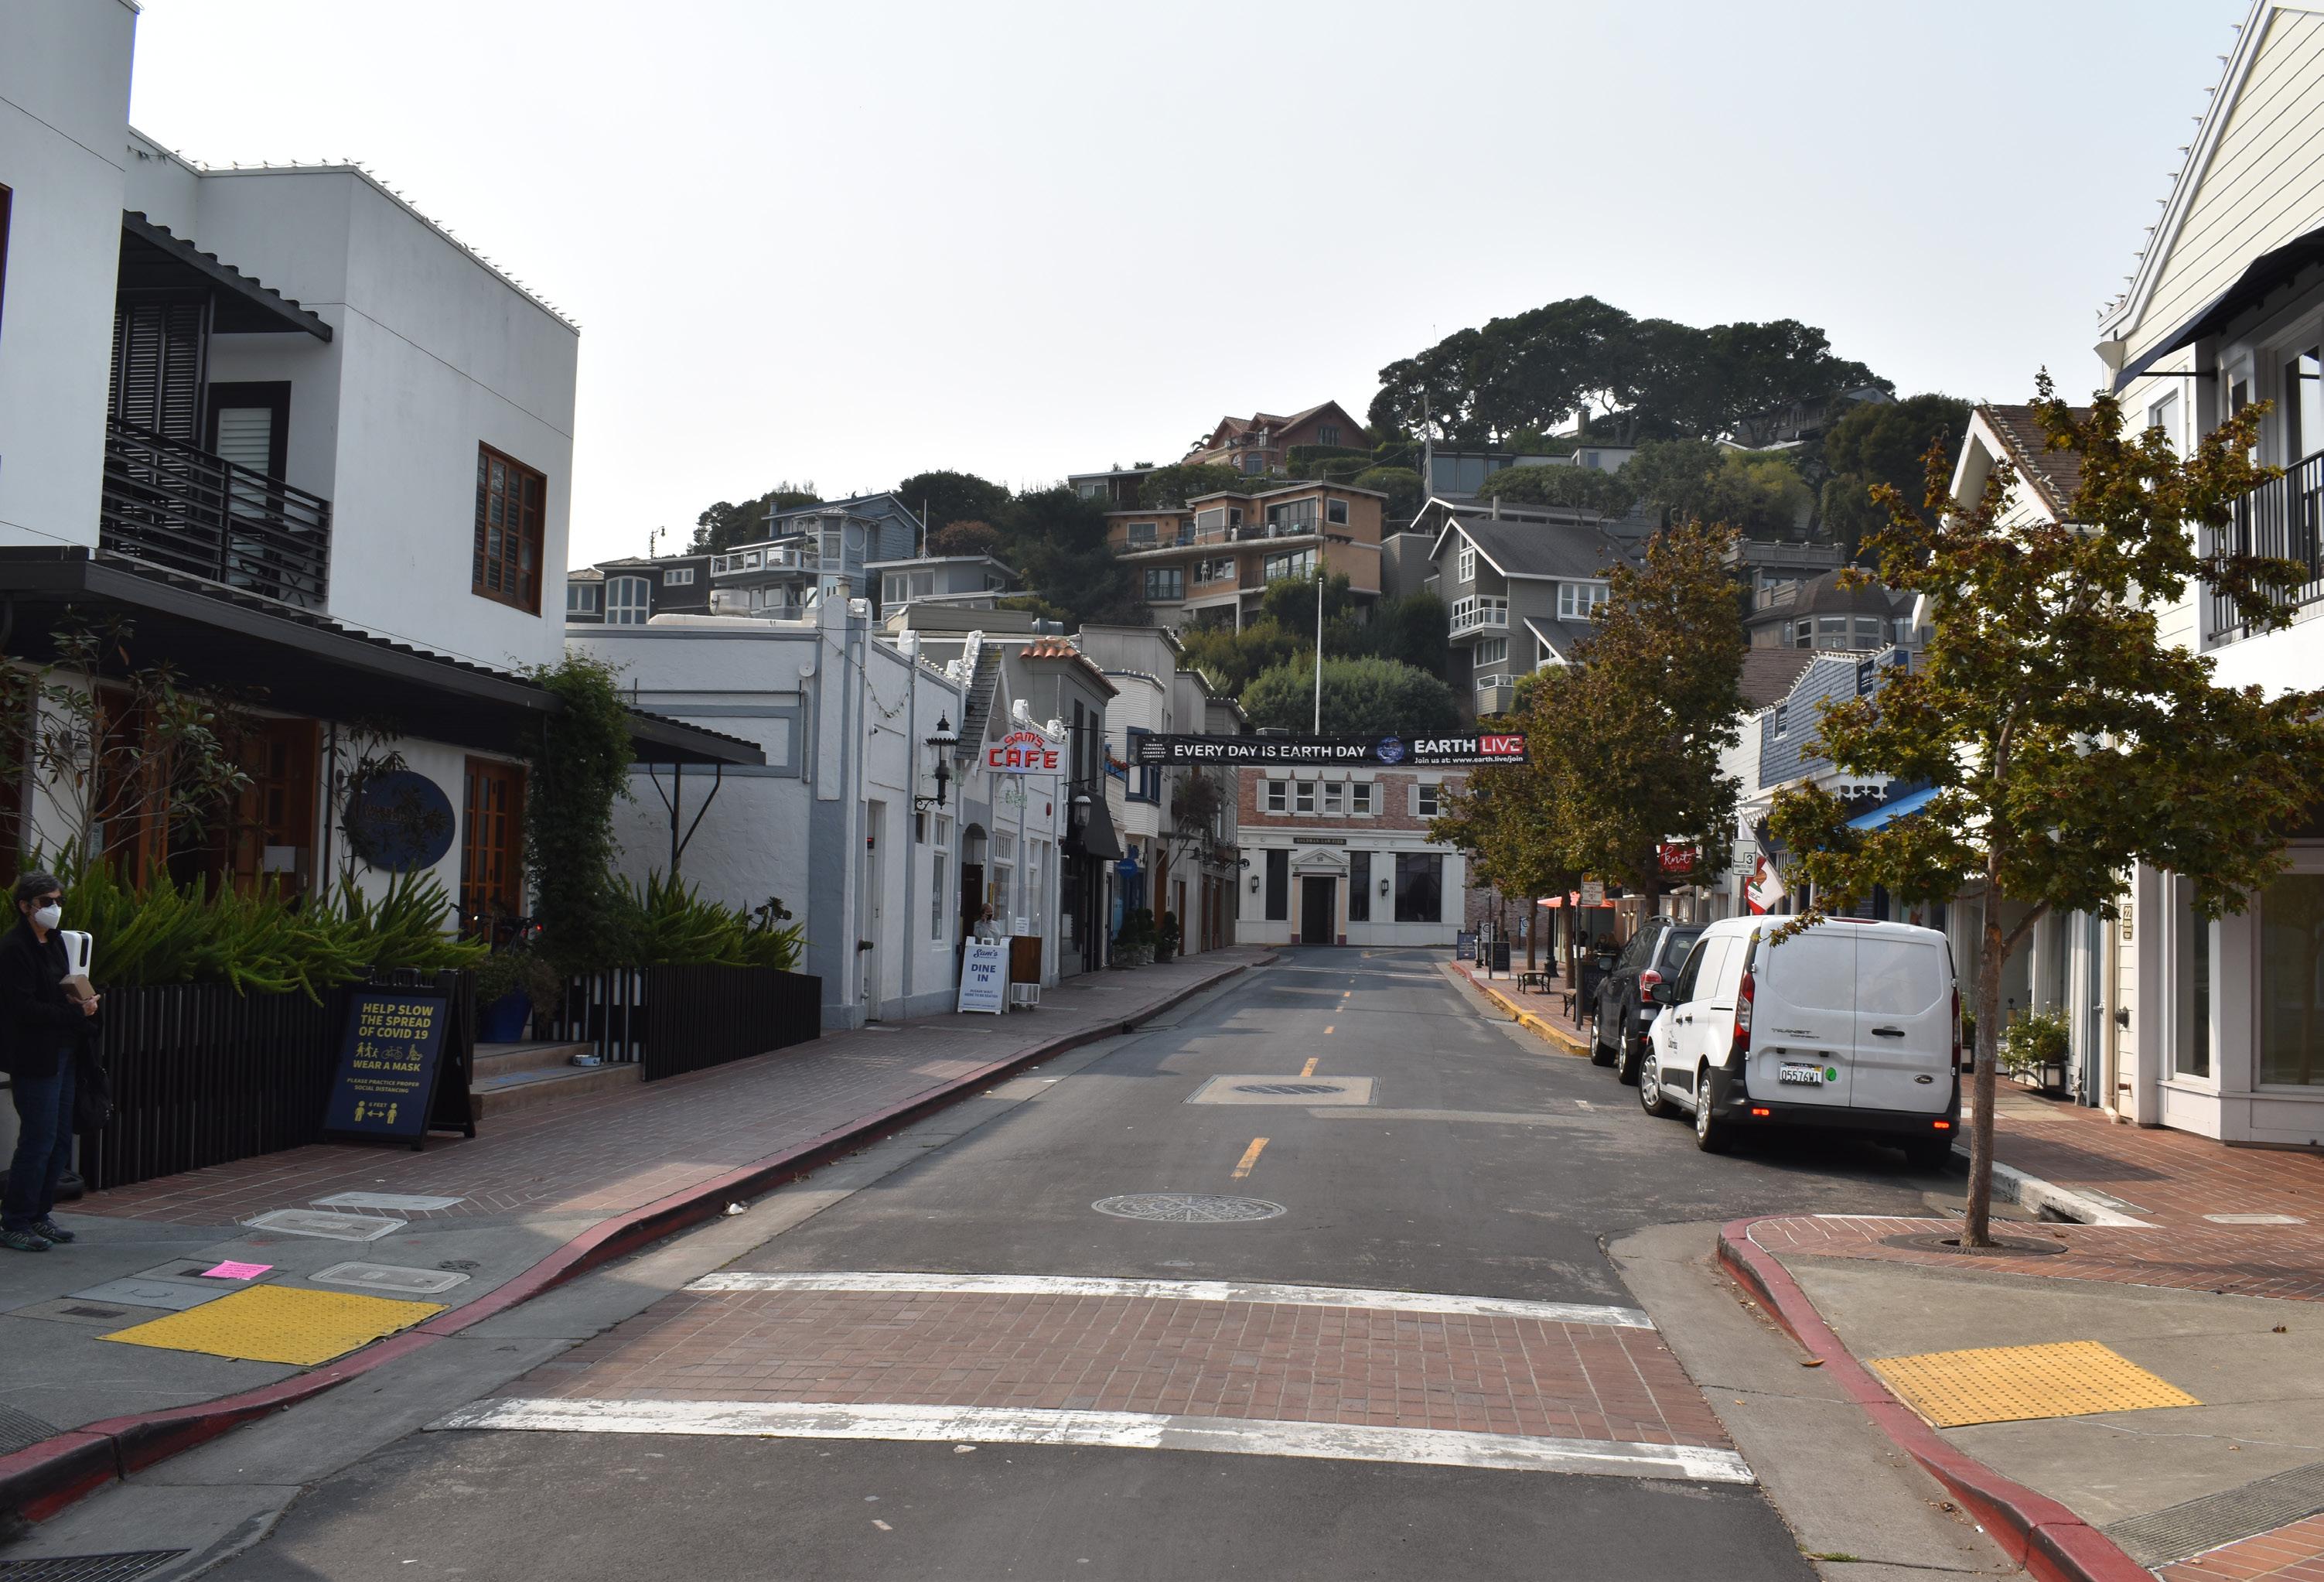
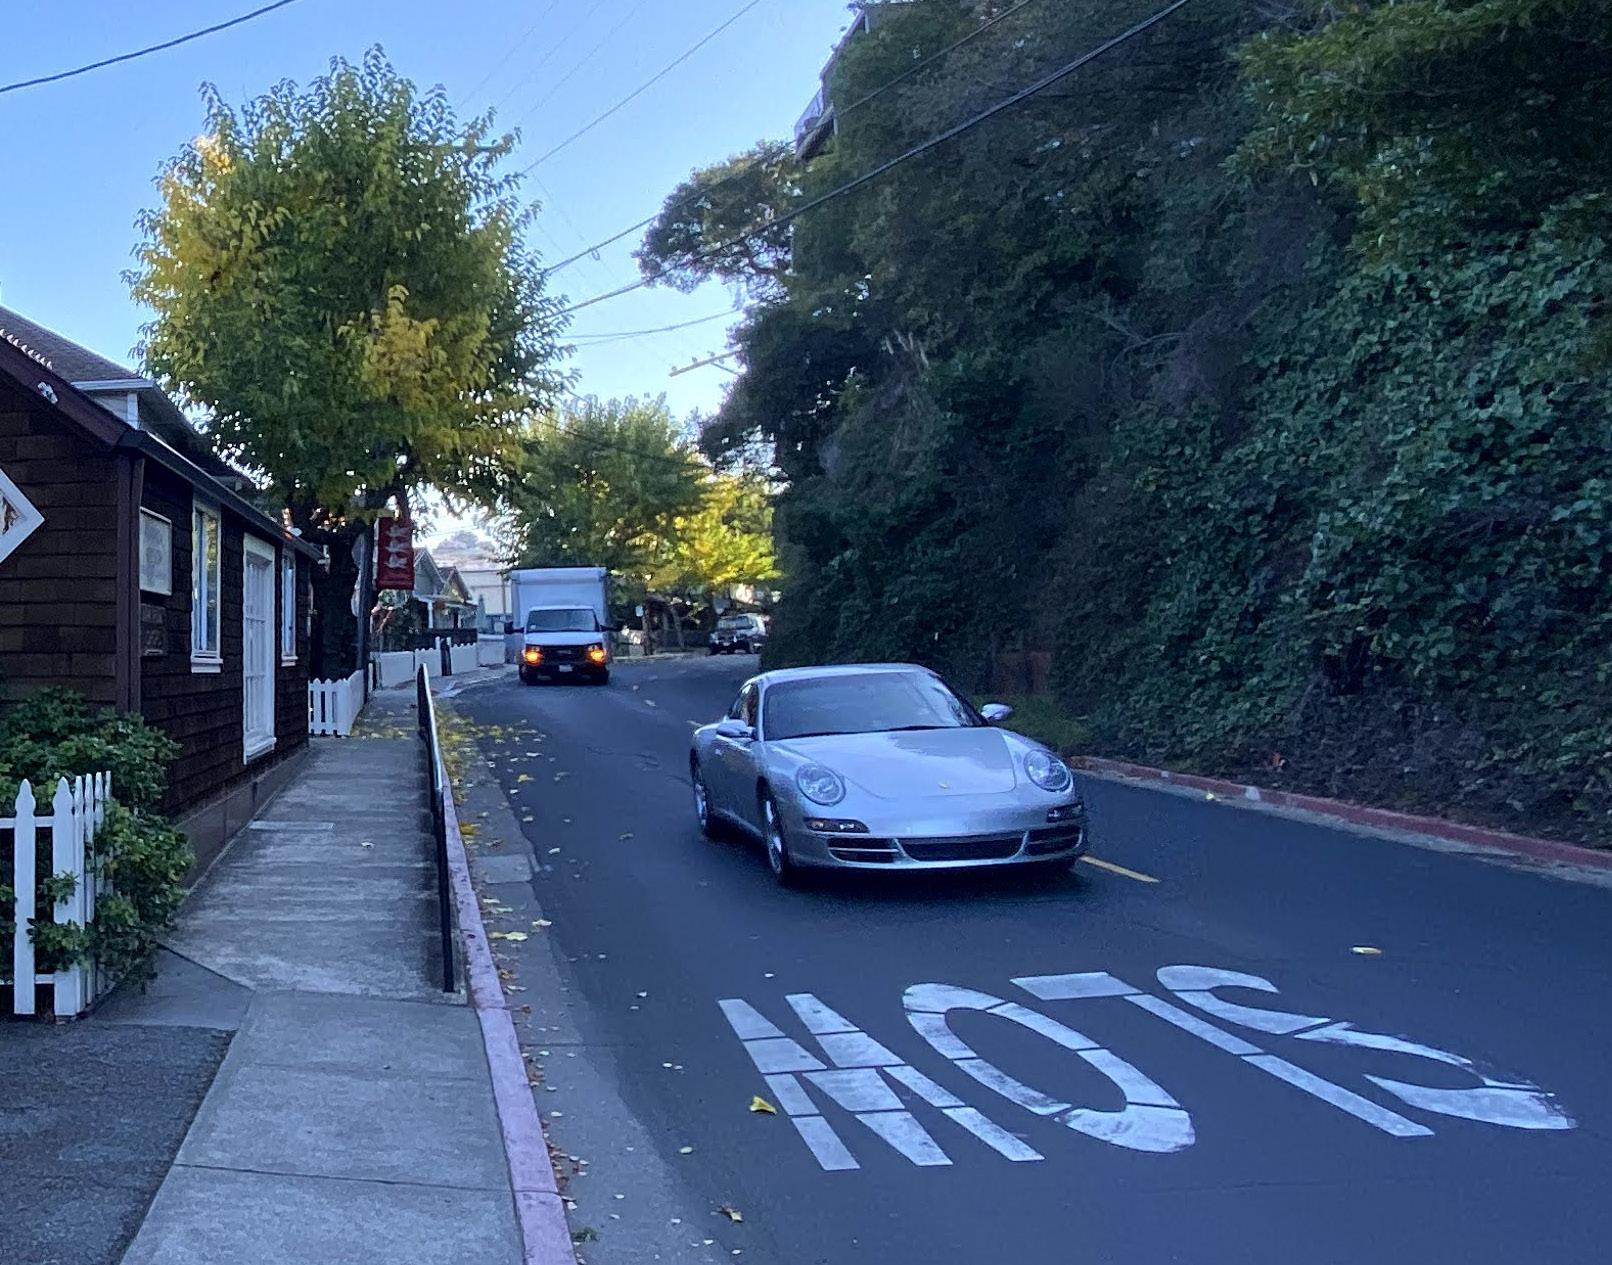
This chapter identifies sources of noise and existing and future noise levels in Tiburon and provides standards to address exposure to current and projected noise sources. The primary source of existing noise in Tiburon is vehicle traffic from Tiburon Boulevard. Commercial activity, outdoor music, recreation, construction, landscape maintenance, and truck loading and unloading are among the stationary sources that contribute to the noise environment. The purpose of the Noise chapter is to limit the community’s exposure to excessive noise levels in noise-sensitive areas and at noisesensitive times of day.
The Noise chapter includes the following sections.
7.2 Fundamentals of Noise. Describes the fundamentals of sound and noise-related terms.
7.3 Existing Noise Conditions. Discusses the most significant sources of noise in Tiburon, including roadways and stationary sources.
7.4 Noise and Land Use
Compatibility Standards. Presents standards that should be used to evaluate compatibility between new land uses and infrastructure projects and noise levels in Tiburon.
7.5 Future Noise Environment. Describes future noise conditions expected with development projected under the General Plan.
7.6 Goals, Policies, and Programs. Identifies goals, policies, and programs to limit the community’s exposure to noise and vibration.
Noise is a subjective reaction to different types of sound. Noise is typically defined as sound that is loud, unpleasant, unexpected, or undesired. The effects of noise on people can be placed in three categories:
• Subjective effects of annoyance, nuisance, and dissatisfaction;
• Interference with activities such as speech, sleep, and learning; and
• Physiological effects such as hearing loss or sudden startling.
Environmental noise typically produces effects in the first two categories. Workers can experience noise in the last category. A wide variation in individual thresholds of annoyance exists and different tolerances to
noise tend to develop based on an individual’s past experiences with noise.
A decibel (dB) is the fundamental unit of sound, and sound is measured on a decibel scale. The decibel scale is logarithmic, not linear, which means that an increase in 10 dB is 10 times greater than the base number. The perceived loudness of sound is dependent upon many factors, including sound pressure and frequency content. The A-weighted decibel scale is used to give greater weight to the frequencies of sound to which the human ear is most sensitive by deemphasizing the very low and very high frequencies. The A-weighted sound level is expressed as dBA and is the most common method to characterize sound in California. Representative outdoor and indoor noise levels in units of dBA are shown in Figure N-1.
The zero on the decibel scale is based on the lowest sound level that the healthy, unimpaired human ear can detect. Except in carefully controlled laboratory experiments, a change of 1 dBA cannot be perceived. Outside the laboratory, a 3 dBA change is a just-perceivable difference. Generally, a change in level of at least 5 dBA is required before any noticeable change in human response would be expected. A 10 dBA change sounds like the noise has approximately doubled.
Community noise is commonly described in terms of the ambient noise level, which is defined as the all-encompassing noise level of a given environment consisting of all noise sources audible at that location. A common statistical tool to measure ambient noise is average, or equivalent, sound level. The day/night average level (Ldn) is based on the average noise level over a 24-hour day, with a 10-decibel weighting applied to noise occurring during nighttime (10 p.m. to 7 a.m.) hours. The nighttime penalty is based upon the assumption that people
react to nighttime noise exposures as though they were twice as loud as daytime exposures. Because Ldn represents a 24-hour average, it tends to disguise short-term variations in the noise environment. Varying levels of noise can impact sleep and speech and cause annoyance. An important way of predicting a human reaction to a new noise environment is the way it compares to the existing environment to which one has adapted. In general, the more a noise exceeds the previously existing ambient noise level, the less acceptable the new noise will be judged by those hearing it.
Existing traffic volumes and generally accepted noise modeling techniques were used to develop noise contours for the major roadways in the planning area. Figure N-2 shows noise contours for the 60 and 65 dBA levels along Tiburon and Trestle Glen Boulevards. The contours indicate maximum noise exposure assuming line-of-sight to the noise source and fall rapidly a short distance from the roadways since noise decreases exponentially with distance. These contours are intended for screening purposes to identify locations where site-specific noise studies may be required. Predicted noise levels along major roadways at the nearest receptors were prepared for the General Plan Existing Conditions Report. Roadway segments where noise levels are at least 65 dBA Ldn at the closest receptor include locations between US 101 and Rock Hill Drive. Noise levels along Tiburon Boulevard in the Downtown are
generally predicted between 60 and 65 dBA Ldn. The nearest receptors on these roadway segments include both residential and commercial uses.
Commercial activity, construction, landscape maintenance, parking lots, loading docks, parks, and schools are among the stationary noise sources in Tiburon. Construction noise includes demolition, excavation, grading, delivery of materials, and building on a project site or staging area. Stationary noise sources also include recreation activities and outdoor music; service and delivery trucks idling, loading, and unloading; and mechanical systems for heating, ventilation, and air conditioning. Town policy provides noise standards for heating, ventilation, air conditioning units and similar noisegenerating mechanical equipment. The Town also regulates the hours of use of leaf blowers and hedge trimmers.

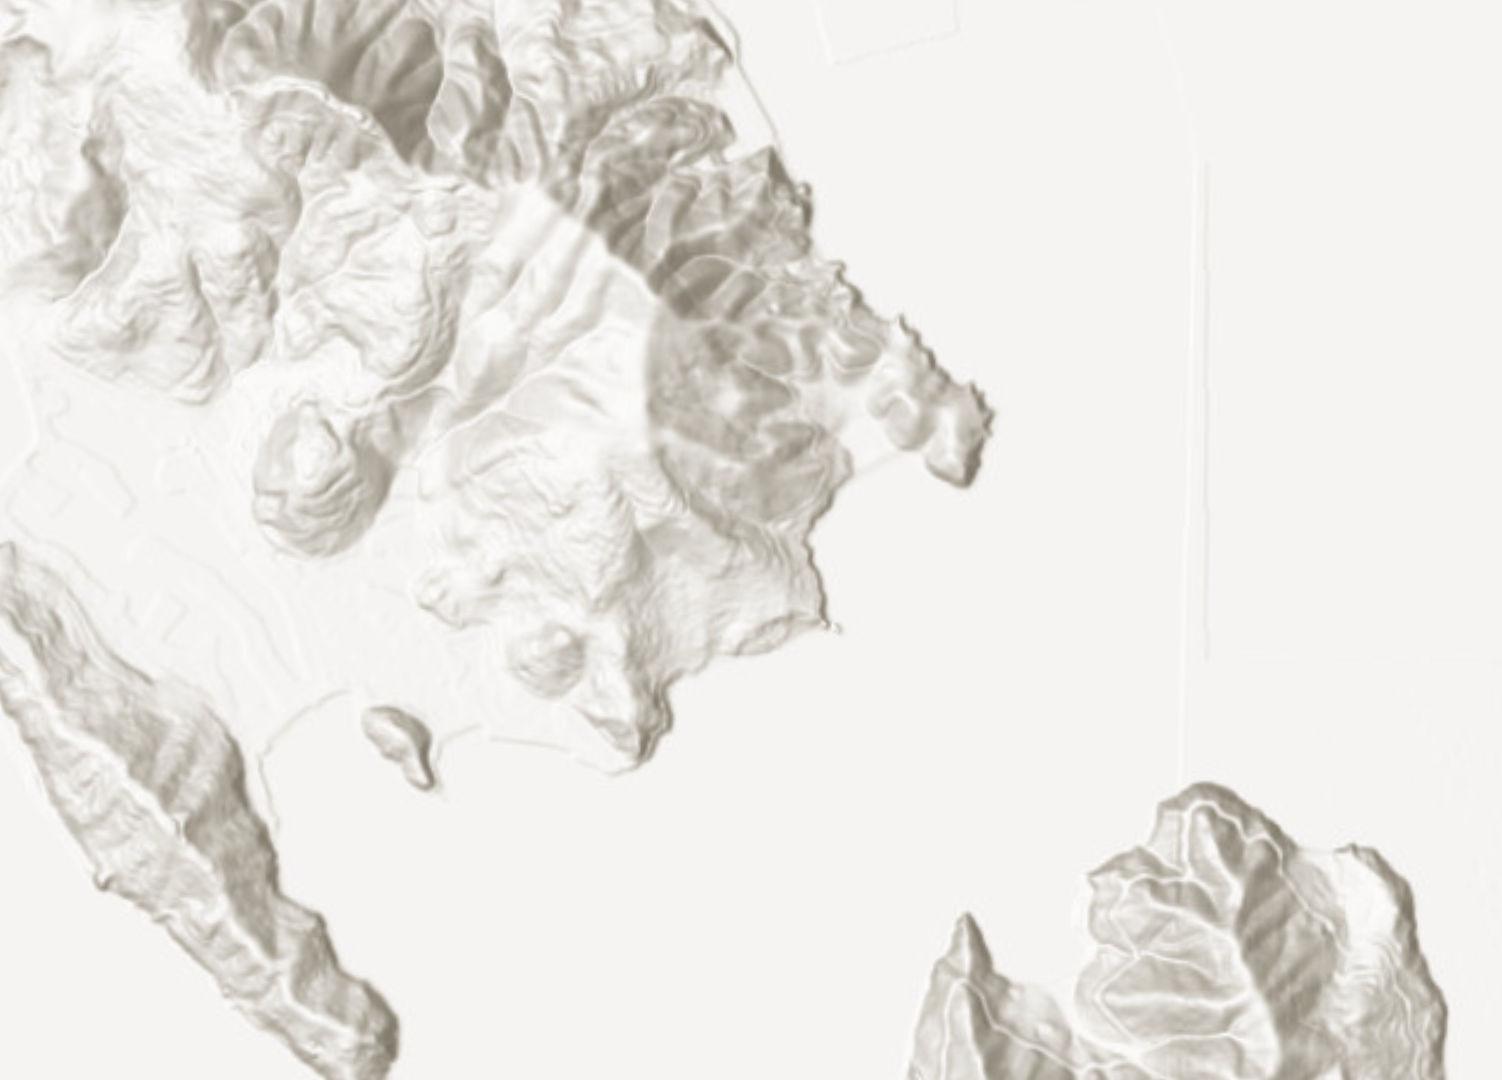
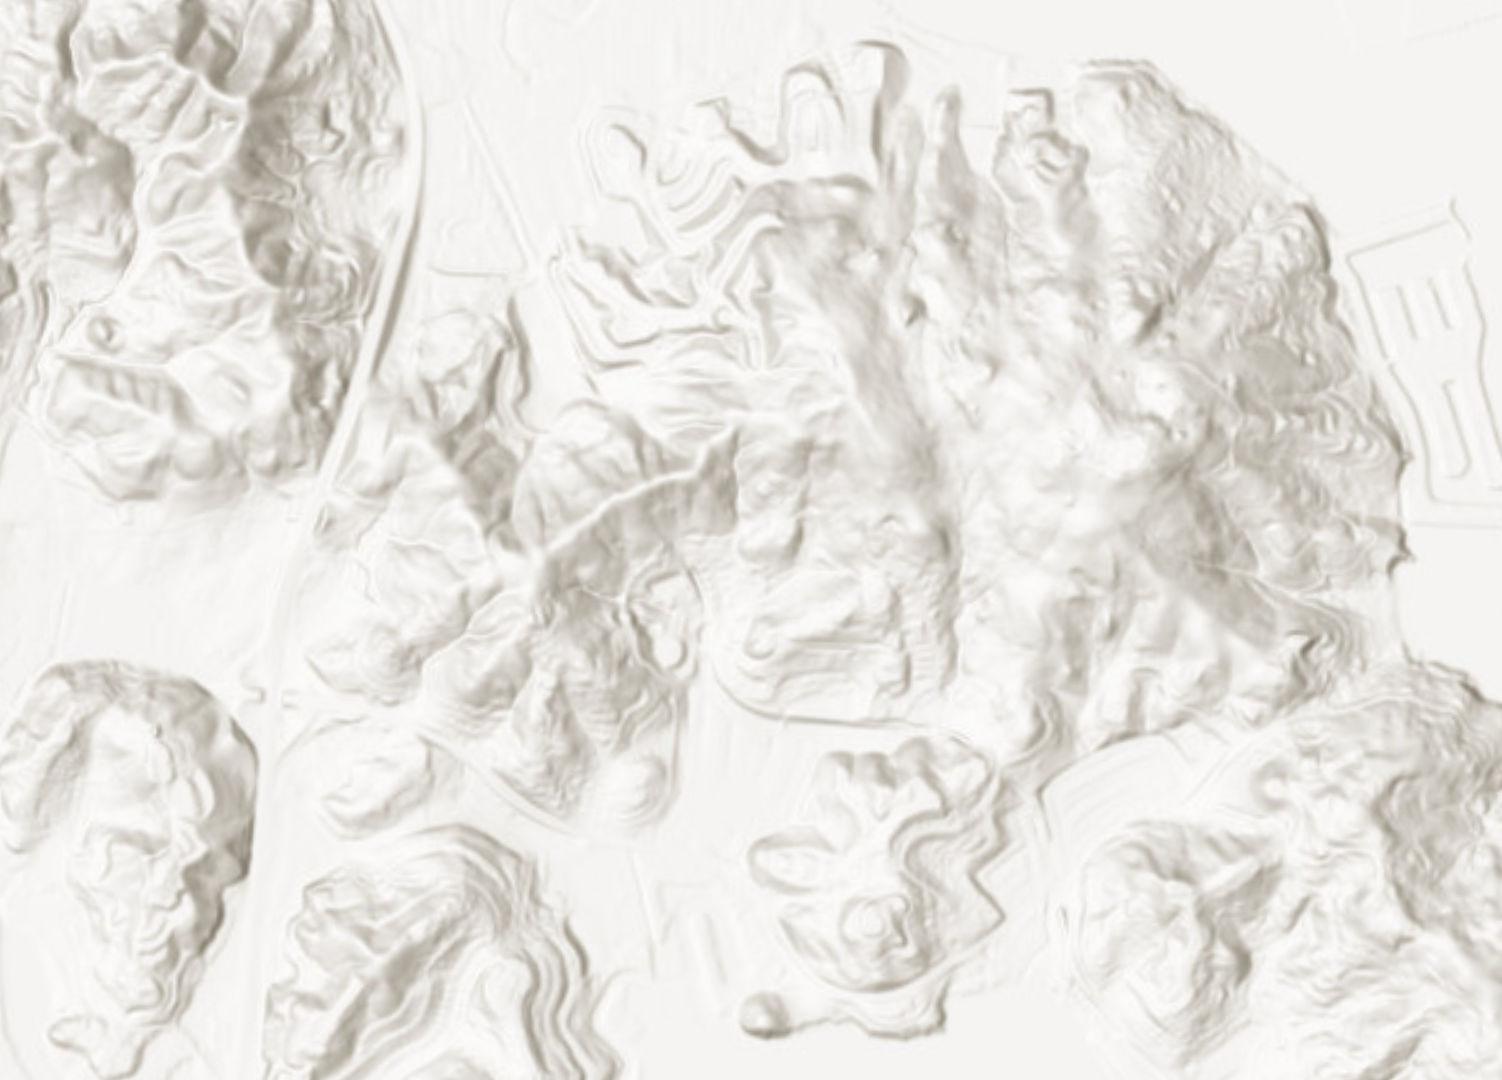
The standards listed in Figure N-3 should be used to evaluate the compatibility between new land uses and future noise in Tiburon. The land use compatibility standards should be used in combination with Figures N-2 and N-4 to determine whether a proposed development or land use is located in an area that exceeds the normally acceptable noise exposure for that type of development or land use and therefore requires an acoustical analysis and/or special noise mitigating measures. The land use compatibility standards are also used as a guide to determine if noise from stationary sources is acceptable.
Future noise levels will be largely attributable to vehicular traffic. Projected noise contours are shown in Figure N-4. This figure identifies areas that may be exposed to excessive noise levels, defined as those above
60 dBA Ldn. Policies and programs in this chapter address these noise issues through implementation of a variety of noise-mitigating measures and, where possible, conditioning future development to limit future noise exposure.
Ensure that residential areas are quiet and that noise levels in public and commercial areas remain within acceptable limits.
Eliminate or reduce unnecessary, excessive, and offensive noises from all sources
Use the Noise and Land Use Compatibility Guidelines in Figure N-3 in land use decisions to determine what noise levels in the community are acceptable or unacceptable and to require noise attenuation methods as warranted in noise-impacted areas.
Use the Noise and Land Use Compatibility Guidelines in Figure N-3 to determine acceptable new land uses, and to require noise attenuation methods as warranted in noiseimpacted areas.
Require acoustical studies for projects that may be exposed to or create noise levels that exceed the Noise and Land Use Compatibility Guidelines in Figure N-3. Mitigation measures should be identified to ensure that noise levels remain at acceptable levels.
Establish conditions of approval through the development review process for activities with the potential to create noise conflicts and enforce these conditions once projects become operational.
Use the environmental review process to identify measures to minimize exposure of neighboring properties to excessive noise levels from construction activity.
Consider potential noise impacts from new or expanded recreational facilities on surrounding residential properties, requiring preparation of an acoustical report for projects which may create noise levels which exceed the Noise and Land Use Compatibility Guidelines in Figure N-3.
Minimize exposure of residents to traffic noise through land use policies, law enforcement, street design and improvements and landscaping.
Work with Caltrans to ensure that adequate noise studies are prepared, and noise mitigation measures are considered for modifications to Tiburon Boulevard.
Discourage the use of sound walls if other noise reduction measures such as berms or landscaping are available. Any sound walls or solid barriers should be aesthetically compatible with the surrounding neighborhood, regularly maintained, and minimize the potential for reflected sound.
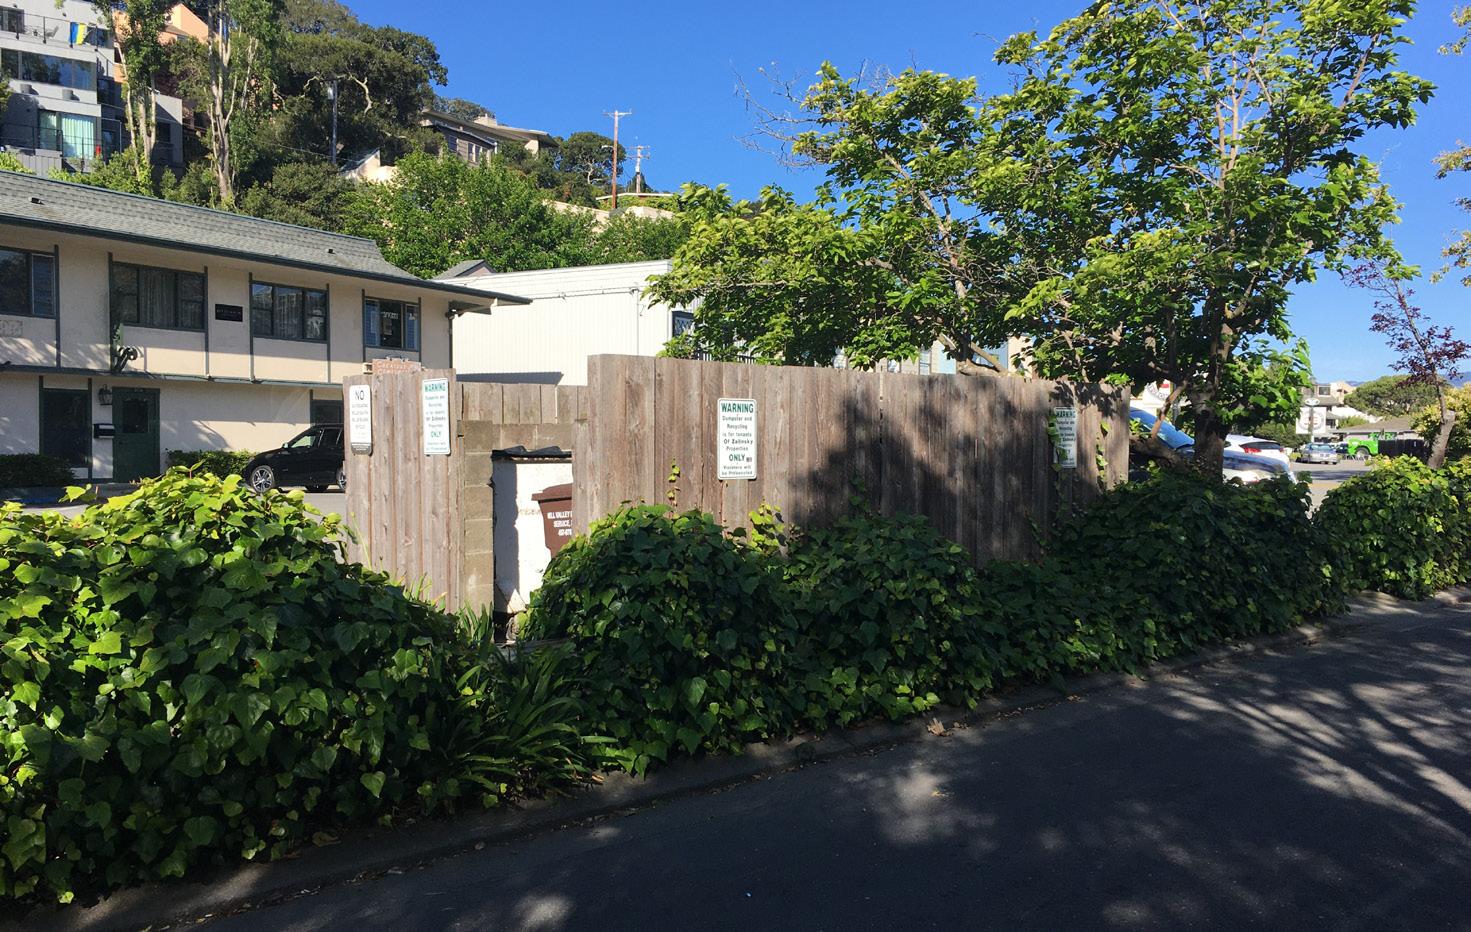
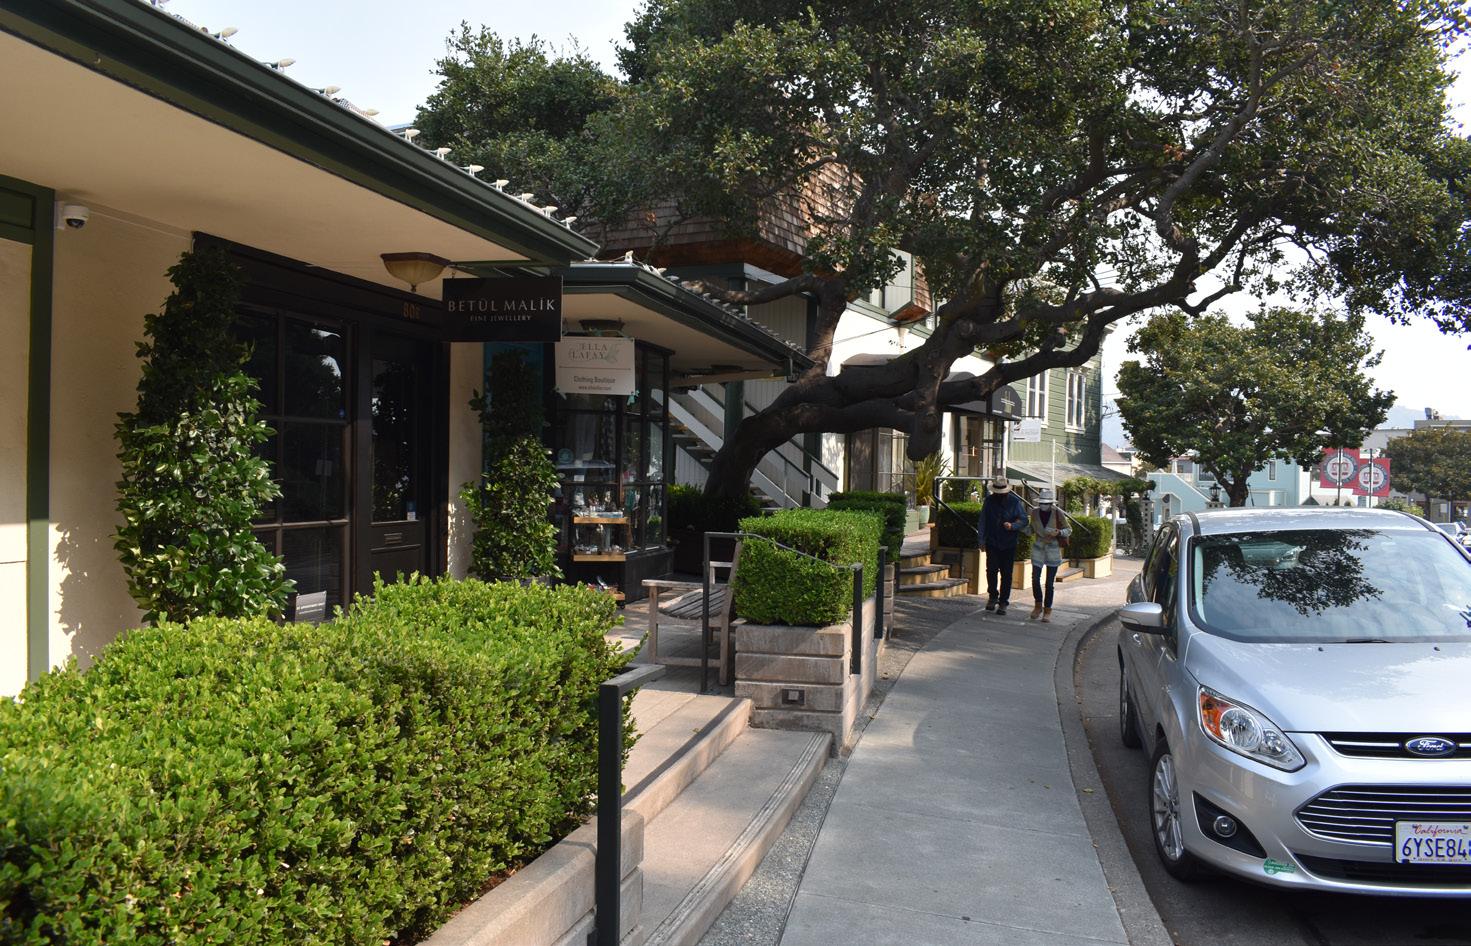
Attempt to reduce aircraft noise over the Tiburon Planning Area by working with the County of Marin, other cities and towns, and appropriate regulatory agencies.
Ensure that the potential for vibration from demolition and construction projects is considered and measures are taken to mitigate potential impacts.
Discourage the use of sound walls if other noise reduction measures such as berms or landscaping are available.
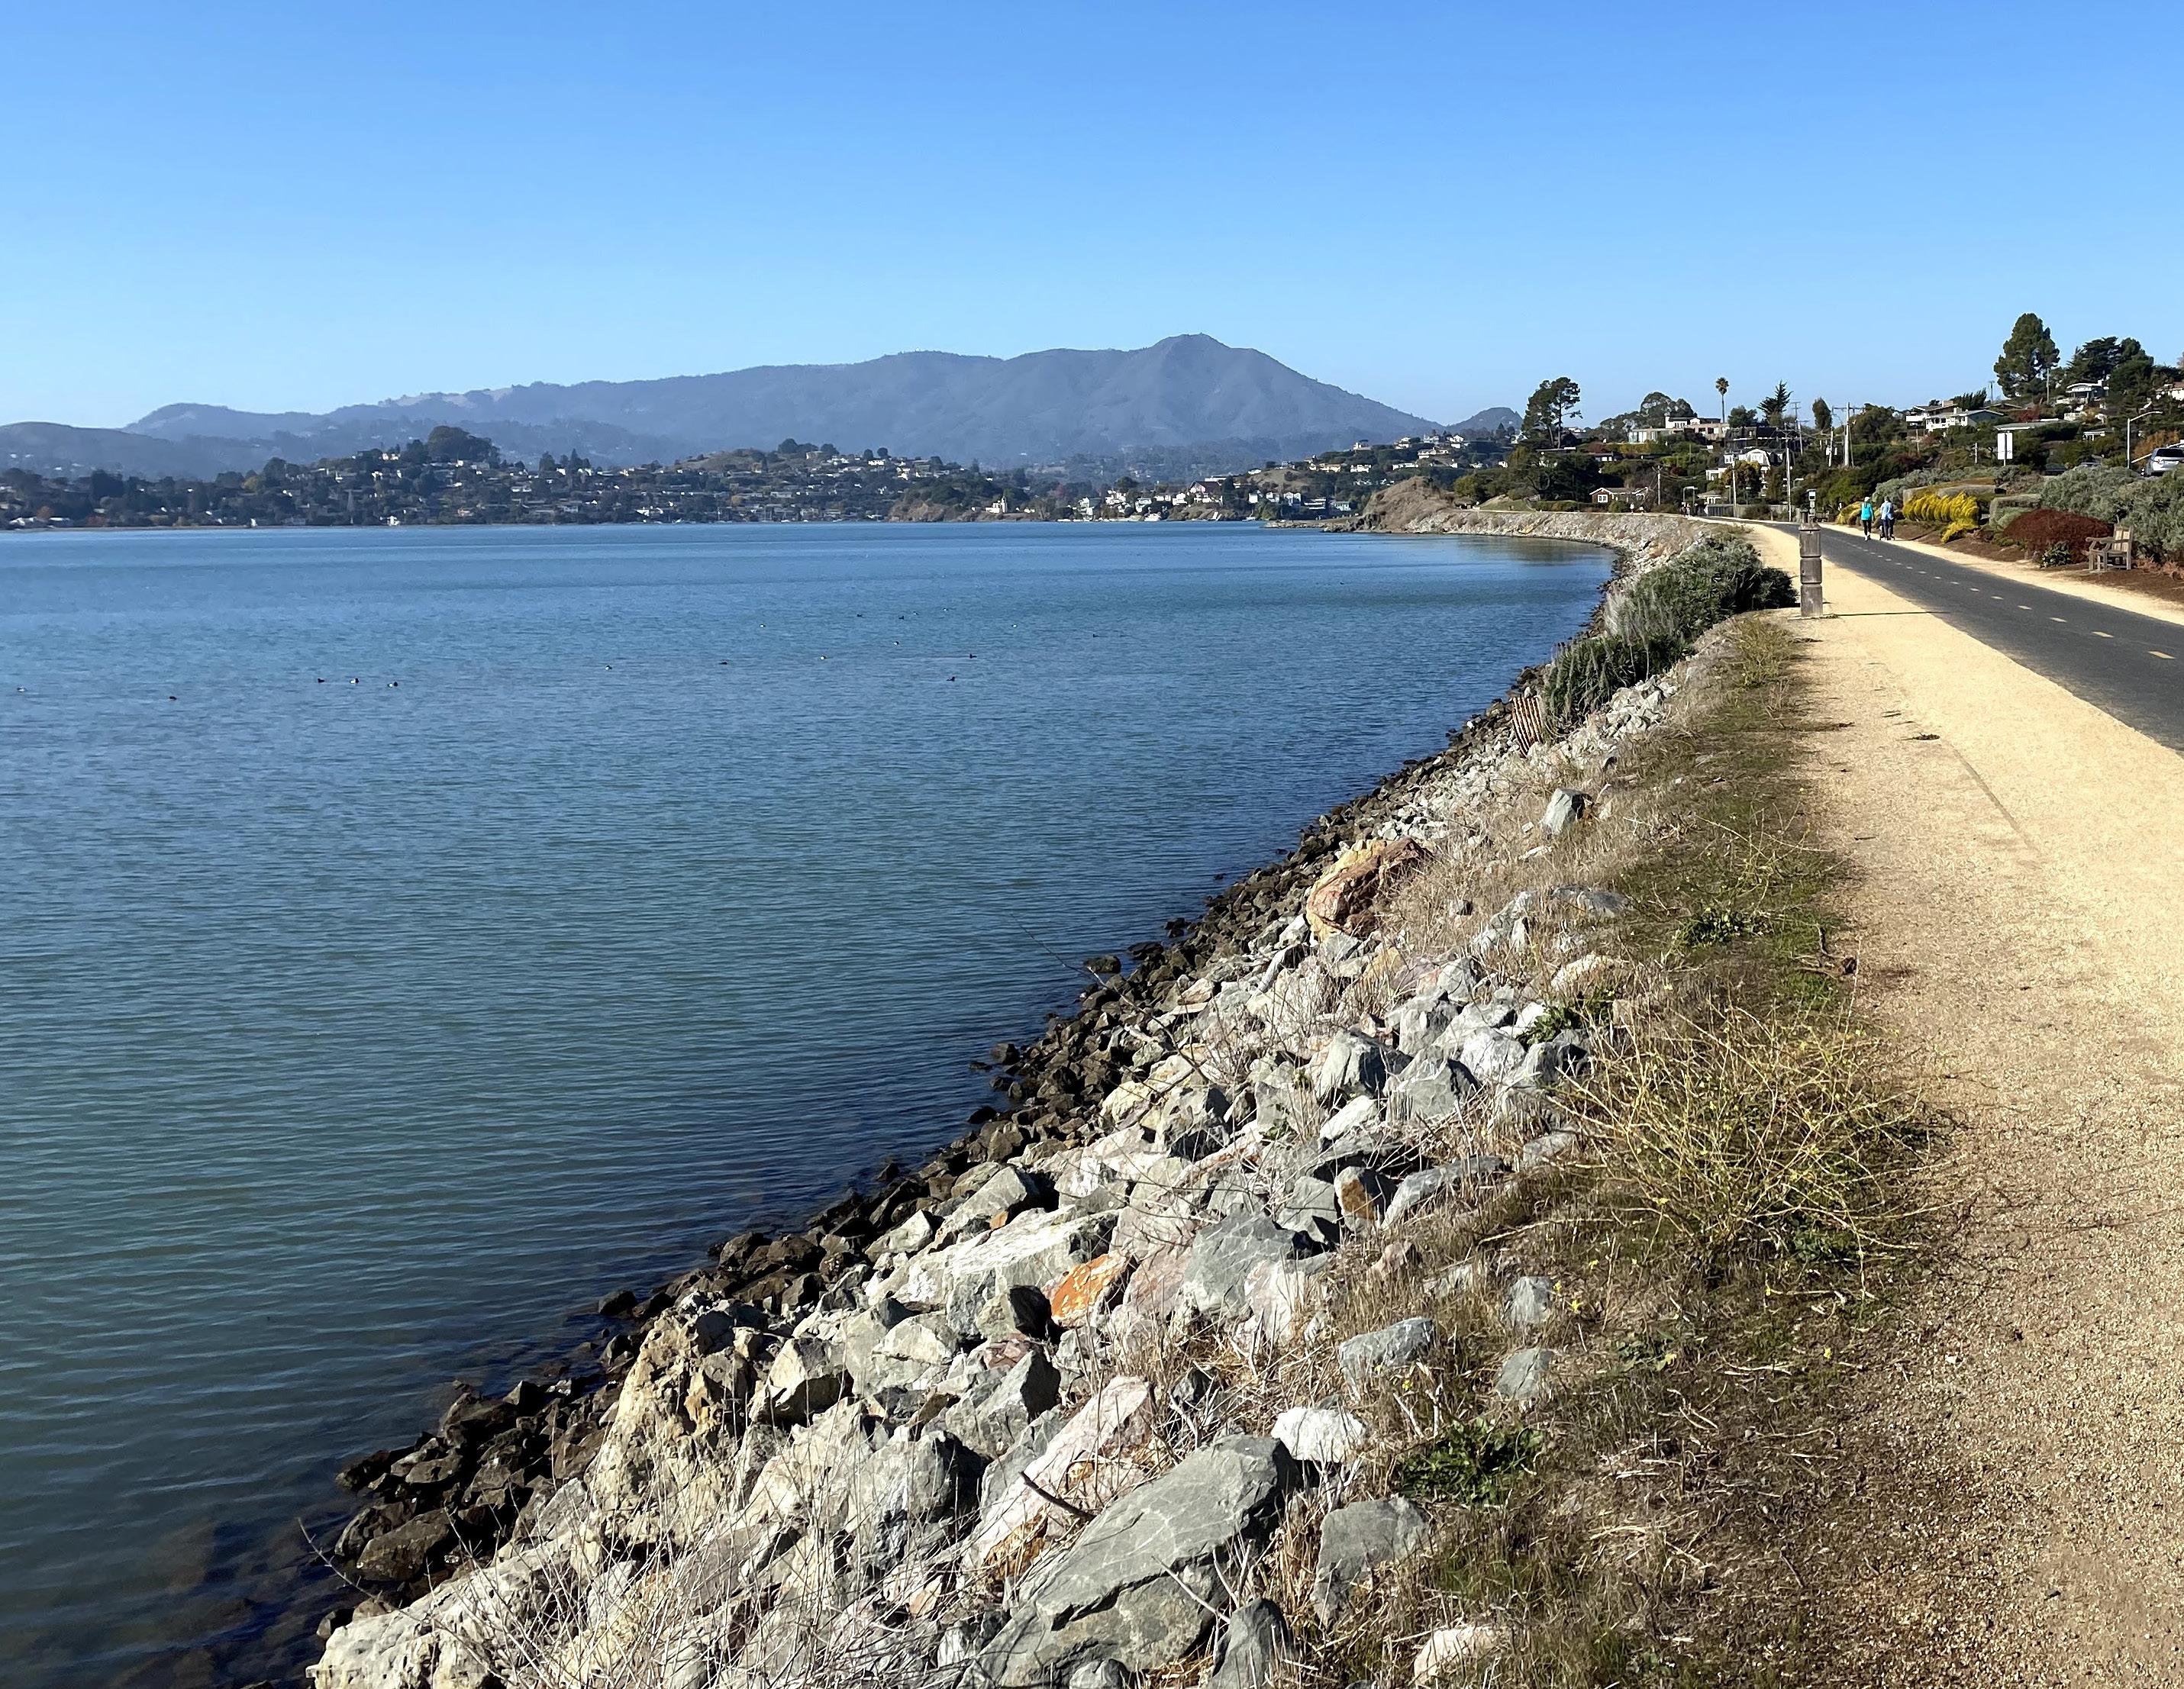
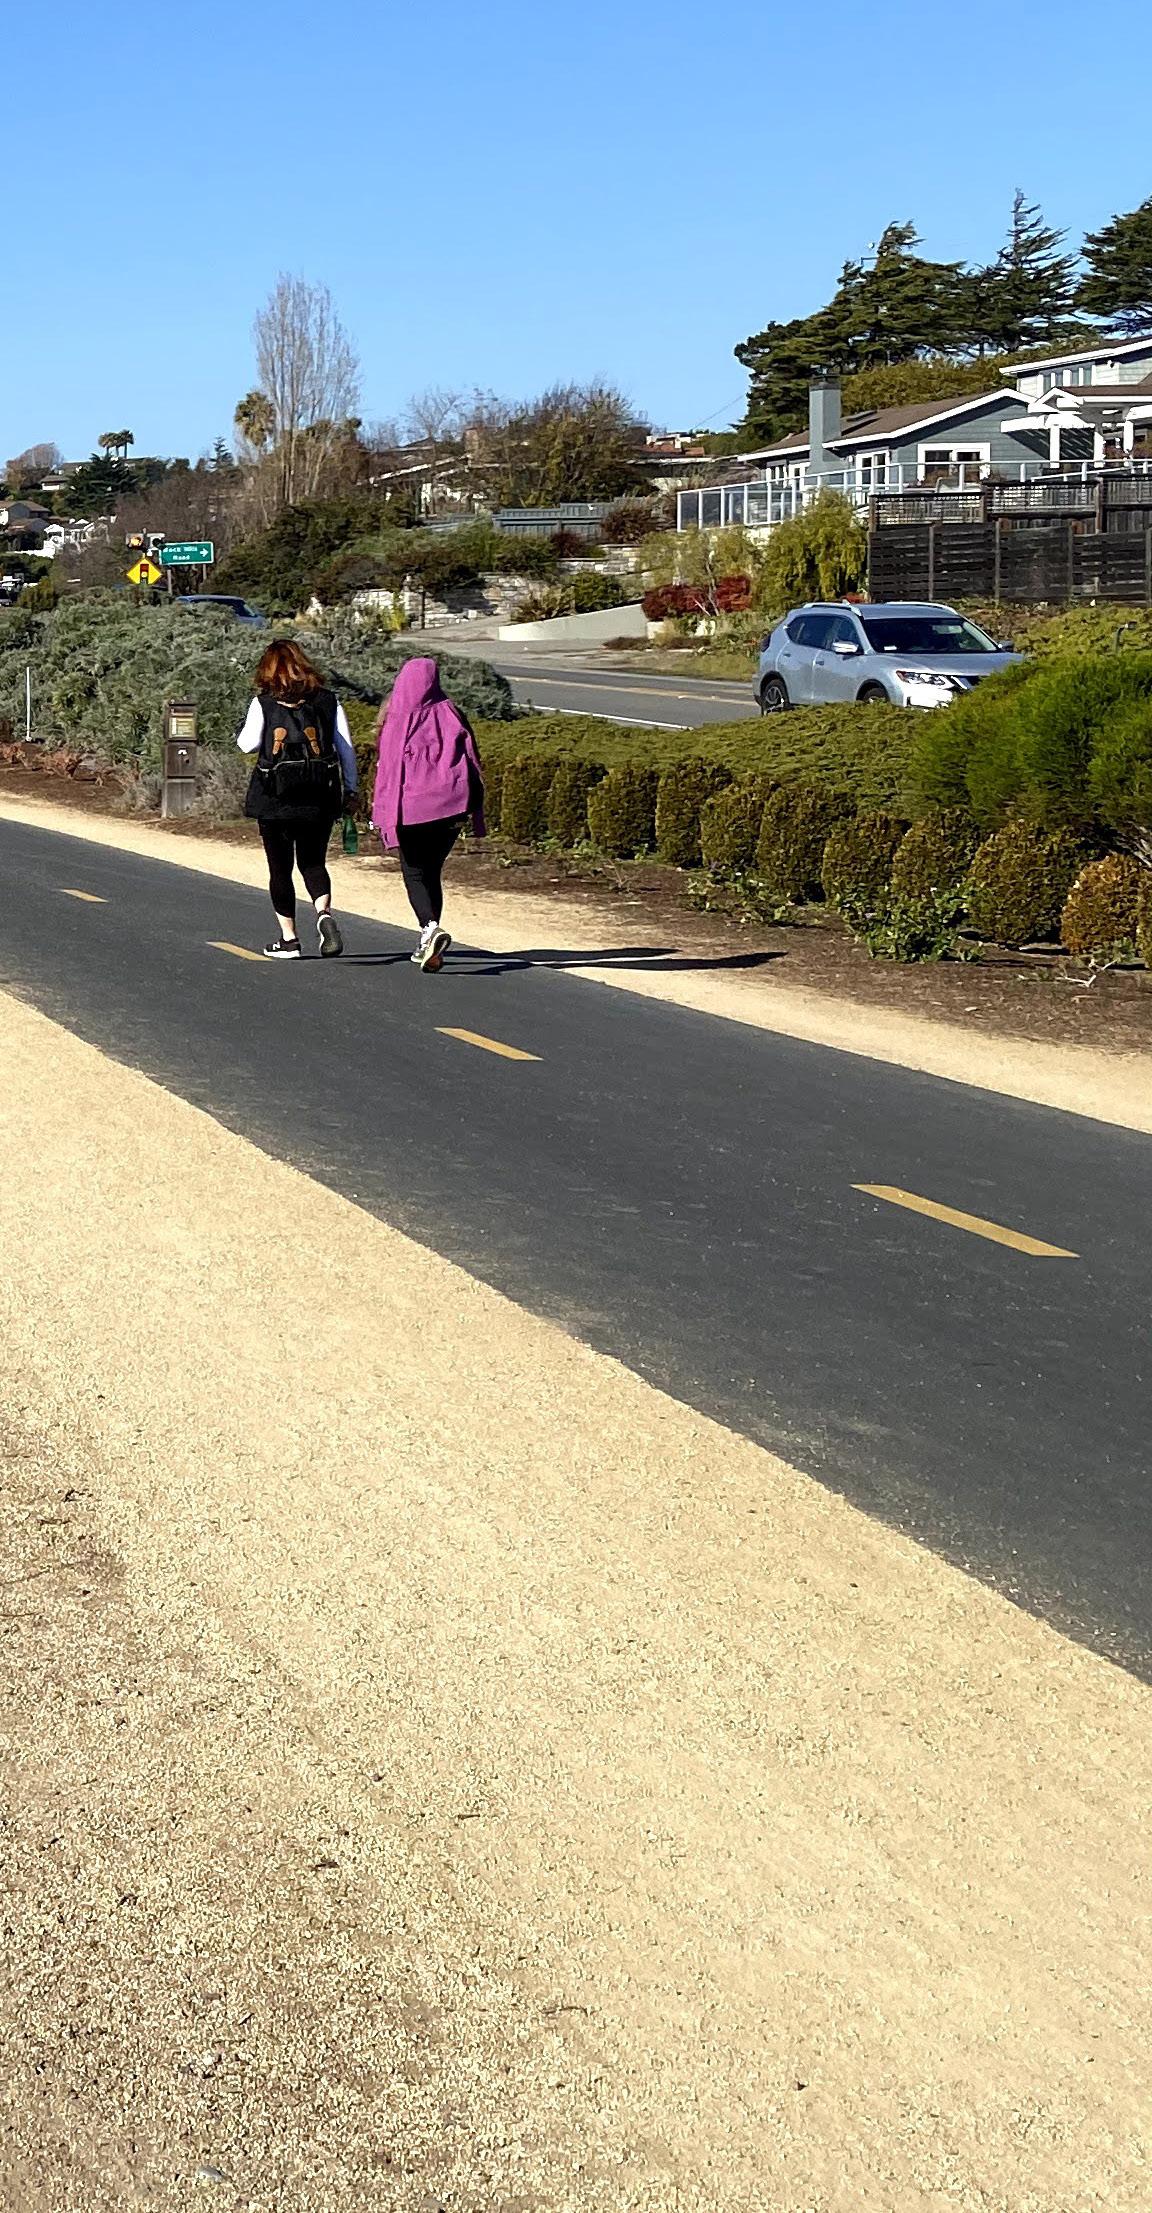
Tiburon recognizes its responsibility to live sustainability and ensure that the earth’s finite resources are used conservatively and, to the extent possible, are preserved for future generations. Tiburon seeks to create and maintain the conditions which humans and nature can co-exist in productive harmony while continuing to prosper and maintain a high quality of life. Planning is crucial to ensure new development uses renewable energy sources and sustainable building materials and has the smallest impact possible on the climate. This chapter presents a framework for governing future decisions about how the Town will provide a sustainable community. The Sustainability chapter includes the following sections.
8.2 Sustainability. Describes the concept of sustainability and the ecological footprint.
8.3 Climate Change Impacts. Provides an overview of existing and projected climate change impacts in California and Tiburon, including rising temperatures, extreme heat events, wildfire, drought, and storms.
8.4 Greenhouse Gas Emissions and the Climate Action Plan. Describes greenhouse gas emissions and the Town’s actions to quantify and reduce community-wide greenhouse gas emissions.
8.5 Goals, Policies, and Programs. Identifies goals, policies, and programs to create a sustainable community.
In 1987, the United Nations Brundtland Commission defined sustainability as “meeting the needs of the present without compromising the ability of future generations to meet their own needs.” Today, we often think of sustainability as the integration of environmental, social, and economic health and vitality to create thriving, diverse, and resilient communities for this generation and generations to come. The practice of sustainability recognizes how these issues are interconnected and requires a systems approach to addressing complex problems. Similarly, issues related to sustainability are addressed throughout the General Plan. Nonetheless, Chapter 5 Equity, Diversity and Inclusion provides a special focus on social equity, while Chapter 2 Land Use addresses economic development. This chapter
focuses on climate change, while Chapter 9 addresses other dominate environmental issues such as loss of biodiversity, land degradation, and air and water pollution.
One way to measure sustainability is through the “ecological footprint” which measures the demand on and supply of nature. The ecological footprint measures how fast populations consume resources and generate waste and compares that to how fast nature can absorb the waste and generate new resources.¹ If a population’s ecological footprint exceeds the region’s biocapacity, that region runs a biocapacity deficit. Today, more than 80% of the world’s population live in countries that are running ecological deficits. To live within the means of our planet’s resources, the world’s
Ecological Footprint would have to equal the available biocapacity per person on our planet, which is currently 1.6 global hectares. The average American’s ecological footprint is 8.1 global hectares, while the United States’ biocapacity is 3.4 global hectares per person. That means Americans uses more than five times the productive capacity of the planet and more than twice what the United States can sustainably provide for its citizens.
¹ For a more thorough discussion see the Global Footprint Network at www.footprintnetwork.org.
California is already experiencing climate change impacts. Sea levels along the coast of southern and central California have risen about 6 inches over the past century and even moderate tides and storms are now producing extremely high sea levels.² Since 1950, the areas burned by wildfire each year has been increasing, as warming temperatures extend the fire season and low precipitation and snowpack create conditions for extreme, high severity wildfires to spread rapidly. Eighteen of the state’s twenty largest fires have occurred since 2003, and the eight largest fires have occurred since 2017.³ The megafires of 2020, sparked in many cases by lightning strikes, burned over 4 million acres across California.
As temperatures continue to rise, California faces serious climate impacts, including:
• More intense and frequent heat waves
• More intense and frequent drought
• More severe and frequent wildfires
• More severe storms and extreme weather events
• Greater riverine flows
• Shrinking snowpack and less overall precipitation
• Accelerating sea level rise
• Ocean acidification, hypoxia, and warming
• Increase in vector-borne diseases and heat-related deaths and illnesses
• Increase in harmful impacts to vegetation and wildlife, including algal blooms in marine and freshwater environments, spread
of disease-causing pathogens and insects in forests, and invasive agricultural pests.
Overall temperatures are projected to rise substantially throughout this century. In Tiburon, temperatures are expected to rise about 4°F by 2100 if global emissions peak around 2040 and then decline, the so-called “low emissions” scenario. If the world fails to act and we continue the path we are on, temperatures are projected to rise 7°F by the end of the century (the “high emissions” scenario) (Cal-Adapt).
As the climate changes, some of the more serious threats to public health will stem from more frequent and intense extreme heat days and longer heat waves. Extreme heat events are likely to increase the risk of heat-related illness, such as heat stroke and dehydration, and exacerbate existing chronic health conditions. Extreme heat days in Tiburon are expected to increase from 4 days to 11 days under the low
emissions scenario and to as many as 19 days under the high emissions scenario. Higher temperatures will make Marin more vulnerable to wildfire and sea level rise. By the end of the century, sea level is projected to rise 2.4 to 3.4 feet, and possibly as much as 10 feet. At 5 feet of sea level rise, flooding may inundate downtown Tiburon, Blackie’s Pasture and Greenwood Cove, the Cove Shopping Center, and Paradise Cay. Flooding will be even worse during storms, which are expected to increase in frequency and intensity.
As described in Section 11.2 of the Safety + Resilience chapter, the Town’s Local Hazard Mitigation Plan and the Marin County Vulnerability Assessment (2022) adaptation and resilience requirements of Gov’t. Code §65302(g)(4)(A). Section 11.5 discusses sea level rise impacts and adaptation strategies in Tiburon.
² Louise Bedsworth,
“Statewide Summary Report,” in California’s Fourth Climate Change Assessment, publication number: SUMCCCA4-2018-013, 2018, p. 31.
³ Cal Fire, “Top 20 Largest Wildfires,” https://www.fire.ca.gov/media/4jandlhh/top20_acres.pdf, accessed 7/29/22.
The earth’s atmosphere contains a group of naturally occurring gases that maintain a habitable climate. These gases allow sunlight to enter the earth’s atmosphere freely and prevent some of the sun’s heat from exiting the atmosphere. Because of their ability to contain heat, the gases are known as greenhouse gases, or GHGs. Natural levels of GHGs exist in balanced proportion, resulting in steady maintenance of the temperature within earth’s atmosphere. However, emissions of GHGs from human activities, such as electrical production and motor vehicle use, continue to elevate the concentrations of GHGs, upsetting their natural balance. When
GHG concentrations exceed natural concentrations in the atmosphere, the “greenhouse effect” of trapped heat is enhanced, and the phenomenon known as global warming occurs.
The United Nations’ Intergovernmental Panel on Climate Change (IPCC) is responsible for advancing knowledge on human-induced climate change. Its reports play a key role in establishing GHG reduction targets and international agreements to reduce emissions. In 2015, all the members of the United Nations Framework Convention on Climate Change – including the United States, China, India, and the European Union – signed on to the historic “Paris Agreement”. The central aim of the agreement was to strengthen the global response to the threat of climate change by keeping a global temperature rise this century well below 2 degrees Celsius above preindustrial levels and
to pursue efforts to limit the temperature increase even further to 1.5 degrees. Global temperatures have already increased by an average of 1.1 degrees Celsius, or 2 degrees Fahrenheit, since the 19th century as humans have emitted heat-trapping gases into the atmosphere by burning coal, oil, and gas for energy, and cutting down forests. The goal of limiting global temperature increase to no more than 1.5 degrees Celsius above preindustrial levels would require nations to all but eliminate their fossilfuel emissions by 2050, and most are far off-track. The world is currently on pace to warm somewhere between 2 degrees and 3 degrees Celsius this century, experts have estimated. Since 2005, the State of California has responded to growing concerns over the effects of climate change by passing
a series of target-setting legislation and adopting a comprehensive approach to addressing GHG emissions in the public and private sectors. In 2006, the state adopted Assembly Bill 32, which established long-term targets to reduce GHG emissions to 1990 levels by 2020. In 2016, Senate Bill 32 established a goal to reduce statewide emissions 40 percent below 1990 levels by 2030. In 2022, Assembly Bill 1279 set a statewide target to reduce emissions 85 percent below 1990 levels by 2045 and achieve carbon neutrality in that year.
The Town of Tiburon recognizes its vital role in reducing greenhouse gas emissions and adapting to climate change. In 2022, the Town adopted Climate Action Plan 2030 that establishes actions the Town’s government and community can take
to reduce emissions 50 percent below 1990 levels by the year 2030 and put the town on a trajectory to achieve carbon neutrality by 2045.
The Town conducts annual inventories of community-wide greenhouse gas emissions to identify baseline emissions and track progress in meeting reduction targets. The inventories estimate the amount of carbon dioxide, methane, and nitrous oxide that are generated by activities within the Tiburon town limits. These greenhouse gas emissions are weighted according to their global warming potential and totaled as “carbon dioxide equivalents” or CO2e. Emissions at the local government level are typically reported in metric tons, or MTCO2e.
Community emissions are quantified according to these seven sectors:
• The Built Environment –Electricity sector represents emissions generated from the use of electricity in Tiburon homes and commercial, industrial, and governmental buildings and facilities.
• The Built Environment –Natural Gas sector represents emissions generated from the use of natural gas in Tiburon homes and commercial, industrial, and governmental buildings and facilities. Propane used as a primary heating source is also included, although it represents less than 1% of emissions in this sector.
• The Transportation sector includes tailpipe emissions from passenger
vehicle trips originating and ending in Tiburon, as well as a share of tailpipe emissions generated by medium and heavy-duty vehicles and buses traveling on Marin County roads. The sector also includes emissions from Marin Transit and Golden Gate Transit buses a as these vehicles travel within Tiburon’s boundaries. Electricity used to power electric vehicles is embedded in electricity consumption reported in the Built Environment - Electricity sectors.
• The Waste sector represents fugitive methane emissions that are generated over time as organic material decomposes in the landfill. Although most methane is captured or flared off at the landfill, approximately 25% escapes into the atmosphere.
• The Off-Road sector represents emissions from the combustion of gasoline and diesel fuel from the operation of off-road vehicles and equipment used for construction and landscape maintenance.
• The Water sector represents emissions from energy used to pump, treat, and convey potable water from the water source to Tiburon water users.
• The Wastewater sector represents stationary, process and fugitive greenhouse gases that are created during the treatment of wastewater generated by the community, as well as emissions created from electricity used to convey and treat wastewater.
The most recent inventory was conducted for the year 2020.
Community-wide GHG emissions totaled 43,307 MTCO2e in 2020, which is 19 percent below estimated 1990 levels. Emissions by sector are shown in Table S-1. It is important to note that the Town’s GHG emissions inventories are not “consumptionbased” inventories and do not take into account lifecycle emissions that are generated by mining, production, manufacturing, or transport of food and products outside the Town limits, nor do they include certain emissions generated outside the community’s borders, such as airplane travel by residents.
Emissions are projected to increase 7.1 percent between the 2020 and 2030 and to drop slightly by 2040, settling at 46,240 MTCO2e, in the absence of any policies or actions that would
occur to reduce emissions. The forecast is derived by “growing” baseline emissions by forecasted changes in population, number of households, jobs and vehicle miles traveled according to projections developed by the Association of Bay Area Governments and the Metropolitan Transportation Commission.
The Town’s Climate Action Plan 2030 identifies state and local actions and performance targets that, if fully implemented and achieved, will meet the Town’s goal to reduce emissions 50 percent below 1990 levels. The top local actions are as follows:
Electric Vehicles. The plan targets 45 percent of passenger vehicles registered in Marin County to be plugin electric vehicles by 2030. (6,340 MTCO2e)
Electrification of Buildings. The plan includes adoption of ordinances that will require new homes and commercial buildings to be all-electric and replacement of natural gas appliances and heating systems with high-efficient electric versions, including heat pump technology, upon burnout. (2,030 MTCO2e)
Energy Efficiency. The plan includes continued promotion and participation in energy efficiency and conservation programs to reduce energy consumption in the built environment. (1,170 MTCO2e)
Waste Reduction. The plan includes actions to significantly reduce organic waste from landfills. (1,830 MTCO2e)
Community Education. The plan includes actions to educate and motive residents to reduce their carbon
input by participating in the Resilient Neighborhoods program. (960 MTCO2e)
Carbon Offsets. To ensure emissions are reduced 50 percent below 1990 levels by 2030, the Town will consider annually purchasing carbon offsets – preferably in a local program that sequesters carbon in Marin County – in the amount needed to bridge the gap between the GHG reduction achieved in 2030 and the target. (2,260 MTCO2e)
Create a sustainable community that ensures residents may meet their own needs without compromising the needs of future generations.
Reduce greenhouse gas emissions in the community and within government operations to mitigate the effects of climate change.
Mitigate the impacts of climate change by reducing community greenhouse gas emissions.
Program S-a Emissions Reduction Targets.
Implement strategies to achieve reductions in greenhouse gas emissions at least 50 percent below 1990 levels by 2030, and to support the State’s goal to achieve zero net emissions statewide by 2045.
Program S-b Climate Action Plan.
Implement the Town’s Climate Action Plan and periodically update the plan to incorporate new emission reduction targets, strategies, and best practices.
Program S-c Monitoring Emissions.
Periodically update the greenhouse gas emissions inventory for community and government operations emissions to track progress in reducing emissions & implementing the Climate Action Plan.
Program S-d Carbon Offsets.
Explore the purchase of verifiable carbon offsets to help achieve the Town’s greenhouse gas reduction goal.
Program S-e Public Education.
Educate the community on the impacts of climate change and actions individuals and businesses can take to reduce greenhouse gas emissions, shift to renewable energy and zero emission vehicles, reduce waste and water use, and adapt to climate change.
Accelerate the conversion to renewable energy sources.
Program S-f Building and Appliance Electrification. Consider building regulations which preclude gas appliances and infrastructure in new buildings and regulations and require gas appliances to be replaced with high-efficiency electric at burnout.
Program S-g Municipal Energy Use.
Evaluate solar energy production and storage systems at all municipal buildings and facilities and plan for replacement of natural gas appliances and equipment. Continue to purchase 100% renewable energy for Town buildings and facilities.
Program S-h Community Energy Use.
Encourage residents and businesses to install solar energy production and storage systems by streamlining regulations and permit processes, or to purchase 100% renewable energy through energy providers.
Encourage energy efficiency improvements in existing residential and commercial buildings to reduce energy use.
Program S-i Green Building Regulations.
Consider adopting green building regulations for new construction and building remodels and additions that exceed minimum State building and energy code requirements.
Program S-j Energy Efficiency Programs.
Promote programs and incentives to property owners to improve energy efficiency. Consider requiring energy audits at time of building sale or major remodel.
Minimize transportation-related greenhouse gas emissions.
Program S-k Zero Emission Vehicles.
Implement a comprehensive program to significantly increase the use of zero emission vehicles through public education and promotion, adoption of building code requirements for electric vehicle charging facilities in new construction, and installation of Level 2 and 3 public charging facilities.
Program S-l Fleet Vehicle Replacements.
Give priority to electric and zero emissions vehicles, as feasible, when replacing vehicles in the Town’s fleet with the goal of achieving a zeroemissions fleet by 2030.
Strive to meet or exceed waste diversion and food recovery targets set by the state.
Program S-m Business Waste Management Plans.
Require that businesses prepare and implement waste management plans to maximize recycling and food recovery and minimize disposal of organic waste where appropriate as a condition of approval of use permits.
Program S-n Organic Waste Reduction.
Work with the Town’s waste hauler and Zero Waste Marin to develop and implement programs to educate and motivate residents and business owners to increase recycling of materials and food recovery and reduce disposal of organic waste.
Program S-o Construction and Demolition Debris.
Modify the solid waste disposal ordinance to maximize the recovery and recycling of construction debris consistent with the Marin Zero Waste model ordinance.
Maximize recycling, composting, reuse, waste reduction, and food recovery within municipal operations and at public parks and facilities.
Program S-p Recycling Facilities. Provide sufficient recycling and composting bins for public and staff use.
Adopt municipal purchasing procedures to give preference to purchasing products that are recyclable, made from recycled materials, and minimize packaging.
Continue to pursue opportunities to improve energy efficiency and reduce resource consumption in Town-owned facilities and operations.
Apply green building principles to the design, construction, and operation of new Town and Town-sponsored facilities to provide long-term cost savings and to serve as an example for the community.
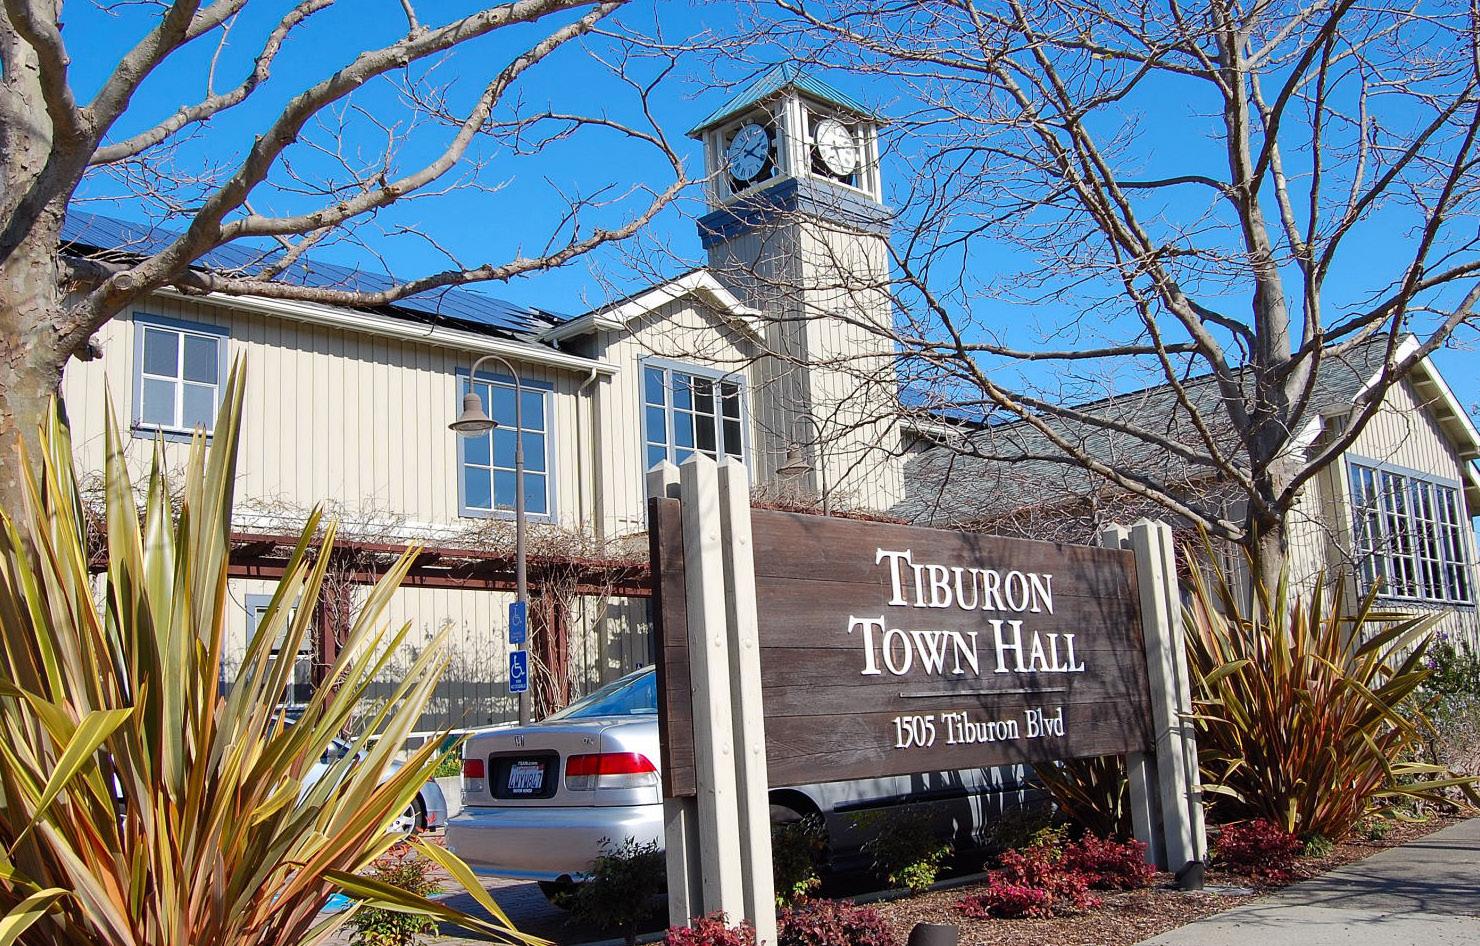
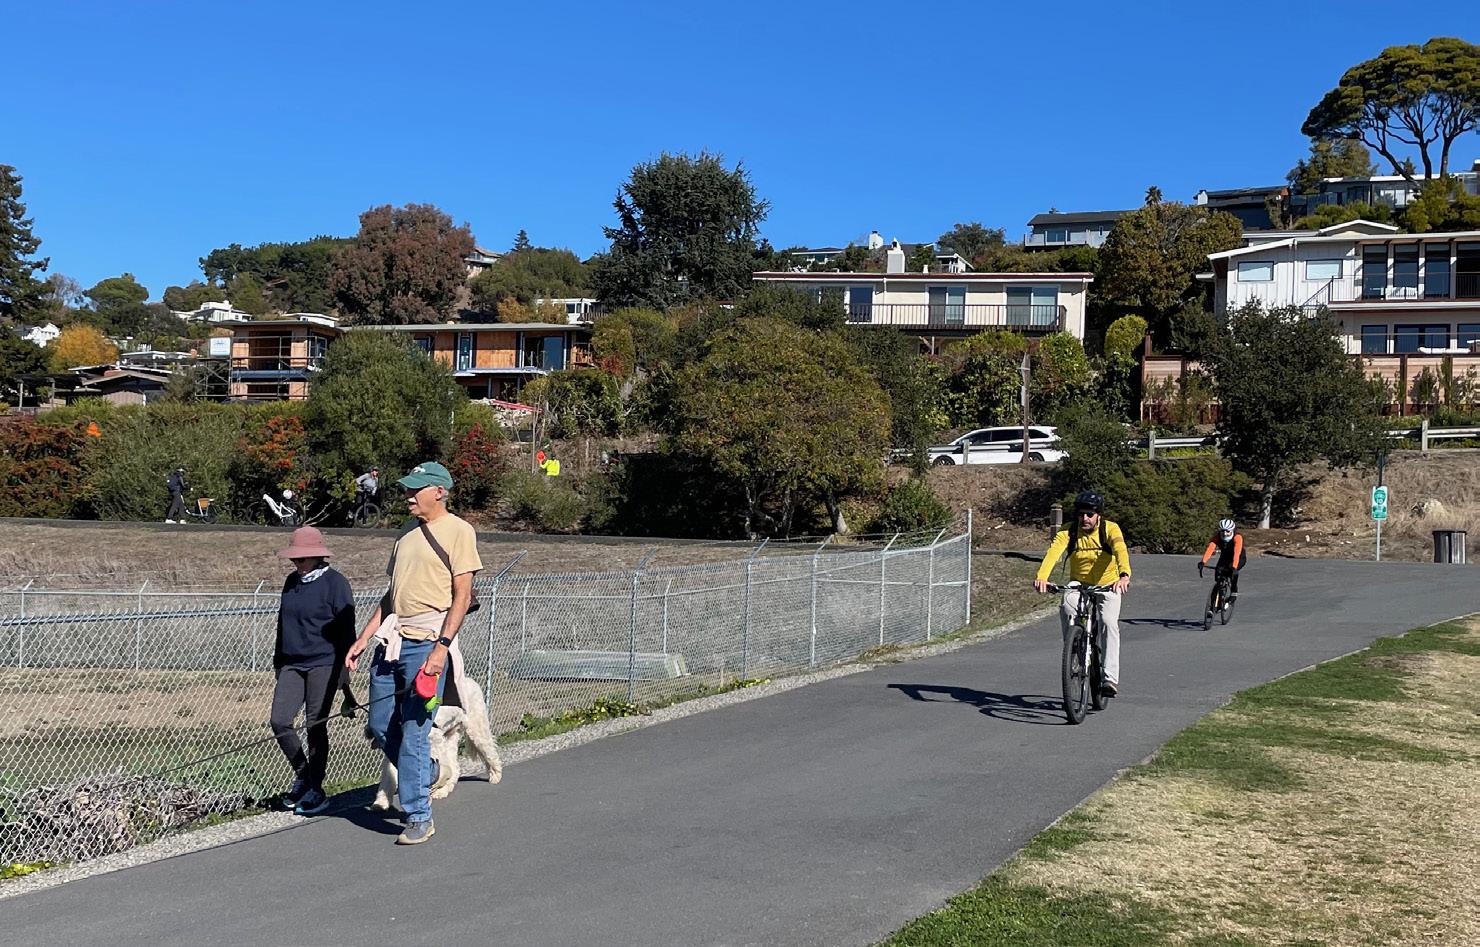
Integrate energy efficiency, conservation, and other green building incentives into the zoning permit and building permit processes.
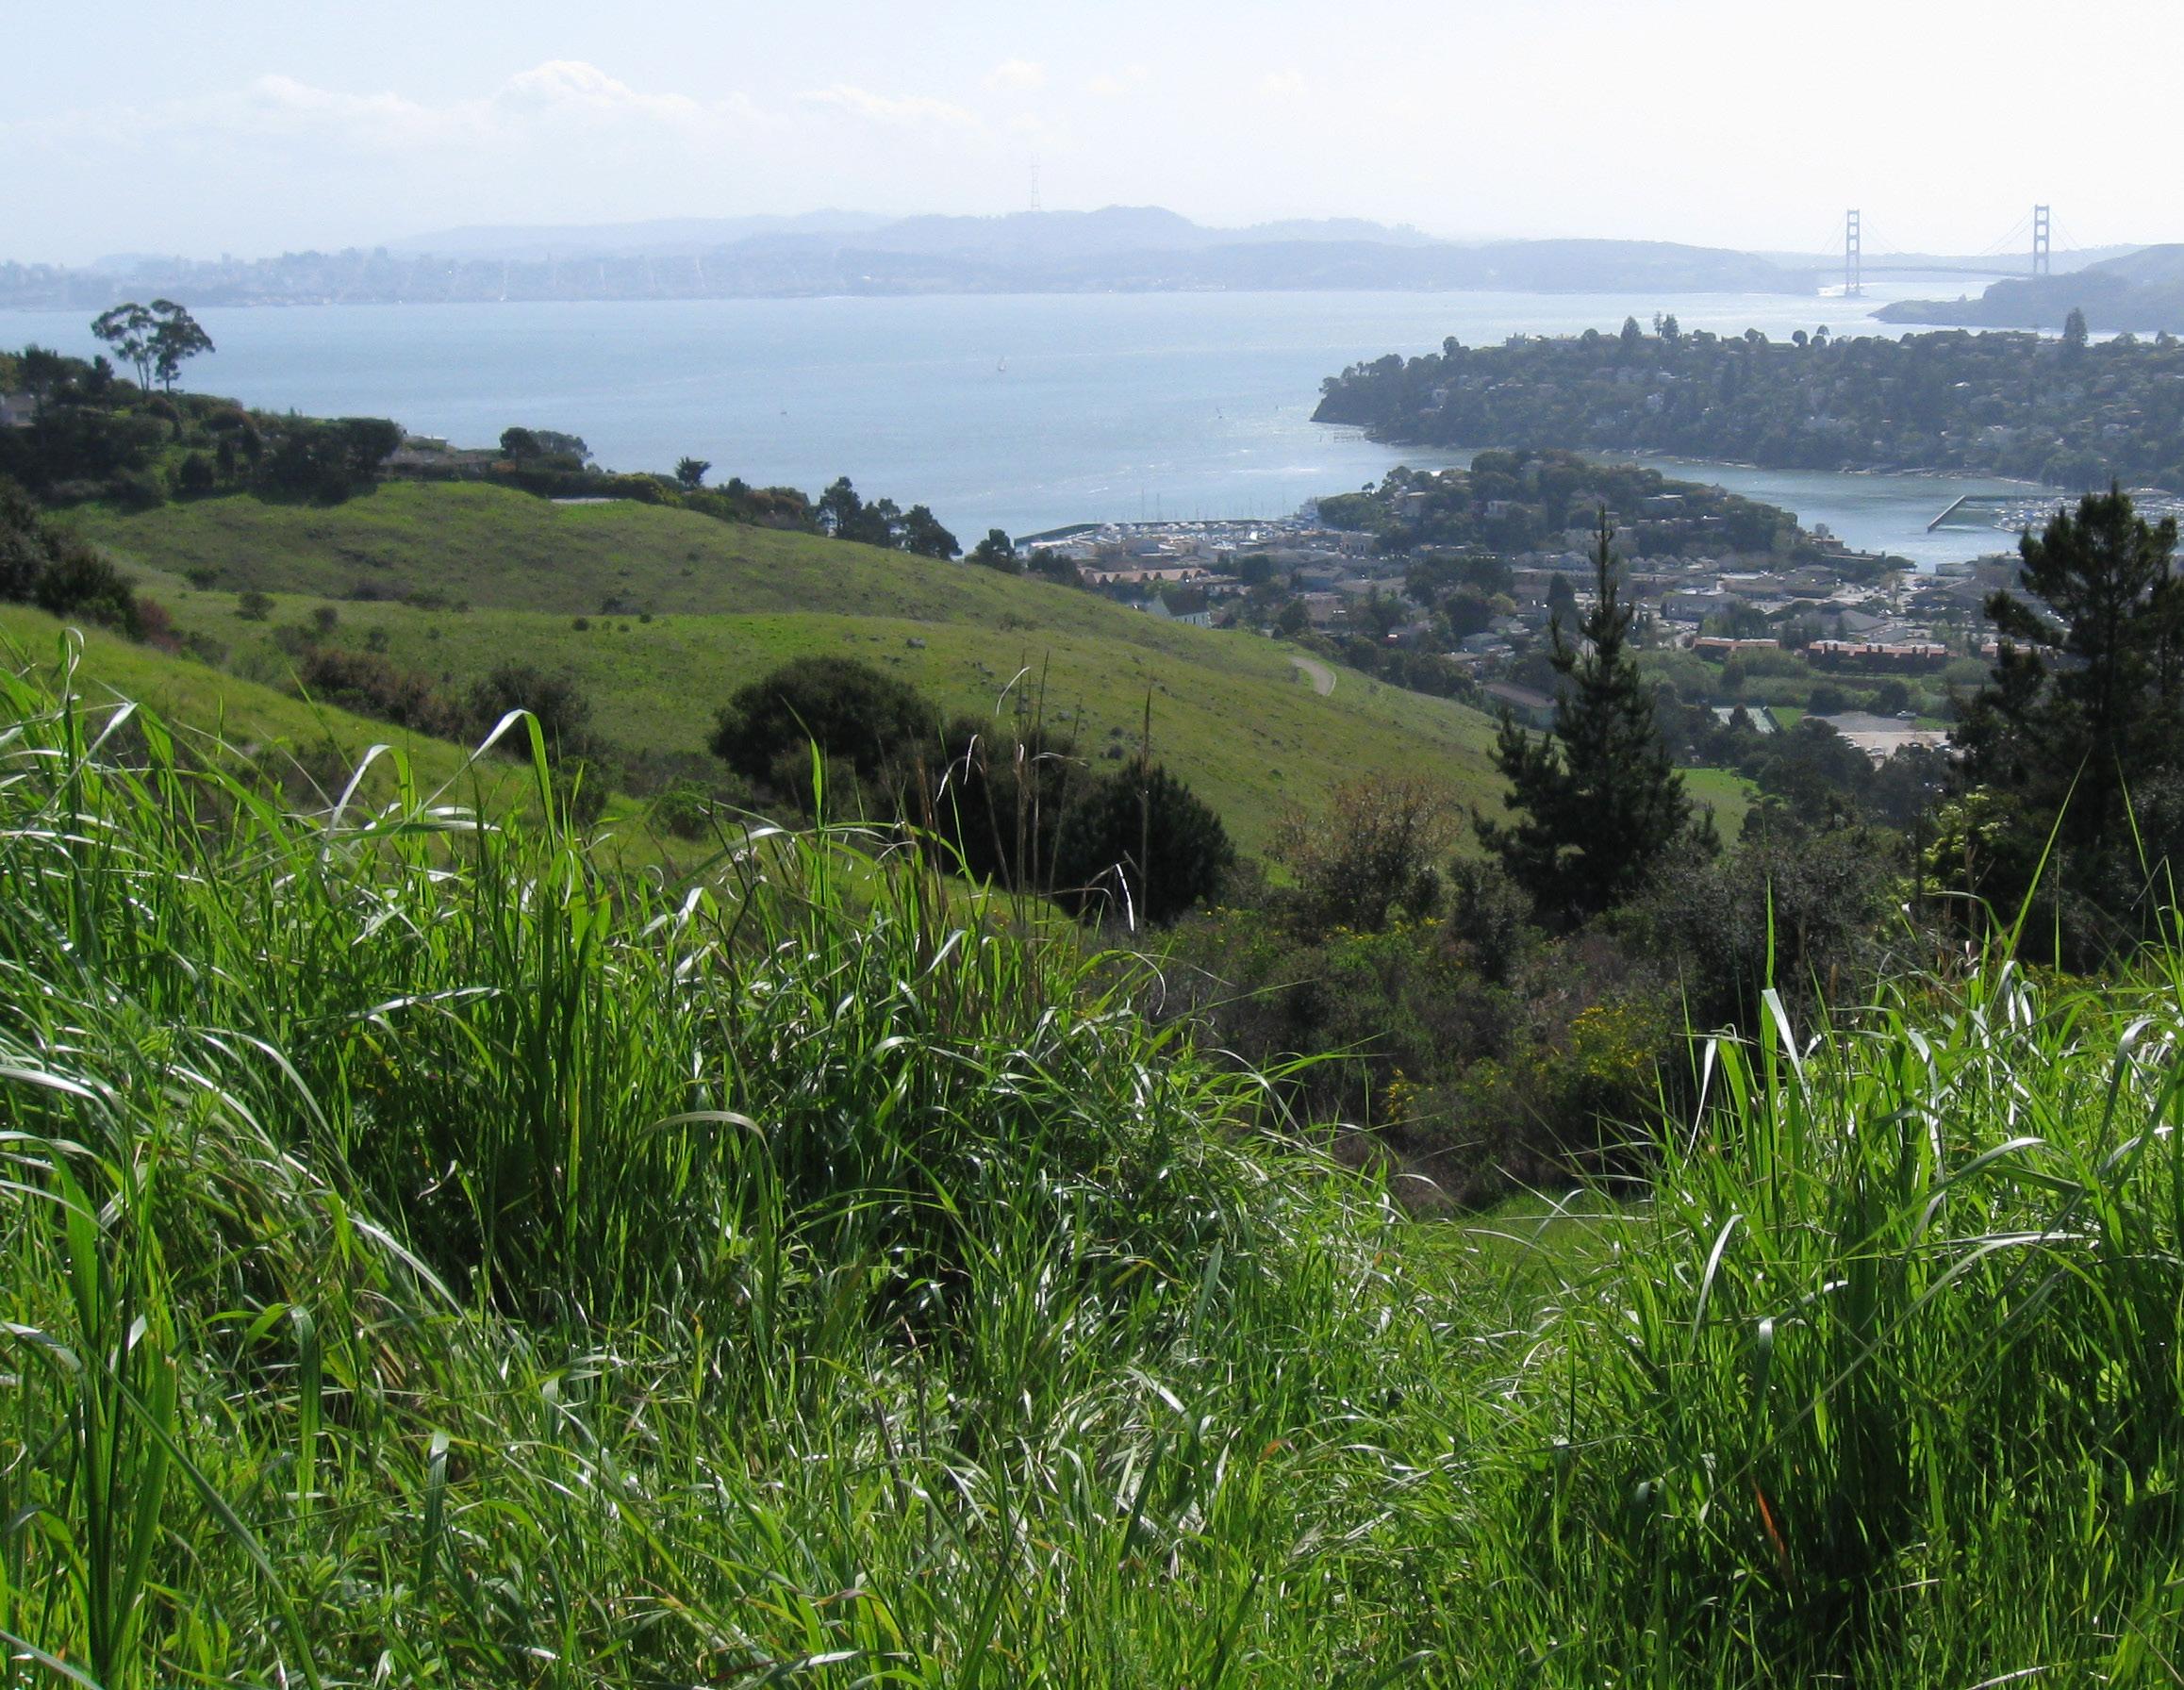
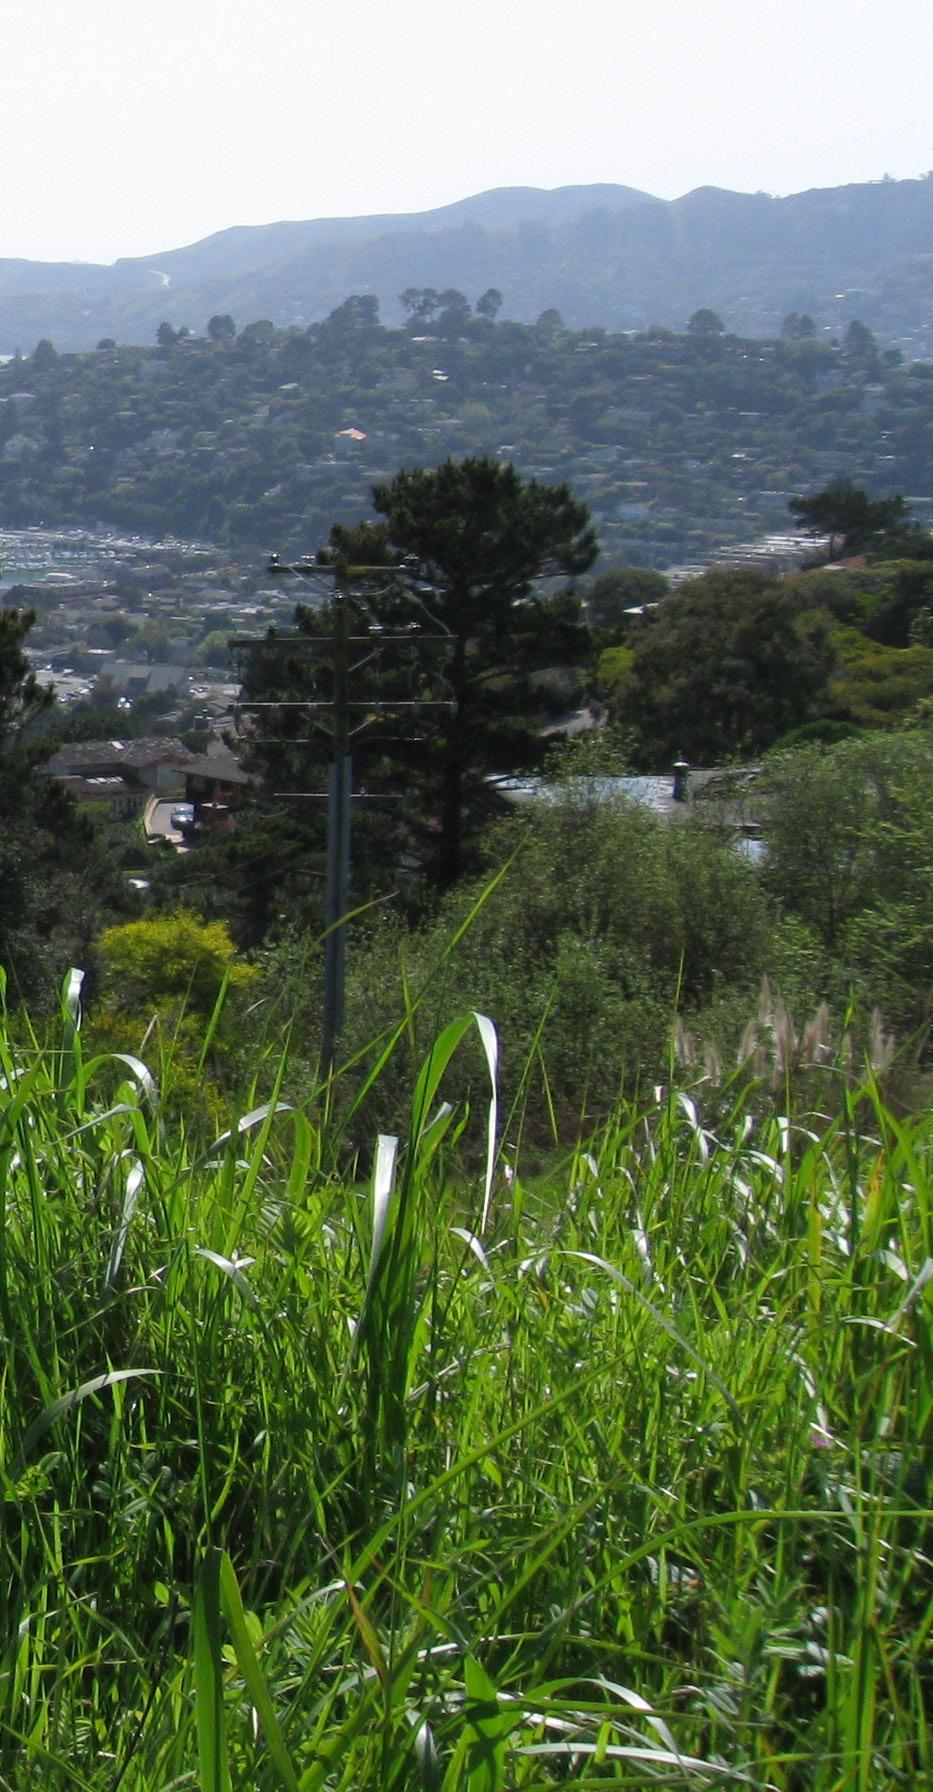
This chapter presents a framework for governing future decisions about how Tiburon will protect, conserve, and maintain natural and cultural resources for today’s residents, as well as future generations. Natural resources are the lands, habitat, wildlife, plants and trees, air, water, and other resources that occur naturally in the environment, undisturbed by humanity. These natural resources can provide biodiversity, agricultural and managed natural resources production, flood risk reduction, protection from hazardous conditions, and climate change mitigation and adaptation. Cultural resources are buildings, sites, structures, or objects that may have historical, architectural, archeological, cultural, tribal, or scientific importance. This chapter addresses the state requirements for the conservation elements of the general plan.
The Conservation chapter includes the following sections.
9.2 Natural Communities and Ecological Resources. Describes the diverse array of natural habitats in Tiburon, including grasslands, woodlands, wetlands, and developed lands, and the wildlife and plants that occur in the Tiburon vicinity.
9.3 Watersheds and Waterways. Provides an overview of Tiburon’s watersheds and creeks.
9.4 Water Resources. Presents an overview of water resources, supplies, and demand.
9.5 Water Quality. Describes pollutants impacting streams, wetlands and the Richardson and San Francisco Bays and measures to protect water quality for wildlife and natural habitats.
9.6 Air Quality. Describes air quality and pollutants in the Tiburon area.
9.7 Cultural and Historical Resources. Provides an overview of Tiburon’s history and describes archaeological, cultural, and historical resources.
9.8 Goals, Policies, and Programs. Identifies goals, policies, and programs to protect and conserve natural, cultural, and historical resources.
Tiburon is located in the San Francisco Bay bioregion, one of at least ten bioregions in California. The bioregion is one of the most populous areas of the state, stretching from Point Arena to the Santa Cruz Mountains and extending from the continental shelf to the delta of the Sacramento and San Joaquin Rivers. The habitats and vegetation of the bioregion are as varied as the geography. San Francisco Bay is the largest estuary on the Pacific coast and includes marshlands and mudflats that provide food and shelter for over 1,000 species of animals, including threatened and endangered species. The water that flows through the Delta sustains fish and wildlife, irrigates farmland, and provides fresh water to two-thirds of the state’s population.
Population growth and urban development have resulted in habitat
loss and fragmentation and the loss of biological diversity in the estuary. Reduced flows of freshwater from the Sierra and water diversions for agriculture have affected fish and waterfowl habitat. Pollution from wastewater treatment plants, oil refineries, and agriculture also impacts biological resources. Urban development continues to threaten the remaining wildlands and habitat of the bioregion and exacerbate air and water quality problems.
Vegetation occurring within the Tiburon planning area primarily consists of ruderal (a plant species that is the first to colonize disturbed lands), riparian, landscaping, and agricultural vegetation. Because of the urban nature of the developed areas within Tiburon, there is limited undisturbed natural vegetation.
Agricultural and ruderal vegetation in the planning area provides habitat for both common and special-status wildlife populations. Some commonly
observed wildlife species in the region include California ground squirrel, California vole, black-tailed deer, coyote, raccoon, opossum, striped skunk, red-tailed hawk, northern harrier, American kestrel, white-tailed kite, American killdeer, gopher snake, garter snake, and western fence lizard, as well as several bat species and many native insect species.
Locally common and abundant wildlife species are important components of the ecosystem. Due to habitat loss, many of these species must continually adapt to using agricultural, ruderal, and ornamental vegetation for cover, foraging, dispersal, and nesting. Wildlife movement corridors, which connect populations of wildlife otherwise fragmented by urbanization, are essential to the survival of many species. In Tiburon, riparian habitat, streams, and foothill access serve as important wildlife movement corridors.
The Richardson Bay Audubon Center & Sanctuary is a wildlife refuge located
in the Planning Area along Richardson Bay and is comprised of 10.5 acres of uplands and 900 acres of subtidal bay. The sanctuary provides vital habitat for migratory waterbirds and other wildlife.
The majority of the land within the Tiburon town limits is developed with urban land uses, as shown in Figure C-1. Annual and perennial grasslands and coastal scrub dominate Ring Mountain Preserve, Old St. Hilary’s Preserve, and the uplands and ridge of the peninsula. Coastal Oak woodlands are found primarily on the north side of the ridge along Paradise Drive and the north side of Angel Island, while stands of eucalyptus exist throughout the peninsula and on Angel Island.
Special-status species are those plants and animals that, because of their recognized rarity or vulnerability to various causes of habitat loss or
Town Of Tiburon
Tiburon Sphere of Influence
Tiburon Planning Area
Annual Grassland
Perennial Grassland
Coastal Oak Woodland
Valley Oak Woodland
Valley Foothill Riparian
Closed-Cone Pine-Cypress
Montane Hardwood-Conifer
Coastal Scrub
Eucalyptus
Fresh Emergent Wetland
Saline Emergent Wetland
Wet Meadow
Lacustrine
Water
Barren
Urban
population decline, are recognized by federal, state, or other agencies. Some of these species receive specific protection that is defined by federal or State endangered species legislation. Others have been designated as “sensitive” on the basis of adopted policies and expertise of State resource agencies or organizations with acknowledged expertise. The California Natural Diversity Database identifies 64 plant and 45 animal special status species within five miles of the Tiburon planning area.
Plant and animal species identified as endangered under the Federal Endangered Species Act are in danger of extinction within the foreseeable future throughout all or a significant portion of its range. Threatened species are likely to become endangered species in the foreseeable future throughout all or a significant portion of its range. Both endangered and threatened species are fully protected from a “take” unless a take permit is issued by the United States Fish and
Wildlife Service. A take is defined as the harassing, harming, pursuing, hunting, shooting, wounding, killing, trapping, capturing, or collecting of a wildlife species or any attempt to engage in such conduct, including modification of its habitat. Proposed endangered or threatened species are those species for which a proposed regulation, but not a final rule, has been published in the Federal Register. Federal laws also protect migratory birds, including their nests and eggs, and bald and golden eagles.
The California Endangered Species Act protects certain plant and animal species when they are of special ecological, educational, historical, recreational, aesthetic, economic, and scientific value to the people of the state. There are three listing categories for species under the Act: endangered, threatened, and rare. The rare classification is provided to native plant species when, although not presently threatened with extinction, it is in such small numbers throughout its range that
it may become endangered if its present environment worsens.
Table C-1 identifies special status species known or suspected within five miles of the Tiburon planning area. Endangered species include the California Ridgway’s rail, the tidewater goby, the salt-water harvest mouse, and a number of plant species including the Tiburon jewelflower. A full list of all special status species is available in the General Plan Existing Conditions Report.
The California Department of Fish and Wildlife (CDFW) considers sensitive natural communities to have significant biotic value, with species of plants and animals unique to each community. There are four sensitive natural communities within 15 miles of Tiburon, as shown on Figure C-2. These include coastal brackish marsh, salt
marshes where a significant freshwater influx dilutes the seawater to brackish levels of salinity; coastal terrace prairie, a grassland plant community found along the Pacific Coast; and northern coastal salt marsh, a non-tidal, nonforested wetland that is continuously or frequently flooded and contains saltwater; and serpentine bunchgrass. All of these community types were once more widely distributed throughout California, but have been modified or destroyed by grazing, cultivation, and urban development. Since the remaining examples of these sensitive natural communities are under continuing threat from future development, CDFW considers them “highest inventory priorities” for future conservation.
Table C-1
SPECIAL-STATUS ANIMAL AND PLANT SPECIES PRESENT OR POTENTIALLY PRESENT IN THE TIBURON VICINITY
COMMON NAME SCIENTIFIC NAME
AMPHIBIANS
California red-legged frog Rana draytonii
BIRDS
California black rail Laterallus jamaicensis coturniculus
California Ridgway’s rail Rallus obsoletus
FISH
Euchalon Thaleichthys pacificus
Longfin smelt Spirinchus thaleichthys
Tidewater goby Eucyclogobius newberryi
INSECT
FEDERAL LISTING CATEGORY (USFWS) STATE LISTING CATEGORY (CDFW)
COMMON NAME SCIENTIFIC NAME
PLANTS Calochortus tiburonensis
FEDERAL LISTING CATEGORY (USFWS) STATE LISTING CATEGORY (CDFW)
Presidio clarkia Clarkia franciscana E
Presidio manzanita Arctostaphylos montana ssp. ravenii
San Fransisco lessingia Lessingia germanorum E E
San Francisco popcornflower Plagiobothrys diffusus –
Santa Cruz tarplant Holocarpha macradenia T
Tiburon mariposa lily Calochortus tiburonensis T T
Tiburon jewelflower Streptanthus glandulosus ssp. niger
Tiburon paintbrush Castilleja affinis var. neglecta
Western bumble bee Bombus occidentalis –
MAMMALS
Salt-marsh harvest mouse Reithrodontomys raviventris
Southern sea otter Enhydra lutris nereis
PLANTS Calochortus tiburonensis
Beach lavia Lavia carnosa
Franciscan manzanita Arctostaphylos franciscana
Marin western flax Hesperolinon congestum
Marsh sandwort Arenaria paludicola
North Coast semaphore grass Pleuropogon hooverianus
Two-fork clover Trifolium amoenum
White-rayed pentachaeta Pentachaeta bellidiflora
Listed species are reported by the California Natural Diversity Database (CNDDB) species to occur or suspected to occur within five miles of the Tiburon planning area, 2022.
USFWS = U.S Fish and Wildlife Service; CDFW = California Department of Fish and Wildlife Status Designations
E = Listed as “endangered” under the federal Endangered Species Act
T = Listed as “threatened” under the federal Endangered Species Act
C = A species that has been studied by the USFWS, and the Service has concluded that it should be proposed for addition to the federal endangered or threatened species list.
CE = Proposed for State listing as “endangered”
CT = Proposed for State listing as “threatened”

It may be found in the Tiburon area and is a threatened species.
Tiburon mariposa lily is a threatened plant species only known to occur at the Ring Mountain Preserve. Source: CNPS Rare Plant Image Collection © Rick York and CNPS
Tiburon jewelflower is an endangered plant that grows on the shallow, rocky serpentine soils on southwest facing slopes of the Tiburon Peninsula. Source: CNPS Rare Plant Image Collection © Rick York and CNPS


A watershed is a region that is bounded by a divide that drains to a common watercourse or body of water. Watersheds serve an important biological function, often supporting an abundance of aquatic and terrestrial wildlife including special-status species and anadromous and native local fisheries. Watersheds also provide fresh water for domestic and agricultural use and enjoyment of natural resources
Tiburon is located within three major watersheds as shown in Figure C-3: Angel Island-San Francisco Bay
Estuaries, Arroyo Corte Madera Del Presidio-Frontal San Francisco Bay
Estuaries, and Larkspur Creek-Frontal San Francisco Bay Estuaries. The Town is drained by multiple small watersheds on the north and south sides of the peninsula. Primarily water drains to the Town stormwater drainage system that runs under Tiburon Boulevard and outlets to Raccoon Strait near the Ferry
Terminal, or the secondary outlet which drains south to Belvedere Lagoon. Other portions of Tiburon drain to Railroad Marsh, a pond/marsh feature that serves as a flood control feature.
Tiburon’s creeks are also a key part of the Town’s open space network. They are valuable physical, aesthetic, recreational, and ecological assets. Protection of creeks not only preserves surface water quality, but also reduces flood risks, preserves biodiversity and habitat, minimizes erosion of stream banks, and prevents downstream siltation.
The Marin Municipal Water District (Marin Water) provides water to the Town of Tiburon as well as the incorporated cities and towns of San Rafael, Mill Valley, Fairfax, San Anselmo, Ross, Larkspur, Corte Madera, Belvedere and Sausalito and communities in unincorporated areas of Marin County. Marin Water’s primary water supply is local surface water obtained from rainfall collected from a watershed with six reservoirs. The Marin Water receives a supplemental water supply from the Sonoma County Water Agency, which comes primarily from Lake Sonoma via the Russian River.
Every five years Marin Water prepares an Urban Water Management Plan (UWMP) to ensure the efficient use of available water supplies. The 2020 UWMP determines the existing baseline water consumption; establishes water use targets; describes and evaluates historical and projected water use; evaluates current and projected water supply and reliability; describes and
evaluates demand management measures; and provides a water shortage contingency plan. According to Marin Water’s 2020 UWMP, projected water supplies are sufficient to meet projected water demand through 2045 in a normal year as well as in multiple dry years.
However, the 2020 UWMP does not take into account increases in population that would result if all jurisdictions within Marin Water's service area meet the Regional Housing Need Allocation assigned to them for the 2023-2031 planning period. The next update of the UWMP will address this issue.
Marin Water also prepared the Water Resources 2040 plan to evaluate resiliency in the face of a variety of threats to water resources in its service area, including earthquakes, drought, climate change, wildfire, landslides, and water quality issues, and to identify options to enhance resiliency for its customers. Based on the results of the
Town Of Tiburon
Tiburon Sphere of Influence
Tiburon Planning Area
Watersheds

Angel Island-San Francisco Bay Estuaries
Arroyo Corte Madera Del PresidioFrontal San Francisco Bay Estuaries
Larkspur Creek-Frontal San Francisco Bay Estuaries
Redwood Creek-Frontal Pacific Ocean
Richardson Bay-San Francisco Bay
Hydrography
Artificial Path or Connector
Ephemeral Stream (rain-dependent)
Intermittent Stream (seasonal)
Lake or Pond
Reservoir
Swamp or Marsh
simulated reliability threats, the Water Resources Plan 2040 recommends actions that Marin Water should take to increase the water supply resiliency, including increased water conservation, investing in watershed management, and exploring groundwater partnering opportunities. No groundwater basins are identified within the Tiburon planning area.
Water is also an environmental resource because of its effects on wildlife and habitat. Two general types of pollutant discharges affect the quality of surface water in the Tiburon area:
• Discharge from a pipe or other device directly into the receiving waters, such as treated wastewater from a sewer plant or an industrial building. These sources can be managed through periodic monitoring and treatment methods.
• Stormwater runoff that has drained from streets, parking lots, roofed structures, farms, and minor watercourses before it reaches a major creek, river, or other water body. This runoff can contain debris, litter, soil, and other natural and man-made pollutants. Typical pollutants include organic materials that contribute to biochemical oxygen demand, suspended solids, pathogens, sediment from construction and erosion, air pollution fall-out, gasoline
additives, oil and grease, nitrogen and phosphorus from chemical fertilizers, animal waste, leached acids from leaves, and pesticides. These pollutants come from a variety of sources, including pet waste, lawn fertilization, cars, construction sites, illegal dumping and spills, and pesticide application. Once pollutants from surface runoff reach the receiving waters, they can cause water quality problems similar to those found in municipal and industrial point source discharges. Where rain falls on paved surfaces, a much greater amount of runoff is generated compared to runoff from the same storm falling over a vegetated area. These large volumes of water are swiftly carried to local streams and wetlands, can cause flooding and erosion, and wash away important habitat for wildlife that live in the stream.
The most critical period for surface water quality is following a rainstorm
which produces significant amounts of drainage runoff into streams at low flow, resulting in poor dilution of contaminates in the low flowing stream. Such conditions are most frequent during the fall at the beginning of the rainy season when stream flows are near their lowest annual levels.
Surface water pollution is also caused by erosion. Excessive and improperly managed grading, vegetation removal, quarrying, logging, and agricultural practices all lead to increased erosion of exposed earth and sedimentation of watercourses during rainy periods. In slower moving water bodies these same factors often cause a buildup of siltation, which ultimately reduces the capacity of the water system to percolate and recharge groundwater basins, as well as adversely affecting both aquatic resources and flood control efforts.
To counteract the impacts of stormwater runoff, Tiburon has adopted regulations that require management of stormwater
for all new development. Stormwater management is the use of specific practices, constructed or natural, to reduce, slow down and/or remove pollutants from stormwater runoff. Stormwater management practices are essentially designed to restore or mimic some of the natural processes provided by the vegetative cover that existed prior to land disturbance. Replacing impervious surfaces with vegetation allows the soil to naturally filter or biodegrade contaminants that would otherwise flow into streams, and wetlands, and the Bay.
State and federal regulations work to protect watershed and recharge areas. In particular, the National Pollutant Discharge Elimination System (NPDES) program and the State Regional Water Quality Control Board
mandate control of urban runoff to eliminate the percolation of pollutants from surface runoff into underground water supplies and open bodies of water. The NPDES program requires the Town to inspect, identify, and prevent illicit discharges such as silt, road debris, oil, or discharges from any residential, commercial or construction area into drains, waterways, and wetlands. Discharges of materials must be processed or eliminated where practical.
San Francisco Bay and Richardson Bay are listed by the San Francisco Bay Regional Water Quality Board as having limited water quality. Pollutants include chlordane, DDT, dieldrin, mercury, selenium, dioxin compounds, furan compounds, PCBs, and invasive species.
Tiburon typically experiences good air quality due to the almost persistent westerly flow of air from the ocean. There are little or no pollution sources to the west of Tiburon. Episodes of high particulate levels can occur in late fall and winter when high pressure over the interior of the western United States (known as the Great Basin High) produces extended periods of light winds and low-level temperature inversions. This condition frequently produces poor atmospheric mixing that results in degraded regional air quality. Air quality may also be compromised by wildfire smoke from around the region, particularly during the dry months.
Tiburon is located within the Bay Area Air Quality Management District (BAAQMD), which is primarily responsible for assuring that national and state standards for air pollutants are attained in the San Francisco Bay Area. BAAQMD is also responsible for adopting and enforcing rules and regulations concerning air
pollutant sources, issuing permits for stationary sources of air pollutants, and monitoring ambient air quality. Areas that do not violate ambient air quality standards are considered to have attained the standard. Violations of ambient air quality standards are based on air pollutant monitoring data and are judged for each air pollutant. The Bay Area does not generally meet national or California standards for ozone and particulate matter. BAAQMD ’s Bay Area 2017 Clean Air Plan contains districtwide control measures to reduce ozone, particulate matter, air toxics, and greenhouse gasses. The Plan notes that Bay Area air quality has improved significantly in recent decades, greatly reducing health effects related to air pollution. Nonetheless, exposure to fine particulate matter (PM2.5) is by far the leading public health risk from air pollution in the Bay Area although communities are disproportionately impacted and there are disparities in health risks.
The closest monitoring station to Tiburon is located in downtown San Rafael, which is the only station in Marin County. Pollutant monitoring results for the years 2017-2019 in San Rafael indicate that air quality standards for particulate matter and ozone have been exceeded in some years. The State standard for respirable particulate matter (PM10) was exceeded four times over the three-year period (vs. 17 times for the Bay Area region) and the federal standard for fine particulate matter (PM2.5) was exceeded 21 times (vs. 37 for the Bay Area). Ozone levels exceeded the State 1-hour and 8-hour standards and the federal 8-hour standard once. The primary sources of these pollutants are wood smoke and local traffic, and their buildup is greatest during the evenings and early morning periods and on cold, stagnant winter evenings when temperature inversions prevent the rise and dispersal of pollutants.
The term ”cultural resources” applies to a variety of natural and humanmade items, including paleontological resources (the fossilized remains of plants and animals), traditional cultural properties (sites with value to Native American communities), and archaeological sites and buildings with historic or architectural significance. Humans are believed to have resided in southern Marin County for the past 13,000 years. According to U.S. Department of Interior, the Coast Miwok first settled the Tomales Bay area between 2,000 and 4,000 years ago. The Coast Miwok occupied what is now Marin County and part of Sonoma County, as far north as the vicinity of Sebastopol. Southern Popo people are also known to have inhabited Marin before colonization. Spanish colonization and the development of missionaries

dramatically changed the Coast Miwok’s ancestral lands and their way of life. In the late 1700s, Coast Miwok were interned in four San Francisco Bay area missions. Forced movement of Coast Miwok to the missions and the determination of the friars to convert the natives to Christianity and destroy all vestiges of their former life, along with epidemic diseases of the whites, dramatically reduced Coast Miwok numbers. By the end of the Spanish occupation, the Coast Miwok population had fallen from 3,000 to between 300 and 500.
The land of the Tiburon Peninsula was first awarded by the Mexican government to John Thomas Reed in 1834 as the Rancho Corte de Madera del Presidio. An Irish sailor, Read had arrived in the area in 1826, and became a Mexican citizen in 1834. His widow and four children applied
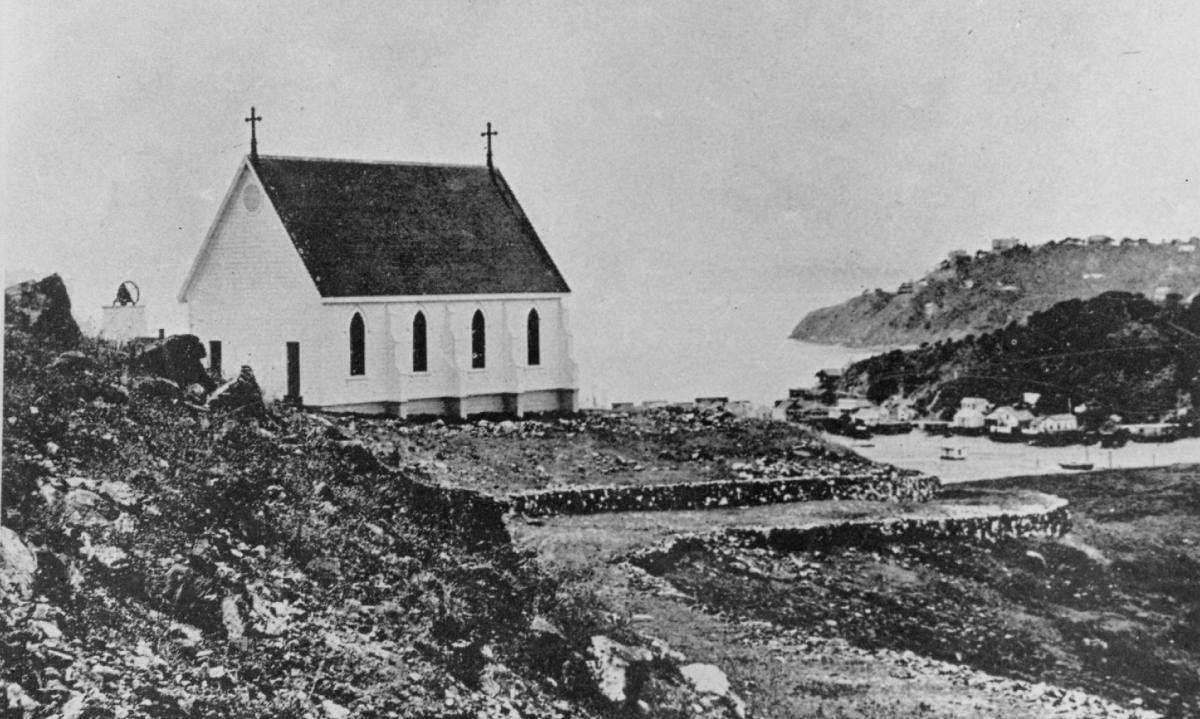
for confirmation of the grant of 7,845 acres; it was finally awarded to the family in 1884. Dairying and cod fishing were two major industries in the area.
In 1882, the Reed family made a deal with Peter Donahue for a right-of-way for the North Pacific Railroad (name later changed to Northwestern Pacific). The railroad company built a railroad yard and ferry terminal, with ferries taking commuters and vehicles to San Francisco and Sausalito. Barges hauled loaded freight cars to San Francisco and Richmond. In the 1970s, the abandoned railroad was removed, and the right-of-way purchased by Tiburon for the waterfront path. The railyards were used for housing and commercial projects.
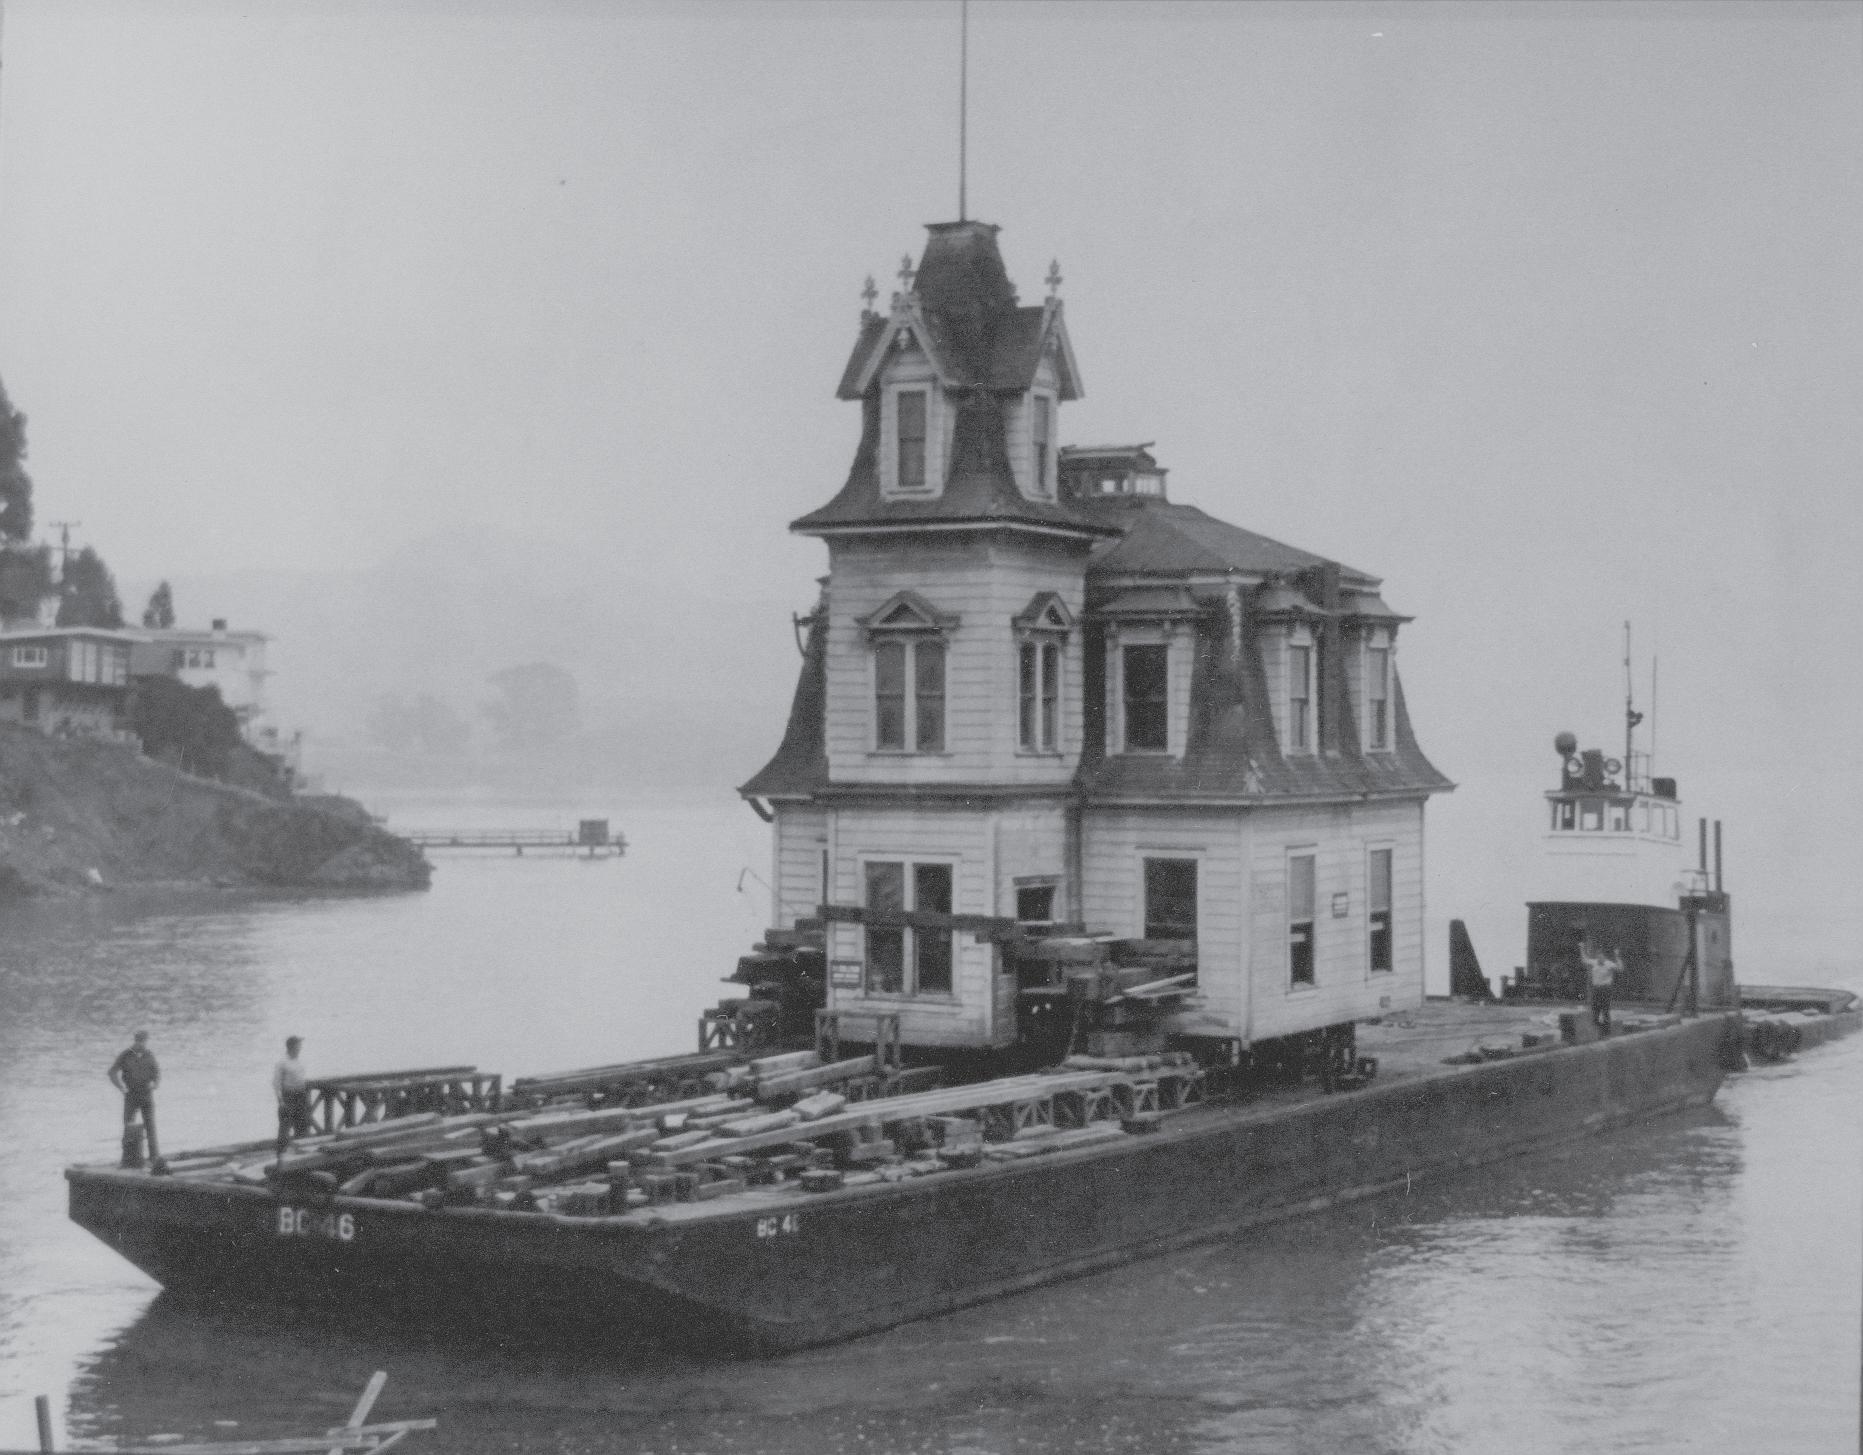
For many years, most of the land of the peninsula was controlled by descendants of the Reed family and used for cattle ranching. Development began after the World War II on smaller tracts. Eventually, the primary
landowners finalized a master plan in 1956.
In 1961, Richardson Bay Audubon Center became established, representing a culmination of a sevenyear local campaign to protect the bay and shoreland from real estate development. This was followed by the dedication of Old St. Hillary’s Historic Preserve, the first hillside open space conserved with wildflower acreage as part of Marin County parks system.
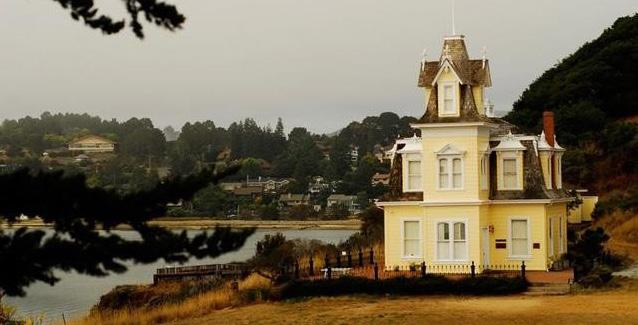
In 1964, the Town of Tiburon was incorporated, and a major preservation effort was launched to revitalize Main Street and Downtown Tiburon.
Surveys have found and recorded a total of 142 cultural resources in the Tiburon planning area, including both prehistoric and historic sites.
Most of the prehistoric period resources were identified in the early part of the 20th century by archeologist Nels Nelson who recorded over 400 shell
Lyford House was the home of Dr. Benjamin Lyford and Hilarita née Reed, the daughter of John Reed. Built in 1876 on Strawberry Point, the house was moved by barge to its present location in 1957. It is now home to the Richardson Bay Audubon Center and Sanctuary. Top photo source: Belvedere-Tiburon Landmarks Society. Bottom photo by @bayareaspaces
mound midden sites along the Bay Area’s shorelines during this period. Many of these shell mound middens were the result of simple shellfish processing and do not possess artifacts or features that indicate habitation, while others are connected with more permanently inhabited prehistoric village sites, some of which continued to be occupied well into the early Spanish Period. In addition to the prehistoric resources identified by Nelson, 11 other prehistoric sites, including prehistoric rock art, habitation, and lithic scatter have been identified in the planning area.
Historic resources include a preponderance of historic period resources relates to Angel Island’s military installations and immigration station, as well as assorted historic foundations, walls, and buildings in the planning area.
The National Register of Historic Places evaluates a historic place based on its connection to an event or person of historic significance; distinctive characteristics of its design or construction; or the information it may yield about our past. Historic listing does not guarantee that a site will be preserved, but is a factor in
environmental review, and can inform local regulations. The National Register lists five properties for the Tiburon planning area. These include:
• Angel Island, U.S. Immigration Station;
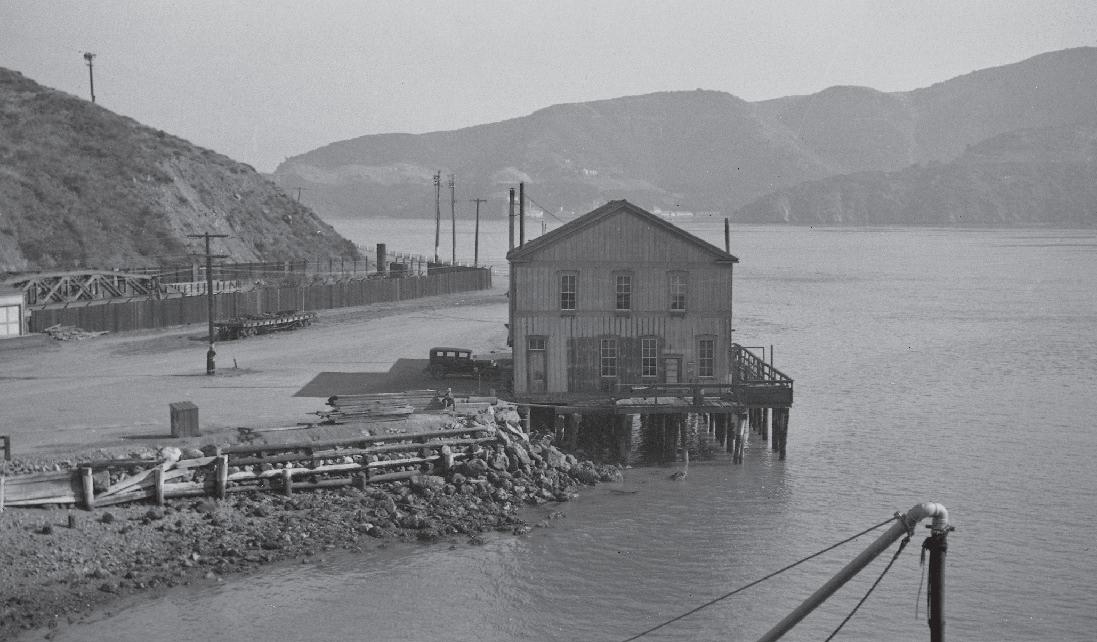
• San Francisco and North Pacific Railroad Station House-Depot (Peter Donahue Building);
• Lyford’s Stone Tower;
• Benjamin and Hilarita Lyford House (Lyford House); and
• St. Hilary’s Mission Church (Old St. Hilary’s Church).
Two historic districts, the Camp Reynolds District and the Angel Island District, are also on record.
In 1999, forty buildings were evaluated for the Downtown Tiburon Historic Resources Study and in 2001 the Town adopted a Local Historic Inventory for Downtown Tiburon including 23 buildings. In 2010, the Town updated the inventory by resolution and removed the Harbor Light Building, 20 Main Street, from the inventory. In 2011, an initial historic evaluation was conducted for the building at 16941696 and found the structure did not possess any characteristics to qualify as a historic resource and the building
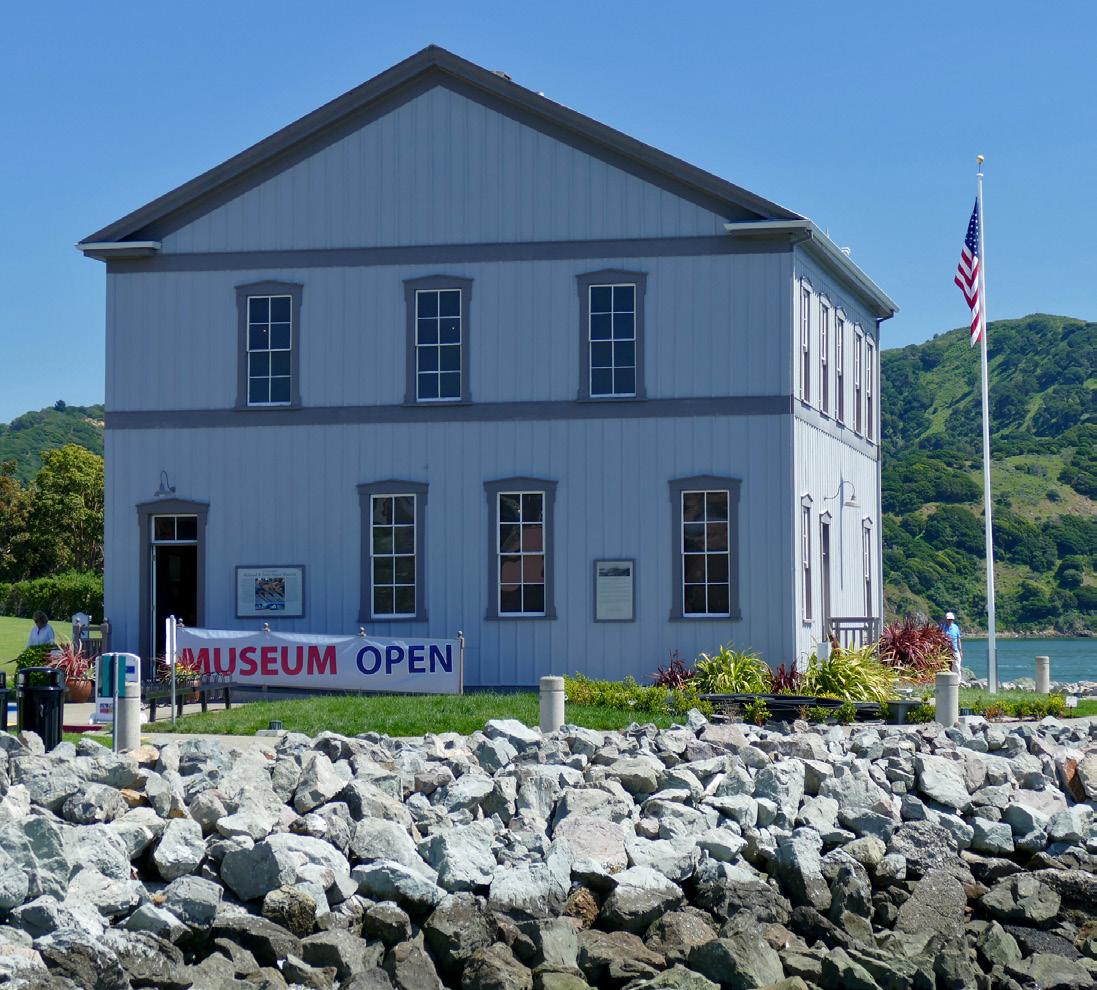
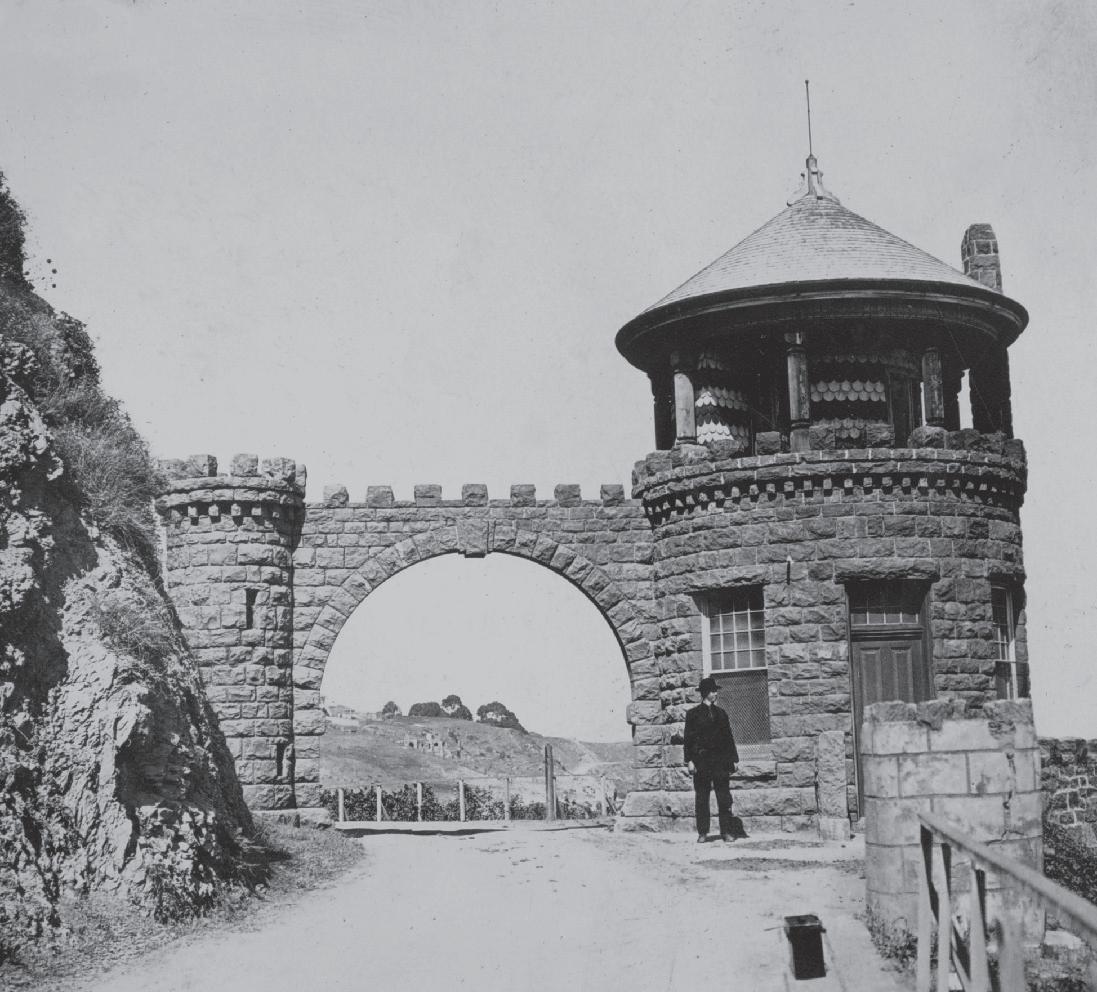
was subsequently removed from the inventory. The remaining resources listed in the local historic inventory are identified in Table C-2 and shown in Figure DT-3 in the Downtown chapter.
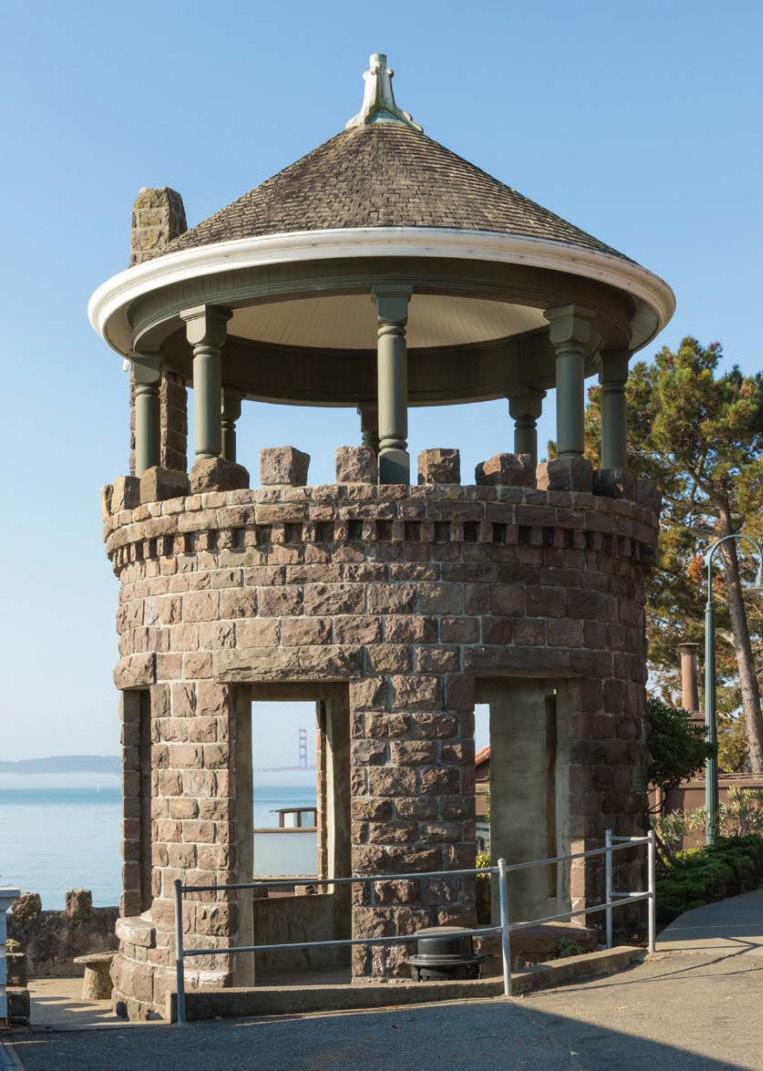
Preserve and improve the quality of the environment through resource restoration and conservation, management, and pollution control.
Limit use of open water areas to landings for boats and ferries; boating, swimming, and fishing; and parks.
Maintenance and replacement of lawfully existing structures built over San Francisco Bay (bayward of the mean high tide line) may be permitted. However, with the exception of piers,
docks, and public access facilities approved by the Bay Conservation and Development Commission (BCDC), expansion of existing structures or construction of new structures that would result in new filling of San Francisco Bay shall be prohibited.
Preserve and enhance the diversity of wildlife and aquatic habitats found in the Planning Area bayfront lands, including tidal marshes, seasonal marshes, lagoons, wetlands, and low-lying grasslands over historical marshlands.
Development shall not encroach into sensitive wildlife habitats, limit normal range areas, or create barriers to wildlife that cut off or substantially impede access to food, water, or
shelter, or cause damage to fisheries or fish habitats. Access to environmentally sensitive marshland and adjacent habitat shall be restricted, especially during spawning and nesting seasons.
Reserve those areas underlain by deposits of “young muds” for waterrelated recreational opportunities, habitat, open space, or limited development subject to approval by the Corps of Engineers and other trustee agencies.
Provide buffer zones of at least 100 feet between development and wetland areas to the maximum extent possible.
Program C-a Wetland and Streamside Regulations. Amend the Zoning Ordinance to incorporate wetland and streamside development setbacks.
Development and construction shall comply with all federal and state regulations regarding jurisdictional waters and wetlands.
Preserve and/or expand freshwater habitats in the bayfront areas associated with freshwater streams and small former marshes so that the circulation, distribution, and flow of the fresh water supply are facilitated.
Require open space buffers of at least 50 feet on each side of the top of the bank of perennial, intermittent, and ephemeral streams on properties less than five acres, and of at least 100 feet on each side of the top of the bank on properties greater than
five acres, to minimize disturbance of natural vegetation and maintain the environmental and scenic attributes of the corridor. Where modification of corridors is required for flood control or crossings, such modification shall be made in an environmentally sensitive manner that enhances, replaces, or retains vegetation.
Avoid construction on lands that are shown to be within the 100-year flood hazard zone as shown on the current FEMA Flood Rate Insurance Map.
Use areas defined as floodplain for habitat and flood protection.
Preserve and protect wildlife, plant, and marine habitat in the open spaces, shoreline, marshes, mudflats, and other biologically sensitive areas to the greatest extent feasible.
Assure new development and construction does not have a significant adverse effect on special-status species or sensitive natural communities to the extent feasible and as regulated by federal and state laws.
Preserve protected trees, as defined in the Municipal Code, tree stands, & tree clusters to the maximum extent feasible.
Program C-b
Consider revising and expanding the Tiburon Tree Ordinance to provide protection of both individual trees and native woodlands. Factors to consider in expanding the current ordinance include the importance of protecting smaller sapling trees and balancing their protection against those of designated “protected trees”, defining critical management guidelines necessary to maintain healthy woodlands, and methods to encourage natural regeneration in woodland habitats.
Protect natural habitat, and natural wooded areas to the maximum extent feasible.
Protect significant geological, ecological, archaeological, tribal cultural, and paleontological resources and historic sites.
Require that projects proposed for sites that have the possibility of containing cultural and tribal cultural resources and resulting in ground disturbance be
evaluated by a qualified archaeologist prior to project approval and require such projects to implement measures to reduce or avoid impacts to any identified or inadvertently discovered cultural and tribal cultural resources. When encountering unanticipated cultural resources, artifacts, or human remains, contractors shall cease construction activities upon until proper authorities have been notified and a mitigation plan is developed.
Preserve and protect structures and properties which have historical, cultural, aesthetic, or other special character or interest to the Town.
Consider adopting an overlay zone for the area containing the Town’s
Inventory of Local Historical Buildings and adopting additional protection measures for the structures identified in the Inventory.
Support the efforts of the Marin Municipal Water District (Marin Water) to conserve the use of water through enforcement of the Town’s water conservation ordinance requiring implementation of water conservation measures.
Where impervious surface construction and storm drain system installation and/or hillside stabilization (e.g., landslide repair) are proposed as part of development proposals, or
wherever such stabilization is required by the Town to protect public safety, require project applicants to analyze the impacts of these drainage pattern modifications on groundwater recharge and on downslope water wells and their yields. In the event impacts are likely, modifications to the proposed project, including possible downsizing, should be implemented to the extent feasible.
Program C-f
Ordinance.
Continue to implement the Town’s water conservation ordinance through the review of new development proposals involving new landscaping.
Coordinate planning activities with Marin Water to ensure that both the Town and Marin Water have the latest information with respect to land use and water supply planning.
Maintain or enhance water quality to promote the continued environmental health of natural waterway habitats.
Continue to be an active member agency of the Marin County Stormwater Pollution Prevention Program (MCSTOPPP) to implement best management practices and to comply with federal and state water quality regulations to reduce pollution being conveyed through storm water systems to the Bay.
Implement the Bay Area Air Quality Management District’s Clean Air Plan by applying BAAQMD’s rules, best control measures ,and best management practices to construction, property maintenance, commercial operations, and other applicable activities.
Program C-h Participate in Emission Reduction Efforts.
Participate in efforts to voluntarily reduce activities that pollute on Spare the Air days and help publicize Spare the Air day activities.
requiring development projects to implement best management practices (BMPs).
Review all development and infrastructure projects for potential air quality impacts to residences, congregate housing, schools, and other sensitive receptors. Ensure that mitigation measures and best management practices are implemented to reduce significant emissions of criteria pollutants to the greatest extent feasible.
Program C-k Emission Reductions.
Require the use of feasible control measures to reduce PM10, NOx, and diesel particulate matter related to development, including construction and operational phases.
C-l
Consider adoption of an ordinance requiring the use of zero emission landscape and small off-road equipment instead of gasoline and diesel-powered equipment in all residential and commercial areas.
Program C-i Reduce
Promote the reduction of particulate matter from construction sites, roads, parking lots, and other sources through
Minimize exposure of sensitive receptors to concentrations of air pollutant emissions, toxic air contaminants, and odors.
Encourage the reduction of the number of single-occupant vehicle trips and cumulative emissions that result from auto use through implementation of Mobility Element policies.
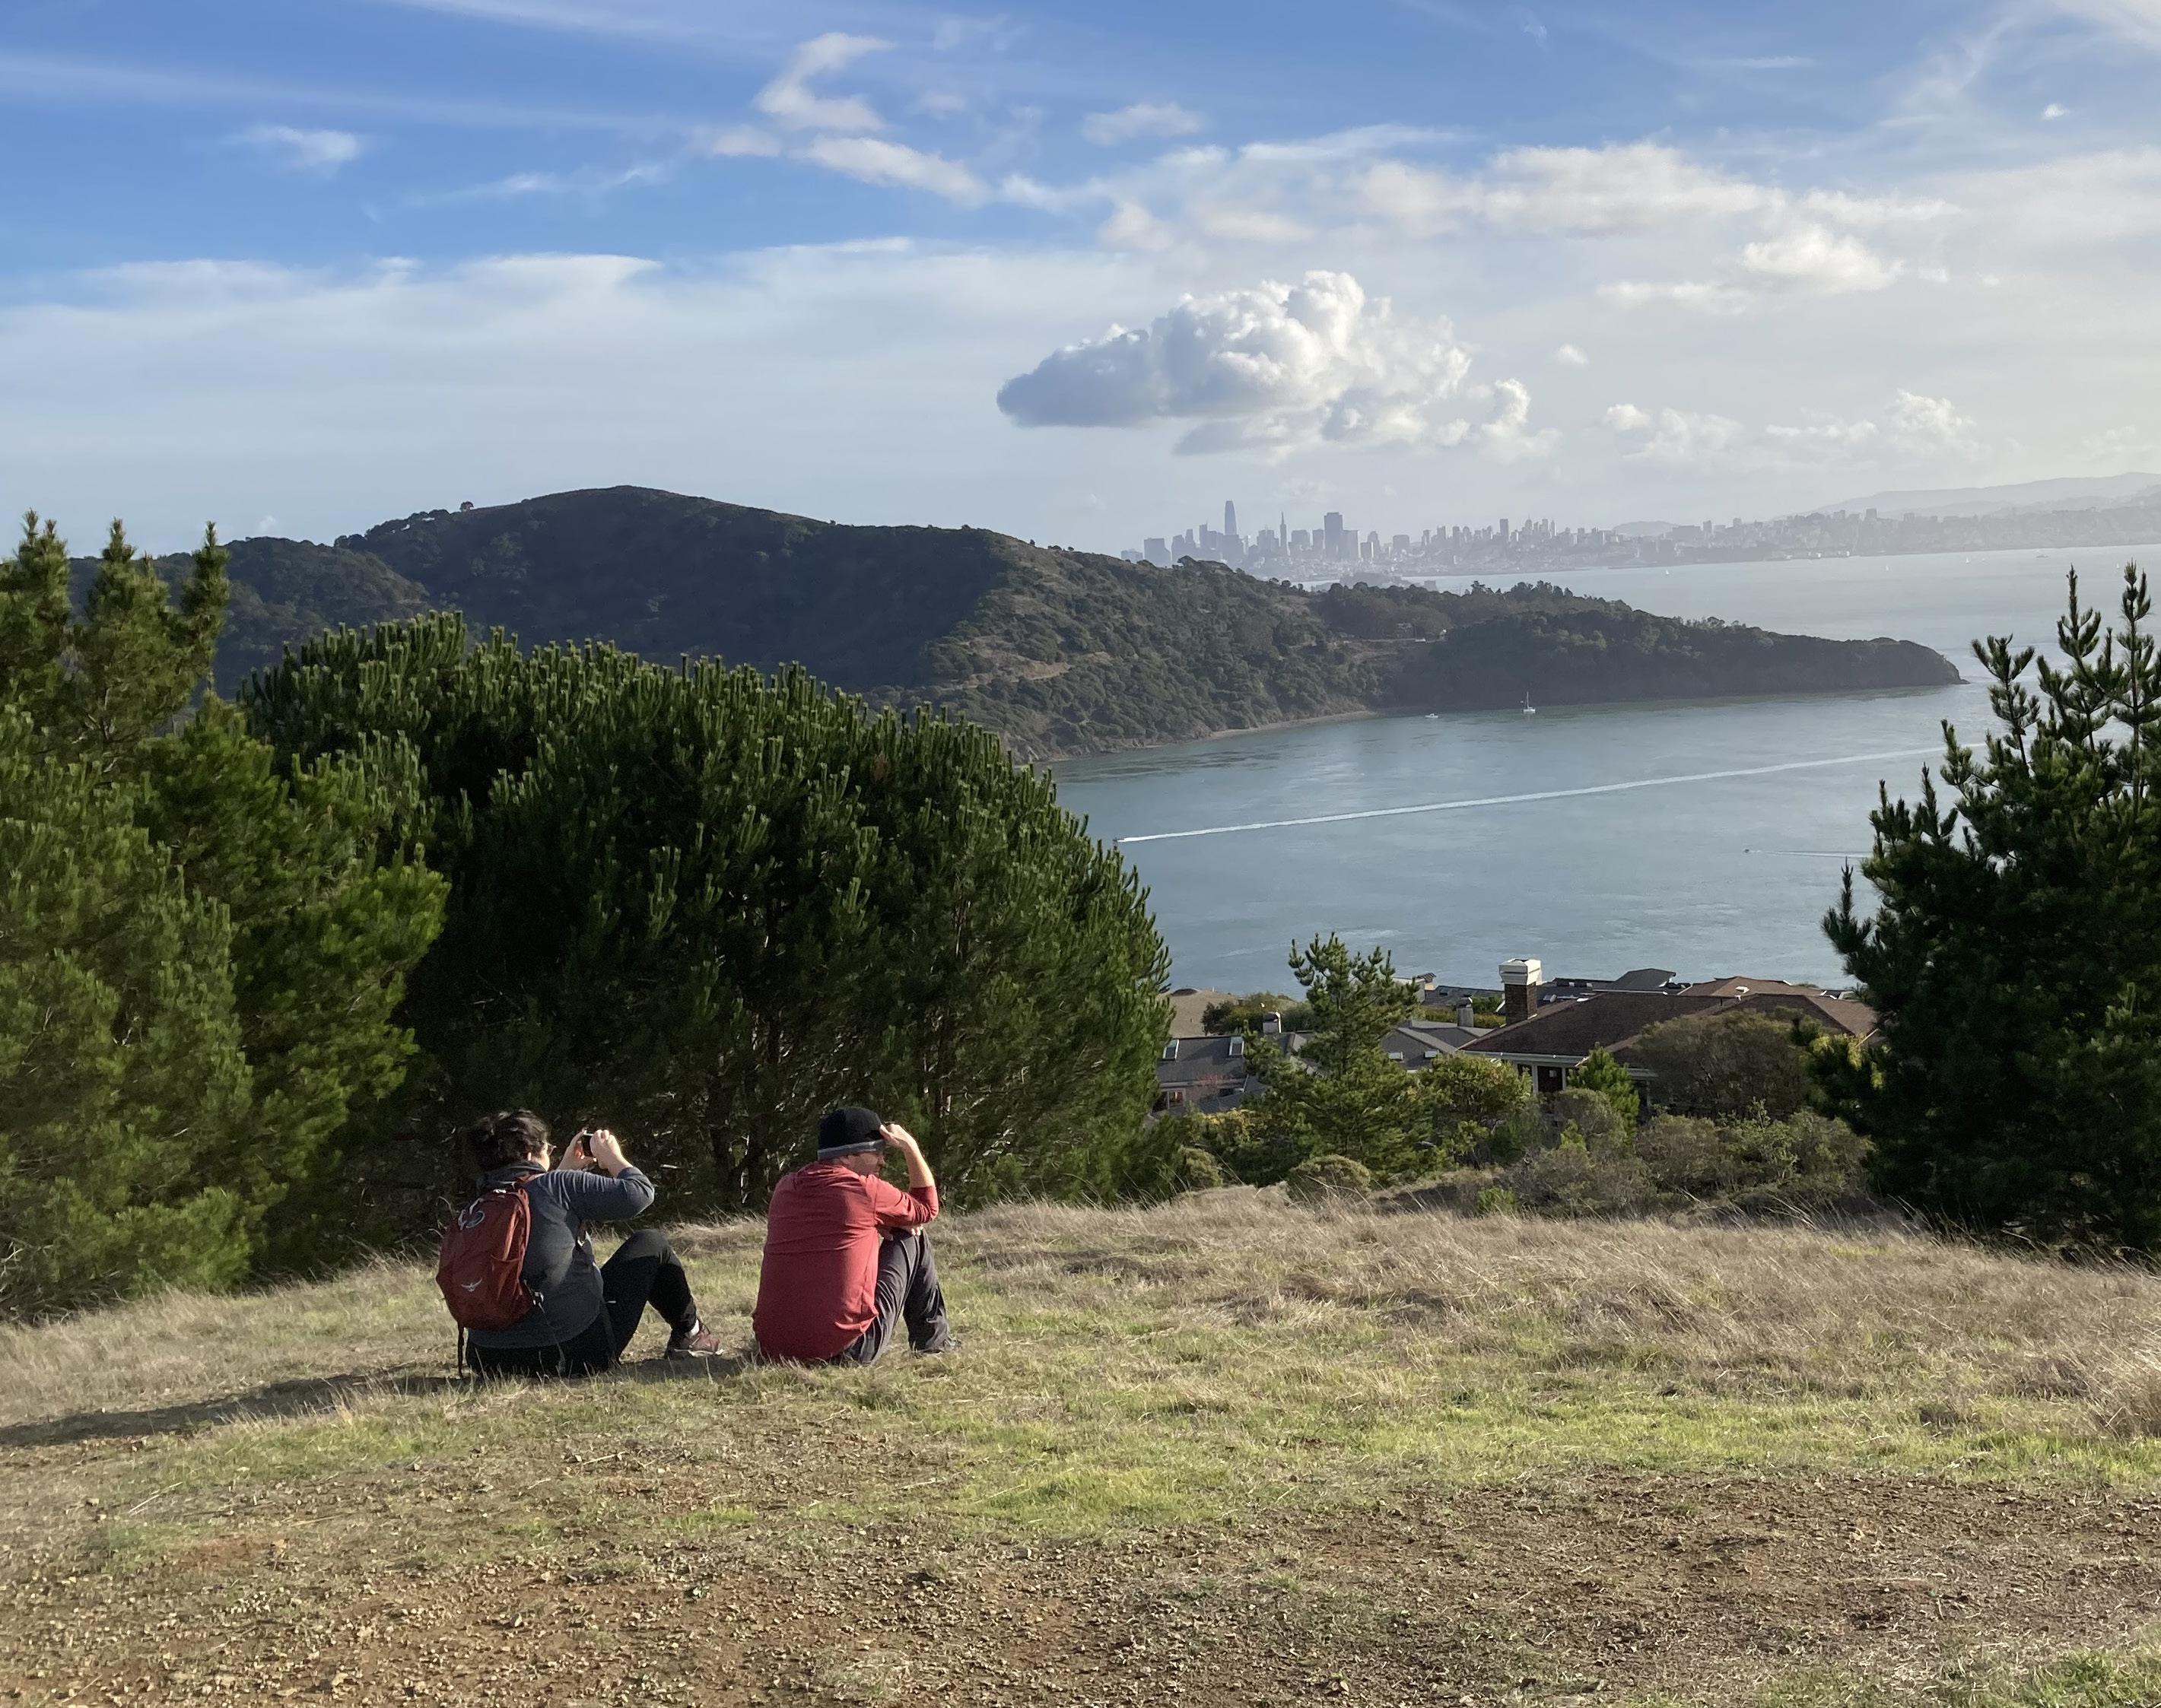
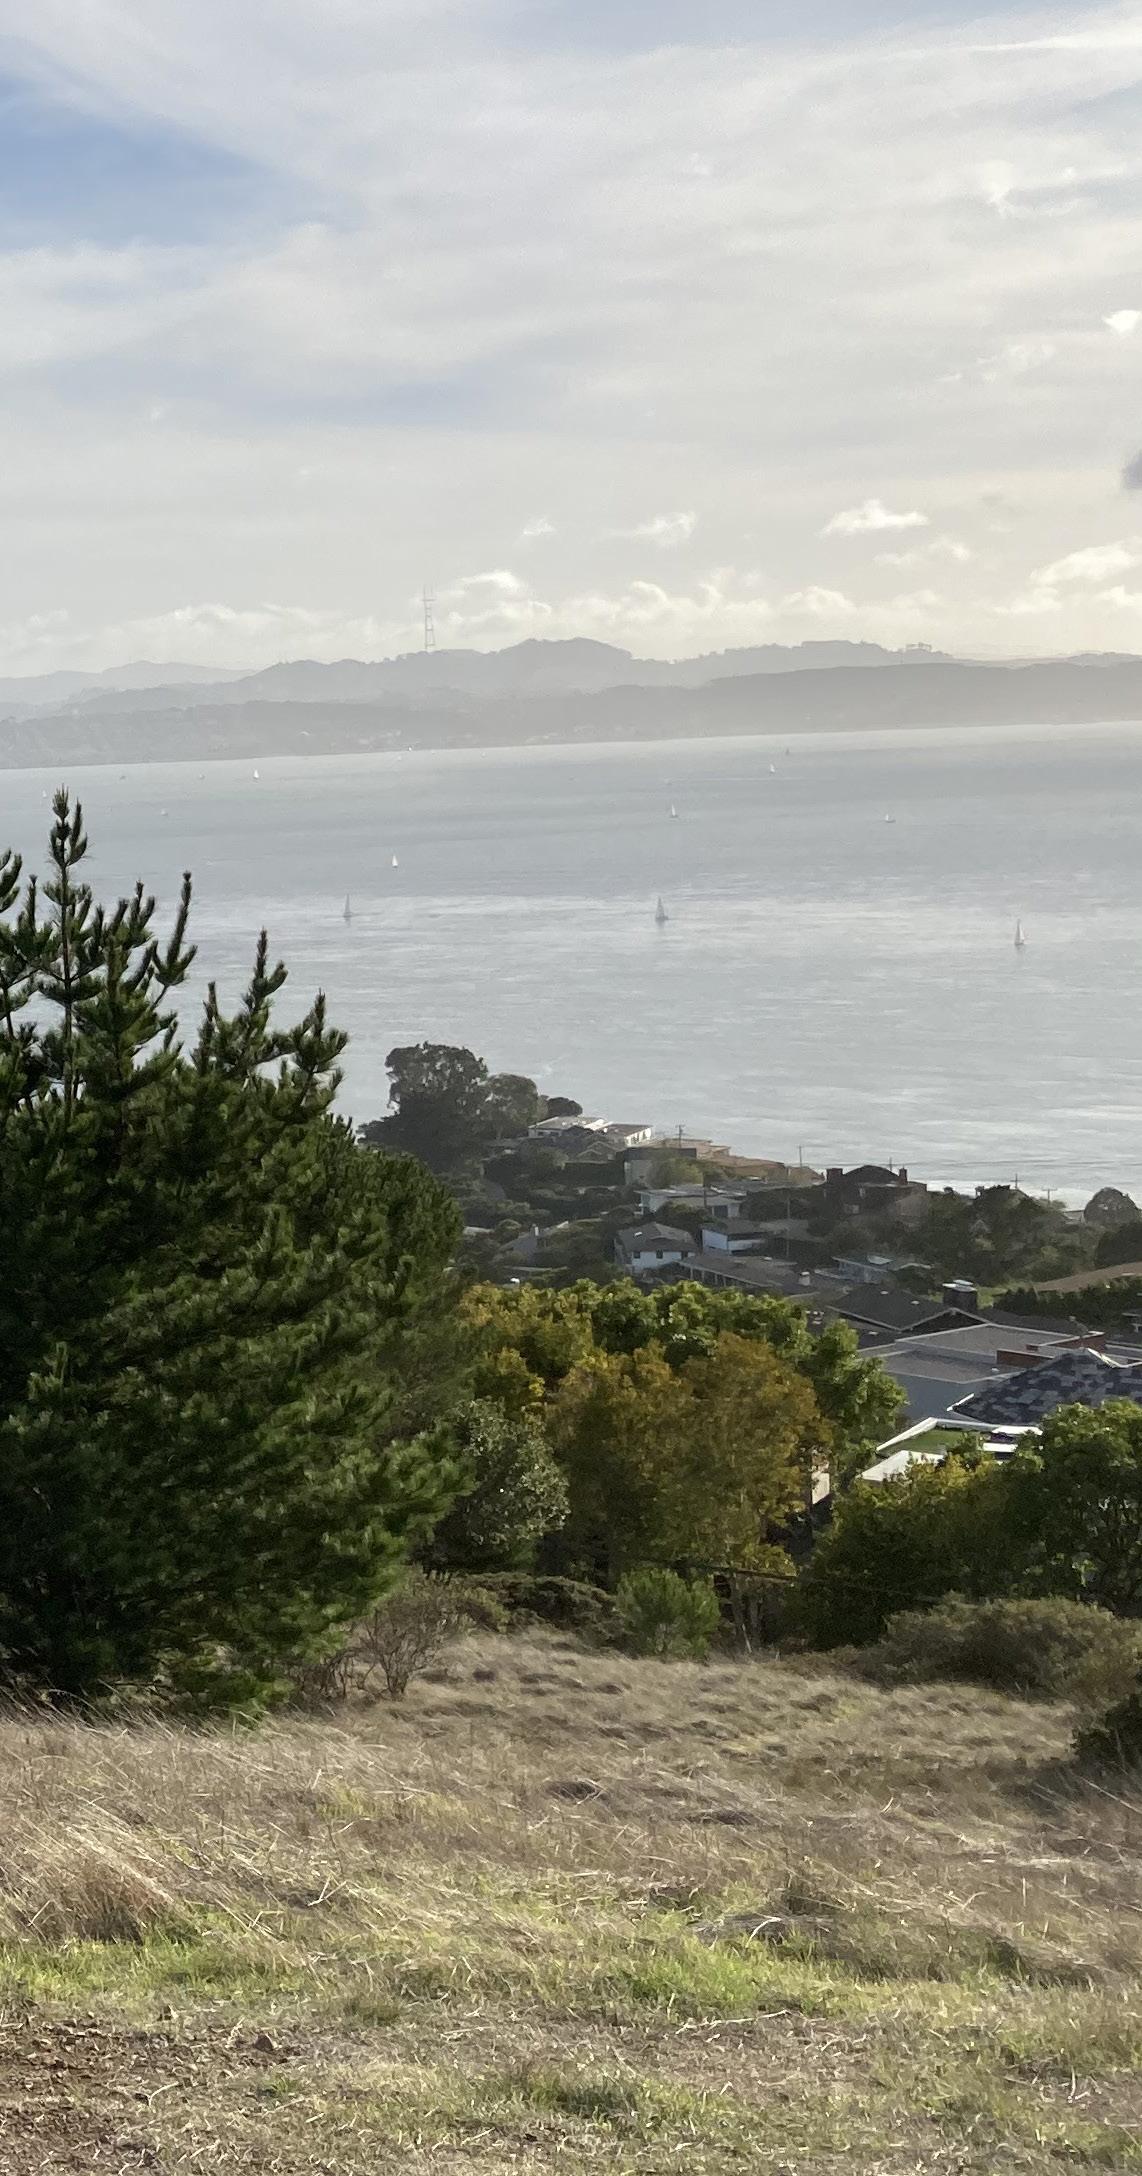
This chapter presents a framework for governing future decisions about how Tiburon will sustain open space and provide parks and recreational opportunities for today’s residents, as well as future generations. The Town’s parks and open space lands can provide biodiversity, recreation, flood risk reduction, and protection from hazardous conditions. The Town recognizes that development of open space lands can degrade its natural resources and impact the many benefits provided by these areas, and therefore seeks to discourage the conversion of open space land to urban uses. The chapter focuses on the protection, maintenance, and enhancement of Tiburon’s open spaces, parks, and recreational facilities and addresses State requirements for the open space element of the general plan. Together with the Town’s Zoning Ordinance regulations related to open space, this chapter constitutes the Town’s open space plan. A description of the biological communities and special
status species in the planning area, and goals, policies, and programs to protect their habitat, are located in the Conservation chapter.
The Open Space, Parks + Recreation chapter includes the following sections.
• 10.2 Open Space. Identifies open space areas in Tiburon.
• 10.3 Scenic Resources. Describes visual resources in the planning area, including ridgelines, greenbelts, water, and wooded areas.
• 10.4 Parks and Recreation. Describes community parks, mini-parks, regional parks, and recreational facilities and programming in Tiburon.
• 10.5 Goals, Policies, and Programs. Identifies goals, policies, and programs to conserve, protect and improve open space lands, parks, and recreational facilities.
Open space and preservation of the natural environment are valued and defining characteristics of the Tiburon Peninsula. The Tiburon Peninsula consists of over 800 acres of protected and publicly owned open space land. Additionally, there are approximately 115 acres of private open space protected from development through easement or another legal instrument. These open space areas are generally not open to public use. As shown in Table OS-1, approximately 769 acres of public open space land is located within the planning area.
Public and private open spaces and parks are shown in Figure OS-1, which constitutes the Town’s open space inventory and map. The open space inventory includes any parcel or area of land or water within the Tiburon town limits and sphere of influence that is essentially unimproved and devoted to open space use for natural resources, the managed production of resources, outdoor recreation, public health and safety, and tribal resources, as required
by California Government Code §65560. The policies and programs contained in Section 9.5 are aimed at the continued preservation and conservation of these lands.
Tiburon
Tiburon
Public
Private
Park
Audubon
Tiburon

Tiburon has a unique visual environment with a diversity of landscapes and views of open space, Richardson Bay shoreline, San Francisco Bay shoreline, Angel Island, hills, ridgelines, stands of various types of trees, and other natural features.
Water, shorelines, and wetlands are important visual resources that provide critical habitat, recreational opportunities, and scenic vistas. Views of Richardson and San Francisco Bays are cherished by residents and contribute to the enjoyment of daily life. Another visual attraction is the abundance of wildlife, particularly birds and other special status species which are constantly moving around the Bay waters, marshes, and mudflats in search of food and refuge. Wildlife refuges like the Audubon Society Wildlife Refuge, located in Tiburon, provide scenic areas

where wildlife can congregate and move freely.
Trees and woodland areas are important natural resources that provide habitat for birds and shaded, protected areas for other animals, and help to stabilize hillsides. Trees and wooded areas also contribute to the visual character of the community. Trees and woodlands are valued by the Town for their ecological importance, their visual enhancement of the community, and their contribution to residential privacy and quiet.
Ridgelines are defined as a line formed along the highest points of a mountain ridge, or as an area of higher ground separating two adjacent streams or watersheds. Besides water, ridgelines are the most visually defining open space attribute in the planning area. Ridgelines also provide the greatest opportunity for community scenic value. Public access to these ridgelines allows community members to enjoy unique views within the Town.
Open Space policies place the highest value on protecting undeveloped ridgelines. The Tiburon Ridge and Significant Ridgelines in the planning area are designated by Town Council Resolution 2859 and shown in Figure
OS-2. The figure also identifies other scenic characteristics, including upland greenbelts, areas with significant tree cover, streams, and wetlands.
Open Space policies call for the protection and preservation of view corridors and open space views from key roadways, including Tiburon Boulevard, Trestle Glen Boulevard, and Paradise Drive. These roadways are identified on Figure OS-2.
The Town owns and operates twelve parks as well as a multi-use path and the landscaped medians throughout Tiburon. The parks include community parks, mini-parks, and specialty facilities, defined as follows:
Community parks are developed primarily to meet the recreational needs of a large portion of the town.
Community parks range in size according to their purpose and often feature community facilities or natural
resources. In Tiburon, the Richardson Bay Lineal Park offers a multi-use path and amenities along the bay waterfront, including an athletic field at McKegney Green, a playground at South of Knoll Park, historical interpretation signage along the Old Rail Trail, a wildflower exhibition garden at Blackie’s Pasture, and a bronze, life-size statue of “Blackie,” a retired U.S. Calvary horse that for 28 years grazed in the pasture that now bears his name.
Mini-parks primarily serve a small portion within the town, usually within one-half radius of the park. Miniparks are generally oriented toward the recreational needs of children and youth. In Tiburon, the Cypress Hollow Park provides playground equipment while the Bel Aire Play Area is an unimproved green area for residents of the Bel Aire neighborhood.
Specialty facilities primarily provide for specific recreational activities, such as the Teather Park Tennis Courts in Tiburon.
In addition to the Town’s parks, two regional parks are located within the planning area in unincorporated Marin County, which are maintained by the Marin County Parks and Open Space Department. The Paradise Beach Park
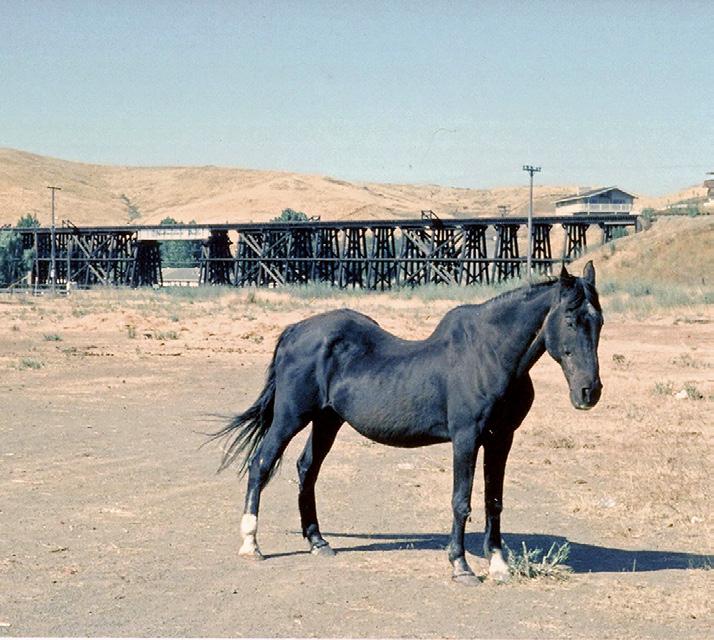
“Blackie,” a retired U.S. Calvary horse, grazed the pasture that now bears his name.
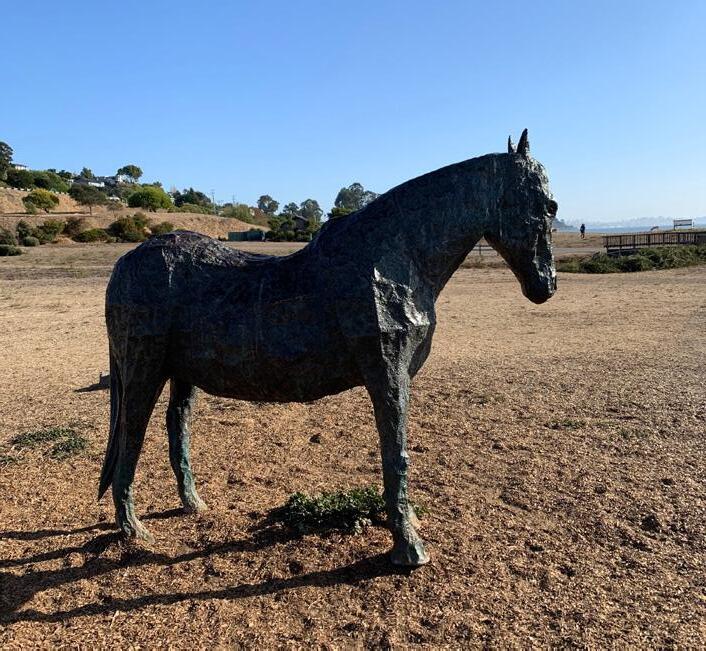
provides a swimming area, kayak and canoe launch, and fishing pier as well as spacious lawns for picnicking and enjoying views across the water to the East Bay. The Tiburon Uplands Nature Preserve offers a hiking loop with access to the Old St. Hilary’s Open Space Preserve and panoramic Bay views.
Table OS-2 provides a summary of the existing parks in the Tiburon planning area, totaling 94.1 acres of parkland. The Town currently manages approximately 56.7 acres of parkland, which represents approximately 6.3 acres of Town parkland per 1,000 residents based on the 2010 Census population count.
In addition to the parks on the Tiburon Peninsula, 726 of the 740 acres of Angel Island State Park are within the incorporated Town of Tiburon; the remaining 14 acres are in the City and County of San Francisco. The historic park offers peninsula residents and visitors opportunities for hiking, biking, camping, and boating. The Ranch provides popular youth summer camps on Angel Island.
The Town manages recreational programs and facilities through a joint powers agreement with the City of Belvedere. Programs are provided by The Ranch, which is governed by a nine-member board. The Ranch offers over 500 classes each year and registers over 4,800 participants.
The Ranch provides classes and activities for toddlers through older adults, including after-school sports, summer camps, fitness and specialty programming, and special events. The organization also manages facility rentals and key access for six tennis/ pickleball courts at three locations. In addition to public facilities, the Tiburon planning area is home to private facilities that require membership for access and use, including the Corinthian Yacht Club, the Tiburon Peninsula Club, the Belvedere Tennis Club, and the Tiburon Yacht Club/Paradise Cay Yacht Harbor. These facilities provide boat slips, tennis courts, swimming pools, and a fitness center.
TIBURON RIDGE
Trails in Old St. Hilary’s Preserve offer incredible views over San Francisco Bay.
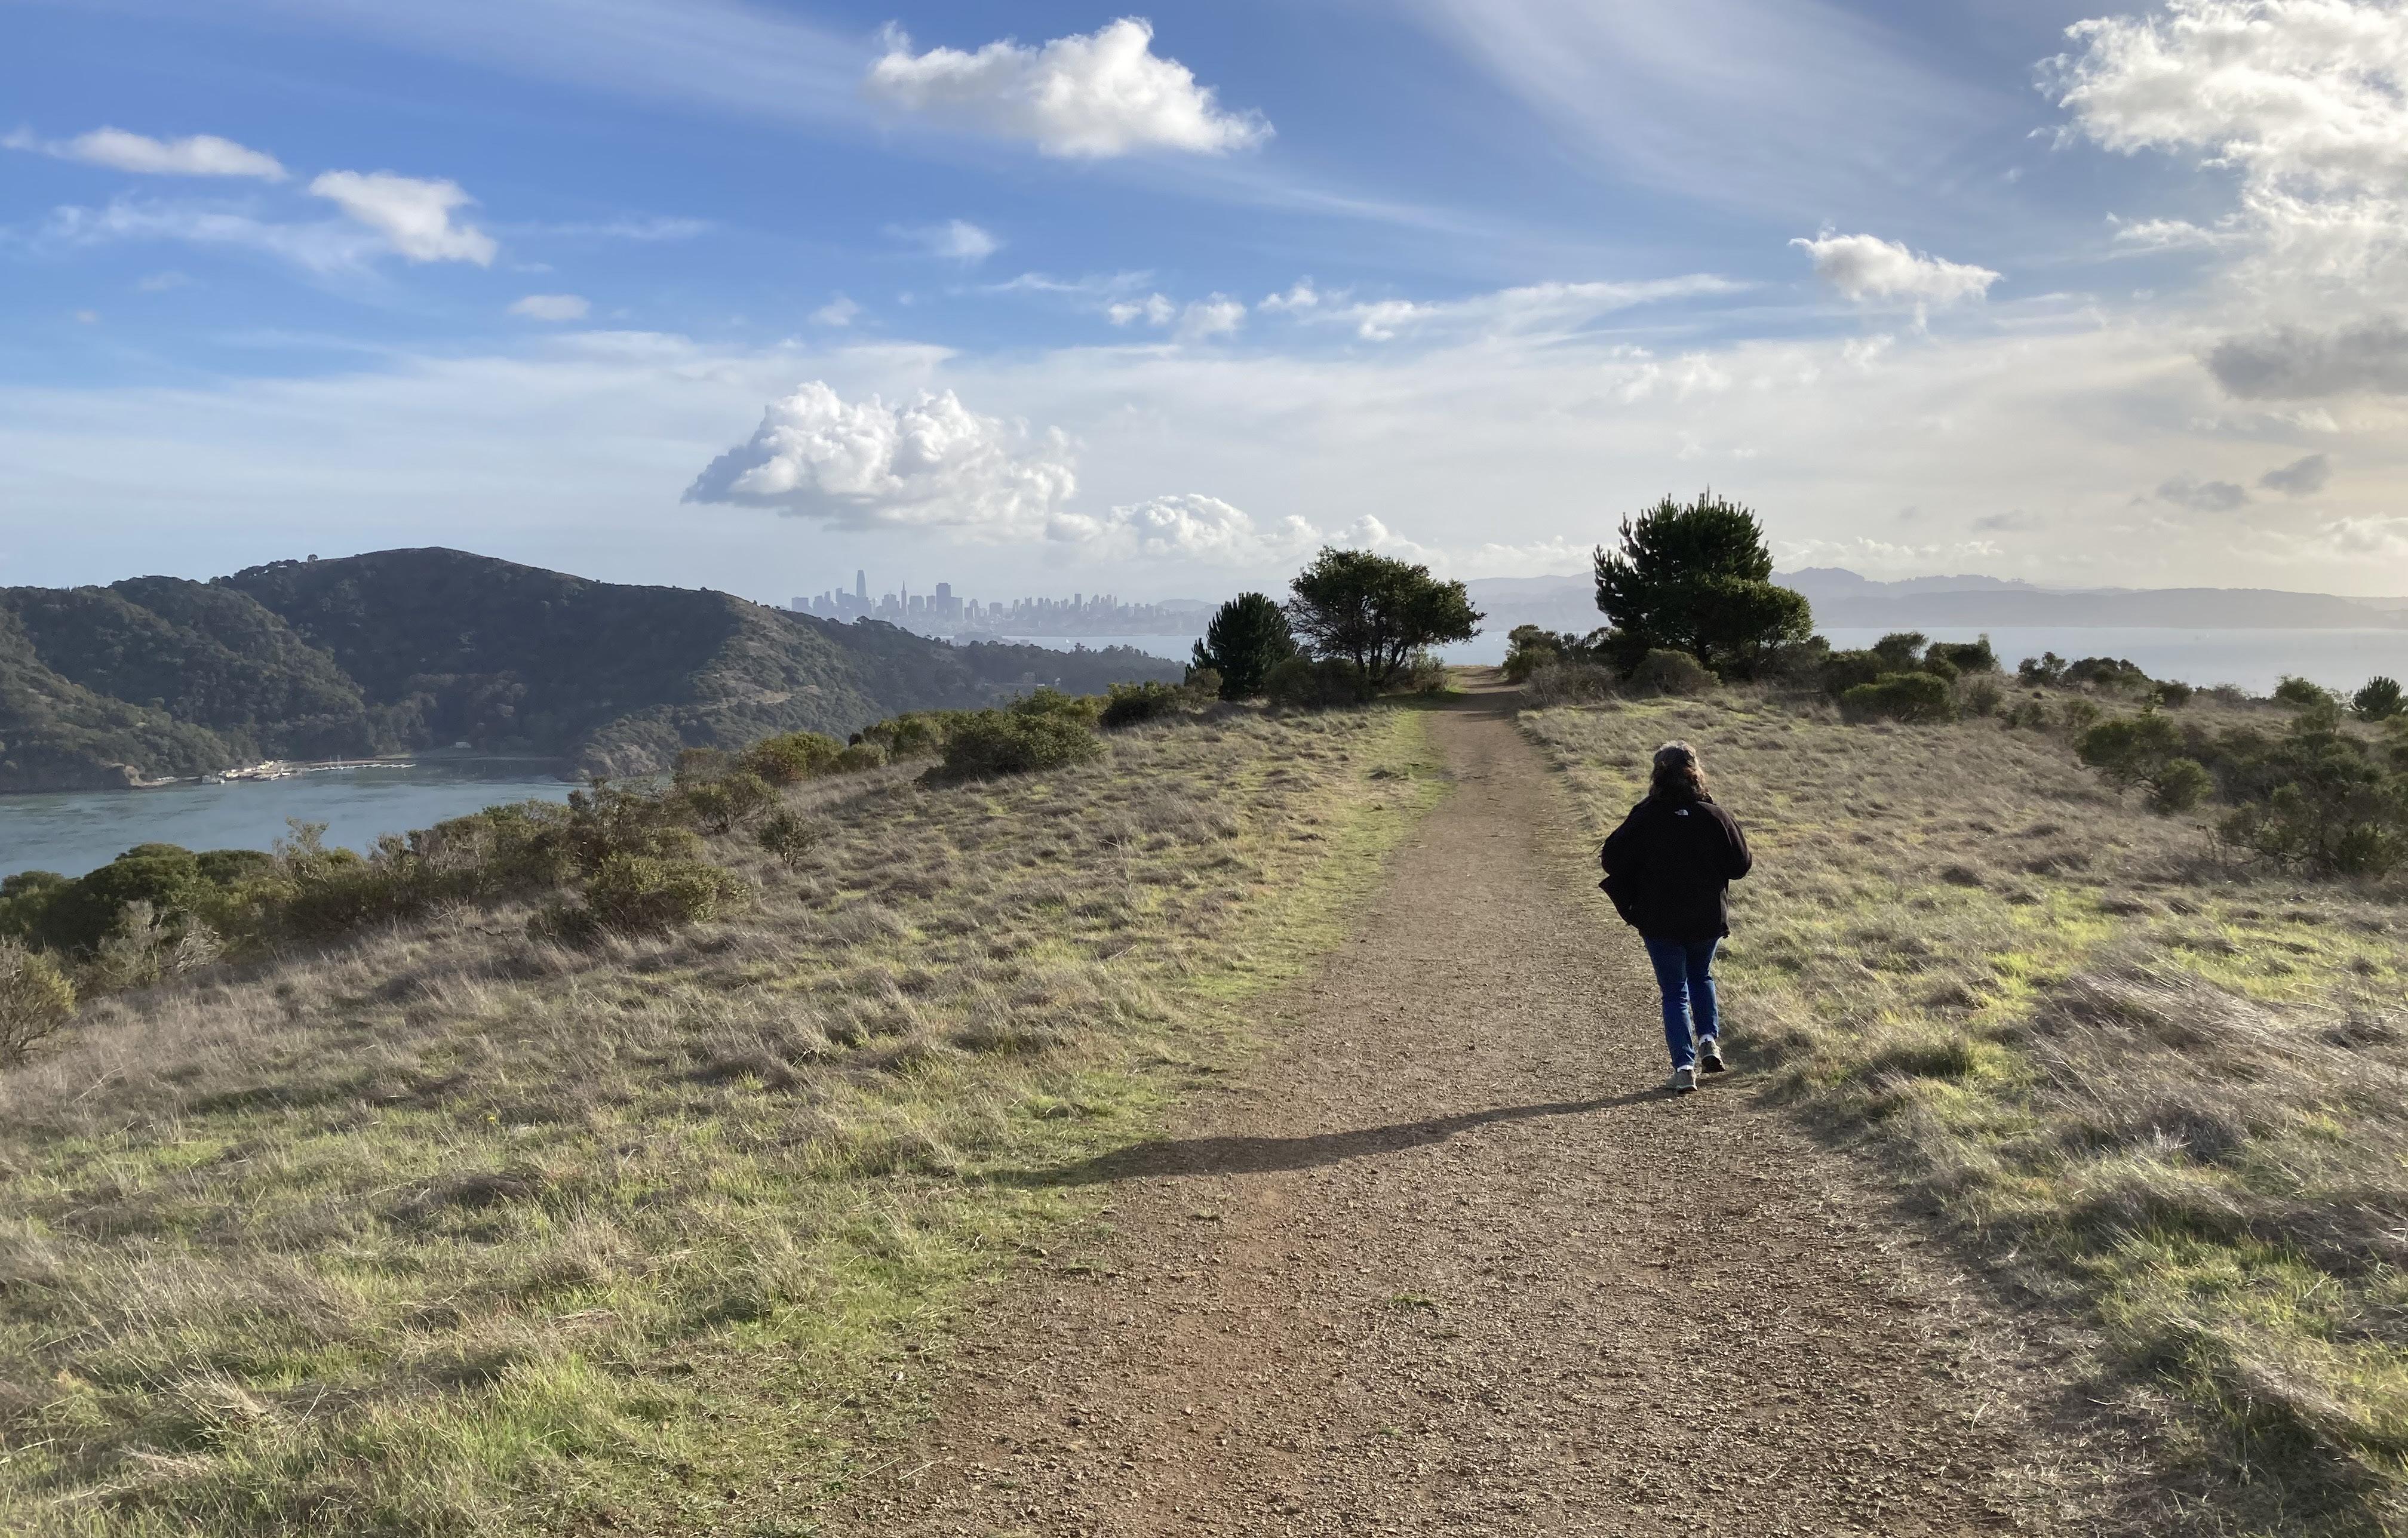
GOAL OS-A
Protect, preserve, and enhance the Town’s unique open space and natural beauty for its recreational and environmental benefits.
Permanently preserve as much open space as possible to protect shorelines, open water, wetlands, significant ridgelines, streams, drainageways, riparian corridors, steep slopes, rock outcroppings, special
status species and their habitat, woodlands, cultural and historic resources, and areas of visual importance, such as views of and views from open space.
Permanently protect, to the maximum extent feasible, the unique open space character of the Town which is attributable to its large amounts of undeveloped land and open water.
Permanently protect as conservation areas, to the maximum extent feasible, all lands and other areas in the public trust.
Protect open space for its visual values, habitat, and native vegetation and minimize impacts of any additional development.
Strive to permanently preserve through setbacks, dedication, purchase, easement, or other appropriate means exceptional structures, sites, open space, and sensitive
environmental resources. Encourage the permanent protection of open space through conveyance of fee title to an appropriate government agency or land trust; by easement; deed restriction; or other appropriate mechanism acceptable to the Town.
When considering whether open space land should be dedicated to the Town or other public entity, weigh the benefits to the community of public ownership against the costs of management efforts and other liabilities associated with owning the land.
Strive to secure public access to those portions of open space land most appropriate for public use through trail easements that connect to other public
trails or through other appropriate legally permissible mechanisms.
Permanently protect public or private open space. Publicly owned open space land should not be sold and should only be traded in exchange for open space which provides improved trail connections, resource protection, or other public benefits.
Land that is proposed for preservation as permanent open space shall typically be contiguous to existing open space and/or open space areas that may in the future be permanently preserved.
Ensure that new development respects the ecological, visual, and safety benefits of hillsides, ridgelines, and other natural areas that serve as habitat and erosion protection as well as visual backdrops to the community. Use the development review process to retain the visual character and environmental attributes of the planning area.
Program OS-a Environmental Constraints Assessment.
Require applicants to demonstrate that proposals for development minimize environmental impacts and comply with the General Plan and applicable regulations, ordinances, and guidelines. Require preparation of an assessment of environmental constraints that addresses applicable topics identified by California Environmental Quality Act and open space characteristics, including those associated with aesthetics, biological resources, and
cultural and tribal cultural resources, prior to the submittal of Precise Development Plan applications for large undeveloped parcels.
Program OS-b Review Development Applications within Sphere of Influence.
Review development applications that are submitted to the County and that are within the Town’s sphere of influence and areas of interest in order to encourage conformance with Town policies, including minimizing the visual impact of development on surrounding hills visible from the Town.
Program OS-c Environmental Assessment.
Require an environmental assessment for development proposed on sites that may contain sensitive biological resources, including wetlands, occurrences of special-status species and sensitive natural communities, native wildlife nurseries and nesting locations, and native wildlife movement
corridors. The assessment shall be conducted by a qualified professional to determine the presence, potential presence, or absence of any sensitive resources which could be affected by proposed development, shall provide an assessment of the potential impacts, and shall define measures to avoid significant adverse impacts to the resource. The development project shall be required to implement feasible measures to avoid or, if avoidance is not feasible, reduce significant adverse impacts.
Cluster lots in new subdivision design to maximize the preservation of open space to the greatest extent feasible. Where the Town determines that a project would better conform to the goals and policies of the General Plan, “estate lot” type development (i.e., large homes on large lots) may be considered. Easement, deed restriction, or other appropriate mechanism
acceptable to the Town shall be used to preserve open space within common areas or individual lots.
Require undeveloped greenbelts to separate development areas or to link open space areas where appropriate.
Protection of predominantly undeveloped ridgelines shall have the highest priority in balancing open space interests with development interests. Undeveloped ridgelines have overriding visual significance to the Town.
Development and the construction of buildings and yard improvements
associated with development, including landscaping and trees, shall be set back from either side of Tiburon Ridge as established in Figure OS-2:
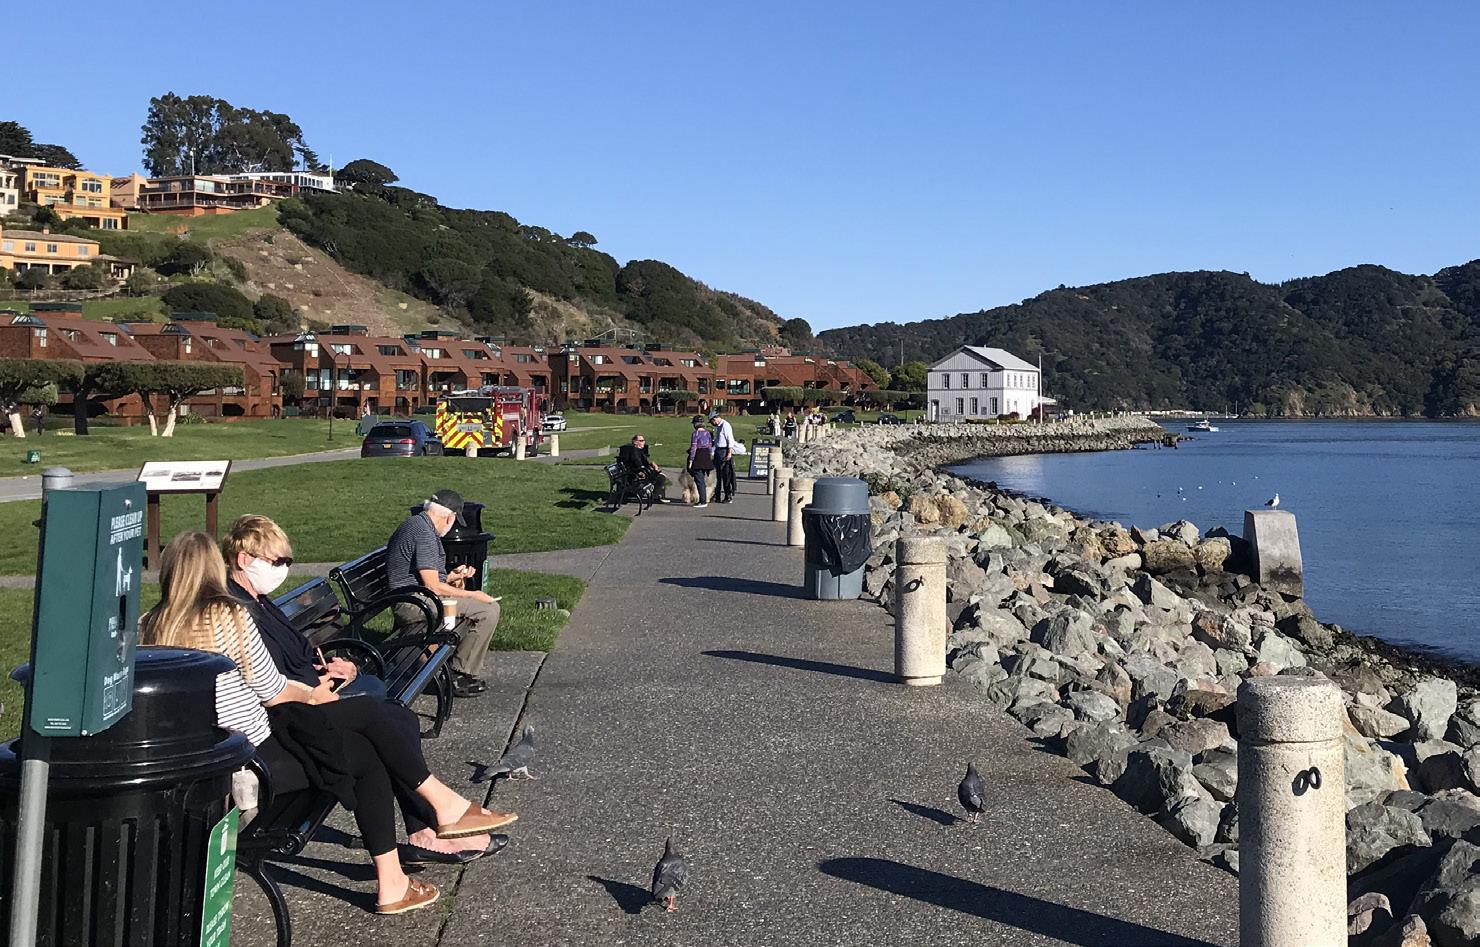
1. a minimum of 150 horizontal feet, &
2. a minimum of 50 vertical feet, measured from the highest point of the roofline of a structure or tree.
If strict application of these requirements prevents all reasonable use of the property, encroachment into the setbacks may be allowed provided that structures are limited to a maximum 15 feet in height, as defined by the Tiburon Zoning Ordinance, and provided that both horizontal and vertical encroachment are minimized.
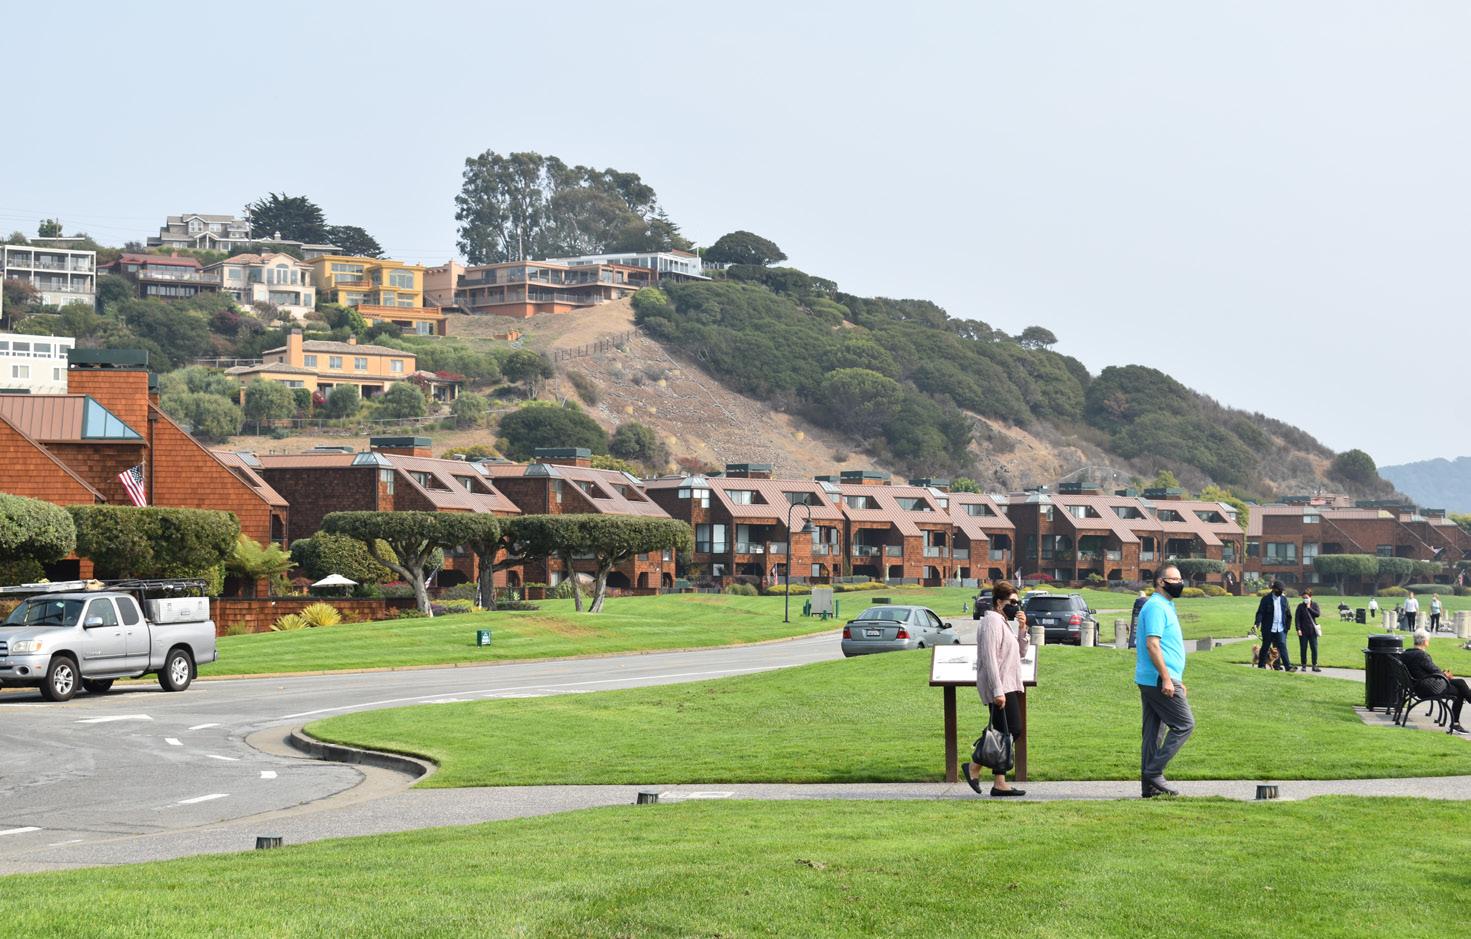
Amend the Zoning Ordinance to incorporate the required setbacks from Significant Ridgelines contained in Policies OS-10 and OS-11, limitations on development of steep slopes in Policy OS-13, and the objective hillside
development standards from the Design Guidelines for Hillside Dwellings.
Development shall be set back from Significant Ridgelines as established in Figure OS-2. Setbacks shall be based on an evaluation of the following characteristics: local and regional visual prominence, ability to connect to existing or potential open space, potential to act as a neighborhood separator, views of and views from, length, height, presence of trees, presence of unusual physical characteristics, highly visible open slopes, significant vegetation, sensitive habitat, special silhouette or back-drop features, difficulty of developing or accessing, and integrity of the ridgeline land form.
In evaluating Significant Ridgelines for protection, all characteristics identified in Policy OS-11 should not be judged equally. Significant Ridgelines that
have a high visual prominence, have the potential to connect to the Tiburon Ridge Trail, or have a distinct ridgeline land form, such as those found at the eastern terminus of the Tiburon Ridge, should be afforded greater protection than those that have low visibility, do not connect to the Tiburon Ridge, or do not have distinct ridgeline land forms.
If strict application of these requirements prevents all reasonable use of the property, encroachment into the setbacks may be allowed provided that structures are limited to a maximum 15 feet in height, as defined by the Tiburon Zoning Ordinance, and provided that both horizontal and vertical encroachment are minimized.
Roads and utilities constructed along or across the Tiburon Ridge or Significant Ridgelines as established in Figure OS-2 shall be strongly discouraged. If no other vehicular access is viable,
crossing of ridges shall be minimized and shall be as near to perpendicular to the ridgeline as possible.
Strongly discourage development on slopes exceeding 40%.
Keep grading to a minimum to the maximum extent possible and make every effort to retain the natural features of the land including ridges, rolling landforms, knolls, vegetation, trees, rock outcroppings, and water courses.
Avoid site grading that is not required by the Town’s Landslide Mitigation Policy to the maximum extent feasible to retain natural landforms.
Where hillslope stabilization is proposed as part of a development proposal, or wherever such stabilization is required by the Town to protect public safety, require the project to evaluate all slope repair-related modifications such as the secondary impacts of subsurface drainage on site and watershed ecological communities, including special-status species, sensitive natural communities, and wetlands. In the event impacts are likely, modifications to the proposed project shall be considered. In the event avoidance and project modification are infeasible, appropriate on- or off-site habitat mitigation shall be required prior to project approval, as mandated by the State and federal regulatory agencies.
Restore natural vegetation and habitat to the maximum extent feasible where grading is required to stabilize areas of geologic instability.
Minimize the impact of grading on adjacent properties, water quality, and air quality.
Slopes created by grading shall be at a slope angle determined to have long-term stability for the materials being used, not exceeding 30 percent wherever possible. Final contours and slopes shall reflect natural land features, including natural vegetation.
The visual impact of retaining walls and similar engineering elements shall be reduced in size and scope to the maximum extent feasible by minimizing their use unless necessary as a foundation to reduce abovegrade building mass and by requiring appropriate visual screening.
Identify and preserve principal vistas, view points, and view corridors affected by development to the extent feasible.
Protect open space views from key roadways, including Tiburon Boulevard, Trestle Glen Boulevard, and Paradise Drive, through the permitting process.
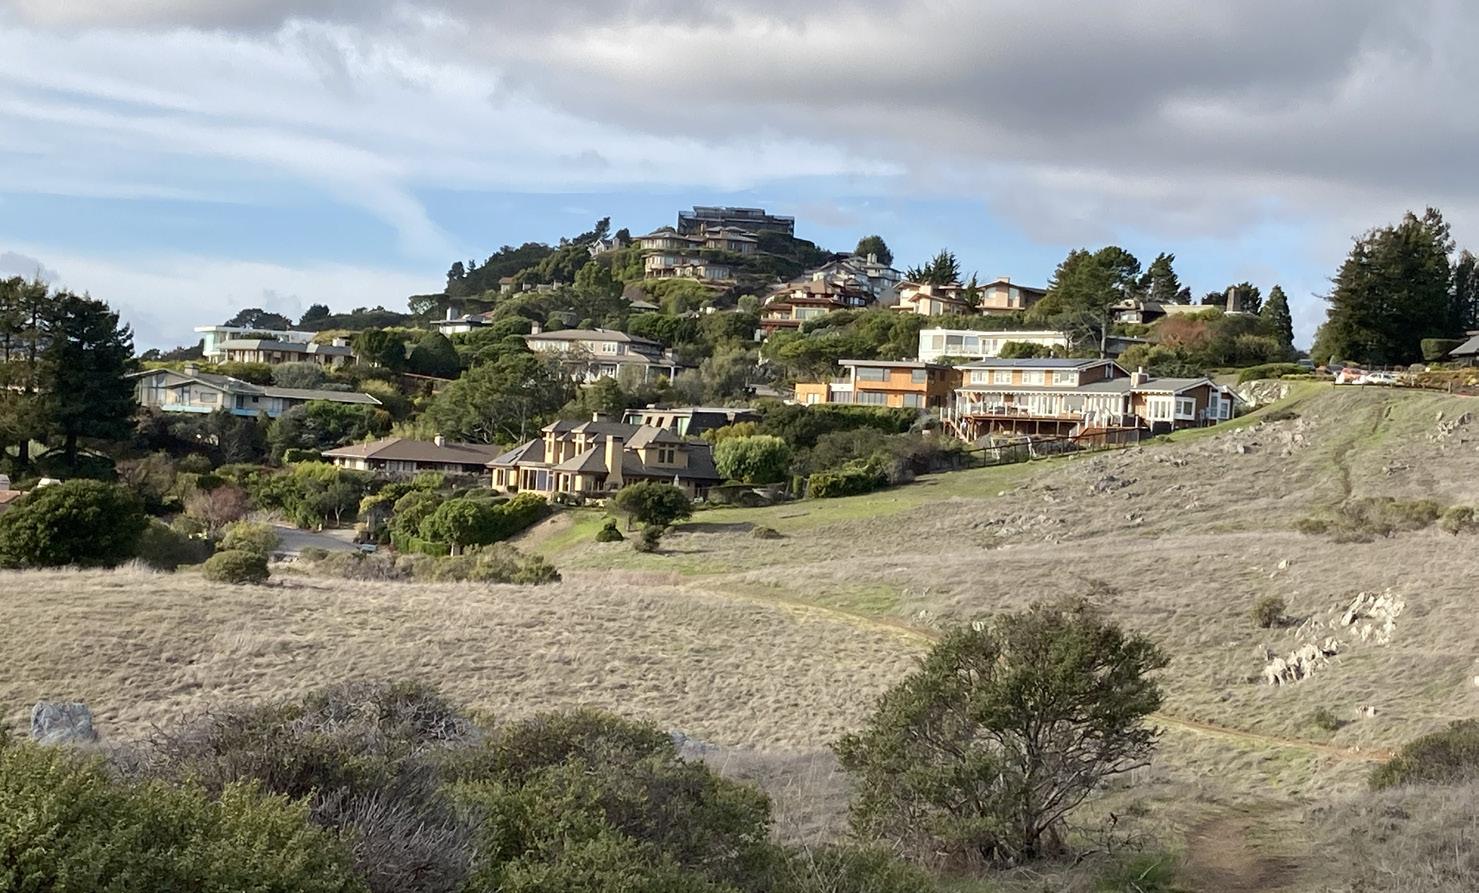
Encourage development in areas where it least interferes with views of and views from open space to the maximum extent feasible.
Protect visual access to the bayfront and scenic vistas of water and distinct shorelines through land use and development review procedures to the greatest extent feasible.
Policies ensure that future hillside development sets back from significant ridgelines and minimizes grading.
Manage the Town’s open spaces for the benefit of the entire community.
Encourage conservation and educational uses of public open space lands. Authorize or provide conservation and education facilities, including nature trails, interpretive exhibits, day camps, nature study areas and other related facilities in areas where the impacts on the natural environment will be minimal.
Program OS-f Improve Trail Signage.
Provide improved trail signage to the public open space, including information on trail safety and identifying/protecting habitat for endangered species.
Program OS-g Trail Connection to Downtown.
Evaluate the potential for an off-road trail connection between the Town’s public open space and Downtown/ Tiburon Boulevard, securing trail easements over private property where possible.
Encourage and seek agreements with other governmental jurisdictions such as County, State, Federal and other agencies and non-profit organizations for funding, acquisition, maintenance, and use of open space areas.
Encourage and promote cooperation and participation of private groups, organizations, and individuals in the planning, operation, and preservation of open space lands as deemed necessary.
Coordinate the use of open space lands with other public and quasi-public lands that are contiguous or otherwise inter-related to Town open space where desirable.
Engage in or authorize landscape restoration and/or enhancement
programs where the natural landscape has been altered or degraded and when funding and resources allow on Town open space land.
Program OS-h Open Space Management Plan.
Implement the adopted Open Space Management Plan that identifies maintenance projects and funding sources.
Encourage the use of native plants for landscaping and discourage the planting of invasive, exotic species
Require the removal of invasive, exotic species, such as broom and pampas grass, as a condition of approval for new developments.
Program OS-i Invasive Species. Encourage homeowners’ associations to disseminate information about the harmful effects of invasive exotic species in landscaping.
Require new developments to ensure ongoing removal of invasive, exotic species through homeowners’ associations, covenants, conditions, and restrictions (CC&Rs), or other appropriate mechanisms.
Provide sufficient land and facilities for a balanced system of parks and recreation opportunities that serve all ages, abilities, and income levels.
GOAL OS-H
Anticipate population growth and to plan for and provide funds for the acquisition of adequate lands or installation of adequate facilities to address future parks and recreation needs of the community.
Maintain sufficient park land and recreational facilities over time.
Program OS-j Coordinate Park and Recreation Planning.
Work with the Belvedere-Tiburon Recreation Department and the City of Belvedere to consider the longand short-term need for additional parklands, sporting facilities, picnic facilities, play areas, or programs to meet the community’s recreational programming and facilities needs.
Program OS-k Parks Master Plan.
Prepare a Parks Master Plan to guide the use, development, and management of park facilities.
Continue to require new parkland dedication and/or collection of in-lieu fees during the development review process. A ratio of 5.0 acres of park land per 1,000 persons is established for the Planning Area pursuant to the Quimby Act.
Continue to use park funds and any future in-lieu fees for improvement of existing and future parks and for parkland acquisition purposes.
Pursue federal, state, county, and other funds to assist in the maintenance, improvement, and acquisition of existing and/or future park facilities.
Strive to adequately fund the ongoing maintenance of the Town’s park and recreation facilities.
Retain the area known as Blackie’s Pasture for passive, informal recreational use, including uses such as picnicking, hiking, wildlife watching, and open play areas which require minimal improvements such as pathways, benches, picnic tables, or restrooms. The quality and preservation of the environment should be the focus of the recreational experience.
Maintain, and enhance where practical, existing water recreation opportunities.
Program OS-l Small Watercraft Launch.
Consider locations and funding for creation of a launch facility for small watercraft (e.g., kayaks and paddleboards), possibly in the Downtown area.
Encourage additional public shoreline access from publicly accessible land consistent with the Bay Conservation and Development Commission’s (BCDC) San Francisco Bay Plan, especially in areas where none currently exists.
Program OS-m Richardson Bay Linear Park.
Prepare a framework or decisionmaking criteria for future improvements to the Richardson Bay Linear Park as part of the Parks Master Plan.
Continue to enhance the network of public trails within the Tiburon Planning Area, including connections between and to public trails.
Program OS-n Trail Easements. Evaluate development applications for the existence and potential creation of easements and/or trails that connect or continue to allow public access to shoreline, recreation, and open space areas.
Encourage public convenience facilities such as restrooms, bicycle racks, drinking fountains, and trash receptacles which may be provided by the State of California, the Town of Tiburon, and/or the local community.
Maintain a positive, mutually beneficial working relationship with the California Department of Parks and Recreation and Angel Island administration to ensure that Angel Island remains a unique state resource and that the unique character of Downtown Tiburon is protected.
Continue to work cooperatively with the Belvedere/Tiburon Joint Recreation Committee to administer and operate recreation programs and facilities for the residents of Belvedere and Tiburon.
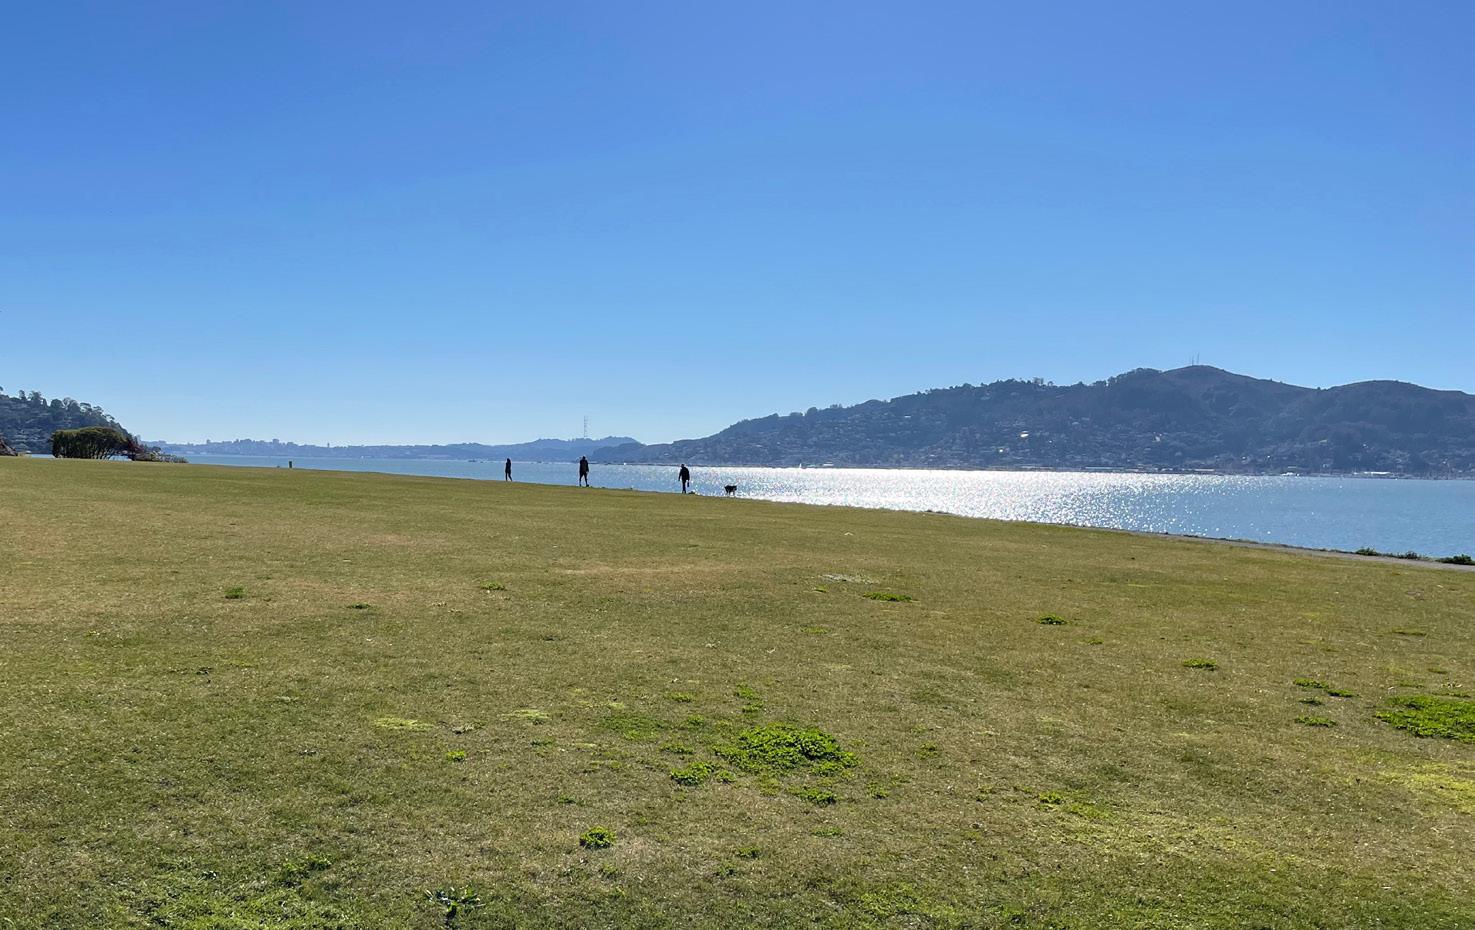
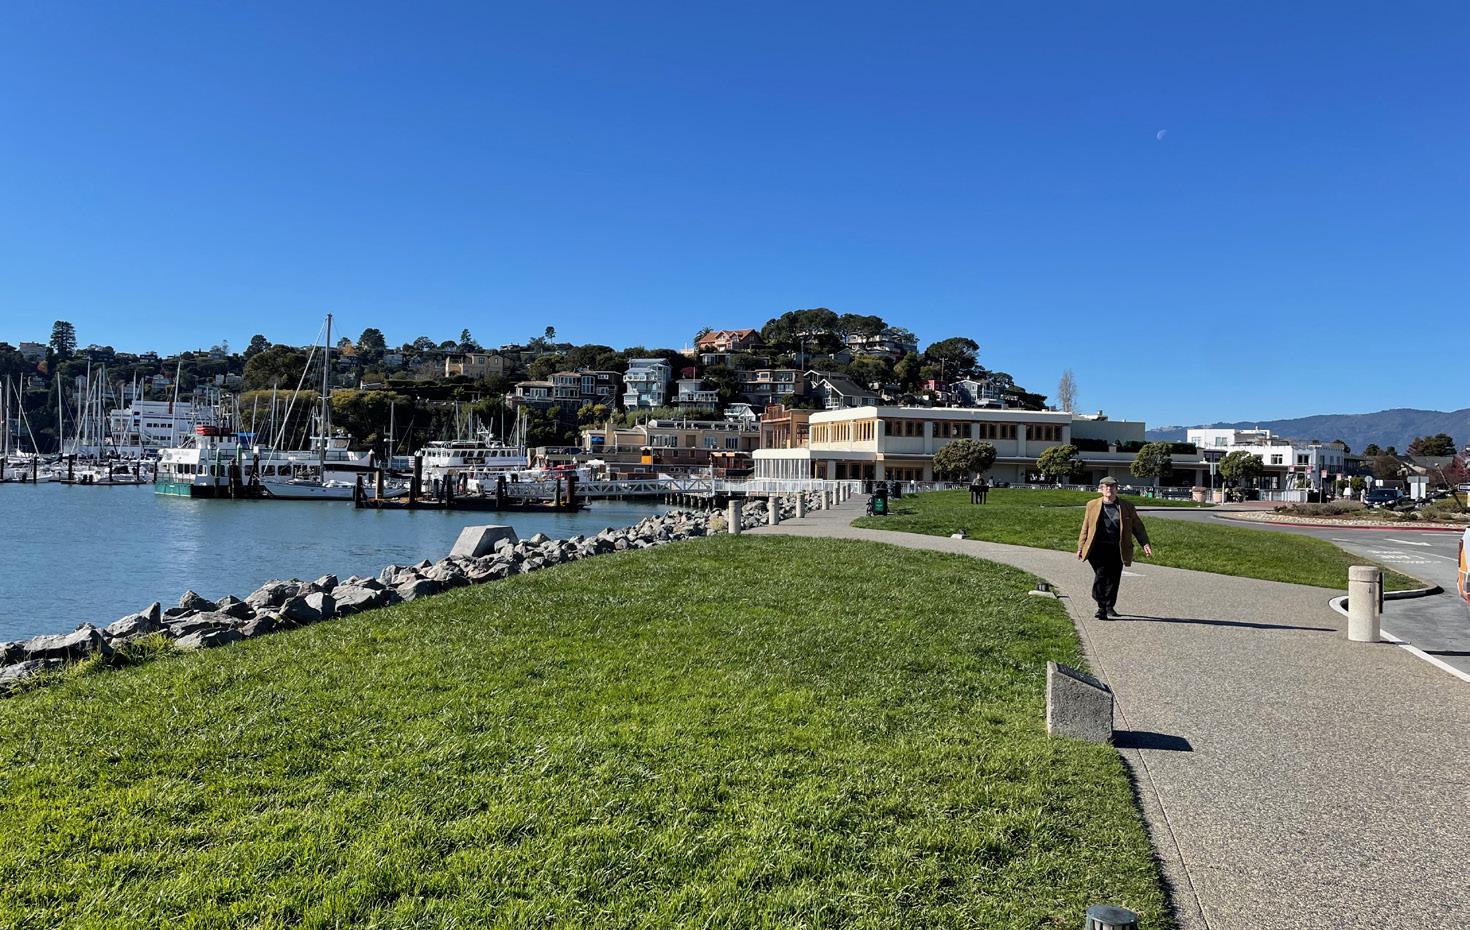
Ensure recreation programming is responsive to and serves the needs, interests, and desires of the entire
community, including those of different ages, abilities, and income levels.
Explore ways of providing financial support to allow full access to recreation programs by residents of need.
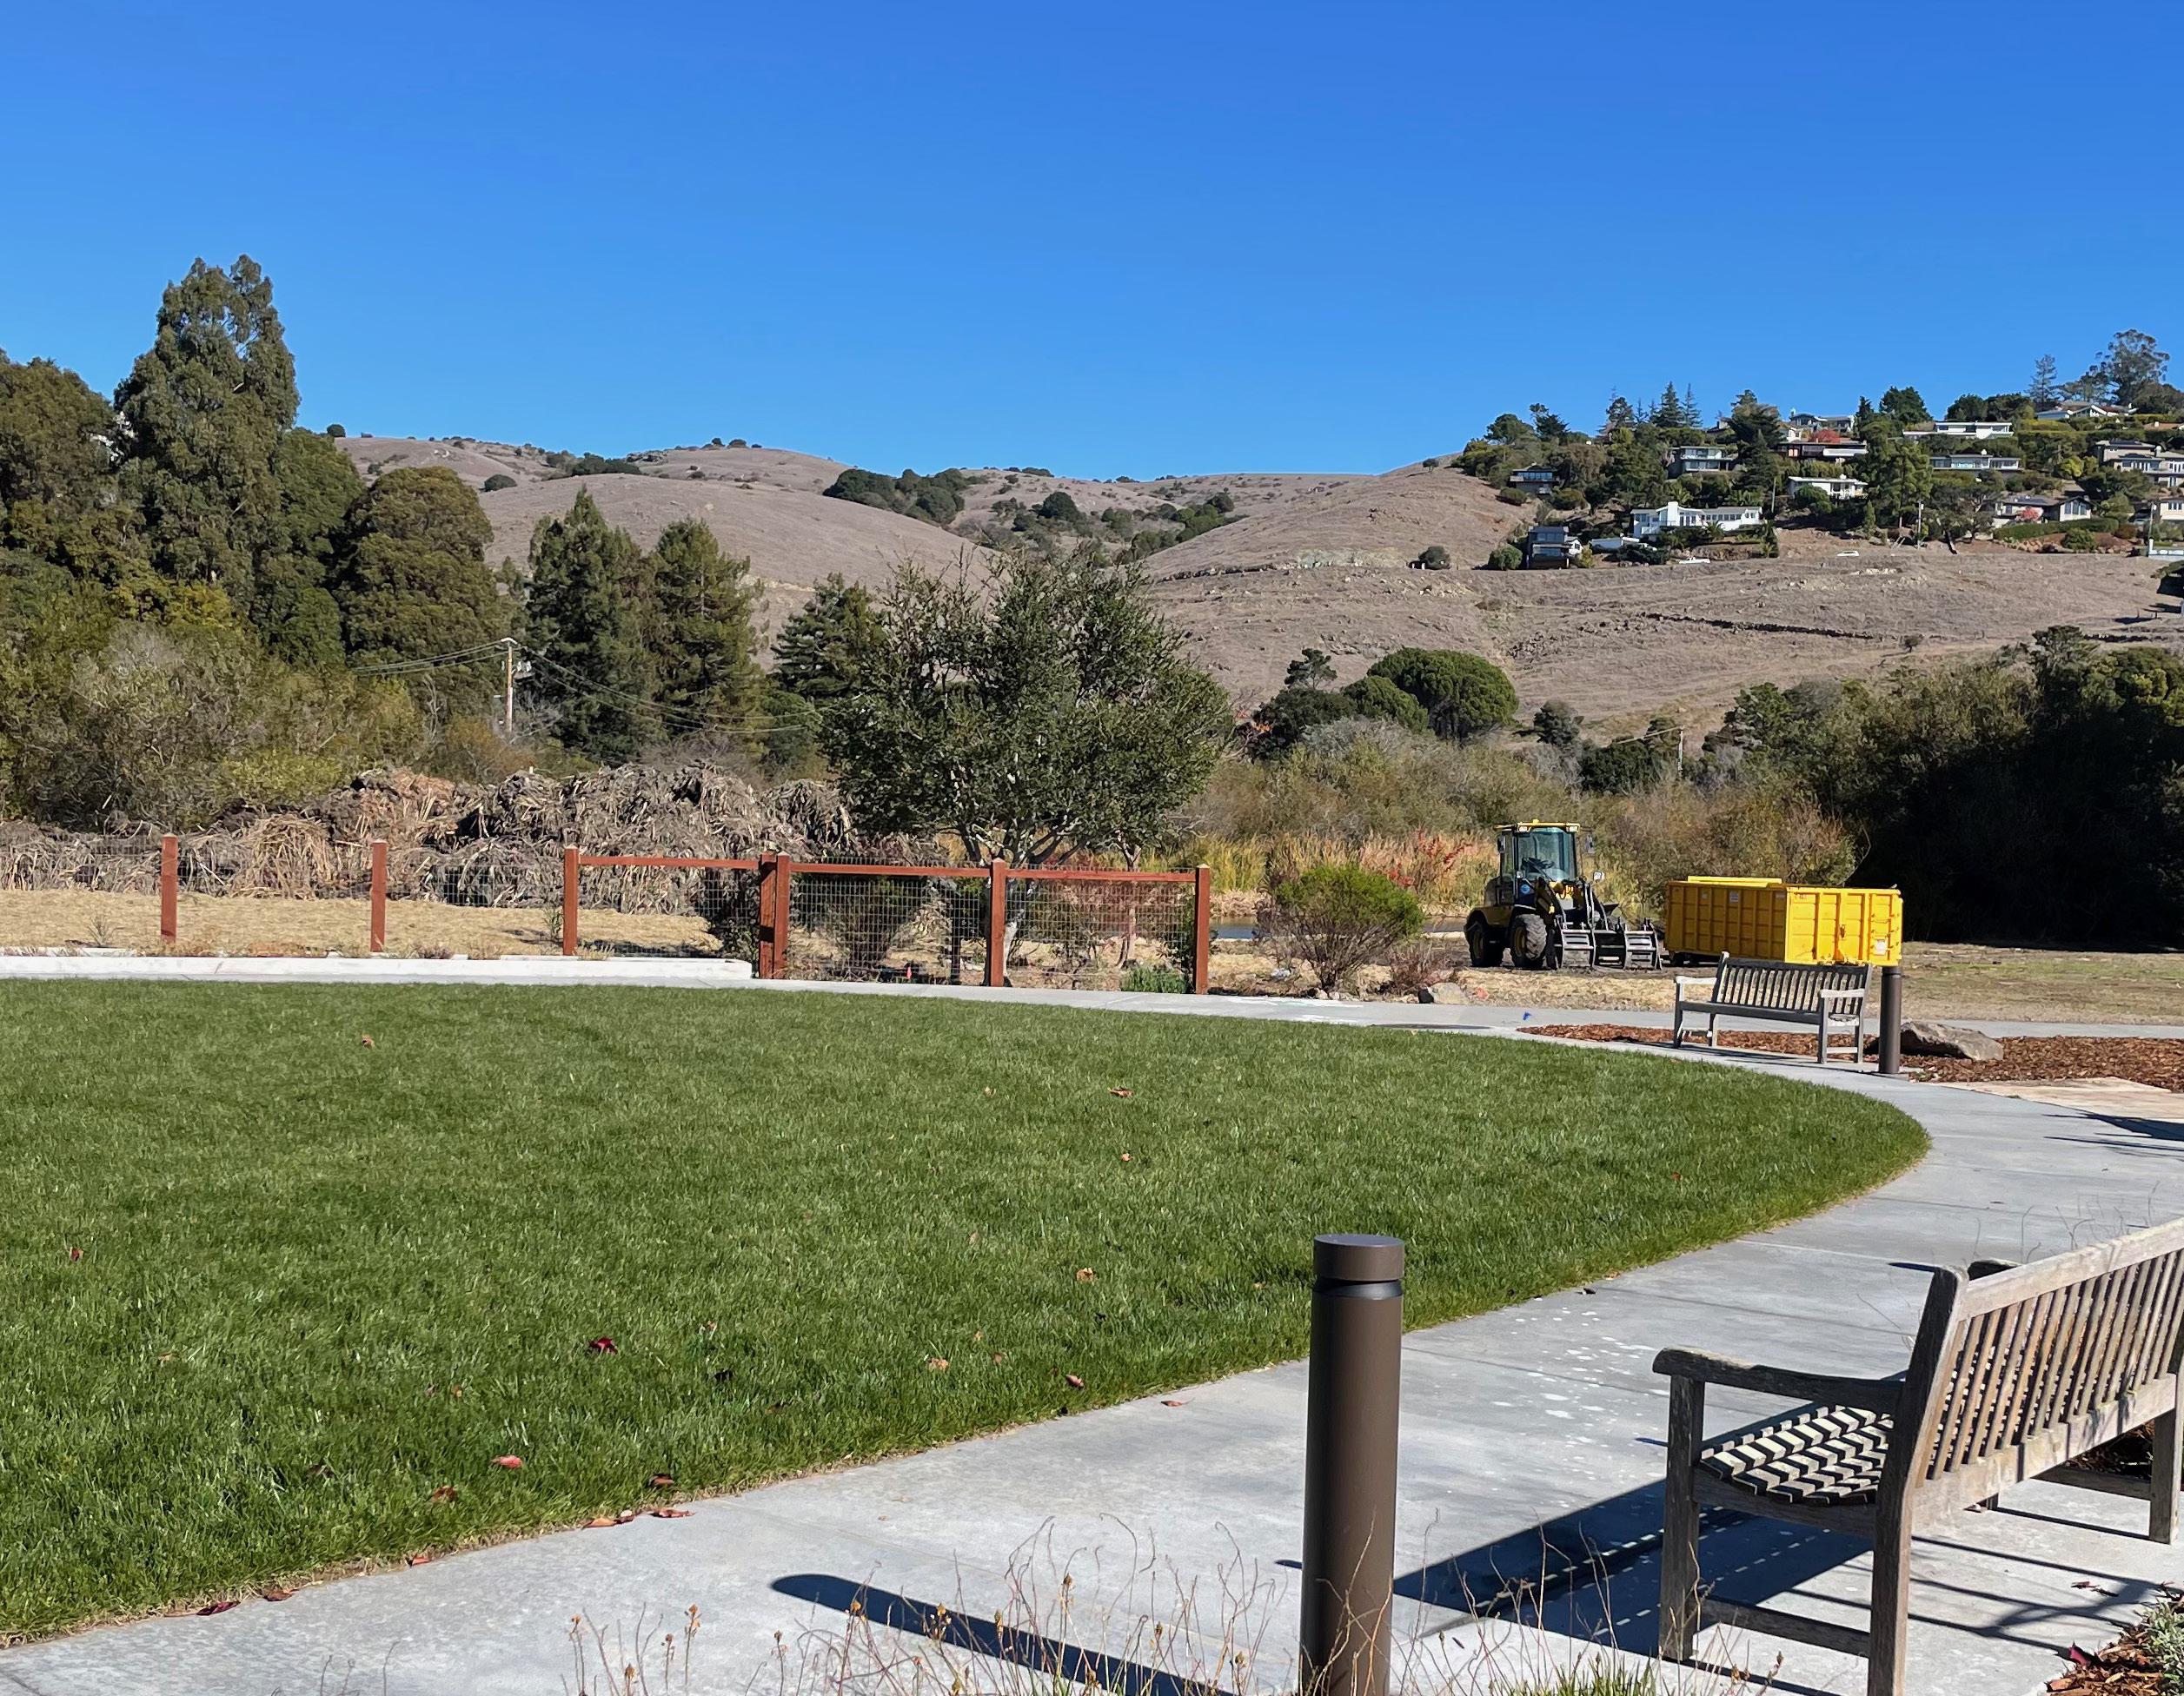
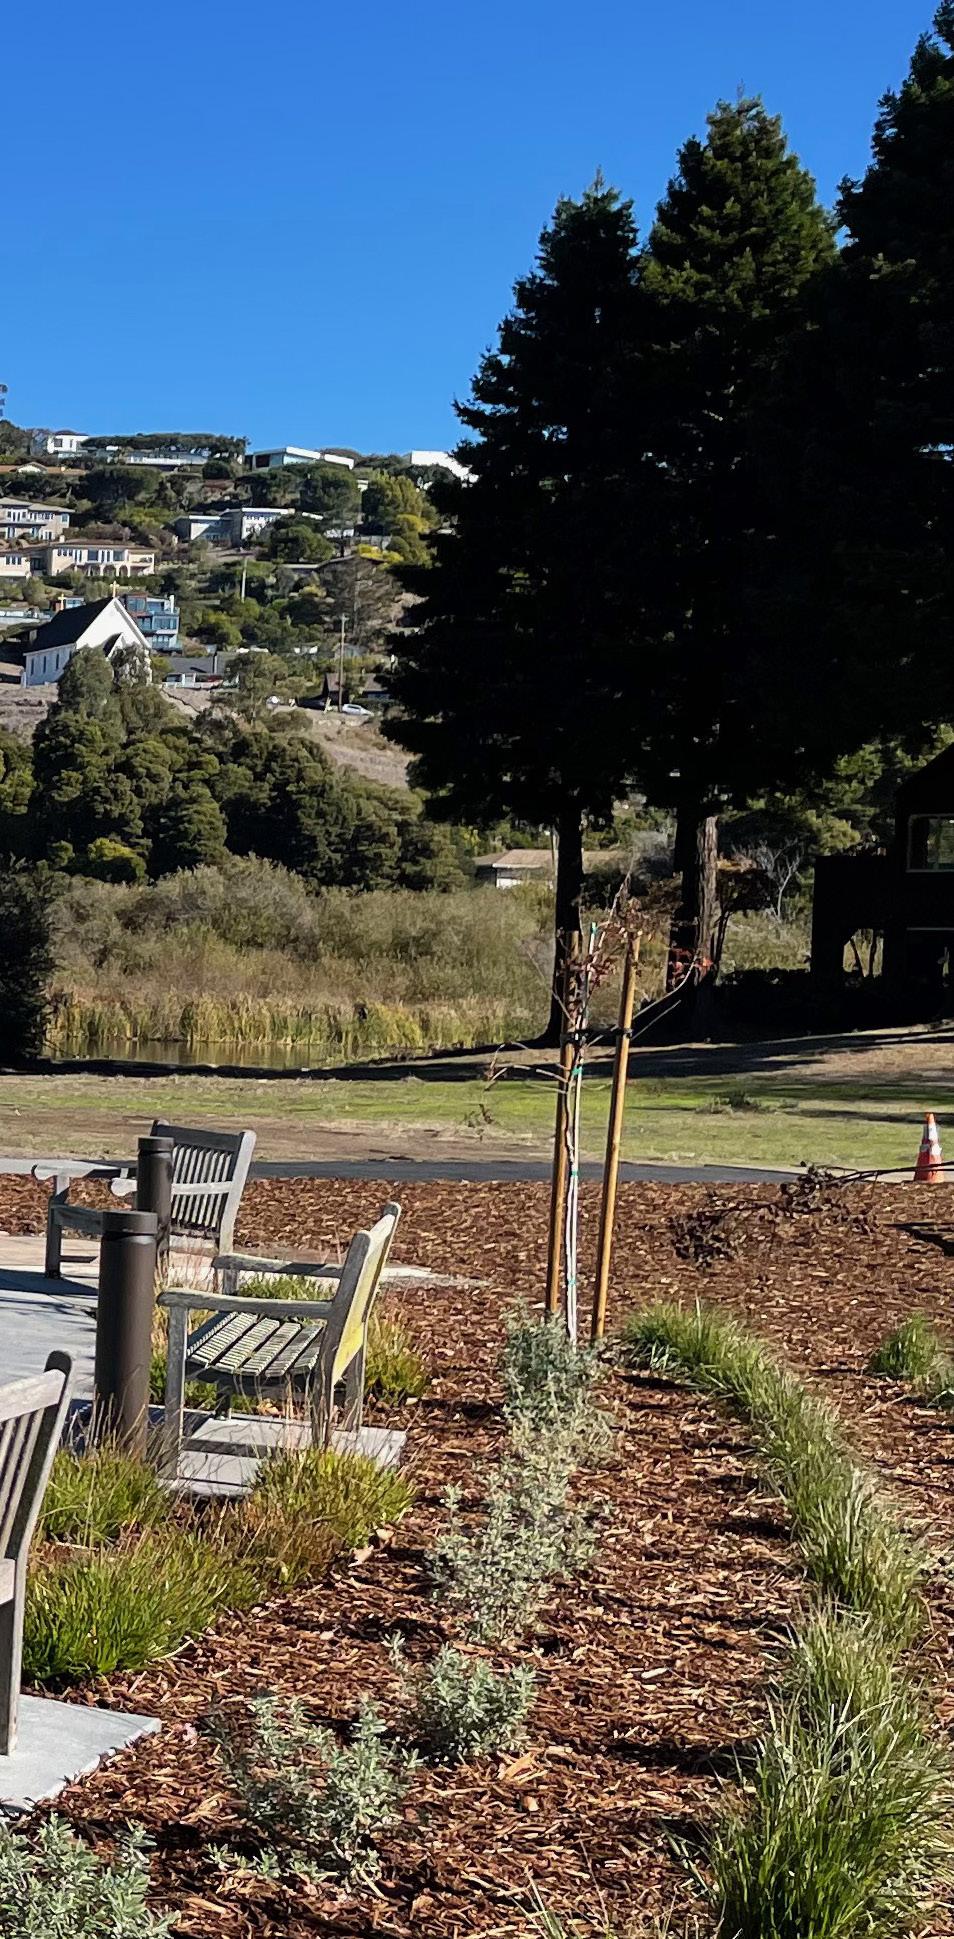
Tiburon is vulnerable to a range of public safety threats including both natural and human-made hazards. Earthquakes, landslides, fire, flooding, sea level rise, and extreme heat events pose serious and real threats to the Town. Planning is critical to identify potential hazards and provide policies and regulatory actions to reduce the community’s risk of death, illness, injury, property damage, and economic and social disruption.
This chapter presents a framework for governing future decisions about how the Town will provide a safe community and protect the community from natural and man-made hazards. The chapter addresses the requirements of the Statemandated safety element and partially addresses the requirements of the land use element of the general plan.
The Safety + Resilience chapter includes the following sections.
11.2 Hazard Mitigation and Emergency Preparedness. Provides an overview to the Town’s approach to reducing safety risks and responding to disasters when they occur.
11.3 Seismic and Geologic Hazards. Describes environmental and man-made hazards including earthquakes, liquefaction, tsunami, and landslide.
11.4 Flood Hazards. Describes flood hazards and flood control and mitigation measures to protect the community from flooding and reduce damage.
11.5 Sea Level Rise. Presents the context of and projections for sea level rise, potentially vulnerable assets in Tiburon, and a framework for decisionmaking.
11.6 Fire Hazards. Discusses fire risks, fire hazard zones, and fire protection measures and service.
11.7 Public Safety. Provides an overview of crime in Tiburon and police protection services.
11.8 Goals, Policies, and Programs. Identifies goals, policies, and programs minimize hazards and risks to life and property.
Hazard mitigation is the use of longterm and short-term policies, programs, projects, and other activities to alleviate the death, injury, and property damage that can result from a disaster. Marin County and its partners, including the Town of Tiburon, developed the 2018 Multi-Jurisdictional Local Hazard Mitigation Plan (2018 LHMP) to assess risks posed by natural hazards and to develop a mitigation strategy for reducing the County’s risks. The LHMP lays out a process to prepare for and lessen the impacts of specified natural hazards that are most likely to impact Marin, such as earthquakes, wildfires, floods, debris flows, wind damage, and tsunamis.
The County and its partners prepared the 2018 LHMP in accordance with the requirements of the Disaster Mitigation Act of 2000 (DMA 2000). Additionally, the plan complies with federal and state hazard mitigation
planning requirements to establish eligibility for funding under the FEMA grant programs. The 2018 LHMP serves as the current Local Hazard Mitigation Plan for all participating jurisdictions.
The 2018 LHMP is currently being updated and is expected to be adopted in 2023. In January 2022 a Vulnerability Assessment was prepared for the Marin Countywide Plan Safety Element Update that will be incorporated into the updated LHMP. The Vulnerability Assessment addresses the adaptation and resilience requirements of Gov’t. Code §65302(g)(4)(A) for Marin County, including the Town of Tiburon, by:
• Identifying exposures to climate change hazards, including drought, extreme heat, flooding, and landslides, debris flows, and postfire debris flows,
• Identifying population groups and community assets that are sensitive to localized climate change effects,
• Evaluating the adapting capacity of identified populations and assets, &
• Conducting vulnerability scoring to describe the degree to which natural, built, and human systems are at risk of exposure to climate change impacts.
Adaptation and resilience goals, policies, and programs in compliance with Gov’t. Code §65302(g)(4)(B) and (C) are contained in Section 11.8.
The Tiburon police station, in addition to day-to-day police activities, houses the Tiburon Peninsula Emergency Operations Center (EOC), which provides disaster response for Tiburon and Belvedere. The EOC is activated during extraordinary emergencies or events and during disasters. The Tiburon Peninsula Emergency Operations Plan guides the Town on how to operate
during an emergency. Tiburon also utilizes standard operating procedures established by Police, Fire, and Public Works for conducting routine monitoring of events to determine appropriate actions prior to activating the EOC.
At the local level, the Tiburon Peninsula EOC is used as the central location for gathering and disseminating information, coordinating all jurisdictional emergency operations, and coordinating with the Marin County Office of Emergency Services and the Marin County Operational Area EOC level during events outside the scope of the Town of Tiburon. When a disaster occurs and two or more of the county’s local jurisdictions’ EOCs (or at the request of one local jurisdiction) within the Marin County Operational Area are activated, the Marin County EOC serves as the focal point for information transfer and supports requests by cities and towns.
If the scope of an emergency is larger than the Marin Operational Area, regional- and state-level EOCs may need to be activated. The California Governor’s Office of Emergency Services is a California cabinetlevel agency that is responsible for emergency preparedness, response, recovery, and homeland security activities within the state.
Tiburon’s location on a peninsula and topography of steep hillsides poses challenging constraints for emergency response and evacuation. One of the major problems Tiburon faces during any emergency is the possibility of becoming isolated from surrounding cities or counties and any subsequent resources or help. The Tiburon Peninsula has one major road (Tiburon Boulevard) and one minor road (Paradise Drive) which provide primary access to the entire planning area. Additionally, there is a second minor road (Trestle Glen Boulevard)
connecting Tiburon Boulevard and Paradise Drive in the northern portion of the planning area; however, the remaining transportation network consists of narrow local streets within the hillsides. Therefore, the susceptibility to road blockages is high and delays during evacuations will be inevitable. During an emergency, some areas could be inaccessible to emergency service personnel and vehicles due to the limited access to the area.
In the event of an area-wide emergency, evacuation of the Tiburon planning area would be difficult. Evacuation traffic on Tiburon Boulevard (Highway 131) would cause severe congestion since that is the only major access route for most of the planning area. As residents use the Highway 101 Tiburon Boulevard/East Blithedale Avenue interchange to evacuate out of Marin County, key choke points would occur causing massive delays for Tiburon residents, especially those located in residential areas in the southern portion of the peninsula. During an evacuation of the Tiburon
Peninsula area, it is anticipated that over 17,000 residents from Tiburon, Belvedere, and Strawberry would potentially utilize this interchange as the main evacuation route since it is the closest interchange to all three communities.
The fire departments serving Tiburon, the Tiburon Fire Protection District and the Southern Marin Fire Protection District, use a cloud-based platform called Zonehaven that provides public safety workers with tools to pre-plan evacuation zones and routes, run scenario models, and collaborate with other agencies. The platform communicates live updates to fire department personnel and the public about evacuation routes, traffic flow, and roadway conditions during an emergency. Using satellite images and other information, the platform delivers real-time evacuation instructions to residents through mobile alerts and social media that can be adapted to the type of emergency, such as wildfire, earthquake, and tsunami. As conditions change, evacuation routes
can be quickly modified. For example, roadways may be closed or turned into one-way evacuation routes as needed.
The Town approved an Evacuation Decal program in August 2018 to demarcate potential evaluation routes to assist residents, businesses, and visitors in evacuating in the event of the disaster. The Evacuation Decal program was developed by the Tiburon Fire Protection District with input from the Belvedere Tiburon Joint Disaster Advisory Council.
The Tiburon Fire Protection District (TFPD) provides fire and emergency medical response services to Tiburon from two stations, including Station 11 downtown (top). Tiburon Boulevard is the town’s primary evacuation route (bottom).
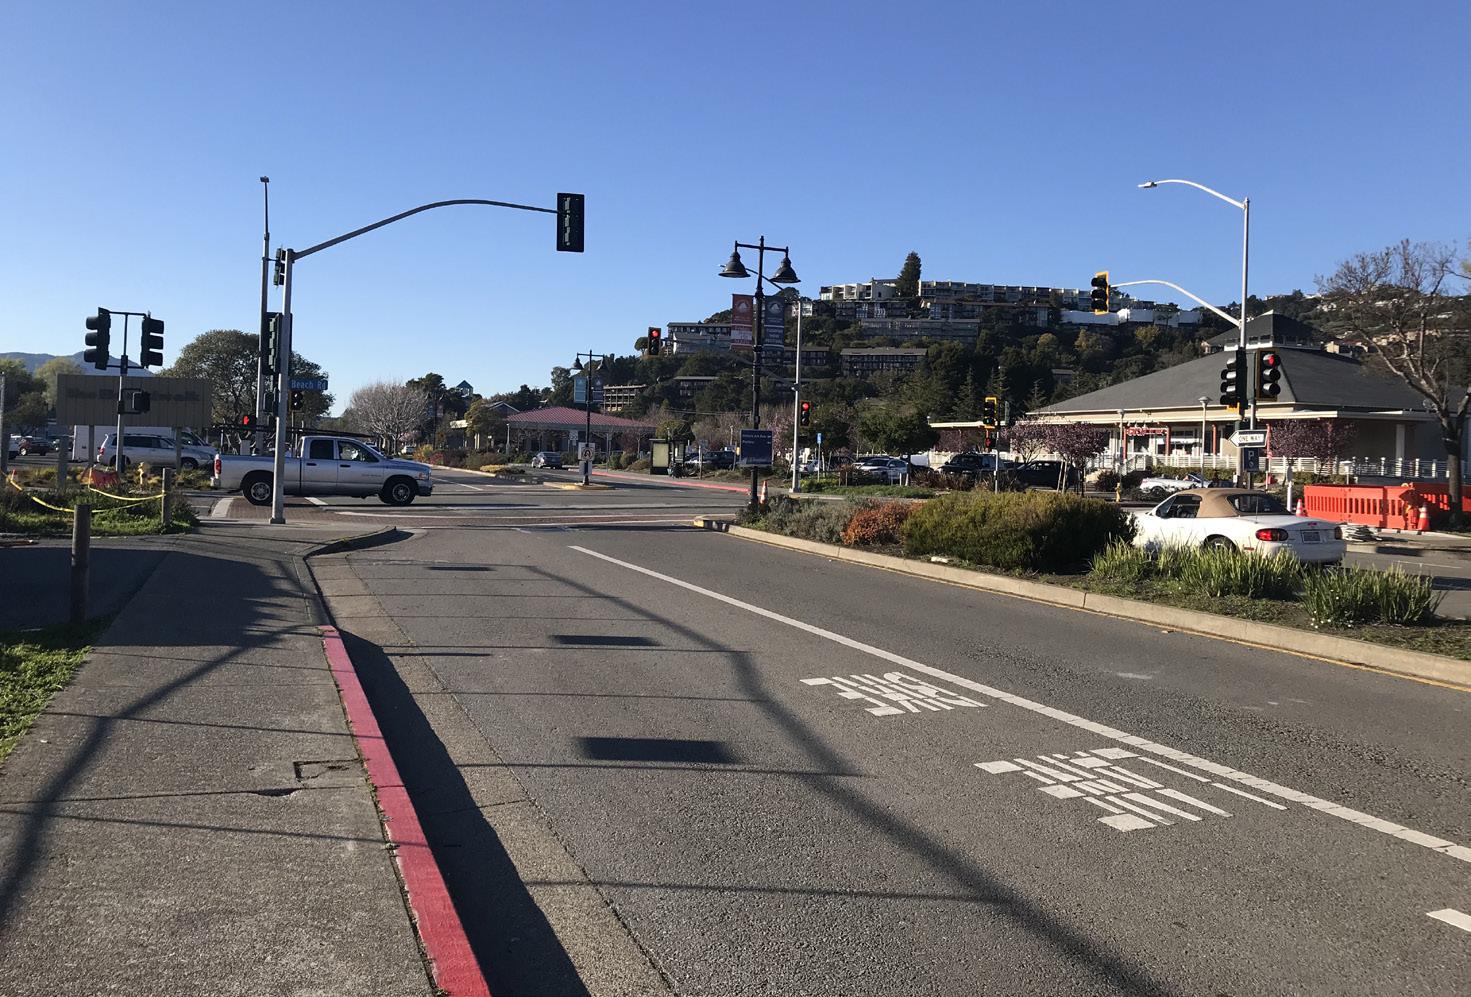
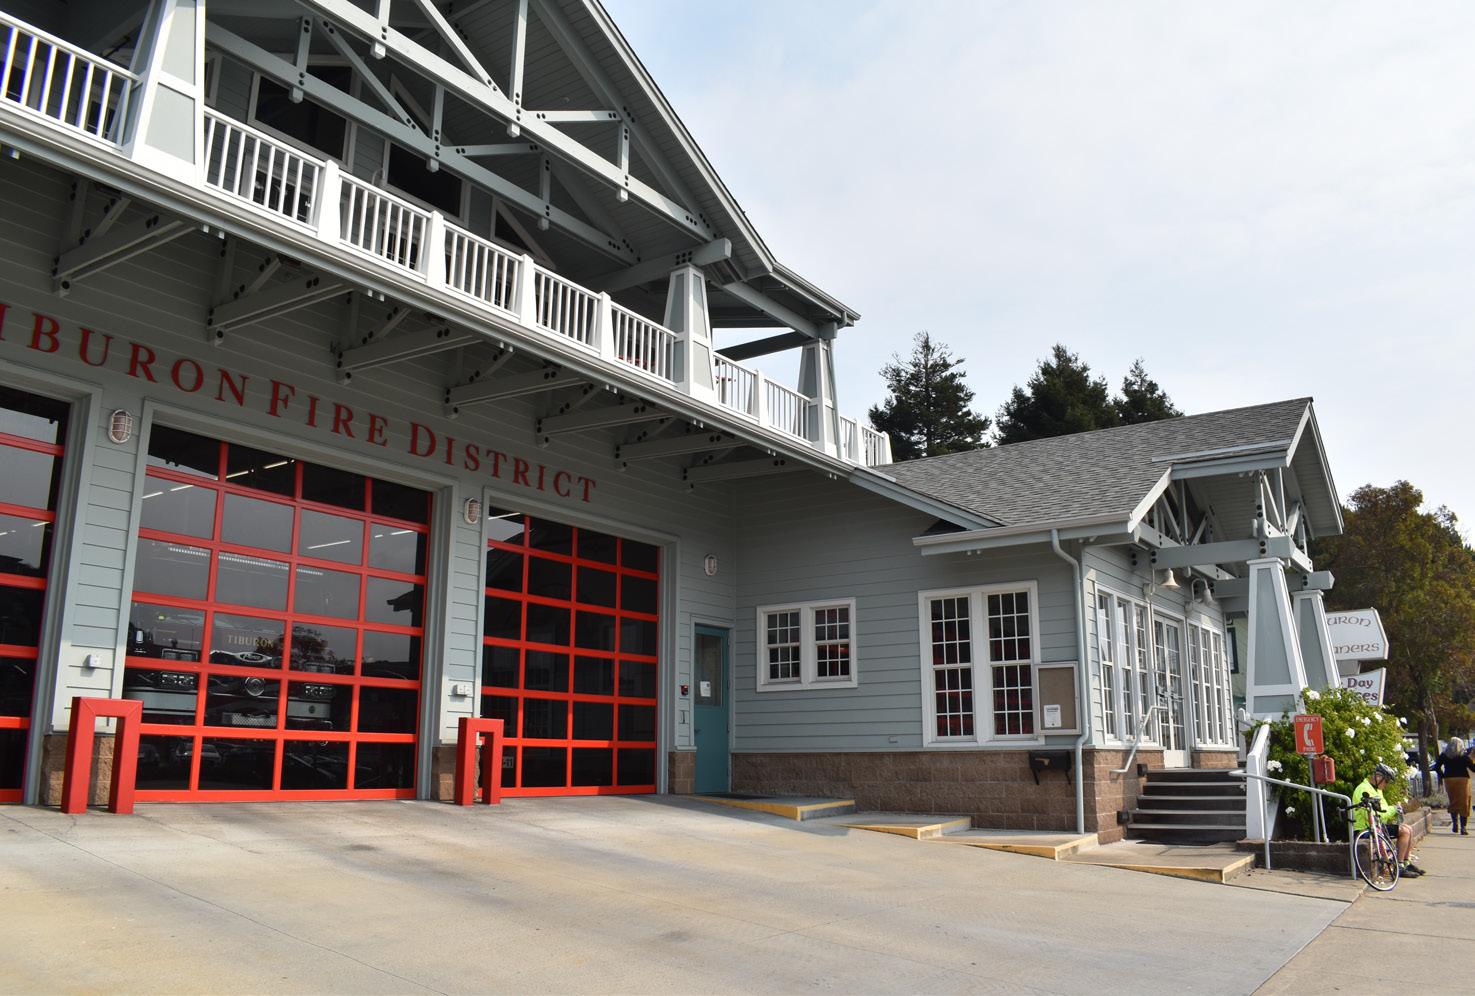
Tiburon is located in the seismically active San Francisco Bay region, an area with a long history of tectonic movements. The region sits on the boundary between two of the Earth’s major tectonic plates—the Pacific and North American Plates—which move inexorably past each other at a rate of about two inches per year. Much of this motion is accommodated from time to time by sudden slips on faults, producing an earthquake. Although the San Andreas fault is the main origin of slip, other faults splay out from the plate boundary throughout most of California.
The San Andreas fault, located about 9 miles east of Tiburon, was the source of the magnitude 7.9 earthquake in 1906. The most recent large earthquake on the San Andreas fault was the magnitude 6.9 Loma Prieta earthquake in 1989. The Loma Prieta earthquake caused intense seismic activity throughout the Bay Area, collapsing a doubledecked freeway in West Oakland and destroying buildings in San Francisco’s
fill-based Marina District. In 2014, the United State Geological Survey’s earthquake forecast for California concluded there is a 72% probability of at least one earthquake of magnitude 6.7 or greater striking somewhere in the San Francisco Bay region before 2043.
Other faults near Tiburon include the Hayward fault, which is located approximately 7 miles to the east. Figure SR-1 provides a map of earthquake faults in the region and indicates 69 significant earthquakes with a magnitude of 4.0 or greater since 1906. An earthquake with a magnitude of 4.0 can be felt by most people indoors, while an earthquake with a magnitude over 6.0 can cause damage over a large area. No significant earthquakes occurred Tiburon during this time.
Damage resulting from earthquakes is mainly from shaking. The intensity of shaking that a structure will experience during an earthquake depends upon the magnitude of the earthquake, the
proximity to the epicenter, and the type of ground materials beneath the structure. Soft soils amplify the shaking, while hard bedrock does not. All buildings located in Tiburon are vulnerable to earthquake damage, but depending upon construction, some buildings are expected to perform better than others. One and twostory wood-frame buildings generally perform well, but they may shift if not bolted to the foundation or partially collapse if cripple walls (short walls between the foundation and first floor that create a crawl space) are not braced. Homes with rooms built over garages are also vulnerable to collapse if walls are not reinforced or braced. While current building codes address seismic safety, they are designed to protect occupant lives during an earthquake. Newly constructed buildings can still be significantly damaged during a major earthquake.
Unreinforced masonry buildings (including materials such as brick,
concrete, and stone), pre-1940 woodframe houses, and pre-1973 concrete buildings are very likely to be damaged during earthquakes. In most cases, these older buildings require retrofit, or they risk significant structural damage during an earthquake.
Structures built in areas of watersaturated granular sediment or fill material are susceptible to liquefaction. The ground shaking from an earthquake transforms the material from a solid state to a temporarily liquid state. Liquefaction is a serious hazard because buildings in areas that experience liquefaction may sink or suffer major structural damage. Most single and multifamily homes under ten stories are unlikely to have foundations stable enough to withstand liquefaction even if they can withstand ground shaking.
EARTHQUAKE FAULTS AND SIGNIFICANT EARTHQUAKES WITH A MAGNITUDE OF 4.0 OR GREATER SINCE 1906 SanAndreasFault SanAndreasFault
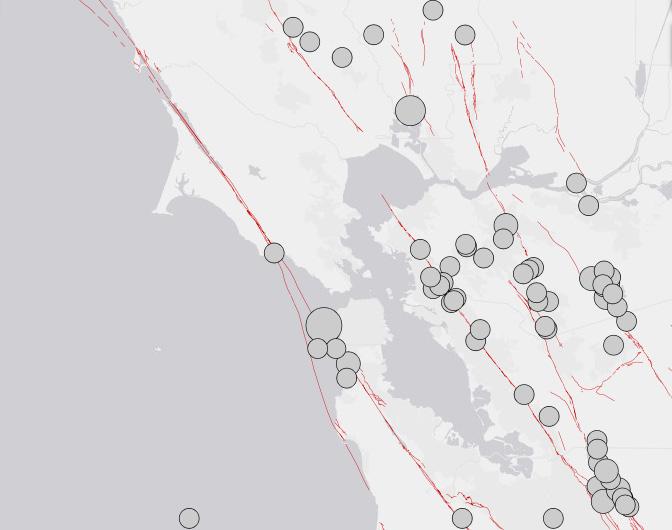
Liquefaction potential in the planning area includes designation of “Very Low” to “Very High” as shown in Figure SR-2. Areas in Tiburon designated with very high potential for liquefaction are generally located in the Downtown from the bay to Mar West Street, including Town Hall and the Tiburon Fire Station #11; the Blackie’s Pasture area and Tiburon Ridge and Belveron neighborhoods; and the Cove Shopping Center and Bel Aire neighborhood.
A tsunami is a series of traveling ocean waves caused by underwater earthquakes, volcanic eruptions, or landslides. Out in the ocean, tsunami waves do not dramatically increase in height. But as the waves travel inland, they build up to higher and higher heights as the depth of the ocean decreases. As the tsunami enters the shallow water of coastlines, waves can reach heights of over 100 feet and strike with devastating force. Depending on the location of an incident, a tsunami can reach the California coast in as little as ten minutes for a local source earthquake or take from 5 to 14 hours for a distant source earthquake. Areas
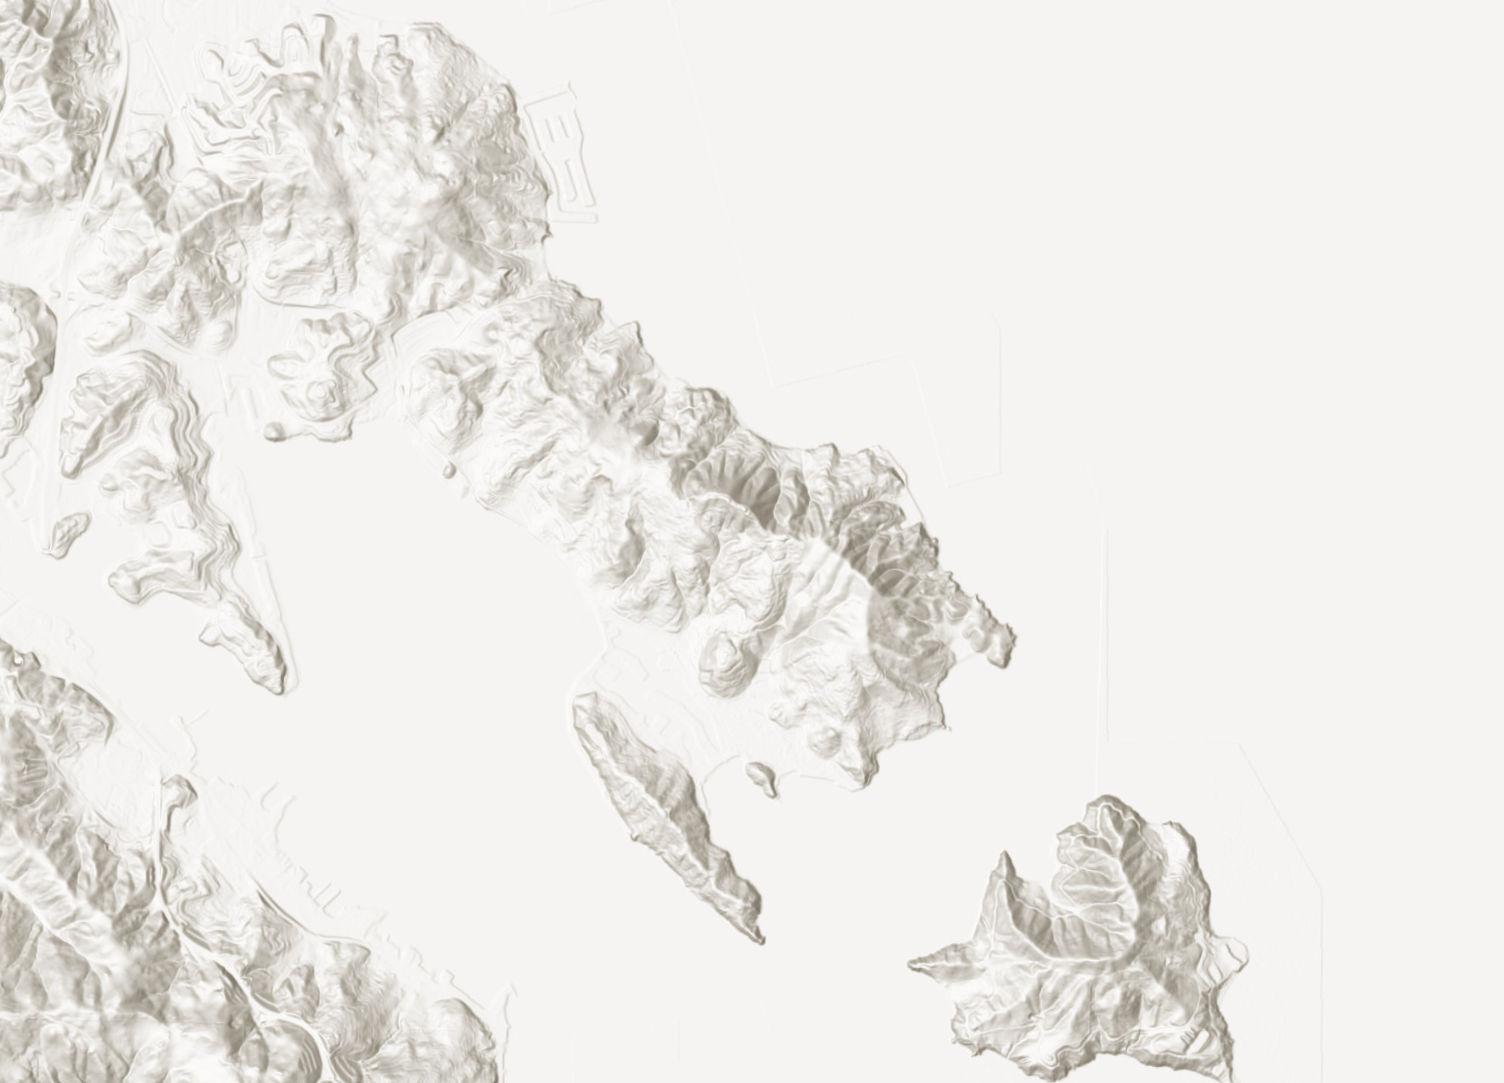
at greater risk if they are less than 25 feet above sea level and within a mile of the shoreline.
While over 80 tsunamis have been observed or recorded along the coast of California in the past 150 years, there is no history of any significant damage caused by a tsunami in Marin County.
The Town is recognized by the National Oceanic and Atmospheric Administration as a TsunamiReady community. To be earn this designation, a community must:
• Establish a 24-hour warning point and emergency operations center
• Have more than one way to receive tsunami warnings and to alert the public
• Promote public readiness through community education and the distribution of information
• Develop a formal tsunami plan, which includes holding emergency exercises
• Comply with TsunamiReady guidelines
Figure SR-3 shows the tsunami inundation areas within the Tiburon Peninsula. Vulnerable areas are
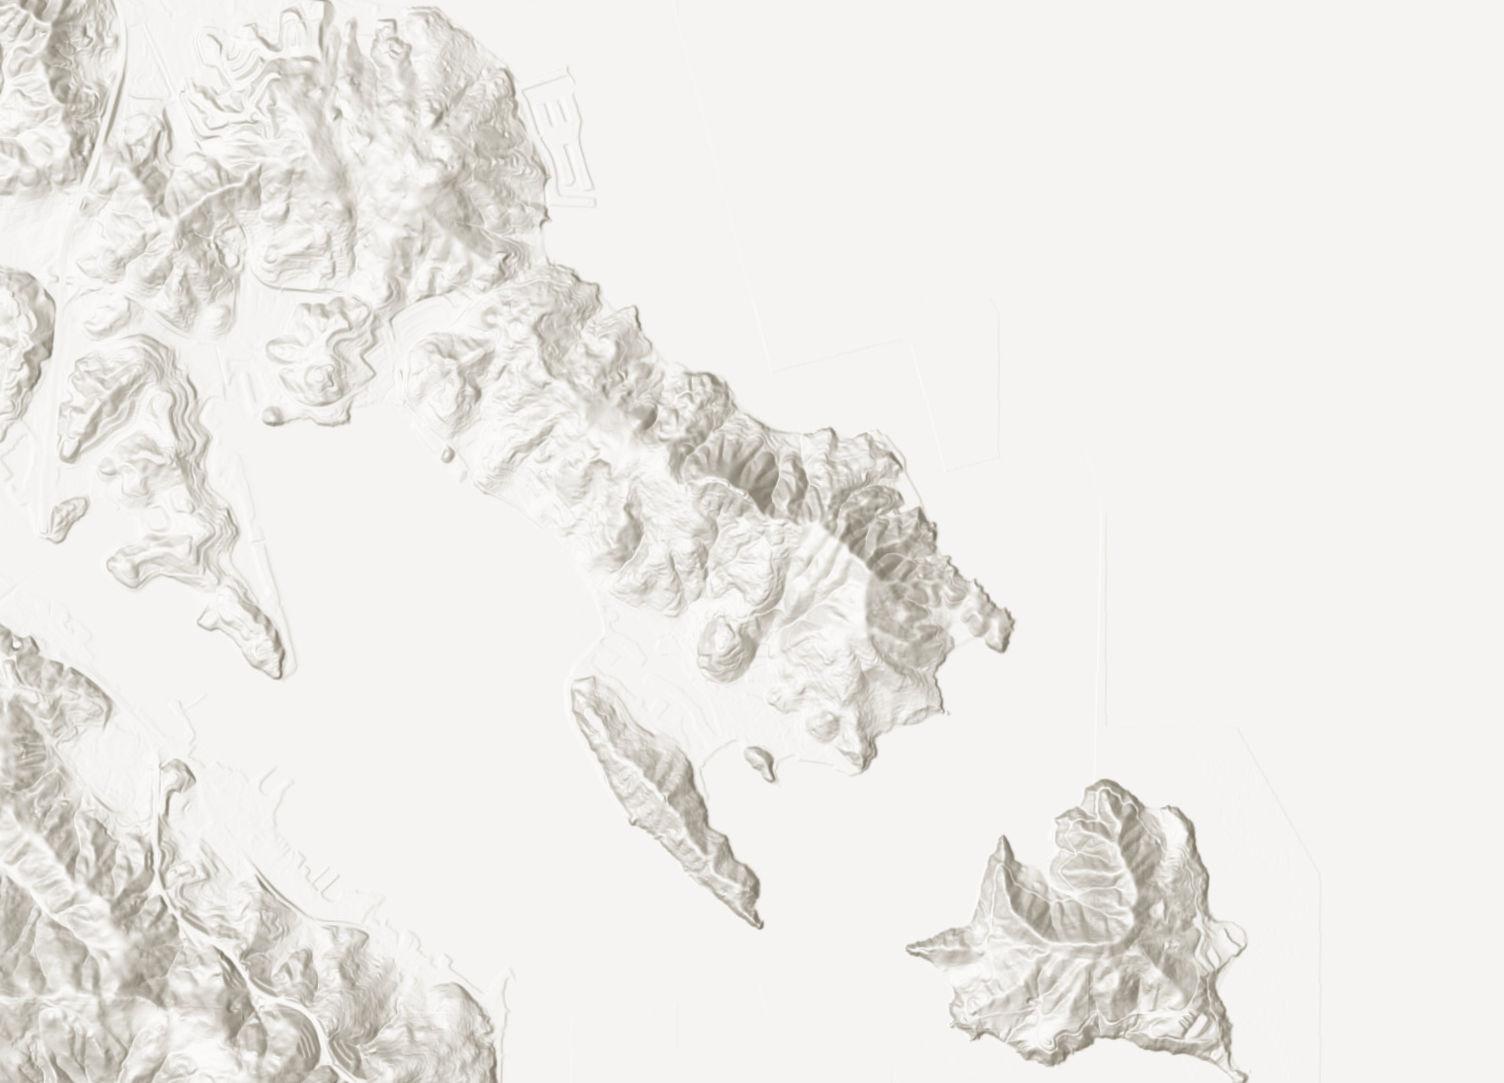
Downtown, including Town Hall and the Tiburon Fire Station #11; Blackie’s Pasture; the Cove Shopping Center; and waterfront properties along Paradise Drive. Additionally, many recreational areas such as beaches, the shoreline park, Paradise Park, and the Old Rail Trail are at risk from tsunamis. A tidal surge from a tsunami could lead to flooding of low-lying areas, similar to a winter storm-related slow rise flood, but more rapidly. Inundation could continue for up to 24 hours from the time of initial impact.
Landslides are a potential hazard to structures, roads, and utilities on hillsides in Tiburon. Landslides can move slowly, as in hillside creep, or can move quickly and disastrously, as is the case with debris flows. Almost every landslide has multiple causes. Landslides can be initiated in slopes already on the verge of movement by rainfall, erosion, earthquake, and disturbance by human
activities. Factors that indicate the probable formation and relative risk of landslide and slope instability include:
• Slope Steepness: Most landslides occur on moderate to steep slopes.
• Slope Material: Loose, unconsolidated soils and soft, weak rocks are more hazardous than are firm, consolidated soils, or hard bedrock.
• Water Content: Increased water content increases landslide hazard by decreasing resistance to sliding and adding weight to the materials on a slope.
• Vegetation Coverage: Abundant vegetation with deep roots increases slope stability.
• Proximity to Areas of Erosion or Man-Made Cuts: Undercutting slopes may greatly increase landslide potential.
• Earthquake Ground Motions: Strong ground shaking may trigger landslides in marginally stable slopes or loosen slope materials
and thus increase the risk of future landslides.
Hillsides in Tiburon have a low to high potential for landslide as shown in Figure SR-4.

Tiburon is subject to flooding problems due to periodic heavy winter rainfalls, tidal fluctuations, and the potential for tsunamis and sea level rise. Impacted areas are the low-lying areas adjacent to the San Francisco Bay, Belvedere Cove, Belvedere Lagoon, and Richardson Bay. During heavy rainfall conditions, and especially when combined with high tides, certain areas are known to flood, including Beach Road at Tiburon Boulevard, Tiburon Boulevard at Ned’s Way, and Tiburon Boulevard near Greenwood Beach Road by the 76 gas station. Actions, such as clearing storm drains, are taken by the Department of Public Works in Tiburon to mitigate flooding on the Peninsula regularly and prior to expected storms. Sea level rise is expected to exacerbate flooding issues, as described in section 11.5.
Congress passed the National Flood Insurance Act of 1968 and the Flood Disaster Protection Act of 1973 to address the increasing cost of floodrelated disaster relief. The intent of the
National Flood Insurance Program, which was established by the 1968 Act, is to reduce the need for large, publicly funded flood control structures and disaster relief by restricting development on floodplains.
The Federal Emergency Management Agency (FEMA) administers the National Flood Insurance Program to provide subsidized flood insurance to communities that comply with FEMA regulations and limit development on floodplains. FEMA issues Flood Insurance Rate Maps (FIRM) for communities participating in the flood insurance program. The FIRM maps delineate flood hazard zones in the community.
The FIRM maps play several critical roles. First, the maps are used by local and county agencies to identify and plan for local or area flood protection. Second, the maps are used by the banking and insurance industries to determine if flood insurance is mandated for a specific property or
area. Lands located within the Special Flood Hazard Areas (areas subject to 1 percent chance of flooding in any given year) require that flood protection insurance be secured for federally regulated or insured loans. Lastly, the maps are used at the federal and State level to plan for waterway projects that are administered by the US Army Corps of Engineers. Improvements, construction, and developments within Special Flood Hazard Areas are generally subject to the following standards:
• All new construction and substantial improvements of residential building must have the lowest floor (including basement) elevated to or above the base flood elevation (BFE).
• All new construction and substantial improvements of non-residential buildings must either have the lowest floor (including basement) elevated to or above the BFE or dryfloodproofed to the BFE.
• Buildings can be elevated to or above the BFE using fill, or they can be elevated on extended foundation walls or other enclosure walls, on piles, or on columns.
• Extended foundation or other enclosure walls must be designed and constructed to withstand hydrostatic pressure and be constructed with flood-resistant materials and contain openings that will permit the automatic entry and exit of floodwaters. Any enclosed area below the BFE can only be used for the parking of vehicles, building access, or storage.
The Town participates in the National Flood Insurance Program, which makes federally backed flood insurance available to homeowners, renters, and business owners in communities that adopt and enforce floodplain management ordinances to reduce flood damage. Approximately 140 flood insurance policies are in force in Tiburon.
The Town’s Floodplain Management Regulations are contained in Title IV, Chapter 13D of the Tiburon Municipal Code. These regulations implement the FEMA standards for construction and development within Special Hazard Zones in Tiburon. The Town requires new construction and substantial improvement of any structure to have the lowest floor, including the basement, elevated at least two feet above the base flood elevation.
Figure SR-5 shows the areas of Tiburon that are prone to flooding, as identified by FEMA. Areas in the 100-year flood zone have a 1 percent chance of flooding in any given year, while areas in the 500-year flood zone have a 0.2 percent chance of flooding. Buildings with habitable living space or critical building equipment below grade are likely to be significantly damaged by flooding.

The 100-year floodplain is largely confined to the Boardwalk Shopping Center and Downtown Tiburon Area
adjacent to the Belvedere Lagoon, as well as areas along the coast, including Blackie’s Pasture. The Town Hall and Tiburon Fire Station #11 are also located in the 100-year floodplain. Areas in the 500-year floodplain include the expanded areas of the 100year flood plain, as well as the Cove Shopping Center and portions of the Bel Aire neighborhood. While property damage to structure is a major concern, damage to roads, utilities, and other infrastructure located in these zones could potentially impact other areas of the community as well.
The Town has robust maintenance and capital improvement programs to help manage and mitigate flood risk. Despite flood control efforts, Tiburon will experience local flooding in future years. During the winter months, Marin County experiences “atmospheric river” storms that can deliver over one inch of rain per hour over extended time frames, causing localized flooding. Scientists warn that climate change could increase the frequency and
intensity of atmospheric river storms in California, mostly in the form of occasional years with more extreme storms. These tendencies could produce more frequent and severe flooding.
In addition, the most severe winter storms come with strong winds and many of these cause damage. This can lead to power outages, road closures, clogged creeks and culverts, and damage to structures and personal property from fallen trees.
According to California’s latest Climate Change Assessment, annual average temperatures in the Bay Area will likely increase by approximately 4.4°F by the middle of this century and 7.2°F by the end of the century— unless there are significant efforts throughout the world to limit or reduce greenhouse gas emissions. Even with significant reduction efforts, the temperature increase is projected to be approximately 3.3°F by mid-century and 4.2°F by century’s end . The effects of increasing global temperature are far-reaching and extremely difficult to quantify. The scientific community continues to study the effects of global climate change. According to the most recent California Climate Change Assessment (California’s Fourth Climate Change Assessment) (2018), the impacts of global warming in California are
anticipated to include, but are not limited to, the following:
• losses to the Sierra snowpack and water supply;
• more and more intense wildfires;
• saltwater contamination, flooding and pests that will affect agriculture;
• more and more extreme heat events that will impact vulnerable populations;
• threats to biological diversity; and
• rising sea levels, which could threaten coastal areas through accelerated coastal erosion, threats to levees and inland water systems and disruption to coastal wetlands and habitat.
This section discusses the role of local governments in adapting to sea level rise, sea level rise projections as they pertain to Tiburon, vulnerable areas and assets, and a framework for making adaptation decisions. The General Plan’s goals, policies, and
programs for adapting to sea level rise are in section 11.8.
Because local governments largely determine the shape of development through land use plans, regulations, and implementing decisions, local governments play an important role in developing climate change strategies including resiliency planning and adaptation. These strategies will need to be coordinated as part of a larger regional or statewide strategy.
Marin County established the Bay Waterfront Adaptation & Vulnerability Evaluation (BayWAVE) program in 2015 to study and address sea level rise. In June 2017, the BayWAVE program delivered the Marin Shoreline Sea Level Rise Vulnerability Assessment. This Vulnerability Assessment seeks to provide context and estimates of the physical and fiscal impacts across the County’s
bayside shoreline over the coming decades. The Vulnerability Assessment is also presented by jurisdiction in community profiles to enable local professionals, officials, and residents to engage in local discussions. Each community profile details key issues and geographic locations and includes economic, environmental, equity, and management considerations related to sea level rise vulnerability. A community profile for the Town of Tiburon is included in the Vulnerability Assessment.
As a next step in the BayWAVE program, Marin County released Adaptation Land Use Planning: Guidance for Marin County Local Governments, a guidebook to help local governments plan effectively to adapt to sea level rise. The County describes an “adaptation pathways” process that accommodates stakeholder engagement as well as cross-jurisdictional approaches to shared impacts. It encourages integration of capital improvement
tools with land use planning tools. The guide has been a resource in the development of policies and programs in this General Plan.
Notable adaptation efforts are currently underway in and around Tiburon, including both infrastructural strategies (the proposed Belvedere seawall) and nature-based strategies such as the gravel beach or replenished mixed sand-gravel beach under consideration for the Greenwood Beach area.
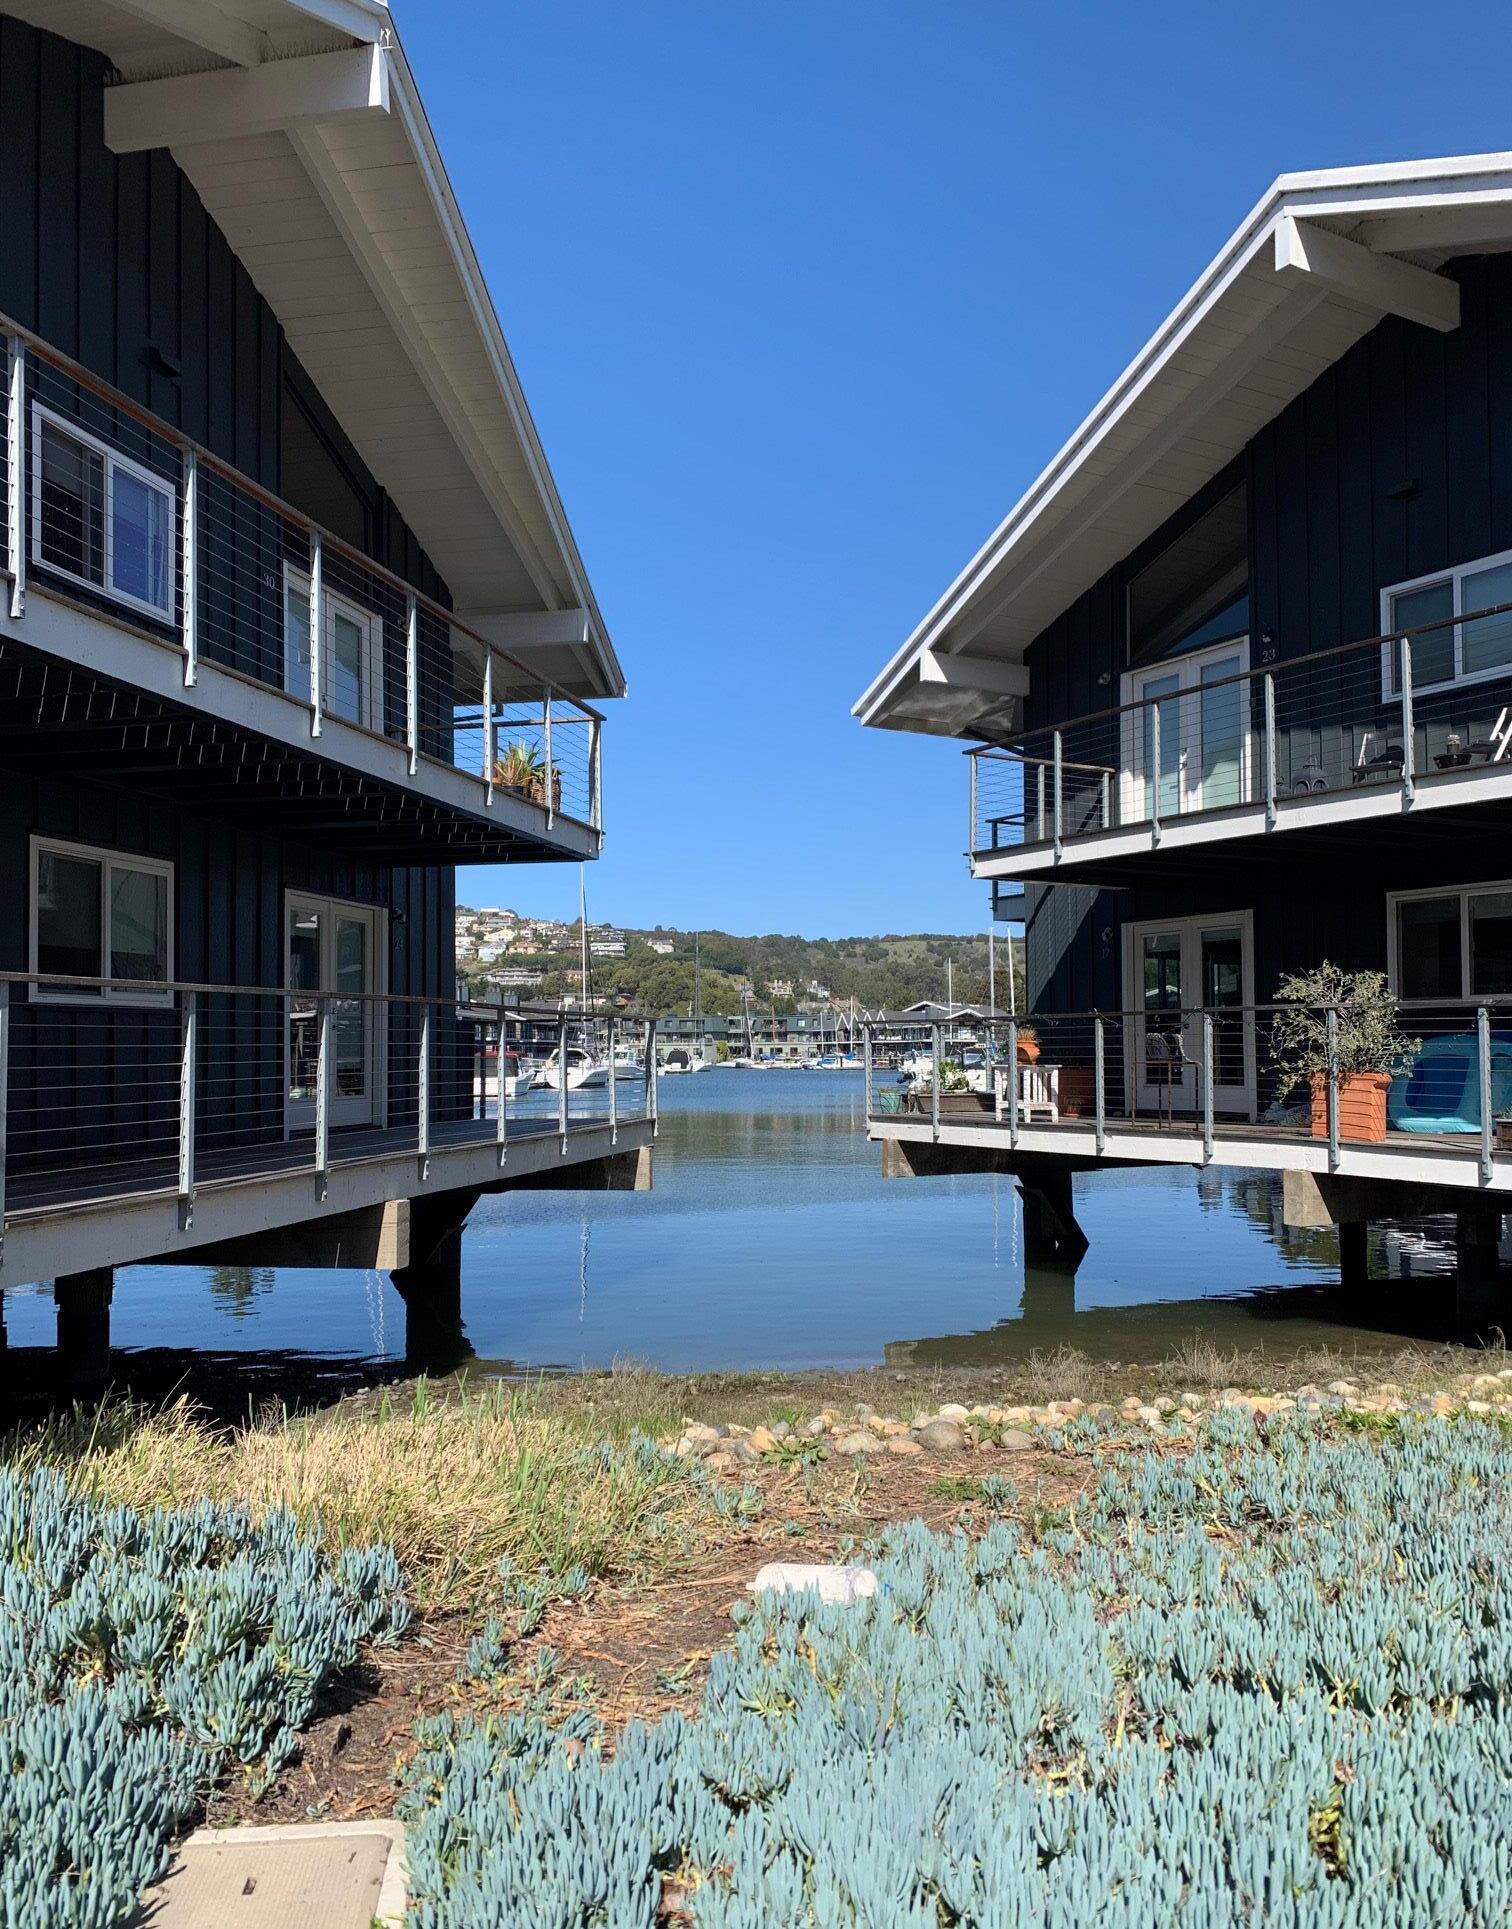
Global models indicate that California will see substantial sea level rise during this century, with the exact magnitude depending on such factors as global emissions, the rate at which oceans absorb heat, melting rates and movement of land-based ice sheets, and local coastal land subsidence or uplift.
The Marin Shoreline Sea Level Rise Vulnerability Assessment was prepared in June 2017 as part of the BayWAVE program to understand and identify the effects of sea level rise on the seaside communities within Marin County. Sea level rise estimates used in this analysis are from the USGS Coastal Storm Modeling Systems (CoSMoS) and are viewable online through the Our Coast Our Future (OCOF) Flood Map tool. The six OCOF scenarios selected for the Vulnerability Assessment analysis are identified in Table SR-1. Figure SR-6 illustrates how these scenarios may be considered in terms of time, based on the State of California’s guidance from 2018.
Tiburon is located along an extensive peninsula projecting into Richardson and San Pablo Bays. The peninsula is generally steep with several areas of reinforced shoreline. As shown
Sea level rise and shallow groundwater is expected to cause tidal inundation in the Greenwood Cove area
in Figures SR-7 through SR-9, very limited areas of Tiburon (about 50 acres) are likely to be vulnerable in the near- and medium-term. However, this includes highly valued shoreline shops and restaurants on Main Street as well as portions of Bay Road and the Boardwalk shopping center and lowlying natural areas in the Greenwood Beach area. Access to Tiburon from Highway 101 and Corte Madera could also flood in the medium-term, potentially cutting off residents from critical services and destinations.
In the long-term, much of Downtown Tiburon as well as the Cove and Boardwalk shopping center areas and portions of Paradise Cay and Bel Aire neighborhoods (some 135 acres in total, on 450 properties) may be vulnerable to inundation. Vulnerable downtown assets include Tiburon Boulevard and other streets; the Bay Trail; the Ferry Terminal; the Tiburon Fire Department, library, and post office; historic buildings along Main Street; hotels, shops, businesses, and housing. The long-term projection (Scenario 6)
could result in over $400 million in assessed value damage and nearly $600 million in the single-family market in Tiburon, as well as approximately 2.5 miles of flooded roadways exposed to saltwater and erosion (Marin County Department of Public Works, June 2017).
While these projections are critical to our ability to prepare and adapt, these projections may not present a complete picture of rising water levels in specific locations. Sea level rise will be accompanied by rising groundwater levels, fluvial flooding, and shoreline erosion. The interaction of these factors – as well as the potential for liquefaction associated with seismic events—will create localized conditions that are as yet not fully understood.
Source: Marin County Department of Public Works, June 2017.
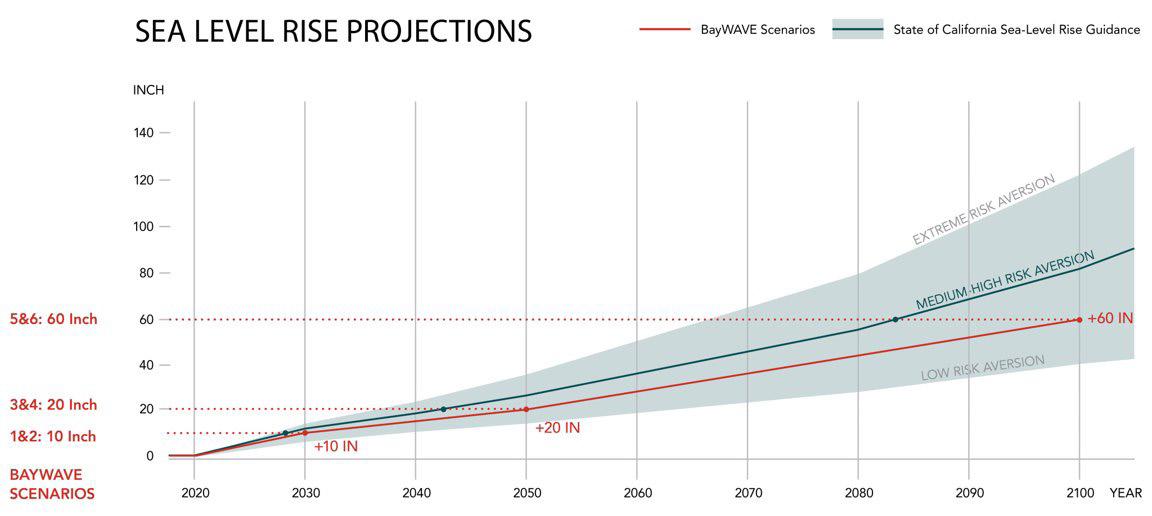
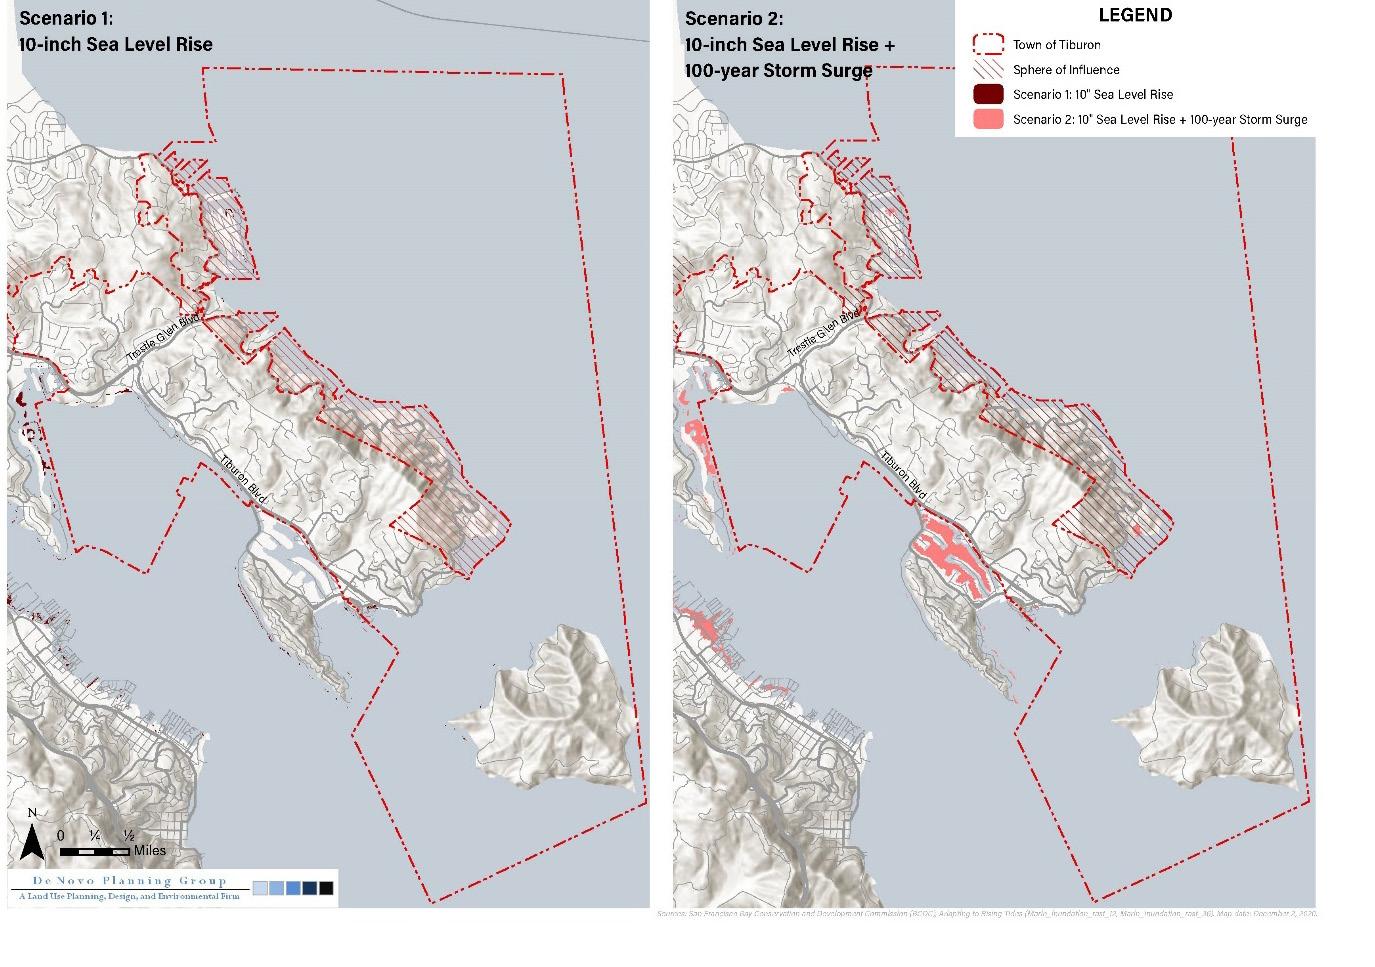
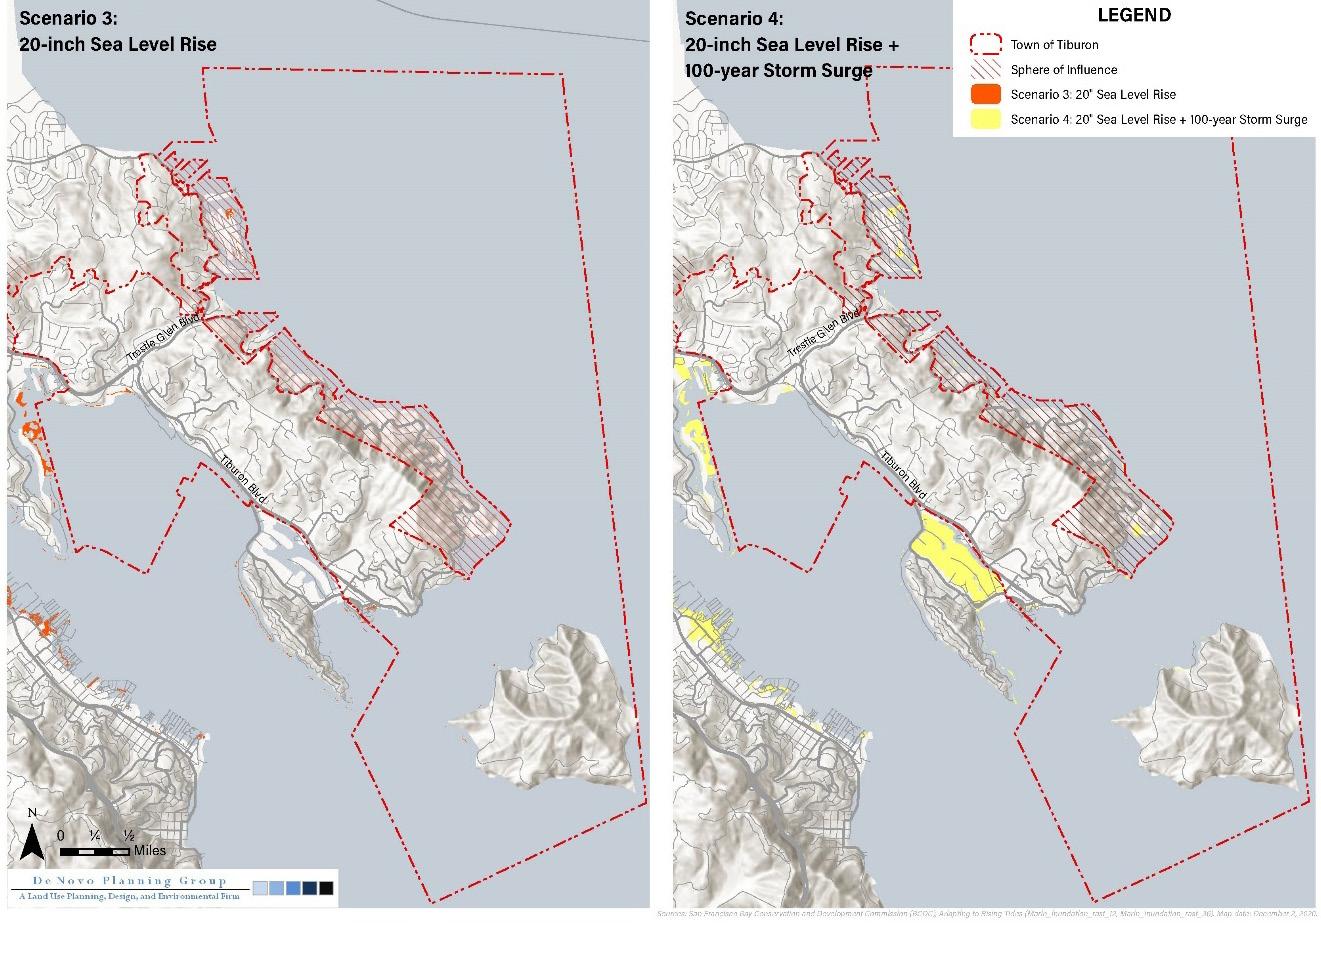
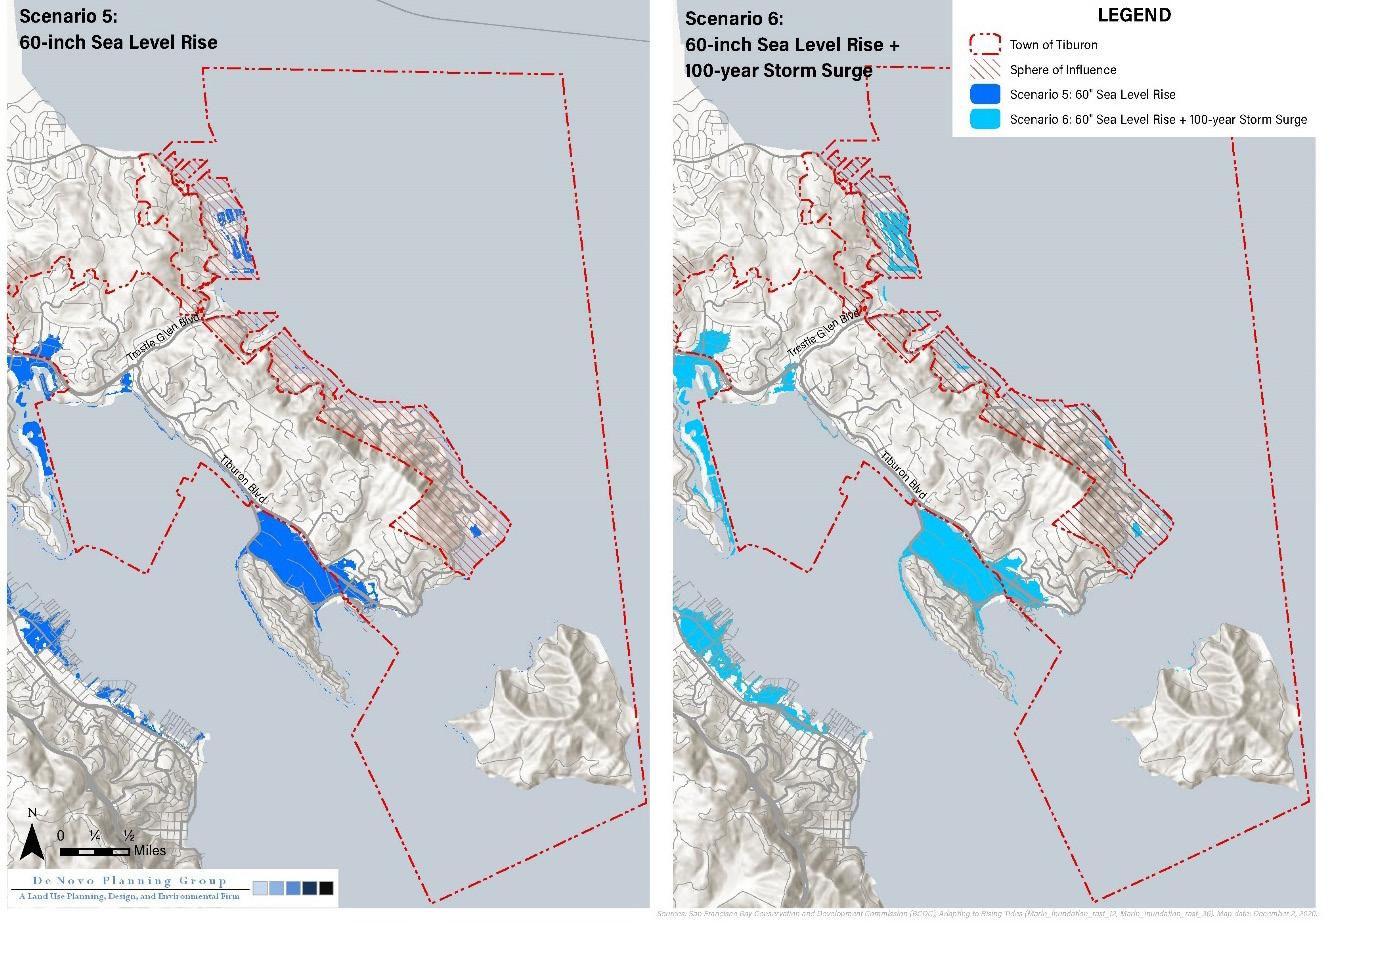
Over its history, Tiburon’s shoreline has changed to suit changing needs. Indeed, much of downtown is the result of the filling of what was previously a lagoon. Today, as a result of climate change, Tiburon must recognize that the shoreline may not be able to be maintained in place without new investments in both traditional and nature-based infrastructure. These investments should be considered in tandem with adjusted expectations for land use and buildings as the community continues to change and develop. The General Plan’s policies and programs (see Section 11.8) provide a roadmap for the Town to pursue adaptation in the years ahead. In addition to providing specific guidance for regulating new development, the General Plan calls for a more detailed adaptation strategy to be developed. Such a strategy should follow an approach
that reflects the community’s vision for the future; considers the right match between potential adaptation tools and their environment; evaluates costs as well as additional benefits that could be gained; charts a sequence of adaptation over time; and considers a mix of public and private actions and partnerships. Tiburon’s adaptation strategy may include shoreline hardening tools like sea wall and coastal armoring; naturebased tools including the restoration of tidal marshes and creation of coarsesand beach; green infrastructure as part of complete streets; and strategies to shift development out of harm’s way over time.
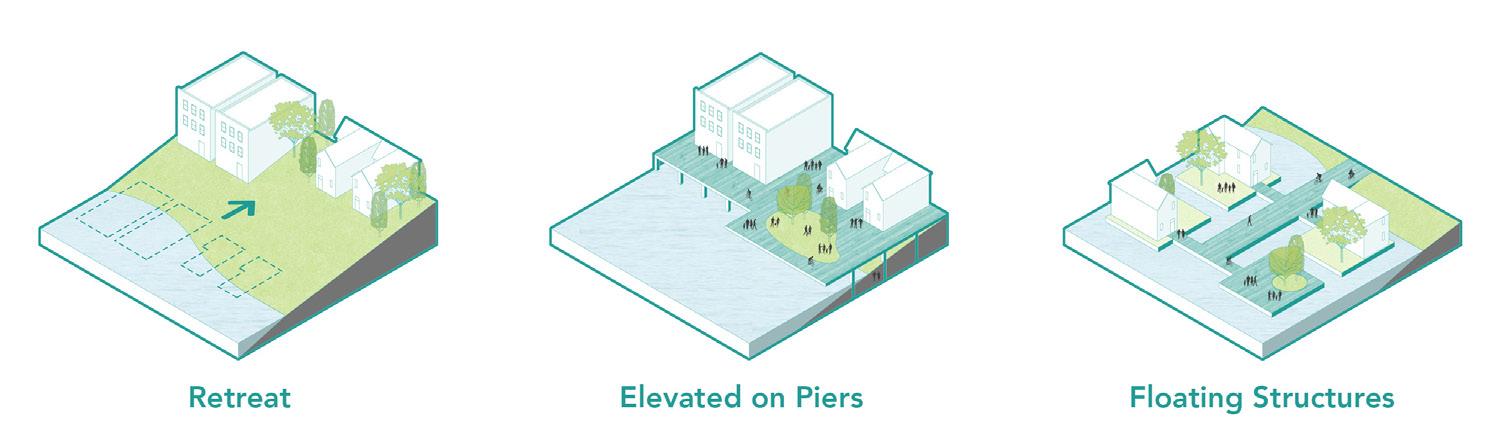
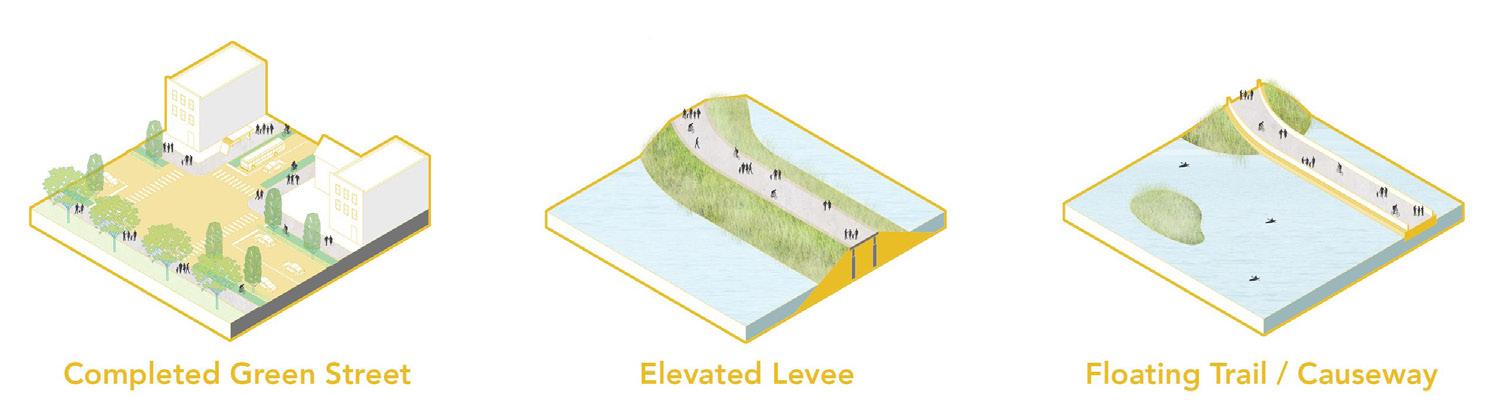
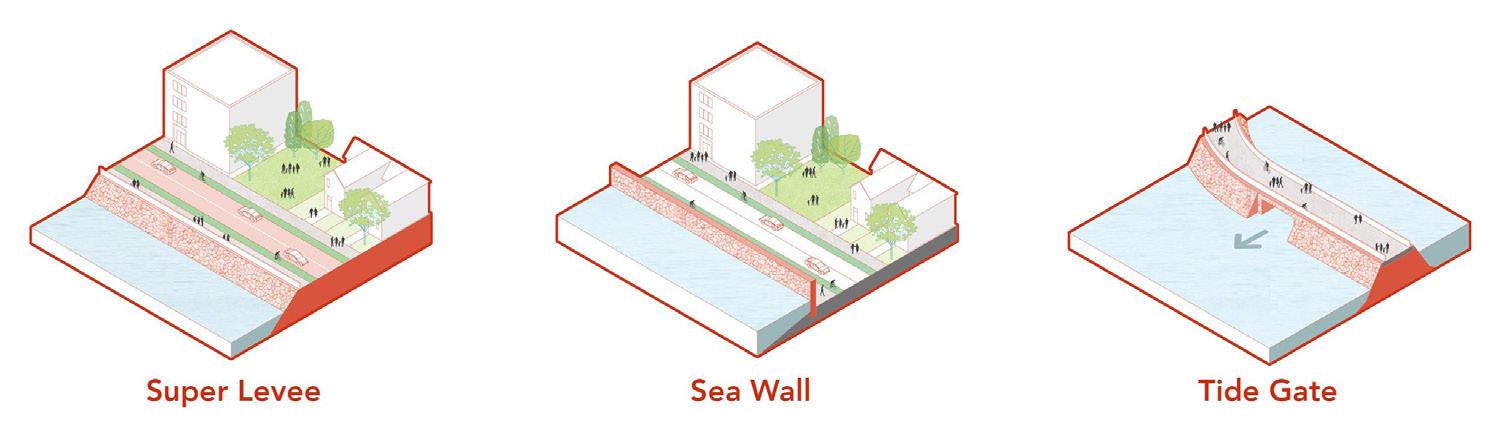
Adaptation tools could consist four key types including the shoreline hardening tools, naturebased tools, daptation tools for roads and infrastructure and tools to shift developmentout of harm’s way over time.
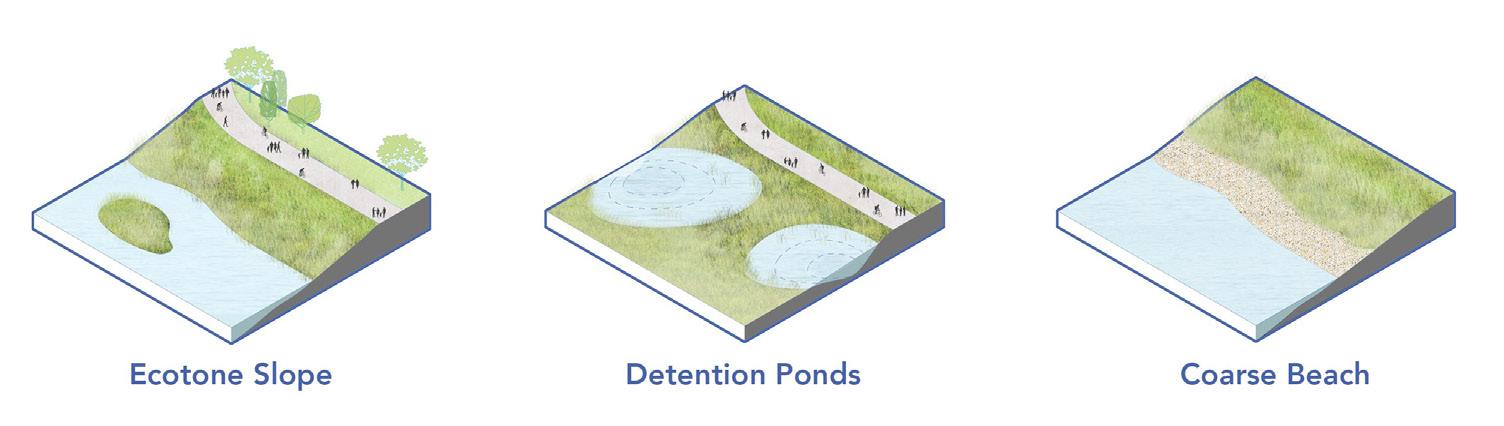
Wildland fire hazards exist in varying degrees throughout the Tiburon Peninsula and pose one of the greatest threats to public safety and property. The wildland fire hazard is caused by a combination of factors including weather, topography, highly flammable vegetation/fuel loading and human activity.
Marin County has experienced many wildland fires throughout its history.
The most recent Marin County fire that resulted in significant structure loss was the Vision Fire in 1995 which destroyed 48 structures in the community of Inverness. In 1929, the Great Mill Valley Fire burned an area that is now developed with more than 1,100 homes. Other large fires in the area include the Kent Woodlands Wildfire in 1972 and the Sausalito wildfire in 1919. In the time before Marin County was settled, fire was a natural part of the ecosystem. Since then, fire suppression policies and practices have contributed to the continuous growth of vegetation,
resulting in dangerous fuel loads. Combined with this fuel accumulation, people have been building homes in the wildlands, creating wildland urban interface (WUI) issues that increase the fire hazard.
In the WUI where natural fuels and structure fuels are intermixed, fire behavior is complex and difficult to predict. Research based on modeling, observations, and case studies in the WUI indicates that structure ignitability during wildland fires depends largely on the characteristics and building materials of the home and its immediate surroundings.
The dispersion of burning embers from wildfires is the most likely cause of home ignitions. When embers land near or on a structure, they can ignite nearby vegetation or accumulated debris on the roof or in the gutter. Embers can also enter the structure through openings such as an open window or vent and could ignite the interior of the structure or debris in the attic. Wildfire
can further ignite structures through direct flame contact and/or radiant heat. For this reason, it is important that structures and property in the WUI are less prone to ignition by ember dispersion, direct flame contact, and radiant heat.
Tiburon’s approach to mitigating structure ignitibility is based on findings from the National Institute of Standards and Technology that defensive actions by homeowners can significantly affect fire behavior and structure loss, and that effective fire prevention practices are essential in increasing structure survivability.
The California Building Code addresses the wildland fire threat to structures by requiring that structures located in state or locally designated WUI areas be built of fire-resistant materials. However, the requirements promulgated by the State only apply to new construction, and do not address existing structures and additions and remodels to existing structures.
Both the Tiburon Fire Protection District and the Southern Marin Fire District have adopted amendments to the Building Code to address home ignitibility for both new and existing construction. The Fire Districts apply more stringent building standards for new construction and require projects involving a substantial remodel or large addition to install an automatic sprinkler system. The Fire Districts also require new construction and substantial remodels to prepare a vegetation management plan. All existing buildings and lands in the WUI must maintain defensible space. Areas in the WUI are shown in Figure SR-10.
The Fire Districts have also adopted Building Code amendments to require fire apparatus access roads and fire hydrants and fire hydrant upgrades under certain conditions.
The Marin County Community Wildfire Protection Plan (CWPP), updated in 2020, is an advisory document prepared by Fire Safe Marin in
collaboration with stakeholder agencies, including the Tiburon Fire Protection District and the Southern Marin Fire Protection District. The CWPP is a countywide strategic plan with action items to reduce fire hazard in the County, especially in areas of concern, which mostly fall within Marin’s WUI boundary. The CWPP assists in protecting human life and reducing property loss from wildfire throughout Marin County. The CWPP describes wildfire risk, hazard, and recommendations for improving wildfire preparedness at the County level.
The California Department of Forestry and Fire Protection (CalFire) identifies fire hazard severity zones based on the severity of the fire hazard expected to prevail there. These areas are based on factors such as fuel type (vegetation that is fire prone), slope, aspect, and
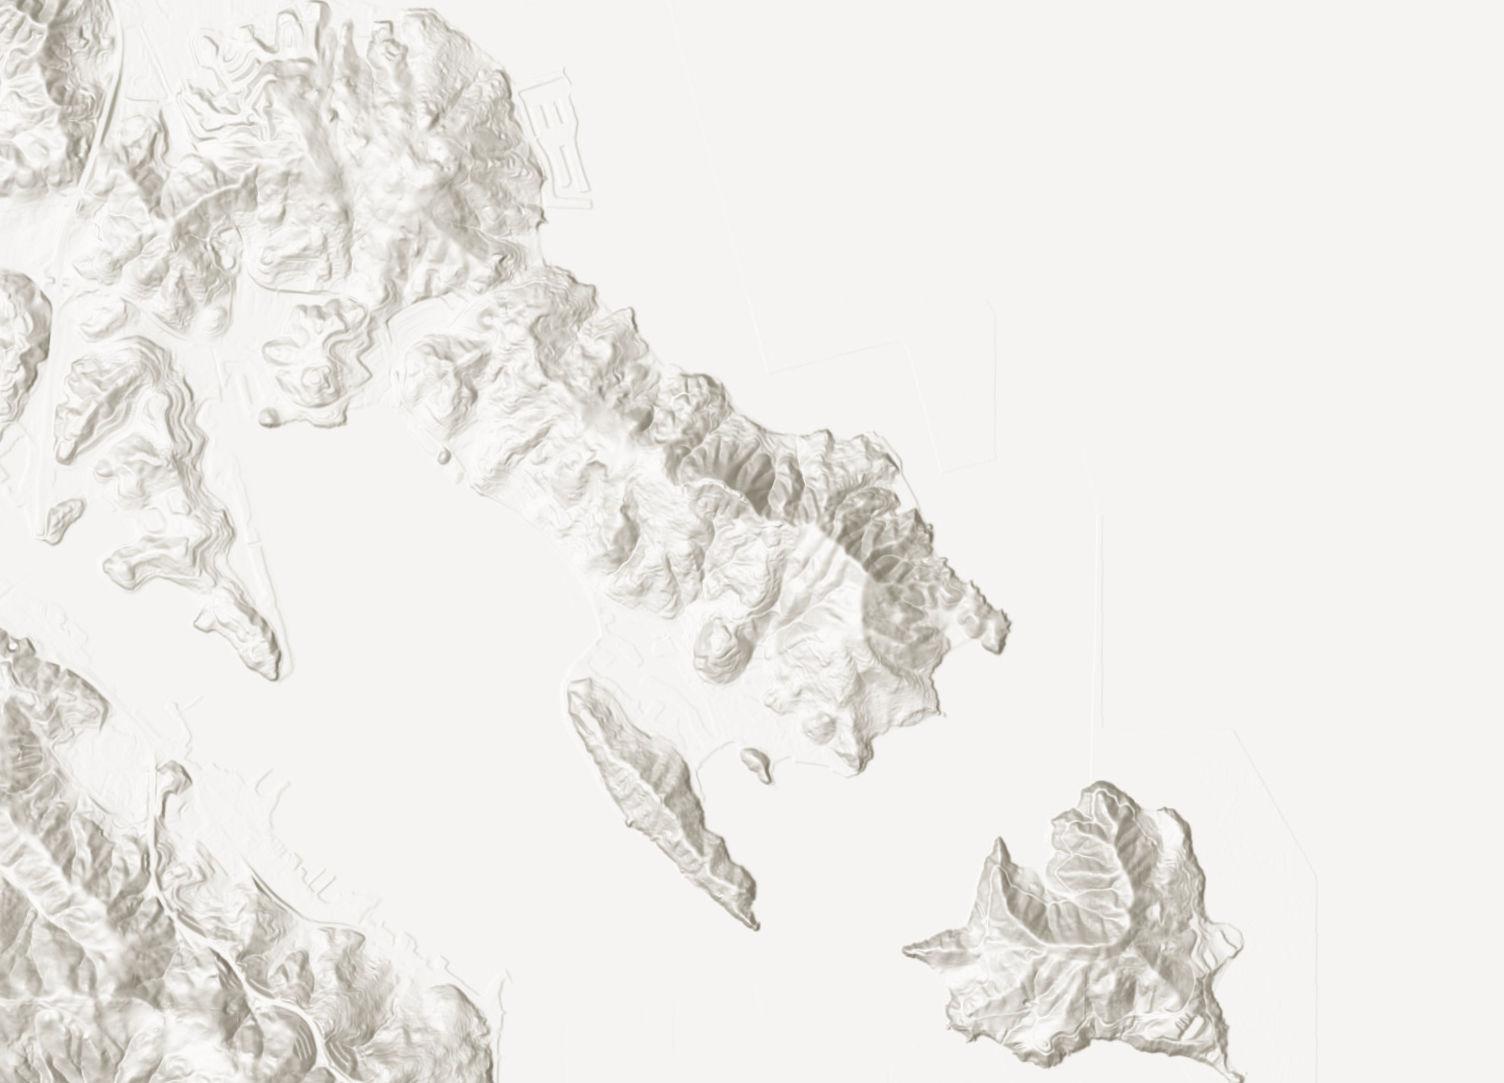
fire weather. There are three zones, based on increasing fire hazard: moderate, high, and very high.
Areas under State jurisdiction are referred to as State Responsibility Areas (SRAs). Within the vicinity of the Town, these SRAs are primarily found to the north and east of the Town limits within the unincorporated area. As shown in Figure SR-11, areas adjacent to the Town along Paradise Drive and in the Ring Mountain Preserve are categorized as a very high fire hazard severity zone.
Areas under the jurisdiction of local entities are referred to as Local Responsibility Areas. CalFire identifies very high fire zones within Local Responsibility Areas. There are no areas within the Town that are categorized as a very high fire hazard severity zone. CalFire also produces a Fire Threat Model which is used to identify areas in California where large, catastrophic fires are most likely to happen. The ranking system is based on four wildfire factors: fuel model, slope, ladder index,
and crown index. The model combines expected fire frequency with potential fire behavior to create five threat classes ranging from low to extreme. As shown in Figure SR-12, areas in Tiburon categorized as moderate and high fire threat are primarily located in the hillsides where there is both open space and single-family homes.
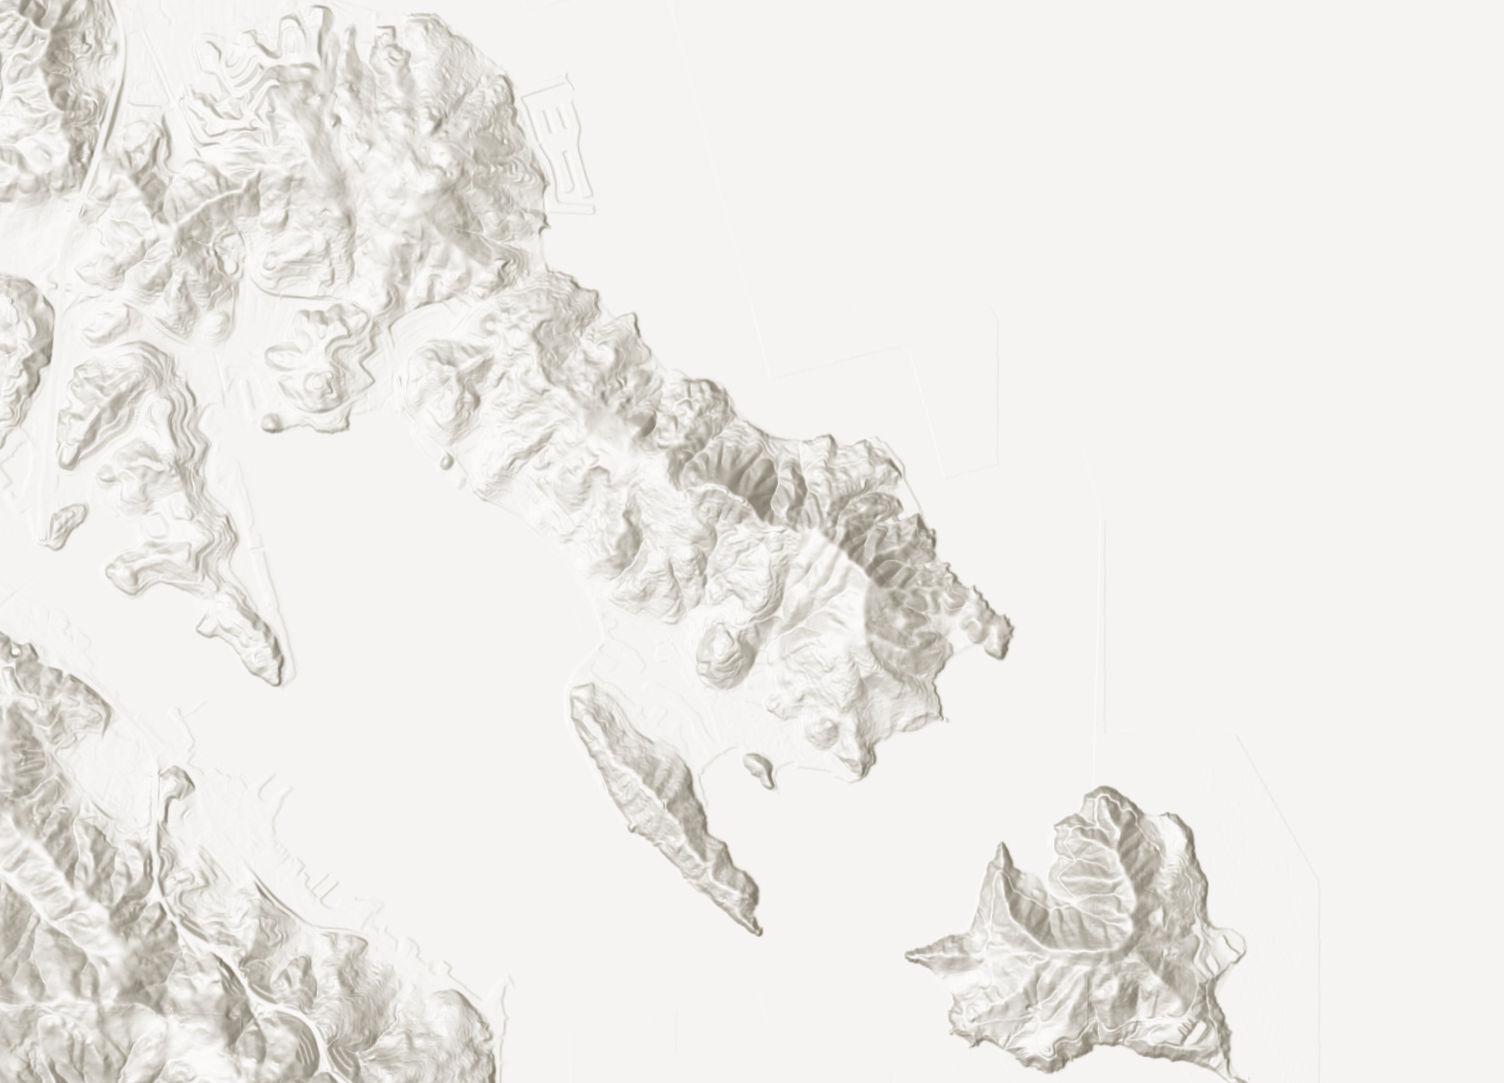
Fire protection and emergency medical services in Tiburon are provided by the Tiburon Fire Protection District (TFPD) and the Southern Marin Fire Protection District (SMFPD). As shown on Figure SR-13, the TFPD serves approximately 75 percent of the Tiburon planning area while the SMFPD provides fire-related services to approximately 25 percent of residents located in the northwest corner of the planning area.
The TFPD provides structural fire and emergency medical response services to the Town of Tiburon, the City of Belvedere, and unincorporated residential and wildland areas on the peninsula, as well as parts of the San Francisco Bay to Angel Island State Park. Within the boundaries of TFPD are large single-family homes, multifamily residential complexes, numerous small businesses, public facilities, open space, and trails.
The TFPD provides a full range of services to the Tiburon peninsula, including:
• Community Risk Reduction Bureau
– Code enforcement, plan reviews, annual business inspections, and summer defensible space program for homeowners;
• Public Education – Fire and burn prevention programs in schools, CPR, First Aid, and Community Disaster Preparedness classes;
• Emergency Medical Services;
• Fire Protection;
• Hazardous Materials Response;
• Fire Investigation; and
• Participation in Marin County and California Mutual Aid System.
The TFPD owns, operates, and maintains two fire stations with one concurrently used as its administrative building within the Tiburon planning area (Fire Station 10 and 11). TFPD fire station locations within Tiburon are shown in Figure SR-13. Each fire station has personnel covering three shifts over a 24-hour period.
The TFPD is a member of the Southern Marin Emergency Medical Paramedic System Joint Powers Authority, which provides emergency medical care and paramedic services to southern Marin County through a joint effort with five other member agencies. Additionally, the TFPD is a member of the Marin Emergency Radio Authority, a countywide public safety and
emergency radio system that allows emergency response agencies to communicate effectively with each other.
The TFPD’s current response time goal is to maintain an overall response time of 8 minutes or less, 90 percent of the time. In Fiscal Year 2019-2020, the TPFD responded to 1,787 calls; twothirds of the calls were for rescue and emergency medical services. TFPD’s average response time excluding mutual aid was below 8 minutes for all incident types; however, the average response time when mutual aid was included exceeded 8 minutes for fire, hazardous materials, and severe weather/natural disaster incidents.
The SMFPD is an independent fire district that provides fire protection and emergency medical services to the City of Sausalito, Tamalpais Valley, Homestead Valley, Almonte, Alto Bowl,
Strawberry, the western area of the Town of Tiburon (Bel Aire/Blackfield/ Reed Heights), and the National Park areas of Fort Baker and the Marin Headlands.
The SMFPD operates out of three stations with a minimum staffing of 15 personnel on duty at all times, as well as an administrative office where administrative and prevention staff are organized. The Tiburon area is served by Southern Marin Fire Station 9 as shown in Figure SR-13.
The SMFPD’s response time standards are as follows:
• Distribution of Fire Stations – Firstdue unit arrives within 9 minutes and 30 seconds of receipt of call 90 percent of the time.
• Effective Response Force – Minimum response of one ladder truck, four engines, one medic unit, and one Battalion Chief arrive within 11 minutes and 30 seconds from receipt of 9-1-1 call 90 percent of the time.
• Hazardous Materials Response –First unit’s travel time is 6 minutes or less 90 percent of the time.
• Technical Rescue – First unit arrives in 8 minutes or less 90 percent of the time and initiates rescue within a total response time of 11 minutes and 30 seconds, 90 percent of the time.
In 2017, 2018, and 2019, the SMFPD met these standards 100 percent of the time.

The Tiburon Police Department (TPD) is responsible for providing law enforcement services in the Town, including patrol, administration, support personnel, investigations, training, parking enforcement, and crime prevention program. The TPD’s location is shown on Figure SR-13. The TPD promotes community-oriented policing and understands that it is the community itself that can best say what it needs from its police department and that the police and the community must work together to accomplish jointly set goals. Similar to other cities and towns, the TPD relies on the Marin Sheriff’s Office for search and rescue services and long-term holding facilities and County Animal Control for animal service. Additionally, the TPD is a member and partner of the Marin County Major Crimes Task Force whose objective is to investigate and prevent the illegal activity of highly mobile mid to upperlevel drug dealers and suppliers and to disrupt and dismantle their criminal narcotic enterprises operating in Marin
County. The TPD also contracts with the Sheriff’s Office for dispatch services.
As shown in Table SR-2, the majority of crimes committed in Tiburon consist of non-violent property crimes, primarily theft of personal property without the use of force. The table shows crime statistics through 2020. The TPD also utilizes an online crime mapping tool that provides the community with up-todate and accurate crime information.
GOAL SR-A
Encourage disaster preparedness planning for effective emergency response and to protect public safety.
GOAL SR-B
Maintain a safe and healthy community.
GOAL SR-C
Identify hazardous areas & discourage to the maximum extent feasible development of areas subject to hazards including, but not limited to, geotechnical hazards, unstable slopes, and floodprone areas.
GOAL SR-D
Ensure safe subdivision and building design.
GOAL SR-E
Reduce the impact of hazardous materials exposure and strive to reduce threats to health, safety, and the environment from hazardous materials.
Ensure that the Town is prepared to effectively respond to any emergency or disaster, including hazardous material releases, in cooperation with other public agencies and appropriate organizations.
Program SR-a Local Hazard Mitigation Plan. Implement the adopted Local Hazard Mitigation Plan to comply with the federal Disaster Mitigation Act of 2000 and maintain eligibility for hazard mitigation funding from FEMA.
Program SR-b Emergency Operations Plan.
Continue to review, update, & provide continued training to ensure that the Emergency Operations Plan remains effective in preparing for disasters.
Program SR-c Cooperation in Training and Educational Programs.
Support and participate in educational and training programs provided by the Fire Districts and other governmental or community-based agencies. Engage Neighborhood Watch Groups or similar neighborhood organizations to disseminate information and train to supplement Town resources during emergencies and disaster recovery.
Program SR-d Identify Evacuation Routes.
Work with the Tiburon Fire Protection District, the Southern Marin Fire Protection District, the Marin Wildfire
Prevention Authority, and the Tiburon Police Department to identify and map residential developments in hazard areas that do not have at least two emergency evacuation routes and identify mitigation measures as feasible.
Work with the Tiburon Fire Protection District, the Southern Marin Fire Protection District, , the Marin Wildfire Prevention Authority, and the Tiburon Police Department to evaluate evacuation routes for their capacity, safety, and viability under a range of emergency scenarios.
Improve local evacuation capacity by identifying evacuation routes through signage and promotion of public safety route identification applications. Assess the feasibility of adding additional evacuation routes.
Make provisions to continue essential public services during and after natural disasters and other catastrophes.
Ensure essential public facilities are accessible and operational during flooding, seismic events, fires, extreme heat events, and other emergencies. Essential public facilities include, but are not limited to, hospitals and health care facilities, emergency shelters, emergency command centers, and emergency communications facilities.
Conduct an immediate post-earthquake assessment of critical facilities and buildings in the Planning Area to determine the extent of damages, if any, to essential Town infrastructure.
This should be performed by trained professional(s) utilizing the current state-of-knowledge regarding postearthquake assessment.
Encourage educational outreach and neighborhood organization to promote awareness and readiness among residents regarding disaster preparedness. Community involvement will be an essential part of the Town’s resilience and recovery.
Program SR-i Public Safety Notifications.
Promote public safety emergency notification systems to warn residents of active threats such as flood or wildfire.
Locate new essential public facilities outside of high hazard areas, including
high fire risk areas, Special Flood Hazard Areas, and areas at high risk for geologic or soil instability, to the extent feasible. Where it is not feasible to locate essential public facilities outside of high hazard areas, require site design, construction, and other methods to minimize damage.
Reduce the risk of loss of life, personal injury, and property damage resulting from seismic and geologic hazards including ground shaking, land sliding, liquefaction, and slope failure.
Assure that development allowed within areas of potential geologic hazard is neither endangered by, nor contributes to, the hazardous conditions on the site or on surrounding properties.
Actively encourage owners of developed property to repair or improve unstable slopes, install drainage facilities, and take other measures that may reduce potential safety hazards.
Discourage development on slopes exceeding 40% wherever possible.
Strongly discourage development located below or in the path of gullies which are highly susceptible to debris flow mudslides.
SR-j
Require that new development and infrastructure projects conform to seismic requirements of the California Building Code and, when applicable, mitigation required by the California Environmental Quality Act.
SR-k
Require preparation of a report by an engineering geologist or geotechnical engineer for new development proposals including new subdivisions, additions, remodels, and infrastructure projects, as applicable, to determine the extent of geotechnical hazards, specify adequate repair/improvement techniques, describe optimum design for structures and improvements, and set forth any special requirements for the sites.
SR-l
Require that new development in areas subject to land sliding comply with the Town’s Landslide Mitigation Policy. Require physical improvements to landslides and to potential landslide areas in instances where avoidance is not feasible or appropriate, as determined through the development review process.
Program SR-m Water Infrastructure Safety.
Coordinate with the Marin Municipal Water District to replace the piping and fittings in those water tanks in the Planning Area that are not currently fitted with flexible, earthquake-resistant joints. In addition, the water tanks should be evaluated to ascertain their ability to withstand strong seismic ground shaking.
Create and implement a Seismic Improvement Program for public buildings and infrastructure. The Program shall include conducting a seismic risk assessment of existing Town infrastructure, which would help to create a list which would prioritize the buildings and equipment that should be retrofitted. Following risk assessment, the Town should adopt a Program that would upgrade vulnerable facilities based on the priority list.
Increase education regarding upgrading of privately-owned buildings using structural and non-structural mitigation measures.
Reduce the risk of loss of life, personal injury, and property damage resulting from flooding by properly maintaining storm drainage systems, natural flood control channels, and waterways and regulating runoff from new construction and development projects. Encourage flood control measures that retain the natural features and conditions of watercourses to the maximum extent feasible.
Integrate flooding and sea level rise projections into policies and regulations to inform the public of the future hazard areas, assess and
address potential impacts to future development, inform future planning and building requirements, plan for opportunity areas for adaptation, and inform funding and financing decisions about short- and long-term adaptation projects.
Prepare and update a Flooding and Sea Level Rise Projection Map as a reference for town policies and regulations and as a publicly accessible tool for tracking flooding and sea level rise hazards. Update the Flooding and Sea Level Rise Map at least every five years, based on the most recent Federal Emergency Management Agency’s (FEMA) Flood Insurance Rate Maps and local projections from the County of Marin.
Ensure information and data related to increased flooding and sea level
rise is current and consistent with the information and data utilized by the County of Marin.
Prepare and adopt an adaptation plan addressing increased flooding and sea level rise. The adaptation plan shall include the following components:
a. Flooding and Sea Level Rise Projection Map, to be used as the basis for adaptation planning.
b. Coordination with local, county, state, regional and federal agencies with bay and shoreline oversight, major property owners, and owners of critical infrastructure and facilities in the preparation of the adaptation plan.
c. An outreach plan to major stakeholders and all property owners within the vulnerable areas.
d. An inventory of potential areas and sites suitable for mid- to large-scale adaptation projects
e. A menu of adaptation measures and approaches that could include but not be limited to:
• Managed retreat, especially on low-lying, undeveloped, and underdeveloped sites, in areas that are permanent open space, and in areas that are environmentally constrained. Transfer of development rights from such areas should be encouraged.
• Innovative green shoreline protection and nature-based adaptation measures such as wetlands and habitat restoration, and horizontal levees where most practical and feasible.
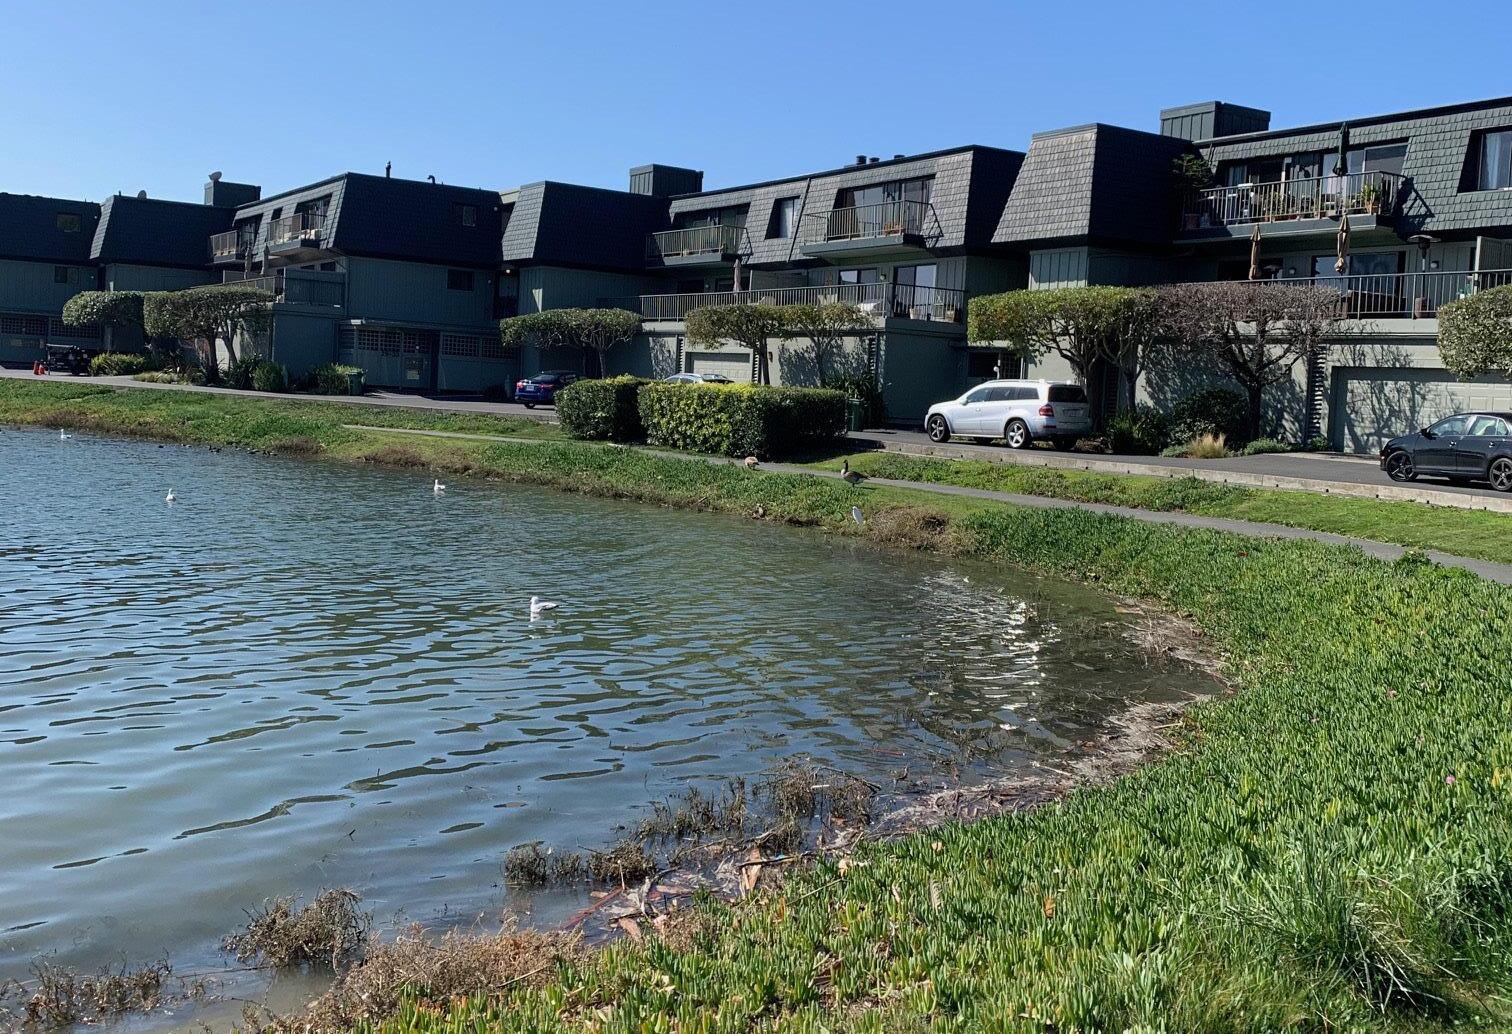
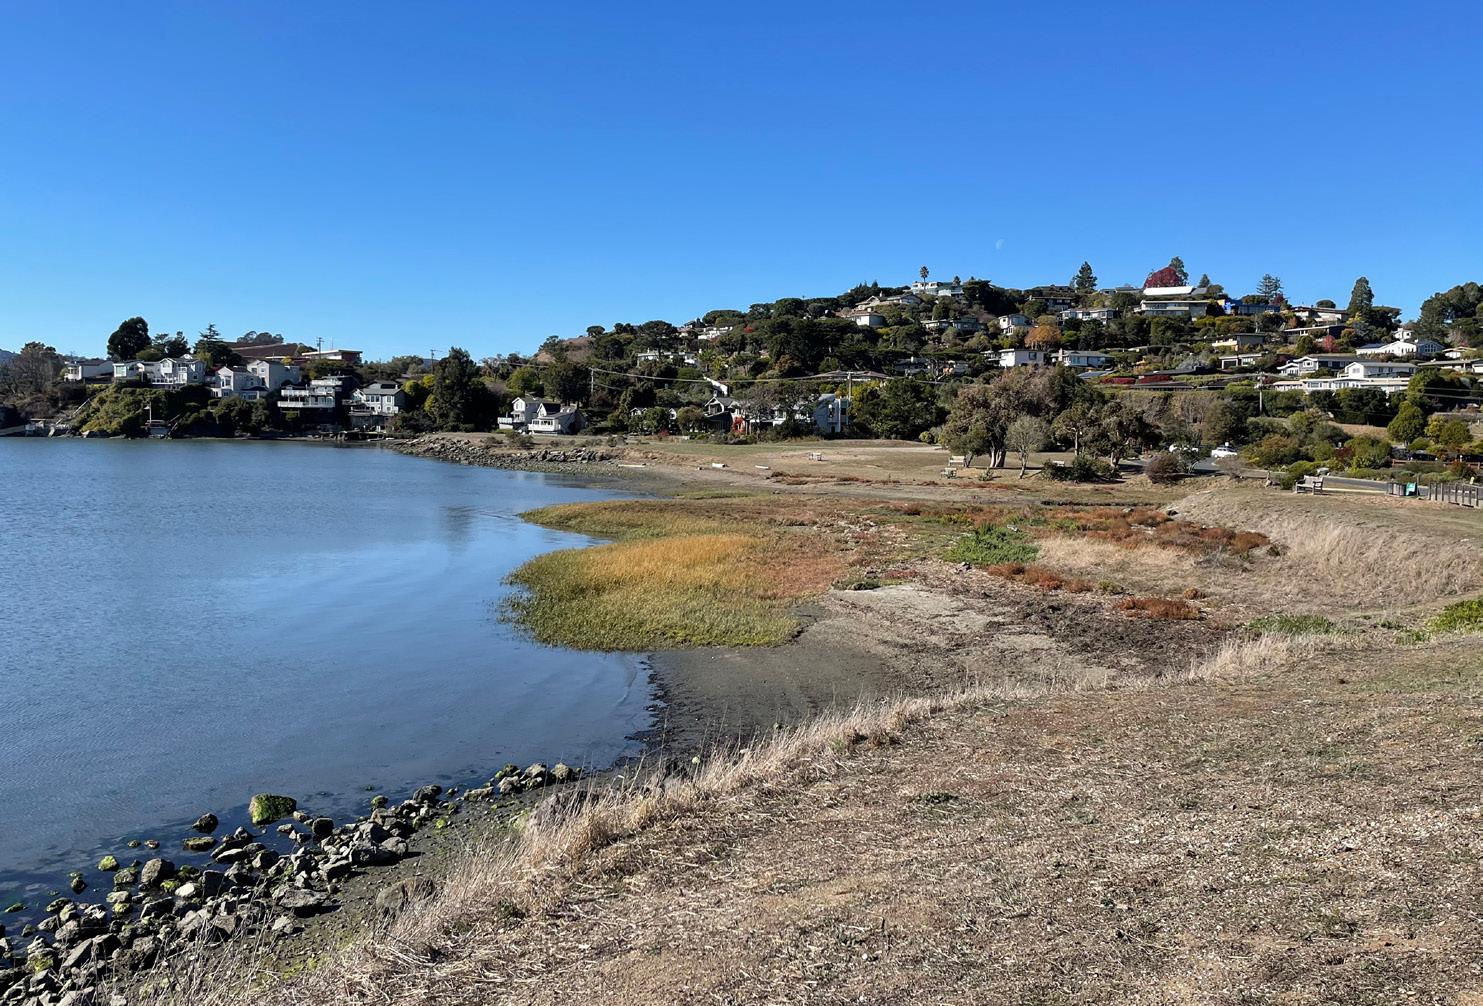
• Hard line armoring measures (sea walls, levees, breakwater, locks, etc.) to minimize the potential for displacement of permanent residents and businesses.
• Elevating areas, structures, and infrastructure to reduce risks.
f. The appropriate timing and “phasing” of adaptation planning and implementation.
g. Potential financing tools and opportunities.
h. Coordination with or incorporation into the Local Hazard Mitigation Plan.
Increase community awareness related to flooding and sea level rise hazards.
Blackie's Pasture (above) and Greenwood Cove (below)
Program SR-s Residential Building Resale Inspections.
Include disclosure of potential property risk due to increased tidal flooding and sea level rise in preparing residential building resale inspections. Utilize the Sea Level Rise Prediction Map for confirming property vulnerability. Work with realtors and property owners to implement this disclosure.
Program SR-t National Flood Insurance Program (NFIP).
Continue to comply with the federal National Flood Insurance Program by maintaining a flood management program and flood plain management regulations. In addition, develop and periodically update a Community Rating System (CRS) to notify residents of the hazards of living in a flood-prone area, thereby reducing local flood insurance rates.
Ensure that the Town’s streets, public spaces, public buildings, and infrastructure are resilient to flooding and sea level rise.
Program SR-u Capital Improvement Planning.
Ensure flooding and sea level rise considerations are included in the Town’s capital improvement planning.
Program SR-v Asset Management Plan.
Maintain an asset management plan that includes life cycle costs and considers sea level rise impacts.
Program SR-w Coordination with Caltrans and Other Roadway Partners.
Coordinate with Caltrans and other partners to ensure roadway improvements in vulnerable areas are
consistent with the Town’s goals, and that infrastructure projects address and plan for increased flooding and sea level rise. This includes Tiburon Boulevard, Paradise Drive, and Main Street.
Program SR-x Coordinate with Utilities and Services.
Coordinate with the utilities and services that have infrastructure and facilities in vulnerable areas to ensure that sea level rise information and goals are consistent with the Town’s goals, and that infrastructure/utility projects address and plan for increased flooding and sea level rise.
Ensure new development is resilient to flooding and sea level rise.
Program SR-y Special Flood Hazard Areas.
Require new development and/or construction, where feasible, to be outside Special Flood Hazard Areas, which are defined by FEMA as areas that would be inundated by a flood having a 1% chance of occurring in any given year. Construction proposed within Special Flood Hazard Areas shall comply with the Town’s Flood Damage Prevention Ordinance (Municipal Code Chapter 13D).
Program SR-z Protection from Wave Action.
Require structures constructed adjacent to areas subject to the 100-year tidal flood to be protected from destructive wave action.
Program SR-aa Development Projects.
Require new development, including substantial alterations, to consider and address increased flooding and
sea level rise impacts and to integrate resilience and adaptation measures into project design as warranted.
Program SR-bb Code
Amendments for Minimum Floor Elevation.
Study amendment of the Town’s Flood Damage Prevention Ordinance to establish a minimum finished floor elevation requirement of +3 feet above the FEMA 100-year flood elevation to protect new development against future sea level rise.
Ensure new development mitigates storm drainage impacts and potential increases in runoff through a combination of measures, including improvement of local storm drainage facilities.
Program SR-cc Design of New Drainage Facilities.
Design drainage facilities within new subdivisions to accommodate a 100year storm.
Program SR-dd Stormwater Detention.
Utilize on-site detention of stormwater runoff to ensure that post-development peak flow rates from a site resulting from both the two-year and 100-year design rainstorms are not increased by new subdivisions or other permitted development projects.
To the extent that new subdivisions are responsible for exceeding the capacity of any existing stormwater drainage system, the applicant shall be responsible for the cost of improvements to the system such that the capacity is not exceeded upon project completion.
Program SR-ff Use of Stormwater Runoff Impact Fees.
Utilize Stormwater Runoff Impact Fees to upgrade, enhance, and/or rehabilitate the Town’s public storm drain system to offset the increased demand on the capacity, operation, and sustainability of the Town storm drain system.
Require project applicants for new development to prepare a hydraulic and geomorphic assessment of on-site and downstream drainageways that are affected by project area runoff. Characteristics pertinent to channel stability would include bank erosion, excessive bed scour or sediment deposition, bed slope adjustments, lateral channel migration or bifurcation, and the condition of riparian vegetation. In the event existing channel instabilities are noted, the applicant may either propose their own channel stabilization program or defer
to the mitigations generated during the Town’s environmental review. Any proposed stabilization measures shall anticipate any project-related changes to the drainageway flow regime.
Evaluate potential measures to more sustainably manage stormwater and erosion and improve water quality associated with urban runoff. This includes improvements such as rain gardens and permeable pavement, which attenuate flooding downstream and provide ecological benefits.
Foster partnerships for funding and project implementation to address flooding and sea level rise hazards.
Work with the County of Marin, the City
of Belvedere, other adjacent agencies, property owners, and neighborhood groups/organizations to plan for and implement adaptation projects.
Program SR-jj County Flood Control Districts.
Work collaboratively with the County of Marin Flood Control and Water Conservation Districts to upgrade existing and/or plan for new facilities that would improve flood protection. Consider expanding the County flood control districts to include areas impacted by sea level rise.
Program SR-kk Countywide Agency/Joint Powers Authority.
Work with the County of Marin to facilitate the formation of a centralized countywide agency or joint powers authority to oversee adaptation planning, financing, and implementation.
Reduce the risk of loss of life, personal injury, and property damage resulting from wildfire and urban fire hazards through code enforcement and coordination the local Fire Districts and other agencies to ensure the safe delivery of emergency services and the effective evacuation of the community in the event of a disaster.
Require new development to provide sufficient water supply and equipment for fire suppression to ensure that the requirements for minimum fire flow and the size, type, and location of water mains and hydrants set forth in the California Fire Code and by local ordinance are met.
Require new development within areas of insufficient peak load water supply to contribute to improvements to the water delivery system to meet requirements for minimum fire-flow.
Work with the Fire Districts and other agencies to provide, enhance, and maintain adequate access, including secondary access, to all areas within the Planning Area.
Consider adoption of an ordinance requiring the maintenance of defensible space on properties where fire hazard is significant. On-going maintenance
of defensible space buffers and fire protection infrastructure (e.g., safe access for emergency response vehicles, visible street signs, fuel breaks, and emergency water sources and supplies, etc.) in new development projects shall be assured in a form satisfactory to the Town and the Fire Districts prior to construction of improvements.
Review all development proposals for fire risk and require mitigation measures, including on-going maintenance of defensible space and infrastructure related to fire protection and fire hardening of structures and areas proximate to structures, for development located in state responsibility areas, high fire hazard severity zones, or other areas with significant wildfire potential, to reduce the probability of fire-related hazards to a less than significant level. Require all new development to meet
the adopted state and local fire codes. Refer all applications to the appropriate Fire Districts for review.
Program SR-nn Open Space Management Plan.
Implement the adopted Open Space Management Program to reduce fuel loads and maintain fire roads and evacuation routes.
POLICY SR-21 POLICE SERVICES.
Maintain an adequate and costeffective Police Department to serve and protect the community.
POLICY SR-22
RISK REDUCTION.
Actively address the need to reduce exposure to hazardous materials.
POLICING AND CRIME PREVENTION.
Continue to implement community policing and crime prevention programs to strengthen relationships between the Police Department and provide outreach to all neighborhoods within the community.
Reduce the risk of loss of life, personal injury, and property damage resulting from structural, electrical, or fire damage to structures through code enforcement and public education.
Program SR-oo Implement the Building Code.
Review and inspect new development, building additions, and remodels, while enforcing the California Building Standards Code and local amendments.
Program SR-pp Update Building and Fire Codes.
Continue to update the Town’s building and fire codes and provide information to the public on new code provisions.
Encourage residents and businesses to reduce or eliminate the use of hazardous materials, including encouraging residents to purchase toxic substances in only the amount needed to do the job, or use non-toxic alternatives that do not pose a threat.
Reduce the presence of hazardous materials in the community and support the operation of recycling centers that take hazardous substances, such as oil, paint, pesticides, cleaners, chlorine products, etc.
Evaluate the potential impacts related to hazardous materials during the environmental review process for new developments or businesses that involve use, transport, production, storage, and/or disposal of hazardous materials or that are proposed on a site affected by a hazardous materials release. Coordinate hazardous materials management with other public agencies regarding the use, storage, transport, or disposal of hazardous materials. The potential significant
impacts associated with exposure to hazardous emissions or hazardous materials shall be fully mitigated.
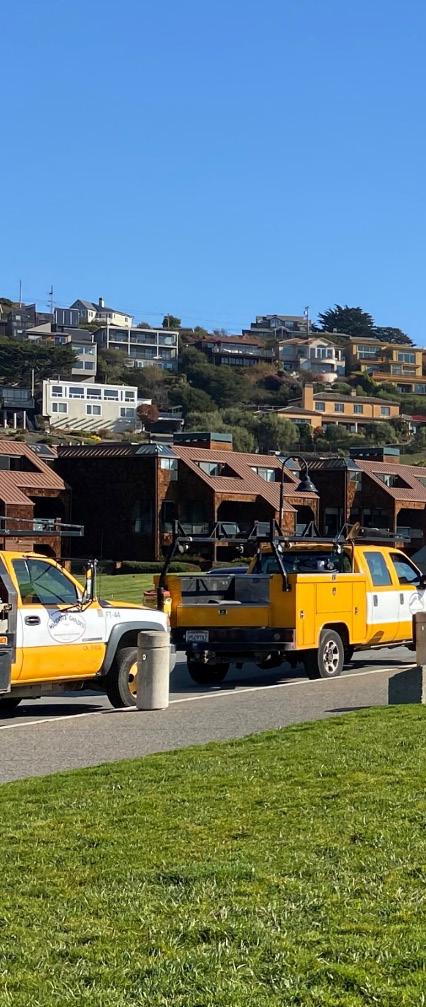
Coordinate with other local agencies to implement proper management measures as identified by the County’s Hazardous Materials Area Plan.