
22 minute read
WOOD BY NEAR INFRARED SPECTROSCOPY
ACTA FACULTATIS XYLOLOGIAE ZVOLEN, 61(1): 31−42, 2019 Zvolen, Technická univerzita vo Zvolene DOI: 10.17423/afx.2019.61.1.03
ASSESSMENT OF THE CHEMICAL CHANGE IN HEAT TREATED PINE WOOD BY NEAR INFRARED SPECTROSCOPY
Advertisement
Zuzana Vidholdová – Anna Sandak – Jakub Sandak
ABSTRACT
Fourier-transform near-infrared spectroscopy (FT-NIR) was used as none-destructive method to determinate changes in the chemical structure of heat-treated wood. For this purpose, pine sapwood (Pinus sylvestris L.) was treated at different temperatures (from 100 °C to 240 °C) and for three durations(1, 3 or 5 hours). The effects of chemical changes on the FT-NIR spectra are linked to absorbance changes of functional groups (–OH, –CH, –CO and –CH2) of lignin, hemicelluloses and cellulose. Gradual degradation of amorphous portion of cellulose was caused by high temperature, while crystalline and semi-crystalline portions of cellulose seem to be less affected by the thermal treatment. The effect of various intensities of heat treatment on chemical changes of wood polymers varied depending on temperature and duration. Presentation of spectra in the form of the xylograms shows clear tendency of degradation kinetic. Evaluation of thermal stability of selected wood component and/or comparison of the influence of modification process parameters can be carried out. Key words: pine, heat treatment, xylograms, FT-NIR.
INTRODUCTION
Heat-treated wood has become an established commercial product possessing a number of advantages over the natural wood. Heat-treated wood is considered an ecofriendly alternative to chemically impregnated wood materials. This treatment reduces the hydrophilic behaviour of the wood by modifying the chemical structure of its components (hemicelluloses, cellulose and lignin) which results in changes of their properties. Some previous studies (GÉRARDIN 2016, KUČEROVÁ et al. 2016, SANDBERG & KUTNAR 2016,
ČABALOVÁ et al. 2014, REINPRECHT & VIDHOLDOVÁ 2011, HILL 2007, WELZBACHER et al. 2007) have reported that treatment temperature and its duration affect the chemical decomposition of wood. The most important positive effects of heat treatment of wood are: enhancement of resistance to biodegradation (ŠUŠTERŠIC et al. 2010, WELZBACHER & RAPP 2007,HAKKOU et al. 2006) improvement of the overall dimensional stability (VIITANIEMI et al. 1997, HILLIS 1984) and reduction of the heat transfer coefficient (MILITZ 2002). Heat treatment is lowering wood equilibrium moisture content (ALTGEN et al. 2016) and enhance the surface quality (PRIADI & HIZIROGLU 2013) in addition to bulk discoloration having attractive dark colour (TODOROVIC et al. 2012). High temperatures and long time of heat treatment decrease most of the mechanical properties of wood (YILDIZ et al. 2011). Thermal modification decreases the heat release rate and propensity for fire propagation in the flashover phase of some species (MARTINKA et al. 2016).
Fourier transform near-infrared spectroscopy (FT-NIR) is an efficient method for high-throughput non-destructive screening of chemical characteristics of different materials including the wood and wood based products. Energy of infrared light stimulates vibrations of -CO, -OH, -CH and -NH functional groups giving overtones and combination bands depending on the molecular structure, chemical composition or physical properties of the measured sample. A state of the art of the FT-NIR applications in wood and paper research has been published by TSUCHIKAWA & KOBORI (2015). Quality assessment of thermally treated wood by means of NIR was previously investigated by several researches (POPESCU et al. 2018,SANDAK et al. 2015,2016, BÄCHLE et al. 2010, MEHROTRA et al. 2010,ESTEVES &PEREIRA 2008). NIR spectra can be pre-processes mathematically and evaluated by means of multivariate data analysis to obtain precise quantitative and qualitative information of physical-chemical nature of material.
In this study, the chemical changes due to heat treatment intensity were evaluated in pinewood by non-destructive FT-NIR spectroscopy. The chemical fingerprint of thermally modified wood is visualized by means of xylograms.
MATERIALS AND METHODS
Material and wood treatment
The defect-free pine sapwood (Pinus sylvestris L.) without cracks, knots or other growth inhomogeneity were used as experimental samples. The density in oven dry state ranged from 431 to 639 kg·m-3 with an average value of 506 kg·m-3 . Specimens were heat treated under atmospheric pressure in the laboratory heating oven (Memmert UFB 500, Germany) at Department of Mechanical Wood Technology, FWST at Technical University in Zvolen, as shown in Table 1.
The heat treatment started by putting the samples at ambient temperature in oven with subsequent increasing of the temperature and without forced air circulation. The period to reach expected temperature varied from 15 minutes (for 100 °C) up to 60 minutes (for 240 °C). Duration of the heat treatment at fixed temperature was 1, 3 or 5 hours. Extensively treated wood was prepared at the temperature 240 °C during 8 hours. At the end of each treatment, samples were cooled down in desiccators in dry environment.
Tab. 1 Thermal modification set-up, treatment parameters, set size.
Species Dimensions (R × L × T) (mm) Treatment temperature (°C)
Pine – sapwood 25 × 25 × 3 100 150 160 200 220 240 Treatment duration (h) 1 3 5
8* Number of replica
4
Note: * The treatment duration of 8 hours was only used for preparation of extensively treated wood.
Wood degradation was monitored by measuring the mass loss (ML) and the CIE L* a *b* colour coordinates. Mass loss percentage was determined on the representative samples set by means of their dry-weight change before and after heat treatment, determined after oven drying at 103 ± 2 °C to constant weight. Colour of heat treated samples expressed in CIE L* a *b* system was measured on samples conditioned at room temperature of 20 ± 2 °C and relative humidity of 60 ± 5 %.
Colour was measured using the Colour Reader CR-10 (Konica Minolta, Japan), with the illuminate type D65 light source and observer angle of 8 ° and approx. ϕ 8 mm measuring area.
FT-NIR measurements
The FT-NIR spectrometer (VECTOR 22-N) produced by Bruker Optics GmbH (Germany) equipped with a fibre-optic probe was used for spectra collection. FT-NIR measurements were performed in a climatic chamber (20 °C, 60 % relative humidity), on the radial face of samples. The spectral range was between 4000 cm −1 and 12 000 cm−1 (2500 nm - 833 nm) and the resolution was set to 8 cm −1 . Each spectrum was collected from 32 internal scans in the absorbance mode. Four measurements were performed on each sample and resulting spectra were averaged. All measurements and subsequent data evaluation were performed at Trees and Timber Institute CNR-IVALSA in San Michele all Adige (Italy).
Data evaluation
Opus QUANT 6.5 (Bruker), PLS toolbox (Eigenvector) and LabVIEW 17 (National Instruments) software packages were used for spectral pre-processing and data mining. For the needs of this research, different evaluation methods were applied on pre-processed data (Table 2). Spectral bands (Table 3) were assigned according to SCHWANNINGER et al. (2011).
Tab. 2 Applied methods during FT – NIR measurements and evaluation.
Sample presentation Acquisition mode Regression method Spectral pre-treatment Attributes
Intact, manual around the surface absorbance PLS EMSC DT2nd selected components Abbreviations: PLS = Partial Last Squares, EMSC = Extended Multiplicative Scatter Correction, DT2nd = second derivatives, SNV = Standard Normal Variate SNV
Generation of xylogram
Dedicated software for creation of xylograms was developed in LabVIEW. The spectral preprocessing included computation of second derivatives for all treated samples. The degradation coefficient of thermal treatment cdeg. TT was calculated according to modified formula which has been published in SANDAK et al. (2016)as equation (1).
c.deg MIN MAX
TTMIN ss TT ss (1)
where: sMIN – the value of DT2nd absorbance spectra of reference (untreated) wood at selected wavelength, sTT – the value of DT2nd absorbance spectra of treated wood at selected wavelength, sMAX – the value of DT2nd absorbance spectra of extensively treated wood (240 °C, 8 hours) at selected wavelength, λ – the wavelength of the infrared light corresponding to the particular functional group.
The outer perimeter corresponds to cdeg. TT = 0 and indicates negligible changes to the NIR spectra. All the results plotted within the central part of the xylogram indicate significant changes to the NIR spectra and extensive degradation of the corresponding component/functional group. A value of cdeg. TT = 1 indicates a fully degraded chemical component. The expected degradation pattern is that the cdeg. TT values gradually change from the outer to the inner part of the xylogram, following the acquired thermal treatment dose. It
was intended that the reference points were sorted according to wavenumber value but were not grouped according to chemical component and functional group.
RESULTS AND CONCLUSION
Various intensity of heat treatment leads to mass loss and colour change due to modification process. The ML of wood during treatment is a key characteristic and it is often used for expressing the changes in the treated wood properties. The ML reflects the heat treatment process intensity as are shown in Figure 1. The ML varied from 0.0 % (100 °C, 1 h) to 35.8 % (240 °C, 5 h). ML depended on the temperature and duration what is in accordance with the state-of-the-art knowledge. Similar results were reported by ESTEVES et al. (2008a),who determined that mass loss varies between 0.2 % (170 °C, 1 h) up to 12.0 % (200 °C, 12 h). It was found that different coupled process parameters had comparable ML, for example: ML of ~ 6 % can be achieved when treat wood in 200 °C for 5 h or in 220 °C for 1 h. It has to be mentioned that wood degradation is more intense in the presence of atmospheric air due to extensive oxidation reactions. Moreover, acetic acid produced in such process acts as an additional depolymerisation catalyst. It was previously reported that there is a higher content of acetic acid released during wood thermal treatment in the oxidizing environment (ESTEVES et al. 2008a,2007, STAMM 1956).
Fig. 1 Mass loss (%) of pine wood during its thermal treatment from 100 °C till 240 °C for 1, 3 and 5 hours.
The appearance and the average value of colour parameters (CIE L*, CIE a* and CIE b*) of heat treated wood are shown in Figures 3, 4, 5 - parts II and III. The CIE L* was the most sensitive parameter clearly related to the treatment intensity. There was a clear tendency of darkening with increasing of heat treatment temperature and time. In contrary, CIE a * and CIE b* parameters changed relatively slightly, when compare to CIE L*. The same tendency of CIE L* , CIE a * andCIE b* variations due to thermal treatment was reported by TOKER et al. (2016), KAMPERIDOU et al. (2013), AKSOU et al. (2011) and BEKHTA & NIEMZ (2003). Colour is an essential wood property for the final consumer. Particularly, it is the determining factor for the selection of a specific wood product for the decorative/visual function ESTEVES et al. (2008b).
Figure 2 presents the second derivative of an averaged near infrared absorbance spectra for thermally treated and reference (untreated) wood. The range of variations is limited only to spectral bands that can be interpreted and associated with well-defined functional groups, which are listed in table 3. Independently to applied thermal treatment (from 100 °C for 1 hour to 240 °C for 5 hours), the spectra present similar trends with typical broad vibration
bands associated to the chemical components of wood. Consequently this trend was figured upon their range, which was determined as the minimum (Figure 2 - green line) and maximum (Figure 2 - red line) value. There was clean tendency of decreasing or increasing of absorbance at various bands. These spectral changes caused by heat treatment were well corresponding to previous reports for heated pine (RIDLEY-ELLIS et al. 2014), larch (YANG et al. 2018) and spruce (POPESCU et al. 2018, BÄCHLE et al. 2010).
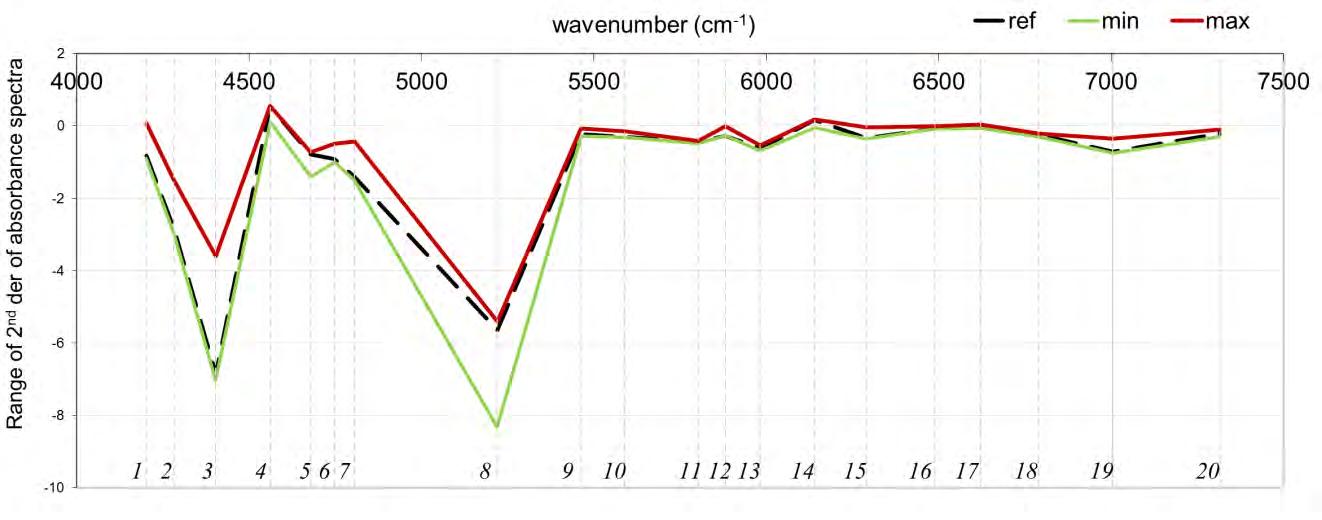
Fig. 2 The range of 2ND derivative of absorbance of FT-NIR spectra on thermally treated and reference samples (Note: used bands 1-20 correspond to components listed in Table 3).
The thermal modification of pine sapwood results in changes of the chemical composition of wood. Closer examination of the xylograms together with changes of absorbance peaks provides additional information regarding kinetics of chemical changes due to treatment temperature and duration (Figures 3, 4, 5 - parts IV. and V.). The most evident variations in NIR spectra, being consequence of changes in chemical composition of functional groups, were observed for the treatments with temperature over 200 °C. On the other hand, cdeg. TT had small values when heating wood at 100 °C or other mild treatment temperatures (150 °C and 160 °C).
The absorption band at 4202 cm1 (band 1 in Table 3 and Figures 3, 4, 5 - part V.) is assigned to the second overtone of –OH deformation of holocellulose. A gradual decrease of the absorbance occurred for all treatment durations; however, the changes were more intense for 3 and 5 hours heat treatment.
Hemicelluloses are polysaccharide with lower degree of polymerization than cellulose. The absorption bands present at the wavenumber 4403 cm-1 (3), 5882 cm-1 (12) and 5802 cm-1 (11) assigned to furanose/pyranose are due to –CH2 stretching and deformation and –CH stretching. A shift in the peak position towards the higher wavelength region occurred with increase of the temperature. This confirms that the physical-chemical structure of the hemicelluloses changes rapidly and its content decreases with the temperature increase (YILDIZ &GÜMÜŞKAYA 2007, SANDAK et al. 2016).
In wood, cellulose has a strong interaction with water due to three hydroxyl groups attached to the glucopyranose ring. The absorption bands assigned to the first overtone of the fundamental –OH stretching mode were identified at wavenumber 4403 cm-1 (3), 4748 cm-1 (6), 6140 cm 1 (14), 6490 cm 1 (16), 6622 cm 1 (17), 6789 cm 1 (18). The absorption band at wavenumber 7005 cm 1 (19), assigned to -OH groups of amorphous regions of cellulose and water shows clear tendencies of its decrease with augmented temperature. The lower degradation intensity was observed for semi-crystalline (4806 cm1
(7), 5463 cm1 (9), 5590 cm1 (10)) and crystalline (6290 cm
1 (15)), regions of cellulose. Similar tendency of degradation kinetic was recorded previously in KAČÍK et al. (2015) and SIVONEN et al. (2002).
Lignin in wood is chemically and physically bonded to cellulose and hemicelluloses forming a three-dimensional polymer complex that contains acetal, α-phenyl-β-ether, phenyl-β-glucosidic and hydrogen bonds. The absorbance of the functional groups associated to lignin (4561 cm-1 (4) and 5982 cm-1 (13)) as well as assigned to lignin and extractives at 4679 cm-1 (5) was reduced in all investigated treatment configurations indicating continue lignin degradation and/or condensation.
The sorption and desorption of water is an important phenomenon which highly affects mechanical and physical properties of wood (e.g. dimensional stability, shrinkage and swelling). The NIR absorption bands at 5220 cm1 (8) and at 7005 cm 1 (19) are assigned to combination of –OH stretching and –OH bending vibration modes in water. As expected, clear changes in both absorbance bands (8 and 19) were observed when the treatment temperature increased from 100 °C to 240 °C.
Tab. 3 Band assignments of selected wood components after thermal modification (according to SCHWANNINGER et al. 2011).
Band Wavenumber (cm1) Chemical component; Bond vibration
1 4202 Holocellulose; O–H deformations (second overtone) 2 4282 Cellulose; C–H stretching, C–H2 deformation 3 4403 Cellulose, hemicellulose; C–H2 stretching, C–H2 deformation, 4 4561 Lignin C–H stretching, C=O stretching 5 4679 Lignin/extractives C–H stretching, C=C stretching 6 4748 Cellulose; O–H deformation, O–H stretching 7 4806 Cellulose semicrystalline and crystalline regions, O–H stretching, C–H deformations 8 5220 Water; O–H stretching, O–H deformations 9 5463 Cellulose semicrystalline and crystalline regions; O–H stretching, C–O stretching (second overtone) 10 5590 Cellulose semicrystalline and crystalline regions; C–H stretching (first overtone) 11 5802 Hemicellulose (furanose/pyranose); C–H stretching (first overtone) 12 5882 Hemicellulose; C–H stretching (first overtone) 13 5982 Lignin; C–H stretching (first overtone) 14 6140 Cellulose; O–H, stretching (first overtone) 15 6290 cellulose crystalline regions; O–H stretching (first overtone) 16 6490 Cellulose; O–H stretching (first overtone) 17 6622 Cellulose; O–H stretching (first overtone) 18 6789 Cellulose; O–H stretching (first overtone) 19 7005 Amorphous cellulose/water; O–H stretching (first overtone) 20 7315 Cellulose; C–H stretching (first overtone), C–H deformations
I. 1 hour treatment
100 °C 150 °C 160 °C 200 °C 220 °C 240 °C
II.
L* III. a
b*
82.13 79.08 73.84 57.91 43.82 32.75 4.30 5.51 5.79 10.68 12.31 9.07 20.86 23.16 23.67 25.77 20.00 12.18

IV.
V.
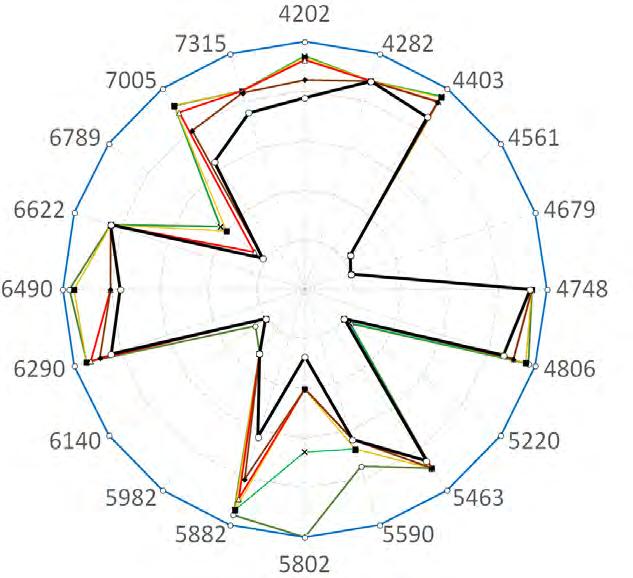
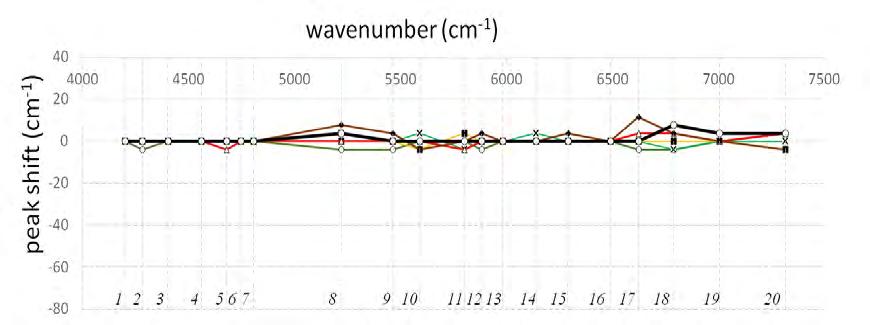
Note: I. Temperature of heat treatment, II. Appearance of heat treated wood, III. Colour of heat treated wood (colour coordinates after heat treatment – CIE L* , CIE a * and CIE b*), IV. Xylograms, V. Peak shift
Fig. 3 Summary results for 1 hour heat treatment of pine sapwood.
I. 3 hours treatment
100 °C 150 °C 160 °C 200 °C 220 °C 240 °C
II.
L* III. a
b*
81.82 75.09 73.81 47.45 34.61 30.26 4.45 6.05 6.00 10.16 9.05 5.00 22.11 24.73 23.97 22.13 13.27 5.36

IV.
V.
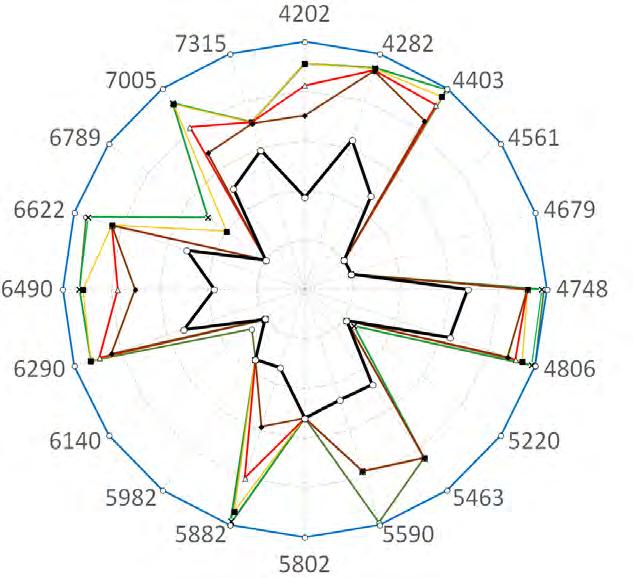
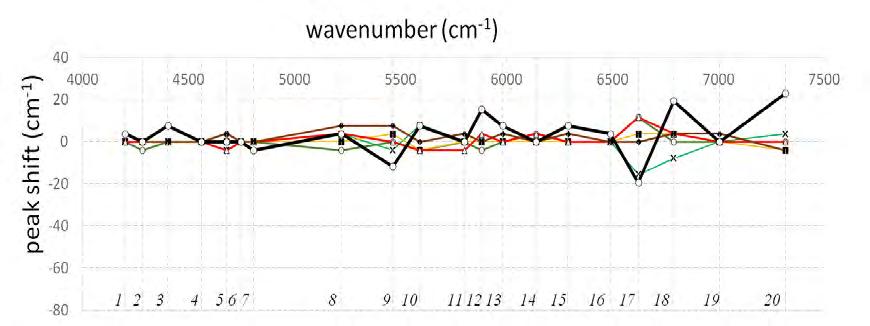
Note: I. Temperature of heat treatment, II. Appearance of heat treated wood, III. Colour of heat treated wood (colour coordinates after heat treatment – CIE L* , CIE a * and CIE b*), IV. Xylograms, V. Peak shift
Fig. 4 Summary results for 3 hours heat treatment of pine sapwood.
I. 5 hours treatment
100 °C 150 °C 160 °C 200 °C 220 °C 240 °C
II.
L* III. a
b*
80.66 75.92 73.65 44.71 31.59 28.31 4.83 6.09 7.15 10.08 8.38 3.83 21.72 25.46 25.52 20.68 10.97 1.21

IV.
V.
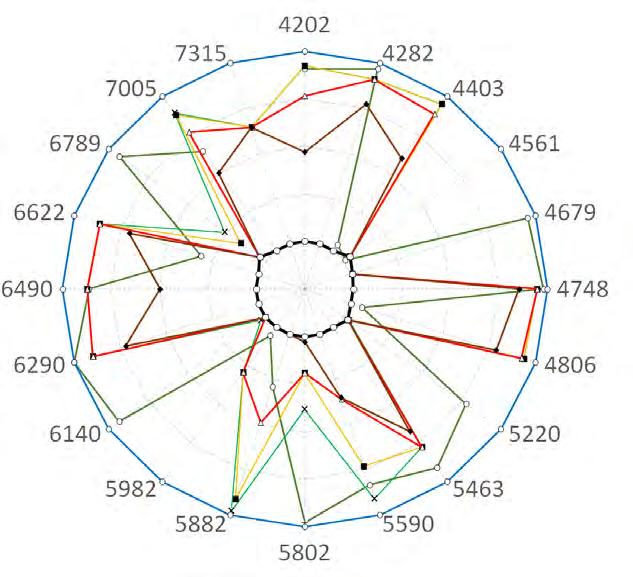
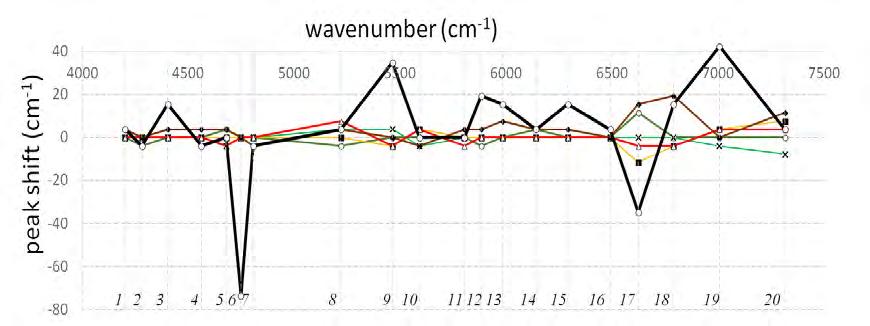
Note: I. Temperature of heat treatment, II. Appearance of heat treated wood, III. Colour of heat treated wood (colour coordinates after heat treatment – CIE L* , CIE a * and CIE b*), IV. Xylograms, V. Peak shift
Fig. 5 Summary results for 5 hours heat treatment of pine sapwood.
CONCLUSSIONS
Treatment duration and temperature, beside of the oxygen concentration, are principal factors that affect wood chemical change and its final appearance due to thermal modification. The analyses of FT-NIR spectra provided essential information about chemical changes of wood components after that process. It was confirmed that heattreatment of wood at elevated temperatures (over 200 °C) caused extensive destruction of hemicelluloses. Some extent of semi-crystalline cellulose and lignin degradation was also noticed but in a smaller degree. Therefore, the number of sorption sites available to link water with wood was dramatically reduced due to thermal treatment. Profound understanding of chemical changes might be helpful for further optimization of the thermal treatment procedures at industrial scale. For that reason, xylograms are identified as a simple and illustrative method that might be highly suitable for visualization how thermal treatment effects on the chemical composition of wood. The same method may be implemented for studies on alternative modification/degradation processes of wood and other lignocellulosic materials.
REFERENCES
ALTGEN, M., HOFMANN, T., MILITZ, H. 2016. Wood moisture content during the thermal modification process affects the improvement in hygroscopicity of Scots pine sapwood. In Wood science and technology, 50(6): 1181–1195. AKSOU, A., DEVECI,M., BAYSAL, E., TOKER, H. 2011. Colour and gloss changes of Scots pine after heat modification. In Wood Research, 56(3): 329–336. BÄCHLE, H., ZIMMER, B., WINDEISEN, E., WEGENER, G. 2010. Evaluation of thermally modified beech and spruce wood and their properties by FT-NIR spectroscopy. In Wood science and technology, 44(3): 421–433. BEKHTA,P.,NIEMZ,P. 2003. Effect of high temperature on the change in color, dimensional stability and mechanical properties of spruce wood. In Holzforschung 57: 539–546 ČABALOVÁ, I., KAČÍK, F., KAČÍKOVÁ, D., ORAVEC, M. 2014. The influence of cross-section of spruce wood specimens on saccharides changes at thermal loading. In Acta Facultatis Xylologiae Zvolen, 56(2): 81–86. ESTEVES,B.,DOMINGOS, I.,PEREIRA,H. 2008a. Pine wood modification by heat treatment in air. In BioResources, 3(1): 142–154. ESTEVES, B., MARQUES, A.V., DOMINGOS, I., PEREIRA H. 2007. Influence of steam heating on the properties of pine (Pinus pinaster) and eucalypt (Eucalyptus globulus) wood. In Wood Science and Technology, 41(3): 193–207. ESTEVES, B., MARQUES, A. V., DOMINGOS, I., PEREIRA, H. 2008b. Heat-induced colour changes of pine (Pinus pinaster) and eucalypt (Eucalyptus globulus) wood. In Wood Science and Technology, 42(5): 369–384. ESTEVES, B., PEREIRA, H. 2008. Quality assessment of heat-treated wood by NIR spectroscopy. In European Journal of Wood and Wood Products, 66(5): 323–332. HILL, C. A. 2007. Wood modification: chemical, thermal and other processes (Vol. 5). John Wiley & Sons. GÉRARDIN, P. 2016. New alternatives for wood preservation based on thermal and chemical modification of wood—a review. In Annals of forest science, 73(3): 559–570. HAKKOU, M., PÉTRISSANS, M., GÉRARDIN, P., ZOULALIAN, A. 2006. Investigations of the reasons for fungal durability of heat-treated beech wood. Polymer degradation and stability, 91(2), 393-397. HILLIS, W. E. 1984. High temperature and chemical effects on wood stability. In Wood Science and Technology, 18(4): 281–293.
KAČÍK, F., ĽUPTÁKOVÁ, J., ŠMÍRA, P., NASSWETTROVÁ, A., KAČÍKOVÁ, D., VACEK, V. 2016. Chemical alterations of pine wood lignin during heat sterilization. In BioResources, 11(2): 3442–3452. KAMPERIDOU, V., BARBOUTIS, I., VASILEIOU, V. 2013. Response of colour and hygroscopic properties of Scots pine wood to thermal treatment. In Journal of Forestry Research, 24(3): 571–575. KUČEROVÁ, V., LAGAŇA, R., VÝBOHOVÁ, E., HÝROŠOVÁ, T. 2016. The effect of chemical changes during heat treatment on the color and mechanical properties of fir wood. In BioResources, 11(4): 9079–9094. MARTINKA, J., KAČÍKOVÁ, D., RANTUCH, P., BALOG, K. 2016. Investigation of the influence of spruce and oak wood heat treatment upon heat release rate and propensity for fire propagation in the flashover phase. In Acta Facultatis Xylologiae Zvolen. 58(1): 5–14. MEHROTRA, R., SINGH, P., KANDPAL, H. 2010. Near infrared spectroscopic investigation of the thermal degradation of wood. In Thermochimica Acta, 507: 60–65. MILITZ, H. 2002. Thermal treatment of wood: European processes and their background. In: International Research Group Wood Preservation, IRG/WP 02- 40241, Cardiff, Wales POPESCU, C. M., NAVI, P., PEÑA, M. I. P., POPESCU, M. C. 2018. Structural changes of wood during hydro-thermal and thermal treatments evaluated through NIR spectroscopy and principal component analysis. In Spectrochimica Acta Part A: Molecular and Biomolecular Spectroscopy. 191: 405–412. PRIADI, T., HIZIROGLU, S. 2013. Characterization of heat treated wood species. In Materials & Design, 49: 575–582. REINPRECHT, L.,VIDHOLDOVÁ, Z. 2011. Termodrevo. Ostrava : Šmíra-print. 89 p. RIDLEY-ELLIS, D., POPESCU, C. M., KEATING, B., POPESCU, M. C., HILL, C. A. 2014. Stiffness changes during low temperature thermal treatment of Scots pine, assessed by acoustic NDT. In 7th European Conference on Wood Modification, Lisbon, Portugal, (Session 2B, Paper 1). 7 p. SANDAK, A., SANDAK, J., ALLEGRETTI, O. 2015. Quality control of vacuum thermally modified wood with near infrared spectroscopy. In Vacuum, 114: 44–48. SANDAK J., SANDAK A., ALLEGRETTI O. 2016. Chemical changes to woody polymers due to high temperature thermal treatment assessed with near infrared spectroscopy. In Journal of Near Infrared Spectroscopy, Wood NIR Special Issue 24, 6: 555–562. SANDBERG, D., KUTNAR, A. 2016. Thermal modified timber (TMT): recent development in Europe and North America. In Wood and Fiber Science, 48: 28–39. SCHWANNINGER, M., RODRIGUES, J.C., FACKLER, K. 2011. A review of band assignments in near infrared spectra of wood and wood components. In Journal of Near Infrared Spectroscopy 19: 287–308. ŠUŠTERŠIC, Ž., MOHAREB, A., CHAOUCH, M., PÉTRISSANS, M., PETRIČ, M., GÉRARDIN, P. 2010. Prediction of the decay resistance of heat treated wood on the basis of its elemental composition. In Polymer Degradation and Stability, 95(1): 94–97. SIVONEN, H., MAUNU, S. L., SUNDHOLM, F., JÄMSÄ, S., VIITANIEMI, P. 2002. Magnetic resonance studies of thermally modified wood. In Holzforschung, 56(6): 648–654. STAMM, A. J. 1956. Thermal degradation of wood and cellulose. In Industrial & Engineering Chemistry, 48(3): 413–417. TODOROVIC,N.V.,POPOVIĆ,Z.,MILIĆ,G.,POPADIĆ,R.2012. Estimation of heat-treated beechwood properties by color change. In BioResources, 7(1): 0799–0815. TOKER, H., BAYSAL, E., KOTEKLI, M., TURKOGLU, T. T., KART, S., SEN, T. F.,PEKER, T. H. 2016. Surface characteristics of oriental beech and scots pine woods heat-treated above 200 C. In Wood Research, 61: 4354. TSUCHIKAWA, S., KOBORI, H. 2015. A review of recent application of near infrared spectroscopy to wood science and technology. In Journal of Wood Science, 61(3): 213220. YANG,S.Y.,HAN,Y.,CHANG,Y.S.,PARK,J.H.,PARK,Y.,CHUNG,H.,YEO,H.2018. Classification of the hot air heat treatment degree of larch wood using a multivariate analysis of near-infrared spectroscopy. In Journal of Wood Science, 64(3): 220225. YILDIZ, S., GÜMÜŞKAYA, E. 2007. The effects of thermal modification on crystalline structure of cellulose in soft and hardwood. In Building and Environment, 42(1): 62–67. YILDIZ,S.,YILDIZ,U.C.,TOMAK,E. D.2011. The effects of natural weathering on the properties of heat-treated alder wood. In BioResources, 6(3): 2504–2521.
VIITANIEMI, P., JAMSA, S., EK, P., VIITANEN, H. 1997. Method for improving biodegradation resistance and dimensional stability of cellulosic products. U.S. Patent No. 5,678,324. Washington, DC: U.S. Patent and Trademark Office. WELZBACHER, R.C., RAPP, O.A. 2007. Durability of thermally modified timber from industrial-scale processes in different use classes: Results from laboratory and field tests. In Wood Material Science and Engineering, 2(1): 4–14. WELZBACHER, R.C., BRISCHKE, C., RAPP, O.A. 2007. Influence of treatment temperature and duration on selected biological, mechanical, physical and optical properties of thermally modified timber. In Wood Material Science and Engineering, 2(2): 66–76.
ACKNOWLEDGEMENT
This work was supported by the Slovak Research and Development Agency under the contract No. APVV-17-0583. Part of this research was conducted within BIO4ever (RBSI14Y7Y4) project funded within a call SIR by MIUR. The authors gratefully acknowledge the European Commission for funding the InnoRenew CoE project (Grant Agreement #739574) under the Horizon 2020 Widespread-Teaming program. We thank European mobility programmes Erasmus+ for financial support the mobility to CNR-IVALSA in San Michele all Adige (Italy) and COST action FP1407 for networking opportunity.
AUTHORS ADDRESS
Zuzana Vidholdová Technical University in Zvolen Faculty of Wood Sciences and Technology Department of Mechanical Wood Technology T. G. Masaryka 24 960 53 Zvolen Slovak Republic Corresponding author: zuzana.vidholdova@tuzvo.sk Anna / Jakub Sandak Trees and Timber Institute CNR-IVALSA via Biasi 75 38010 San Michele all Adige Italy Corresponding author: anna.sandak@ivalsa.cnr.it Jakub Sandak InnoRenew CoE Livade 6, 6310 Izola Slovenia e-mail: jakub.sandak@innorenew.eu Jakub Sandak University of Primorska Andrej Marušič Institute Muzejski trg 2 SI-6000 Koper Slovenia


