16 minute read
DRYING THE SPRUCE (PICEA ABIES L. KARST.) COMPRESSION WOOD
ACTA FACULTATIS XYLOLOGIAE ZVOLEN, 61(1): 53−61, 2019 Zvolen, Technická univerzita vo Zvolene DOI: 10.17423/afx.2019.61.1.05
DRYING THE SPRUCE(PICEA ABIES L. KARST.)COMPRESSION WOOD
Advertisement
Ivan Klement Miroslav Uhrín Tatiana Vilkovská
ABSTRACT
The aim of the paper is to analyse differences in drying rate of compression and opposite spruce wood. Compression wood samples and their corresponding normal wood samples from the opposite part of a sample log were compared under conditions of two different drying modes (t = 60 °C and t = 90/120 °C). Also differences in density, initial and final moisture content, moisture gradient, intensity of water evaporation and case-hardening, both before and after drying process, were analysed. The differences in drying rate were noticeable mostly at the beginning of drying process. Slower drying rates, both above and under the fibre saturation point, were represented by compression wood. As expected, the differences in density of compression and opposite wood in oven dry state can be reported. Differences in initial moisture content were not found and the differences in moisture gradient were not considered significant. The negative effect of compression wood on casehardening was not confirmed. Since the compression wood is the source of difficulties in wood processing, better knowledge of these different characteristics may have positive impact on spruce wood processing. Key words: compression wood, opposite wood, drying, spruce, moisture gradient.
INTRODUCTION
Reaction wood is created in coniferous and deciduous trees as a respond to the deviation of trunk from the vertical position. Reaction wood of coniferous trees is also called compression wood, because it is created on the compression side of the trunk. At a macroscopic level, compression wood is often recognised by its characteristic colour (TIMELL 1986). Compression wood appears dark because it absorbs more light, due to the high lignin content, and scatters less light, due to thick tracheid walls. As a general rule, the intensity of the colour of compression wood increases with increasing severity of compression wood (WARENSJÖ 2003). In cross sections, compression wood is characterised by thick cell walls and rounded outline of its tracheids, increased occurrence of spaces and the absence of the inner part of the secondary wall, the S3 layer (OLLINMAA 1959). The angle of microfibrils in S2 layer is 30°– 45° compared to 15°– 30° in normal wood (NEČESANÝ 1956, GORIŠEK and TORELLI 1999). OLLINMAA (1959) also found that in compression wood, tracheids are shorter compared to normal wood. There are also less bordered pits in compression wood (TARMIAN et al. 2011). From a chemical point of view, the compression wood has a higher content of lignin than normal wood (NEČESANÝ 1956, SAITO and FUKUSHIMA 2005).
Compression wood has properties which adversely affect its usefulness in wood products. Thicker cell walls coupled with the greater proportion of lignin in the cell wall makes the wood denser, more impermeable and stronger in compression. The larger microfibril angle in the S2 layer reduces the tensile strength and modulus of elasticity and increases the brittleness of the wood, making it unsuitable for uses in which it is likely to experience high stresses. The larger microfibril angle also means that the wood has a higher longitudinal shrinkage on drying, but a lower transverse shrinkage. This explains the distortion on drying of pieces of wood containing both normal and compression wood (BARNETT et al.). High longitudinal shrinkage of compression wood is source of problems during drying. The problem occurs when the dried material (board) contains both compression and normal wood. This may lead to non-uniform shrinkage causing distortion in the form of spring, bow or cup. The drying characteristics of compression wood are still not well explained. Among rare studies on compression wood drying TARMIAN et al. (2009) investigated wood of Picea abies L. Karst containing a high proportion of well-developed compression wood and put forward that compression wood had a much lower drying rate than normal wood. They found out that noticeable difference in drying of compression and normal wood is in the domain above fibre saturation point (FSP), when the free water is removed. As the moisture content decreased to the bound water domain, the compression wood was dried comparatively fast as normal wood, and time to reach the same moisture content of 12% was similar because of the higher initial moisture content of the normal wood. STRAŽE and GORIŠEK (2006) also reported, that compression wood (radially oriented spruce samples) dried slower and also to higher equilibrium moisture content compared to normal wood samples.
The aim of presented article was to analyse differences in drying of compression and opposite spruce wood and to determine differences in density, moisture, moisture gradient, intensity of water evaporation and case-hardening. Better understanding of compression wood behaviour in drying process might have a positive effect on quality of final products.
EXPERIMENTAL
Materials
Spruce log (Picea abies L. Karst) with content of compression wood was selected from the forests in Sielnica-Brestová (Slovakia). The diameter of the log was 38 cm on the narrow end and length was 4 m. Based on the distribution of compression wood along the whole log, one shorter log (1m long) was cut out. Thickness of compression wood zone on both ends of the log was not smaller than 8 cm.

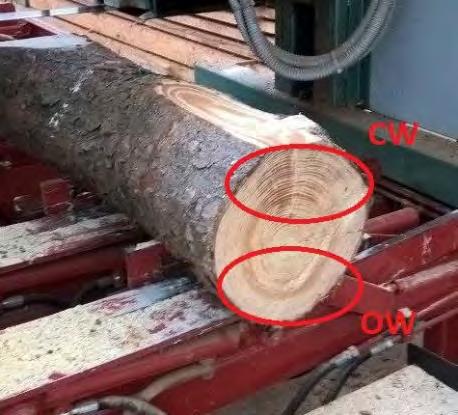
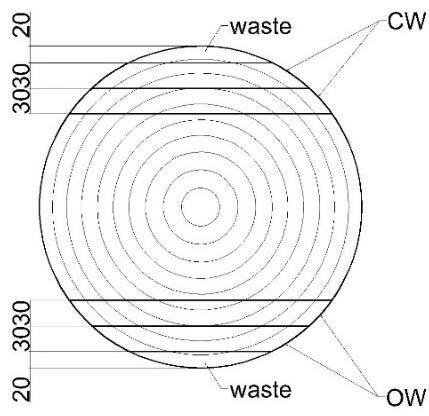
Fig. 1 Spruce log with marked areas of compression wood-CW and opposite wood-OW (left) and sawing pattern (right).
Four boards were cut out from the sapwood zone of log, according to sawing pattern (Fig. 1). Two compression wood boards and two normal wood boards from opposite part of log (opposite wood). Subsequently, 4 drying samples were cut out from each board as shown in Figure 2 (4 compression wood samples and 4 opposite wood samples), with dimensions of 30 × 100 × 300 mm (thickness × width ×length).

Fig. 2 Method of samples cut out. 1-drying sample, 2-part of board from which initial moisture content sample, moisture gradient sample, case-hardening sample and density sample were cut out, 3-waste.
Methods
The process of drying was conducted using a laboratory kiln Memmert HCP 108 (Memmert GmbH + Co. KG, Schwabach, Germany) at the Department of Wood Technology, Technical University in Zvolen, Slovakia. Two drying modes were used.
Drying mode No.1 was conducted with maximum drying temperature of 60 °C and No.2 with maximum drying temperature of 120 °C (Table 1). The same psychrometric difference (Δt) of 2 °C was maintained in the stage above the FSP for both drying modes. The psychrometric difference was increased to 12 °C when all samples reached fibre saturation point (approximately 30% of moisture content). During the drying mode No. 2, when the moisture content of all samples decreased below FSP, the drying temperature increased to 120 °C without regulation of relative humidity of the ambient air. Eight samples for both drying modes were placed in the drying chamber (four compression wood and four opposite wood samples) with their end grains sealed with silicone. Weight of each sample was continuously measured every 24 hours during drying. The gravimetric method was used to determine actual moisture content.
Tab. 1 Drying modes.
Drying mode
above FSP below FSP
t (°C) (%) Δt (°C) t (C°) (%) Δt (°C) 1 60 91 2 60 52 12 2 90 94 2 120 - -
The density of wood at initial and final moisture content was measured according to STN EN 49 0108. The initial and final moisture content of wood was measured using the gravimetric method according to STN EN 49 0103. The intensity of water evaporation from the surface of samples was calculated using Eq. 1
∆�� 2��(��+ℎ)·3600·�� (kg·m
−2 ·s −1)
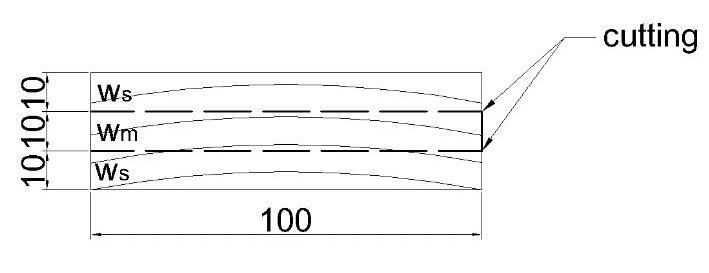
(1) where Δm is weight loss of wood during drying, l (length), b (width), h (thickness) of dried samples and τ is drying time interval. Moisture gradient was measured before and after the drying process. The samples were cut into three layers according to Fig. 3. The moisture content of layers was measured
using gravimetric method according to STN EN 49 0103. Subsequently, the moisture gradient was calculated using Eq. 2
∑���� (%) (2)2 where wm is moisture content of the middle layer and ws is moisture content of surface layers (%).

Fig. 3 Method of sample preparation for moisture gradient determining.
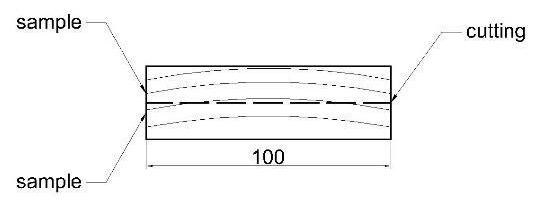
Case-hardening of wood before and after drying process was determined according to STN EN 49 0645. The method of sample preparation and case-hardening measurement is illustrated in Fig. 4. The level of case-hardening was determined according to the maximum space between the layers.
Mentioned properties were measured on the all samples.


Fig. 4 Method of case-hardening sample preparation (left) and realization of case-hardening method (right).
RESULTS AND DISCUSSION
Table 2 shows density, initial and final moisture content and drying time of compared samples. The average density of compression wood measured at 0% MC was 562.2 kg.m
-3 whilst the density of opposite wood was 479.2 kg.m
-3 . It is 14.7% higher value. KLEMENT and HURÁKOVÁ (2015) also reported a higher density of spruce compression wood (527 kg.m -3 vs. 441 kg.m -3). The reason for higher value of compression wood density are thicker cell walls containing more lignin. Another reason is up to four times higher content of latewood (WARENSJÖ 2003, GRYC 2005, DIAZ-VAZ et al. 2009). The density of compression wood is also affected by ratio of compression wood and position in the trunk.
Drying mode No. 1.
Initial moisture content of compression wood and opposite wood samples was approximately at the same level. The drying rate of compression wood was lower compared to opposite wood, both over and under FSP. The difference in drying rate was remarkable during first 48 hours of drying process. This is also associated with a slightly higher intensity of water evaporation during this phase (Table 3). Compression wood reached the required final moisture content of 10% in 241 hours whilst the opposite wood reached this moisture content in 189 hours (Fig. 5).
Tab. 2 Density, moisture content and drying time of samples
Fig. 5 Drying rate curves for drying mode No. 1.
Tab. 3 Weight loss of samples and intensity of water evaporation for drying mode No. 1.
Drying mode Sample
1
2 CW1 CW2 OW1 OW2 CW1 CW2 OW1 OW2 Average Density at 0% MC Initial Moisture Content
Final Moisture Content Drying Time ρ0 (kg·m 3) wi (%) wf (%) t(h)
570 83.20 84.06 10.50 10.63 241
479 83.21 82.48 10.21 10.13 189
554 89.78 88.89 9.60 9.71 150.5
479 87.59 86.76 9.59 9.38 149
] % [ Moisture content
100 90 80 70 60 50 40 30 20 10 0
0 50 100 t [h] 150 compression wood opposite wood 200 250
Drying Mode No. 1 Drying Time Weight Loss of Samples Intensity of Water Evaporation t (h) m (kg) g (kg·m -2·s -1) CW OW CW OW
0 24 48 72 96 121 145 169 189 193 0.046 0.048 6.84503E-06 7.1596E-06 0.034 0.036 5.11485E-06 5.26769E-06 0.030 0.031 4.39666E-06 4.56137E-06 0.027 0.026 3.96189E-06 3.91144E-06 0.023 0.022 3.26211E-06 3.07692E-06 0.020 0.017 2.98255E-06 2.58191E-06 0.019 0.016 2.81784E-06 2.37417E-06 0.043 0.040 7.58902E-06 7.1045E-06 0.005 4.42493E-06
217 241 0.021 0.012 3.06126E-06 1.71283E-06
Drying mode No. 2.
The differences in drying rate curves of compression and opposite wood were remarkable during first 24 hours of drying. The opposite wood reached higher intensity of water evaporation than the compression wood during this phase. Subsequently, the drying rate curves of both wood were similar. The overall time required to reach the desired final
moisture content was very similar. Compression wood reached the required final moisture of 10% in 150.5 hours and the opposite wood in 149 hours (Fig. 6).
100,00 90,00
] % [ moisture content
80,00 70,00 60,00 50,00 40,00 30,00 20,00 10,00 0,00
0 50 100
t [h]
150 compression wood opposite wood 200 250
Fig. 6 Drying rate curves for drying mode No. 2.
Tab. 4 Weight loss of samples and intensity of water evaporation for drying mode No. 2.
Drying Time Weight Loss of Samples Intensity of Water Evaporation t(h) m (kg) g (kg·m 2·s 1) CW OW CW OW
0 24 0.059 0.076 8.7755E-06 1.1277E-05
48 0.049 0.040 7.2264E-06 5.9963E-06
74 0.054 0.038 7.3759E-06 5.157E-06
98 0.048 0.030 7.0854E-06 4.4649E-06
122 0.048 0.026 7.0557E-06 3.8654E-06
144
0.041 0.021 6.6531E-06 3.4318E-06 149 0.102 0.050 7.2365E-05 3.583E-05 150.5 0.034 8.0926E-05
The difference in drying intensity of compression and opposite wood is due to differences in the anatomical structure (TARMIAN and PERRÉ 2009). Longitudinal and radial permeability of compression wood is lower compared to opposite wood (TARMIAN et al. 2009). The opposite wood dries remarkably faster compared to compression wood during the phase of free water removal due to larger and more numerous bordered pits of axial tracheids. Similar, the extended process of diffusion in compression wood is associated with a higher density of wood caused by less permeable, thick cell walls. Our results are consistent with TARMIAN et al. 2009. The moisture loss in compression wood over FSP was lower. WILLIAMS (1971) and DAVIS et al. (2002) mentioned that the differences in drying rate curves of compression and opposite wood gradually decrease as the moisture content approaches the FSP. This was not confirmed by our measurements. Compression wood dried slower even during the phase of bound water removal, this can be caused by a different structure of compression wood. Compression wood reached the required final moisture content substantially later than opposite wood under the conditions of drying mode No.1. When the drying mode No. 2 was used, the compression wood dried slower than opposite wood in the area below the FSP. The time necessary to reach the required final moisture content was 1.5 hours longer.
The moisture gradient values are shown in Table 5. Values of moisture gradient were similar before the drying process. The negative moisture gradient of some samples was caused due to freezing of samples and subsequent condensation of water on sample surfaces after defrosting. Compression wood samples reached slightly higher values of moisture gradient after drying, under the conditions of both drying modes. Though, differences were small and can be considered insignificant.
The level of case-hardening of compression wood samples was lower compared to opposite wood samples before the drying process. This indicates that the samples were wellselected and consisted only pure compression wood (Table 6). Higher level of casehardening after drying process was showed in opposite samples. The samples reached higher level of case-hardening under the conditions of drying mode No. 2 (high-temperature) compared to drying mode No.1.
From the resulting data, the adverse effect of compression wood on the level of casehardening cannot be ascertained. Case-hardening level could be affected by combination of high temperature and high relative humidity.
Tab. 5 Moisture gradient.
Drying Mode No. 1
Sample Moisture Content (%)
Ws Wm Ws Ø ws Δw Drying Mode No. 2 Moisture Content (%)
Ws Wm Ws Ø ws Δw
Before Drying Process CW1 73.23 81.74 82.53 77.88 3.86 79.96 80.97 83.44 81.70 0.73 CW2 87.01 87.12 81.80 84.40 2.72 91.61 86.16 84.55 88.08 1.92 OW1 71.85 80.70 80.35 76.10 4.60 88.25 84.51 77.92 83.09 1.42 OW2 72.06 76.24 79.14 75.60 0.64 93.80 95.66 97.77 95.78 0.13 After Drying Process CW1 9.94 11.60 10.74 10.34 1.26 8.66 10.09 9.60 9.13 0.96 CW2 9.89 10.75 9.51 9.70 1.05 8.48 10.15 9.02 8.75 1.40 OW1 9.24 9.98 9.49 9.37 0.61 9.49 9.87 9.50 9.49 0.38 OW2 10.59 9.77 8.80 9.69 0.08 9.81 9.67 8.95 9.38 0.29
Tab. 6 The values of case-hardening.
Case-hardening
Drying Mode No. 1 Drying Mode No. 2 CW1 CW2 OW1 OW2 CW1 CW2 OW1 OW2
Size of Gap (mm) Before Drying Process 0 0 1.3 1.46 0.45 0 1.25 1.43 After Drying Process 1.04 1.44 1.27 2.29 6.54 1.62 2.12 10.32
CONCLUSION
Our measurements have shown the following findings: Compression wood dried remarkably slower than opposite wood during both phases (over and under FSP). The time necessary to reach the required final moisture content of 10% was 52 hours longer when the drying mode No. 1 was used (t = 60 °C) and 1.5 hours longer when the drying mode No. 2 was used (t = 120 °C). Differences in drying rate and intensity of water evaporation were noticeable especially at the start of the drying process (first 24 to 48 hours). The compression wood density in oven dry state was 14.7% higher than opposite wood.
Compression wood samples reached slightly higher values of moisture gradient after drying process under the conditions of both drying modes. But the differences were small and can be considered unnoticeably. The adverse effect of the compression wood on the level of case-hardening after the drying process cannot be ascertained. Better knowledge of these properties can help with the processing of coniferous wood under production conditions.
REFERENCES
BARNETT, J., SARANPÄÄ, P., GRIL, J. 2014. The Biology of Reaction Wood. Berlin Heidelberg : Springer-Verlag, p. 7. ISBN 978-3-642-10813-6. DAVIS, CP., CARRINGTON, CG., SUN, ZF. 2002. The influence of compression wood on the drying curves of Pinus radiata in dehumifier conditions. In Dry Technology, 2002, 20(4): 2005–2026. DIAZ.VAZ, J. E. et al. 2009. Redalyc density and chemical composition madera de compresión en Pinus radiata II: Densidad y compuestos químicos, In Maderas. Ciencia y technologia, 2009, 11(2): 139151. GORIŠEK, Ž., TORELLI, N. 1999. Microfibril Angle in Juvenile, Adult and Compression Wood of Spruce and Silver Fir. 1999, In Phyton (Buenos Aires), 39: 2730. GRYC, V. 2005. Stavba a vybrané vlastnosti dřeva smrku (Picea abies L. Karst.) s výskytem reakčního dřeva. 2005, Doctoral Thesis. Brno : MZLU, p.192. KLEMENT, I., HURÁKOVÁ, T. 2015. Vplyv sušenia na vlastnosti a kvalitu smrekového reziva s obsahom reakčného dreva, In Acta Facultatis Xylologiae Zvolen, 2015. 57(1): 7582. ISSN 13363824. NEČESANÝ, V. 1956. Struktura reakčního dřeva. Praha : Preslia, 28: 6165. ISSN 0032-7786. OLLINMAA, P. J. 1959. On certain physical properties of wood growing on drained swamps. In Acta Forestalia Fennica 72. 24 pp. (In Finnish with English summary). SAITO, K., FUKUSHIMA, K. 2005. Distribution of lignin interunit bonds in the differentiating xylem of compression and normal woods of Pinus thunbergii. In Journal of Wood Science, 2005, 51(10): 246251. STN 490 103: 1993. Wood. Determination of the moisture content of the physical and mechanical testing. Slovak Standards Institute, Bratislava, Slovakia. STN 490 108: 1993. Wood. Determination of density. Slovak Standards Institute, Bratislava, Slovakia. STN 490 645: 1993. Testing of quality of dried timber (test of case-hardening of timber) Slovak Standards Institute, Bratislava, Slovakia. STRAŽE,A.,GORIŠEK,Z. 2006. Drying characteristics of compression wood in Norway spruce (Picea abies Karst.). In Wood structure and properties. Zvolen : Arbora Publishers, pp. 399–403 TARMIAN, A., AZADFALLAH, M., GHOLAMIYAN, H., SHAHVERDI, M. 2011. Inter-Tracheid and Cross-Field Pitting in Compression Wood and Opposite Wood of Norway Spruce (Picea abies L.). In Notulae Scientia Biologicae, 2011. 3(2): 145151. TARMIAN,A.,PERRÉ,P. 2009: Air permeability in longitudinal and radial directions of compression wood of Picea abies L. and tension wood of Fagus sylvatica L. In Holzforschung, 63(3): 352356. TARMIAN, A., REMOND, R., FAEZIPOUR, M., KARIMI, M., PERRÉ, P. 2009. Reaction wood drying kinetics: tension wood in Fagus sylvatica and compression wood in Picea abies. In Wood Science and Technology, 2009, 43(11): 113–130. TIMELL, T. E. 1986. Compression wood in Gymnosperms. Vol. 1: Properties of compression wood. Berlin : Springer Verlag, 1986. p. 2150. ISBN 3-540-15715-8. WARENSJÖ, M. 2003. Compression wood in Scots pine and Norway spruce. Diss. (sammanfattning/summary) Umeå: Sveriges lantbruksuniv. In Acta Universitatis Agriculturae Sueciae. Silvestria, 2003, Doctoral Thesis.1401-6230;298 ISBN 91-576-6532-X.
WILLIAMS,D.H. 1971. A comparison of rates of drying of “compression” and “Normal” 4 in by 1 in Pinus radiate in N Z For. Res. Inst. Forest Product Report. 12: 303.
ACKNOWLEDGMENTS
This work was supported by the Slovak Research and Development Agency under the contract no. APVV-17-0583.
ADDRESS OF AUTHORS
Ivan Klement Miroslav Uhrín Tatiana Vilkovská Technical University in Zvolen Faculty of Wood Sciences and Technology Department of Wood Technology T. G. Masaryka 24 960 53 Zvolen klement@tuzvo.sk xuhrin@tuzvo.sk tatiana.vilkovska@tuzvo.sk


