UX Design Portfolio
Xueyi Duan


• I work for TP-LINK as a software engineer. Security cameras are one of the products manufactured in TP-LINK factories. Before packaged, cameras are required to go through a series of tests to ensure that the product quality is qualified. One of the tests is to test the number and brightness of the LED lights on the product.

• In winter 2020, I noticed that line workers had to turn on LEDs and measure the brightness with their naked eyes. Thus, most workers experienced eye pain, tearing, photophobia, and blurred vision after long hours of work.
• Plus, the test accuracy was also negatively affected due to human error.
• The manual test accuracy was already up to 87%. It’s a challenge to improve it.
• To solve the problem, I planned to replace this test procedure into a software-controlled one.
• Line workers were reluctant to change their working process. So the new test has to be a very easy to use one, otherwise no one would use it.
• How to design a new test procedure that are easy to use, efficient, and with higher performances?
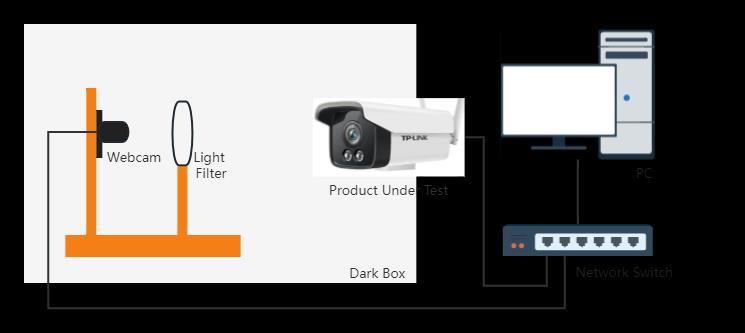
I used a webcam to photograph LEDs on the product, then used image recognition technology to measure the brightness and number of LEDs.
To improve the recognition accuracy, a light filter was equipped between the webcam and the product to filter extra light. The system was set in a dark box to suppress interference from outside lights.


On a business trip, I found workers felt uncomfortable while working. I talked with them and found the problem.
Convinced policymakers to change the situation. Proposed image recognition solutions and sought support from algorithm engineers.
Interview:Lineworkers
85% eye discomfort 65% welcomed to change the test procedure 20% concerned about the test accuracy after change
Designed and tested 4 version.
Development and validation
SEP. 18 NOV. 06
Finished.
13 for red LEDs 42 29 for white LEDs
customer returns due to LEDs quality issue
• White LEDs are much brighter than red LEDs, which caused 2.23 times more abnormalities than red LEDs.
70%
test error happened in the second half of working hours
• Statistics found a positive correlation between test error rate and working hours, and fatigue has negatively affected the test accuracy.
Use a webcam to capture the product.
Use image recognition to measure the number and brightness of LEDs.
Add a light filter to filter out excess light.


��
White LEDs were so bright that several lights were recognized as a single light.
Needed to get less light into the webcam.
�� LEDs were recognized correctly.
�� Factory lights sometimes interfered with the results.
��
Image capture and image recognition worked perfectly.
Dark boxes


Use a dark box to exclude irrelevant lights.
Add a clamp to hold the webcam and filter in place


The webcam and filter will move after several tests, requiring adjusting.
After 3*2000 tests, no test error was found.


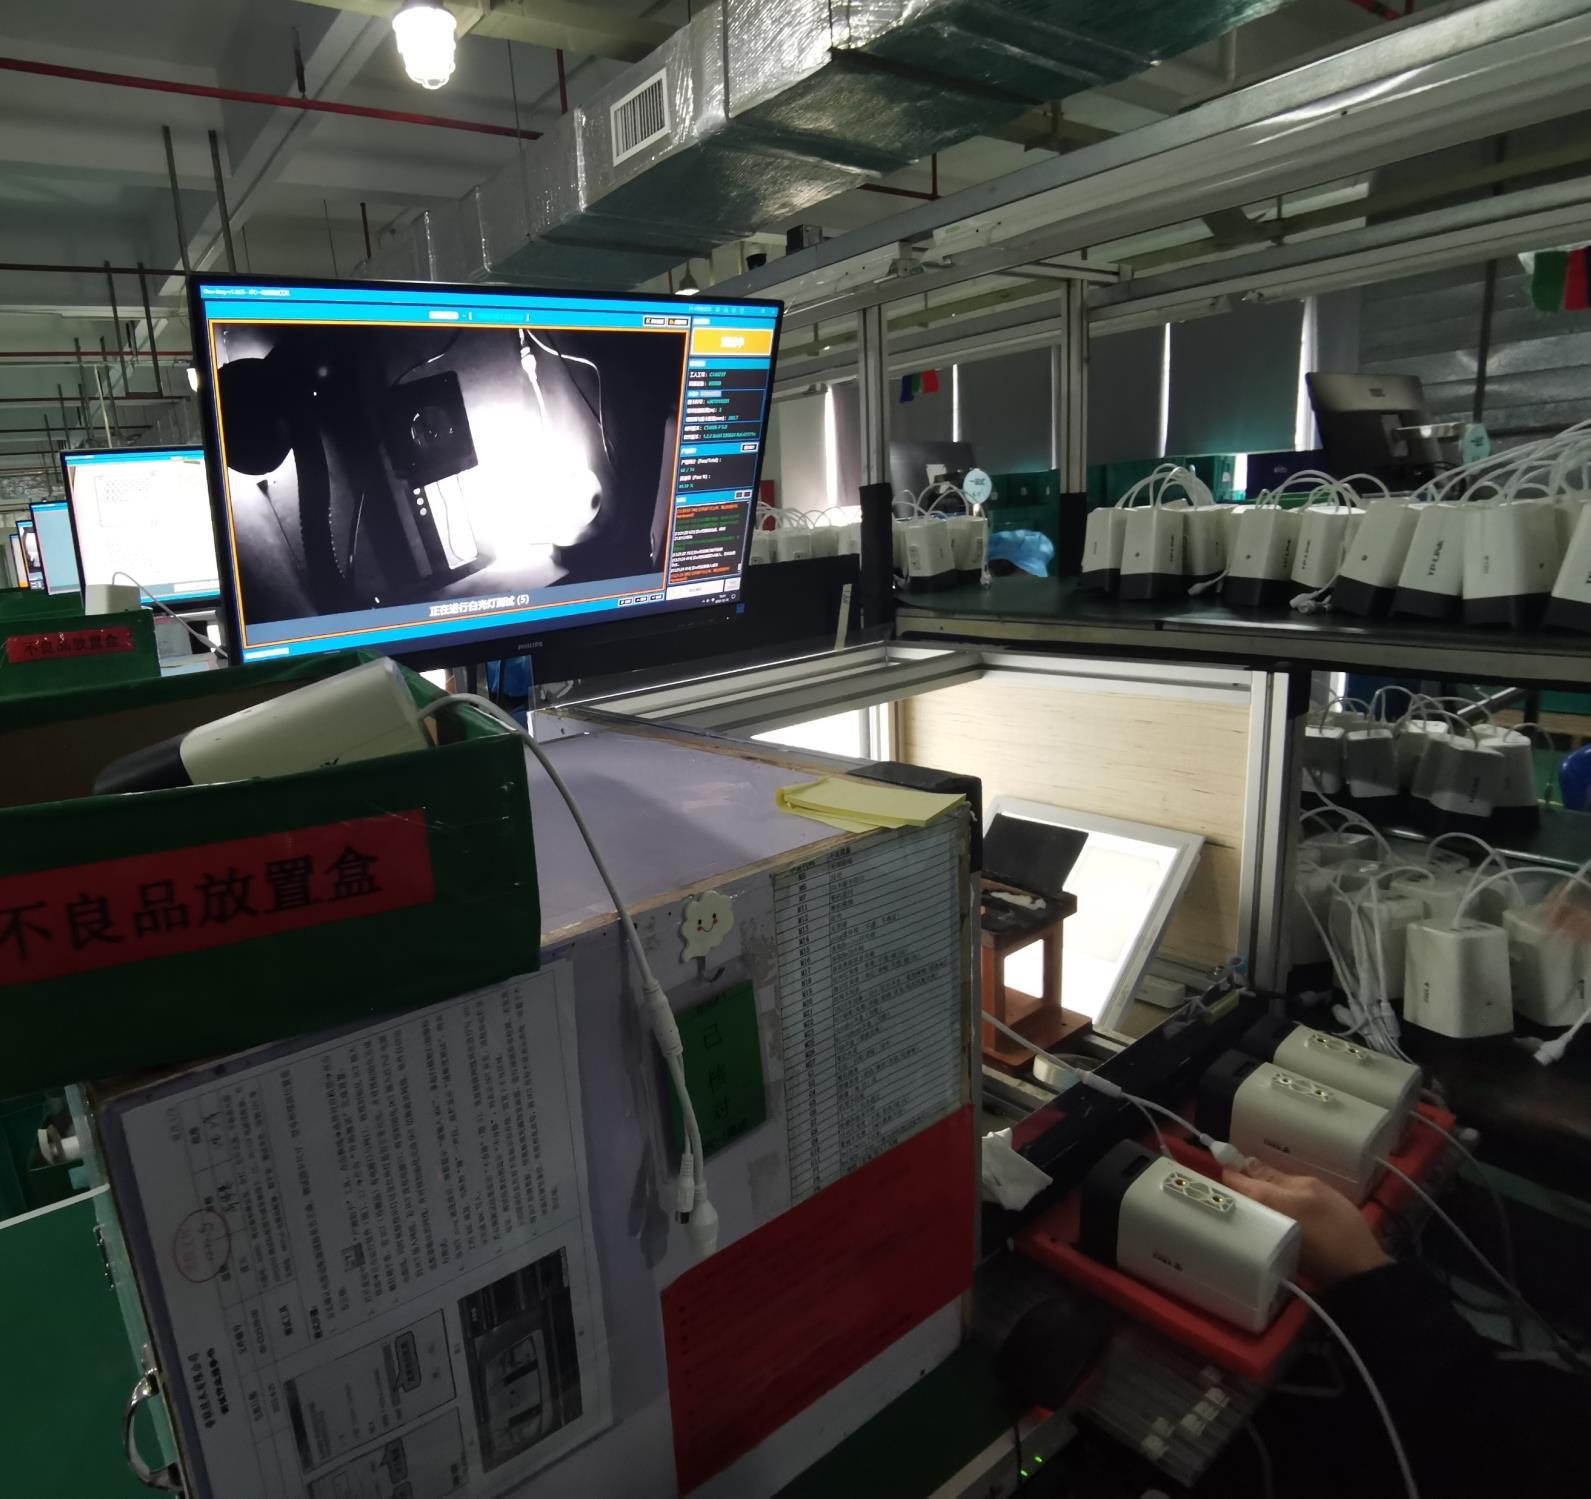
A test station in the factory


The system has been in operation for over 2 years. The system tests over 10,000 products everyday, and not a single customer return due to LEDs quality issue has happened again during the 2 years.
The average test accuracy was improved from 87% to 96%. Line workers’ positive feedbacks towards the system were 100%. They love it!

[TYPE]
Business Project / Group Project [ROLE]
Team leader / 100% User Research / 100% Design / 50% Front-end Development
[TOOLS]
Axure RP / TypeScript / React / Java / Django
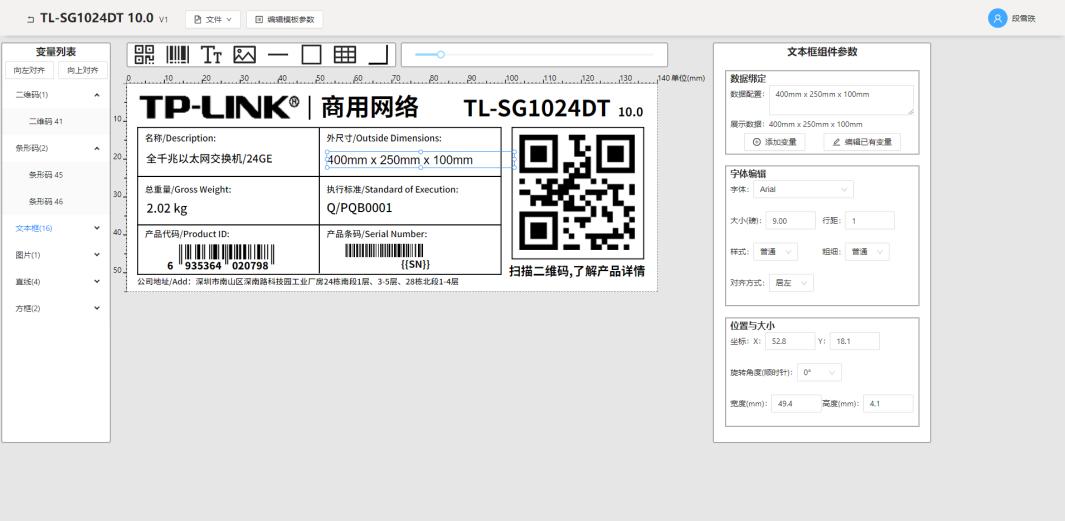
The production of labels in factories was inefficient and chaotic. To solve the problem, I led a team to design and develop a manufacturing execution system for label production, which includes a subsystem to generate label data, a sub-system to manage label template, a online editing website to edit label template, and a desktop application to print labels. The resource management costs and the average production error rate were reduced by 50% and 37%, respectively. Positive feedback up to 88%.
[TIME]
Apr. 2022 ~ Dec. 2022
• Products need to be labeled before leaving the factory. As a engineer at TPLINK, I was appointed to be the

Project Manager to design and develop a system for factories to produce labels.
• In the past, the factory used Microsoft Excel to manage label data and used pirated software to make label templates. Templates and data were managed offline in Windows File Manager.
• Company executives found such a label production situation worrisome and asked me to investigate in the field, define problems, and make improvements.
• No one in the company has a comprehensive understanding of label production situation. It required me to communicate with different people to collect information.
• The company executives were only vaguely aware that there were problems with the production process, but didn't know exactly where the problem was. I needed to find, organize, and define the problem myself.
• Label production involves 5 departments including Product, Design, R&D, Engineering, and Manufacturing. Every department has its own needs, which may conflict with each other.
• People involved came from different backgrounds and required different communicating techniques.
LabelPrint, an online manufacturing system, including several sub-systems.
• LabelData: A system generating label data, used by product engineers.

• LabelEdit: An online editing website for industrial engineers to edit label templates.
• LabelPrint: The main system including a label template managing system and a template printing app.
In the first 3 month, I communicated with stakeholders from different apartment, observed line workers’ work, did quantitative study, and defined problems.
In the next 6 weeks, I delivered 6 designs and conducted tests iteratively.
In the final 4 month, I led the team developing the system in 6 sprints.
• We used different research methods based on the audience and the situation.
• Observation: Because the production situations were complex and line workers couldn’t explain them clearly. We stayed in factories for one week to observe how they work and how they deal with production errors.
• Interview: For skilled workers and industrial engineers, we conducted interviews to dig deeper into their needs.
• Survey: Product engineers and designers were not our core users, so we conducted surveys to collect the overall data and their preferences.


Line
For every sub-system, we used the architecture above.


The system has been in operation for over 3 months.
Till now…
The resource management costs were reduced by 50%.
The average production error rate were reduced by 37%.
Positive feedbacks were up to 88%, from users across the company.