
Portfolio 2018-2022 Selected works Xueyu WangXueyu.wang116@outlook.com

Designer is like a kaleidoscope.
Design is the interplay of different dimension.
I liken the designer to a kaleidoscope, just look into the tube and it will present a different pattern, turn it slightly and another pattern of flowers will appear. I think the same is true of the designer, who is not only able to com bine different dimensions to create beautiful designs, but also to present them differently through production. I think of design as the interplay of different dimensions, so the first project in the portfolio, retrofitting revolution, involves an analysis of urban and global aspects as well as a synthesis of landscape architectural planning. The second project, Consequen tial planetary landscape, is an analysis of the global perspective of the city-state. The third project, Coastal formation, provides strategies for intertidal conservation from a landscape perspective. The fourth project, space rebirth, is a holistic enhancement of the area from the perspective of landscape architecture. The fifth project, Degrowth, is a reuse of the buildings and the surrounding landscape. The five pro jects are linked to each other and present their respective themes from different perspectives.
Low-tech retrofitting using living materials and improve people’s life.
Analysis of the global water condition as well as the causes of the water crisis in Spain.
Providing strategies for intertidal conservation, and the creation of ecological landscapes.
Oil depot renovation to promote local economic development and enhance regional vitality.
Adaptive reuse of the waste transfer station and re-engineering of the waste disposal process.
Today, the United Kingdom faces a climate emergency. Many houses and workplaces are at high or medium risk of fuel poverty, and the lack of insulation, to keep warm houses or avoid overheating are at low rates of implementation.Our priority in 2050, with 80% of struc tures already constructed, will be to decarbonize the existing build ings stock.The built environment is critical for adapting to changing and increasingly harsh climatic conditions.It’s time for a change.
In the project, living has two meanings, one is the use of living mate rials for low-tech renovation. The other is the use of living materials for reuse to improve people’s lives.

Our project is based on the environmental principles of ecology and the use of living materials, through an analysis of the current use and potential of straw as a building retrofit material to improve existing buildings, infrastructure and communities. We have made our initial policy proposals and the straw retrofit strategy, based on existing pol icies and construction flow. Using the back-to-back house in Leeds as a prototype, we look for opportunities to use the straw to retrofit and also to measure the amount of CO2 change in it. And finally, we look at its application at the community scale. We hope our strategy can combine householders, professionals, and anchor institutions to work together to achieve a low carbon retrofit process and benefit the local communities.
FIG.02/ Global and United Kingdom Co2 emissions and energy consume situation
The cumulative territorial and consumption-based CO2 emissions by rank (1970-2015) given by Jason Hickel are shown on the graph , which indicates that higher-income countries have produced more signif icant historical emissions. The United States and Eu rope bear a disproportionate share of the blame for the amount to which countries respond to climate change.
Most countries are experiencing a carbon diox ide emissions crisis, with the United States, China, Europe, and India emitting the most. From the data given by Climate watch, it appears that buildings and construction also play a role in this.
The graph depicts how much energy is consumed in each country and how each country's energy crisis could be alleviated following retrofitting policies.
Finally, the United Kingdom actually produces a lot of carbon dioxide. It bears a lot of responsibility for climate change. The greenhouse gas emissions by sector data from the Department for Business, Energy & Industrial Strategy shows that buildings account for a quarter of the UK's total CO2 emissions. As a result, the United Kingdom now has an urgent need to execute retrofits to minimise carbon dioxide emissions and save more energy.


In the face of climate change, the UK has developed a zero-carbon strat egy called Build back greener. It covers many aspects, including power, fuel, industry, heat, buildings, transport and so on.The Italian government issued urgent legislation to revive the economy after the covide-19 period, including the “110% Super-bouns”. It is a bonus scheme to incentivise retrofit. It is a tax advantage If you are an Italian property owner, you can get the bouns by retrofitting the A2 civil habitation class to meet energy
requirements and other standards. As of 1 March, more than 122,000 applications had been ap proved. This scheme boosts the construction GDP, offers more than 15000 new jobs, reduces CO2 emissions and raises public awareness of retrofitting.And in response to the Olympics, France man dates the use of at least 50% wood or bio-based materials in all new public buildings. In the middle of the diagram, the anchor institution is analysed in relation to the subsequent site selection. In the sequence diagram on the far right, policy proposals are made at the level of Uk, city council, organi sation, community and individual in the context of the project study.

Based on data from John Butler’s sustainable build consultancy, we have created this anatomical map to describe the existing usage of straw in various sectors of the economy: cultivation, processing, manufacturing and application. Cultivation section shows how we can obtain wheat straw. It starts with sowing wheat berry, then goes through the germination stage, after growing and tiller and producing wheat heads, it is ready to be harvested.

We harvest wheat grains, and the rest of the agricultural by-products are straw. After drying the straw, this stage is over.Then 41% of the wheat straw is used locally, 51% is sold and 2% is used for other purposes. In the lo cal use section, 6% of the wheat straw is used as fertiliser, 20% is used for feeding animals and 15% for animal Bedding.Of the 51% sold, 39% of the wheat straw is exchanged for feed and bedding for animals, while 7% is used for biofuel and 12% for other uses. Of this, 7% goes to factories to produce plastic wheat straw products, which are eventually delivered to shops for purchase. Only 5% of the wheat straw is used for construction, going into material processing plants where it is turned into strawboard for new construction or renovation of houses.

FIG.05/ Kg Co2 cradle to gate emissions per kg of material, including sequestration of biobased materials

https://www.sustainablebuildconsultancy.com/ blog/embodiedcarbon
FIG.06/ Stored carbon https://www.sustainablebuildconsultancy.com/ projects


07/ Four sectors of straw Google images


It can be seen that most countries produce wheat straw to a greater or lesser extent and it can also be imported from other countries such as Romania and Canada , which indicates to a certain extent that there is a large market and implement ability of the choice of wheat straw for the retrofitting of houses.


FIG.09/ UK wheat straw production and straw bale buildings distribution
It is very significant that there are large areas of straw cultivation, mainly in the east of the coun try.At the same time, according to the European straw building association (ESBA) data on the distribution of straw bale buildings, there are already many houses built with straw as a material in the UK, with a high concentration in England.

FIG.10/ UK straw bale buildings


These straw bale buildings show great potential for the implementation of straw-based retrofitting in the UK.

Focus on Leeds
Emission
Poverty
Through our previous research, we found that Leeds is one of the cities in the UK with high CO2 emis sions. It is also surrounded by many farms and the city council has a retrofit policy. There is also a case where straw has been used to build community. So we chose Leeds as the location for our study.
FIG.15/ whole lifecycle carbon emissions
Leeds Local Plan Update
FIG.12/ Total amount of Co2 emissions FIG.16/ leeds retrofit policies
FIG.13/ Co2 emissions from home heating
According to Place-based Carbon Calculator for England data, the overall CO2 emissions are mainly come from the south western parts of Leeds, in Ardsley & Robin Hood Ward. (FIG.12) Similarly, the CO2 emission from heating gas are also concentrated in the south-west of Leeds. (FIG.13) Refer ring to EPC standard based on the condition of energy use and CO2 emission in housing, Leeds scores D (rating 63.07), and in 2018 around one in ten households in Leeds were living in fuel poverty (10%), the same as the average for England (10%).


FIG.14/ Average housing EPC score
To achieve Leeds zero carbon by 2030, Leeds local plan Update sets out the approach in five aspects to operational carbon that will be necessary to deliver zero carbon buildings. (FIG.27)Now, Leeds gov ernment has secured £37million funding to improve the energy ef ficiency of 4,500 properties including residential buildings in Leeds. The investment will support the council’s commitment to reduce the city’s direct emissions to net-zero by 2030 and will also support lo cal ‘green’ jobs in industries carrying out the improvements. (FIG.28)


FIG.17/ Traditional materials transport to Leeds from other part of the UK (Right)

FIG.18/ Conventional retrofit model (Left)
Conventional retrofit in Leeds
The conventional retrofit process begins with finding a building surveyor to assess whether the home needs retrofitting, if so, there is 20% VAT needs to pay in advance, and then the LABC will evaluate the design scheme from retrofit design company.
Once the plan is finalized, the conventional construction materials like cement, rock, and sand produced in other parts of Britain are sent to the construction site and used to retrofit. After finished, Housing Association will offer the housing to people most suited to that particular property.For traditional retrofitting process, the long transport distances due to the remoteness of the materials and the processing company result in large amounts of CO2 being generated during trans port and lead to longer and more costly retrofitting times.
FIG.19/ Straw retrofit model
We create a straw retrofit system combining householders, pro fessionals, and anchor institutions to work together to achieve a low carbon retrofit process.
FIG.20/ Straw retrofit process
FIG.21/ The beginning of straw retrofit process

Firstly, the house could be proved it needs to be retrofitted by Leeds Sustainability Institution, then the house owners could get the subsidy from the council by applying for the grant.The retrofit company could help design the plan. And the house owners can apply for the mortgage from the Leeds Building Society.Then send the scheme to the living materials companies, and they can help to look for the local suppliers whose straw has already met the standard of construction materials.The closest “flying facto ry” could be selected for residents and professionals to assemble prefabricated panels. The straw is transported to the selected factory and processed to the panels. Then the retrofit materials will be sent to the site.Together with the contractors, the dwell ers can retrofit their own houses under professional guidance.
FIG.24/ Find the nearest “flying factory”


FIG.22/ Get the support of retrofit from anchor institution FIG.25/ Get support from anchor institution while retrofitting
FIG.23/ Select the suitable farms as suppliers

FIG.26/ The house will be rented through housing association

Finally, by retrofitting with living materials mode, it not only can offer more affordable houses for locals, brings more opportunities for the construction industry, but also promotes the local market of planting, manufacturing, and animal husbandry, forming an interlinked industrial network, creating more employment opportunities, and promoting the local economic development.
The whole system shows the concept of sourcing locally, engaging largely, and affect ing greatly. It can be applied in a city near the place where biomaterials are produced. According to their own unique characteristics, the supply chain can be different, by using this model in different regions, it can create an innovative, various and sustain bale way of retrofit industry in the UK.

FIG.28/ Back-toBack house structure


FIG.29/ Back-to -Back house history
Back- to-Back houses share party walls on three of the four sides, with only doors and windows on the front walls. Where the toilet and water supply are shared with multiple households in enclosed courtyards.
FIG.30/ Building prob lems analysis
Because of the problem of insufficient housing, Leeds started to build back-to-backs in the 1820s. However, the quality of its housing was poor and it was extensively demolished in the 1970s. Even so, Leeds has retained a large number of back-to-back houses, particularly in the Harehills area. Even though the living conditions in this area were not satisfactory, many residents opposed the demolition of back-to-back houses because they considered them to be of significant heritage value.
Based on a preliminary understanding of the history and structure of the Back-to-Back house. This is followed by an analysis of the exist ing problems with their various components.
The lack of roof maintenance resulted in many damaged tiles, which may cause roof leaks. And clogged chimneys, poor ventilation, and a lack of light in the attic could be potential problems for the residents. And there are some cracks, bends, and paint starting to peel can be seen on the ceiling.Poorly constructed staircase and some worn-out furniture that needs to be replaced. In terms of energy usage, old bulbs and plugs may consume a lot more energy, resulting in high electricity bills.The interior walls of the property have problems of wetness, mold, and peeling wallpaper. And the insulation is inadequate as well as the exterior walls, which are poorly insulated in thermal and acoustic. The frames of the windows are distorted and rot. Additionally, heavy erosion can also be seen on the garden wall.
At last, the floor may suffer from gaps, cracks, unevenness, and swollen edges due to high moisture.
When retrofitting, we mainly try to use living materials to retrofit and improve the living environment of the house for the users to meet the standard of Passivhaus.

Firstly, replace the damaged roof tiles with recycled tiles or eco-friendly Vege roofing tiles, which is an Innovative Bio-Composite using vegetable oil in the production instead of cement and clay.Secondly, the poor insulation among traditional roofs is also a reason for high energy bills, the straw board insulation with timber frame produced by Ekopanely company can improve the existing roof and ceilings’ insulation of the house. For the ther mal insulation aspect of the walls,If it is a load-bearing wall, it cannot be easily demolished, but we can add Ekopanely strawboard insulation to its interior side to help reduce heat loss.Add the insulation and draught-proofing under the wooden floor. In order to separate different functional zones, building the straw partition wall can make the most of the space simultaneously.


FIG.32/ Community analysis and design strategy
FIG.33/ Community current traffic analysis (left)
FIG.34/ Community current problems anal ysis (Right)
To begin with, the on-site fly factory can produce prefabricated straw materials for retrofit buildings and temporarily store the ma terials. Materials can be carried from here to the adjoining building for repairs.Secondly, as part of the retrofit process, the road next to the building was transformed into a shared street, with planned parking spaces and green space.At the workshop, people can experi ence the process of building materials from straw and have the op portunity to use the tools to transform the interior of their homes.
FIG.35/ The section of conventional materi als’ retrofit process
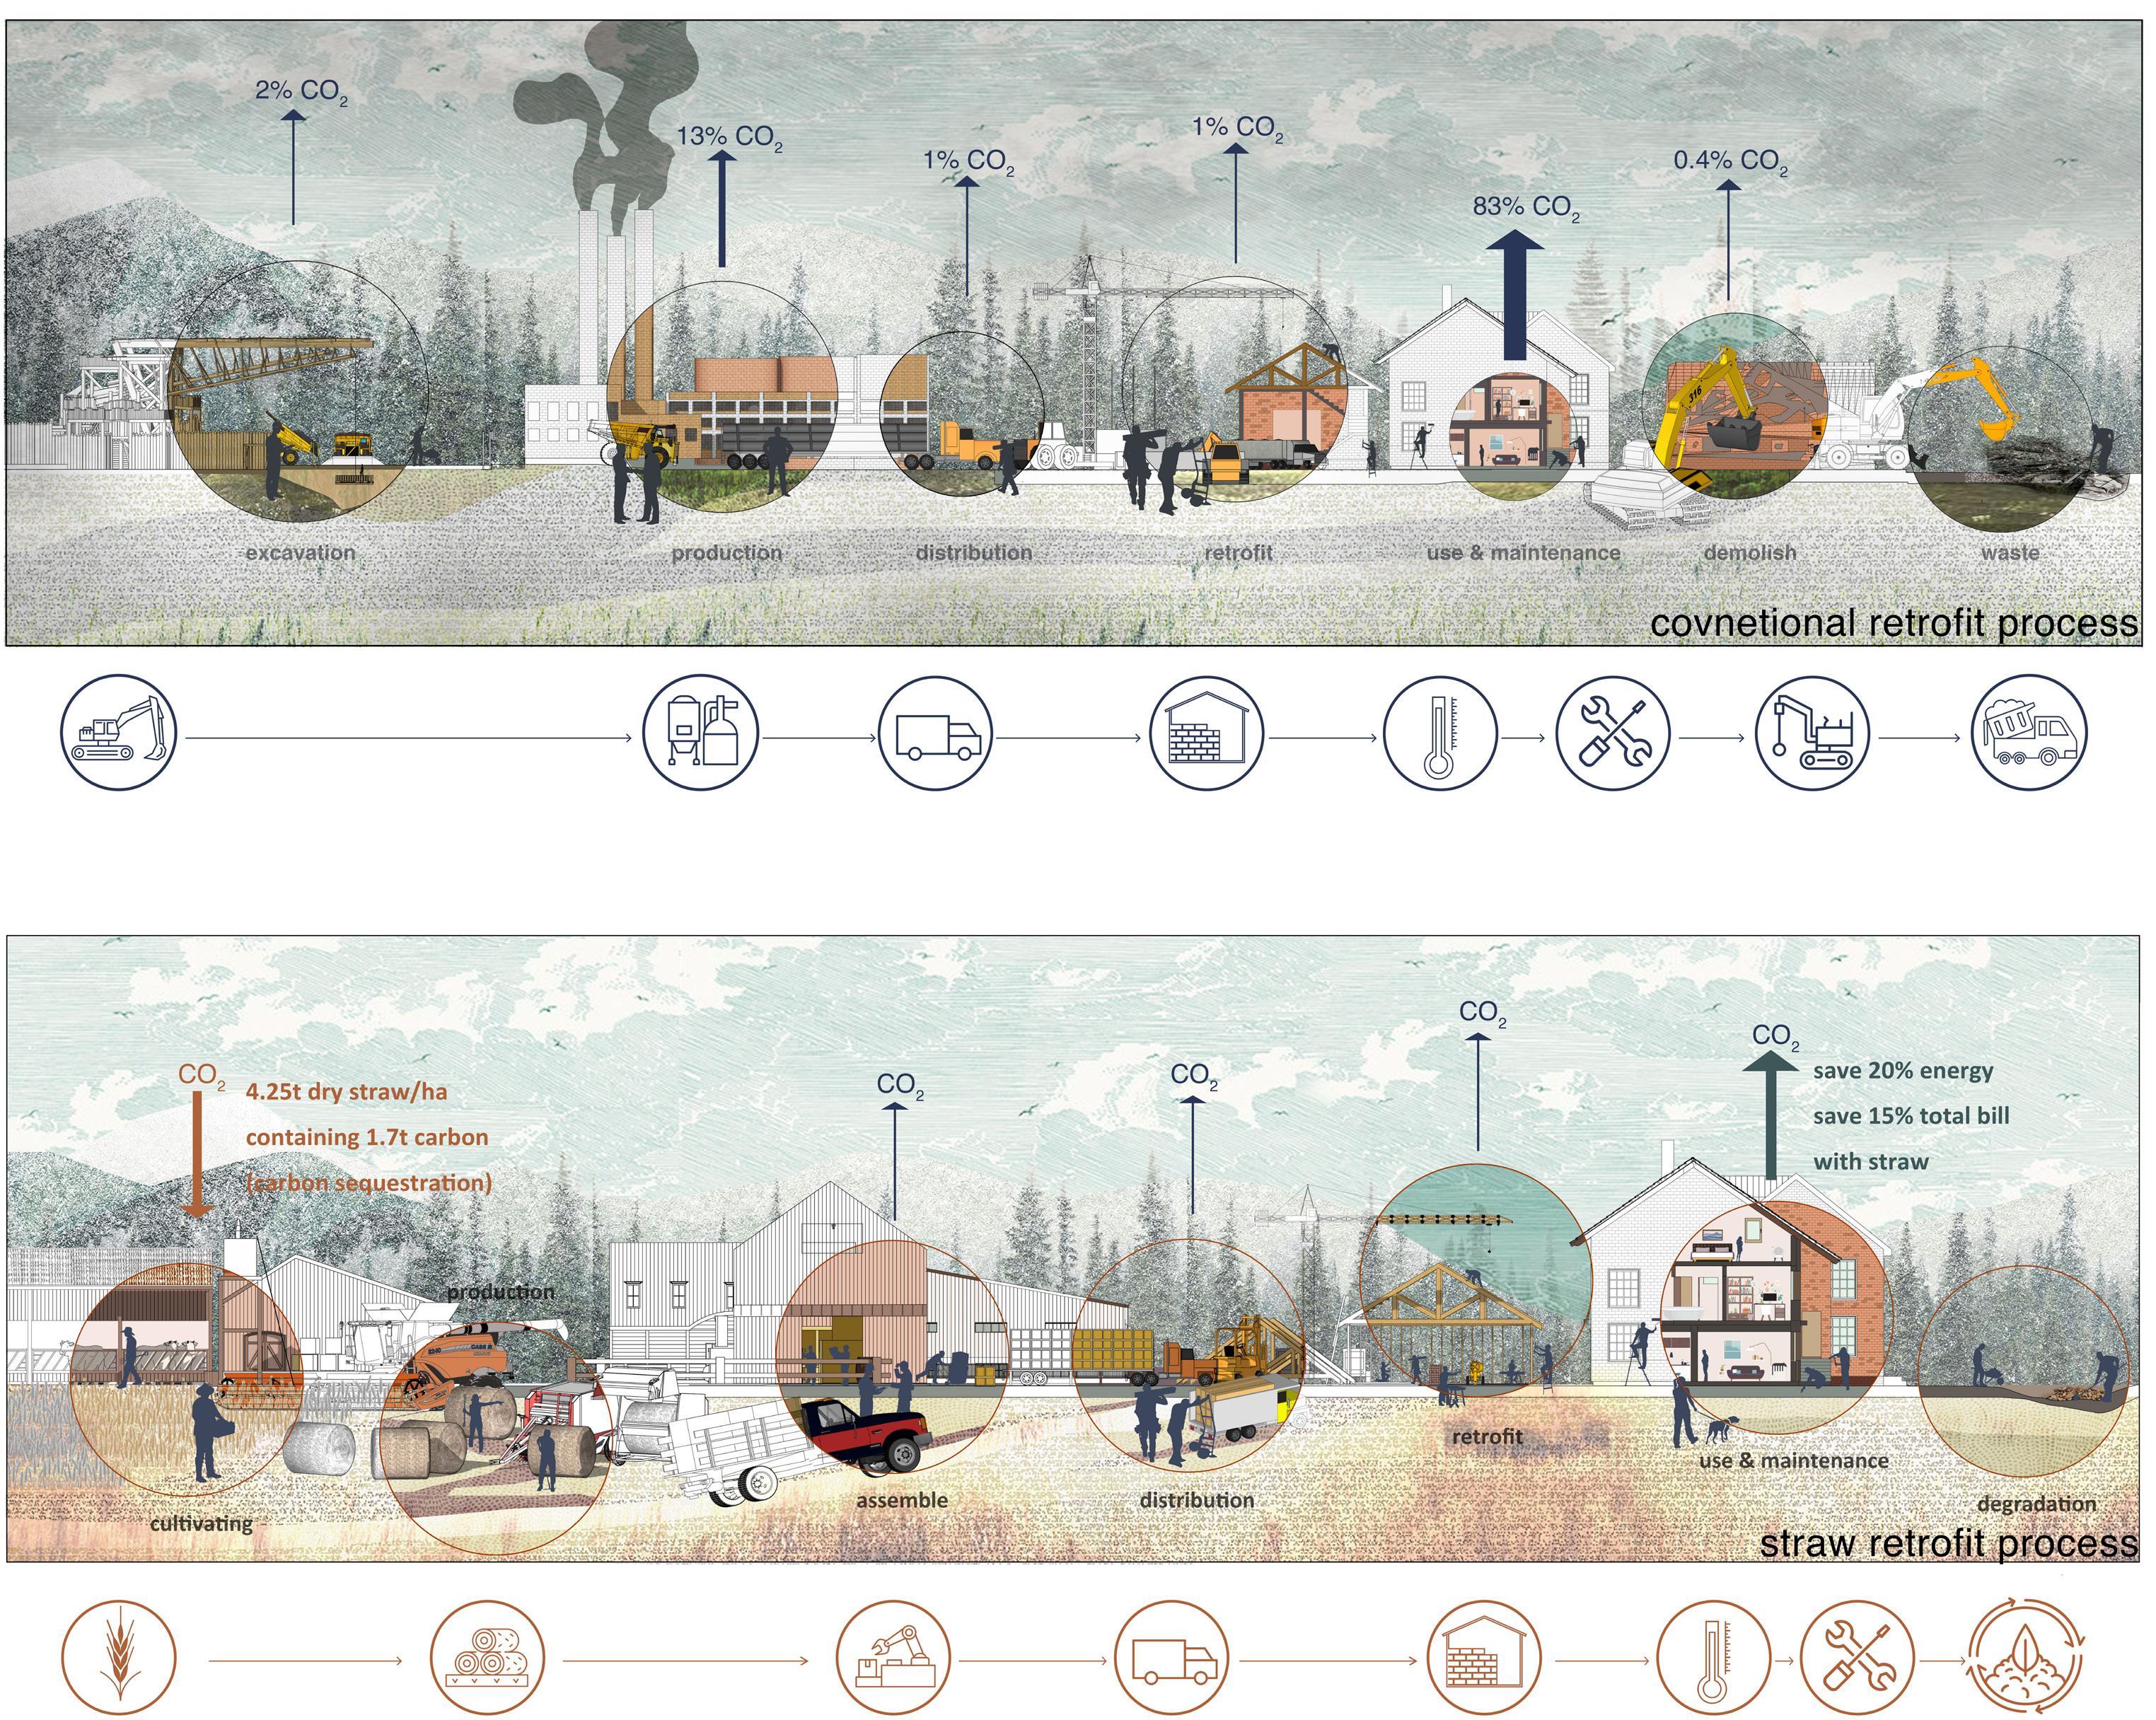
FIG.36/ The section of straw retrofit process
Compared with the conventional retrofit process, straw stores the carbon during the cultivating part, however, the cement production will emit more than 15% CO2. Be cause of sourced locally, the CO2 emission in distribution will be largely decreased. In addition to transportation, us ing the prefabricated panel with offsite techniques acts as a viable step towards cutting down CO2 emissions. Straw has better insulation properties than conventional materi als, which could help reduce 20% CO2 emission and save 15% energy bills when living in a straw-retrofitted house.
In the end life of the straw materials, it can be degraded instead of demolition and become a kind of waste.
All in all, retrofitting with straw can reduce CO2 emis sions by 50% and provide affordable housing for all, pro mote the development of new, organic, and biodegradable materials, and reduce construction waste at the same time.
The ability to combine the supply system of building ma terials with the actual site will help to stimulate the vitality of the area, not only by providing a more comfortable living environment for the inhabitants, but also by increas ing employment opportunities, promoting the economic development of the area and improving regional policies. The programme can also be implemented in other areas and will gradually have an impact on more areas in the fu ture, significantly reducing CO2 emissions and alleviating the energy crisis.

This research aims to analyse the history of water scarcity in Spain, engineering, and its future development. Spain is arguably the European country with the most severe water crisis in recent years. However, wa ter’s political and ecological importance is not only a recent development in Spain. Throughout history, water politics, economics, culture and engineer ing have infused and embodied countless tensions and conflicts that have driven and still drive leapfrog societies.(E Swyngedouw 2015)
Based on this, the project will look at the global water situation and then analyse water stress in Europe, leading to the water situation in Spain, where the project is located, and its causes. This will be fol lowed by a discussion of the measures that have been taken to combat water scarcity in Spain from ancient times to the present day and the impact of these measures. The main ones are the construction of dams, inter-basin water transfers, and desalination plants. At a regional scale, the third part takes the Spanish city of Almeria to illustrate and demonstrate the changes brought about by the construction of water projects in Spain. Finally, the impact of the water project is analysed on a global scale, and the outlook is given.

The first period from 1939 to 1955 was characterised by a sustained construction of state-led grand hydraulic works, but the dam system is still imperfect, and the achievement is limited. After 1953, announcing the second period proved to be a “watershed” moment in realising Franco’s hydro-vision for Spain. Between 1955 and the end of Franco’s dictator ship, most of Spain’s terrestrial hydro-in frastructure was implemented.


FIG.06/ Impact on
and
As time went by under the vigorous implementation of water projects, ag ricultural production and population migration both showed an upward trend. Labour inputs and agricultur al transformation have accelerated urbanisation in the south and east.
FIG.07/ 1975-2000
Distribution of water resources in Spain

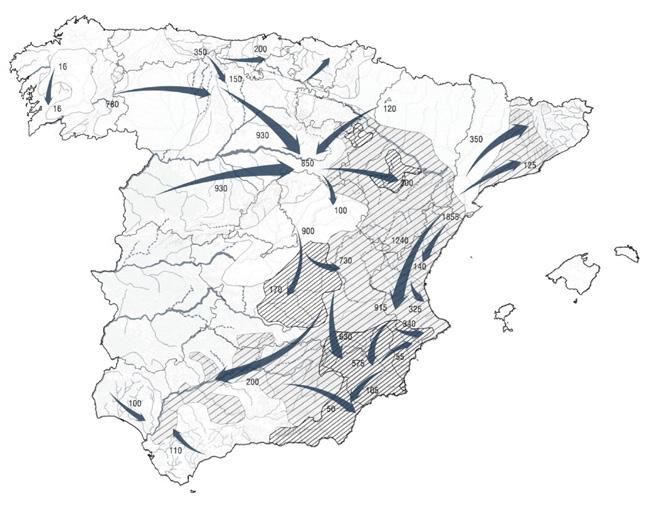

FIG.08/ 1975-2000
Implementation of the Spanish water transfer policy


FIG.09/ The impact of Spain’s water transfer policy on Almeria
FIG.10/ Groundwater crisis
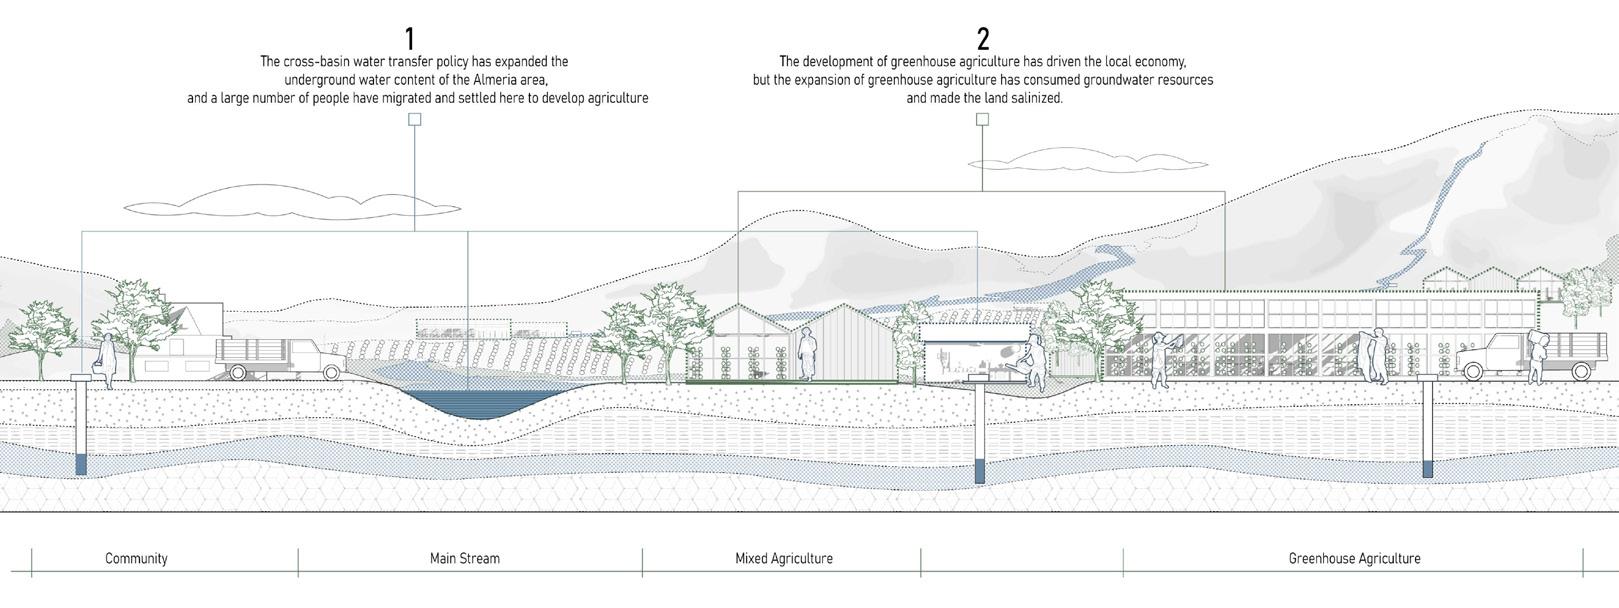
FIG.11/ Groundwater crisis
With the depletion of groundwater and the shortage of water resources, Spain is gradually introducing desalination technology
The inter-basin transfer of water and the construction of dams and other major water projects to expand the irrigated area in the south of Spain have led to increasing migration of labour to Almeria. But as the climate changes and the demand for water for agriculture increases, groundwater resources are depleted, and plastic waste from abandoned greenhouses spreads along the rivers.
In 2004, Spain introduced a desalination policy and built a plant in Almeria. Desalination has gone some way to meet the local water demand and alleviate groundwater shortages. The desalination tech nology provides the local population with an adequate supply of freshwater used for drinking purposes and is also piped to the greenhouses.
FIG.12/ Distribution of desalination plants in Spain
Distribution of desalination plants in Spain

Eleven desalination plants along the eastern coastline produce large quantities of freshwater day and night. The surrounding tourist attractions are the first sites to be transferred to nearby cities. In fact, except for Almeria, the coastal towns benefit more from tourism than agriculture due to the relatively high price of water.
Low temperature multi-effect
Electrodialysis
Reverse osmosis technology


Based on the analysis of the distribution and technology of desalination plants, we have chosen the campo dalias desalination plant in Almeria as a case study.
Desalination technology is thus a double-edged sword which, on the one hand, has helped to alleviate Spain’s water shortage and, on the other, has caused problems.
Excessive costs
The final price per cubic metre of desalinated water depends to a large extent on a combination of source (brackish or seawater), energy, transport, labour costs, etc., which makes the price of desalinated water in Spain fluctuate between 0.6 and 1 euro per tonne.

For farmers who need a lot of water, the cost is too high unless there are large subsidies. Many farmers prefer to drill wells illegally and draw on the already scarce groundwater reserves for irrigation.
Impact of waste from large scale desalination
Key to this is the need to release the highly saline residual water back into the environment on the one hand and the increased production of carbon dioxide due to the high energy requirements of desalination on the other. The brine is usually mixed with seawater and then pumped back into the sea. Marine ecologists are concerned about the physicochemical composition of the residual water in the marine ecosystem.

FIG.18/ Location of desalination plants
FIG.19/ Water tansfer megaproject


To solve the global water shortage crisis, more and more countries are adopting desalination plants as a solution. For the time being, the Spanish government may need to come up with new solutions, such as prioritising agricultural water use, choosing more affordable crops and more sustainable irrigation methods, or re-evaluating previous schemes to come up with more optimal water-saving solutions.In the future, Spain will have to find more effective solutions to the water crisis while facing the pros and cons of desalination policies.
FIG.20/ Spanish desalination company expands
Water shortages and water imbalances remain a concern in Spain. The increasing frequency and duration of droughts and water shortages are indicative of a failure of environmental sustainability. At present, the overexploitation and degradation of water resources is already at a high level and the problem is already serious. However, a secure water supply for economic activities should also be guaranteed.
Water has always been a focus of attention in Spain. The social and natural production of Spanish society can be illustrat ed by tapping into the central role of water politics and engineering in the modernisation process of Spain. This workshop sorted out the causes of droughts in Spain since ancient times and the policies followed by Spain in response to water scarcity at different times, visualising the information at several dimensions - global, national, and local. We developed a better understanding of data collecting, documentation, and visualisation during this process. What can a designer do in this situation? Designers can use these methodologies to investigate Spanish water policy, dam construction trends, and water transfers in Spain, among other things. Designers can also serve as storytellers. We can utilise some of our designs to uniquely communicate the message we want to send to various stakeholders, attracting their attention to the problem.
Location: San Francisco Bay Area, California, USA
Duration
As you walk along the coast, you often see tourists coming into the intertidal zone. But over time, the intertidal zone area decreases gradually, and the economic and ecological benefits weaken gradually. Therefore, this project’s theme is how to utilize and protect the intertidal zone from creating a beautiful coastal environment.

The project is located in San Francisco Bay, USA. The design aims to create an ecological landscape that provides habitats for plants and animals and places for visitors to rest. It can deal with flooding and provide strategies for intertidal protection around the world.
October 2019 to January 2020
Academic/Individual
The intertidal zone, also known as the foreshore or seashore, is the area above water level at low tide and un derwater at high tide (in other words, the area within the tidal range).

This area can include several types of habitats with various species of life, such as seastars, sea urchins, and many species of coral with regional differences in biodiversity.
As can be seen from the map, the intertidal zone has a broad global distribution, especially in the USA, Brazil, China, and Madagascar.

Climate change, rising sea levels, soil erosion, and increased storms are all threats to the intertidal zone.
In the left panel of biological zoning in the intertidal zone, the distribu tion of the marginal intertidal zone and the True intertidal zone can be clearly seen. In the right panel, the formation of the intertidal zone

analysed in terms of its economic and ecological benefits as well as the reduction of the area.


Geological analysis
analysis
/the United States/ /California/ /San Francisco Bay Area/
The San Francisco Bay Area, referred to as the Bay Area, is located in the Sacra mento River's lower reaches around the San Francisco Bay, including a number of large and small cities. The site is located in the Coastal intertidal zone of Emeryville.


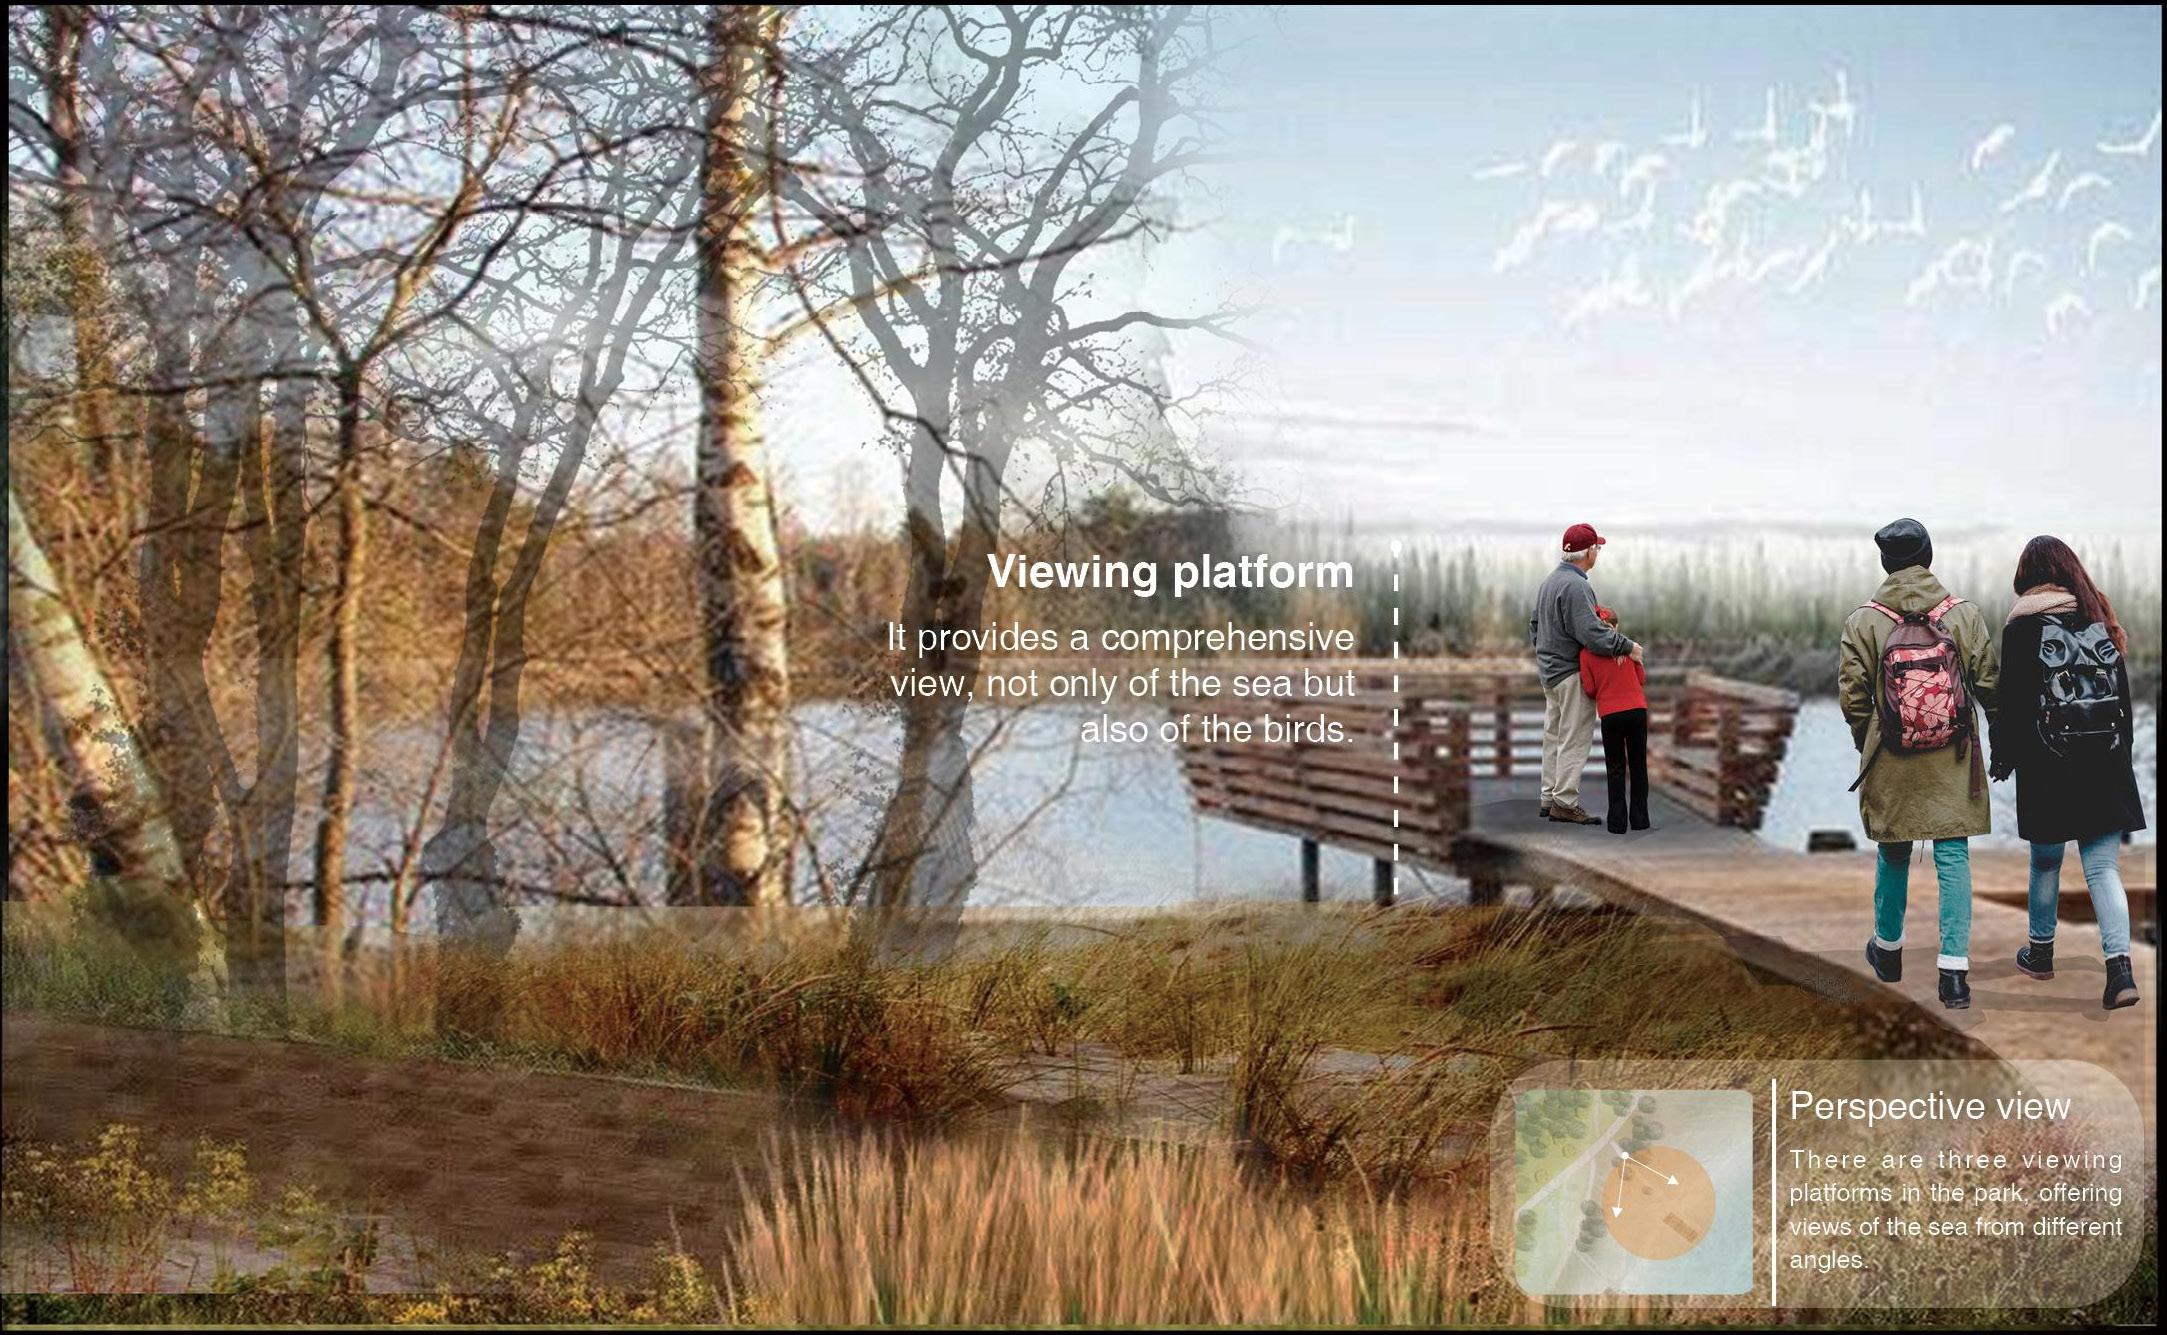
During the dry season, the platform can be used, as a place for people to relax and provide more space for excursions. The interior of the site is like a wetland. Aquatic plants can purify the rainwater, while visitors can play on the platform and pro vide creatures’ ecological habitat.
During the rainstorm, the interior of the site is able to collect rainwater promptly, infiltrate rainwater, and pro vide staying space for visitors at the same time. This provides ample space for visitors to rest even in rainy weath er, making full use of the landscape.


The design site is located in Hangzhou Gongshu district Xiaohe oil depot, which was built in the early 1950s. It is the first oil depot built in Zhe jiang province after the founding of new China.
In addition, the site is adjacent to the Grand Canal and contains historical deposits. Accord ing to the geographical location, the analysis and design of its surrounding environment, popula tion functional needs, etc., can make this place a landmark site, making it a dynamic, compre hensive park that can promote the local regional economic development, meet the activity needs of the surrounding population.
FIG.03/
According to the survey and analysis, tourists mainly visit the park around 4 PM and mostly focus on the rest days. Workers spend most of their lunch breaks around 5 PM and 12 pm, and most of their time on weekdays. The distribution time of residents is rela tively uniform. More people are using the park at around 8 am and 3 pm and 5 pm.


Xiaohe
Xiaohe
depot
lot, west
the founding of new
In the analysis diagram, the main groups of people around the site are classified, mainly tourists, workers, kids youngsters, and the elder, and the functional needs of the different groups are summarised, such as leisure and sports needs, in order to deduce the spatial form and function required for the design of the site.


FIG.09/ Waterfront

type
FIG.10/ Tank trans formation strategy


Site
The master plan takes diversity as the theme, uses the site’s basic conditions, and divides its different spaces and features. The site will be designed from four aspects.
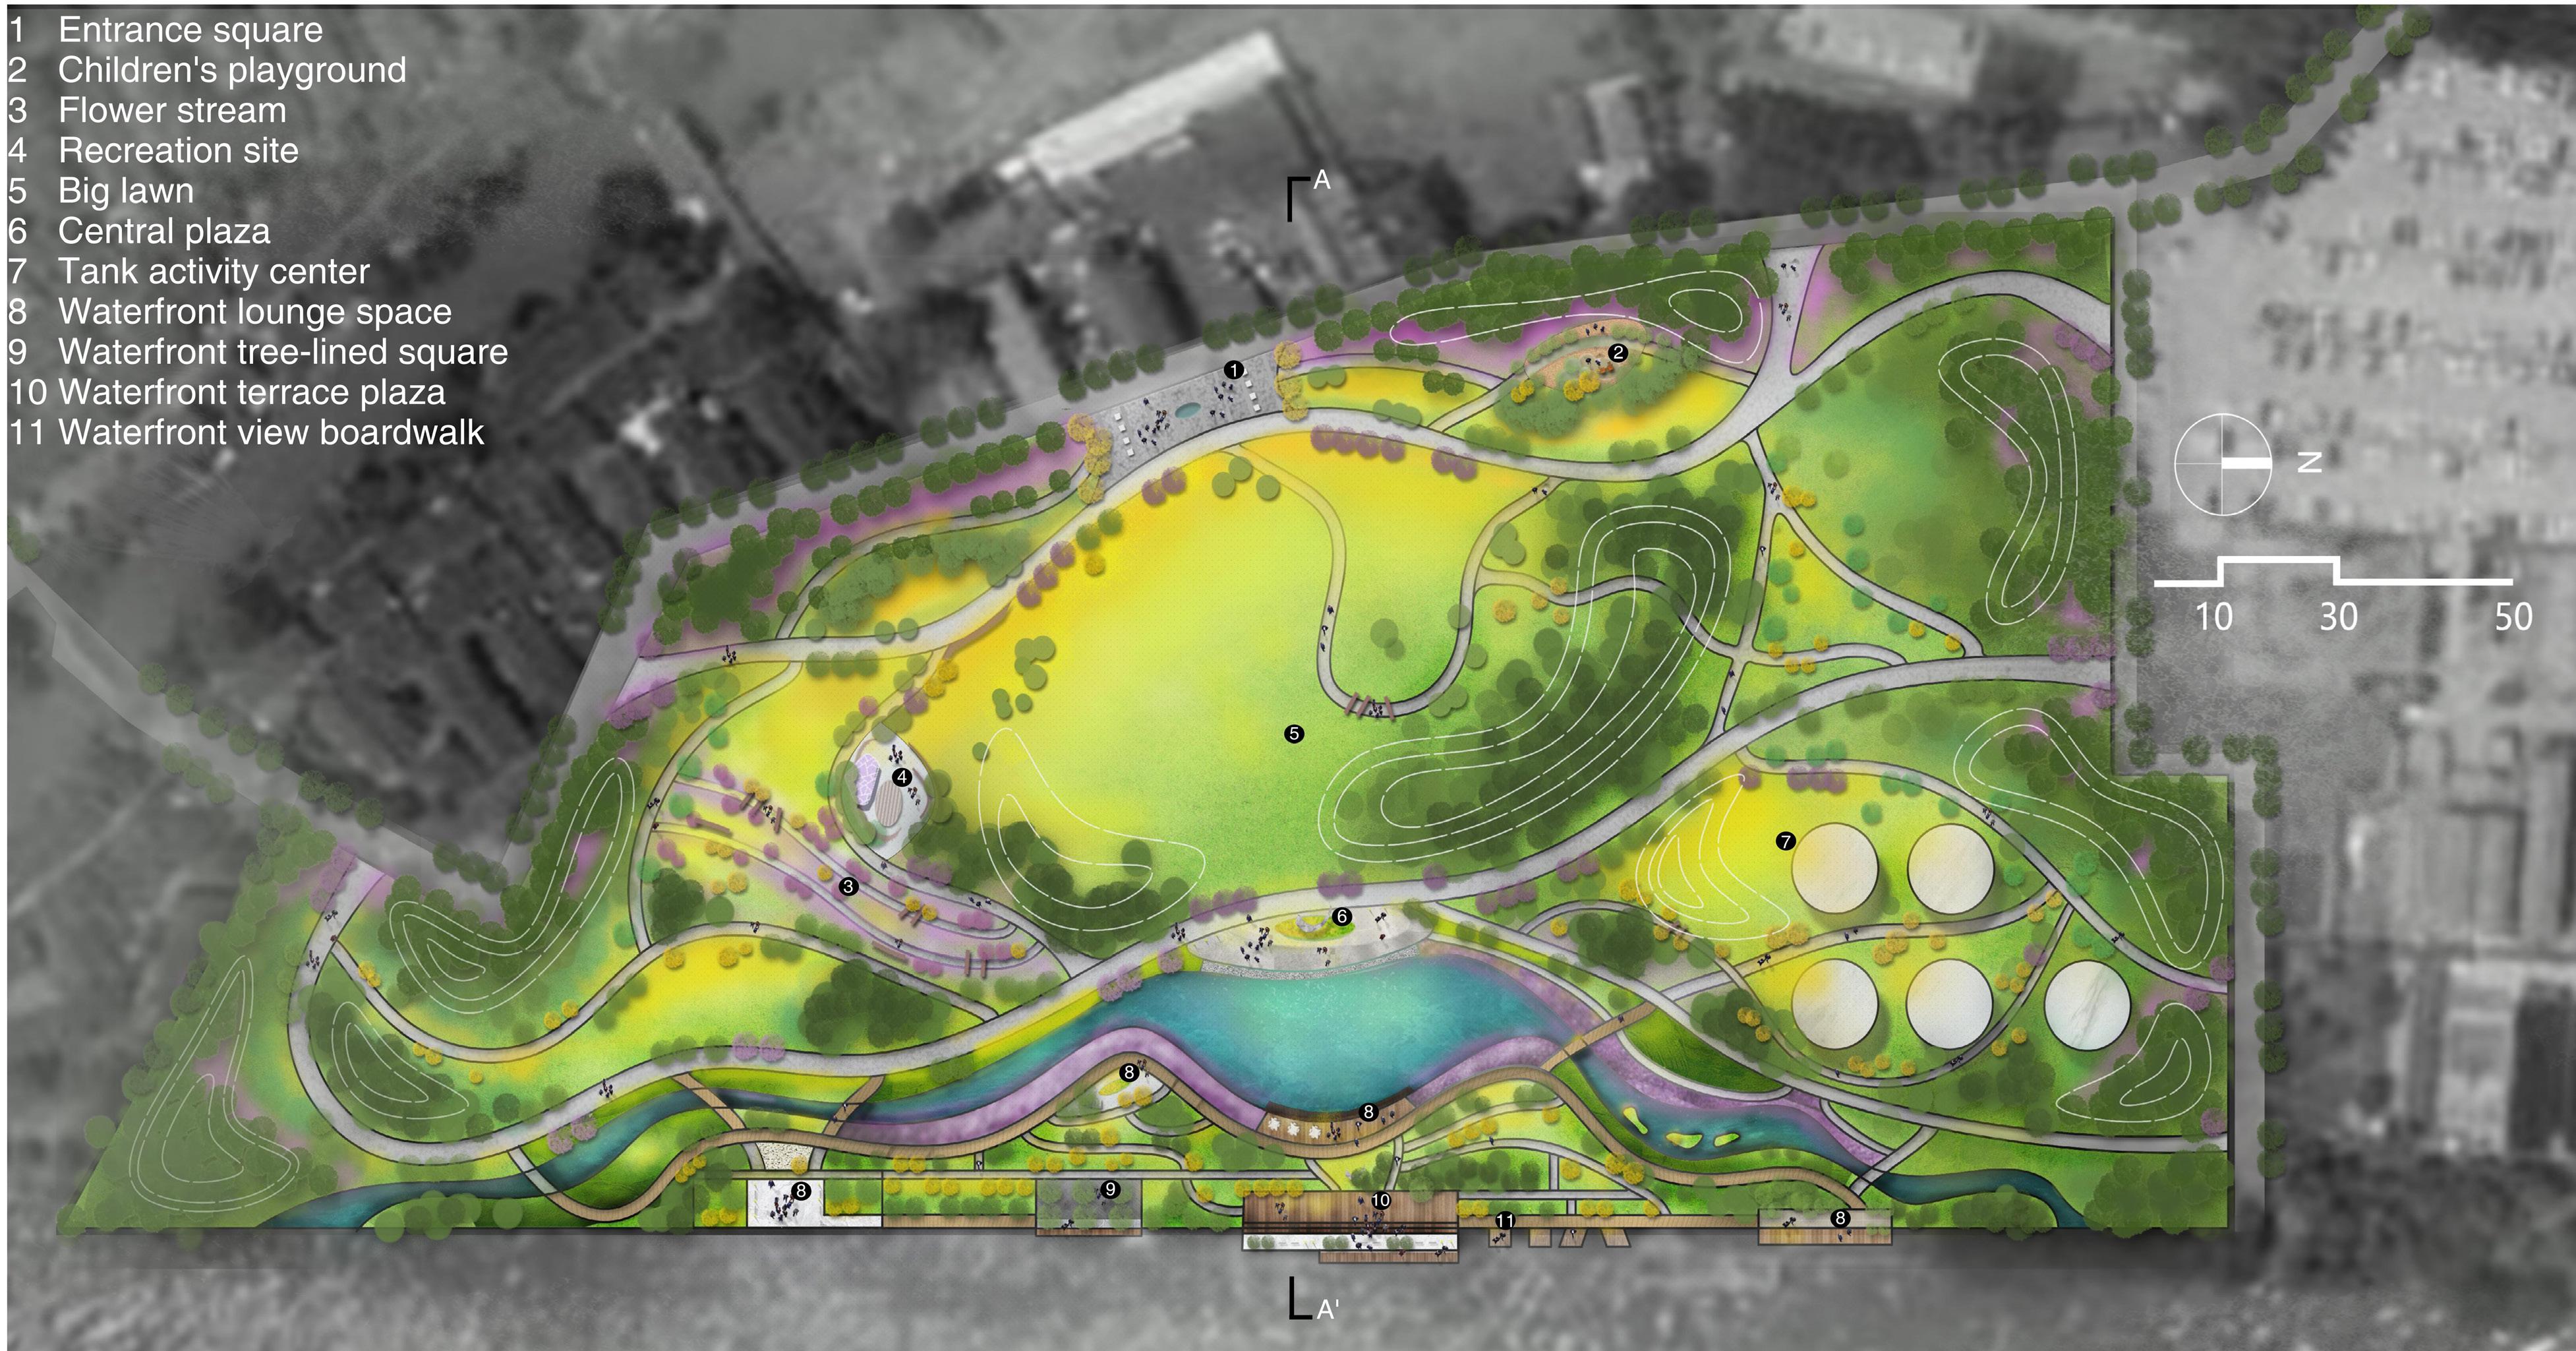
1. The use of different levels of the road to form a streamline so that each site has integrity.
2. By introducing the canal water, the tourist space inside the site is enriched to fully meet the needs of visitors for a water-loving experience.
3. Provide large events and performance venues and create large open grass spaces. A space for visitors to relax and enjoy.
4.Gathering business, through the reuse of the existing site oil tank, so that it has performance, exhibition, and other functions. Energise the site and drive the local economy.

FIG.13/
FIG.14/


FIG.15/


Cringle dock solid waste transfer station is a waste transfer station located in the London Borough of Nine Elms. In recent planning, industrial sites have been released. For example, the Battersea Power Station in the Vauxhall area of Nine Elms, London, where Cringle Dock is located, will be redeveloped into a mixed residential, commer cial, retail, and leisure complex. The transfer station, which is over 40 years old, is architecturally very much at odds with the proposed new development.
With this in mind, the project applies the New Deal concept to reno vate and update the Cringle dock solid waste transfer station. The flow of waste disposal has been planned and the rest of the site has been rationalised. The design of the site has been adapted to fit in with the Western Riverside Waste Authority (WRWA) policy and to facilitate the development of a better waste recycling network in the Wand sworth area.
Cringle Dock is one of 50 secure protected docks on the River Thames at Wandsworth, allocated to barges for cargo handling. It is one of London’s key waste infrastructures. Cringle Dock has operated as a waste transfer station since 1972 and is protected by planning policies contained in the London Plan 2011 and Wandsworth Council’s Core Strategy. These policies require that any development close to the secure dock must minimise the potential for conflict of use and disturbance.


At this stage, the station is for lorry use only and, based on further site research, the site faces serious problems with dirty road surfaces, outdated facilities, and confusing routes for people and vehicles. Despite its protected dock status, the arrival of large numbers of residents, workers, and visitors will undoubtedly cause problems in the area if redevelopment does not take place, seriously affecting the operation of Cringle Dock. In addition, the current oper ational design of the waste transfer station is based on a waste storage silo; while functioning properly, the open-air system sometimes emits an unpleasant odour.


Following the design, we have divided the site into two areas. One is the waste transfer station area, where the functional flow of the site is improved, not only for waste disposal but also for the processing of objects to maxim ise recycling. The workshop and recycling garden is a place where people can use their waste products for human processing and turn them into treasures. The recycling garden also provides a resting place and a recycling market to maximise the vitality of the area.


this site, the waste is stored and sorted through the plant
can then be transported by river to the community or
for further processing, depending on the outcome
the sorting process. For the design of the recycling garden
workshop, we decided to leave more functional choices
the users, mainly in the modular garden and workshop,

it took time for the community and people to get used to
site’s construction.
dumping inlet Workshops
Rubbish storage Recycle Garden
Repair and processing of rubbish goods Second—hand market
Cringle Dock after renovation
FIG.10/


port waste disposal process
port waste disposal process

Here, more and more processed items can be delivered to the site itself and the wider surrounding area. Processed furniture, for example, can be transported to neighbouring schools, furniture shops or communities. Similarly, wash ing machines, bicycles and even processed products can be transported to laundries, bicycle shops, repair points, neighbouring parks, agricultural gardens etc., for reuse.
In the future, we hope that this model can be replicated everywhere, with as little waste as possible and as little waste as possible. Rubbish is no longer rubbish; it is “Next in Re-waste”.
