THE STUDY OF LANDSCAPE CHANGE IN THE MIDDLE AREA OF RAMALLAH GOVERNORAT-Yanah Enayah
Dr. Samar Nazer
Eng.Razan Bleidi
Yanah Enayah Alia Jamhour
Roaa Sawalha
Dala Zahran
CONTENTS
◼ Abstract
◼ Letreture Review
◼ What is Landscape
◼ Landscape change
◼ Review for Study area
◼ Research Problem
◼ Research Question
◼ Objectives
◼ Study Area
◼ Methodology
◼ Results
◼ Landscape Composition
◼ Landscape Structure
◼ Discussion and Conclusion
◼ References
ABSTRACT
This research studies and investigates the landscape change in Ramallah andAl-Bireh governorate containing 13 villages besides them in a vertical way in time between the years 1997and2019.Twoaerialphotoswereuploaded inArcGIS to draw the land cover maps , which clearly shows the differencesbetweenthetwoyearsinlandscapeclassesinthe studyarea.
The results showed that a change in the landscape structure,inawaythatrevealedthe Palestenianbeltup has doubled during the period , and the area of Isreli settlement also increased besides paved road , which affectedtheagriculturalareanegatory.
The research aims to quantify and qualify the landscape change in the early mentioned periods by figuring out the quantitative and the qualitative physical classes in the area , andtospecifythelandscapechangesthere.
KEYWORDS: Ecology ,Landscape change, land cover; GIS drawings and statistics ; Ramallah & Al-Bireh cities ; Villages of Ramallah.
LETRETURE REVIEW
A landscape is the visible features of an area of land,its landforms, and how they integrate with natural or man-made features. Landscape ecology is the study of patterns and processes of species assemblages and their interactions within landscapes .(2010 ,Seibert. "ArchaeologyandLandscape")
And landscape change :is a dynamic process.Landscapes consist of innumerable configurations along a continuum and consist of a variety of elements such as riparian, granite or wetland areas.Landscape modification changes the spatial configuration of native vegetation.( McIntyre, Hobbs,1999)
We discussed several previous studies and researches that are directly related to our title: (2004,Bürgi, Hersperger and Schneeberger . Driving forces of landscape change), The concept of driving forces is gainingincreasinginterest.
For this study, it faces four main challenges and their clarifications. Landscapes are the main area where the combined effects of society and nature becomevisible,andinterestinmodelsoflandscape changehasbegun.Landscapechangestudieshavea long tradition in the landscape environment, and they need an interest in interdisciplinary work and integration to fully understand the complexity of the system under study. Examining the drivers of landscape change can significantly improve the currentcontributionofthelandscapeenvironment towardssolvingreal-worldproblems.
Bender and Boehmer,in 2005 thatcontainstwocase studies of a cultural landscape in Southern Germany, and gathering further information for related researches,then compare it with the situation in Palestine.The research aims to develop appropriate techniques for quantifying and analyzing the landscape change since 1850.Methods were derived from geographical landscape change analysis,based oncadastralmapsandlandregisters,andwererenderedat a land plot level by the use of GIS.The two case studies emphasize that an approach based on a land plot level and using a land record-based GIS provides valuable results relevant for planning processes and nature conservation in changingculturallandscapes.ThisstudyChangesinlanduse and land cover are some of the far-reaching effects of human activities on modern landscapes.As a result of the intensification of agricultural production the land use has been through many changes and some of the uses disappeared. (Bender and Boehmer,2005)
in study by Bürgi and M. Hersperger, in their research studied the changes for the periods 1930–1956,1957–1976, and 1977–2000 are documented based on a comparison of cartographic maps.A list of 73 potentially relevant driving forces is established based on document analysis. Based on further document analysis and expert interviews,52 of them were found to be relevant primary driving forces for the documented landscape changes.We found that in all three periods, urbanization was the most important process of change. Greening is steadily increasing in importance and surpassed agricultural intensification in the last period. Overall, as well as for urbanization, the economic driving forces,followedbypoliticaldrivingforces,aremostimportant for landscape changes in all three periods. Cantonal driving forcesaremostimportant,followedbythenational,localand international driving forces.By presenting an approach to quantify thecontributionofmajor driving
forces groups (socioeconomic, political, cultural, technological, and natural/spatial driving forces) to landscape change this study contributes to method developmentinlandchangeresearch.soduringthestudyto the landscape we should study the contribution of major driving forces groups and their effect to landscape change.and use the every method we have to study the landscapechangeformoreaccuracy.alsokeepcontributing and developing the methods in land change research.(Bürgi and M.Hersperger,2009)
As for Skahes,Bunce,1997,"Landscape Changing Trends (1741-1993) in Verestad, Swedencharacterized by multivariate analysis",It aimed to is to demonstrate the value of the multivariate method, Principal Component Analysis (PCA) on data related to landscapeelements,toidentifytherelativetrendsofchange and to illustrate landscape dynamics.Data were retrieved from retrospective studies based on the interpretation of aerialimageryandoldcadastralmapsin
three time periods, covering 56 selected small villages in Verestad,southern Sweden,and to perform the analysis,the data were summarized in five major land cover groups, (1) composite Suitable for agriculture and pastures, (2) open semi-natural grasslands,(3) wooded pastures,(4) water,and (5) forest / remaining land.The result is that landscapes in mostsmallvillageshavebeentransformedfromamoreopen rural landscape with fields and semi-natural grassy areas,to a non-rural landscape with closed forests and fragmented rural areas dominated by cultivated grasslands. The scale and distribution of small villages along major axes over time indicates reduced complexity, and suggests a negative relationship between the degree of open agricultural landscapes and the relative proportion of semi-natural grasslands and forests. PCA has been shown to be a useful tool for simplifying complex landscape data sets and indicatingthenatureofchangeintermsofdynamicsofspatial organization and direction of change in the rural landscape of Virestad.Intheanalysis,threetypesofsmallvillagesof
varying development were distinguished; (A) A significant change from rural semi-open landscapes to closed non-rural forestlandscapes;(B)Intermediate change, as small villages were alreadyintimatelyconnectedtothe closed forest landscape from the start;(C) Intermediate change,as small villages remained closer to relatively open rural landscapes over the 200 years of the study period.(SkahesandBunce,1997)
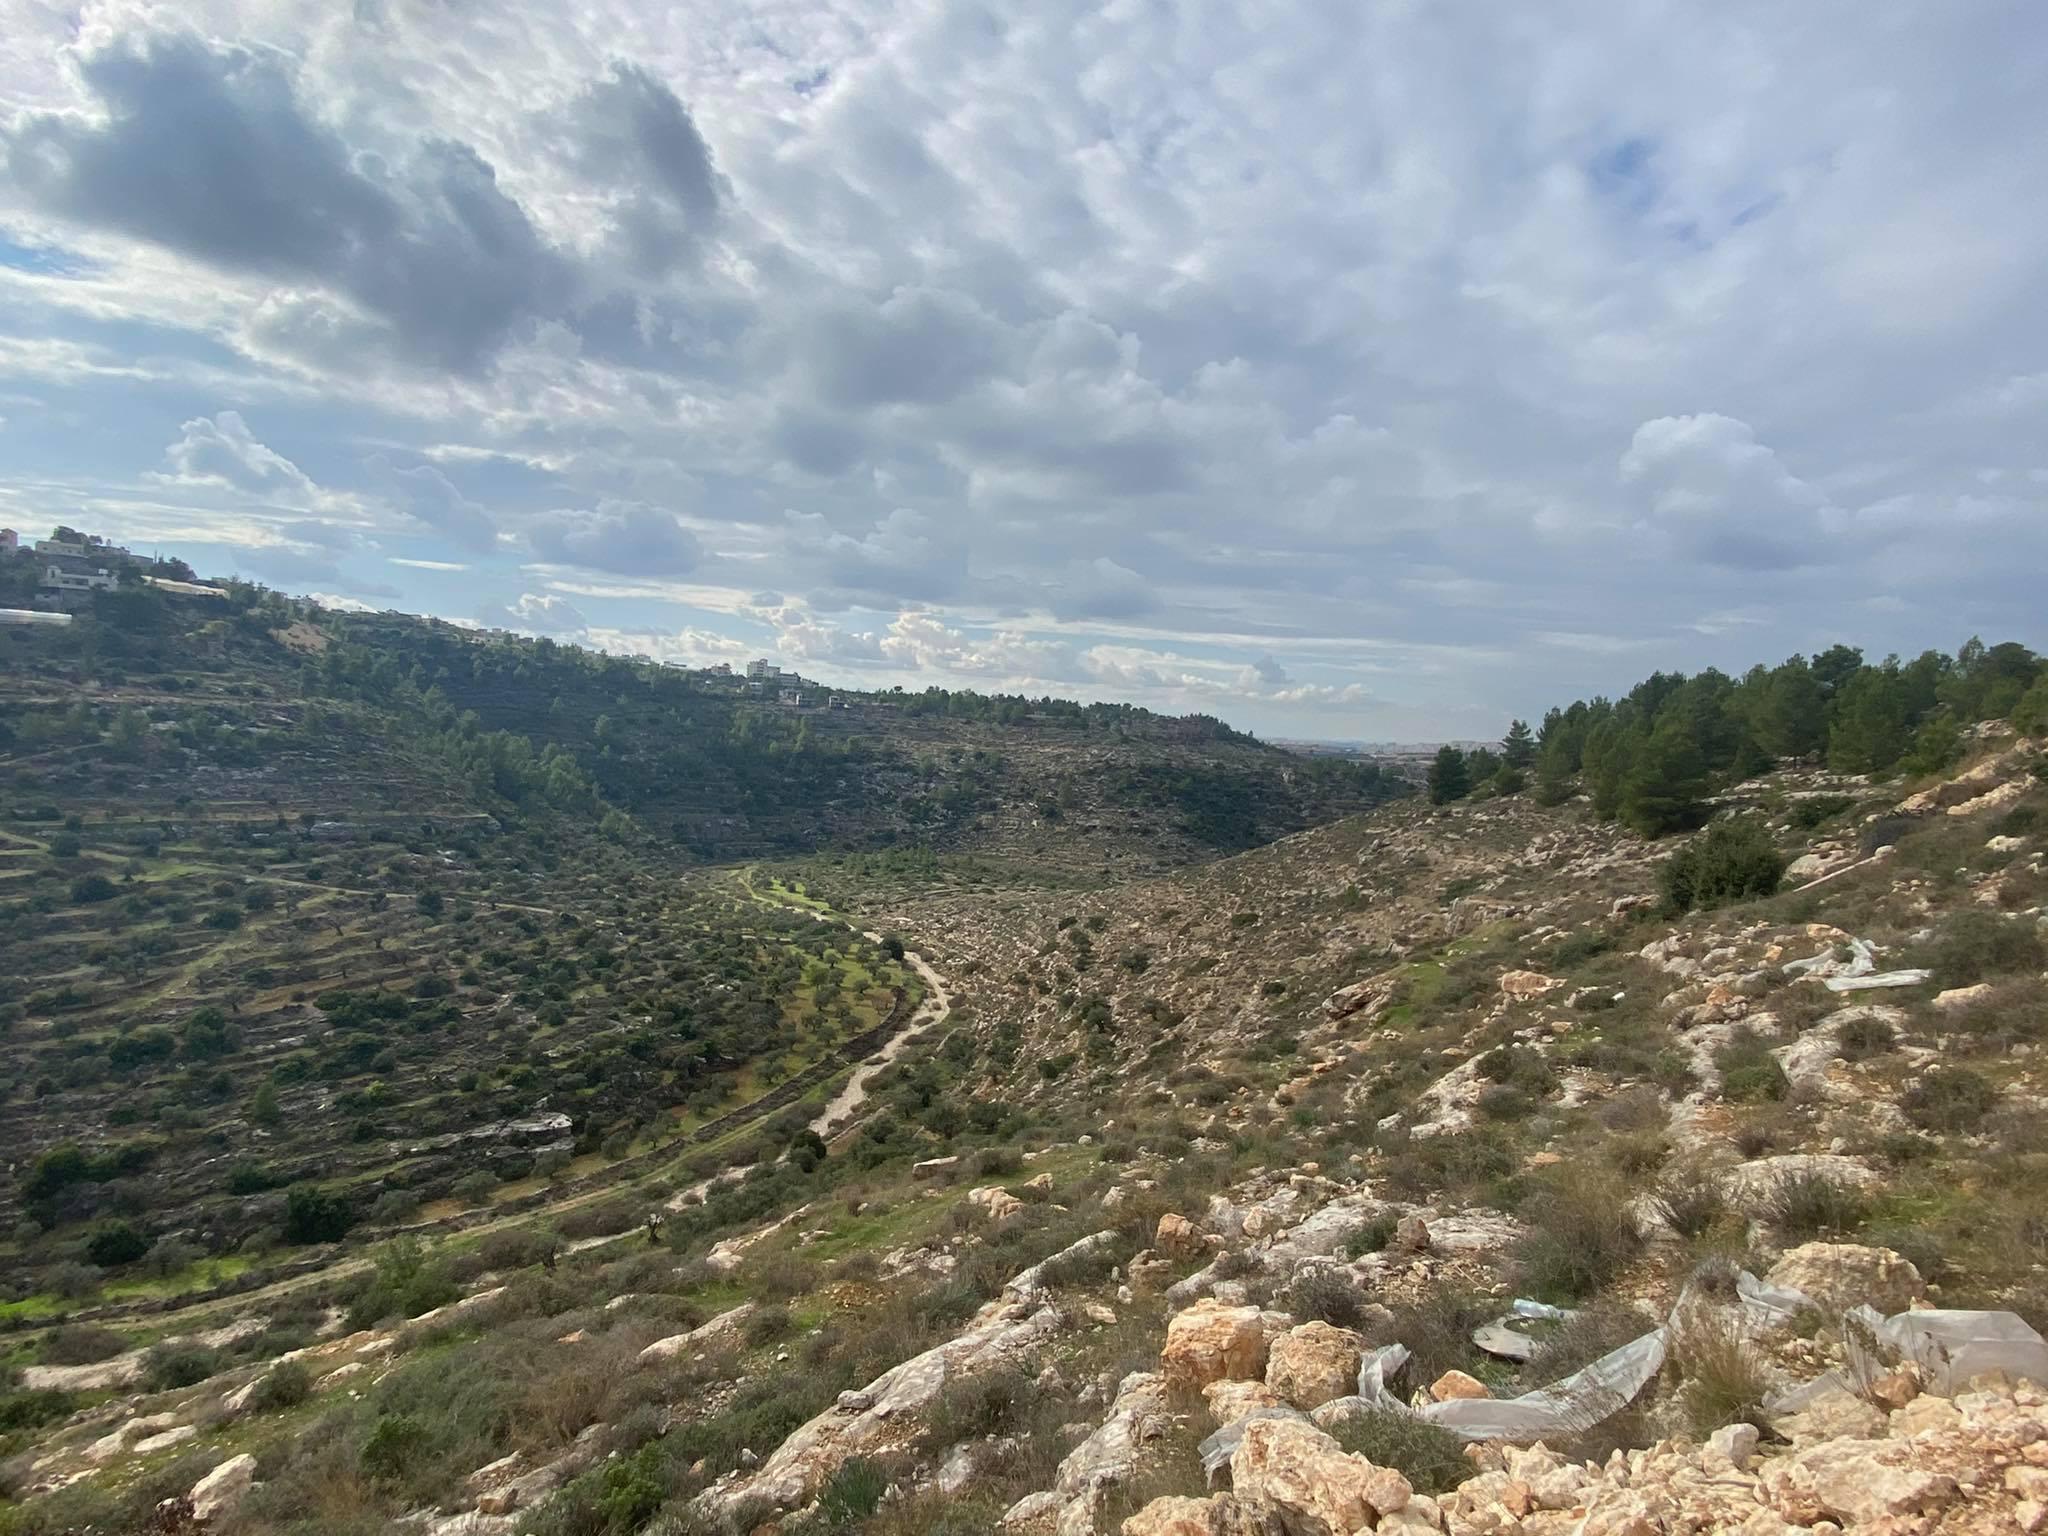
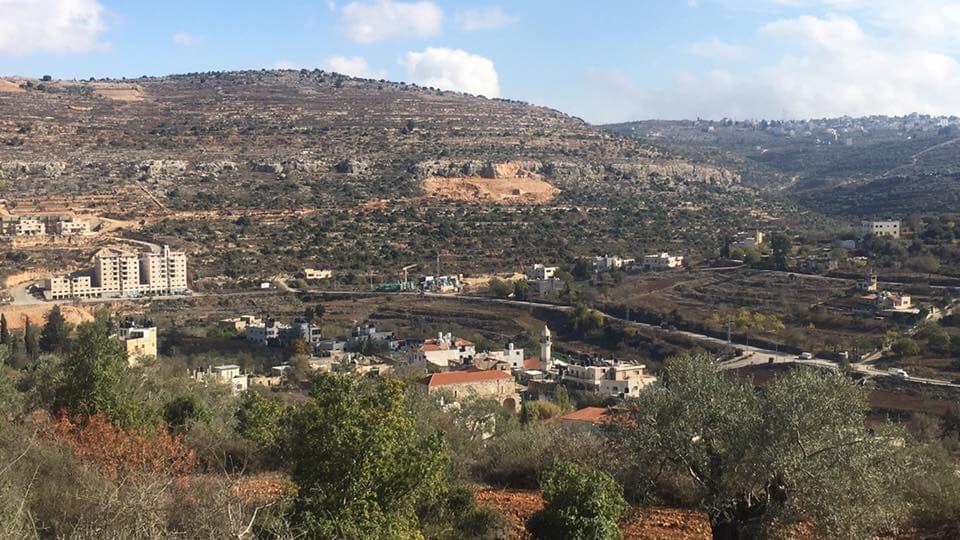
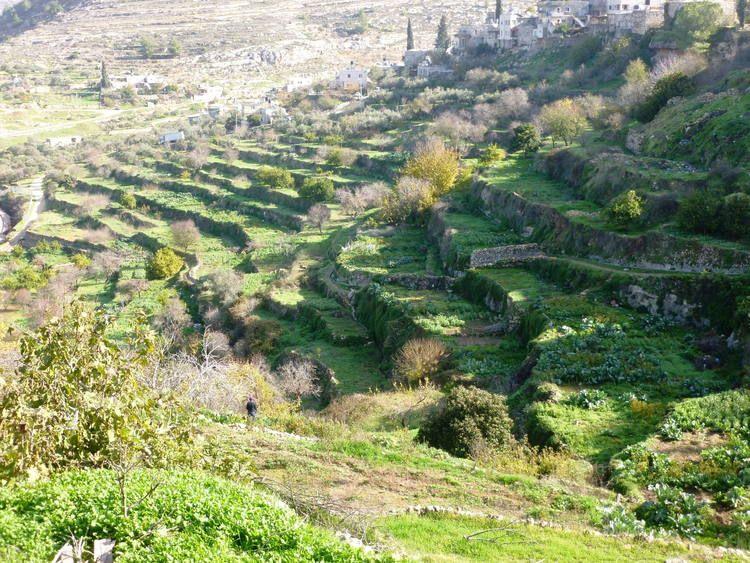
(Photo ( 3 ) by researchers,2020,location:Ain Sinaia)
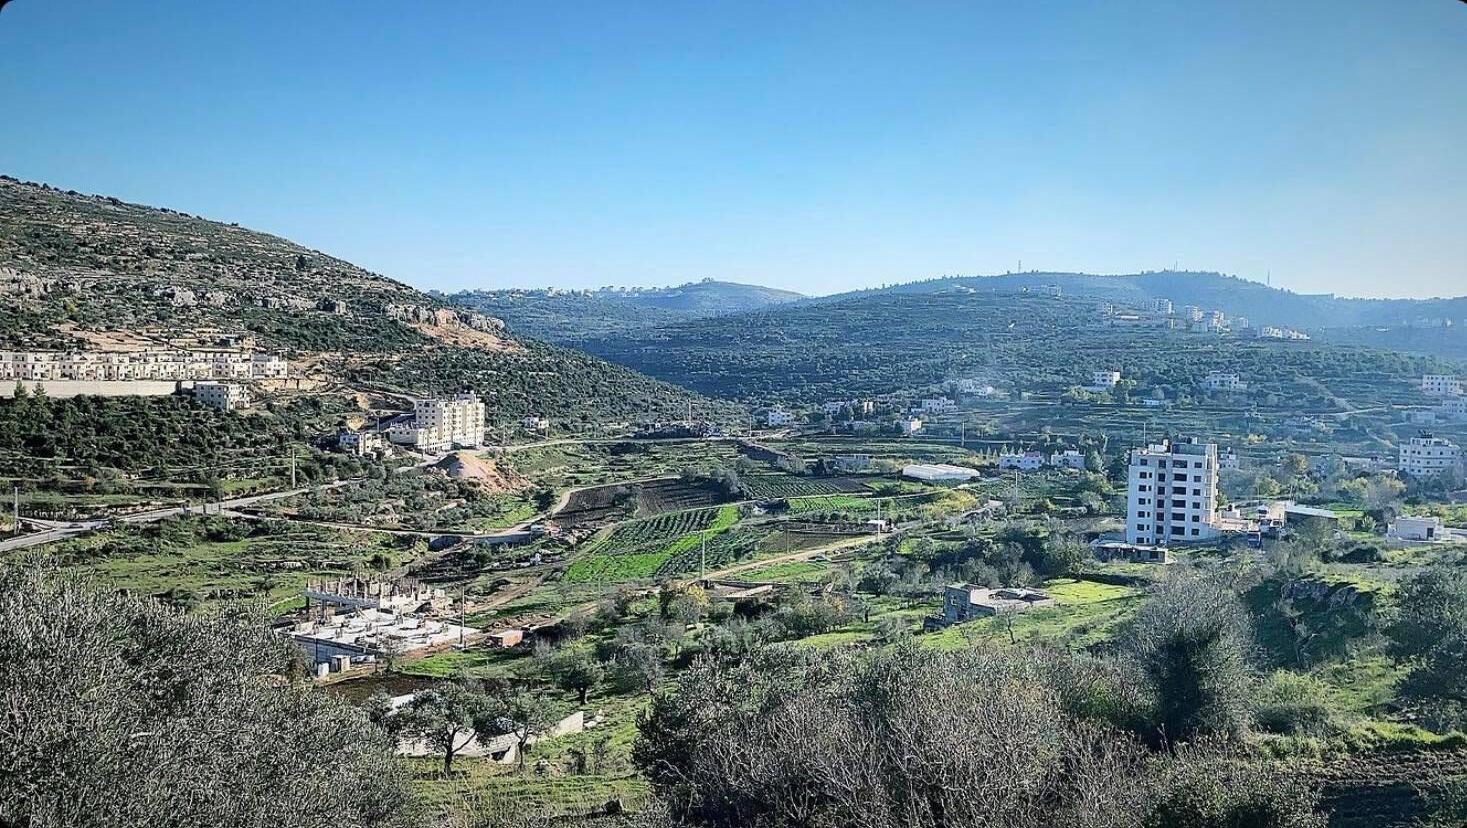
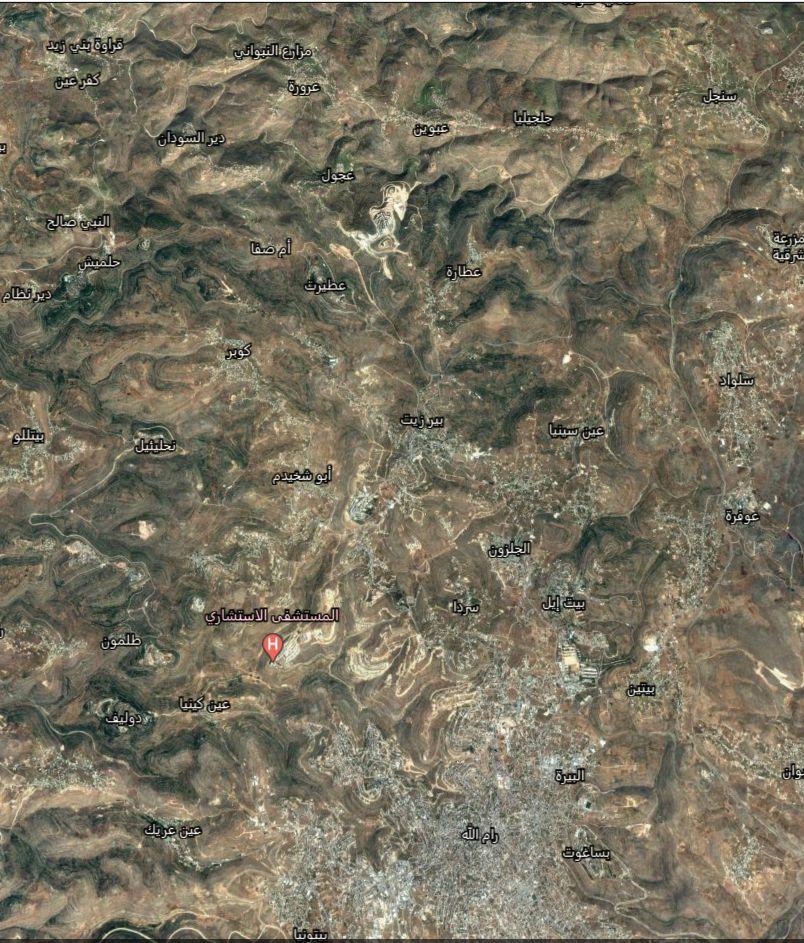
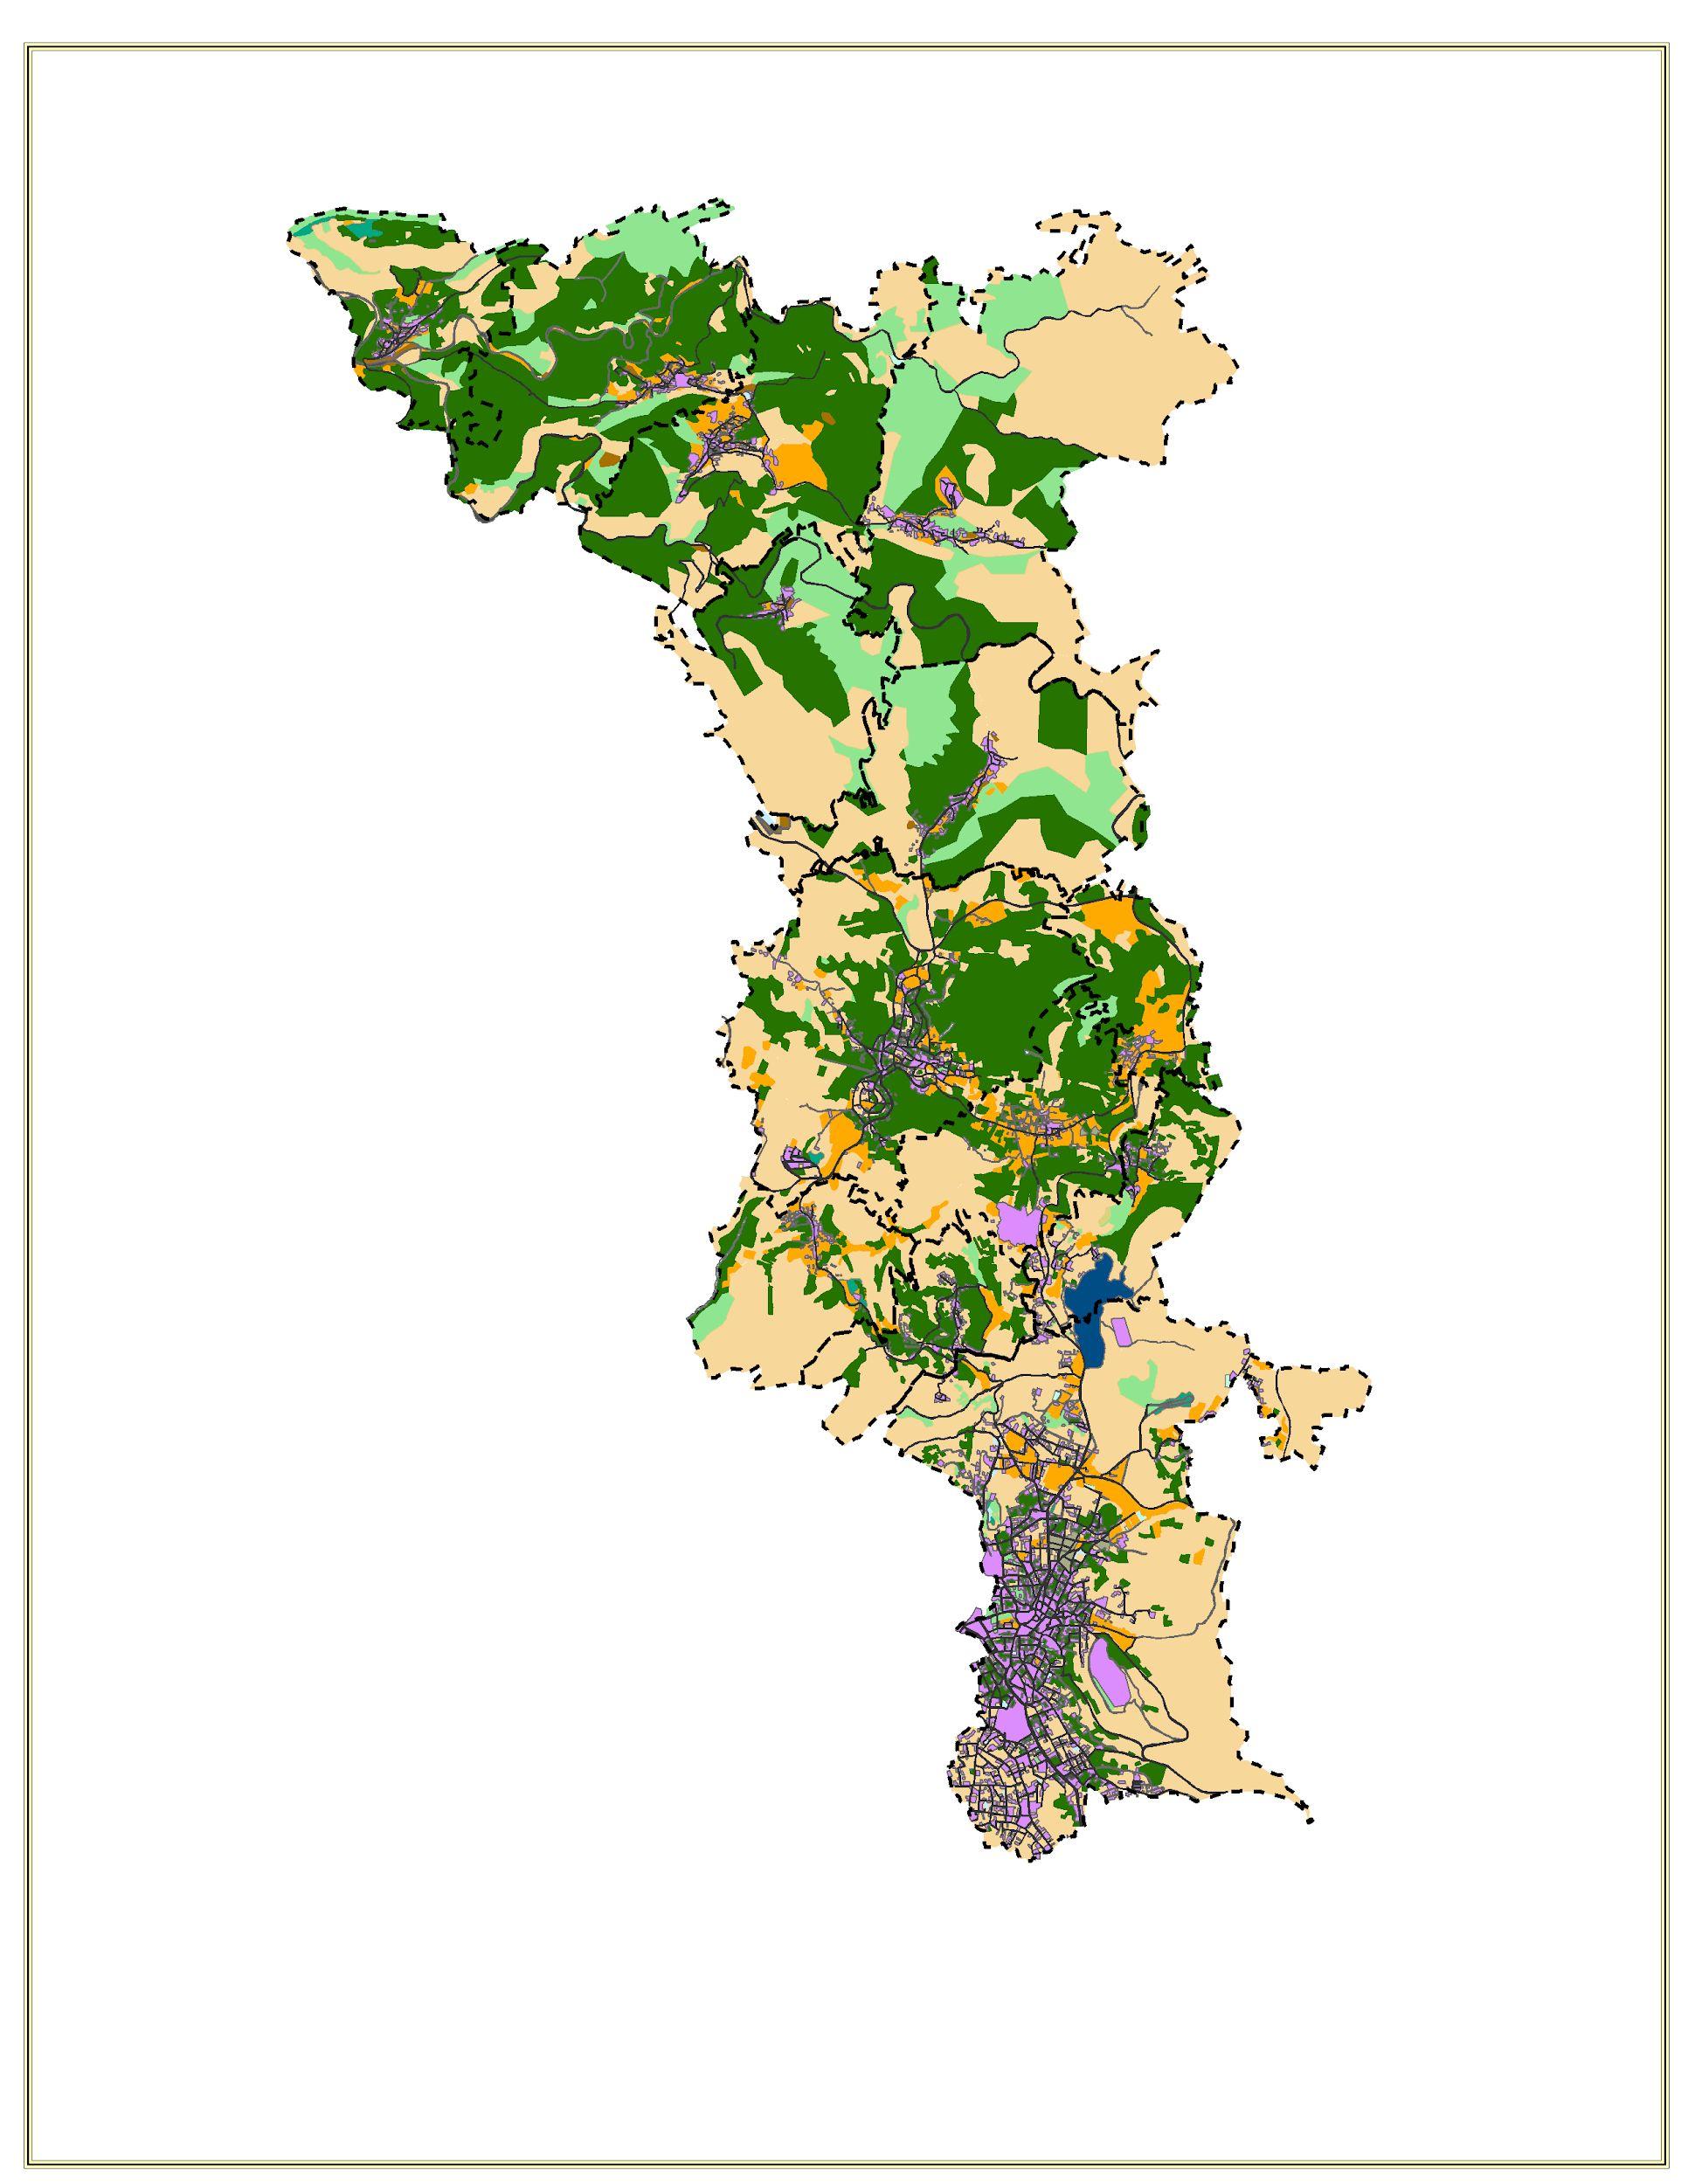
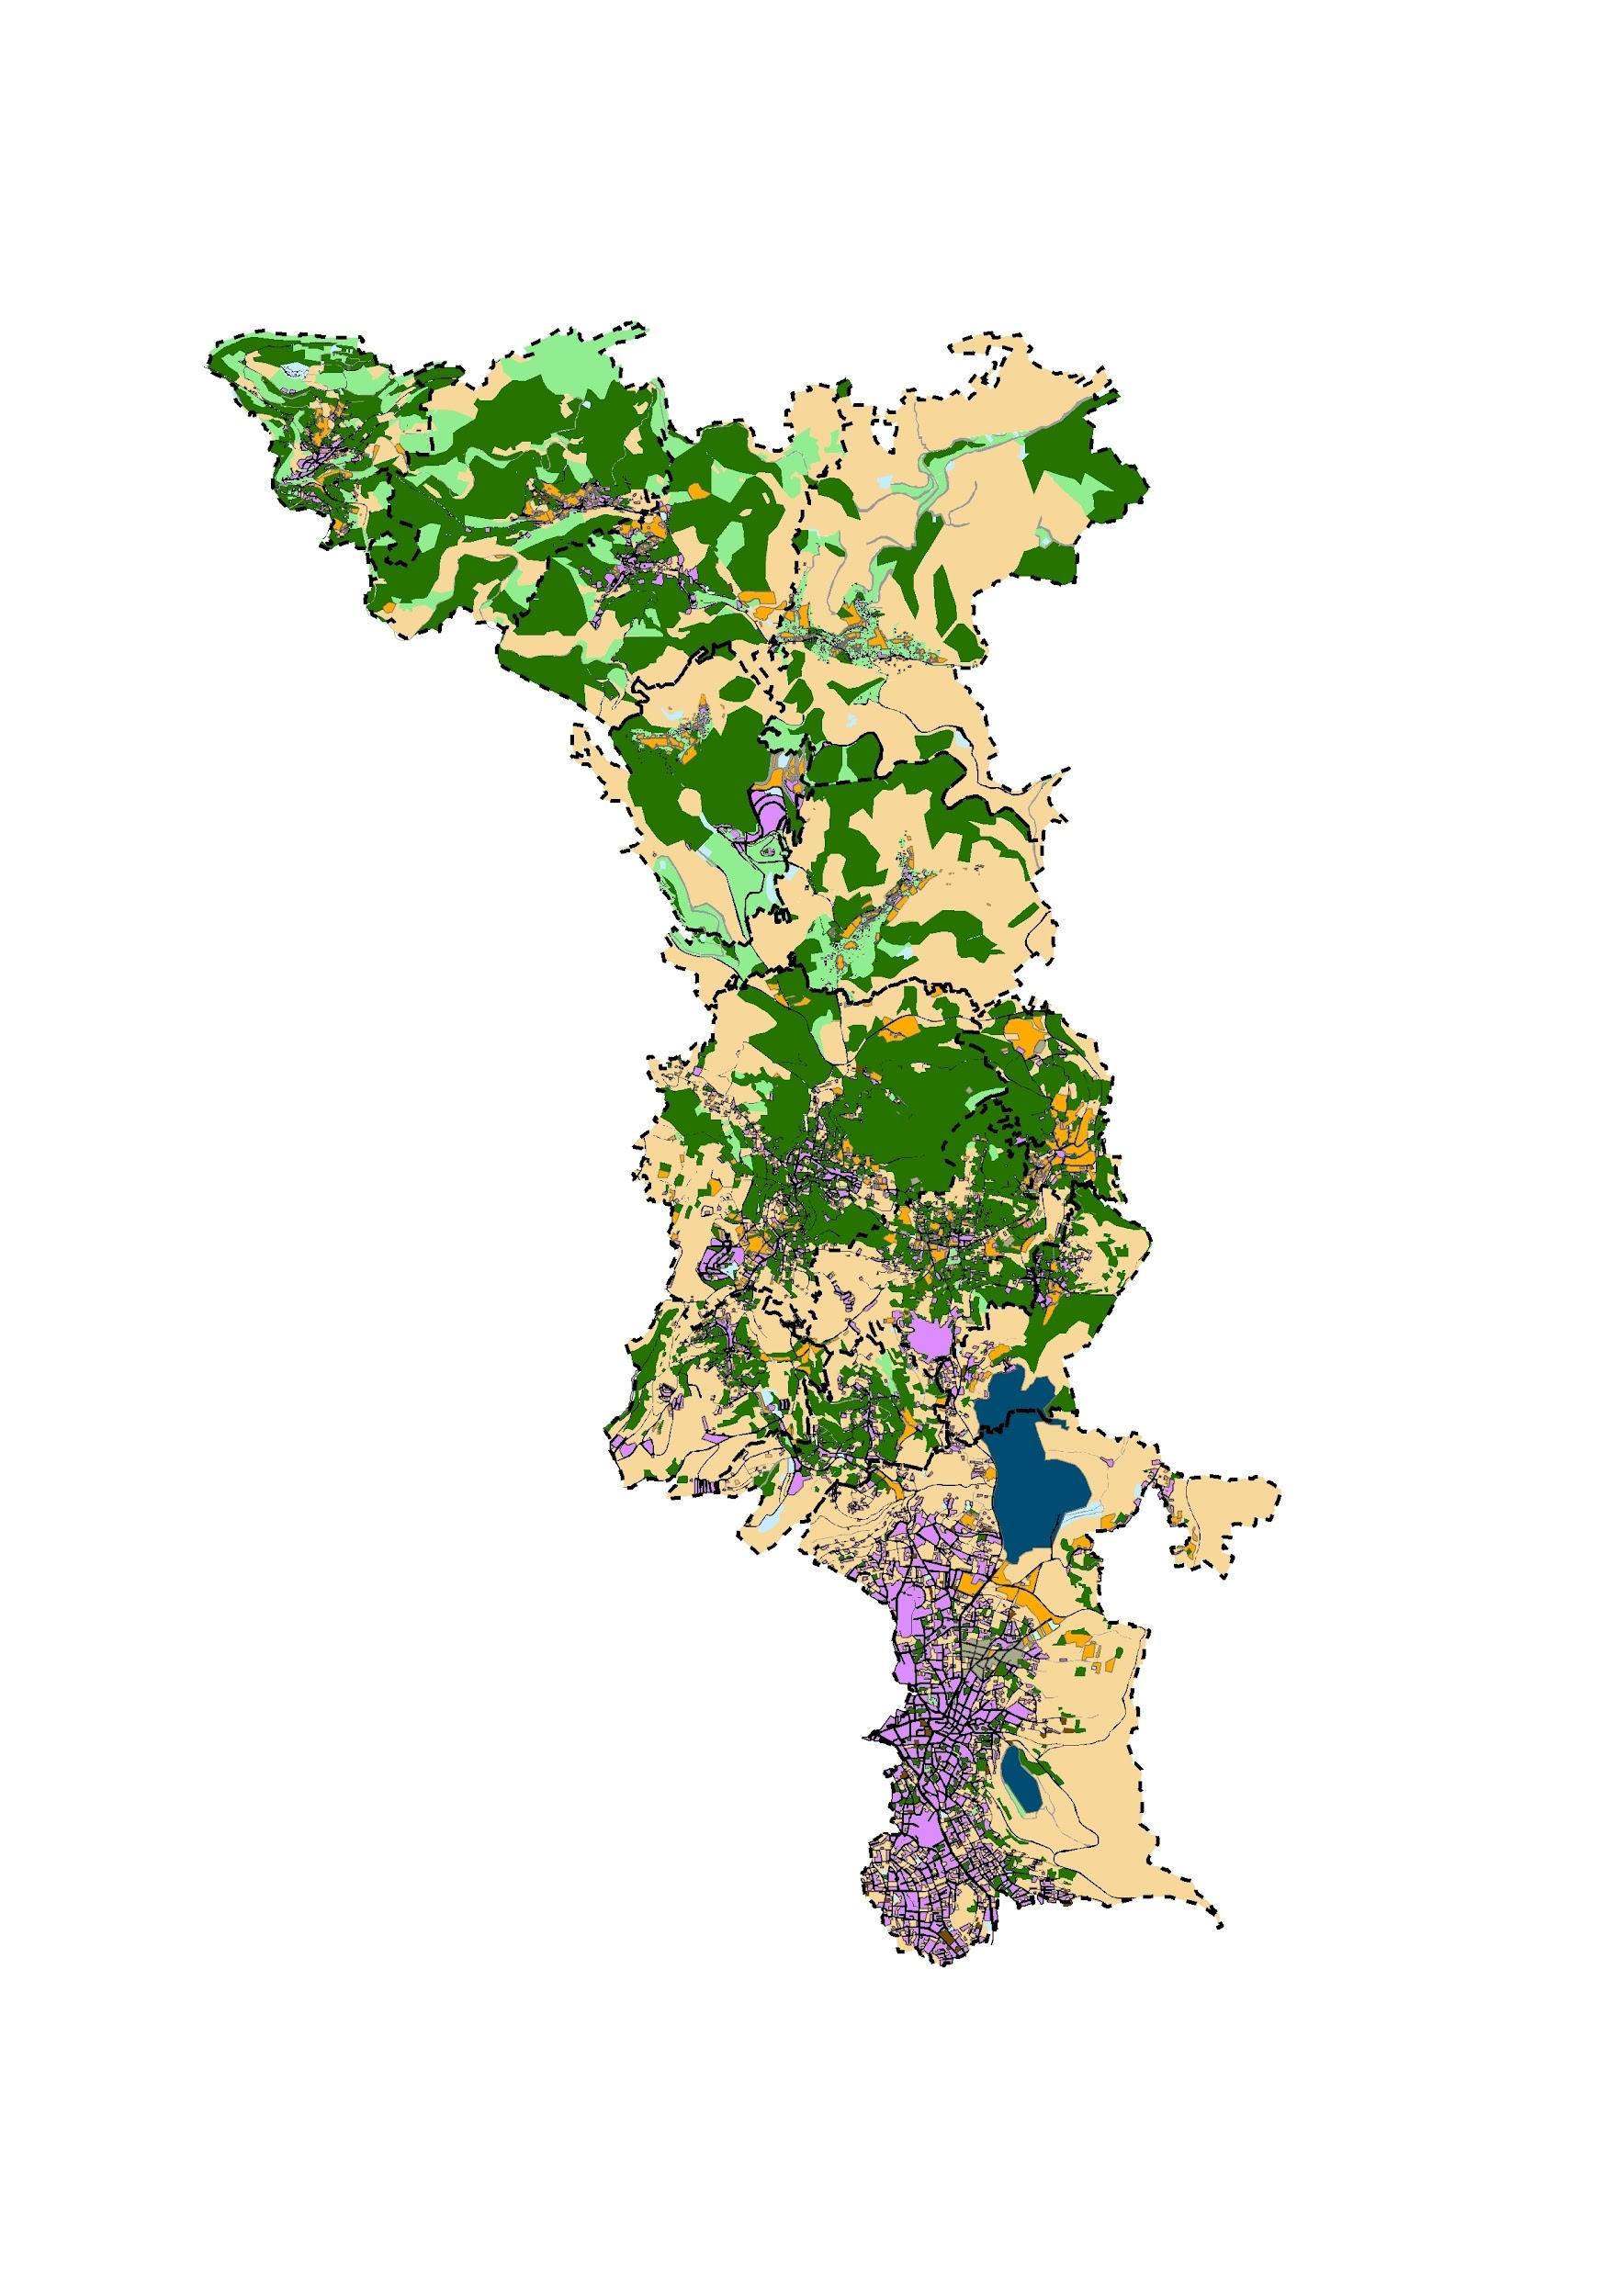
This research looks at landscape changes in Ramallah Governorate in general,and especially in Al-Bireh ,Birzeit and some more of the villages that are surrounded (jifna,Surda,Ein Senia,Abu Qash,DuraAl-Qara,Atara, Arura.,Abwein,Mazrai an Nabali,Qarawat Bani Zaid) and compares these changes between two years 1997 and2019.However;Theresearchaddressesthelandscapetypesthatarefoundinthe chosen areas Land useWhich the main Landscape classes in land-use are Palestinian built-uparea,Israelibuilt-up,arablelands,permanentagriculturaltrees,green houses, Pasturearea,forests,Opentreeplantation,Scrubarea, ValleysandLake,pool,river.
The landscape is looked upon as a physical entity that comprehends tangible and measurable evidence of change.This paper focuses on tracing the actual physical changeinthelandscapesover1997and2019,inwhichitstudieslandscapeelements and their characteristics and compare these changes. In other words, the study investigatesthelandscape'sdevelopment,andmeasuresthisdevelopmentinterms of landcover,asevincedinchangesonmapsanddiagrams
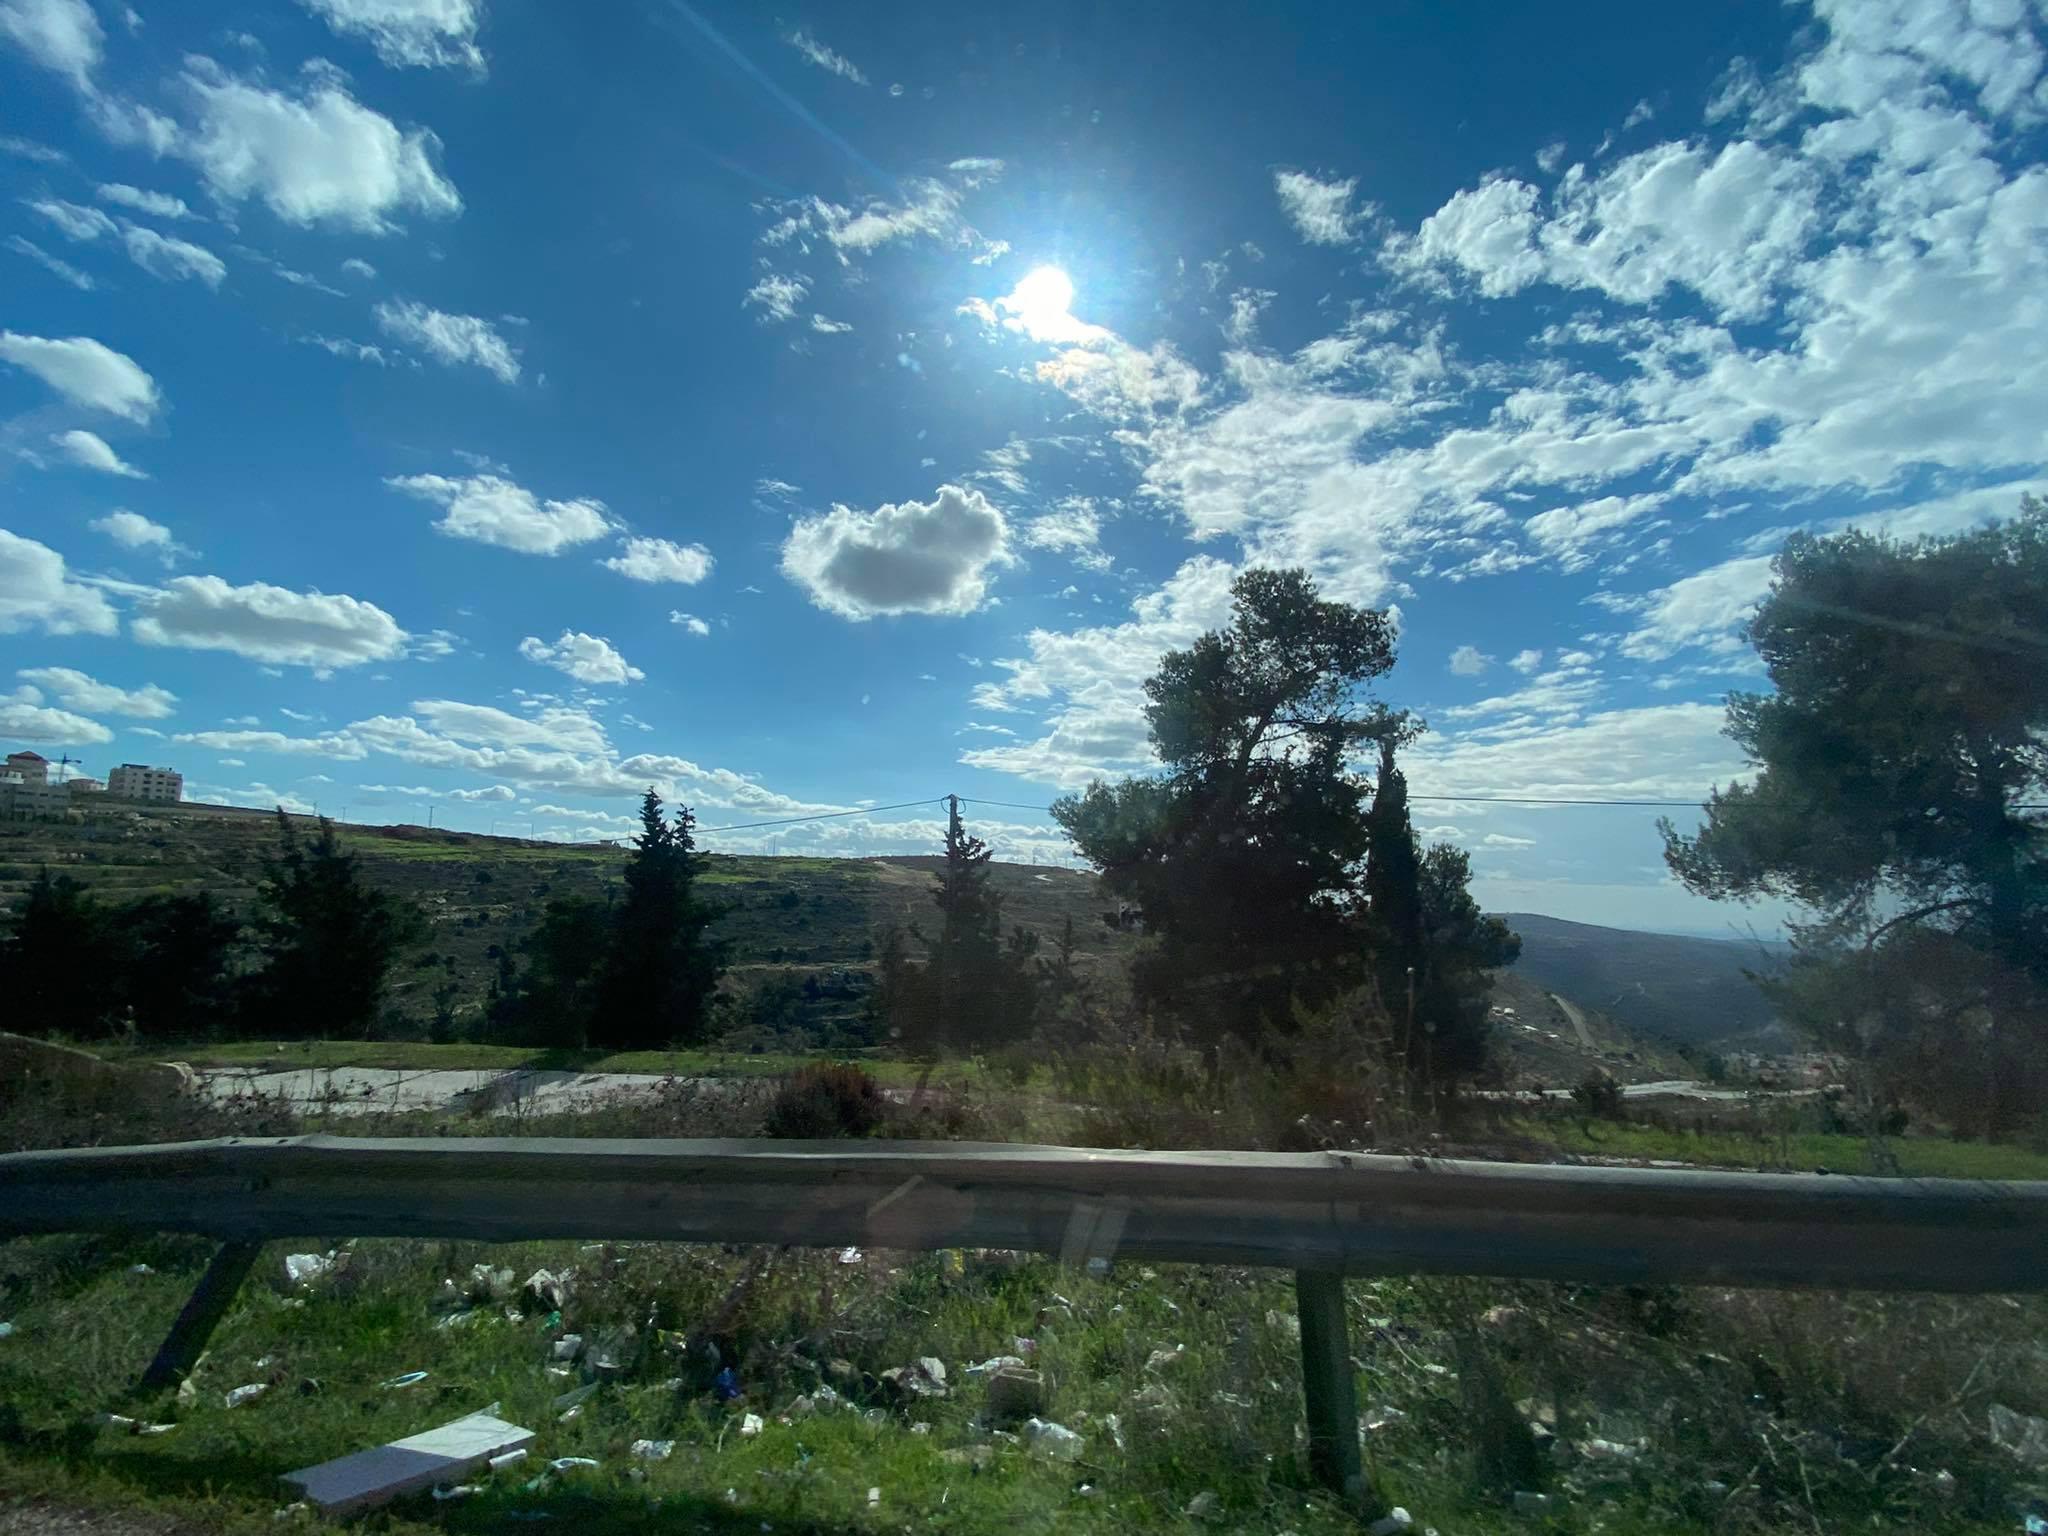
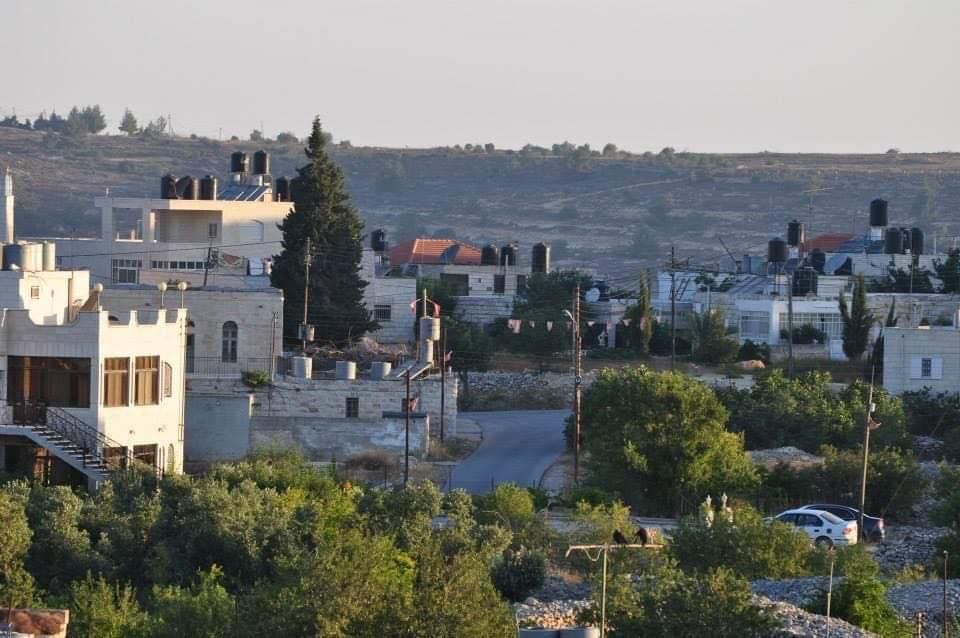
(Photo ( 10 ) by researchers,2020,location: Surda)
RESREACH QUESTIONS
First Question
What are the changes that happened during 1997 and 2019?
Second Question
Second feature How these changes affected the landscape and the landscape elements?
Third Question
What and where are the gains and losses for each landscape class?
OBJECTIVES
Study the landscape structure of our area and determine landscape categories.Estimatinglandscapechangeovertimefrom1997to2019
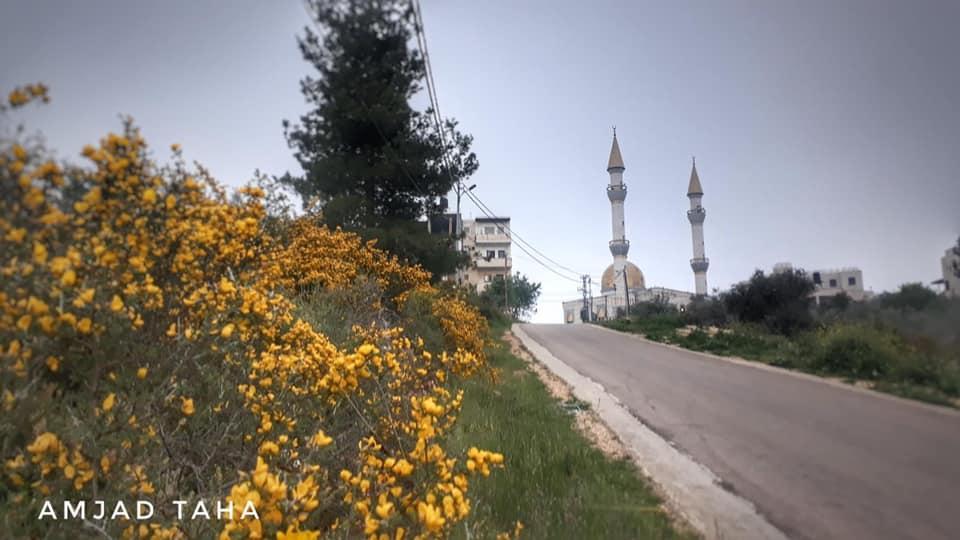
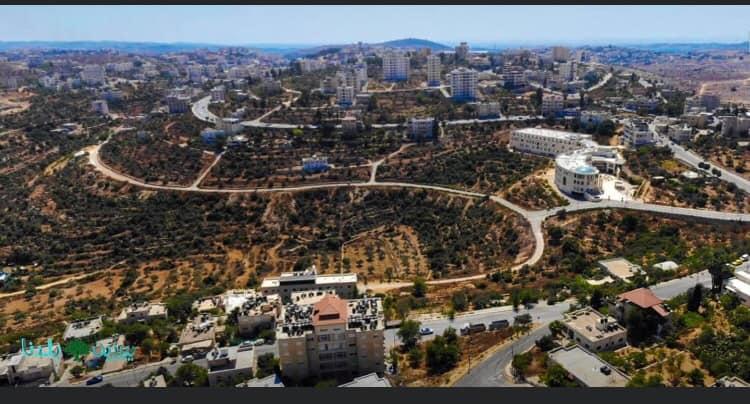
Photo ( 11 ) by researchers,2020,locatio:Mazaria an Nabali
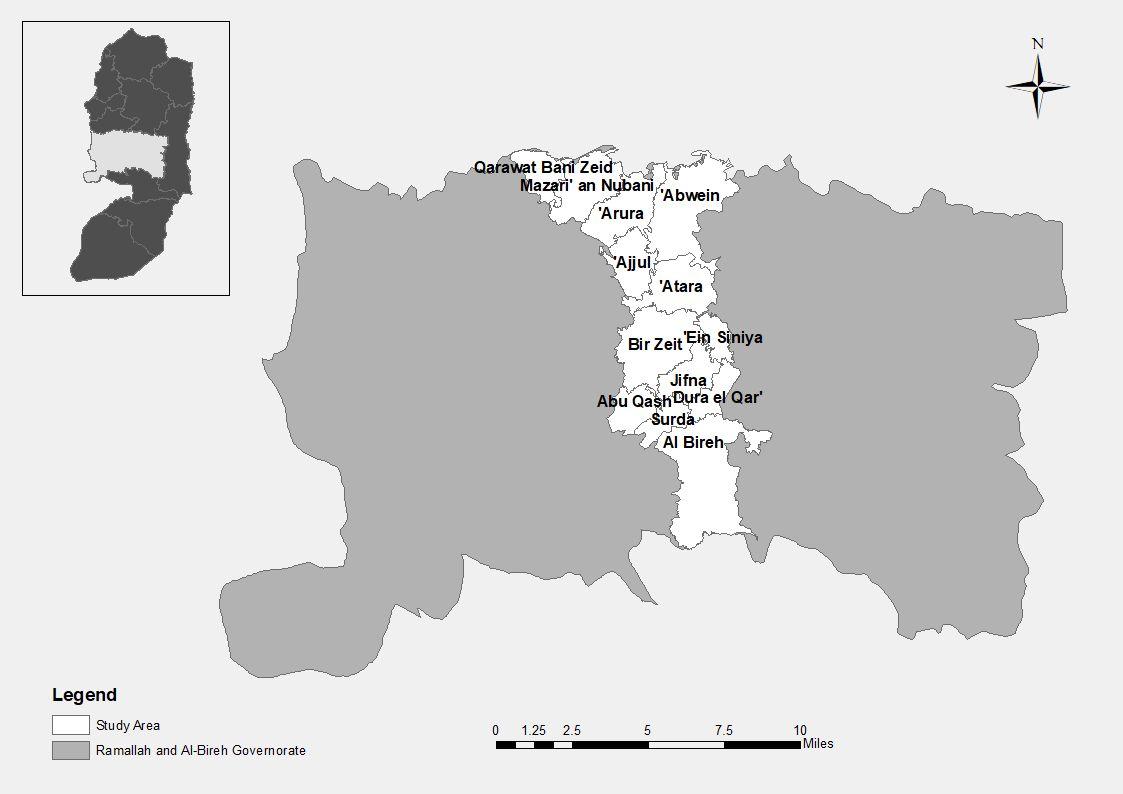
Ramallah & Al Bireh Governorate is located along the middle of the West Bank. It is bordered by Nablus & Salfit Governorates to the north, Jericho to the east, Jerusalem to the south,and theArmistice Line (the Green line 1949) to the west.As a region,Ramallah covers a total land area of 855,587 dunums , distinguished into eighteen major land use classes. These include Palestinian built up areas, Israeli settlements, closed military areas, military bases, open spaces, forests and construction sites. .(ARIJ – GIS Unit,2011)
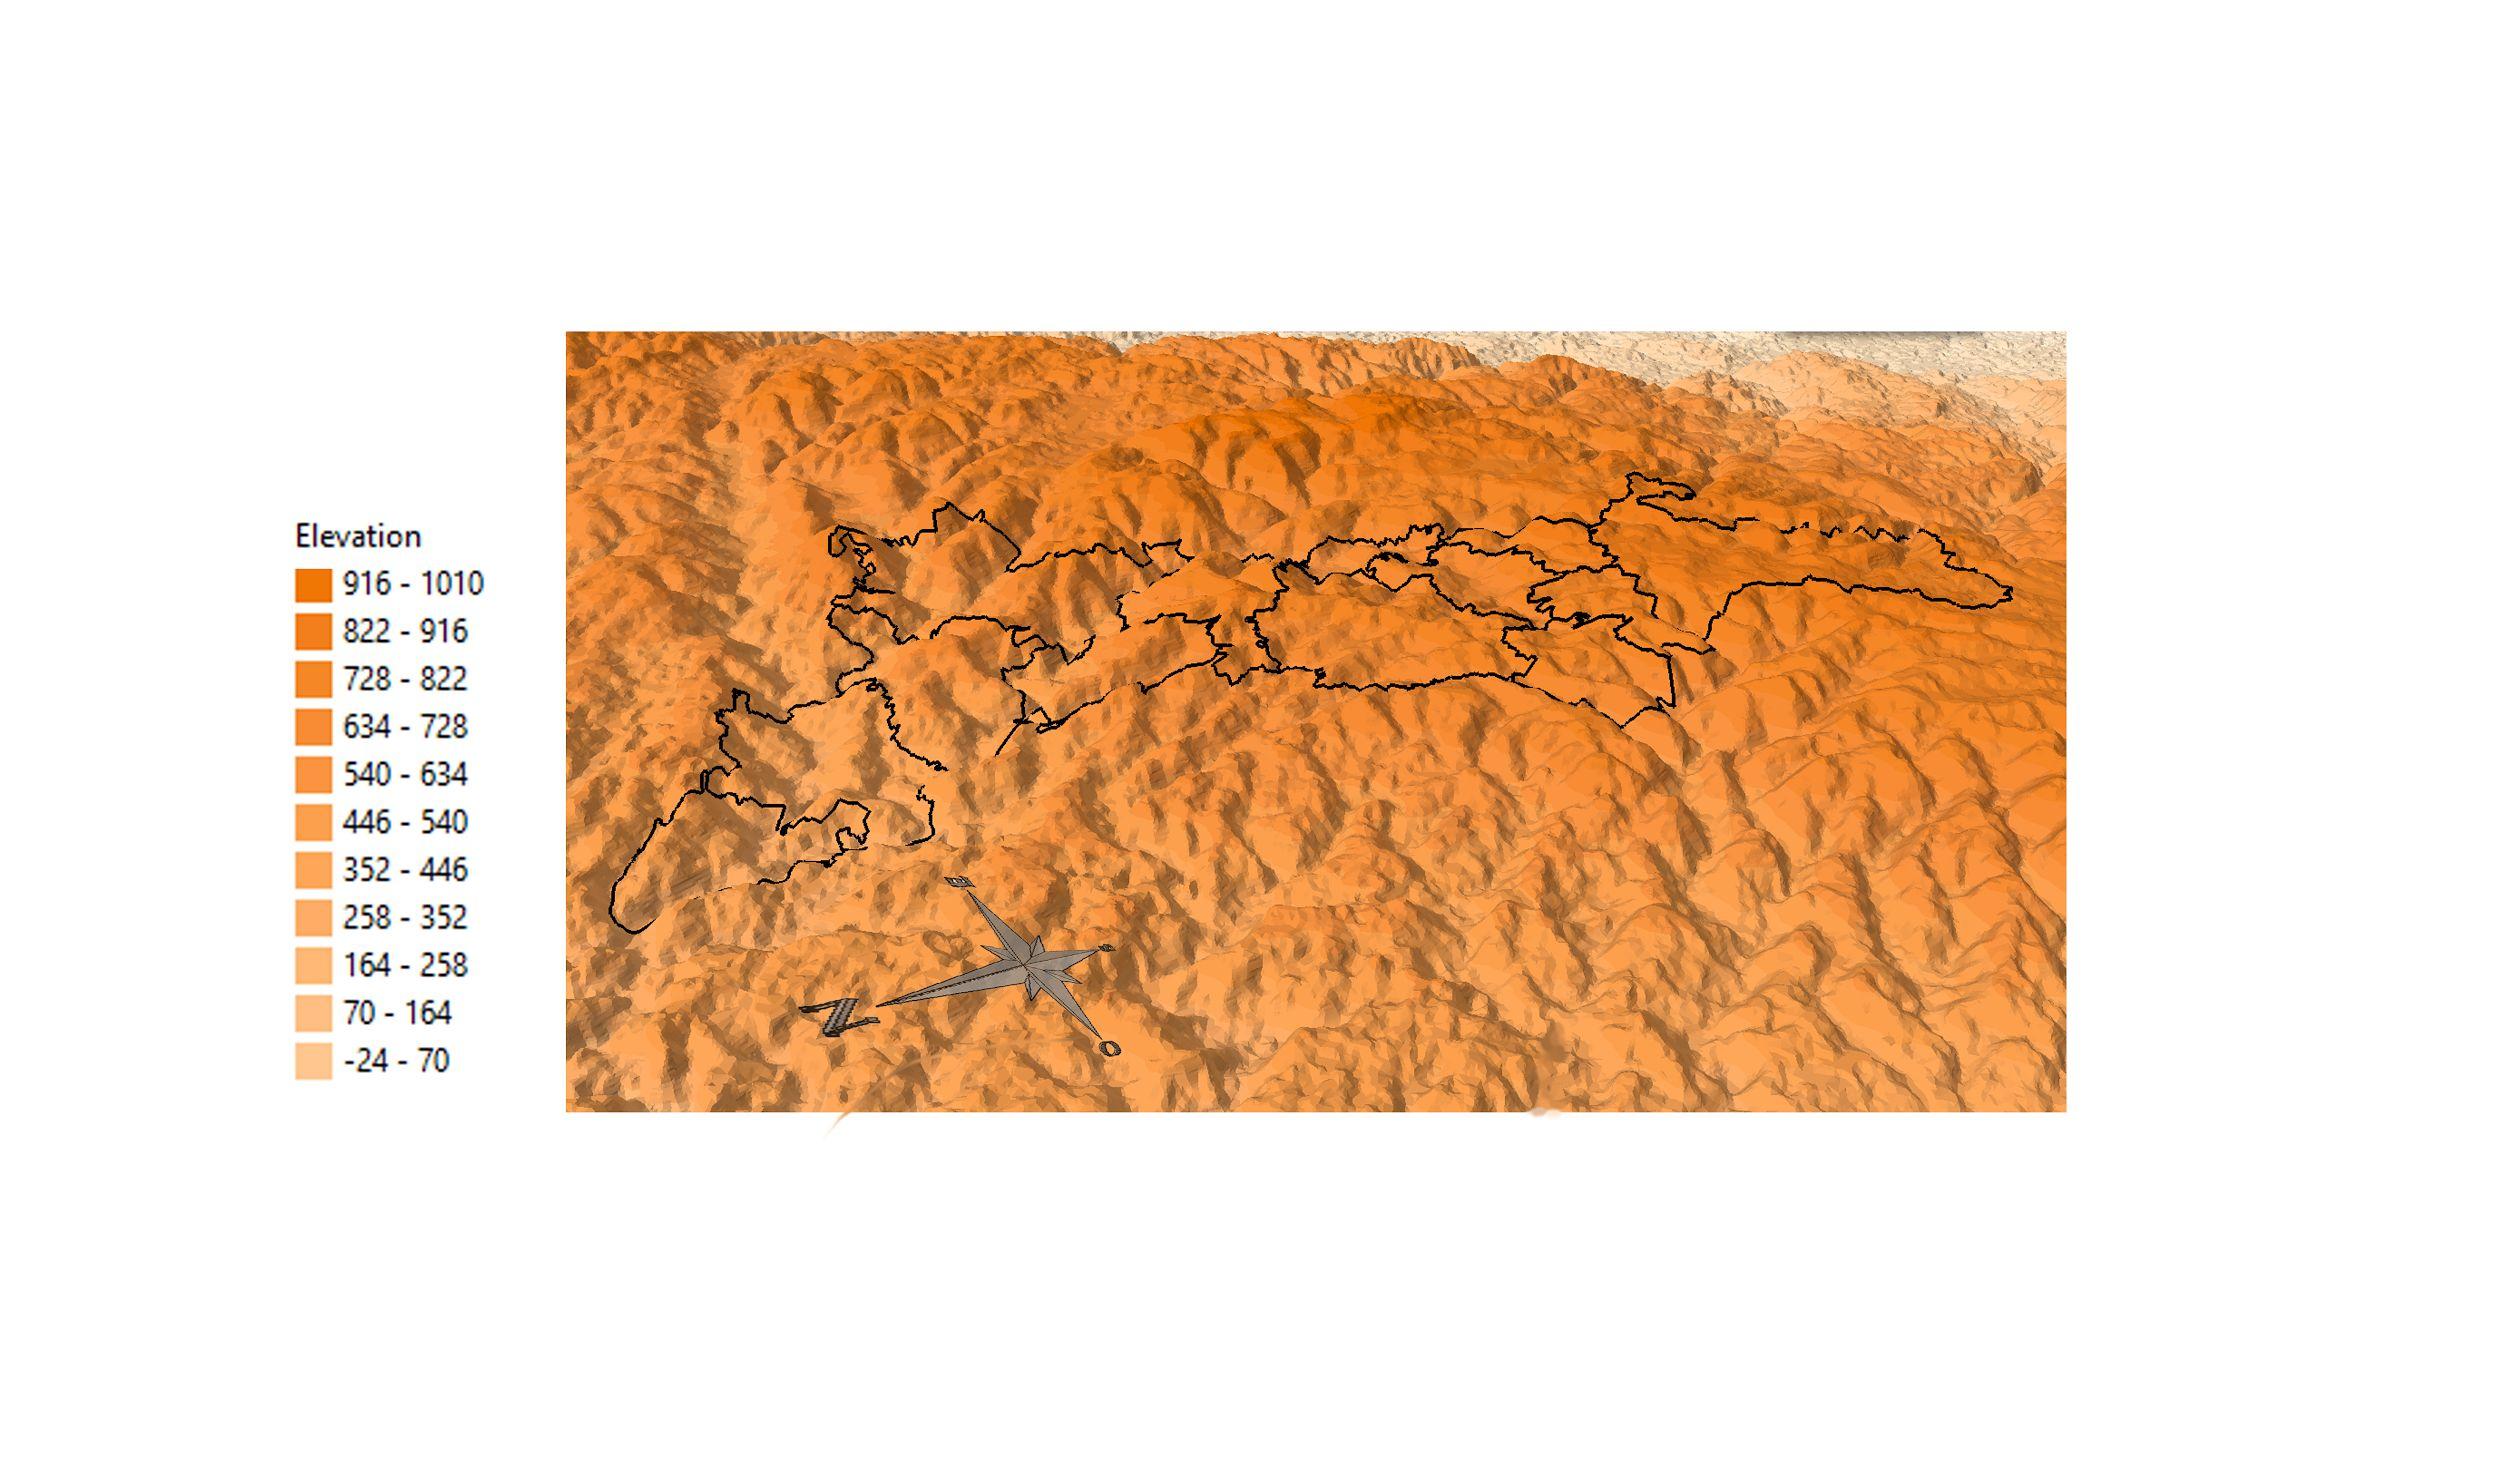
It is inhabited by 347,818 Palestinians (Palestinian Central Bureau of Statistics ,2020) distributed over 73 geographical locations It is noted that Palestinian built-up areas constitute 5.44 % of the total area of the Governorate. Ramallah & Al Bireh Governorate is further characterized by great a variation in its topography and altitude, being dominated by the topography of the Jordan RiftValley.It has an levation varying between 219m above sea level in the west, and 937m above sea level toward the west and northwest 2011)
This research mainly focuses on studying the changes in the landscape, the causes of change, and its impact on the environment and biodiversity in the city of Al-Bireh and 12 neighboring villages as follows (Birzeit, Jifna, Surda, Ein Senia, Abu Qash,DuraAl-Qara,Atara, Arura.,Abwein,Mazaria an Nabali,Qarawa Bani Zaid).The area of the total study area is (11544.24) hectares.
area.
Topography OfThe Site Study
Map 2:Topography OfThe Site Study
METHODOLOGY:
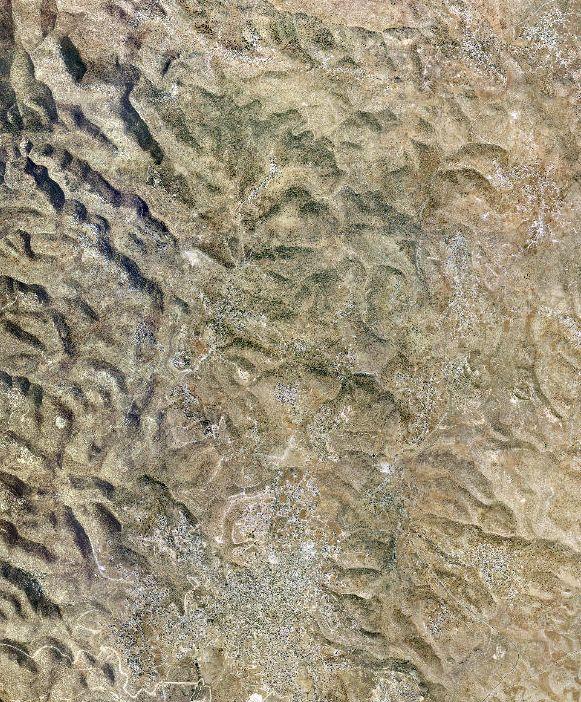
After determining and visiting the site ,to understand the landscape characteristics that is found in the site, in order to understand and determine the land cover there, collecting photo , and aerial photo taken fromGeomolgofthesiteduringtwoperiods from 1997 and 2019, and analyzing these photographs using GIS 10.5 ,order to investigate the actual physical changes. then measure the areas of change in the landscape categories,theirsizeandnumber,inorderto arrive at a matrix between the two stages to clarify the percentage of lost and acquired areas with the direction of this loss or gain, by following the analytical and inductive approach of the maps and matrix to reach the information and conclusions Make recommendations, as well as diagrams that visually illustrate changes in landscape categories.
Datacollection
aerialphoto 1997-2019
Dataanalysis
Digitizing land cover map 1997-2019
Calculation
Area\PatchesandNumber\Loss andgain
Overlay between 1997 and 2019
Results
Sitevisit
Map 3:Aerialphoto1997
Map 4:Aerialphoto2019
Landuse in 2019
This section will clarify the physical and temporal changes in the landscape classes during the years between1997and2019.
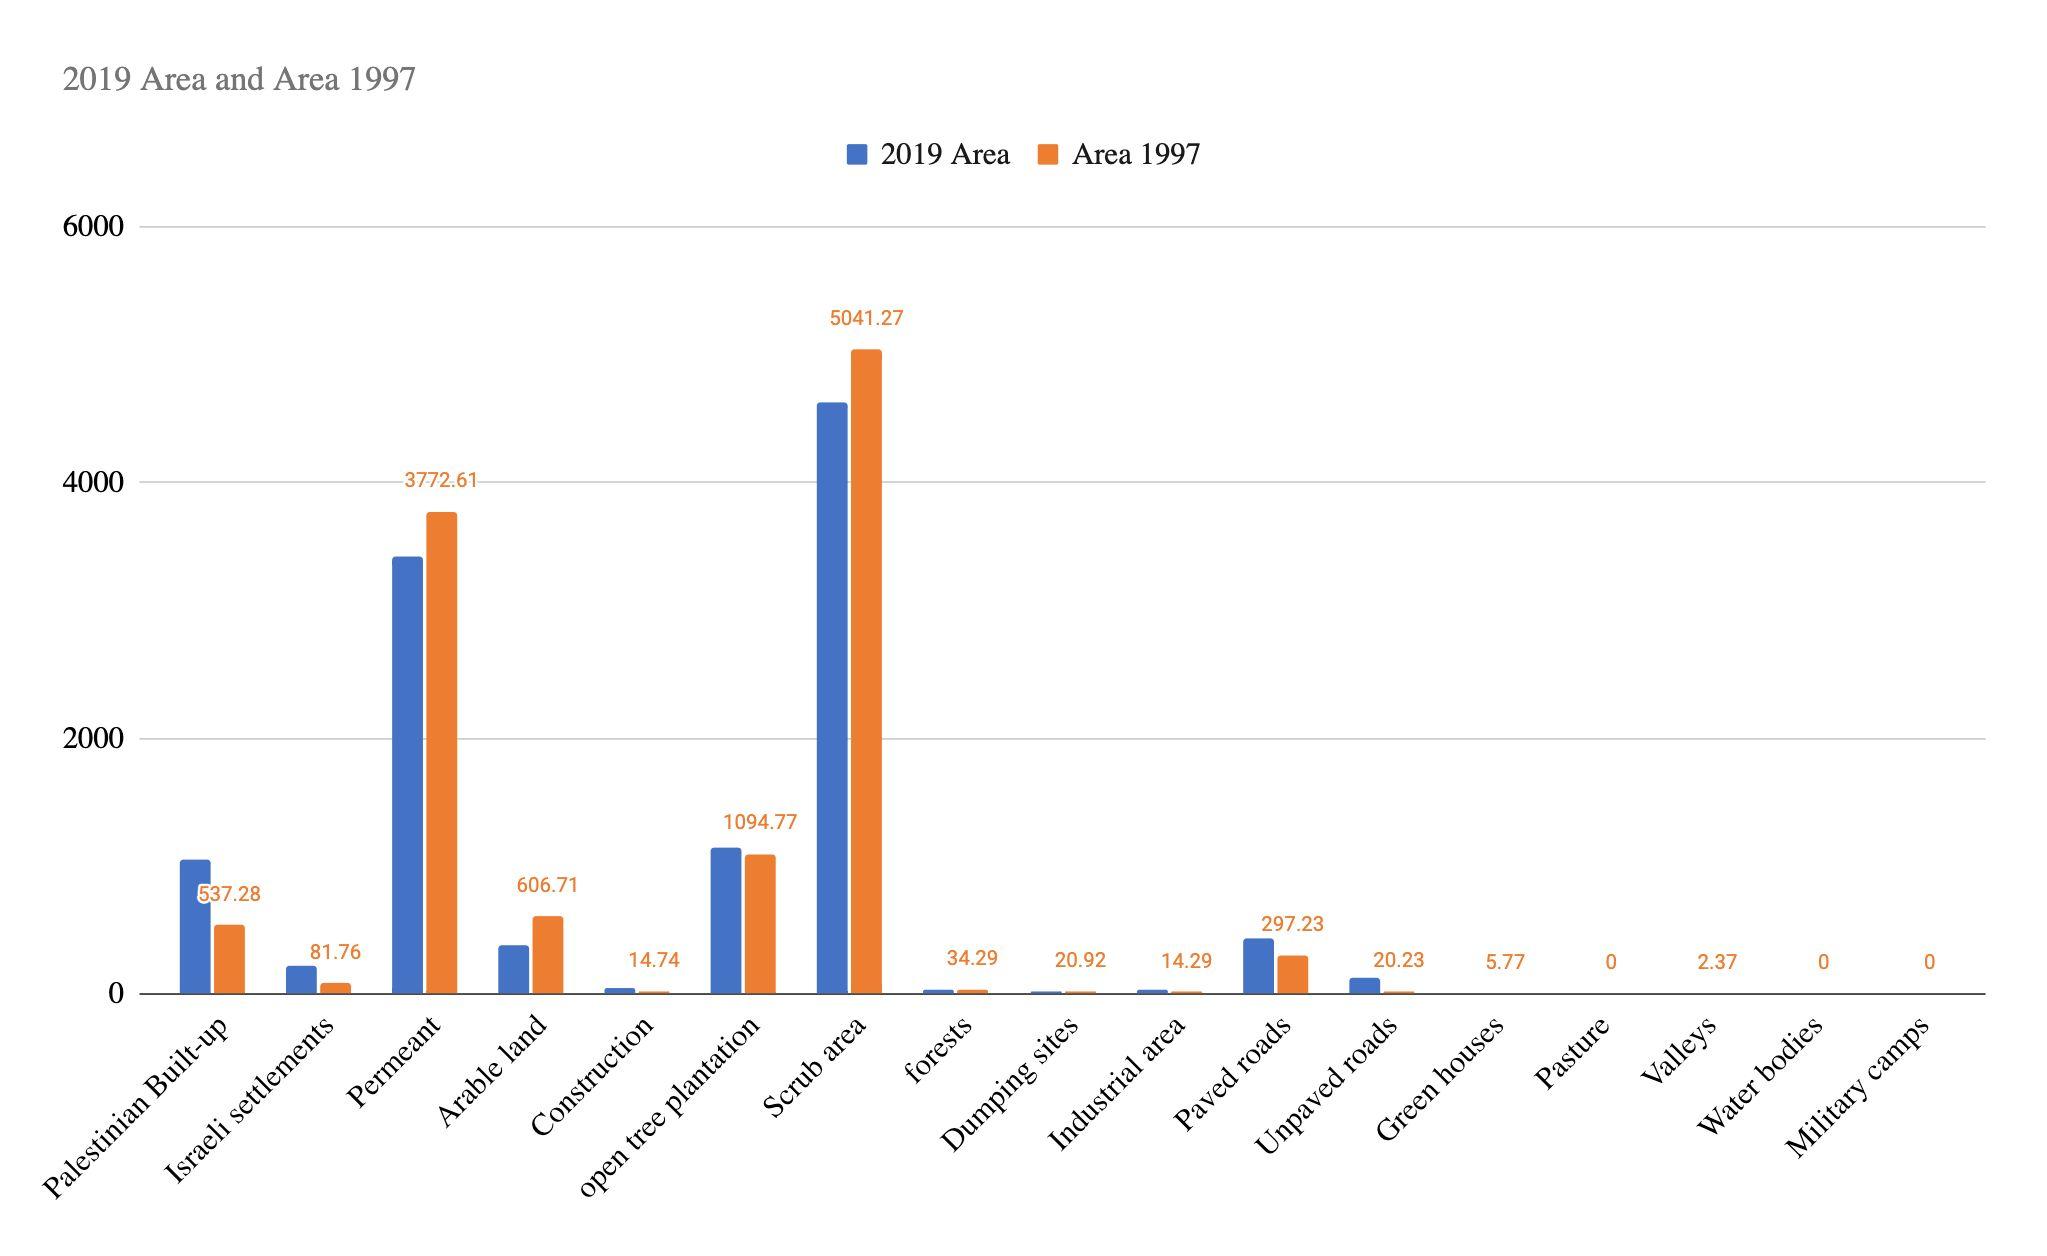
Landscape composition was quantified by means of the area covered by each class.
Gains and losses of area for the different landscape classes between the two time periods of 1997 and 2019, was generated to quantify the overall transitionmatrix.
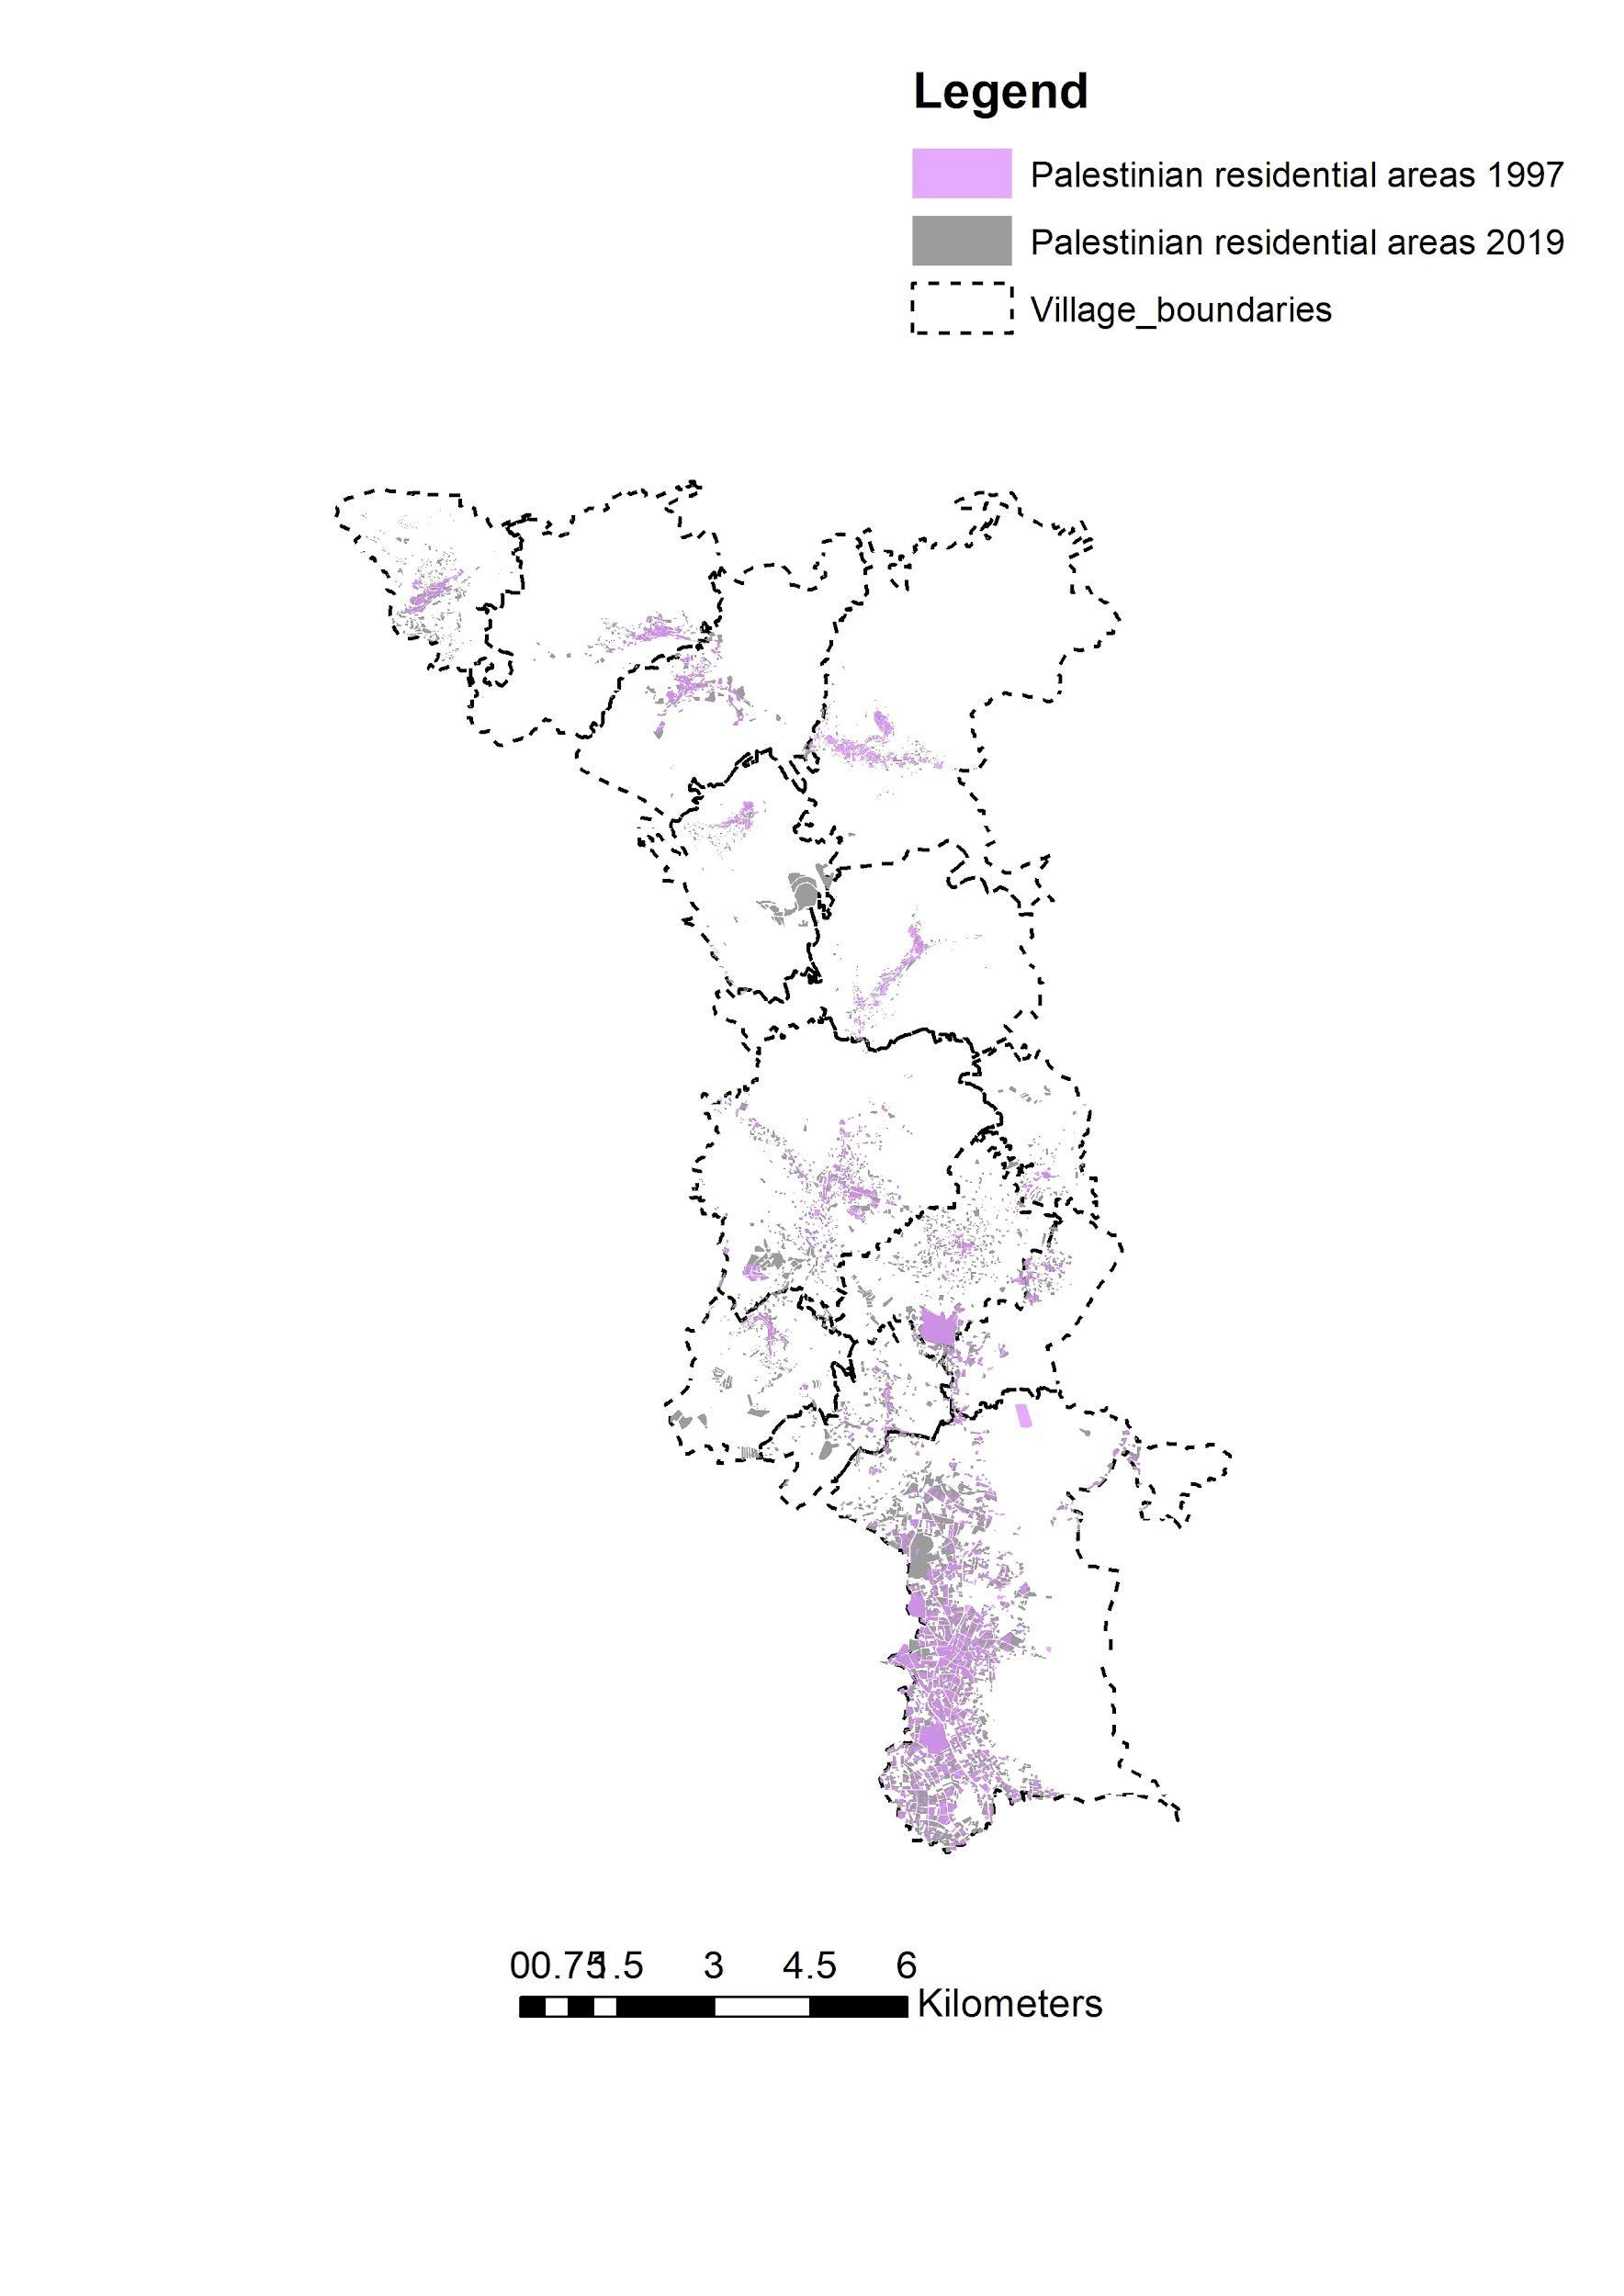
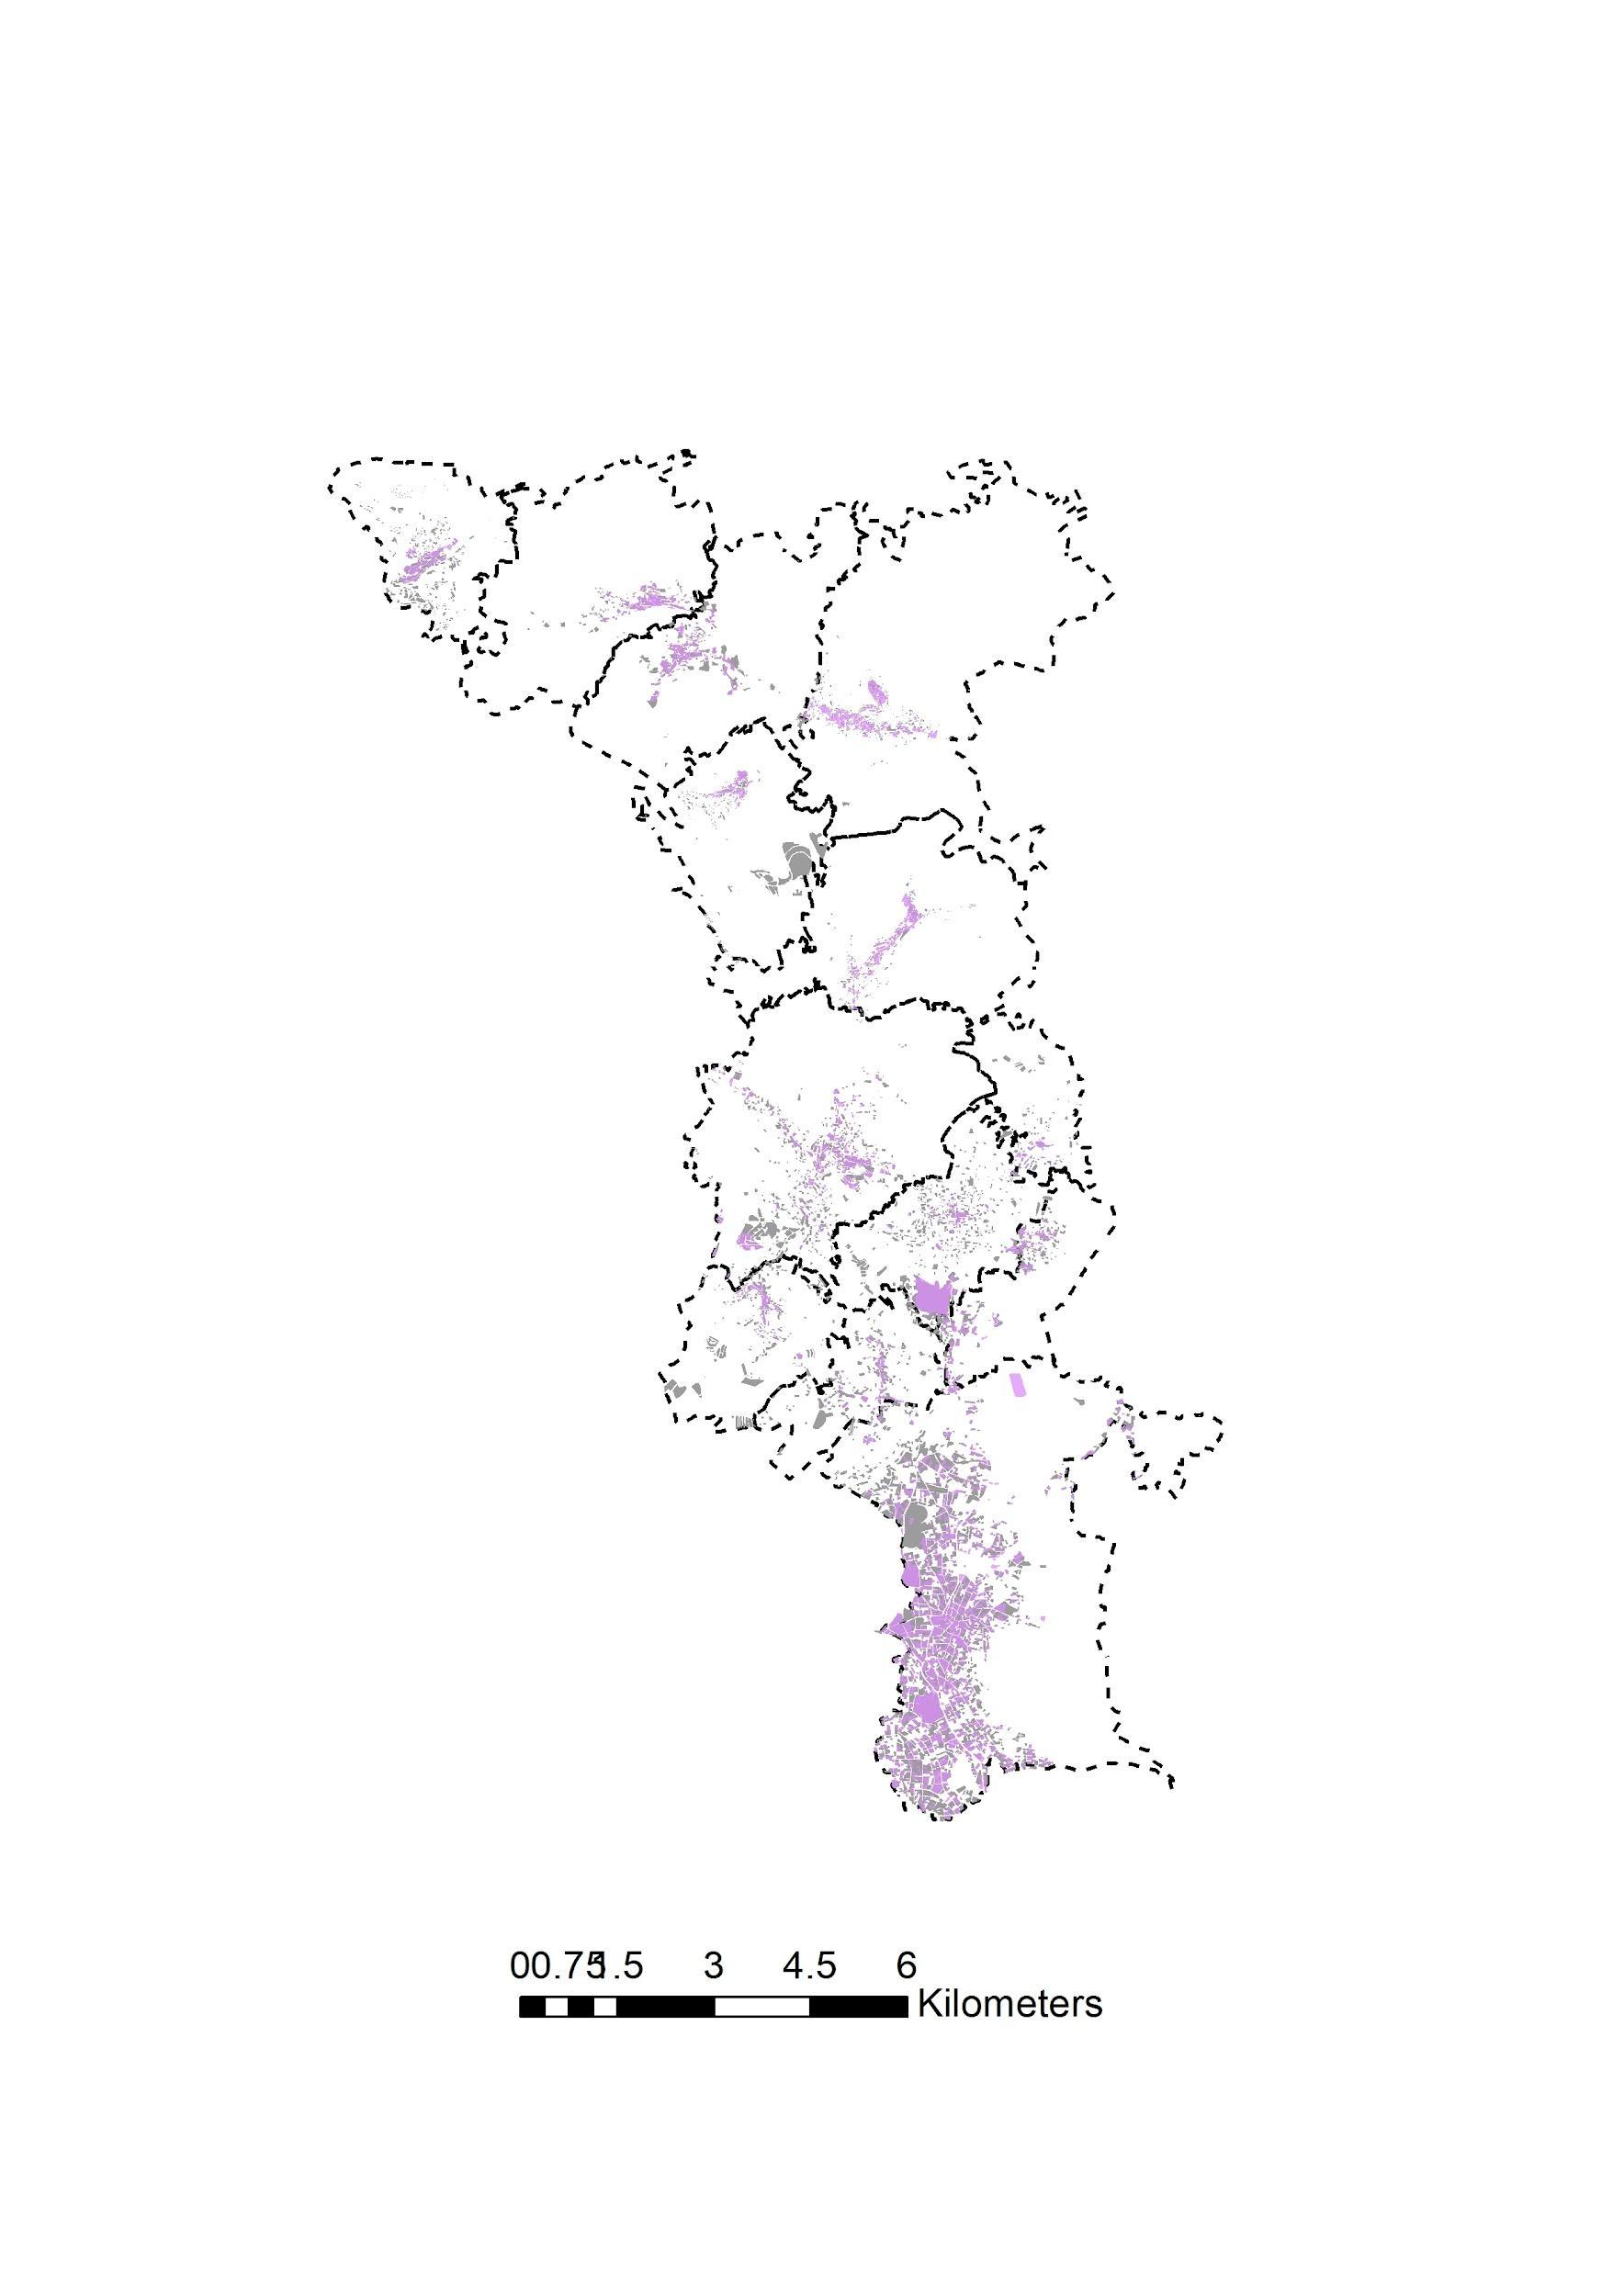
Map 8: Palestinian residential areas -overlay
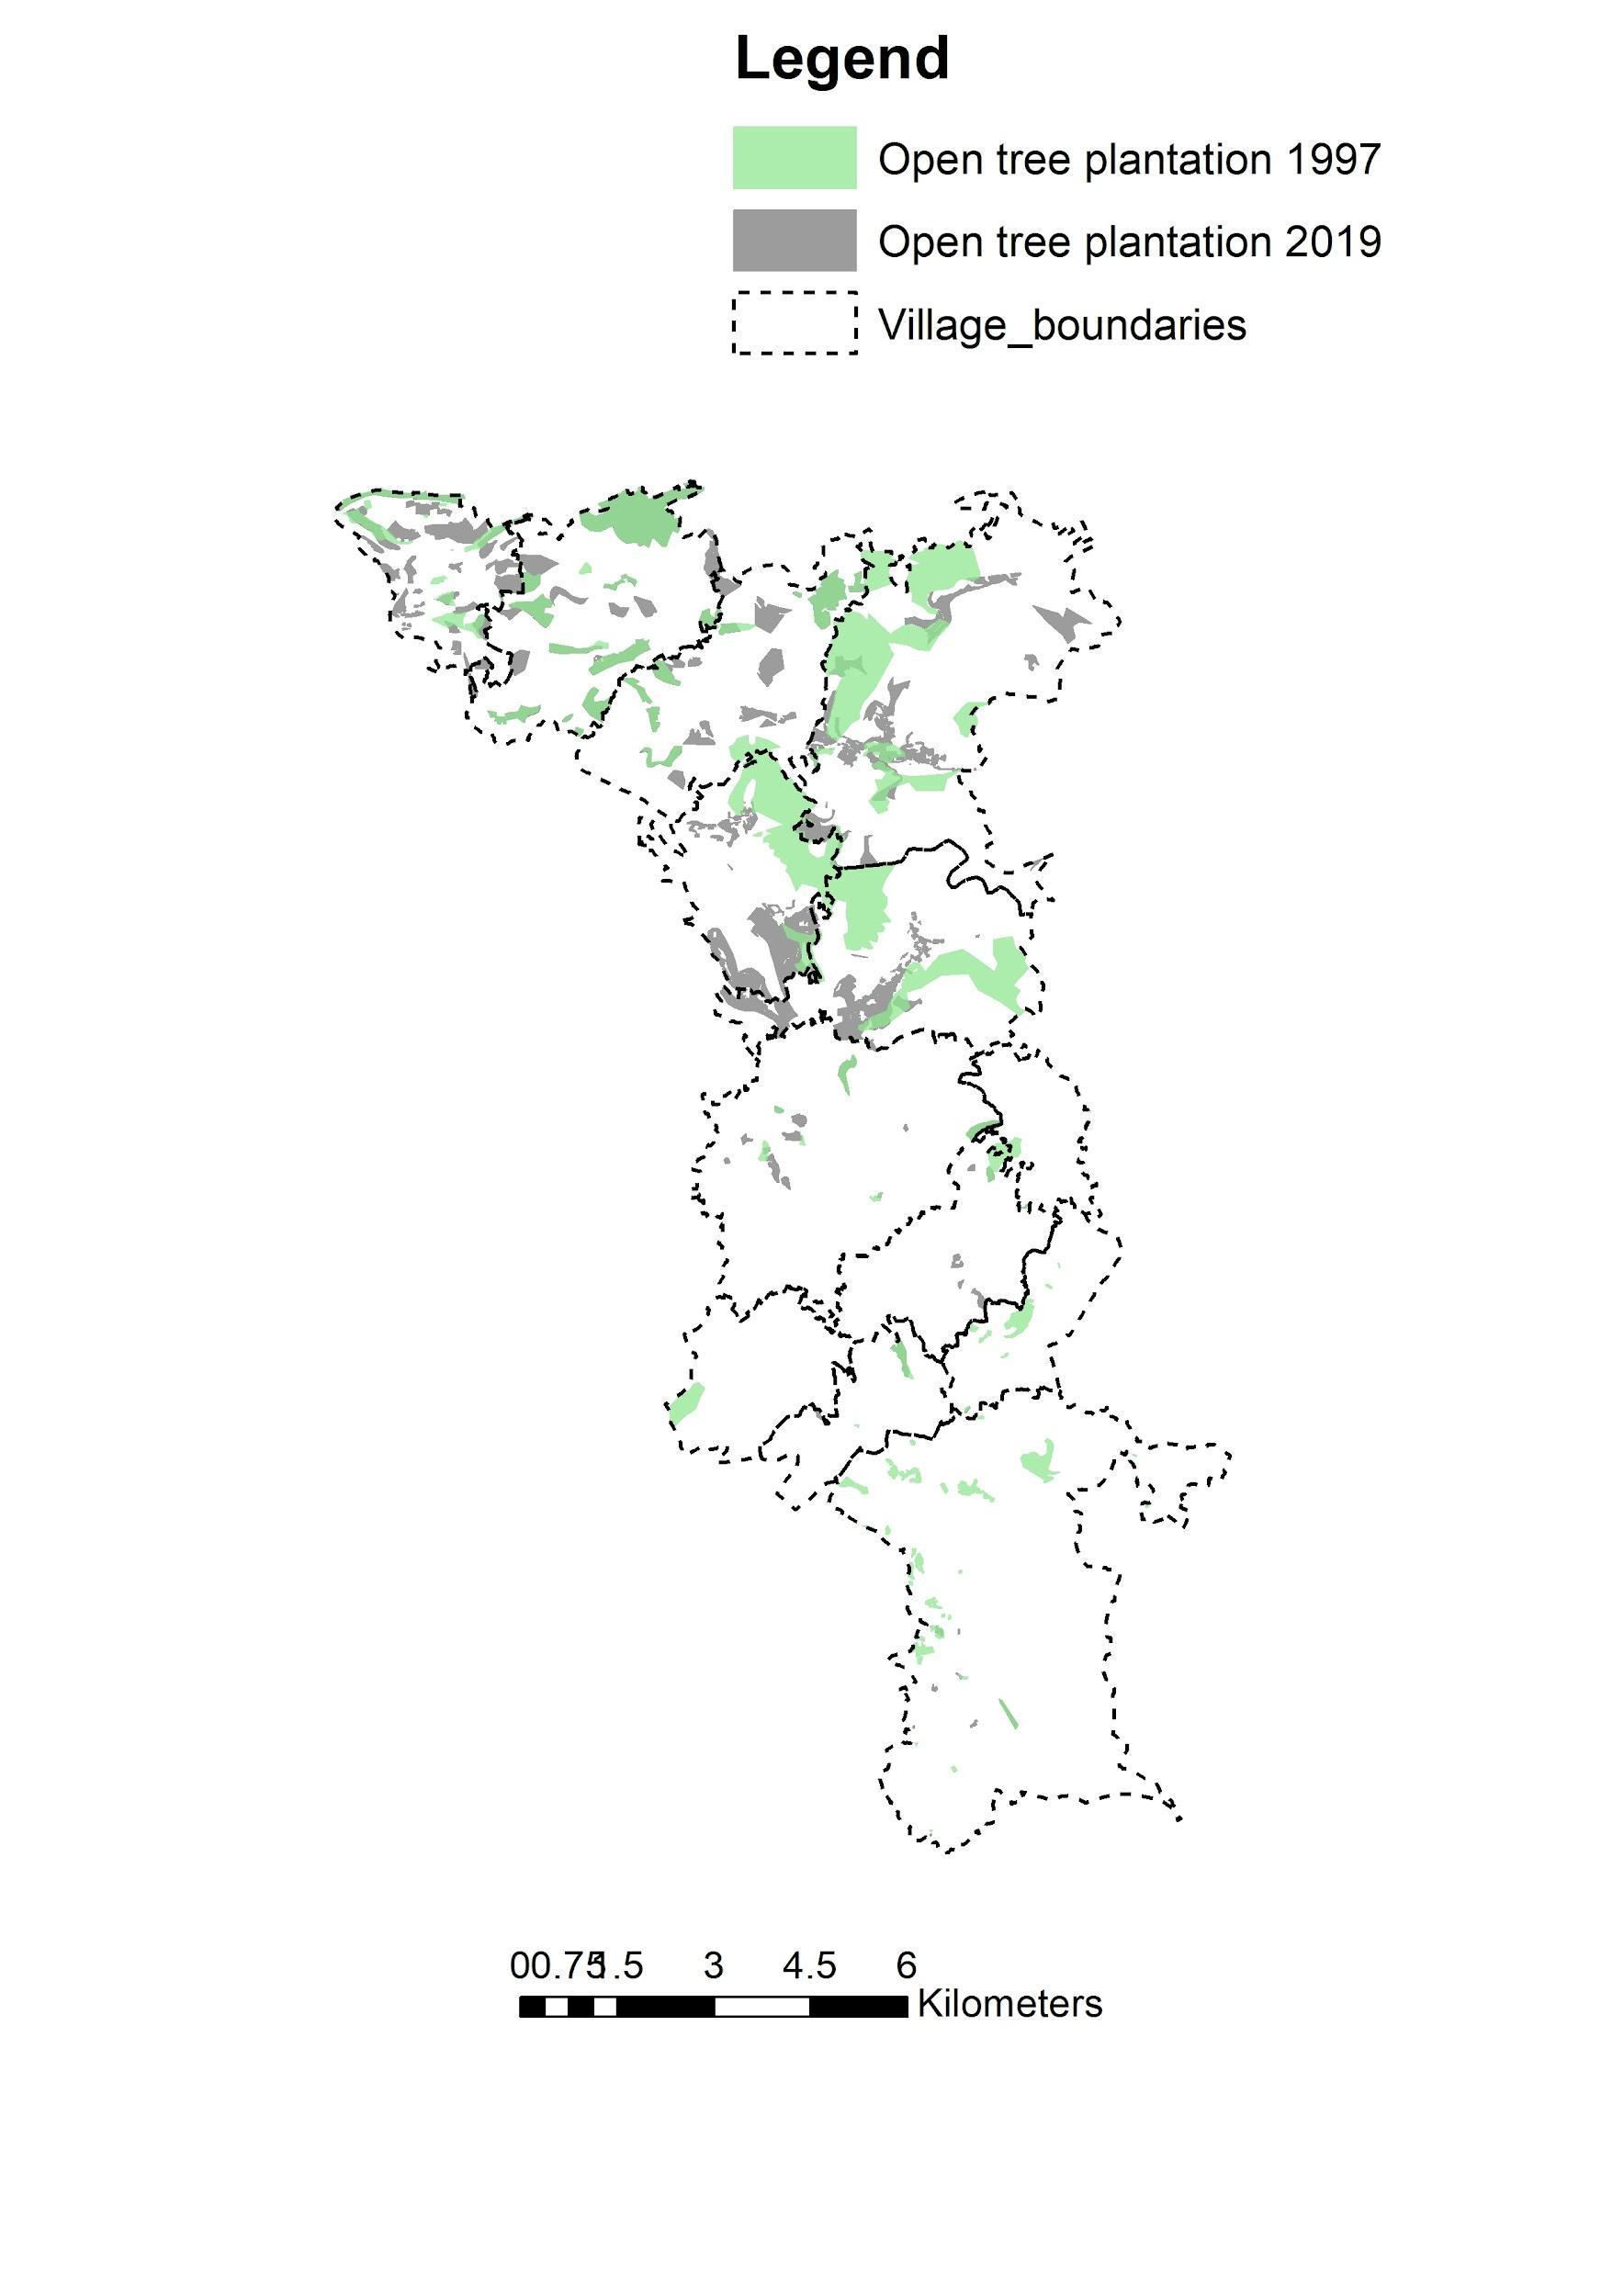
Map 7: Open tree plantation-overlay
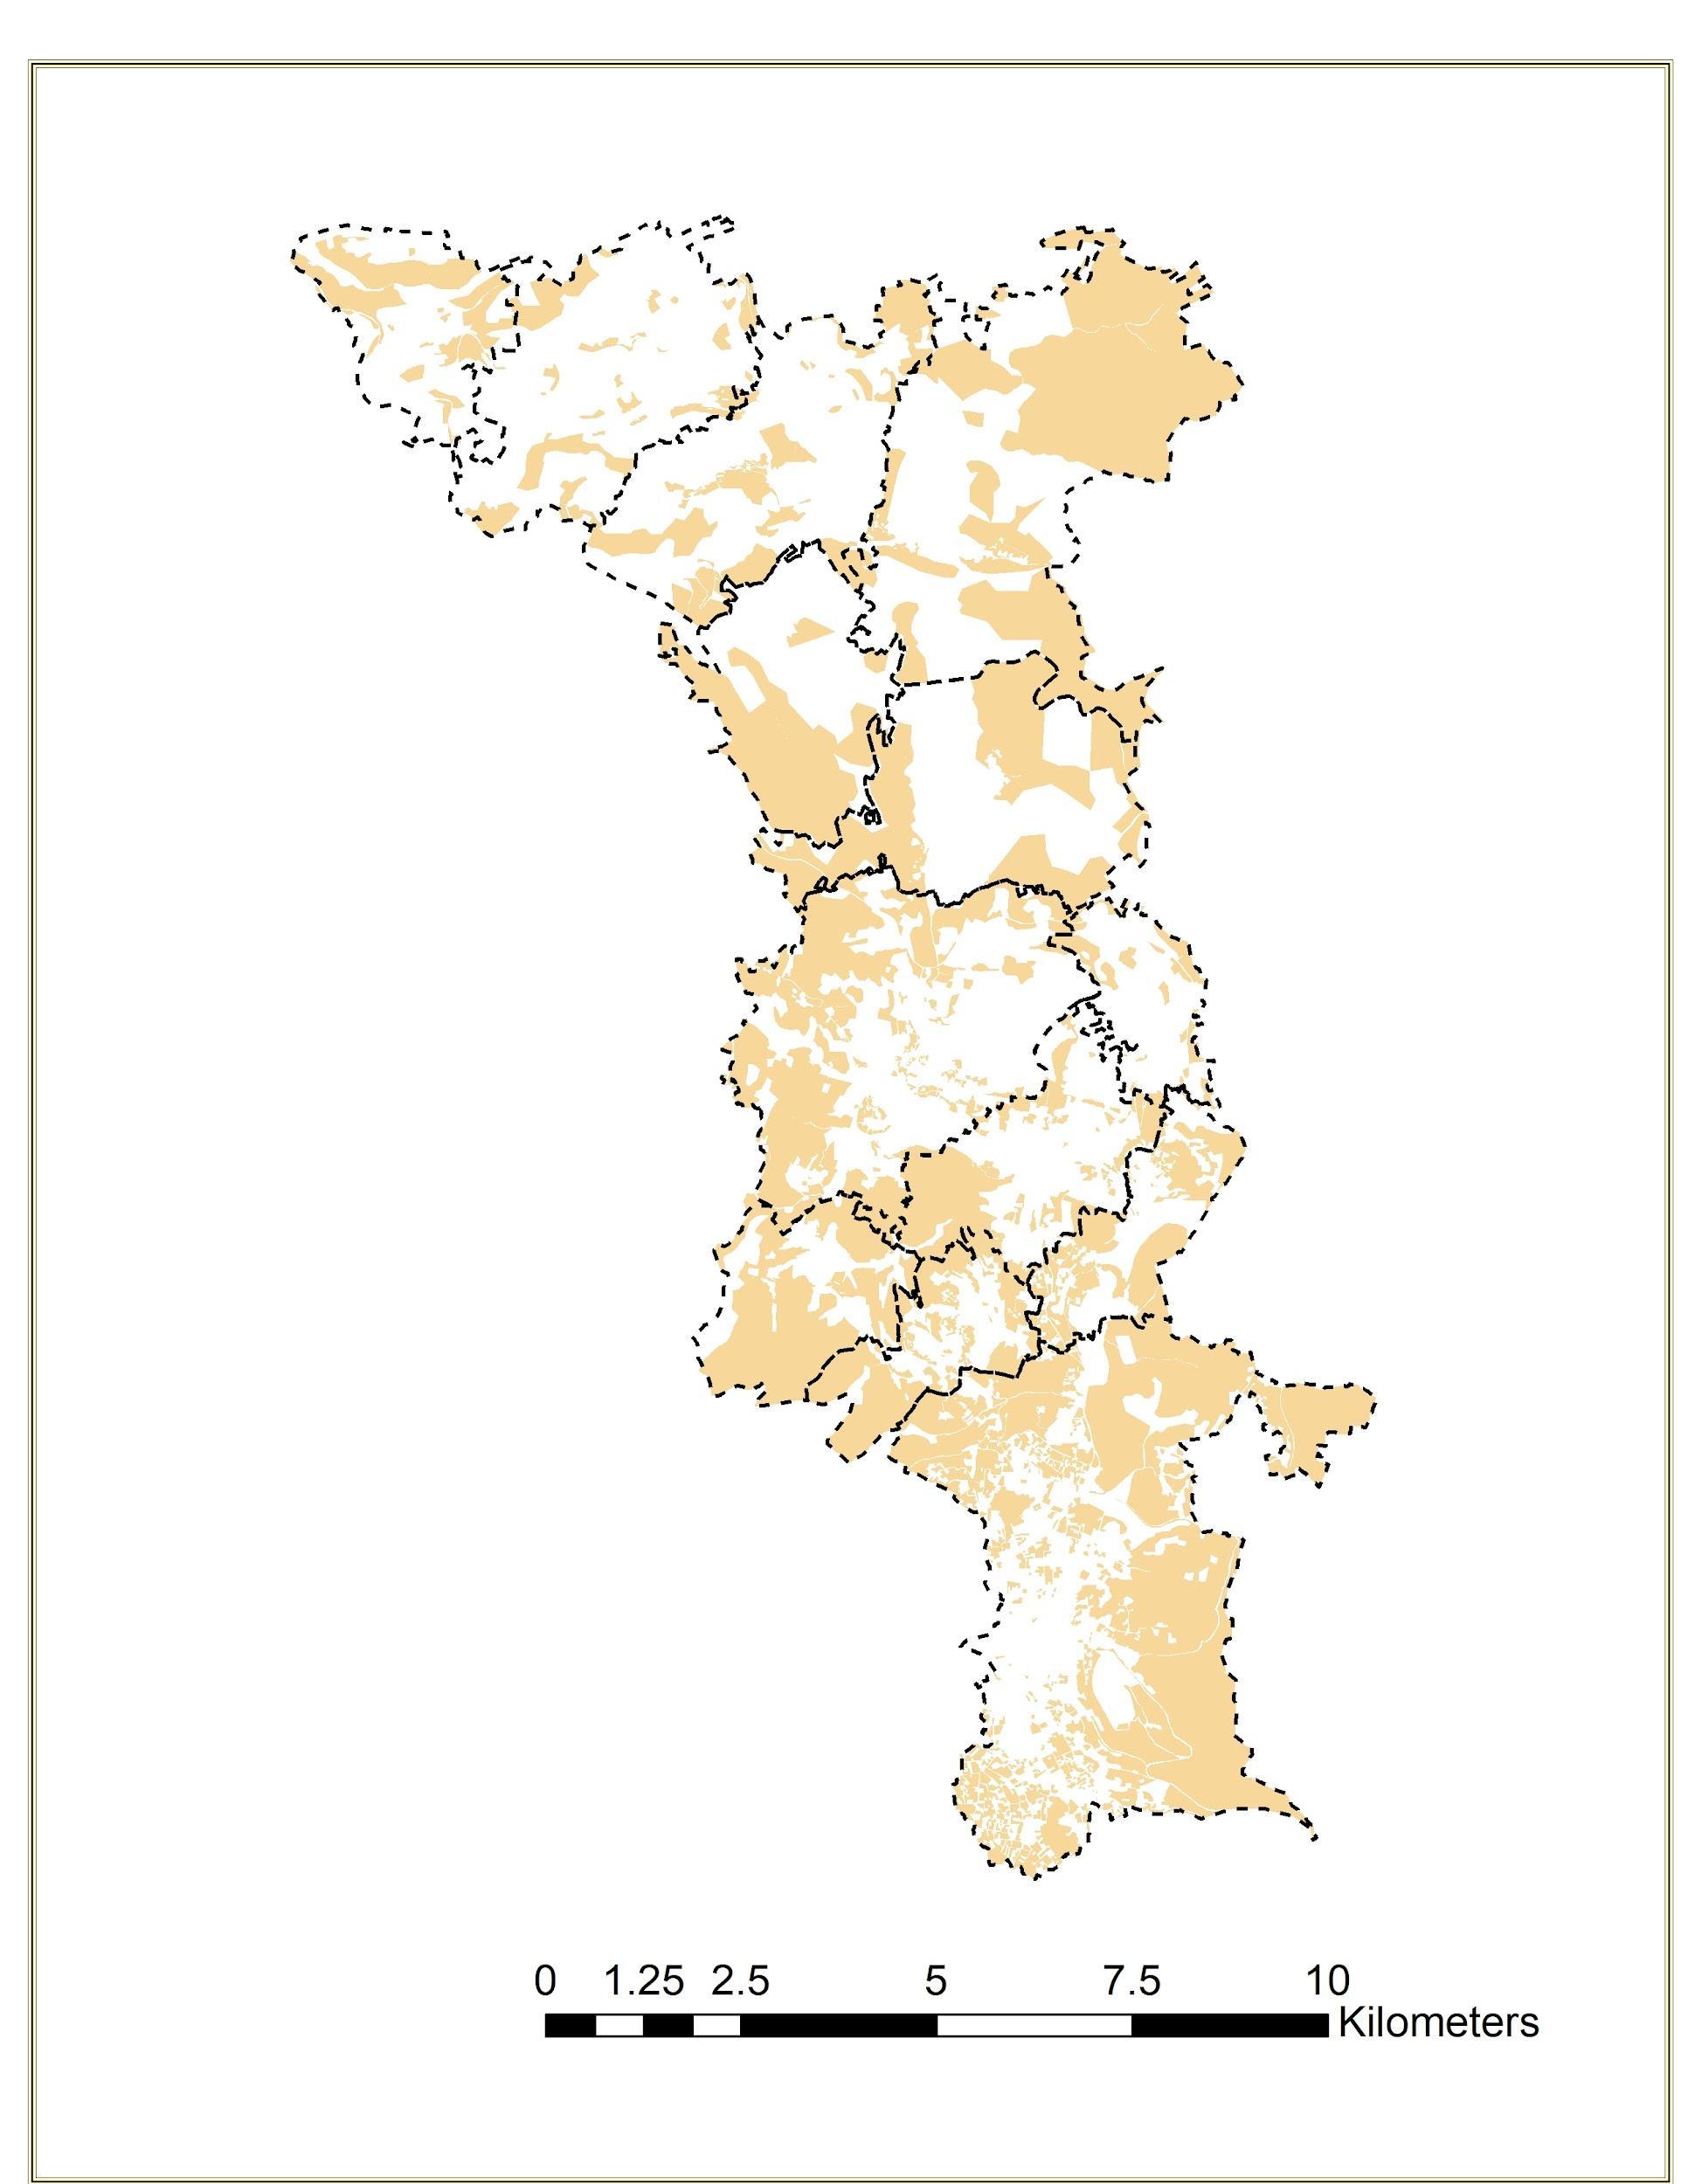
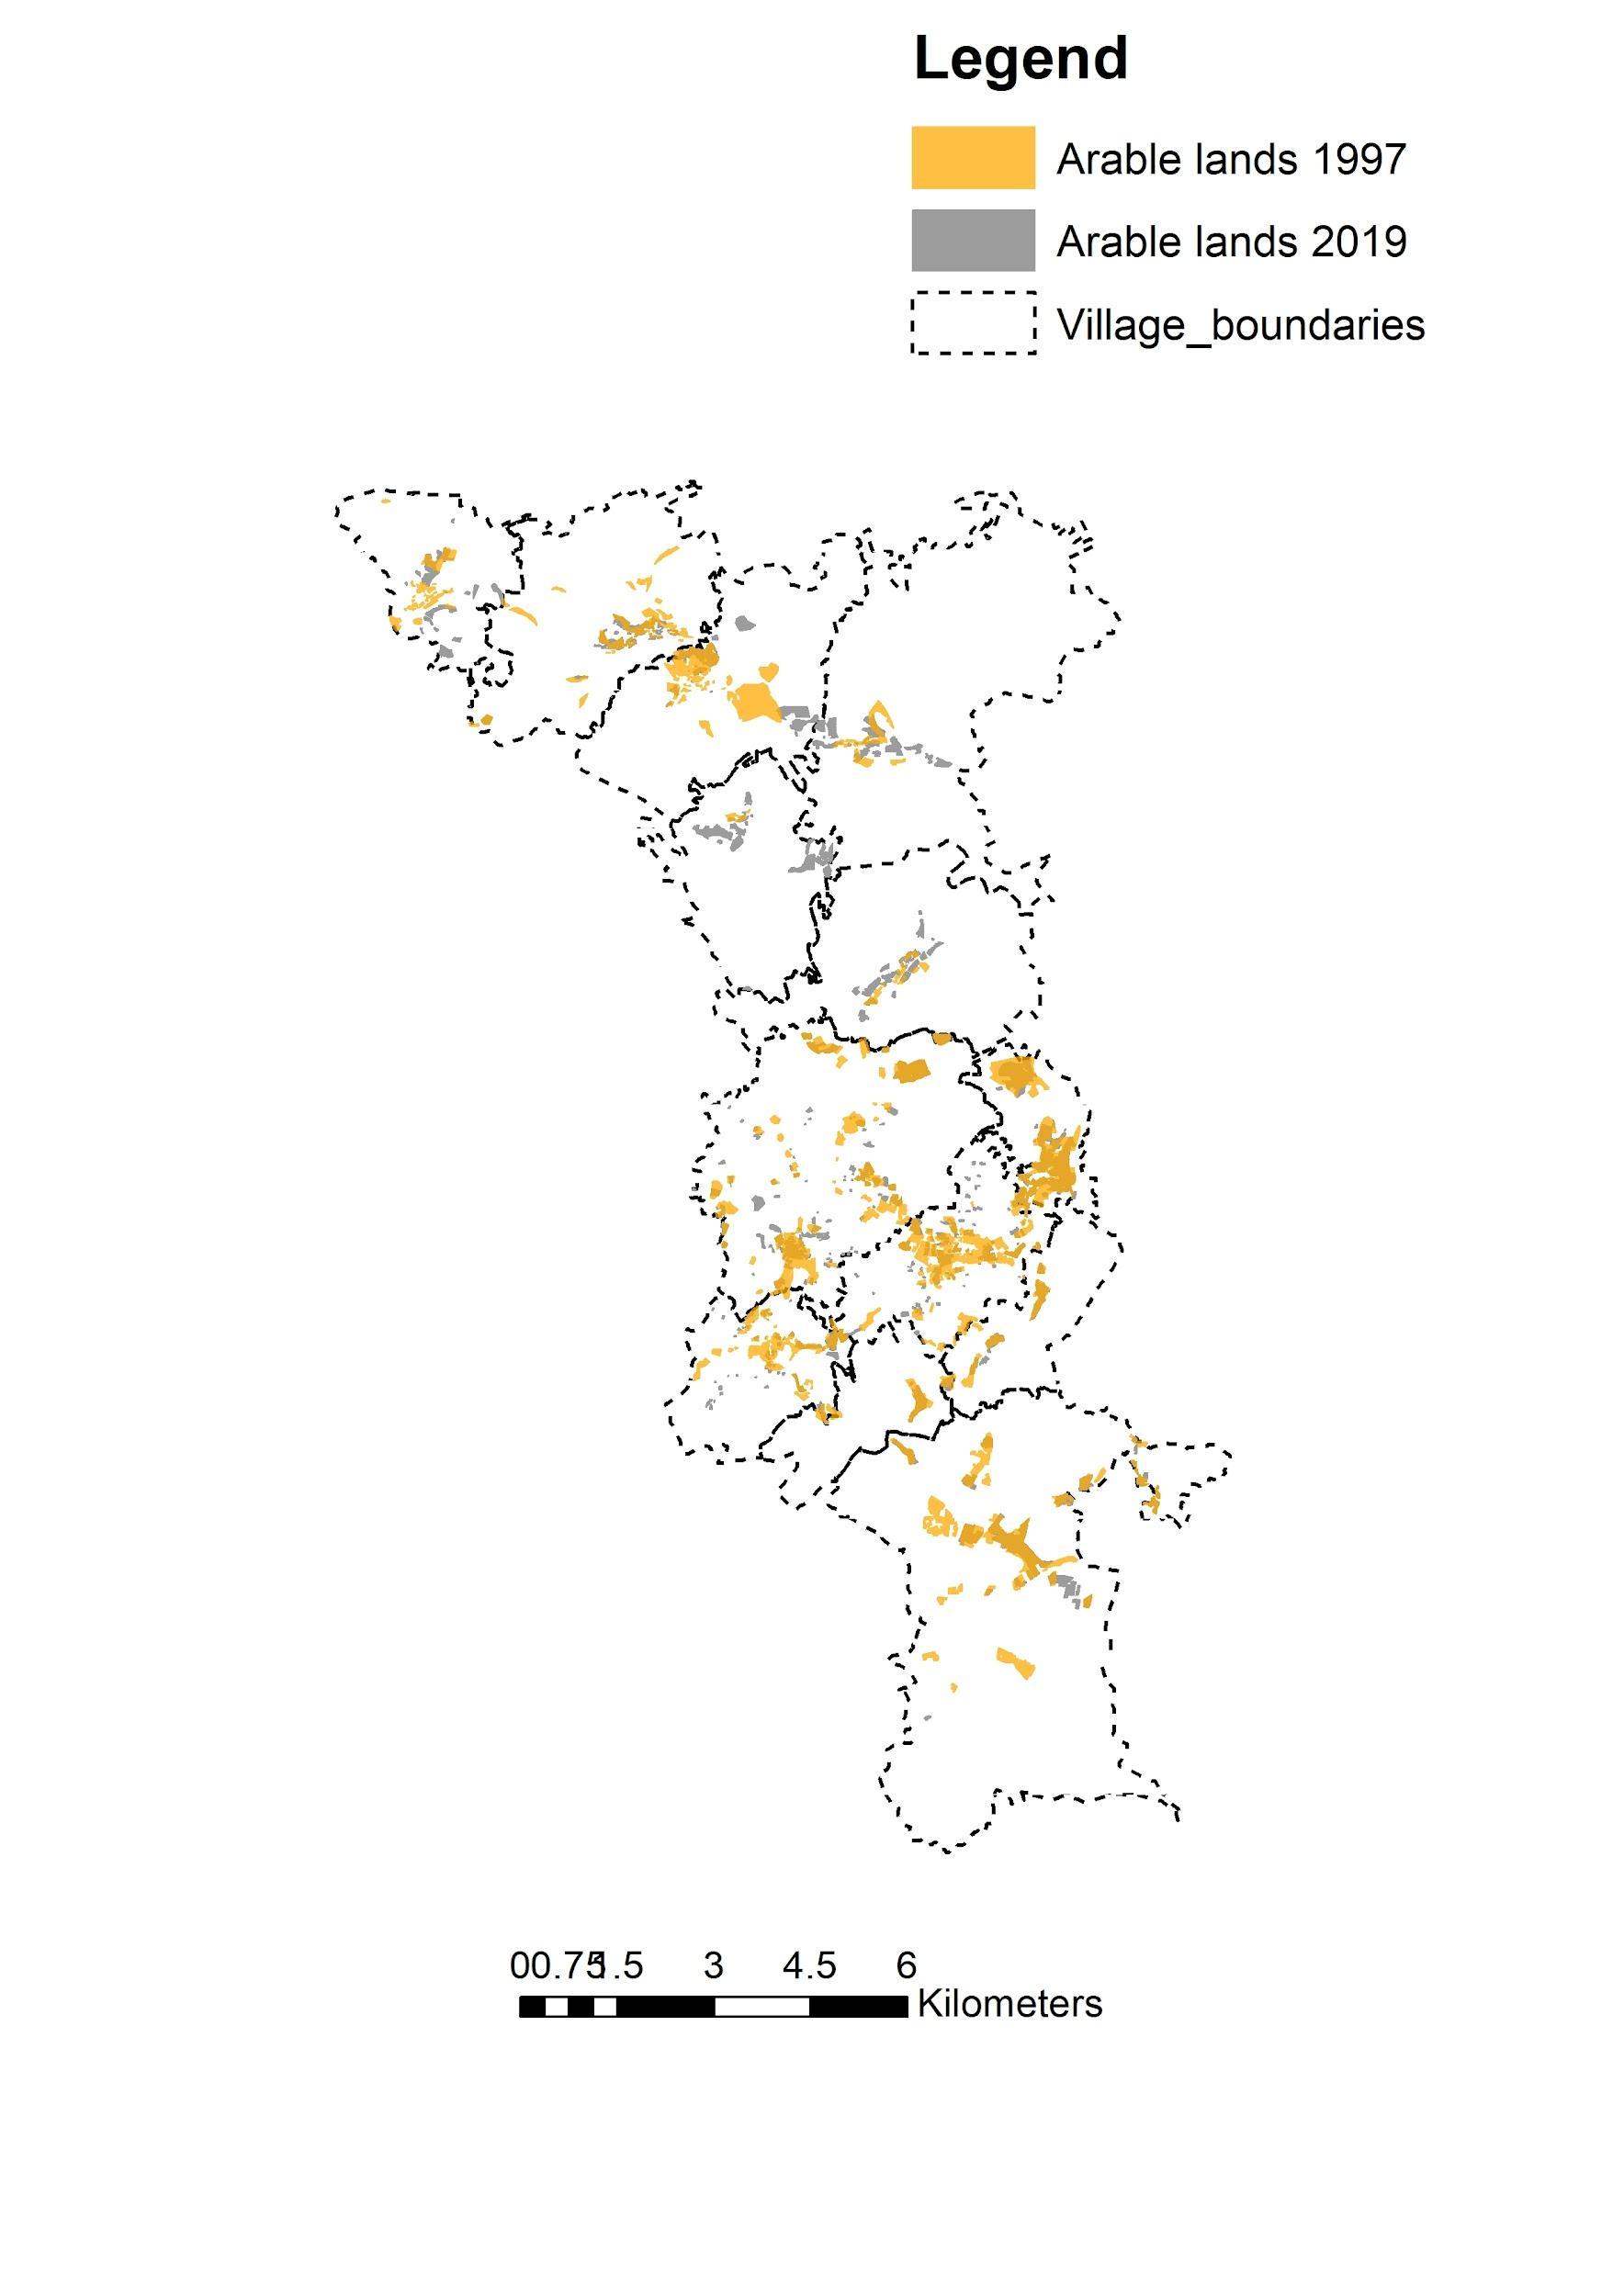
Arable lands -Overlay
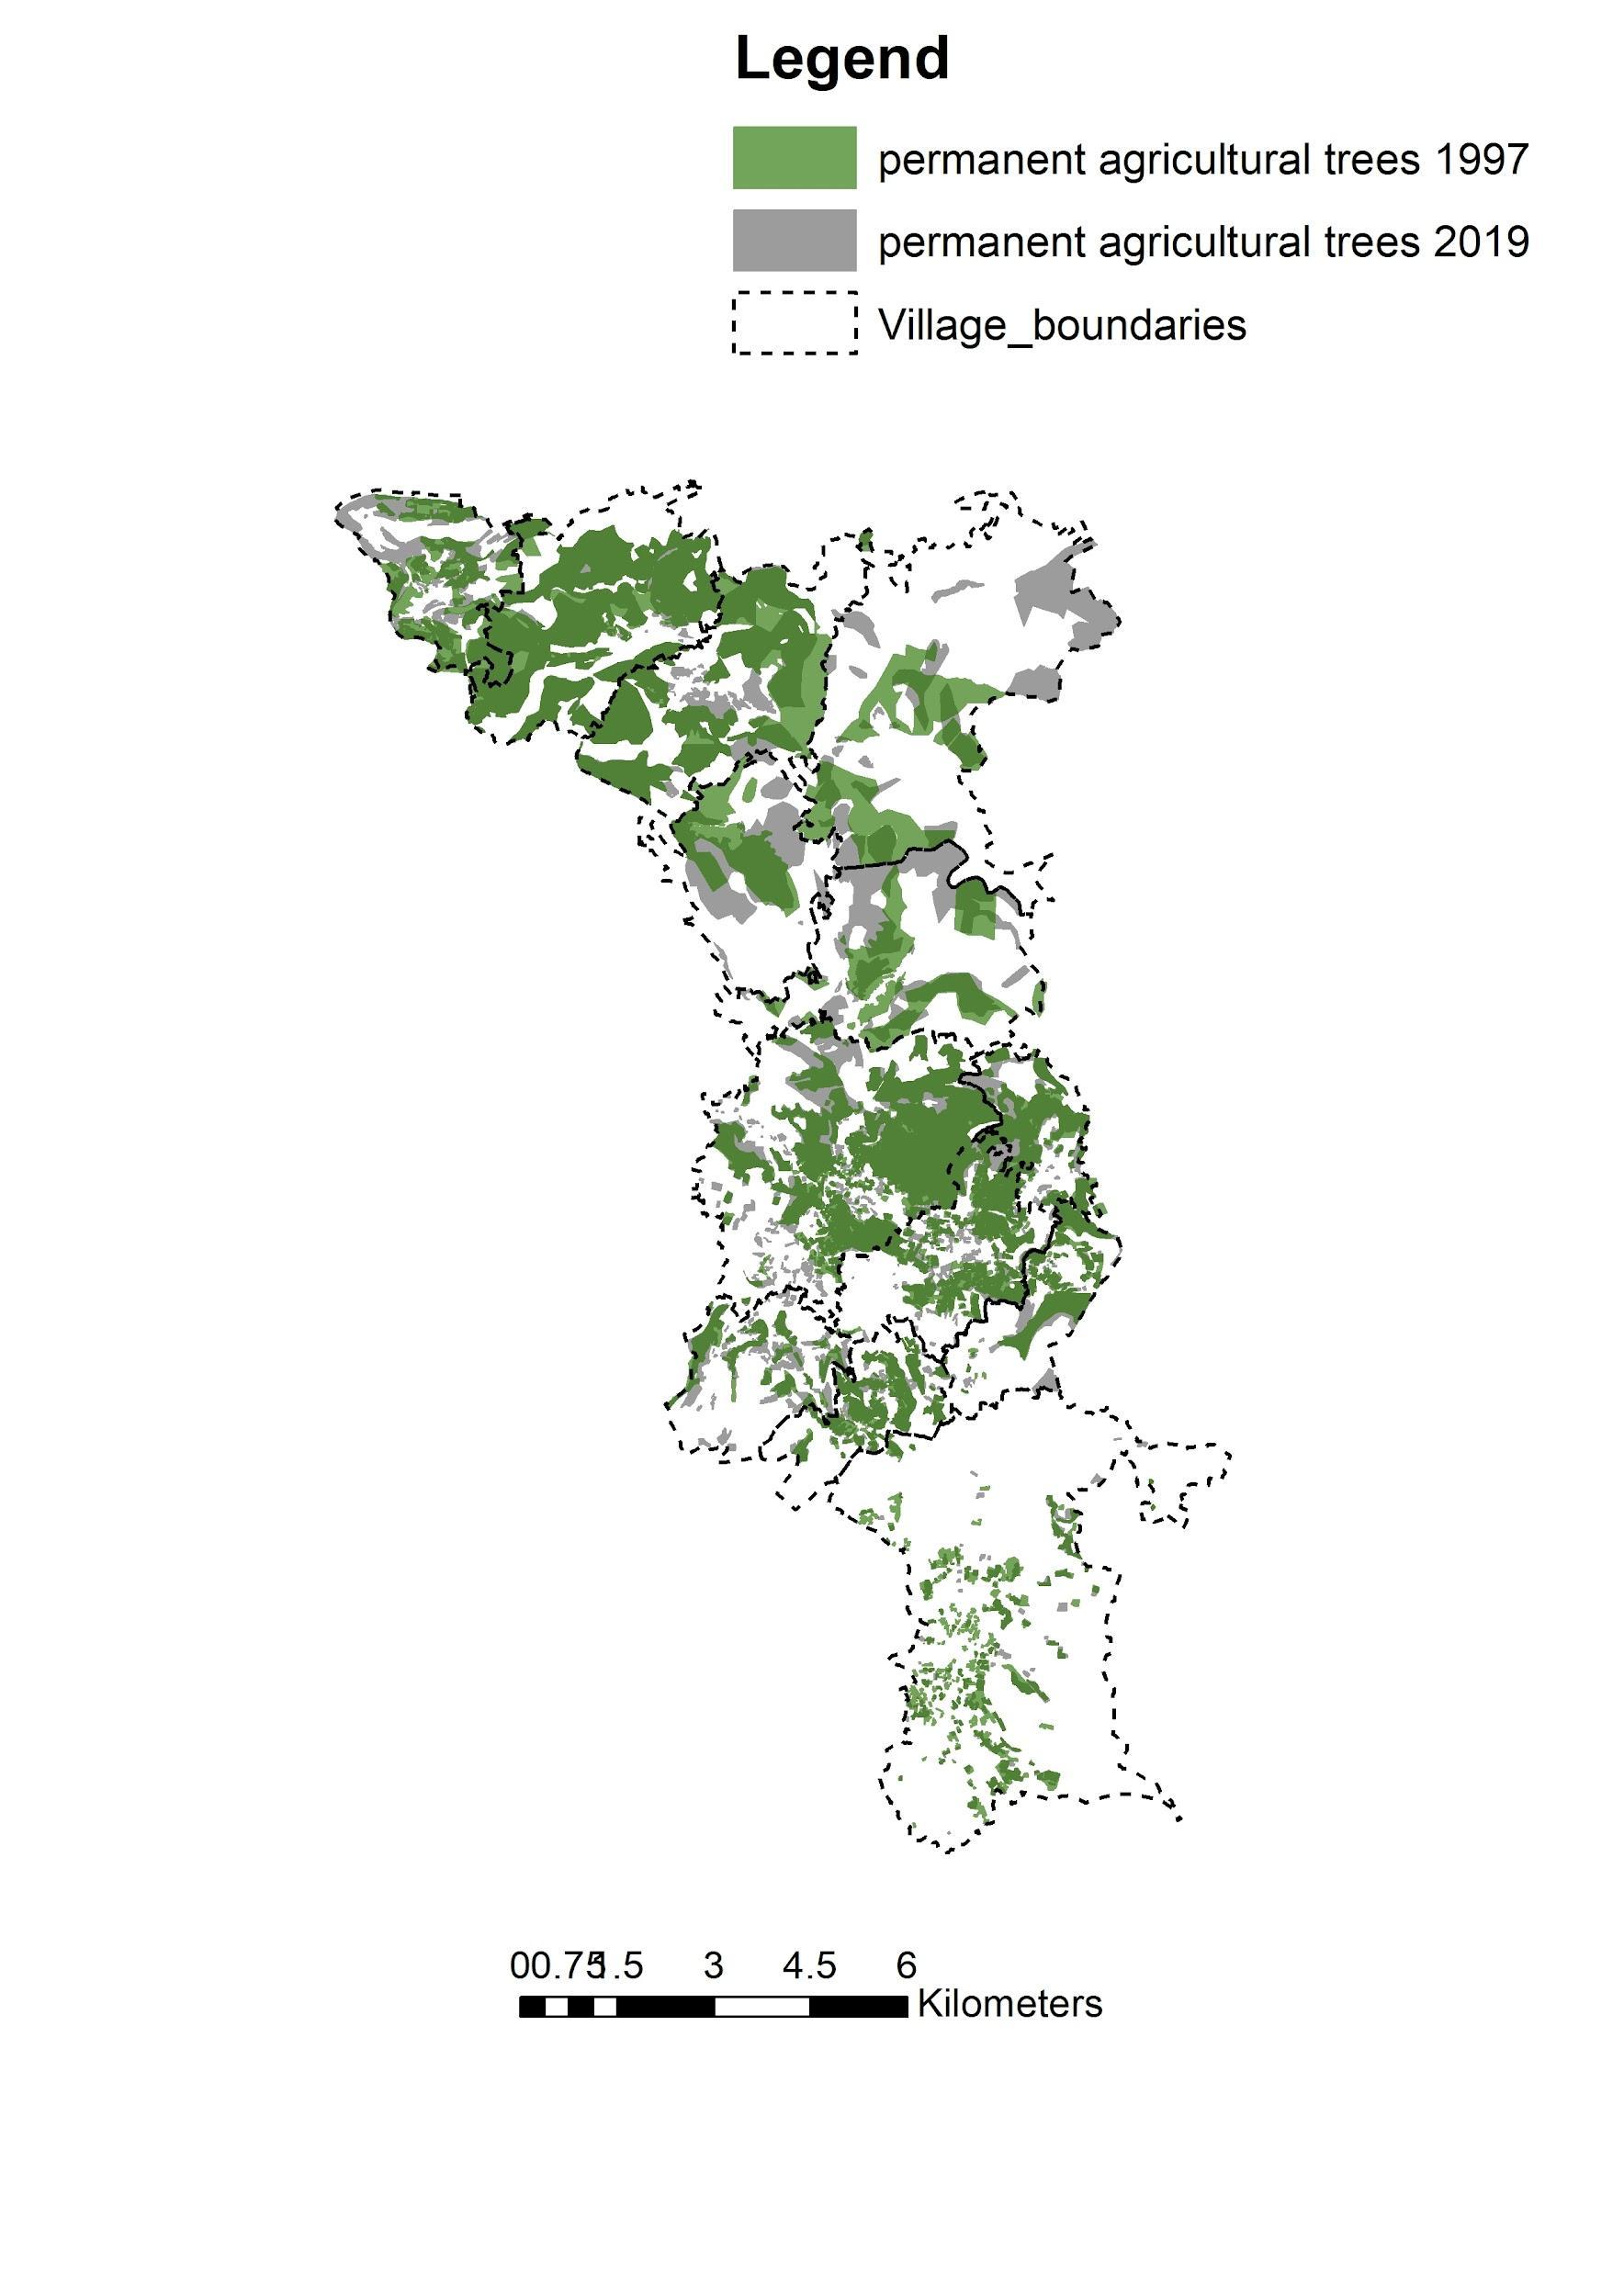
Permanent agricultural trees- Overlay
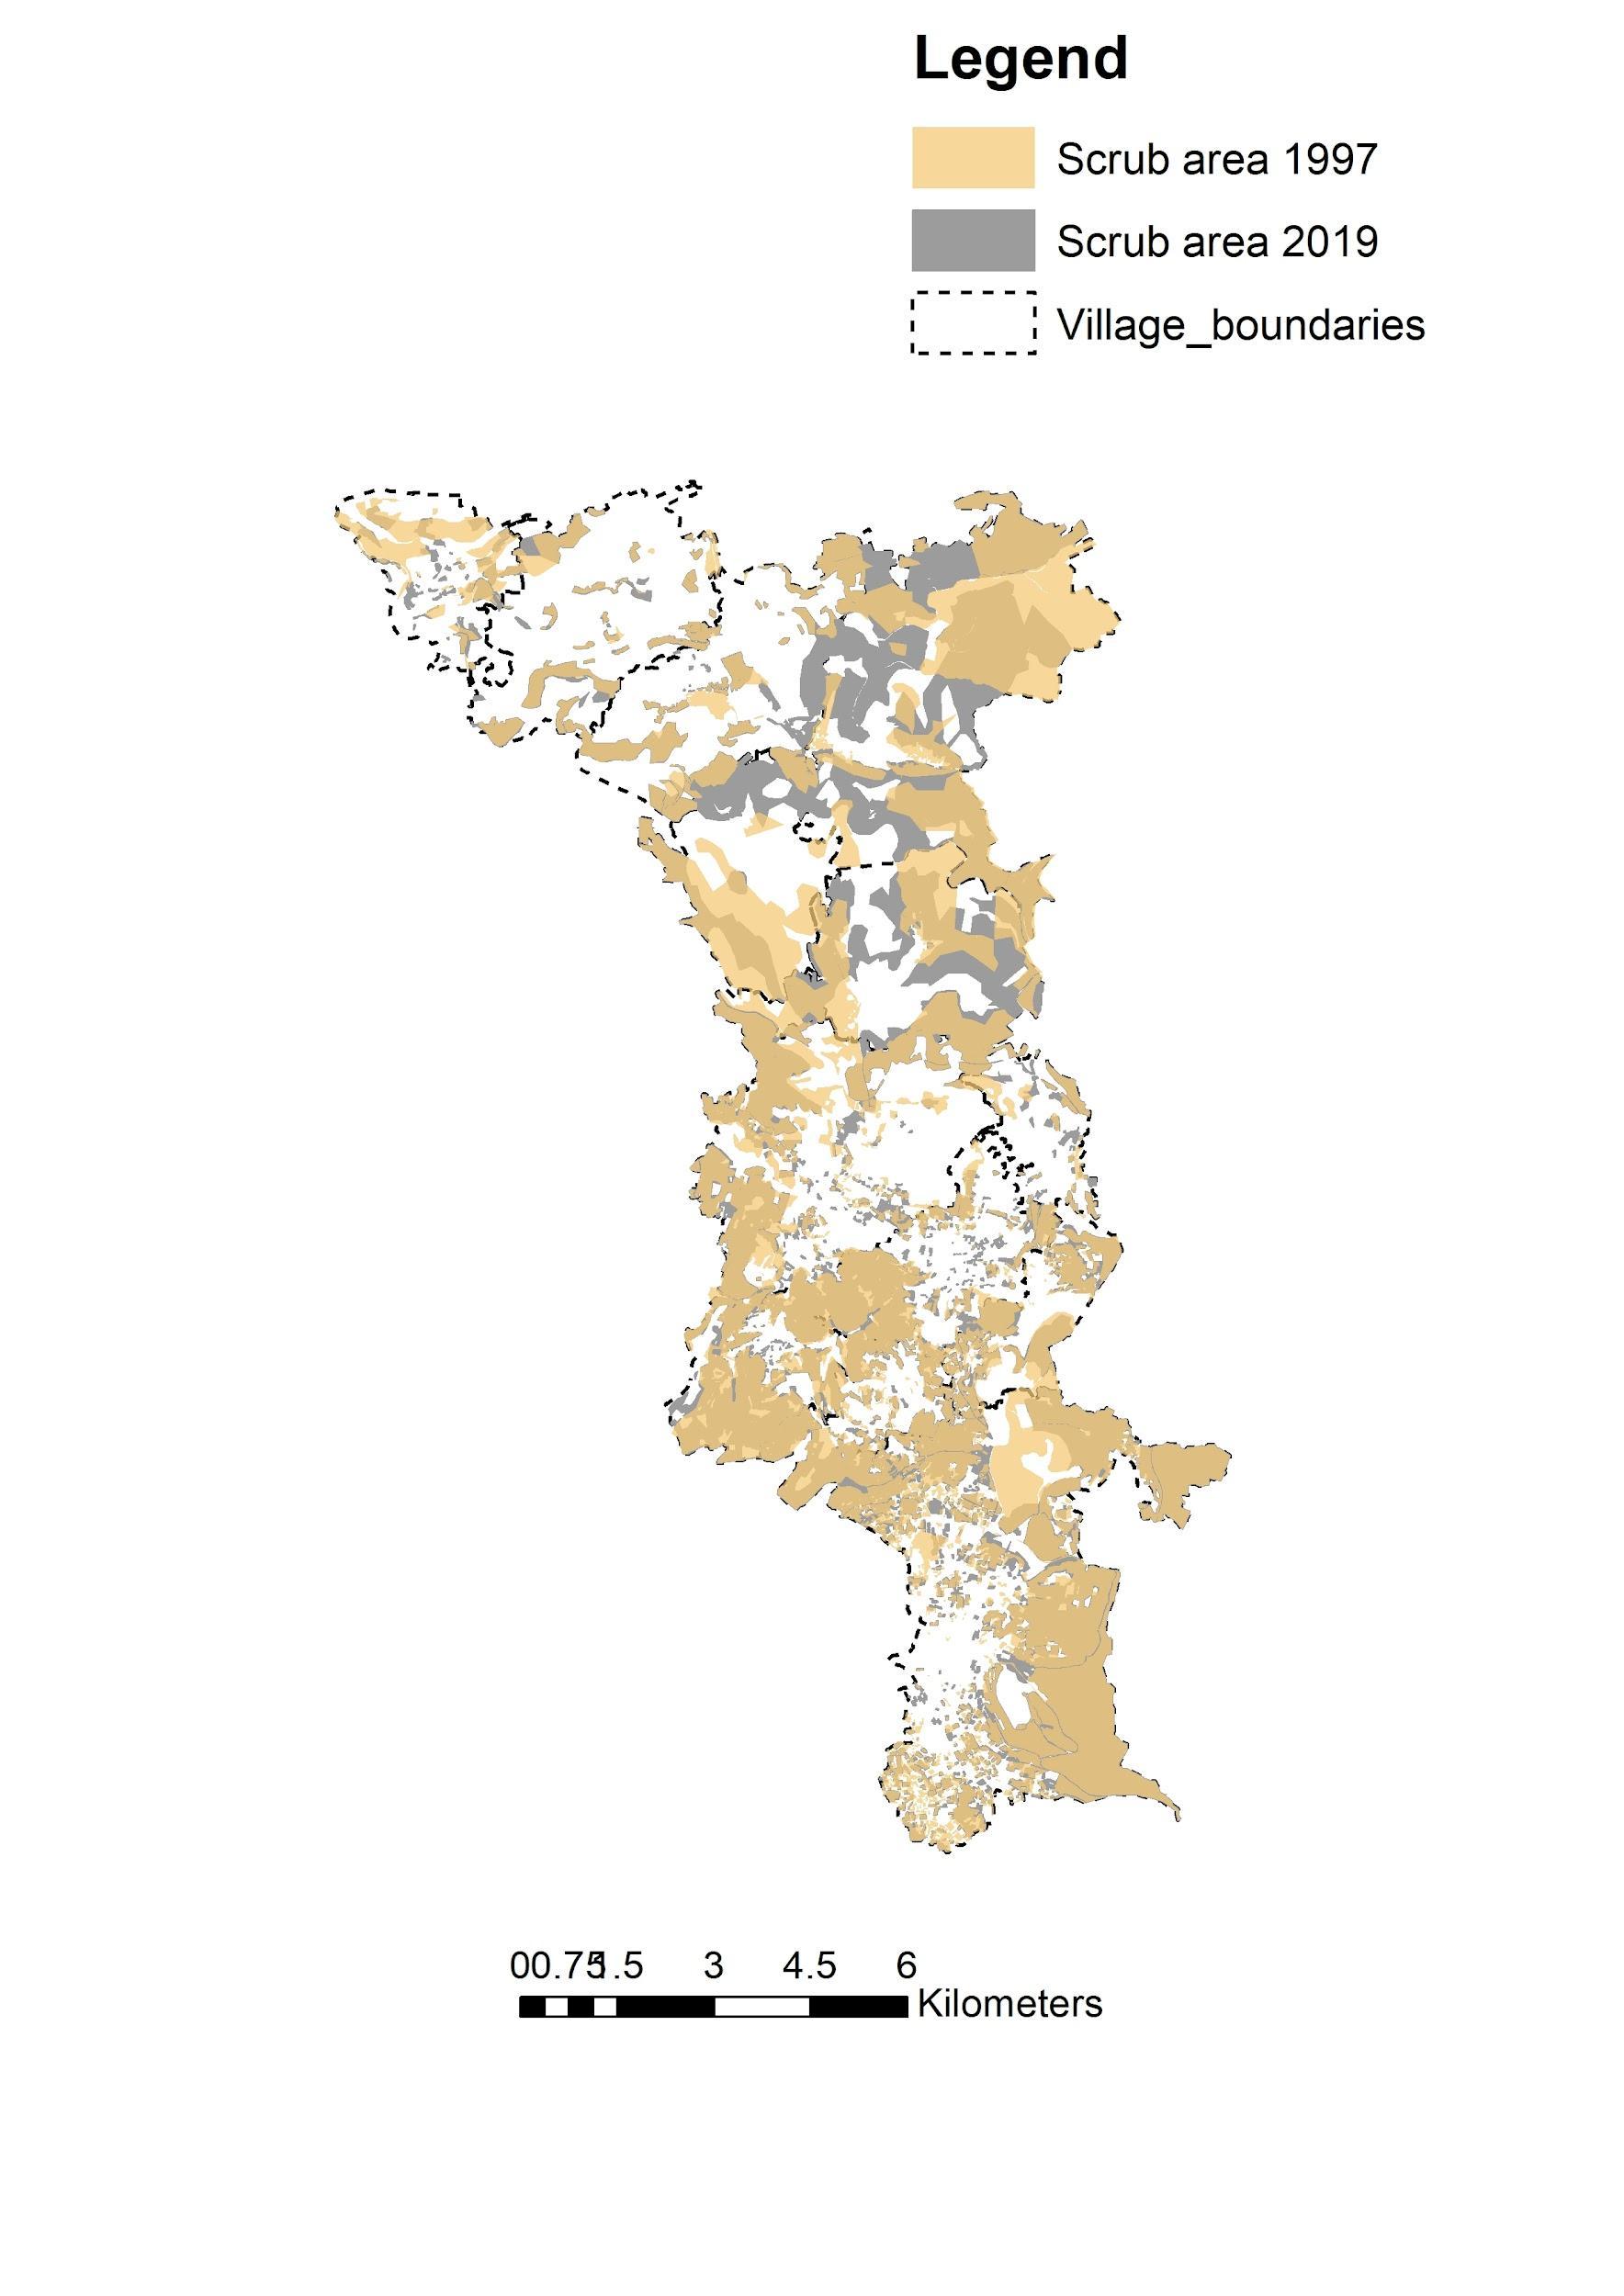
Map 9 :Scrub area -Overlay
Map 10:Arable lands -Overlay Map 11 :Permanent agricultural trees -Overlay
LANDSCAPE COMPOSITION
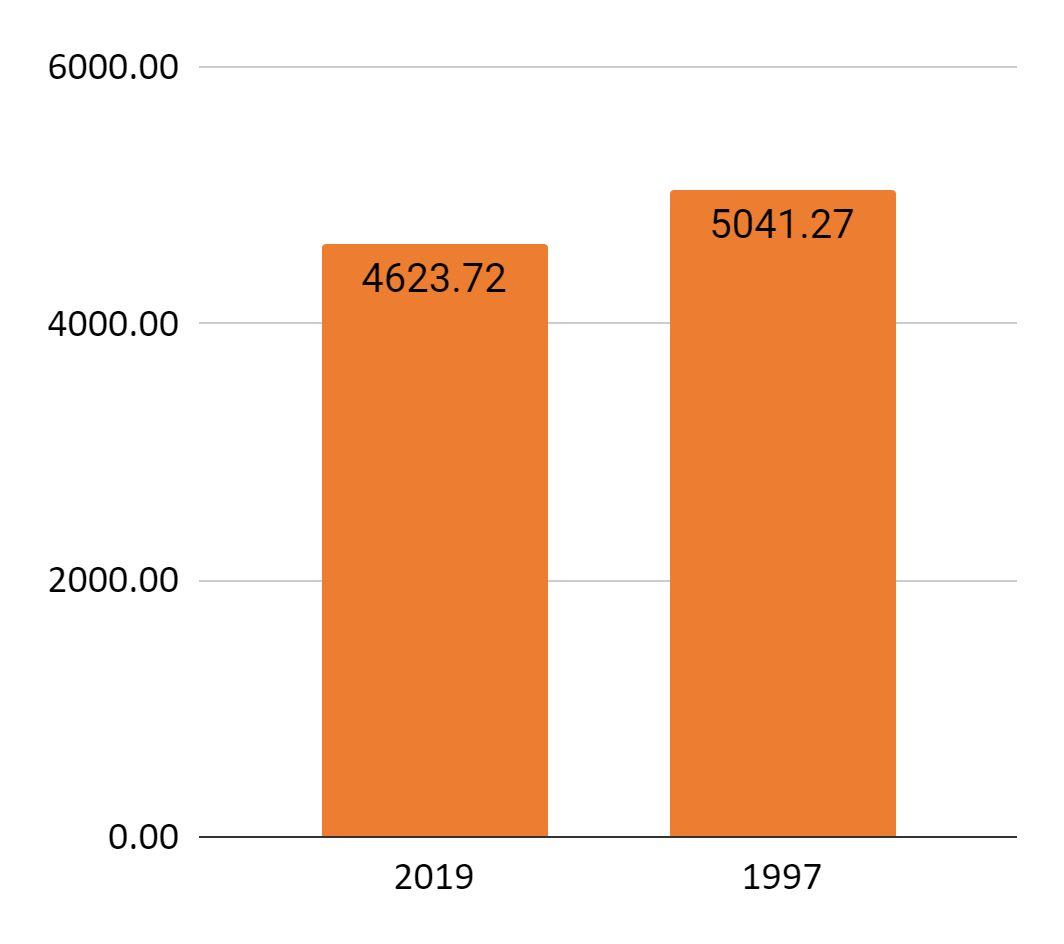
In year 1997,the dominant class was the scrub area.The scrub area in the chosen site was regarded as the matrix, within which patches of other landscape classes could be found.
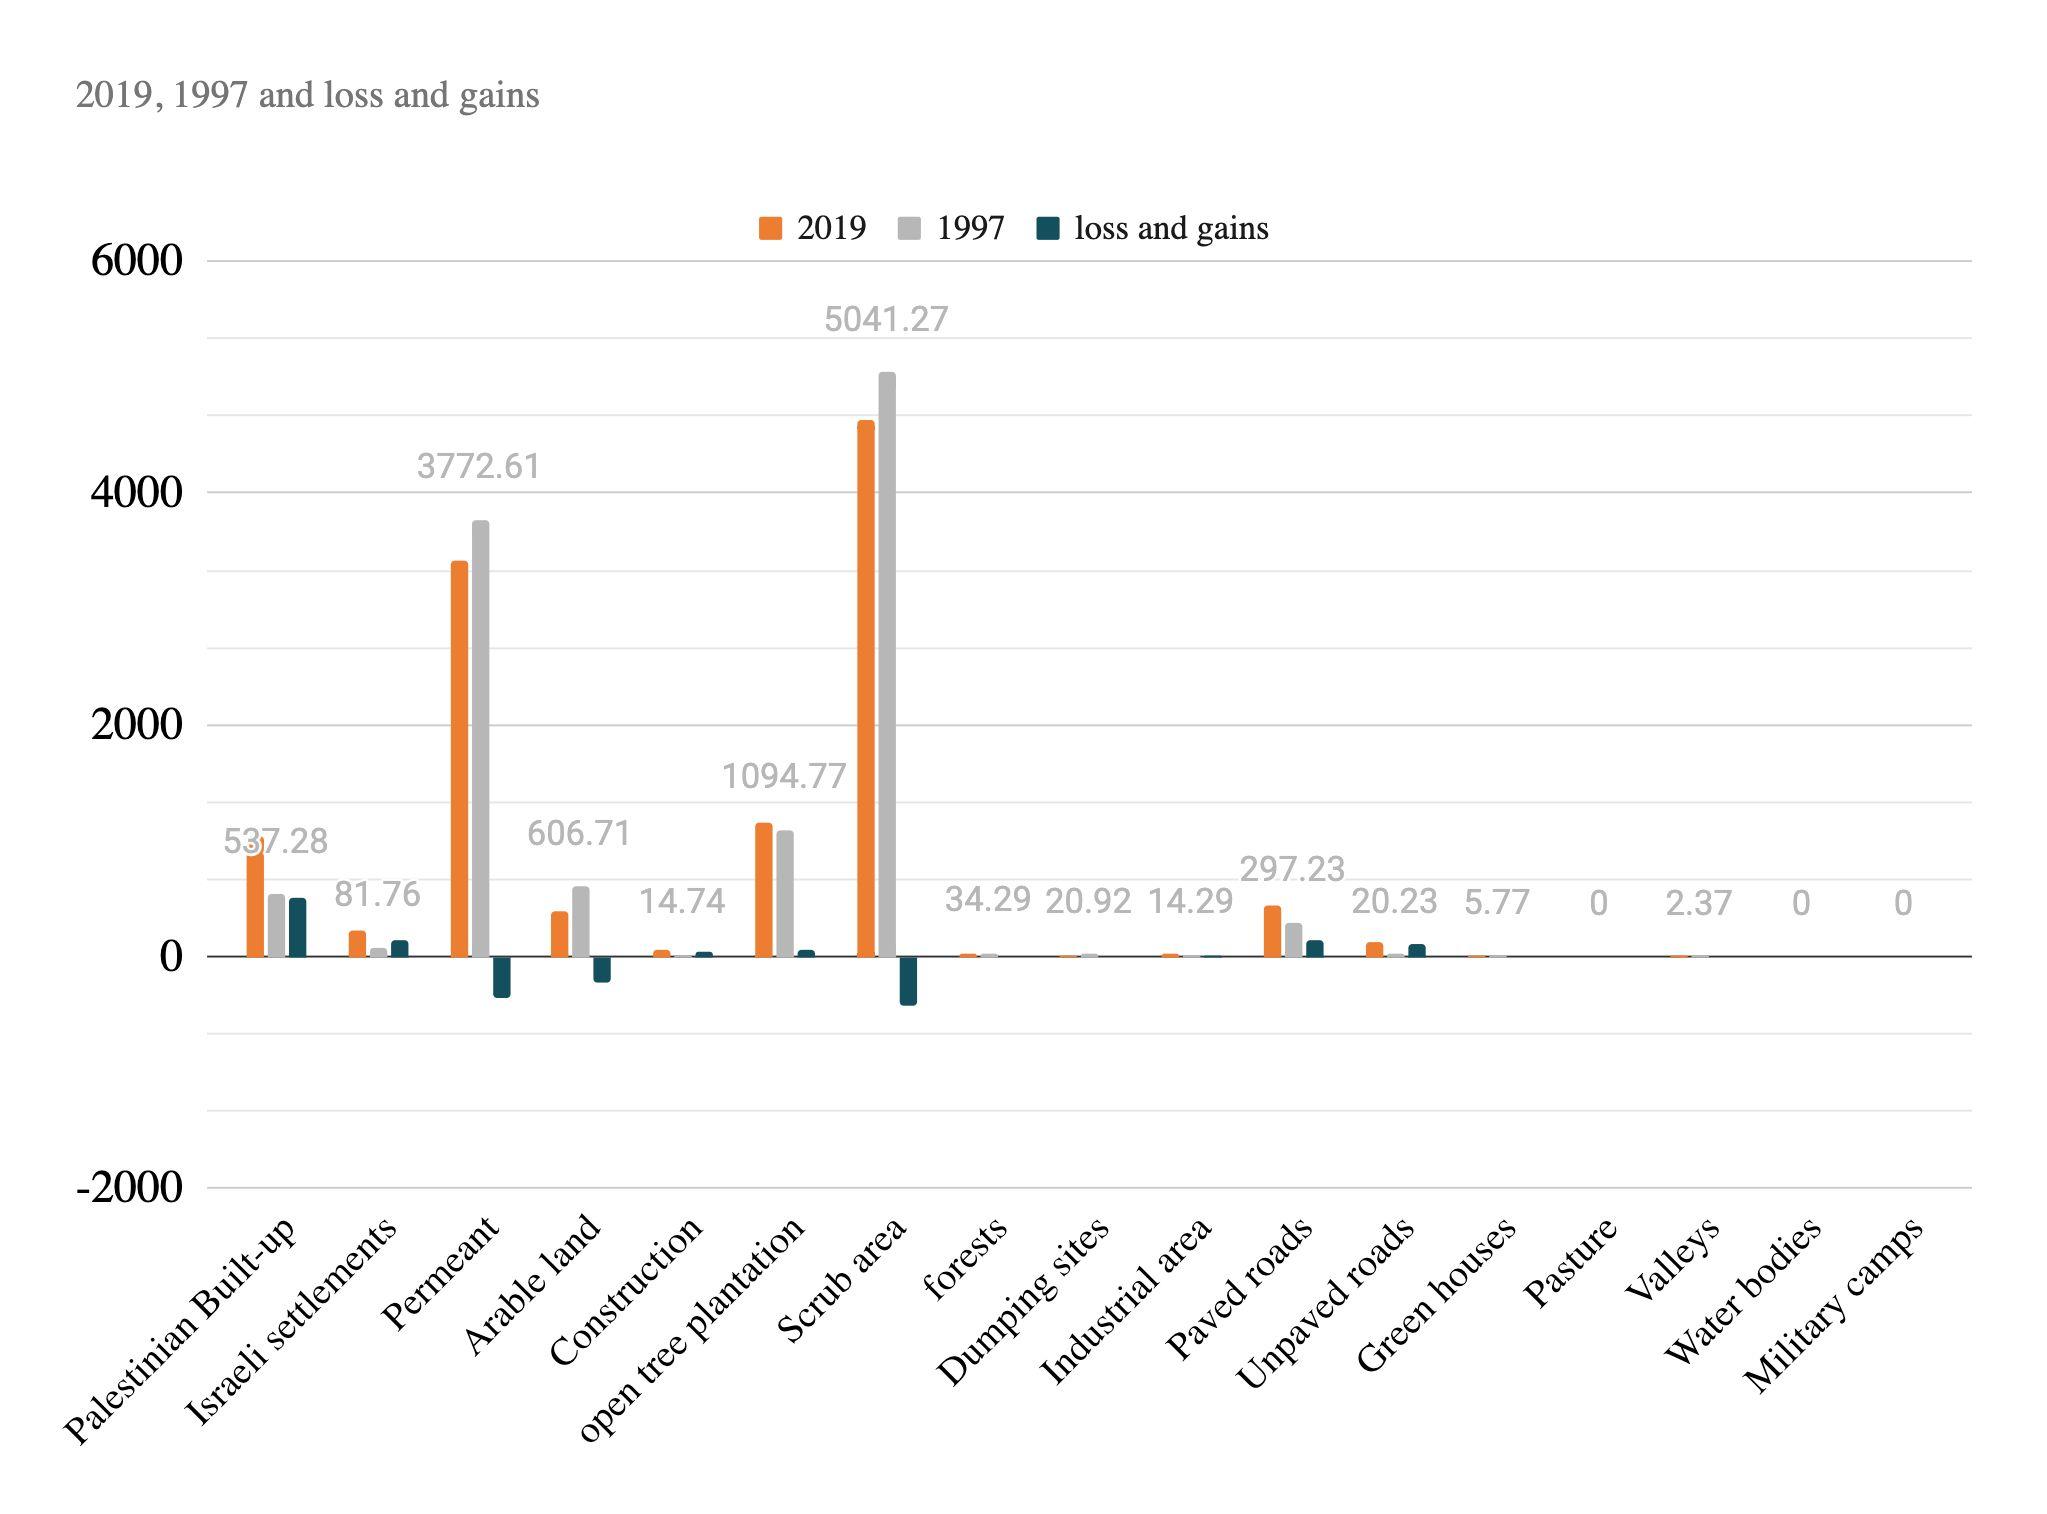
The scrub area in the chosen site was regarded as the matrix, within which patches of other landscape classes could be found. By the year 2019 , scrub area has decreased from 5041.27 hectare to 4623.72 hectare and an increase in other classes,mainly in the built-up area andIsraelisettlement,wererecorded.
Most of the decrease (loss) in the scrub area has been converted to permanent, open tree plantation area, Palestinianbuilt-upareaandIsraelisettlement.
Despite this decrease, scrub area continues to be considered as the matrix. But at the same time, it took (gain) from the permanent mainly and open tree plantationarea.(Return to table 1 and diagram 1)
The Palestinian built-up area in1997 has expanded dramaticallyfrom537.28hectaretobecome1048.12 hectare in 2019. Most of the increase (gain) in the Palestinian build up area has been converted from the scrub area and permanent agricultural trees.while there was no decrease (loss) in The Palestinian built-up area. (Return to table 2 and diagram 2)
Table number 1: Scrub area 1997 vs. 2019.
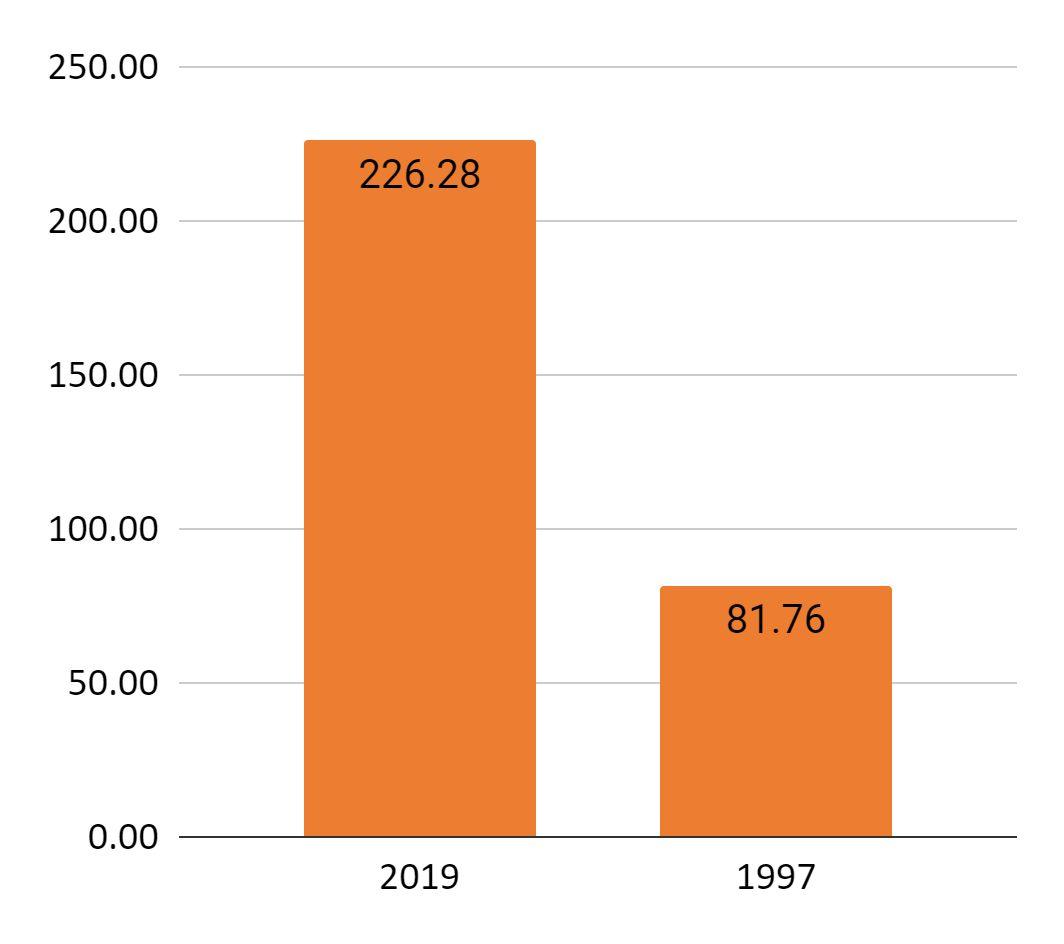
the Israeli settlement has expanded dramatically from 81.76 hectare to 226.28 hectare. Most of the increase (gain) in the Israeli settlement has been converted from Scrub area ,open tree plantation,forest,Paved roads,and Construction.But as for the loss,it is not there,because only Israeli settlements take areas. (Return to table 3 and diagram 3)
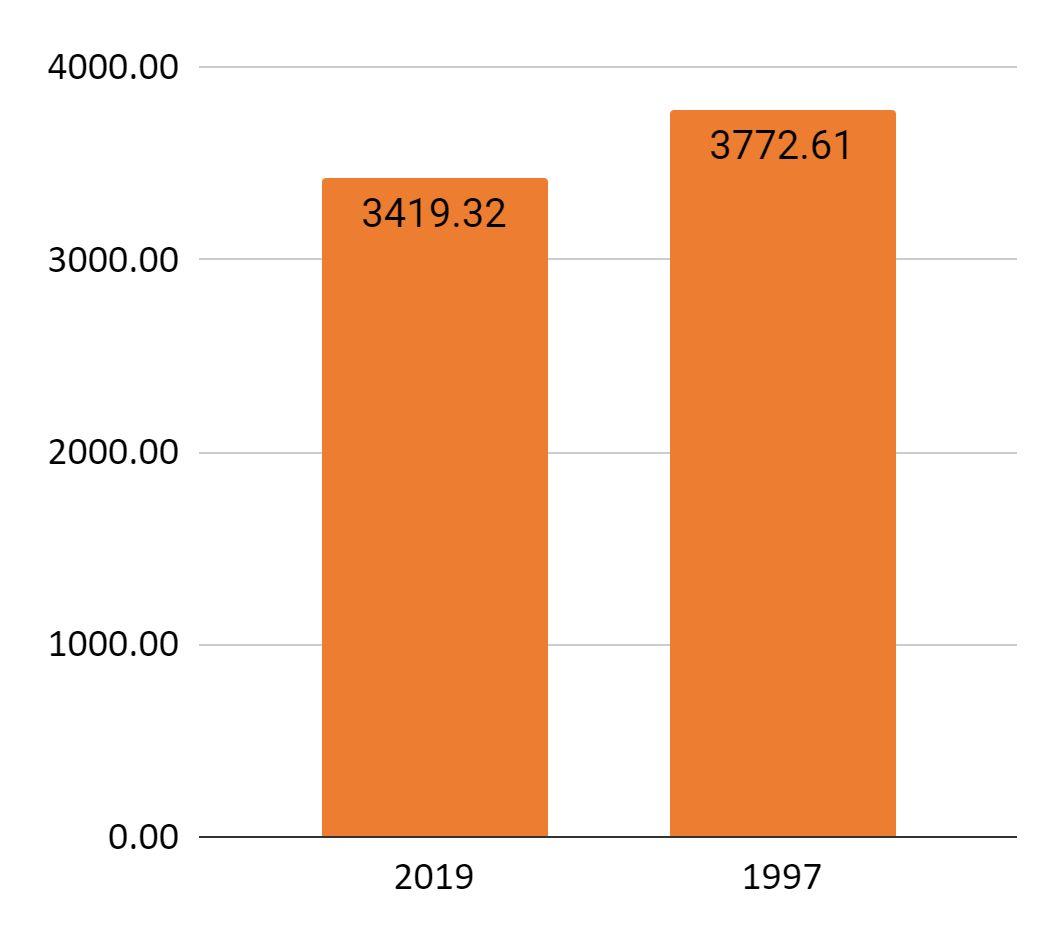
In pemenant area , the area in this class has decreased from 3772.61 hectare to 3419.32 hectare . The decreasing (loss) in the permanent area is mostly converted to scrub area and open tree plantation .At the same time, it took (gain) from the scrub, open tree plantationandarableland. (Return to table 4 and diagram 4)
Table number 2: Palestinian build up area 1997 vs. 2019.
Diagram 2: Palestinian build up area 1997 vs. 2019.
Table number 3: Israeli settlement 1997 vs. 2019.
Diagram 3: Israeli settlement 1997 vs. 2019.
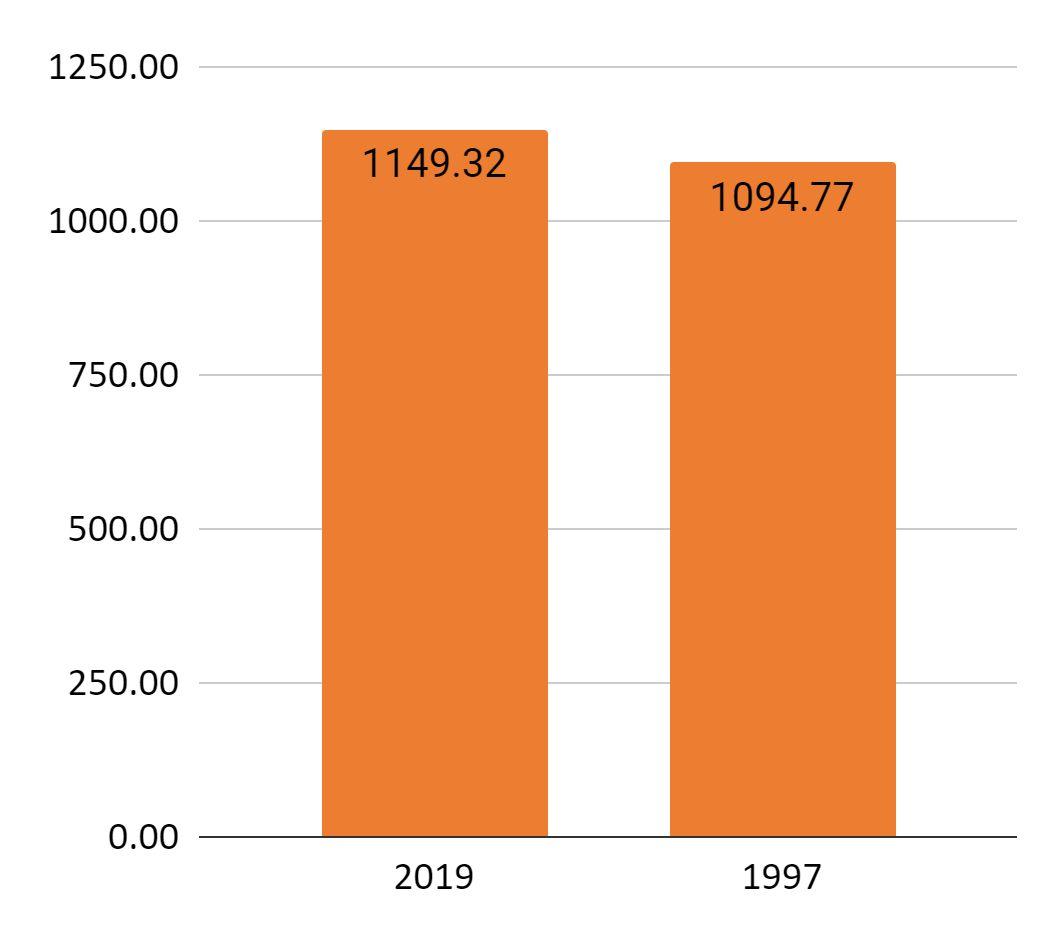
The open tree plantation areas in 1997 has decreased from 1094.77 hectare to 1149.32 hectarein2019.Mostofthedecrease(loss)inthe open tree plantation areas has been converted to permanent agricultural trees and the scrub area. However; it took (gain) also from permanent agriculturaltreesandthescrubarea. (Return to table 5 and diagram 5)
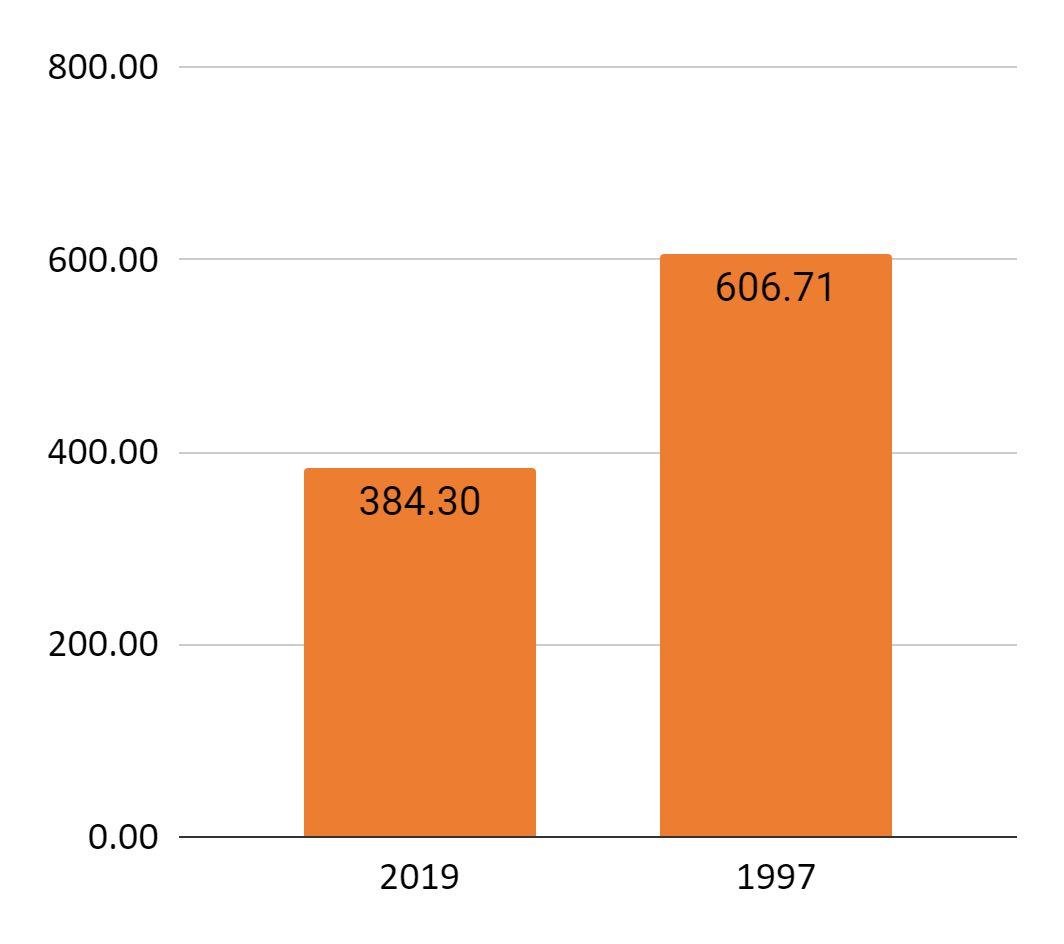
The arable land has decreased from 606.71 hectare to 384.30 hectare .Most of the decrease (loss) in the arable land has been converted to permanent, scrub area,and palestinian build up areas. But it took (gain) from opermanent,scrubarea,andopentreeplantation. (Return to table 6 and diagram 6)
Table number 4: pemenantarea1997 vs. 2019.
Diagram 4: pemenantarea 1997 vs. 2019.
Table number 5: opentreeplantationareas1997 vs. 2019.
Diagram 5: opentreeplantation 1997 vs. 2019.
Table number 6:Arableland1997 vs. 2019.
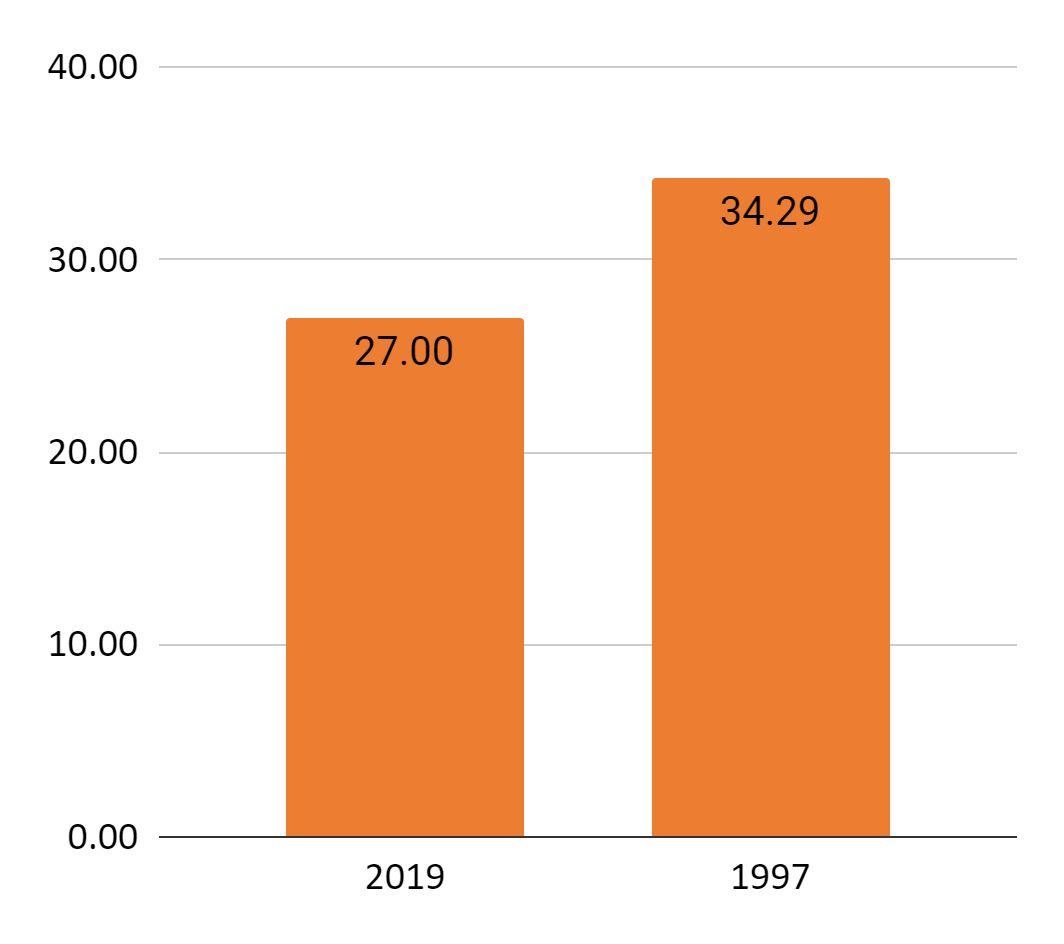
Table number forest7:1997 vs. 2019.
Diagram 6: arable land 1997 vs. 2019.
In 1997 the forest class has decreased from 34.29 hectare to 27.00 hectare in 2019. Most of the decrease (loss) inThe Forests has been converted to Permanent ,Palestinian built-up,and Paved roads. But it took (gain) from permanent, scrub area,and opentreeplantation. (Return to table 7,and diagram 7)
Diagram 7: forest 1997 vs. 2019.
The Dumping sites has increased from 20.92 hectare to 17.70 hectare . Most of the decrease (loss) inThe Dumping sites has been converted to Open tree plantation, scrub area,and palestinian build up areas. But it took (gain) from scrub area,permanent,and open tree plantation . (Return to table 8,and diagram 8)
Construction site decreased from 14.741hectare to 53.17 hectare in 2019 ,the decreasing (loss) in area was converted to Palestinian built-up area , scrib area and open tree plantation , and an increase in other classes, which are scrub and permanent. (Return to table 9 and diagram 9)
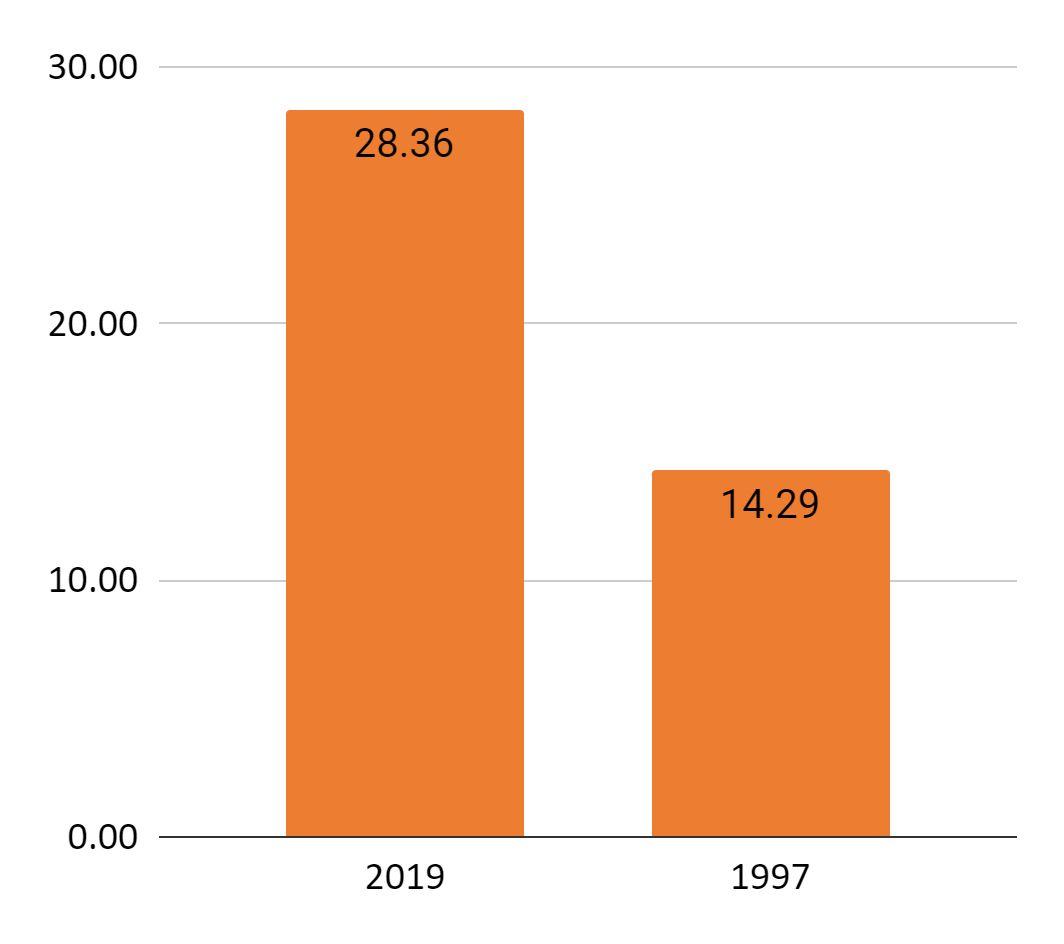
The industrial in 1997 has expanded from 14.29 hectare to become 28.36 hectare in 2019. Most of the increase (gain) in the industrial area has been convertedfromthescrubareaandarableland.while there was no decrease (loss) inThe Industrial area. (Return to table 10 and diagram 10)
Table number8:Dumping sites1997 vs. 2019.
Diagram 8: Dumping sites1997 vs. 2019.
Diagram 9: Construction site 1997 vs. 2019.
Table number9:Construction site 1997 vs. 2019.
The Paved roads has increased from 297.23 hectare to 434.36 hectare .Most of the decrease (loss) inThe Paved roads has been converted to Scrabareas, Palestinianbuilt-up ,andPermanent. But it took (gain) from scrub area, Permeant and Arableland.(Return to table 11 and diagram 11)
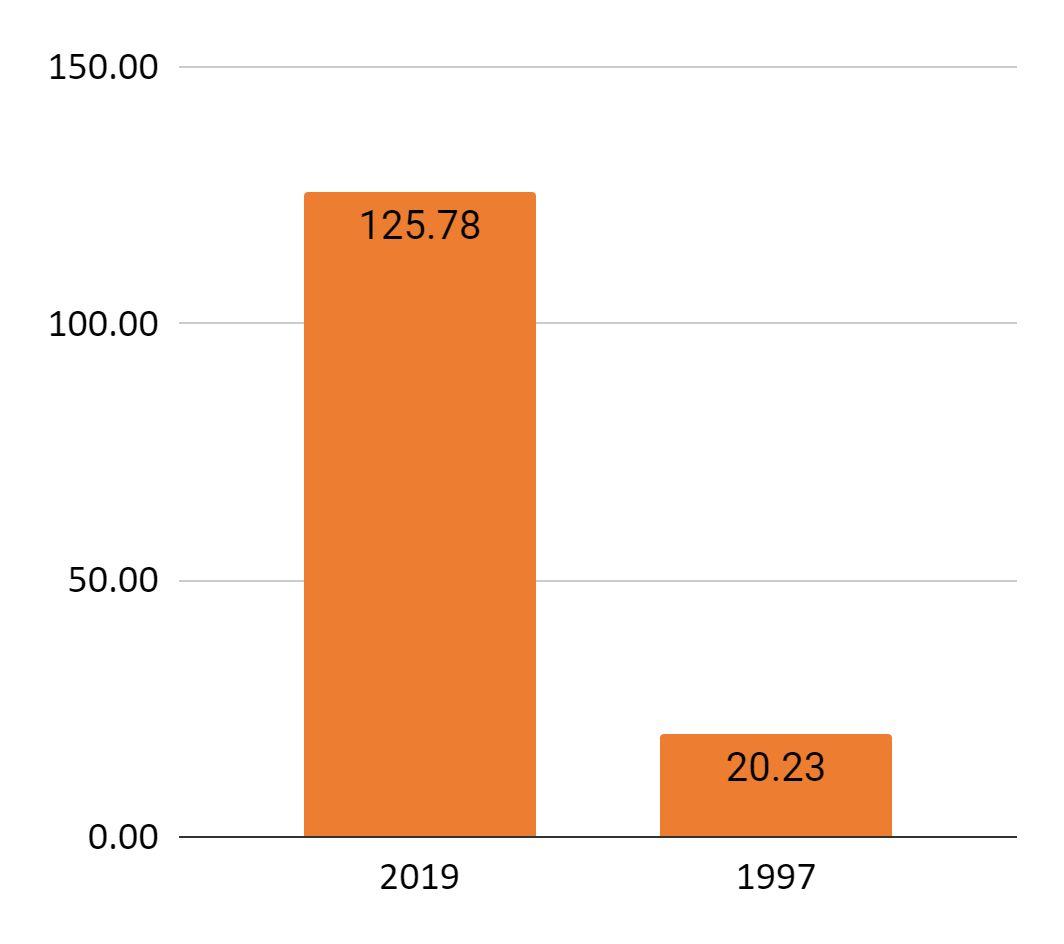
The Unpaved roads in 1997 has expanded from 20.23 hectare to become 125.78 hectare in 2019.Mostofthedecrease(loss)hasbeenconverted to the Palestinian built-up area.While most of the increase (gain) from the scrub area and permanent agriculturaltrees.(Return to table 12 and diagram 12)
Table number10: Industrial area 1997 vs. 2019.
Diagram 10: industrial area 1997 vs. 2019.
Table number11: Paved Roads 1997 vs. 2019.
Diagram 11: Paved Roads 1997 vs. 2019.
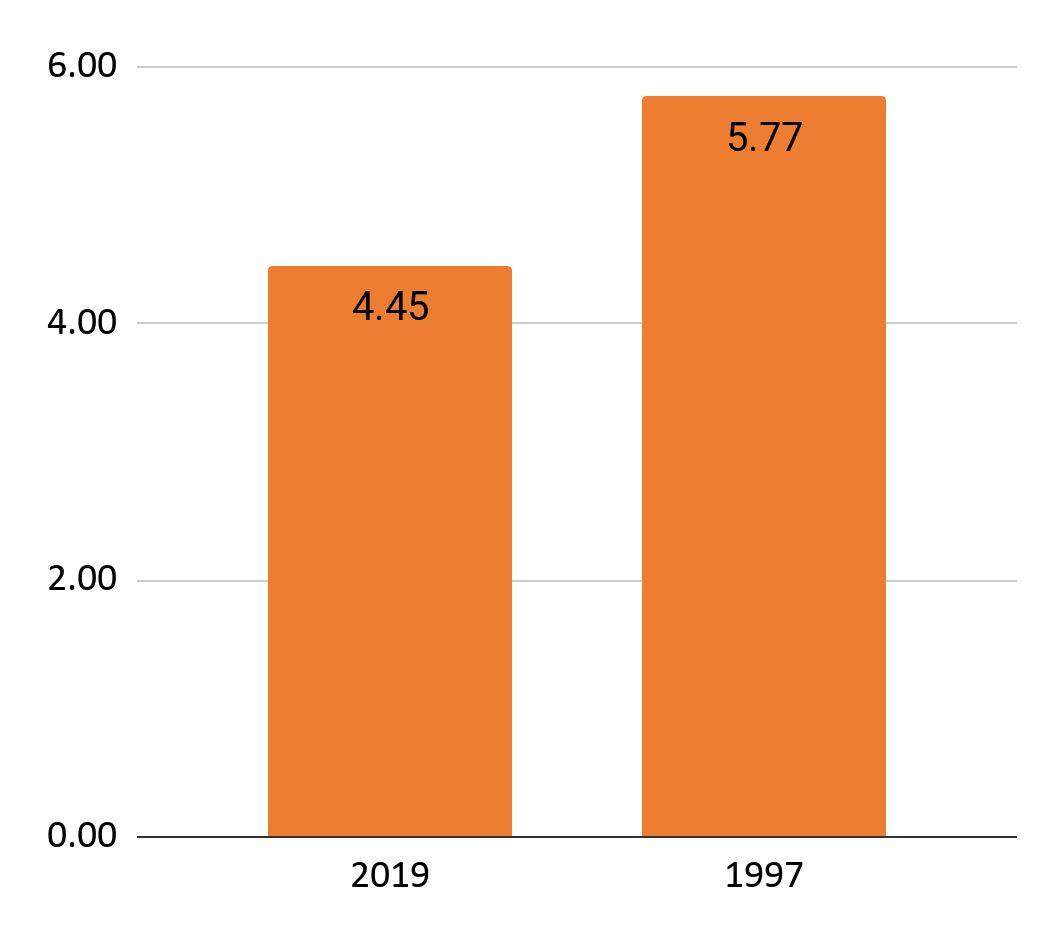
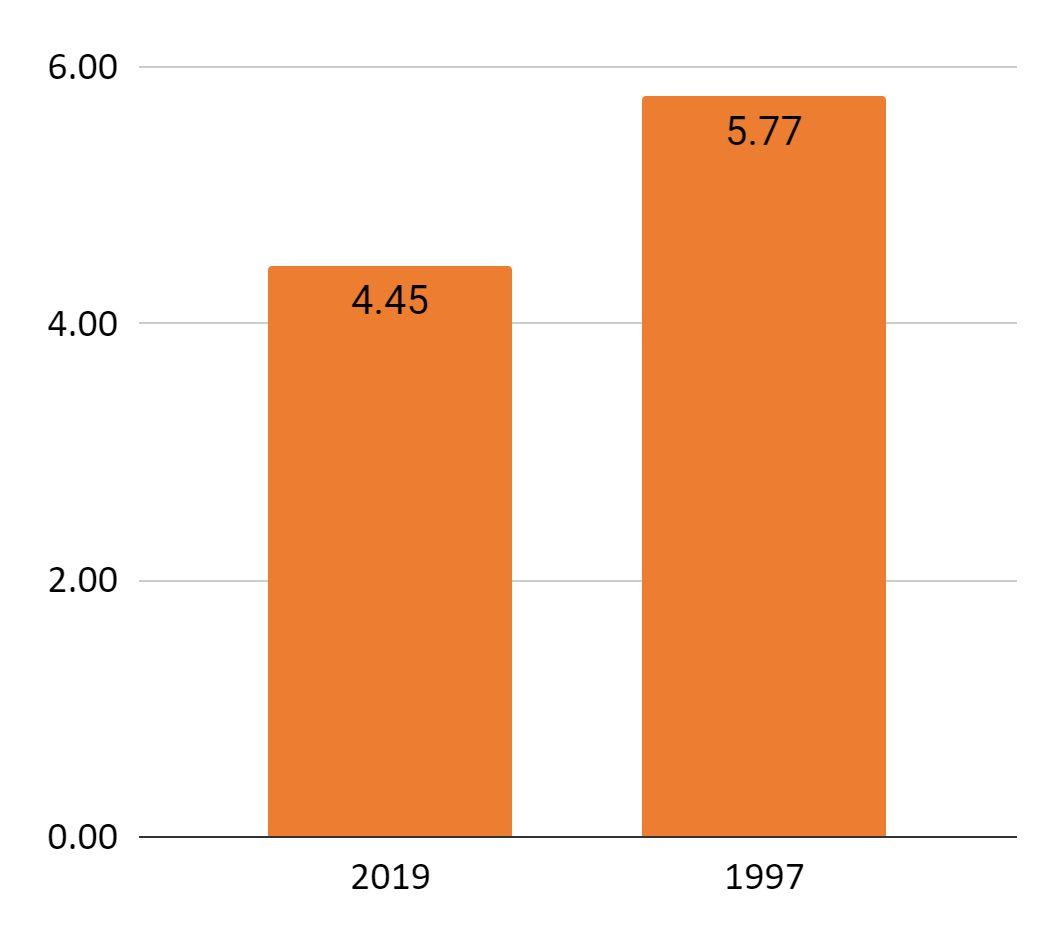
Other class which is the green houses , it fases a decreasing (loss) 5.77hectare to 4.5 hectare .most of the area converted to Palestinian built-up and permanent.ontheotherhanditincreses(gain)due to the taken area from scrub area and arable land .(Return to table 13 and diagram 13)
Diagram 13: Green Houses 1997 vs. 2019.
Table number13 :Green Houses 1997 vs. 2019.
Table number12 : unpaved roads 1997 vs. 2019.
Diagram 12: unpaved roads 1997 vs. 2019.
Diagram 14: landscape classes area 1997 and 2019.
Loss and Gain
Diagram 15: landscape classes area 2019 vs 1997 and the gain and loss for each class
(15 ) : Loss and Gain
LANDSCAPE STRUCTURE
Land cover it not a steable term , it changes due to the surrounding circumstances affected mostly by human activities .The structural landscape pattern are matrix, corridor, and patches .(DramstadW. E. et al., 1996; Forman R. and Godron M., 1986).
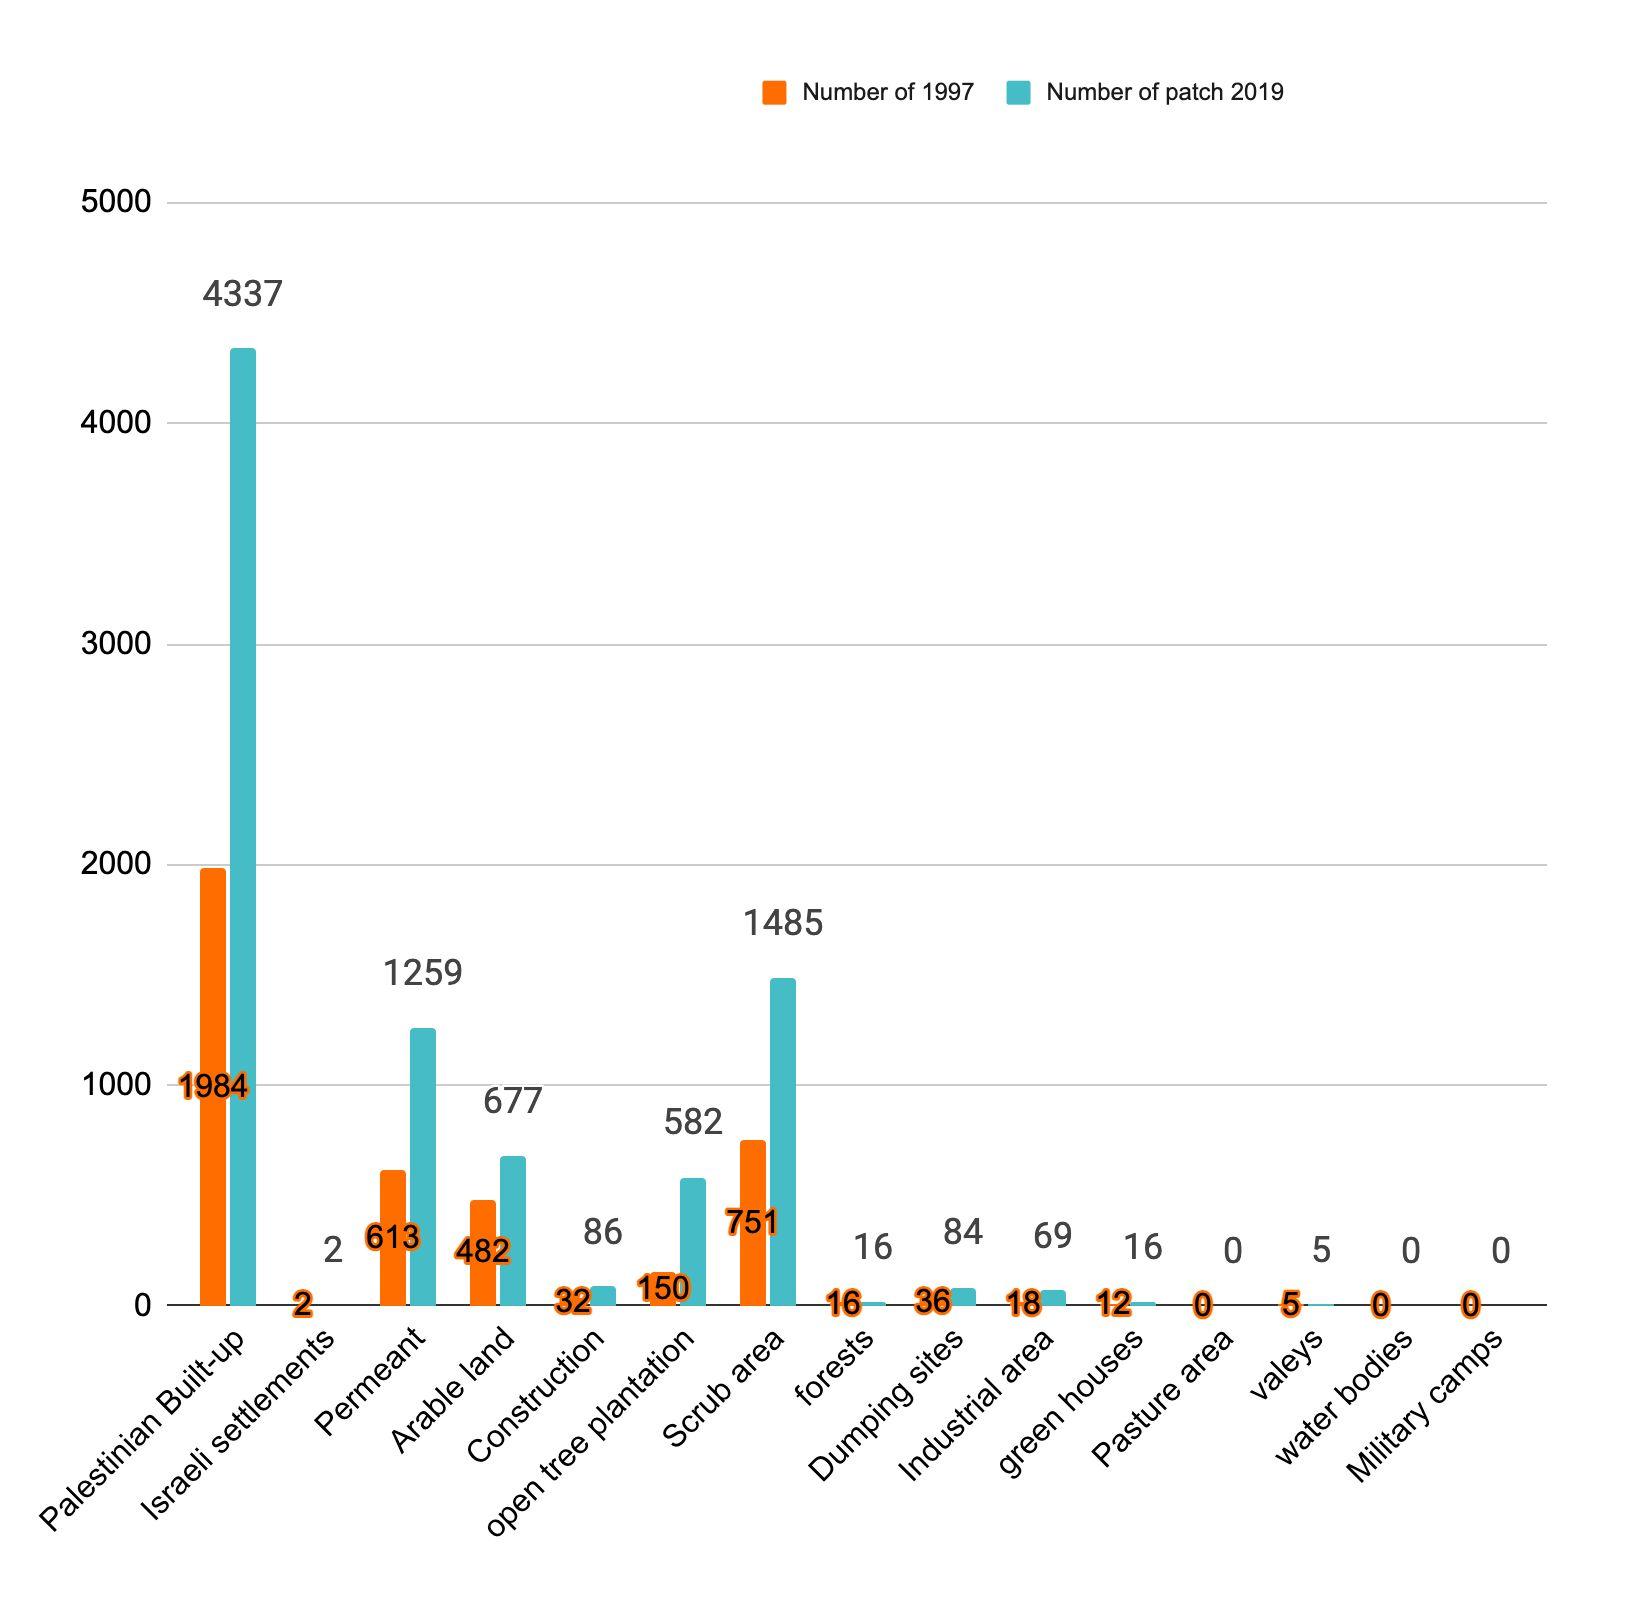
The increasing in the patch numbers can be noticed, as the total numbers between the two years has doubled ,but also there is a decrease in some of the patches numbers .It increased from 4101 to 8618 patchesintotal.
Overall,the numbers of patches increased as mentioned earlier almost in all classes , but mostly in plaestinean built-up from 1984 to 4337 patches, permanent area which increased from 613 to 1259 and scrub area changed from 751 to 1485 patches.
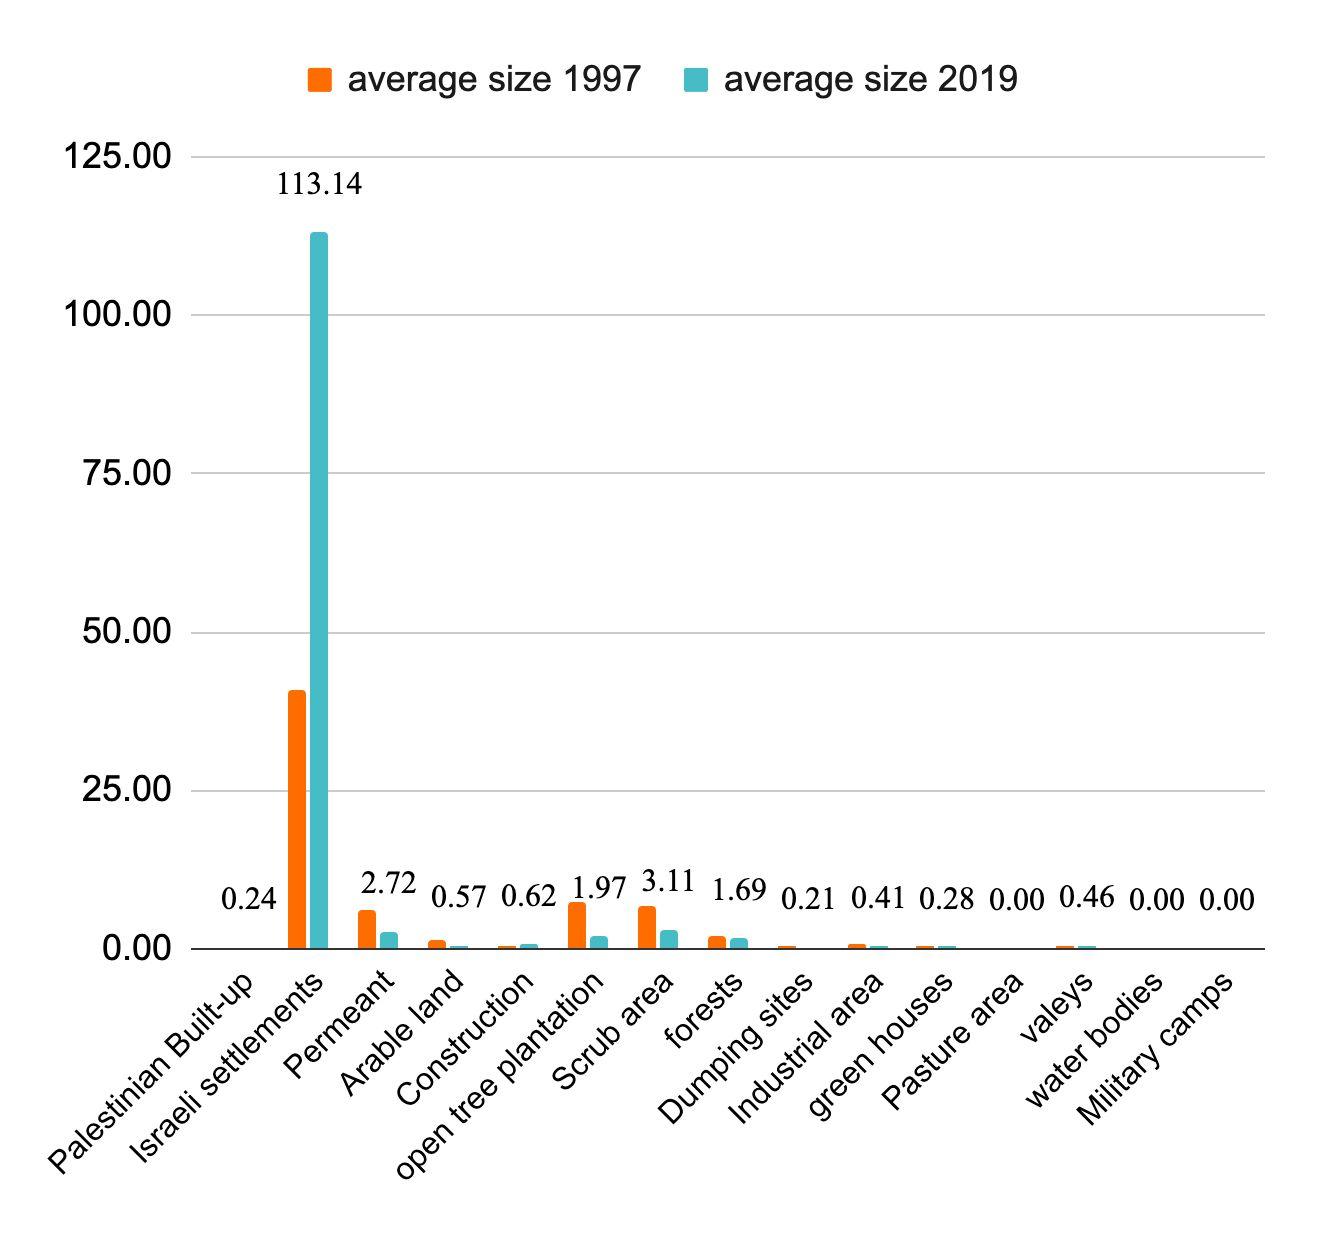
Table number(17) :Average Size and number of patches
Diagram 17: the avarege size of patches 2019 vs 1997
Diagram 16: the number of patches 2019 vs 1997
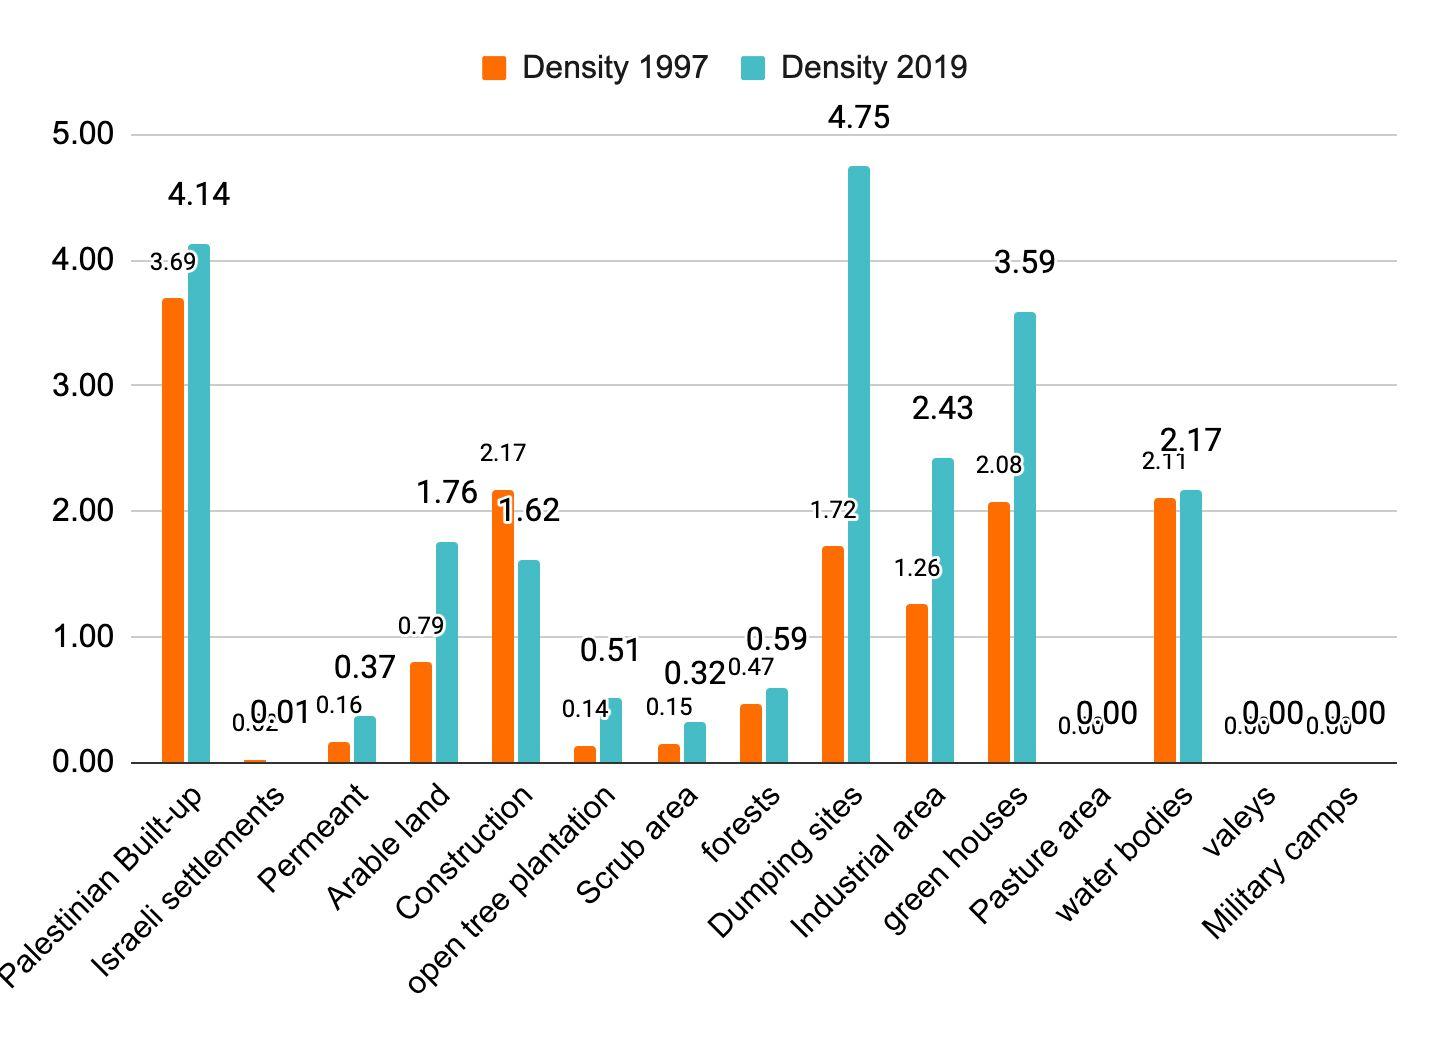
Diagram 18:patches density through the years 1997 and 2019
number(18) : patches density through the years 1997 and 2019
DISSCUTION AND CONCLUCION
After studying our area with taking into consideration all of the aspects,the measurable change in landscape happened in the area that is susceptible to urban expansion as a result of urban growth and the needs of inhabitants. After analyzing our qalqulations and drawings , we came to conclude that the classes has identified to be either decreased in area like Arable land ,scrub area ,and forests .or increased like most of the classes in our region ,for example the Palestinean built-up and Israeli settlement .
The scrub area has decreased and become more fragmented than before but still one of the main big classes . According to the number of patches , no decrease has been noticed clearly and almost all of the patches has been increasing in number since 1997,just like Palestinean built-up , permanent area , and this happens due to the establishing new roads that crosses with these classes . Especially since most of the study area have a rural character, and this has a large role in having a large proportion of arable land ,permeant ,and scrub land .
Moreover , due to the economical development and the urban growth and population in the area , and due to its central location needs that led to open new streets and build more facilities which contributed in increasing the number of patches .
Politically speaking , specifying the region as District C encouraged the existence of the settlements, which divided the classes and its patches .
In conclusion ,without having theArcGIS programme we won’t be able to reach our desired results .ArcGIS with two aerial photos that were extracted from Geomolg , GIS provided us with an overview map for the physical elements in the study area ,and their calculates specific areas.After creating the matrix we could determine the gains and losses in the classes.This research achieved the objective of the study which meant to find out the physical changes that occurred in the site over the period 1979-201, also shows how humans behaviour affects the landscape dramatically ,precisely the natural landscape which we can conclude that it is the most important part in our lives .
REFERENCES
● A.M.Hersperger,M.Bürgi / (2009)
Going beyond landscape change description:Quantifying the impochange in a Central Europe case study.rtance of driving forces of landscape-Land Use Policy.
● DramstadW.E.et al.,1996;Forman R. and Godron M.,1986
● McIntyre and Hobbs 1999
● Photo take by resarcher.2020.
● Skahes and Bunce,1997,Directions of landscape change (1741–1993) in Virestad,Sweden — characterized by multivariate analysis: https://www.sciencedirect.com/science/a rticle/abs/pii/S0169204697000194