
SEPTEMBER 2022 an
LATINX issue brief YOUTH


12 T H E F A M I L Y 'Familismo' CONTENTSTable of 3 A C K N O W L E D G E M E N T S introduction, Terminology, & Data Gaps4 F O R E W O R D 7 L A T I N X P E O P L E ' S H I S T O R Y I N N E W Y O R K S T A T E & T H E U . S . 10 L A T I N X P E O P L E T O D A Y

19 L G B T Q I A + C O M M U N I T I E S 18 G E N D E R : C U L T U R A L N O R M S & E Q U I T Y 20 J U S T I C E S Y S T E M I N V O L V E M E N T 17 H E A L T H I N D I C A T O R S & C 0 V I D - 1 9 I M P A C T S 14 E D U C A T I O N 21 F O S T E R C A R E & C H I L D W E L F A R E 23 A C T I O N S T E P S 24 R E S O U R C E S F O R L A T I N X Y O U T H 25 A P P E N D I C E S & R E F E R E N C E S
Most Latinx residents in NY State either originate from or trace their ancestry back to Caribbean nations including Puerto Rico, the Dominican Republic, and Cuba (2,008,000 in total).

This issue brief was prepared by the following NYS Youth Justice Institute staff: Megan Willows, Tierney Nash, Alysha Gagnon, Brian Rainey, Tawnee Crews, and Giza Lopes.
We are also grateful to the following Fellows of SUNY's Hispanic Leadership Institute for their insightful feedback: Christian Alberto, EdD, Director of Admissions and Enrollment at SUNY College of Optometry; Miguel Baique, Assistant Dean for Academic Diversity & Inclusive Excellence in the Thomas J. Watson College of Engineering and Applied Science at Binghamton University; Adriana Conde, Assistant Vice President for Employee & Labor Relations at SUNY Downstate Health Sciences University; Christie Smith, Director of Admissions at SUNY Geneseo; and Elizabeth Vásquez, DrPH, Department Chair and Associate Professor of Epidemiology and Biostatistics in the School of Public Health at the University at Albany.
The Bronx has the highest proportion of Latinx residents of any county or borough in New York State with 54.8% of its residents identifying as Latinx in 2020
BY THE NUMBERS
Children (ages 0 18) make up the largest proportion of Latinx residents in NYS (27%).
The YJI would like to thank the NYS Division of Criminal Justice Services (DCJS), the NYS Office of Children and Family Services, the University at Albany, and the NYS Juvenile Justice Advisory Group for their continued support for the Institute and our work.
PAGE 3
54.8%
2
A C K N O W L E D G E ME N T S
M+ 27%
This issue brief provides a profile of Latinx youth in New York State and the United States today. Latinx people have a wide range of experiences across gender, race, culture, and location In this brief, we are not able to address all these multifaceted identities. We note intersectional
PAGE 4
Another point of clarification is the use of the terms Latinx, Latina, and Latino In Spanish, the suffix “o” denotes masculine or a group of people of multiple genders. The suffix “a” refers to feminine, or a group of exclusively feminine people. In the early 2000s, the suffix “x” was introduced as a gender neutral option to refer to either an individual or a group [3].
FOREWORD
experiences where possible throughout the document and we encourage you to read more about young Latinx people and available resources for Latinx youth in our Resources section and the References. Latinx youth represent an important part of our future as a nation and we hope that this document provides some insight into their lives, the challenges they face, and their aspirations.
INTRODUCTION
While Hispanic and Latinx/a/o are used interchangeably, these terms refer to distinct and overlapping populations. Hispanic means Spanish speaking or from a Spanish-speaking background or country [1]. Latino is an abbreviation of the word Latinoamericano translating as Latin American and is not limited to Spanish speaking cultures or nations of origin. There is a great deal of overlap in people who could identify with either term, including but not limited to, people from Colombia, Cuba, Guatemala, Mexico, Puerto Rico, and other Central or South American Spanish-speaking countries. People from other Central American or South American countries that are not Spanish-speaking, such as Brazil, are considered Latinx but not Hispanic. However, these distinctions are not always clear cut and there are generational differences in adoption of which terms to use to self identify [2].
HISPANIC & LATINX TERMINOLOGY
For this report, we use Latinx as a reference to mixed groups people from countries in North, Latin, Central, or South America, regardless of national language and excluding Spain, except when the sources we rely on are unclear or specify a Hispanic population. We use Latina to refer to women or girls and Latino to refer to men or boys.
PAGE 5
L A N G U A G E S I N L A T I N A M E R I C A


English Spanish Portuguese French Spanish/Indigenous Spanish/English SOURCE: Nations Online [https://www nationsonline org/oneworld/amer ican languages htm] *For countries without an official language at the federal level, the most spoken language (i.e. "de facto" national language) was selected. PAGE 6 Dutch

PAGE 7
U.S. Specifically, while Latinx people are currently the fastest growing ethnicity in the United States, Spanish settlers came to the U.S. as early as 1513 [4]. Latinx people currently represent 18.8% of the national population according to the 2020 Census. In New York State, the Bronx borough of New York City has been a longstanding center for Latinx culture Over half of those living in the Bronx are Latinx (54.8%), with most residents either coming from or
GAPS IN DATA ON LATINX YOUTH
Latinx people have a diverse and rich history in New York and throughout the
HISTORY
HISTORY OF LATINX PEOPLE IN NEW YORK STATE & THE U.S.
Producing a comprehensive picture of Latinx and Hispanic youth life in New York, or the U S more broadly, can be difficult due to inconsistent data collection and availability This is due first to the variation in definitions of Latinx and Hispanic people. Second, different fields have different standards for publicly reporting their data Some sources focus as locally as census tract data, others provide county-level information, and others still aggregate not only to the state level but to different age brackets. As such, readers of this brief need to be aware that there are limitations to the information presented While it is not practical for all of these fields to change their longstanding data
recording and reporting practices, small changes can and should be made to facilitate interdisciplinary collaboration This will allow researchers and practitioners to better understand and serve the growing and complex population of Latinx and Hispanic youth. Another critical data gap that exists at present relates to how youth’s race and ethnicity are collected In some cases this information is self reported, whereas in others it is recorded through the perception of the practitioner serving the young person. Possible differences between these forms of identification may have implications for the type of culturally responsive services that would be appropriate for the youth and their family
205.1 M 227.2 M 249.6 M 282.2 M 309.3 M 329.5 M Total U.S. Population Total Latinx Population within U.S. tracing their ancestry back to Caribbean nations including Puerto Rico and the Dominican Republic [5] . Recent years have also seen increasing Latinx populations in upstate New York, particularly in the lower Hudson Valley in Ulster, Dutchess, and Sullivan counties as well as in Albany County [6] PAGE 8 FIGURE 1 - LATINX POPULATION IN THE U.S., 1970-2020 4.7% 6.4% 9.0% 12.5% 16.3% 18.8% 1970 1980 1990 2000 2010 2020 SOURCE: U.S. Decennial Censuses, 1970 2020

PAGE 9
FIGURE 2 - PERCENTAGE OF LATINX POPULATION

SOURCE: U.S. 2020 American Community Survey

that 60% of Latinx people in the US were 35 or younger in 2016. In New York State, 54% of Latinx people are under 35 [7] The same report indicates that Latinx people believe in key aspects of the American Dream: 77% of Latinx youth ages 18 35 said that most people can be successful if they are willing to work hard and 75% believe th children will have b standards of living them. In addition, a study characterized millennials those between 1981 and 1996 by their progressive views, racial diversity, and expanding educ which sets them older generatio However, Latin not currently re equitably in the system. While Latinx political representation has increased by roughly 75% over the
FIGURE 3 - COUNTRIES OF ORIGIN OR ANCESTRY IN NEW YORK STATE

PAGE 10
SOURCE: U S 2020 American Community Survey
Today, youth is a defining characteristic of Latinx people in the nation. The Pew Research Center reports
LATINX PEOPLE TODAY
past two decades, a 2021 report found that only about 1 5% of all current elected officials are Hispanic or Latinx [9].
SOURCE: U.S. 2020 Decennial Census
According to the 2020 Census, about one third (32 8%) of the Latinx population living in the U S was born outside the country The migration of Latinx people to the United States has been increasing in recent years. Crises of gang violence, poverty, and political corruption in the Northern Triangle nations of Guatemala, Honduras, and El Salvador have spurred migration to the United States since 2000 [10]. However, recent mass waves of migration have pushed Central American migrants into the media spotlight since 2018
FIGURE 4 - PERCENTAGE OF LATINX PEOPLE IN NEW YORK STATE BY AGE

NEW LATINX MIGRANTS
Twenty percent (20%) of Latinx people born outside the US do not currently have US citizenship status, which is likely an underestimate according to experts [11]
Those without citizenship are at greater risk for labor exploitation, trafficking, and abuse, and are less likely to report crimes against them to the police due to deportation fears [12, 13] Latinas without citizenship status in particular face heightened risks for intimate partner violence and exploitation in the workplace. In addition to fearing deportation from law enforcement, undocumented Latina women often distrust
PAGE 11
Juan (Brietzke & Pereira, 2017)
'FAMILISMO'
A better future is waiting for me as long as I keep up with school. That makes me more motivated in my life, I think. I don't like to watch my mother working so hard... but to go to university I need to have papers.
19]. Familism pride a positive, affective component of familism that emphasizes pride in one’s family and making one's family proud has also been associated with fewer depressive symptoms and greater joy in Latinx youth [20]. In addition, family resilience, or the ability of a family to overcome challenges together, has been shown to protect Latinx youth from internalizing negative views of themselves as a result of discrimination and reduce depressive symptoms [21].
THE FAMILY
PAGE 12
government systems due to past experiences in their home nations They are also less likely to speak English compared to undocumented Latino men, typically do not control family finances, and are usually more responsible in caring for children which limits their avenues to resist abuse or escape from abusive relationships [14].
Familismo is a central cultural value in many Latinx communities which emphasizes dedication and commitment to the family unit. Some studies indicate that this commitment may provide protective effects that benefit mental and physical health [15, 16, 17]. Other work has also found that familism can play a role in promoting well being and in protecting against life stressors including economic hardship that might otherwise negatively impact one’s well being [18,
PASSING DOWN FAMILY TRADITIONS
PAGE 13
New Latinx migrants come from many countries and bring a variety of rich cultural traditions with them Passing down the Spanish language is particularly key for Latinx migrant parents with. A recent study finds that 97% of Latinx migrant parents say they speak Spanish to their children [22] However, this same research also indicates that passing down Spanish becomes less common across second and third generations. Yet language is not the only tradition that connects generations: Latinx migrants also pass

[After my parents left] I lived in my grandma’s house and like there were always a lot of people there. My uncles, my aunts and my cousins. And you know, I never felt alone.
Fernandina (Ko & Pereira, 2011)
down celebrations such as quinceañeras, which celebrate girls’ 15-year birthdays, and some holidays are shared across certain North, Latin, Central, and South American nations such as Día de Los Muertos (Day of the Dead) Food has also shown to be an important link to tradition and culture across generations and is central to some celebrations. For instance, Latin American families host tamaladas tamale making parties around holidays and Caribbean Latinx people also host pasteladas or pastele -making parties during the holiday seasons. Ultimately, language, celebrations, and food are central in linking the past to the present and connecting Latinx generations [23]
PAGE 14
Overall, there were approximately 13 9 million Hispanic students, 7.1 million boys (51.2%), and 6.8 million girls (48.8%) which represent 27% of the student population in 92,823 schools. 2
FAMILY SEPARATION EDUCATION
The distinction between voluntary family separation and forced family separation is critical conceptually and in the ways family members adapt. The incarceration of a parent has serious implications for the well being of children. Studies have shown that parental incarceration increases residential instability [26], aggression [27], and the likelihood of delinquency during adolescence and adulthood [28] These adverse effects often create pathways of additional negative outcomes for their children. The detainment and deportation of family members have similar negative effects on children, including depression and posttraumatic stress disorder (PTSD) [29], and even among families that do not experience deportation, they are likely to live with the fear and anxiety of potential separation
In the 2017-2018 school year, the US had approximately 50.9 million students enrolled in public schools, 26.2 million boys (51.4%), and 24.8 million girls (48.6%). 1
PRE-K TO GRADE 12
1 - Numbers do not necessarily sum to totals due to rounding.
Punitive criminal justice policies and strict immigration laws have disrupted the stability of Latinx families in the U.S. Recent reports indicate that among Hispanic inmates, 51% of men and 61% of women in state facilities have minor children [24]. In federal prisons, where those convicted are serving longer sentences, these proportions are even greater [25] Similarly, deportation has fractured immigrant families, most often, those who immigrated to the U S from Latin countries
2 - This data source treats Hispanic as a racial category and does not disaggregate by ethnicity.
3 - The NCES presents summary statistics for overall Hispanic youth but for some data points they delve deeper and present information for Ethnic subgroups from North America (e.g., Mexico) Central America, (e.g., Guatemala) and South America (e.g., Peru).
young adult population in total, 60%
As of 2016, Hispanic young adults aged 18 24 enroll in college at approximately the same rate as the overall 18 24-yearold population at 39% compared to 41% [32]. Public higher education is a critical resource for these students as the proportion of Hispanic students attending public colleges and universities (85%) is higher than any other racial group or the total (78%). The Hispanic Association of Colleges and Universities notes that Hispanic enrollment is increasing faster than any other racial/ethnic group, and this is a group that is already receiving 1/4th of the Associate degrees conferred (as of 2020) [33]. Public higher education is a critical resource for these students. Of the Hispanic young adults enrolled in a 4 year degree program, 54% graduate within 6 years, a rate lower than the enrolled

According to the National Center for Education Statistics 3 (NCES) in the 2018 2019 academic year, 81.7% of Hispanic youth in the US graduate high school, compared to 85 8% of youth overall and 89 4% of white youth In New York, this gap is wider with 82 8% of all youth graduating, but only 72 9% of Hispanic youth and 90 2% of white youth achieving this milestone [30]. Existing research indicates that failing to complete secondary education has several negative life consequences including reduced job availability and mobility in the job market [31].
POSTSECONDARY
PAGE 15
The cultural diversity present in Latinx students can enrich the college and university communities these individuals join, especially when Latinx cultures are not aggregated to a ‘monolithic Latinx’ but allow for the representation of the various subgroups, which may also have different needs [34]. Several colleges and universities have developed Spanish
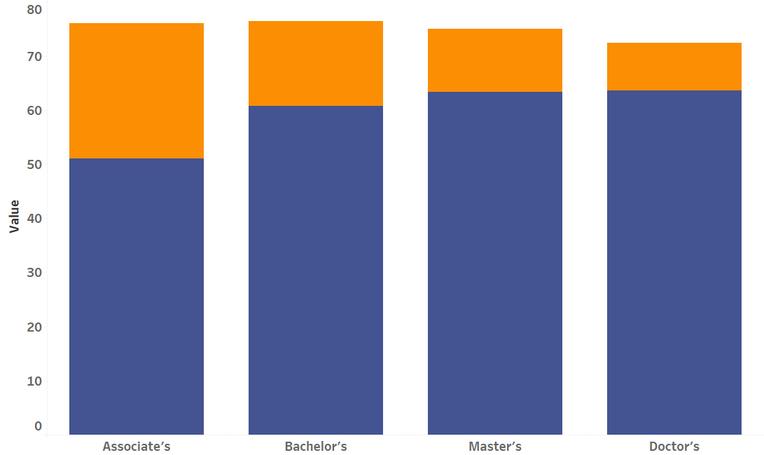
ASSOCIATE BACHELOR MASTER DOCTOR 18.8%11.6% 5.7% 25.0% 51.0% 60.8% 63.4% 63.6% PAGE 16 FIGURE 5 - TOP 5 LATINX UNIVERSITY MAJORS - U.S., 2019 FIGURE 6 - PERCENTAGE OF DEGREES EARNED BY ETHNICITY AMONG WOMEN, 2018-2019 Business Education Health Professions PublicAdministration &SocialServices 23% 23% 13% 10% 5%Psychology Latina Women White Women SOURCE: National Center for Education Statistics (NCES) SOURCE: National Center for Education Statistics (NCES)

Latinx youth with elevated mental health concerns prior to the pandemic experienced a reduction in symptoms during the pandemic [41].
Despite living longer lives, Latinx people are more likely to experience extreme poverty compared to white people: Latinx people make up 18.7% of the U.S. population, but account for 28.1% of the overall population of those living in poverty [38] These unexpected dual outcomes of low socioeconomic status (SES) and longer lives is described as the “Latino paradox” among scholars. Other health outcomes including maternal mortality rates are lower among Latinx people compared to black people and white people by some estimates [39], while recent infant mortality rates among Latinx people are 5 deaths per every 100,000 live births [40]. Yet much of this data is based specifically on the
experience of Mexican Americans and there is variation across Latinx groups.
PAGE 17
While there is a robust body of work highlighting black-white racial and ethnic disparities in health and quality of life, health outcomes for Latinx people and the factors influencing these outcomes have not been investigated as thoroughly Among Latinx people, the average life expectancy of men and women is 79.1 years and 84.4 years, respectively [36]. On average, both Latino men and Latina women outlive their white and black counterparts Longevity, however, is not indicative of overall well being throughout the life course and these life expectancy estimates vary across Latinx people and migrant groups [37].
Over the pandemic, Latinx youth described the “impact of racism, loss of income, the role of community and family in coping with stress, information overload, home-schooling, loneliness and boredom, and lack of structured routines” [42].
there were increases in internet access between 2015 and 2017, lowincome Latinx youth, in particular, were least likely to have home internet access and it is likely that the COVID19 pandemic intensified these disparities through economic impacts on low-income Latinx communities [44].
COVID-19 led to increases in childcare responsibilities for Latinx adolescents and teens; Latinx teens who took on greater duties of childcare experienced heightened stress which decreased their school performance and overall well-being
While[43].
COVID-19
HEALTH
Additionally, Latinx people are less likely to complete higher education compared to white people, though postsecondary education is becoming more common for Latinx youth today [47]. Research indicates that women generally need to complete higher levels of education to receive the same earnings as men with less education. According to the 2020 Census, “women with high school diplomas had about the same median earnings as men with less than a ninth grade education” [48]. Latinas are therefore at an acute disadvantage in the job market even when considering overall gender disparities

PAGE 18
While Latinx cultures are diverse, many continue to emphasize traditional gender roles and patriarchal structures, often through expectations surrounding machismo for men and marianismo for women Experts have described machismo in Latinx cultures as characterized mainly by aggressiveness and competition with other men while marianismo means to judge Latina women by the standard of the Virgin Mary [45]. These widespread cultural norms impact the lives of young Latinx women and men deeply including how they choose to present themselves, their decisions surrounding dating, marriage, and having children, and even the careers they choose to pursue
GENDER
CULTURAL NORMS & EQUITY
Latina women in particular face discrimination and experience gender inequality on multiple levels. For instance, Latinas on average make 26% less in income than white women and 70% less than white men in most states [46]. Latinx people are also more likely to begin working earlier in life and Latinx people overall are disproportionately overrepresented in the service industry which is characterized by low wages and long hours This has long term implications on quality of life since these jobs tend to have fewer benefits and resources along with limited retirement plans
Overall, this work highlights concepts of family acceptance and rejection and youths’ feelings of belongingness [49]. Other research has linked parental acceptance or the lack thereof with depressive symptoms in Latinx LGBTQIA+ youth, showcasing a need to receive support outside of the family [50].
PAGE 19 FIGURE 7- LATINX FULL-TIME EMPLOYMENT PERCENTAGE, AGES 16-25 BY GENDER – U.S, 2000-2020 LGBTQIA+ COMMUNITIES Latino Men Latina Women U.S. Average 2000 2005 2010 2015 2020 19.6% 16 5% 11.7% 10 7% 13.3% 15.4% 8 6% 11.1% 11 4% 9.0% 12.1% 11.9% 8.5% 11.8% 11.0% SOURCE: Bureau of Labor Statistics (BLS)
Latinx LGBTQIA+ youth’s experiences with family can notably differ from the familismo culture. One study found five main themes in these youths’ experiences with families: (1) definitions of belonging and belonging to the family; (2) family rejection or the fear of rejection; (3) a culture of queer invisibility; (4) divergent experiences among non parental family members; and (5) resilience (p. 10).

Additionally, Latinx people are less likely to complete higher education compared to white people, though postsecondary education is becoming more common for Latinx youth today [47]. Research indicates that women generally need to complete higher levels of education to receive the same earnings as men with less education. According to the 2020 Census, “women with high school diplomas had about the same median earnings as men with less than a ninth grade education” [48]. Latina women are therefore at an acute disadvantage in the job market even when considering overall gender disparities
Approximately 42% of Latinx LGBTQ students experienced harassment or assault while at school due to both their sexual orientation and race/ethnicity;
Only about 40% of Latinx LGBTQ students indicated that they had school administrators who were somewhat or very supportive; and
LATINX LGBTQIA+ YOUTH IN SCHOOLS
J S I PAGE 4
School disciplinary practices negatively affected educational outcomes for Latinx LGBTQ students in particular. These students who experienced school discipline were less likely to plan attending college or a trade school and had lower grade point averages (GPAs);
Latinx LGBTQ students who had supportive staff at their schools were less likely to experience several different negative outcomes, including missing school due to safety concerns and feeling unsafe because of their identity (Zongrone, Truong, & Kosciw, 2020).
PAGE 20
35% of Latinx LGBTQ students indicated that they had missed at least one day of school in the preceding month because they felt unsafe or uncomfortable;
According to the OJJDP’s Statistical Briefing Book, the overall number of Hispanic youth who have had cases processed by juvenile courts has decreased since 2005 (from a peak of 274,400 in 2008 to a low of 136,100 in 2019) [51]. However, Hispanic youth comprise a greater proportion of youth who have had juvenile court cases in the same time frame (15.9%

to 18.8%). This speaks to greater levels of disparity even if justice system involvement has decreased among Latinx youth in recent years.
Historically there have been different patterns of offending by Latinx youth that have generational differences. Research has shown that first-generation youth tend to offend less frequently than second or third generation youth, a phenomenon ascribed to an “Americanization” process [52, 53, 54]. Third generation Latinx youth commit violent offenses at approximately the same rate as non immigrant white youth [55].
FOSTE CARE & CHILD WELFARE
In 2020, there were a total of 406,466 youth in the United States foster care system. Of these, 88,111 or 22% were Hispanic [56]. In New York, there were 15,485 young people in foster care, 4,027 or 26% of whom were Hispanic. There are several paths for youth to enter the foster care system, but one of the most negative is through experiencing maltreatment In 2020, Hispanic and Latinx youth in New York experienced maltreatment reports at a proportion slightly above that of their representation in the overall youth population, 29% versus 25% [57]. Further, while Hispanic youth waiting to be adopted in NY were proportionate to their overall representation in the state (26% and 25%), actual adoptions for these Hispanic youth were disproportionately lower (16%).
PAGE 21

PAGE 22 136,100 CASES 52% NON-PETITIONED 48% PETITIONED 44% OTHER 42% DISMISSED 15% 0PROBATION .6% WAIVED 41% NON-ADJUDICATED 58% ADJUDICATED 8% OTHER 53% DISMISSED 38% PROBATION 66% PROBATION 4% OTHER 31% PLACED HISPANIC 2019 JUVENILE DELINQUENCY COURT CASE PROCESSING SOURCE: Office of Juvenile Justice & Delinquency Prevention (OJJDP), 2019 * *Note: The OJJDP utilizes the term Hispanic throughout their data
Continue to expand the availability of Spanish-speaking services such as physical and mental health services, child welfare and foster families, and juvenile justice system contact points
Heighten available support for LGBTQIA+ Latinx young people, especially for housing and mental health services
PAGE 23
ACTION STEPS
Increase and promote equitable opportunities for Latina women in education and the workplace
nvest in data collection efforts to better capture the diversity of Latinx experiences in the US by disaggregating data by Latinx groups and utilizing consistent terminology for Latinx people
Future research should further examine the role of familismo in the lives of Latinx youth
Child Protection Agencies Support Families
Resources
Immigrant and Refugee Children: A Guide for and Staff
School Support
Links to all resources listed here are available on the online issue of this document at www albany edu/yji
Education Mental Health
Provider Factsheet How
PAGE 24
Educators
IMMIGRANT FAMILIES
Therapy for Latinx National Latino Behavioral Health Association National Resource Center for Hispanic Mental Health Human Rights Campaign Latinx LGBTQ Youth Report
INDIVIDUALS
RESOURCES FOR LATINX YOUTH AND FAMILIES
NYS Office for New Americans (ONA)
Children who Lack
for Service Providers
SERVICE PROVIDERS
Latinx LGBTQ+ Youth Can and Lawful Immigration Status Strategy Brief
Immigrant
New York Legal Assistance Group Rights of Immigrant Students Factsheet
League of United Latin American Citizens National Center of the American Latino (Smithsonian) Hispanic Culture Books on Goodreads Hispanic Documentaries (List created by PBS)
q=hispanic%20origin&g=0400000US36,36%240500000&y=2020&tid=ACSDT5Y2020.B03 001
q=hispanic%20new%20york%202020&g=0400000US36%240500000&tid=DECENNIALPL 2020 P2
REFERENCES
[6] U.S. Census Bureau. (2020). HISPANIC OR LATINO, AND NOT HISPANIC OR LATINO BY RACE. Decennial Census. Retrieved from https://data.census.gov/cedsci/table?
[4] Suarez, R. (2013). Latino Americans: The 500 year legacy that shaped a nation. Celebra
[7] Lopez, M. H., Krogstad, J.M., & Flores, A. (2018). Key facts about young Latinos, one of the nation’s fastest growing populations. https://www.pewresearch.org/fact tank/2018/09/13/key facts about young latinos/
[2] Ibid
[5] U.S. Census Bureau. (2020). HISPANIC OR LATINO ORIGIN BY SPECIFIC ORIGIN. American Community Survey. Retrieved from https://data.census.gov/cedsci/table?
[9] National Association of Latino Elected Officials (2022). National Directory of Latino Elected Officials 2021.
PAGE 25
[1] Lopez, M. H., Krogstad, J. M., & Passel, J. S. (2021). Who is Hispanic? Pew Research Center. https://www.pewresearch.org/fact tank/2021/09/23/who is hispanic/
[3] “Latinx” And Gender Inclusivity. (2018). Merriam-Webster Dictionary. https://www.merriam webster.com/words at play/word history latinx
[8] Hondagneu Sotelo, P , Estrada, E , Flores, E O , & Flores, G M (2020) Latinx millennials: Enduring issues and new challenges Sociological Perspectives, 63(3), 461 477.
[16] Piña-Watson, B., Gonzalez, I. M., & Manzo, G. (2019). Mexican-descent adolescent resilience through familismo in the context of intergeneration acculturation conflict on depressive symptoms. Translational Issues in Psychological Science, 5(4), 326;
[12] Velazquez, A. M., & Kempf-Leonard, K. (2010). Mexican immigration: Insiders’ views on crime, risks, and victimization. Journal of Ethnicity in Criminal Justice, 8(2), 127 149
[18] Id. 15
[19] White, R M , Roosa, M W , Weaver, S R , & Nair, R L (2009) Cultural and contextual influences on parenting in Mexican American families. Journal of Marriage and Family, 71(1), 61 79.
[20] Stein, G. L., Cavanaugh, A. M., Castro Schilo, L., Mejia, Y., & Plunkett, S. W. (2019). Making my family proud: The unique contribution of familism pride to the psychological adjustment of Latinx emerging adults Cultural Diversity and Ethnic Minority Psychology, 25(2), 188.
[17] Stein, G L , Cavanaugh, A M , Castro Schilo, L , Mejia, Y , & Plunkett, S W (2019) Making my family proud: The unique contribution of familism pride to the psychological adjustment of Latinx emerging adults. Cultural Diversity and Ethnic Minority Psychology, 25(2), 188.
[14] Hondagneu-Sotelo, P. (1994). Gendered transitions. In Gendered Transitions. University of California press
PAGE 26
[11] Creamer, J. (2020). Inequalities Persist Despite Decline in Poverty For All Major Race and Hispanic Origin Groups. Census.Gov. https://www.census.gov/library/stories/2020/09/poverty rates for blacks and hispanics reached historic lows in 2019 html
[10] Renwick, D , & Labrador, R C (2016) Central America’s violent northern triangle Council on Foreign Relations, 19
[13] Zatz, M. S., & Smith, H. (2012). Immigration, crime, and victimization: Rhetoric and reality Annual Review of Law and Social Science, 8, 141 159
[15] Masarik, A. S., & Conger, R. D. (2017). Stress and child development: A review of the Family Stress Model Current opinion in psychology, 13, 85 90;
PAGE 27
[29] Rojas-Flores, Clements, M. L., Hwang Koo, J., & London, J. (2017). Trauma and Psychological Distress in Latino Citizen Children Following Parental Detention and Deportation. Psychological Trauma, 9(3), 352 361. https://doi.org/10.1037/tra0000177
[28] Mears, Daniel P., and Sonja E. Siennick. (2016). “Young Adult Outcomes and the Life Course Penalties of Parental Incarceration.” The Journal of Research in Crime and Delinquency 53(1):3 35
[21] Ramos, G , Ponting, C , Bocanegra, E , Chodzen, G , Delgadillo, D , Rapp, A , & Chavira, D. (2021). Discrimination and internalizing symptoms in rural Latinx adolescents: The protective role of family resilience. Journal of Clinical Child & Adolescent Psychology, 1 14.
[26] Geller, Amanda, Irwin Garfinkel, Carey E. Cooper, and Ronald B. Mincy. (2009). “Parental Incarceration and Child Well-Being: Implications for Urban Families.” Social Science Quarterly 90(5):1186 202.
[25] Ibid
[30] National Center for Education Statistics (2018) Common Core of Data (CCD) National Center for Education Statistics https://nces ed gov/ccd/tables/ACGR RE and characteristics 2018-19.asp
[27] Wildeman, Christopher (2010) Paternal Incarceration and Children’s Physically Aggressive Behaviors: Evidence from the Fragile Families and Child Wellbeing Study Social Forces, 89(1), 285 309
[22] Lopez, M H , Krogstad, J M & Flores, A (2018) Most Hispanic parents speak Spanish to their children, but this is less the case in later immigrant generations Pew Research Center. https://www.pewresearch.org/fact-tank/2018/04/02/most-hispanicparents-speak-spanish-to-their-children-but-this-is-less-the-case-in-later-immigrantgenerations/
[24] Glaze, L., & Maruschak, L. (2008). Parents in Prison and Their Minor Children. US Department of Justice Bureau of Justice Statistics, 25.
[23] Knepp, M D (2010) Tamaladas and the role of food in Mexican immigrant and Mexican American cultures in Texas State University of New York at Albany
[33] Hispanic Association of Colleges and Universities (2022) 2022 Hispanic Higher Education and HSIs Facts. https://www.hacu.net/hacu/HSI Fact Sheet.asp
[39] Hoyert, DL. (2020). Maternal mortality rates in the United States. NCHS Health EStats. DOI: https://dx.doi.org/10.15620/cdc:113967external icon
[31] Several studies discuss detrimental life course outcomes that are associated with not completing high school and point to education as an important achievement that can help people desist from delinquency or other antisocial behaviors, e.g., Laub, J. H., & Sampson, R. J. (2001). Understanding Desistance from Crime. Crime and Justice, 28, 1 69. https://doi.org/10.1086/652208; Sampson, R. J., & Laub, J. H. (1997). Crime in the making: pathways and turning points through life (3rd print). Harvard Univ. Press.
[36] Arias, E., & Xu, J. (2022). United States Life Tables, 2019. National Vital Statistics Reports, 70(19), 59
[40] Ely, D., & Driscoll, A. (2021). Infant Mortality in the United States, 2019: Data From the Period Linked Birth/Infant Death File National Center for Health Statistics (U S ) https://doi org/10 15620/cdc:111053
[34] Cuellar, M. (2018). Understanding Latinx College Student Diversity and Why It Matters. Higher Education Today. https://www higheredtoday org/2018/01/29/understanding latinx college student diversity matters/
[38] Id 10
[32] de Brey, C , Musu, L , McFarland, J , Wilkinson Flicker, S , Diliberti, M , Zhang, A , Branstetter, C., and Wang, X. (2019). Status and Trends in the Education of Racial and Ethnic Groups 2018 (NCES 2019 038). U.S. Department of Education. Washington, DC: National Center for Education Statistics. Retrieved 8/17/2022 from https://nces.ed.gov/pubsearch/.
PAGE 28
[37] Lutz, W., Striessnig, E., Dimitrova, A., Ghislandi, S., Lijadi, A., Reiter, C., ... & Yildiz, D. (2021). Years of good life is a well being indicator designed to serve research on sustainability. Proceedings of the National Academy of Sciences, 118(12), e1907351118.
[35] Ibid.
[43] Roche, K. M., Huebner, D. M., Lambert, S. F., & Little, T. D. (2022). COVID 19 Stressors and Latinx Adolescents’ Mental Health Symptomology and School Performance: A Prospective Study Journal of Youth and Adolescence, 51(6), 1031 1047
[46] Hegewisch, A., & Mefferd, E. (2021). The Longest Time to Equal Pay: Latinas and the Wage Gap. Institute for Women’s Policy Research. https://iwpr.org/wp content/uploads/2021/09/Latina Womens Equal Pay Day Fact Sheet 2021 FINAL.pdf
[42] Cortés García, L., Hernandez Ortiz, J., Asim, N., Sales, M., Villareal, R., Penner, F., & Sharp, C (2021) COVID 19 conversations: A qualitative study of majority Hispanic/Latinx youth experiences during early stages of the pandemic Child & Youth Care Forum Springer US.
[47] Ibid
[48] Jarosz, B., Mather, M., and Martinez, M. (2022). Does the Gender Pay Gap Explain Why Women Complete College Degrees at Higher Rates than Men? Population Reference Bureau (PRB). https://www.prb.org/articles/does the gender pay gap explain why women complete college at higher rates than men/#:~:text=In%20fact%2C%20women%20need%20to,than%20a %20ninth%2Dgrade%20education
[41] Penner, F , Ortiz, J H , & Sharp, C (2021) Change in youth mental health during the COVID-19 pandemic in a majority Hispanic/Latinx US sample. Journal of the American Academy of Child & Adolescent Psychiatry, 60(4), 513-523.
[44] Dolcini, M. M., Canchola, J. A., Catania, J. A., Mayeda, M. M. S., Dietz, E. L., CottoNegrón, C., & Narayanan, V. (2021). National-level disparities in internet access among low income and Black and Hispanic youth: Current population survey. Journal of Medical Internet Research, 23(10).
PAGE 29
[50] Abreu, R. L., Riggle, E. D., & Rostosky, S. S. (2020). Expressive writing intervention with Cuban-American and Puerto Rican parents of LGBTQ individuals. The Counseling Psychologist, 48(1), 106 134.
[45] Stevens, E P (1973) Machismo and marianismo Society, 10(6), 57 63
[49] Piña Watson, B., Gonzalez, I. M., & Manzo, G. (2019). Mexican descent adolescent resilience through familismo in the context of intergeneration acculturation conflict on depressive symptoms Translational Issues in Psychological Science, 5(4), 326
APPENDIX
DATA SOURCE DESCRIPTIONS
[51] Sickmund, M , Sladky, A , and Kang, W (2021) Easy Access to Juvenile Court Statistics: 1985 2019 https://www ojjdp gov/ojstatbb/ezajcs/
[55] Sampson, R J , Morenoff, J D , & Raudenbush, S (2005) Social Anatomy of Racial and Ethnic Disparities in Violence American Journal of Public Health, 95(2), 224 232 https://doi.org/10.2105/AJPH.2004.037705
[53] Sutherland, E H (1947) Principles of criminology (4th ed ) J B Lippincott
[56] Annie E. Casey Foundation. (2022). Children in foster care by race and Hispanic origin. KIDS COUNT Data Center. https://datacenter.kidscount.org/data/tables/6246 children in foster care by race and hispanic origin
[52] Ousey, G. C., & Kubrin, C. E. (2009). Exploring the Connection between Immigration and Violent Crime Rates in U.S. Cities, 1980 2000. Social Problems, 56, 447.
PAGE 30
[54] Vigil, J. D. (2002). Community dynamics and the rise of street gangs. In M. M. SuárezOrozco & M. M. Páez (Eds.), Latinos: Remaking America. Berkeley: University of California Press.
This brief uses several major administrative data sources from a variety of fields It is important to provide the overarching context of these sources as well as provide information about how they define the population of interest for this brief.
[57] Williams, S. C. (2022). State-level Data for Understanding Child Welfare in the United States. Child Trends. https://www.childtrends.org/publications/state level data for understanding child welfare in the united states
Criminal Justice Data & Parental Incarceration
Education Data (K-12 and Postsecondary)
PAGE 31
The Office of Juvenile Justice and Delinquency Prevention (OJJDP) funds the National Center for Juvenile Justice, which produces national statistics about juvenile offending and victimization through the Statistical Briefing Book (SBB). The data are presented at the national , state, and county level and can be filtered to show data regarding age, sex, race, and ethnicity at several system processing points including arrest and detention For their presentation of race and ethnicity, these data conform to the US Census’ “bridgedrace categories” to account for methodological and definitional changes to the Census, which allows for consistent analyses across time. These “bridged race” data and the “vintage” data and their accompanying documentation are available through the National Center for Health Statistics’ National Vital Statistics System
The National Center for Education Statistics (NCES) produces regular surveys of samples of students across the US for a variety of topics. They note that “all race/ethnicity data are collected according to Office of Management and Budget (OMB) standards For all surveys, data on individuals can be disaggregated by ‘Black,’ ‘White,’ ‘Hispanic,’ and ‘Other;’ for some surveys, data can also be disaggregated by ‘Asian/Pacific Islander’ and ‘American Native or Alaska Native.’” Some of their reports further disaggregate the Hispanic racial category to identify country or region of origin, however, not all of their data allows for this disaggregation.
The Civil Rights Data Collection (CRDC) is a biannual census of US public schools conducted by the Office of Civil Rights at the US Department of Education. There are strict quality control measures to ensure the most accurate reporting possible. As of summer 2022, the most recent publicly released data is from academic year 2017 2018. There are questions that address district level characteristics and others that address school level characteristics, with measures added or adapted to changing contexts The CRDC collects enrollment data, course offerings and enrollments, SAT/ACT participation, sport involvement, and school discipline measures, broken out by race, gender, and disability status. In their measurements, they define seven racial categories: Native American, Asian, Black, Hispanic, Hawaiian/Pacific Islander, White, and two or more races. As such, they do not have the ability to specific discuss Hispanic students who have an additional racial identity (e g , Black Hispanic or White Hispanic, etc ) This is a limitation that could be addressed by having two questions, one regarding ethnicity and the other regarding race. These data do a commendable job at disaggregating their data, this would be one step further and advance the field’s ability to more precisely address Hispanic students.
Child Welfare Data
PAGE 4
D A T A S O U R C E S AnnieE CaseyFoundation (2021) 2021KidsCountDatabook https://assetsaecforg/m/resourcedoc/aecf 2021kidscountdatabook 2021pdf Boyd,T.(2016).MasterListofCRDCDefinitions.27.Retrievedfrom https://ocrdataedgov/assets/downloads/CRDC Definitions 2015 16pdf NationalCenterforEducationStatistics(NCES).(2022).NCESHandbookofSurveyMethods Introduction.NationalCenterforEducationStatistics.https://nces.ed.gov/statprog/handbook/ indexasp NationalCenterforHealthStatistics.(2022).U.S.CensusPopulationsWithBridgedRace Categories.https://www.cdc.gov/nchs/nvss/bridged race.htm NationalCenterforJuvenileJustice (2022) EasyAccesstoJuvenilePopulations https://www.ojjdp.gov/ojstatbb/ezapop/ NationalDataArchiveonChildAbuseandNeglect(NDACAN) (2022) AdoptionandFosterCare AnalysisandReportingSystem(AFCARS)Codebook https://www.ndacan.acf.hhs.gov/datasets/pdfs user guides/afcars adoption file codebook.pdf
The Annie E. Casey Foundation produces an annual report titled Kids Count that addresses various nationwide trends and experiences of children under the age of 18 This provides a nationwide snapshot of health, economic, education, family and community, and overall well-being. Similar to AFCARS, the Kids Count data is disaggregated by race and ethnicity. They have a racial category of Latino, which includes “people who identified as being of Hispanic, Latino or Spanish origin” and then excludes people of these identities from the racial groups. Each racial group includes both Hispanic and non Hispanic youth other than White, which is reported explicitly as White, non Hispanic
The US Department of Health and Human Services’ Administration for Children and Families produces annual reports of adoption and foster care cases. These data are publicly available through the Adoption and Foster Care Analysis and Reporting System (AFCARS) with data support provided by the National Data Archive on Child Abuse and Neglect (NDACAN) These data report on youth age, sex, placement setting, case goal, race and ethnicity, cause for removal, and other related areas These data separate race and ethnicity, defining race as excluding Hispanic, and Hispanic youth can belong to any racial category.