12 minute read
buildings (d


28 Chapter 2
- In the downstream passage, the reverse trend is observed. Increasing w increases PD/PDref.
Advertisement
The highest PD/PDref occurs for the widest upstream passage and near the passage entrance.
The maximum PD/PDref in downstream passage shows an increase of 207% from the narrowest passage (w = 0.15B) to the widest one (w = 0.75B). Note that similar trends as presented for z/H = 0.97 in Fig. 2.10 for both the upstream and downstream passages are observed at lower elevations namely z/H = 0.9, 0.8, 0.7, as shown in Table 2.4.
Figure 2.10. Profiles of the dimensionless power density along horizontal line at z/H = 0.97 for different passage widths w between upstream buildings.
Table 2.4. Compariosion of dimensionless maximum power density along the centerline at heights z/H = 0.97, 0.9, 0.8 and 0.7 for different w/B.
Max. PD/PDref in upstream passage Max. PD/PDref in downstream passage w 0.15B 0.3B 0.45B 0.6B 0.75B 0.15B 0.3B 0.45B 0.6B 0.75B z/H = 0.97 2.01 1.62 1.30 1.00 0.81 0.38 0.52 0.79 0.98 1.17 z/H = 0.9 2.21 1.66 1.24 0.91 0.70 0.51 0.57 0.83 1.03 1.24 z/H = 0.8 1.89 1.51 1.06 0.73 0.54 0.55 0.59 0.83 1.01 1.21 z/H = 0.7 1.66 1.33 0.89 0.58 0.41 0.57 0.61 0.80 0.97 1.15
2.5.2 Impact of streamwise distance between upstream and downstream buildings (d)
The streamwise distance between upstream and downstream buildings is investigated for d varying from 3 m to 12 m, corresponding to d = 0.15B to 0.6B, respectively. Note that for all cases w = 0.75B and ΔH = 0.
Urban wind energy potential: Impact of building arrangement and height 29

Figure 2.11. Contour plots of (a-d) dimensionless velocity magnitude (with superimposed streamlines) in vertical centerplane (y/B = 0) and (e-h) horizontal plane at z/H = 0.97 for different streamwise distances d between the upstream and downstream buildings.
Figs. 2.11 and 2.12 show the contour plots of V3D/Uref (with superimposed streamlines) and PD/PDref in the vertical center plane (y/B = 0 in Fig. 2.11a-d and Fig. 2.12a-d) and the horizontal plane (z/H = 0.97 in Fig. 2.11e-h and Fig. 2.12e-h) for different values of d. It can be seen that: - As d increases, the flow in the upstream passage becomes more accelerated up to V3D/Uref of 1.3. This is attributed to the upstream effect of the downstream buildings, which acts to slow down the approach flow, as demonstrated in earlier studies [50, 83, 102]. In addition, the region of highly accelerated flow in the passage is more extended in the streamwise, lateral
30 Chapter 2
and vertical directions. For the shortest d, i.e., 0.15B, the maximum V3D/Uref is 1 near the two side corners of the upstream building, where flow separation causes the creation of highspeed corner streams. This corresponds to PD/PDref = 0.9. For the highest value of d = 0.6B, the maximum V3D/Uref increases to 1.2 near the passage entrance of the upstream building, generating PD/PDref of 1.3. - By increasing d, the region of low V3D/Uref near the windward facades of the downstream buildings is enlarged, and the flow is deviated over and around the downstream buildings.
In order to better understand the air flow pattern near the downstream buildings as a function of d, Table 2.5 lists the dimensionless flow rate through different surfaces of the control volume between the upstream and downstream buildings shown in Fig. 2.9. For the smallest value of d, i.e., 0.15B, 30% of the incoming flow goes through the control volume, where wind energy harvesting is considered, while 13% exits vertically and another 56% flows through the lateral surfaces. By increasing d from 0.15B to 0.60B, the flow rate through the downstream surface reduces to 24%, which shows about 20% reduction with respect to the case with d = 0.15B. The DFR through the control volume reduces to 46% for the lateral surfaces, and increases to 30% for the horizontal surfaces. Note that the air flow rate through the upstream surface of the control volume changes by about 14% as d/B increases from 0.15 (Case W4) to 0.6 (Case D3). - As d increases, the area of maximum flow velocity and power density in the downstream passage slightly decreases. For all cases, the maximum V3D/Uref of 1.2 in the passage appears near the passage entrance. For the smallest d of 0.15B in Fig. 2.11a, the regions of high wind energy potential (PD/PDref > 1.2) only appears near the passage entrance, and extends vertically downward until an elevation of z/H = 0.4. Increasing d also reduces the vertical extent of the region with high wind energy potential region the downstream passage.
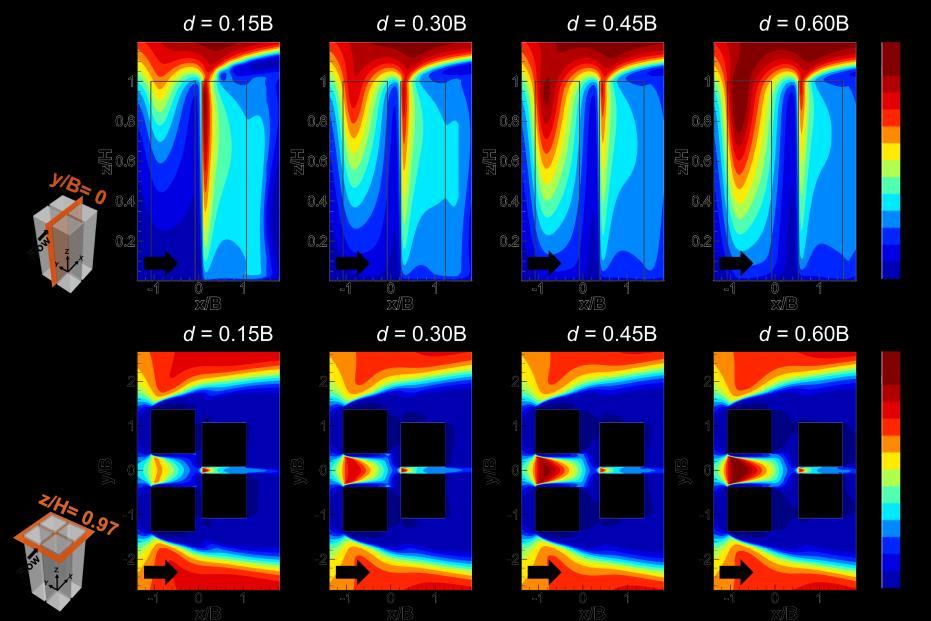
Figure 2.12. Contour plots of the dimensionless power density for different streamwise distances d between the upstream and downstream buildings in (a-d) vertical centerplane (y/B = 0) and (e-h) horizontal plane at z/H = 0.97.
Urban wind energy potential: Impact of building arrangement and height 31
Table 2.5. Flow rate and DFR through different surfaces of the control volume shown in Fig. 2.9 for different d/B. case name d/B FR(US) [m3/s] DFR(DS) DFR(LSs) DFR(HSs)
Case W4 0.15 926 0.30 0.56 0.13
Case D1 0.30 990 0.27 0.52 0.21
Case D2 0.45 1030 0.25 0.50 0.25
Case D3 0.60 1058 0.24 0.46 0.30
Figure 2.13 shows the profiles of PD/PDref along a horizontal line (centerline) at z/H = 0.97 for different values of d. It can be seen that: - In the upstream passage, the maximum PD is highly sensitive to d as increasing d substantially enhances PD. For the largest value of d = 0.6B, the maximum PD/PDref is about 1.3, which is about 65% higher than that for the case with d = 0.15B. - In the downstream passage, the maximum PD is weakly sensitive to d where increasing d from 0.15B to 0.6B leads to about 11% reduction in PD. This is in line with the observations of flow rate in the downstream passage, which is also found to be weakly sensitive to d (see
Table 2.4).
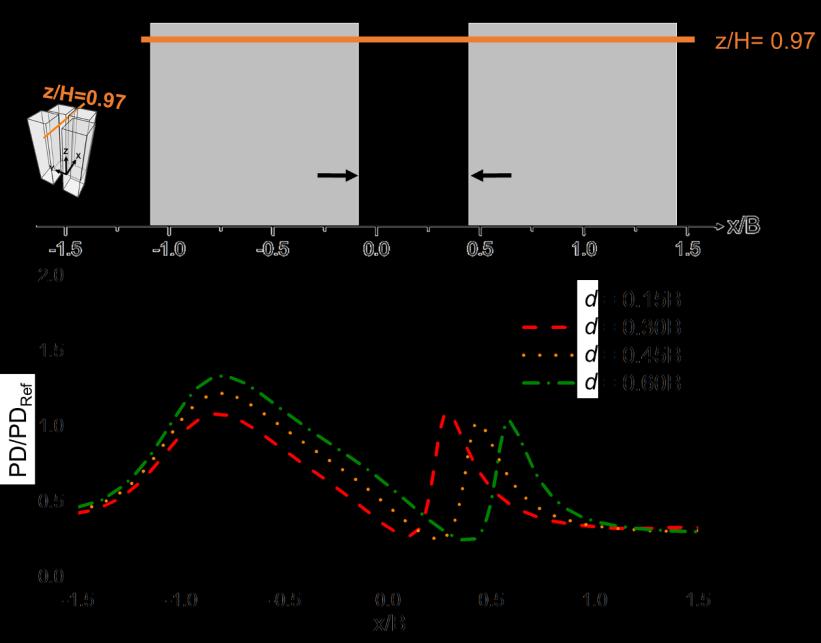
Figure 2.13. Profiles of the dimensionless power density along centerline at z/H = 0.97 for different streamwise distances between the upstream and downstream buildings.
2.5.3 Impact of height difference between upstream and downstream buildings (ΔH)
To analyze the impact of the height difference between the upstream and downstream buildings (ΔH = Hu – Hd), the upstream building height Hu is varied from 60 m to 120 m, while the downstream building height Hd is retained at 90 m. This corresponds to ΔH between -0.3H and 0.3H. Note that for all cases both d and w are fixed at 0.15B, the same as the reference case. Figs. 2.14 and 2.15 show the contour plots of V3D/Uref (with superimposed streamlines) and PD/PDref in the vertical center plane at y/B = 0 for different values of ΔH. It can be seen that:
32 Chapter 2
- For ΔH < 0 (corresponding to the cases where the upstream buildings are lower than the downstream ones), a high-velocity region is observed at the windward surfaces of the upstream and downstream building, where the flow is accelerated to V3D/Uref of 1.2, corresponding to PD/PDref of 1.7. As ΔH increases from -0.3 to -0.1, the vertical extent of the high-velocity region gets more limited and becomes negligible at ΔH = -0.1H. In addition, the streamwise extent of the high-velocity region along the roof of the downstream buildings also reduces. - For ΔH = 0 (reference case) and ΔH > 0 (cases of upstream buildings higher than downstream buildings), the downstream buildings are located in the wake of the upstream buildings resulting in a significant reduction in the wind velocity in the downstream passage. In this case, V3D/Uref varies between 0.4 (ΔH = 0) and 0.75 (ΔH = 0.3H). This corresponds to PD/PDref values ranging from 0.3 to 0.7, respectively. However, a considerable high-velocity region is present in the upstream passage and above the roof of the upstream buildings, where the flow is accelerated to PD/PDref of 2.0. By increasing ΔH, the vertical extent of the area of highly-accelerated flow in the upstream passage grows.

Figure 2.14. Contour plots of the dimensionless velocity magnitude (with superimposed streamlines) in vertical centerplane (y/B = 0) for different heights of the upstream buildings.
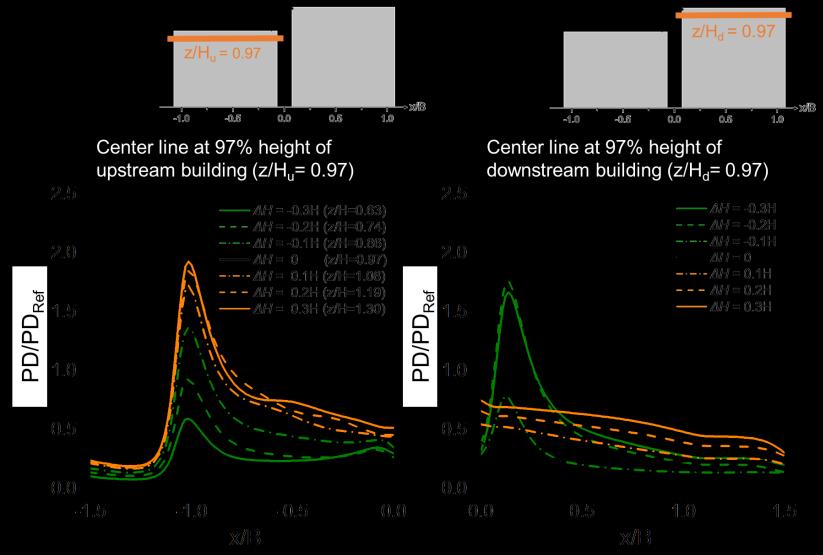
Fig. 2.16 shows the profiles of the dimensionless power density along the centerline at (a) z/Hu = 0.97 and (b) z/Hd = 0.97 for different values of ΔH. Note that because the height of the upstream buildings varies for each case, the presented data are at different z/H. It can be seen that: - In the upstream passage: For the cases with ΔH ≥ 0, a peak in PD/PDref can be observed. The case with equal heights of upstream and downstream buildings (ΔH= 0) presents the maximum wind power density, i.e., PD/PDref = 2.0. - In the downstream passage: the reference case with ΔH = 0 reveals the lowest maximum in
PD/PDref, as compared to the other cases. The cases with ΔH < 0 present high power densities in the downstream passage. The maximum PD/PDref value of 1.8 corresponds to ΔH = -0.2H,
Urban wind energy potential: Impact of building arrangement and height
which is around 364% larger than that of the reference case (ΔH = 0). 33
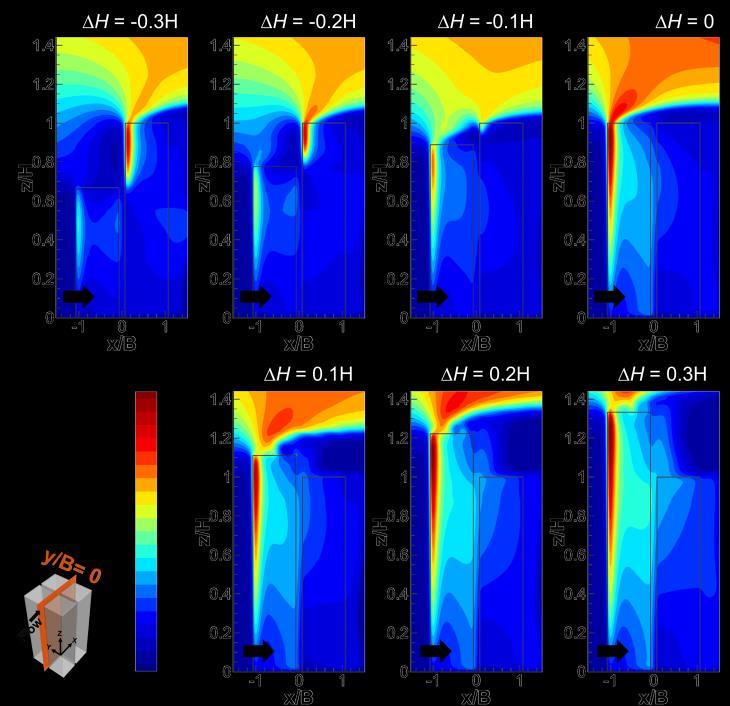
Figure 2.15. Contour plots of the dimensionless power density in vertical centerplane (y/B = 0) for different heights of the upstream buildings.
Figure 2.16. Profiles of dimensionless power density along the centerline at (a) z/Hu = 0.97 and (b) z/Hd = 0.97 for different height difference between the upstream and downstream buildings.
34 Chapter 2
2.5.4 Impact of wind turbine type/orientation
The calculation of the wind power density is typically performed based on the streamwise component of the mean velocity, which is the component of velocity used to calculate the power density for the typical HAWTs [103]. This approach was used in Section 2.5.1 – 2.5.3. Moreover, many studies emphasized that vertical axis wind turbines (VAWTs) are highly advantageous over HAWTs primarily due to their potential power gain in vertically skewed airflows and omnidirectionality [19-21]. To further evaluate the wind energy potential considering other types of wind turbines, an analysis is performed in this section to compare the calculated wind power density for different types of turbines. Note that the velocity component is different for each turbine type as indicated in Fig. 2.17. a) The typical HAWTs: The corresponding power density, termed as PDH, is calculated using the mean streamwise velocity component (U), as the normal component to the rotor plane. b) The typical Darrieus (lift-based) VAWTs: the corresponding power density, termed as PDVV, is calculated using the vector sum of the streamwise and lateral velocity components (√��2 +��2). c) The horizontally-mounted Darrieus VAWTs: the corresponding power density, PDVH, is calculated using the vector sum of the streamwise and vertical velocity components (√��2 +��2).
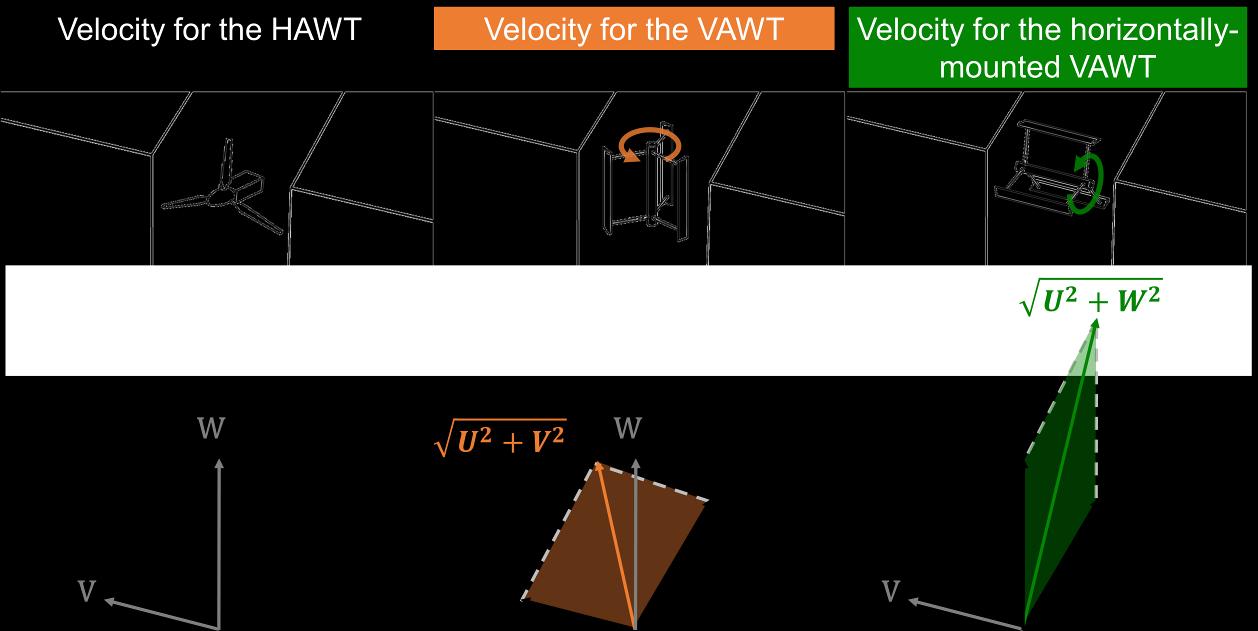
Figure 2.17. The velocity vector employed for the calculation of the wind power density for three types of wind turbines.
For the analysis, the cases with the highest power density in the upstream and downstream passages are selected as follows: - Case Ref: the reference case, which has the narrowest upstream passage (w = 0.15B, d = 0.15B,
ΔH = 0) - Case W4: the case with the widest passage between the upstream buildings (w = 0.75B, d = 0.15B, ΔH = 0) - Case D3: the case with the longest streamwise distance between the upstream and downstream buildings (w = 0.75B, d = 0.6B, ΔH = 0) - Case H-2: the case for which the height of the upstream buildings is lower than the downstream buildings (w = 0.15B, d = 0.15B, ΔH = -0.2H)
Urban wind energy potential: Impact of building arrangement and height 35
Fig. 2.18 shows the profiles of the dimensionless power density for different turbine types along the centerline at z/H = 0.97 and 1.03, respectively, for the aforementioned cases. The lines of PDVV and PDH evidently overlap due to the absence of lateral velocity component along the centerline in this symmetric flow configuration. The maximum PDVH values at z/H = 0.97 are 20%, 36%, 8%, and 9% higher than PDH along the whole line for the Case Ref, Case W4, Case D3, and Case H-2, respectively. The maximum PDVH values at z/H = 1.03 are 76%, 21%, 37% and 45% higher than that PDH for four selected cases, respectively. This indicates the remarkable contribution of the vertical velocity component, which is clearly advantageous for wind energy harvesting. Based on the presented analysis, the horizontally-mounted Darrieus VAWTs are to be preferred as the best turbine type/orientation for wind energy harvesting in the passage between the high-rise building arrays near the roof as well as along the roof for the normal wind direction of 0°.
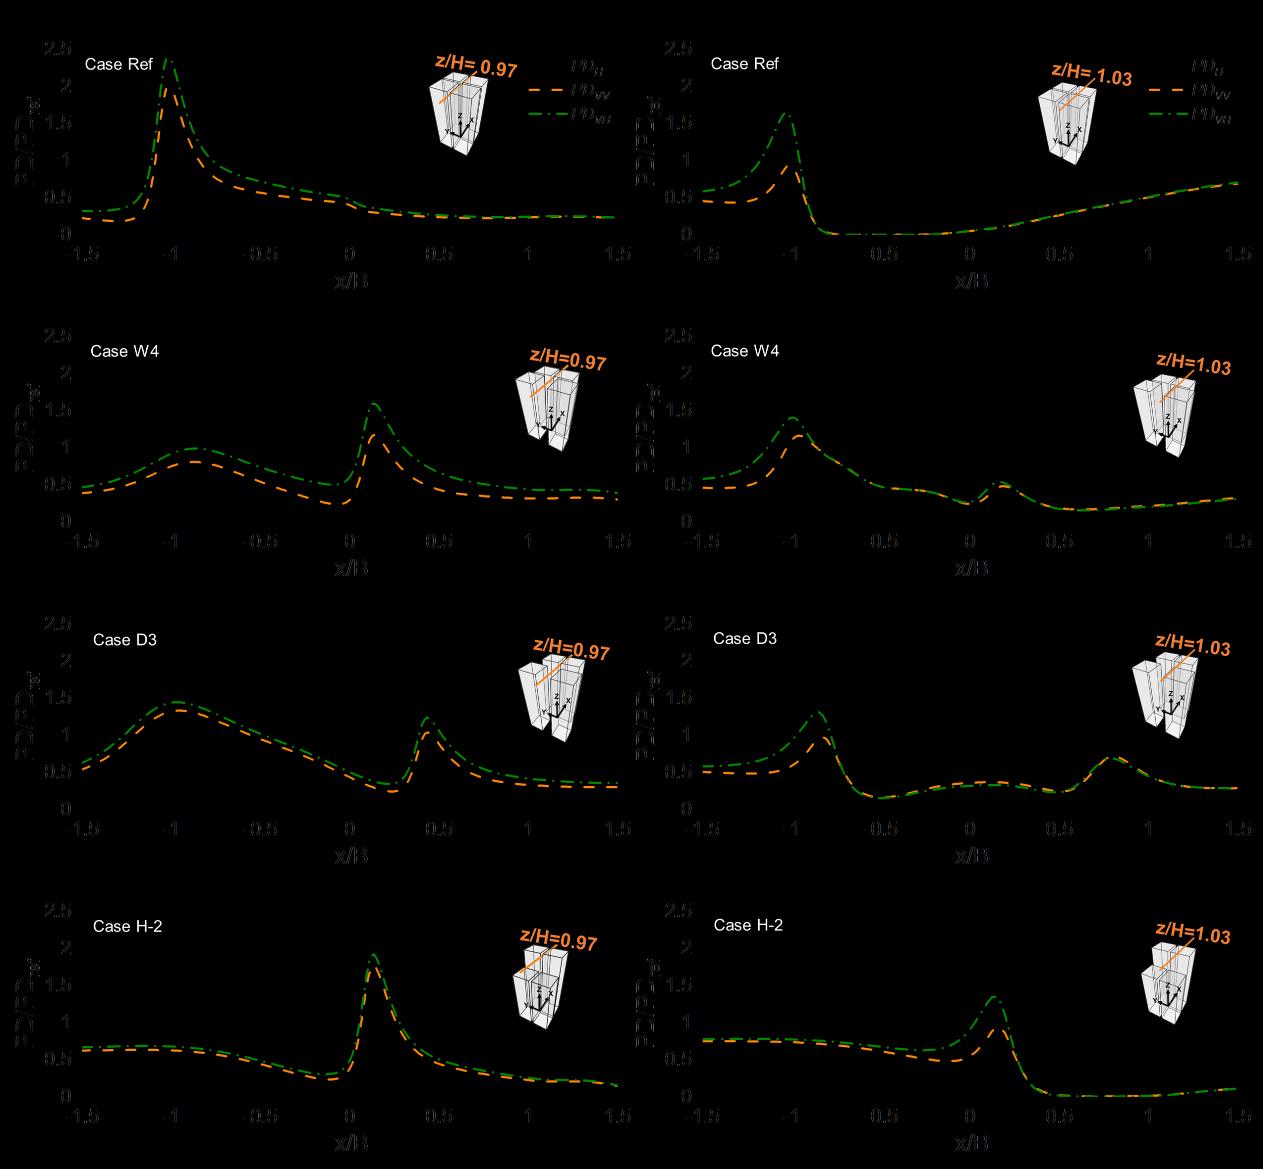
Figure 2.18. Profiles of dimensionless power density for different turbine types, i.e. HAWT (PDH), VAWT (PDVV), and horizontally-aligned VAWT (PDVH), along horizontal lines at (a-d) z/H = 0.97 and (e-h) z/H = 1.03 for four selected cases: Case Ref, Case W4, Case D3 and Case H-2.
36 Chapter 2
2.5.5 Impact of wind direction
Previous studies have shown the significant influences of wind direction and building arrangement on the wind flow patterns around buildings [36, 37, 61]. Thus, in this section, the impact of wind direction on the wind energy potential is investigated. The analysis is performed for three wind directions (0°, 22.5°, 45°). The simulations are performed for the four cases with the highest power densities, i.e., Case Ref, Case W4, Case D3, and Case H-2, see Section 2.5.4. Fig. 2.19 shows the contour plots of the dimensionless power density in the horizontal plane at z/H = 0.97 for the different wind directions for the selected cases, see Table 2.2. The wind power density is highly sensitive to the wind direction. For wind direction 22.5°, the wind flow tends to be more tilted to one side and hard to pass through the passage due to the oblique airflow direction, which causes comparatively low PD/PDref values in the upstream and downstream passages, with respect to zero wind direction. For wind direction 45°, a substantial decrease in PD/PDref along the passage between the buildings is observed.
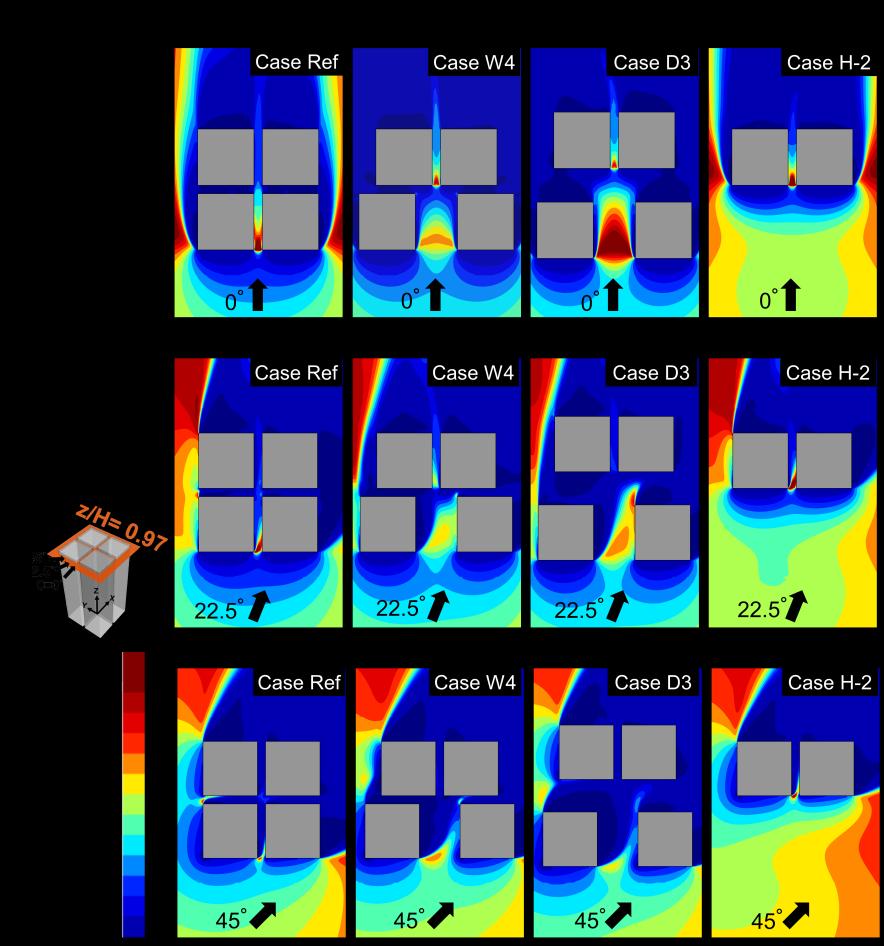
Figure 2.19. Contour plots of dimensionless power density in horizontal plane at z/H = 0.97 for different wind directions (0°, 22.5°, and 45°) for selected cases: (a, e, i) Case Ref, (b, f, j) Case W4, (c, g, k) Case D3 and (d, h, l) Case H-2.