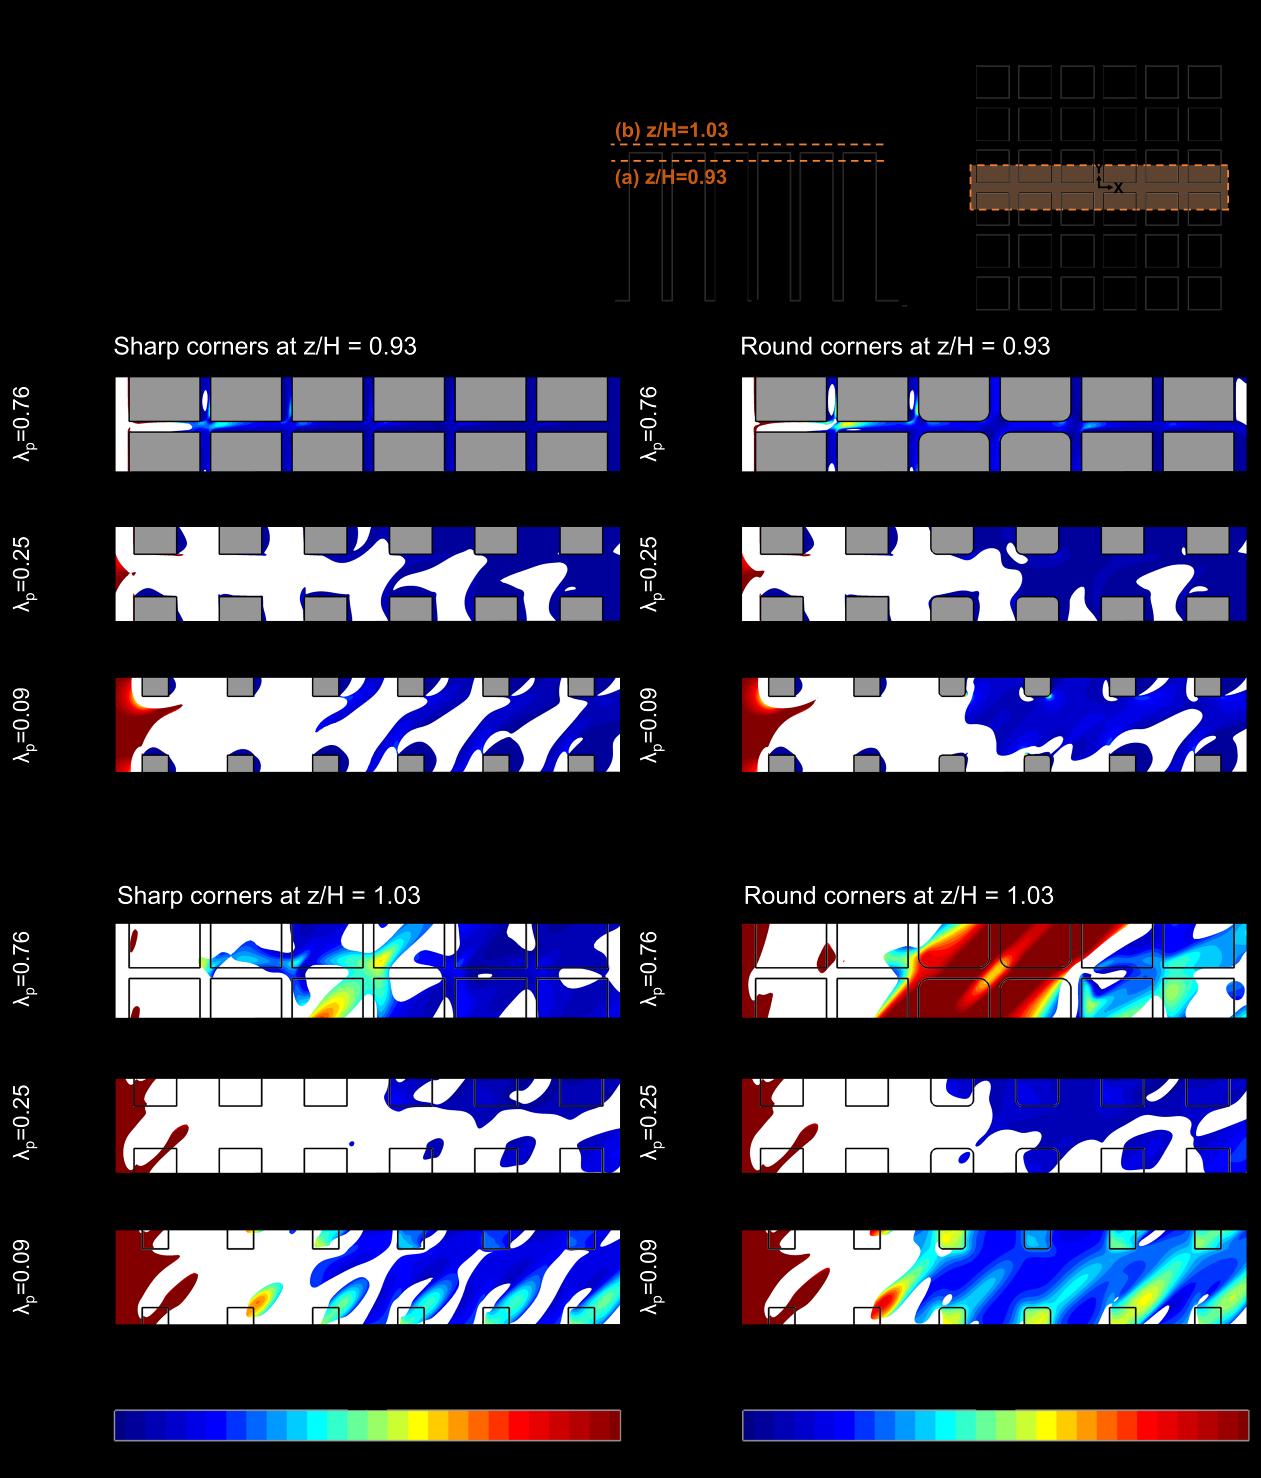
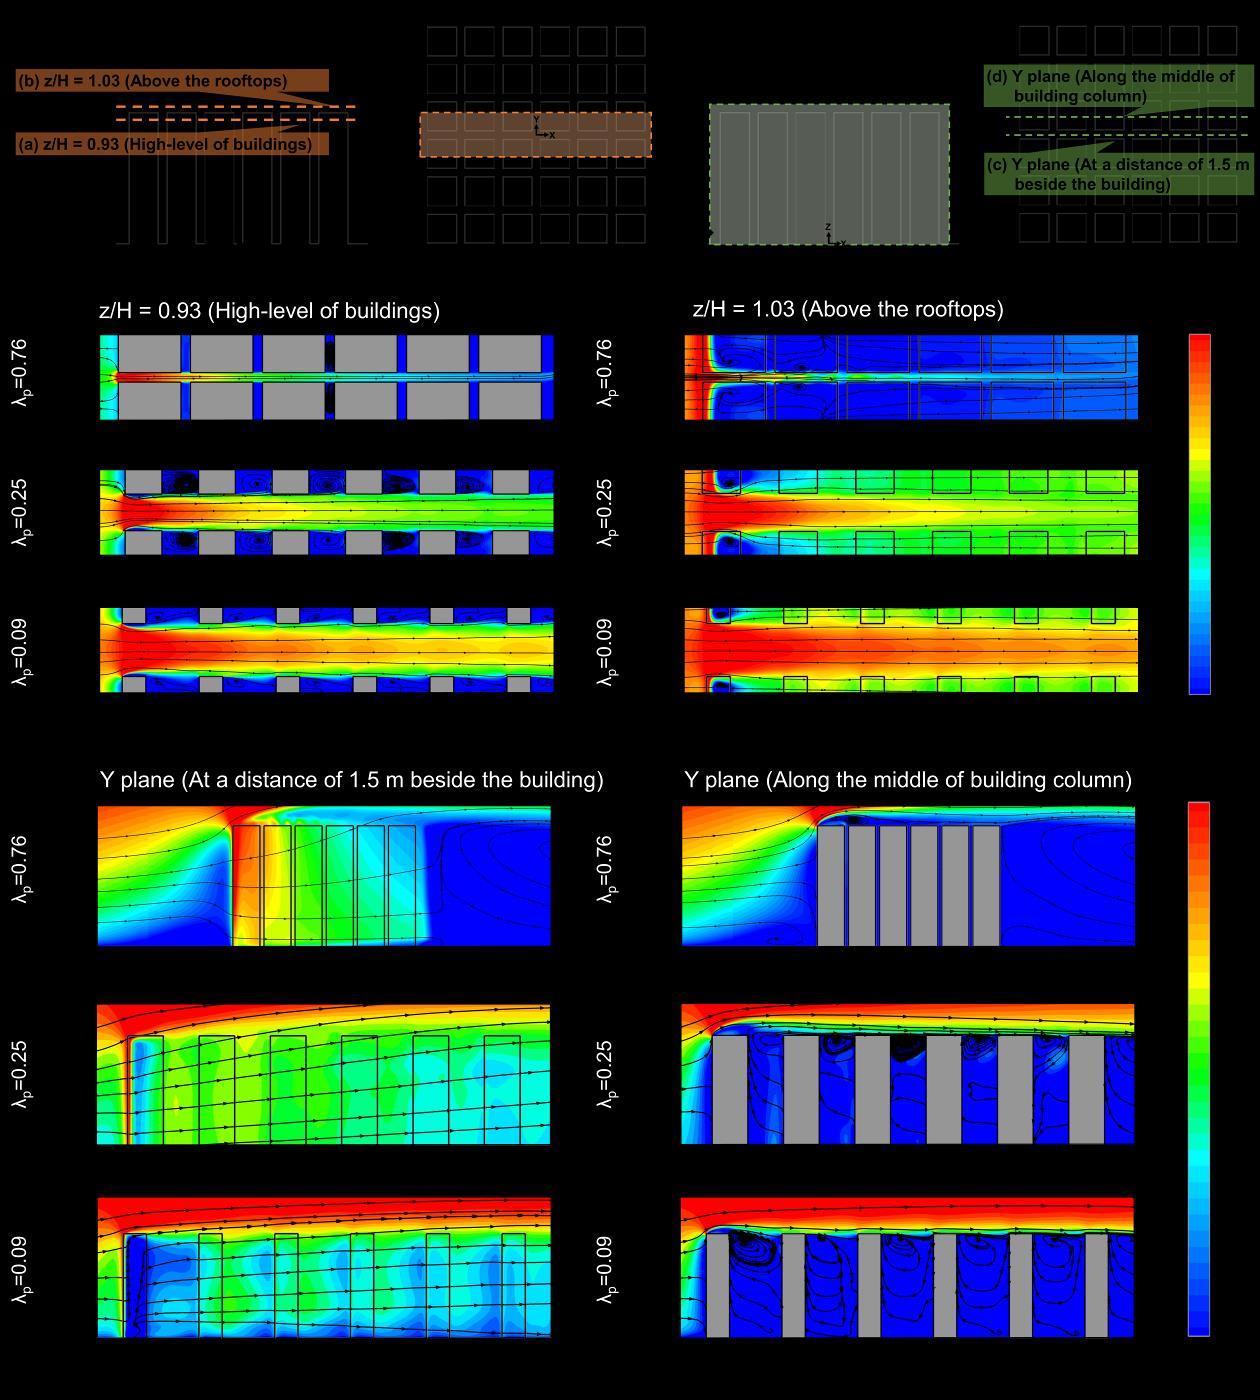
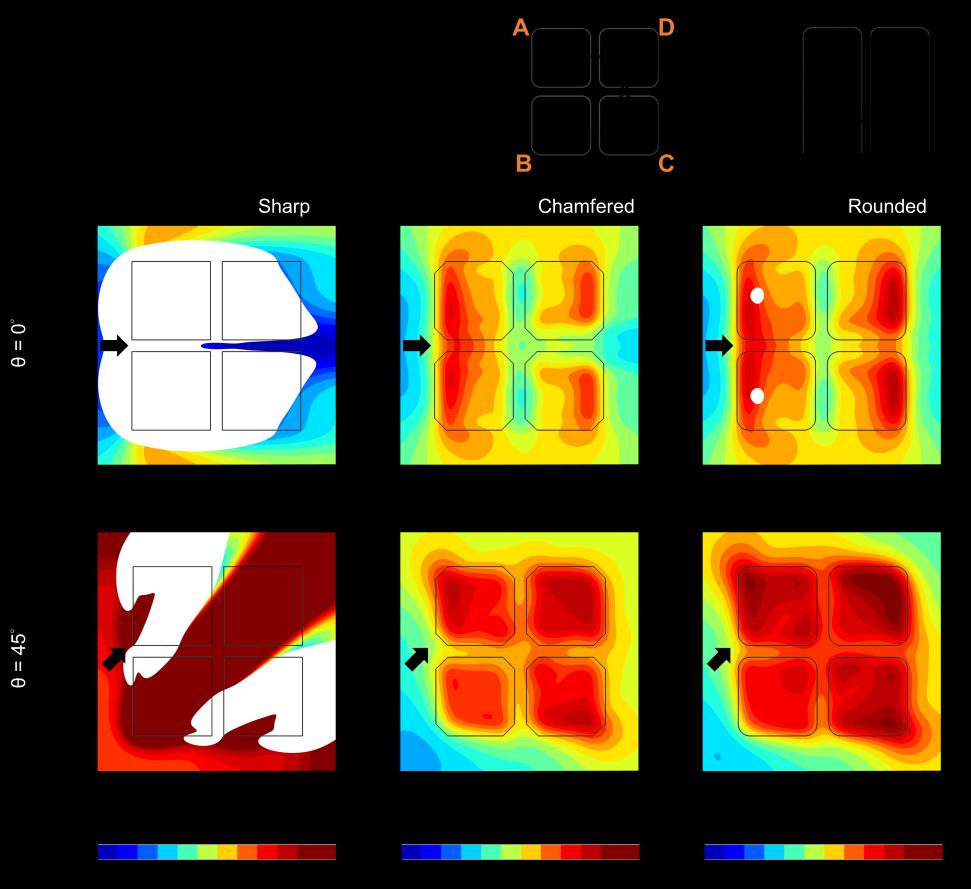
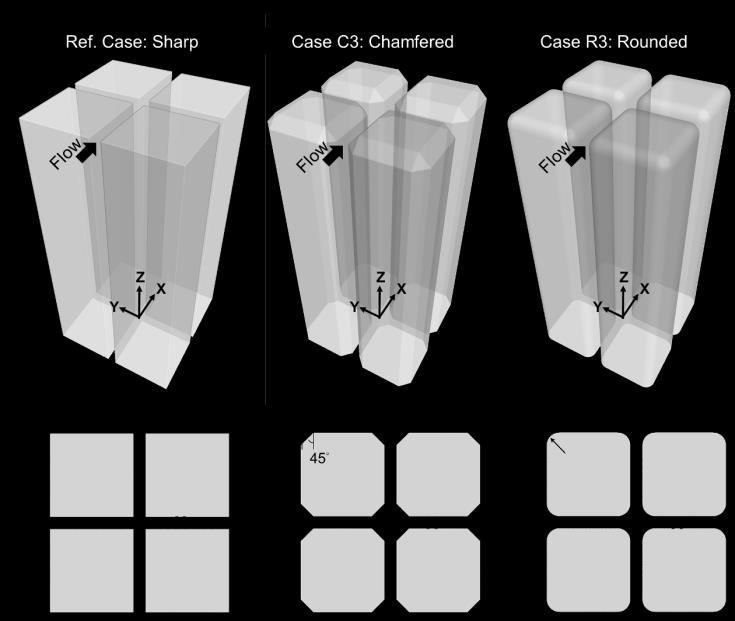
Chapter 2
28
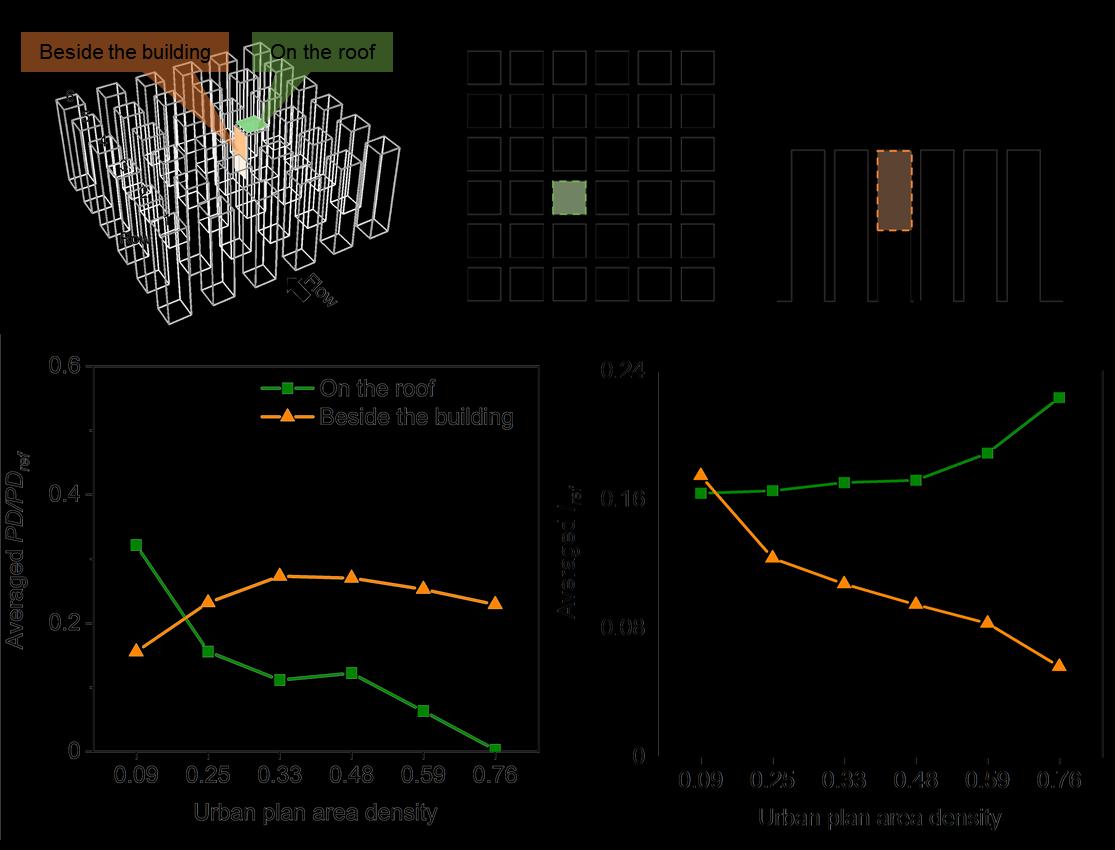
In the downstream passage, the reverse trend is observed. Increasing w increases PD/PDref. The highest PD/PDref occurs for the widest upstream passage and near the passage entrance. The maximum PD/PDref in downstream passage shows an increase of 207% from the narrowest passage (w = 0.15B) to the widest one (w = 0.75B). Note that similar trends as presented for z/H = 0.97 in Fig. 2.10 for both the upstream and downstream passages are observed at lower elevations namely z/H = 0.9, 0.8, 0.7, as shown in Table 2.4. -
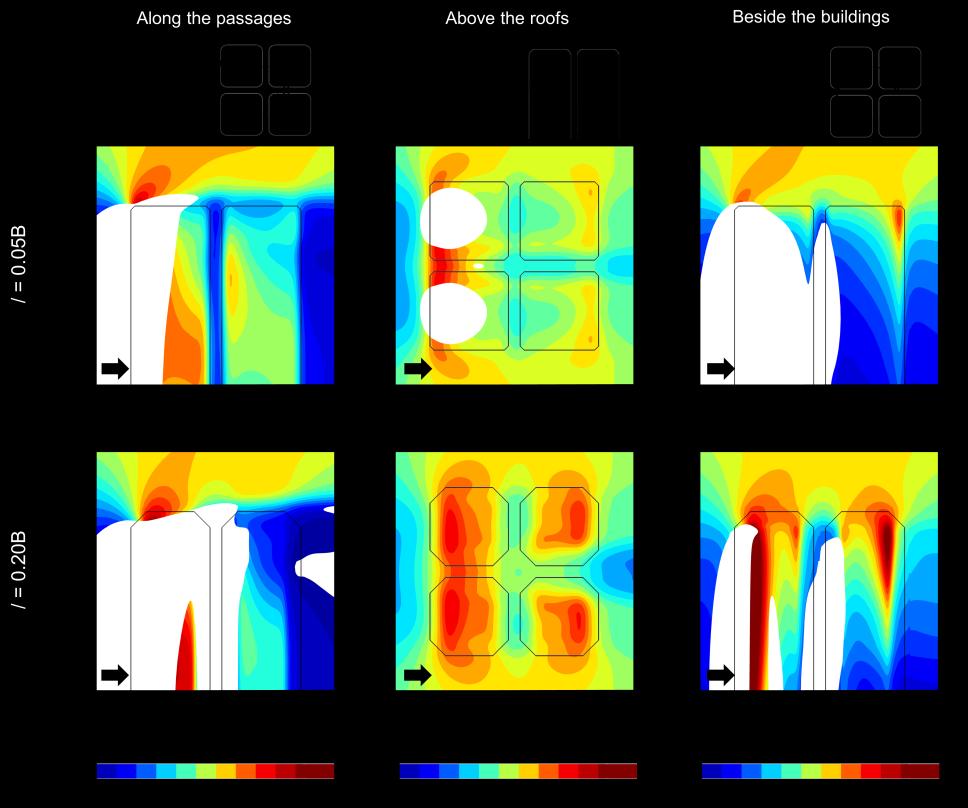
Figure 2.10. Profiles of the dimensionless power density along horizontal line at z/H = 0.97 for different passage widths w between upstream buildings. Table 2.4. Compariosion of dimensionless maximum power density along the centerline at heights z/H = 0.97, 0.9, 0.8 and 0.7 for different w/B.
w z/H = 0.97 z/H = 0.9 z/H = 0.8 z/H = 0.7
2.5.2
Max. PD/PDref in upstream passage 0.15B 0.3B 0.45B 0.6B 0.75B 2.01 1.62 1.30 1.00 0.81 2.21 1.66 1.24 0.91 0.70 1.89 1.51 1.06 0.73 0.54 1.66 1.33 0.89 0.58 0.41
Max. PD/PDref in downstream passage 0.15B 0.3B 0.45B 0.6B 0.75B 0.38 0.52 0.79 0.98 1.17 0.51 0.57 0.83 1.03 1.24 0.55 0.59 0.83 1.01 1.21 0.57 0.61 0.80 0.97 1.15
Impact of streamwise distance between upstream and downstream buildings (d)
The streamwise distance between upstream and downstream buildings is investigated for d varying from 3 m to 12 m, corresponding to d = 0.15B to 0.6B, respectively. Note that for all cases w = 0.75B and ΔH = 0.