1 minute read
3.5.5 Impact of wind direction
62 Chapter 3
3.5.5 Impact of wind direction
Advertisement
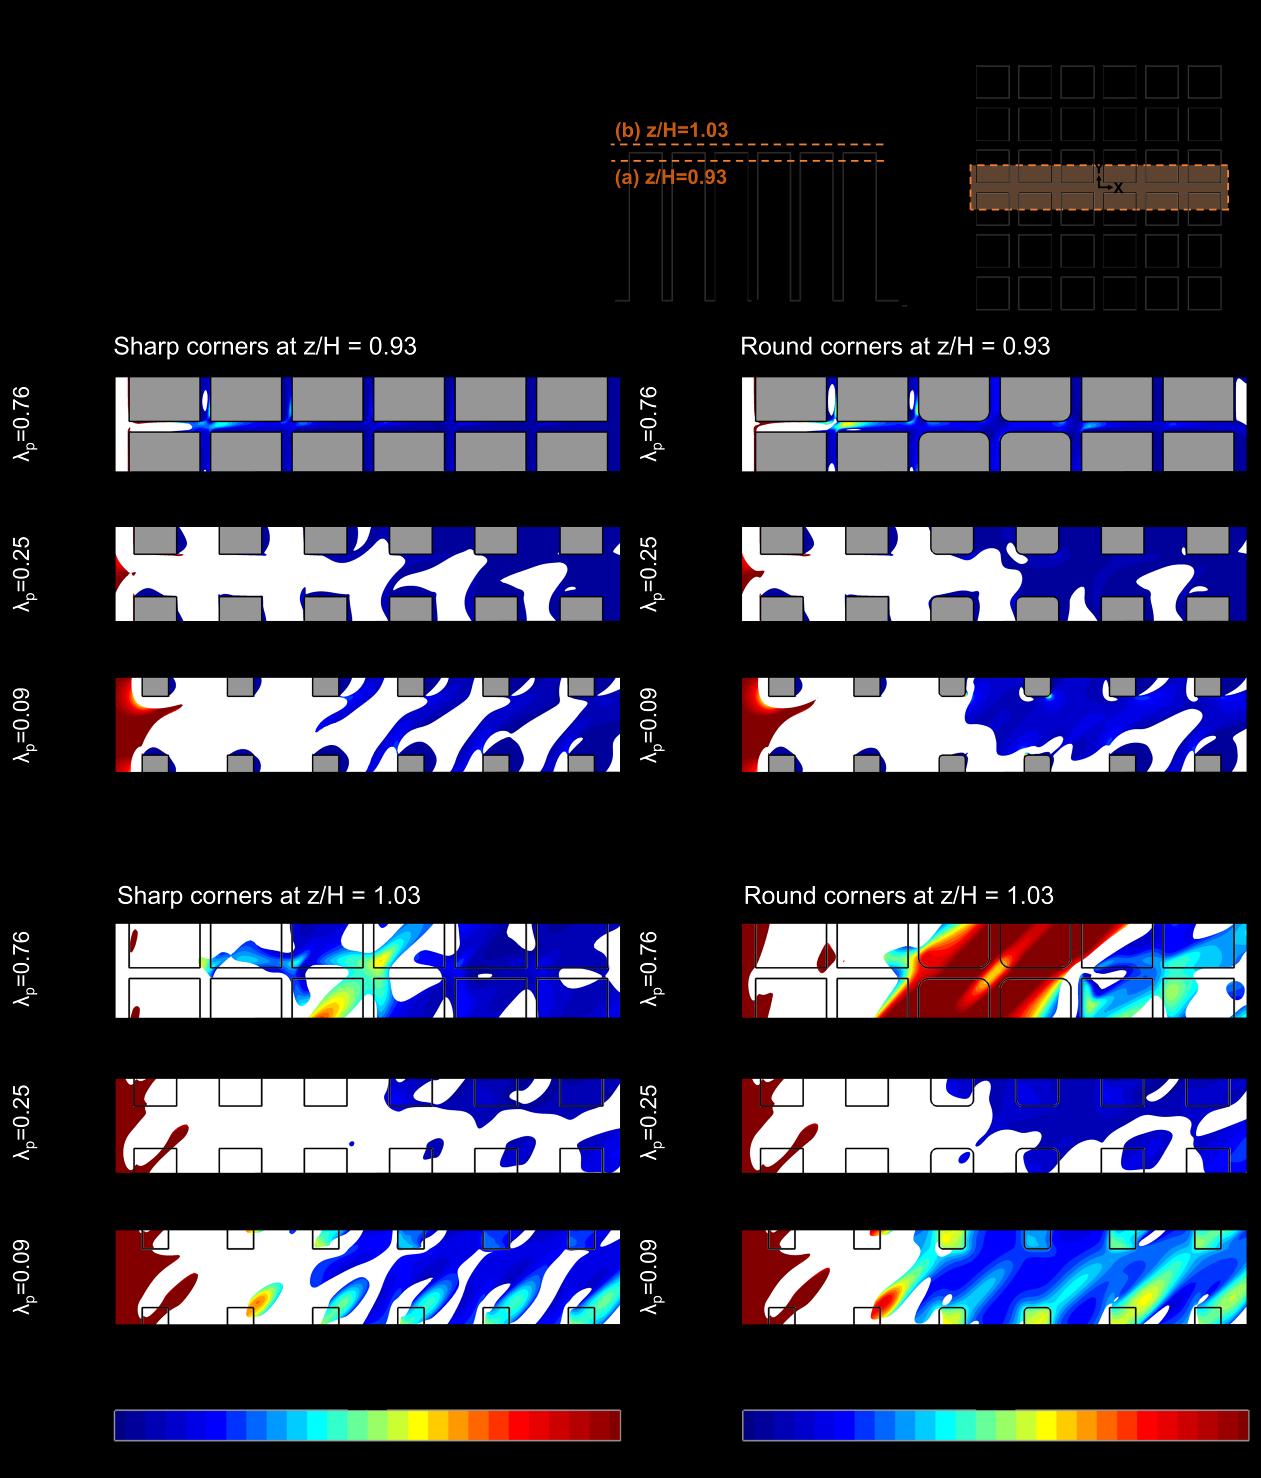
The contour plots of PD/PDref, with high turbulence regions with Iref > 0.16 masked with white color, in the horizontal planes at z/H = 0.93 (just below the roof) and 1.03 (just above the roof) are shown in Fig. 3.15 and Fig. 3.16, respectively, for wind directions of 0° and 45°. Here the wind power density is calculated using the streamwise velocity component as for the typical HAWTs. Note that the high turbulence region (Iref > 0.16) is masked with white color, signaling its unsuitability for turbine installation based on the IEC standard [128]. It can be seen that the magnitude and distribution of the wind power density and the extent of the high turbulence regions are very sensitive to the flow angle and very different values and patterns are observed for the two flow angles studied. The URAR for the wind directions of 0° and 45° are listed in Table 3.6.
Figure 3.16. Contours of dimensionless power density in horizontal plane at z/H = 1.03 (just above the roof) for different building corner shapes at wind directions of 0° and 45°. Note that the high turbulence region (Iref > 0.16) is masked with white, signaling its unsuitability for turbine installation. The black arrow indicates the flow direction.
Regardless of the flow angle, the extent of the unsuitable region for turbine installation below/over the roof at different flow angles is significantly less for the chamfered and rounded corner shapes compared to the sharp corner. This is significant as it highlights that with the


