PhD Thesis by Yu-Hsuan Juan

Page 76

Chapter 3

62 3.5.5

Impact of wind direction

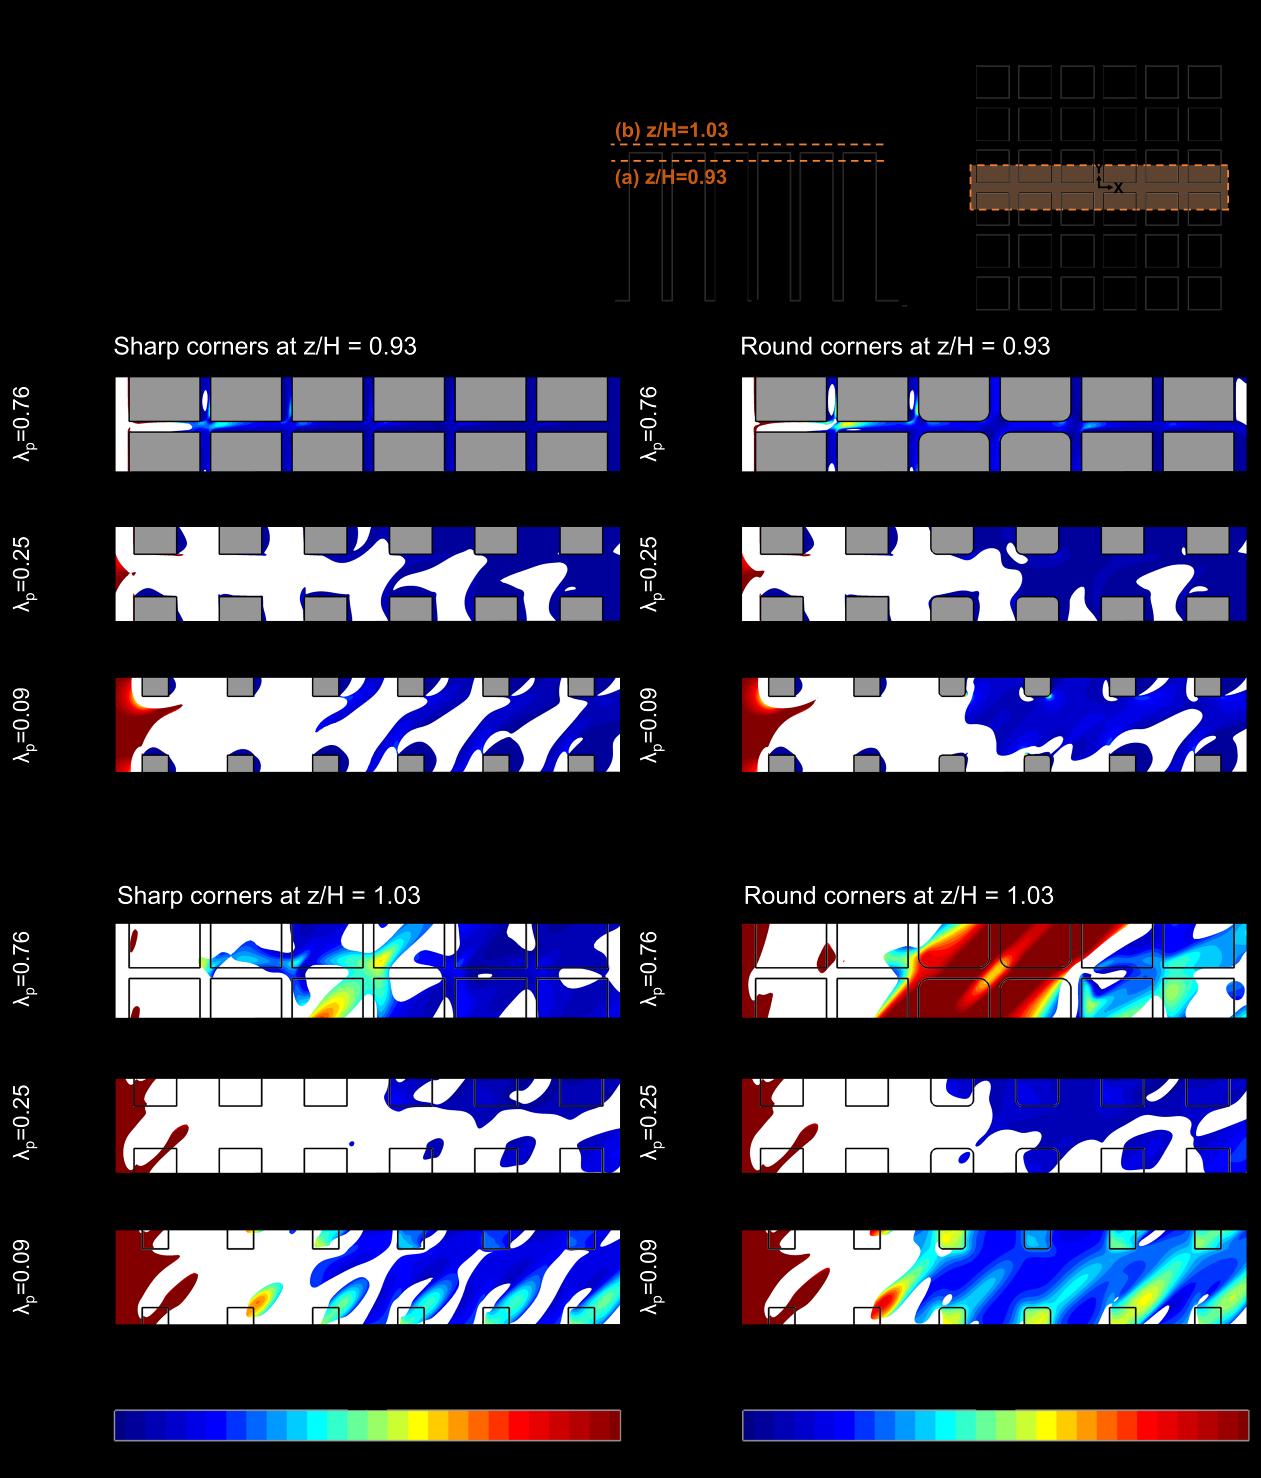
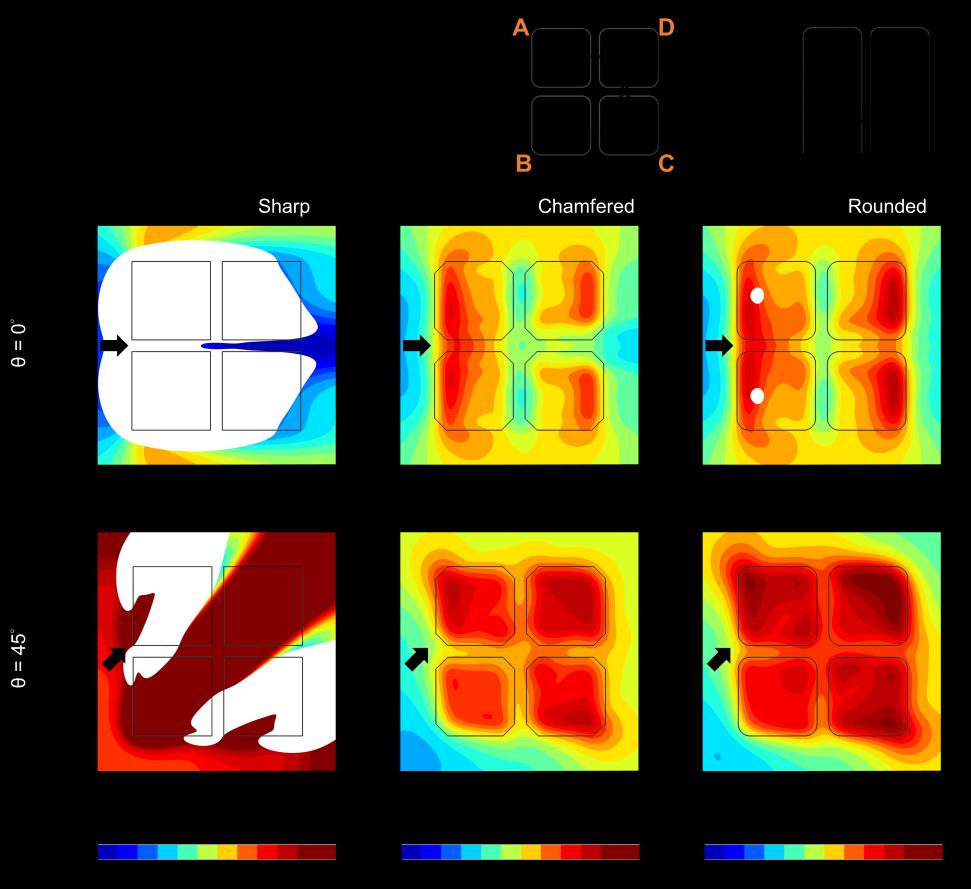
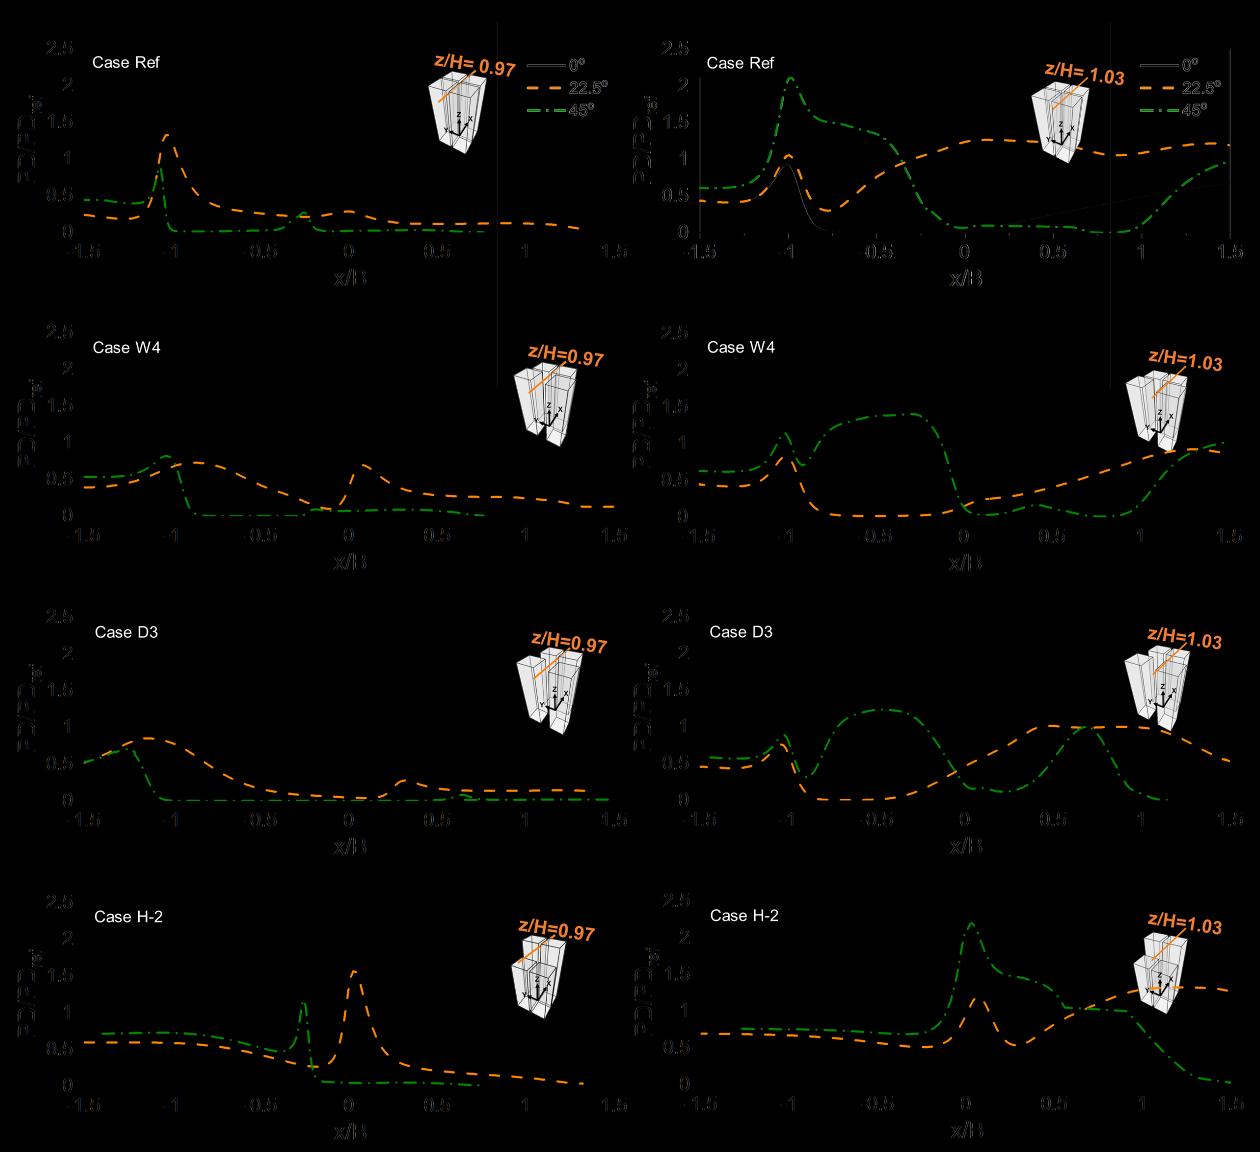
The contour plots of PD/PDref, with high turbulence regions with Iref > 0.16 masked with white color, in the horizontal planes at z/H = 0.93 (just below the roof) and 1.03 (just above the roof) are shown in Fig. 3.15 and Fig. 3.16, respectively, for wind directions of 0° and 45°. Here the wind power density is calculated using the streamwise velocity component as for the typical HAWTs. Note that the high turbulence region (Iref > 0.16) is masked with white color, signaling its unsuitability for turbine installation based on the IEC standard [128]. It can be seen that the magnitude and distribution of the wind power density and the extent of the high turbulence regions are very sensitive to the flow angle and very different values and patterns are observed for the two flow angles studied. The URAR for the wind directions of 0° and 45° are listed in Table 3.6.

Figure 3.16. Contours of dimensionless power density in horizontal plane at z/H = 1.03 (just above the roof) for different building corner shapes at wind directions of 0° and 45°. Note that the high turbulence region (Iref > 0.16) is masked with white, signaling its unsuitability for turbine installation. The black arrow indicates the flow direction.

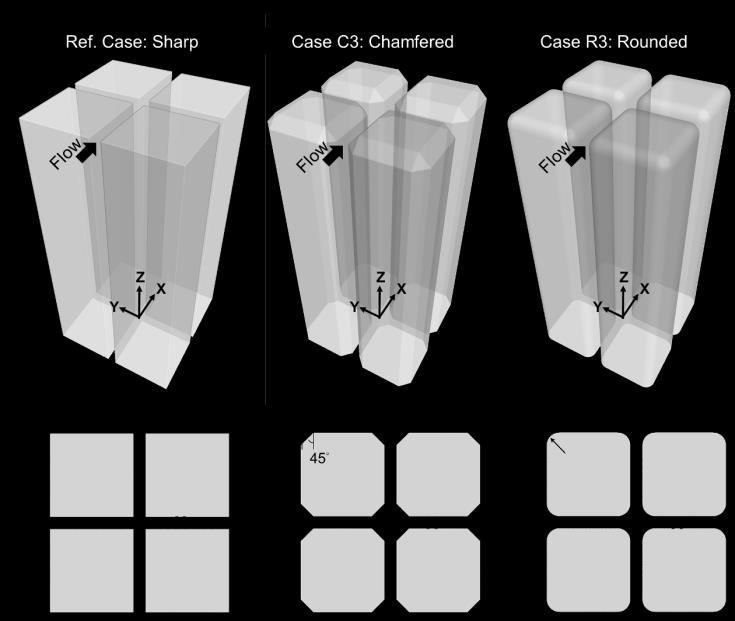
Regardless of the flow angle, the extent of the unsuitable region for turbine installation below/over the roof at different flow angles is significantly less for the chamfered and rounded corner shapes compared to the sharp corner. This is significant as it highlights that with the


Turn static files into dynamic content formats.

Create a flipbook

Articles inside

References

29min
pages 151-164

Biography

1min
pages 165-166

4.5 Discussion

3min
pages 105-106

4.4.2 Impact of building corner shape

8min
pages 97-103

5.1 Introduction

13min
pages 112-116

5 Urban wind energy potential for a realistic high-rise urban area

1min
page 111

4.4.1 Impact of urban density

9min
pages 91-96

4.3.3 Computational settings

1min
page 89

4.3.2 Computational domain and grid

2min
page 88

4.2.1 Turbulence model sensitivity analysis

1min
page 85

4.2 CFD validation study

2min
pages 83-84

4 Urban wind energy potential: Impacts of urban density and layout

1min
page 79

3.5.5 Impact of wind direction

1min
page 76

4.1 Introduction

8min
pages 80-82

3.5.4 Impact of wind turbine type and orientation

3min
pages 73-75

3.5.3 Impact of corner radius

2min
pages 71-72

3 Urban wind energy potential: Impacts of building corner modifications

1min
page 53

3.5.2 Impact of chamfer length

2min
page 70

3.4.3 Grid-sensitivity analysis

1min
pages 62-63

2.7 Conclusions

3min
page 52

3.2.2 CFD validation: computational settings and results

3min
pages 58-59

3.3 Test cases

1min
page 60

2.6 Limitations of the study

1min
page 51

Discussion ...................................................................................................................................... 131

1min
page 20

buildings (d

12min
pages 42-50

Summary and Conclusions.......................................................................................................... 133

1min
page 21

Summary

2min
page 15

1.4 Thesis outline

3min
pages 23-24

2.2.2 CFD validation: computational domain and grid

1min
page 30

2.2.3 CFD validation: other computational settings

2min
pages 31-32

2 Urban wind energy potential: Impact of building arrangement and height

1min
page 25
Issuu converts static files into: digital portfolios, online yearbooks, online catalogs, digital photo albums and more. Sign up and create your flipbook.