
2022 1235 South Clark Street • Suite 305 • Arlington, VA 22202 • 800-7-ASTHMA (800-727-8462) • aafa.org
The Most Challenging Places to Live With Asthma

2022 Asthma Capitals
Acknowledgements
asthmacapitals.com ©2022 Asthma and Allergy Foundation of America 2022
Asthma and Allergy Foundation of America, (2022). 2022 Asthma Capitals. Retrieved from asthmacapitals.com
Copyright © 2022 by the Asthma and Allergy Foundation of America (AAFA). This material may be reproduced unaltered in whole or in part without fees or permission provided that acknowledgment is given to the Asthma and Allergy Foundation of America. Content may not be reprinted, translated, or distributed electronically without prior permission in writing from AAFA. For permission, contact info@aafa.org
AAFA publishes the Asthma Capitals™ report to raise awareness about the nationwide impacts of asthma. The report analyzes data from across the continental United States and ranks the 100 largest cities where it is challenging to live with asthma. The report ranks cities by the most critical of health outcomes – asthma prevalence, emergency department visits due to asthma attacks, and asthma mortality. The outcomes are not weighted equally. The report also examines asthma risk factors that influence the outcomes.
Suggested Citation
About the Asthma and Allergy Foundation of America (AAFA)
The views and opinions expressed in this report are those of the AAFA authors and do not necessarily reflect the policies or positions of other individuals, organizations, or companies.
Founded in 1953, AAFA is the oldest and largest nonprofit patient organization dedicated to saving lives and reducing the burden of disease for people with asthma, allergies, and related conditions through research, education, advocacy, and support. AAFA offers extensive support for individuals and families affected by asthma and allergic diseases, such as food allergies and atopic dermatitis (eczema). Through its online patient support communities, network of local chapters, and affiliated support groups, AAFA empowers patients and their families by providing practical, evidence-based information and community programs and services. AAFA is the only asthma and allergy patient advocacy group that is certified to meet the standards of excellence set by the National Health Council. For more information, visit aafa.org
About This Report
Available online at asthmacapitals.com
Media Inquiries
For media and related inquiries, contact media@aafa.org.
2
The 2022 Asthma Capitals™ report is an independent research project of the Asthma and Allergy Foundation of America and made possible by support from Sanofi and Regeneron.
AAFA would like to thank Dr. Mitchell Grayson for serving as medical research advisor on the report’s methodology. We are grateful to our advocates and partners who shared their personal stories for this report. And lastly, this comprehensive report would not be possible without the dedication of the AAFA staff responsible for this report: Hannah Jaffee, Melanie Carver, Sanaz Eftekhari, Jenna Riemenschneider, Lynne Bosma, Tanya Bumgardner, Nicole Gaghan, Kathy Przywara, Cole Clementson, Dana Leufroy, and Jei Norris.
. . . . . . . . . . . . . . . . . . . . . . . . . . . . . . . . . . . . . . . .
. . . . . . . . . . . . . . . . . . . . . . . . . . . . . . . . . . . . . . . . .
Lack of Health Insurance
Taking Action at the State and Local Level 39 Contacting Your Legislators 40 Tips for Communicating With Legislators and Their Staff 42 Sample Letter to Your State or Local Legislator . . . . . . . . . . . . . . . . . . . . . . . . . . 43
Risk Factors That Can Worsen Asthma or Influence Asthma Rates 14 Poverty . . . . . 15
Spotlight: Indoor Air Quality and Healthy Buildings 21 Pollen 22
. . . . . . 17
Asthma Quick-Relief Medicine Use 24 Asthma Control Medicine Use 25 Access to Specialists 26
. . . . .
asthmacapitals.com Asthma and Allergy Foundation
Introduction 4
. . . . . . . . . . . . . . . . . . . . . . . . . . .
Table of Contents
The Top 100 Most Challenging Places to Live With Asthma 7
. . . . . . . . . . . . . . . . . . . . . . . . . . . . . .
Asthma Health Outcomes . 11
Air Pollution 18
. . . . . . . . . . . . . . . . . . . . . . . . . . . . . . . . . .
. . . . . . . 23
Estimated Asthma Prevalence . . . . . . . 11
Health Equity 27 Detroit . . . . . . . . . . . . . . . . . . . . . . 28
. . . . . . . . . . . . . . . . . . . . . . .
©2022
Emergency Department Visits 12 Asthma-Related Mortality 13
A Note From New York State Senator Gustavo Rivera . . . . . . . . . . . . . . . . . . . . 34
of America 3 2022
Map of the Top 20 Most Challenging Places to Live With Asthma in 2022 6
. . . . . . . . . . . . . . . . . . . . . . . . . . . . . . . . . . . . . . . . . . . . . .
Federal Policies and Programs to Support People With Asthma 36
Methodology . . . . . . . . 44 Resources 45
Smoking Cigarettes, Cigars, Vapes
St. Louis 30 Chicago 31 Los Angeles 31 New York 32
Risk factors such as poverty, exposure to pollutants, and access to health care play an important role in asthma outcomes. But these aren’t the only reasons a person may experience asthma exacerbations. Where they live may influence whether or not they have this common chronic lung disease and how successfully they can manage it.
more people with asthma episodes and attacks and asthma hospitalizations increase.1 The third week of the month—known as Asthma Peak Week—is often the Septemberworst.
Knowing what puts someone at higher risk for asthma is an important part of understanding and treating the disease. The Asthma and Allergy Foundation of America’s (AAFA) 2022 Asthma Capitals™ report looks at how location may influence asthma in cities across the continental U.S.
• An overview of federal and state-level advocacy, and a toolkit to help advocates champion better policies for people living with asthma
Foundation of America 4 2022
EachIntroductionSeptember,doctorssee
It is our goal that the 2022 Asthma Capitals™ report inspires action. Reduced asthma rates and deaths are possible. And this report highlights where we can focus our efforts for healthier environments and communities.
©2022 Asthma
is the perfect storm for people with asthma and allergies. Ragweed, the most common fall pollen allergy, peaks in September in the United States. Mold counts go up as leaves begin to collect outside. Children return to school and are exposed to respiratory illnesses and buildings filled with asthma triggers. Flu and cold season begins as well. With these events all happening at the same time, people with asthma are exposed to a lot of asthma triggers. This can make it hard to keep airway inflammation under control.
In addition to the annual rankings, this year’s report includes two additional pieces:
• A focus on health equity and the work AAFA is supporting to address asthma disparities in local communities
1. Sears, M. R., Johnston, N. W. (2007). Understanding the September asthma epidemic. Journal of Allergy and Clinical Immunology, 120(3), 526–529. https://doi.org/10.1016/j.jaci.2007.05.047
The Asthma Capitals™ report ranks 100 cities in the continental U.S. based on these health outcomes: asthma prevalence, emergency department visits for asthma, and deaths due to asthma. The report also examines risk factors that contribute to these outcomes: poverty, air quality, access to specialist medical care, pollen counts, medicine use, tobacco policies, and the rate of uninsured residents. The data in this report includes the 100 most populated U.S. cities (metro areas), and does not include information from Alaska, Hawaii, Puerto Rico, or tribal nations. The residents of these areas are greatly affected by asthma, but more data is needed to get a better picture of the impact.
asthmacapitals.com and Allergy
Kids are exposed to a lot of allergens when they go back to school. Children are often exposed to mold, pests, pollen, pet allergens, and more in schools. All of these can be triggers for some people with asthma. Children’s clothes or belongings can then carry these allergens, like pet hair, from school to home. And then the allergens may trigger other family members with asthma or allergies.
Ragweed pollen season peaks in September in the United States. Ragweed grows in every state except Alaska. Pollen seasons are getting more intense every year due to climate change. Longer, hotter growing seasons are stimulating plants to release more pollen. Allergens like pollen trigger asthma in people with allergic asthma.
Kids tend to get sick when they go back to school. Crowded school classrooms are hotbeds of germs. Cold season also peaks the same time school starts. Kids catch colds at school, get sick, and then expose others in the home to the illness. These infections then set off serious asthma attacks for some people. While there is no vaccine for the common cold, the flu shot is available. Flu season can occur later in the fall or winter. Everyone over the age of 6 months, including family members, should get a flu shot each year, if possible.
Extreme weather or natural disasters related to climate change may occur in September and worsen air quality. Parts of the country may experience heat waves, wildfires, extreme thunderstorms, or hurricanes during this time. This may worsen air pollution or exposure to airborne allergens and particles, making it more challenging to control asthma.
3. Johnston, N. W., Johnston, S. L., Norman, G. R., Dai, J., Sears, M. R. (2006). The September epidemic of asthma hospitalization: School children as disease vectors. Journal of Allergy and Clinical Immunology, 117(3), 557–562. https://doi. org/10.1016/j.jaci.2005.11.034
There is an “epidemic” of asthma-related hospital stays in September. In fact, the third week of September is considered Asthma Peak Week. Many more people stay in the hospital for asthma shortly after school starts than at any other time of the year. Around 25% of asthma-related hospital stays in children happen in September.2 The number of asthma hospital stays peak for school-age children first, followed by preschool children and then adults.3
asthmacapitals.com ©2022 Asthma and Allergy Foundation of America 5 2022
Indoor and outdoor mold counts increase in some areas. Mold can be both an allergen and an airway irritant. Outdoor molds grow on decaying plant matter like fallen leaves. Indoor molds grow when the humidity levels inside increase and air ventilation decreases. This typically happens in fall and winter months but can also be a problem year-round in some climates.
SEPTEMBER IS A DIFFICULT TIME FOR PEOPLE WITH ASTHMA
People who stay in the hospital for asthma often have a viral infection. Serious asthma attacks are often related to respiratory tract infections, especially rhinovirus. Rhinovirus is the main cause of the common cold. Viral infections cause up to half of asthma attacks in adults and 80% of asthma attacks in children.2
2. Mullen, A. (n.d.). Avoid the September Epidemic. National Jewish Health. https://www.nationaljewish.org/conditions/ health-information/health-infographics/avoid-the-september-epidemic
asthmacapitals.com ©2022 Asthma and Allergy Foundation of America 6 2022 Map of the Top 20 Most Challenging Places to Live With Asthma in 2022 These are the top 20 Asthma Capitals based on estimated asthma prevalence, emergency department visits due to asthma, and asthma-related fatalities. The burden of asthma falls heavily on the eastern half of the country, including some cities in the Midwest. The full list of top 100 cities can be found on page 7 in this report. 1. Detroit, MI 2. Cleveland, OH 3. Allentown, PA 4. Lakeland, FL 5. Fresno, CA 6. Charleston, SC 7. Harrisburg, PA 8. Poughkeepsie, NY 9. Philadelphia, PA 10. Baltimore, MD 11. Columbus, OH 12. Richmond, VA 13. Cape Coral, FL 14. St. Louis, MO 15. Orlando, FL 16. Albany, NY 17. Louisville, KY 18. Greenville, SC 19. Toledo, OH 20. Rochester, NY 7 5 15 14 3 10 12 20 18 16 9 4 6 17 192 11 1 8 13
asthmacapitals.com ©2022 Asthma and Allergy Foundation of America 7 2022 The Top 100 Most Challenging Places to Live With Asthma NATIONAL RANKINGS ■ Worse Than Average ▲ Average ● Better Than Average (Factors are not weighted equally) RankingsNational2022 Overall Metropolitan Area Total Score (Avg. 63.79) PrevalenceEstimatedSubtotal:Asthma DeathSubtotal:CrudeRateforAsthma forSubtotal:EDVisitsAsthma 1 ■ Detroit, MI 100.00 ■ ■ ■ 2 ■ Cleveland, OH 99.51 ■ ■ ■ 3 ■ Allentown, PA 98.62 ■ ▲ ■ 4 ■ Lakeland, FL 97.72 ■ ▲ ■ 5 ■ Fresno, CA 91.36 ■ ■ ▲ 6 ■ Charleston, SC 90.18 ■ ▲ ■ 7 ■ Harrisburg, PA 89.06 ■ ■ ▲ 8 ■ Poughkeepsie, NY 88.38 ■ ▲ ● 9 ■ Philadelphia, PA 87.50 ■ ■ ▲ 10 ■ Baltimore, MD 85.84 ■ ■ ▲ 11 ■ Columbus, OH 85.55 ■ ▲ ■ 12 ■ Richmond, VA 83.49 ▲ ■ ■ 13 ■ Cape Coral, FL 82.81 ■ ● ■ 14 ■ St. Louis, MO 82.23 ▲ ■ ■ 15 ■ Orlando, FL 81.60 ■ ● ▲ 16 ■ Albany, NY 81.39 ■ ▲ ● 17 ■ Louisville, KY 81.35 ■ ● ■ 18 ■ Greenville, SC 79.73 ■ ● ▲ 19 ■ Toledo, OH 79.45 ■ ▲ ■ 20 ■ Rochester, NY 77.20 ■ ▲ ▲ 21 ■ New York, NY 76.95 ■ ■ ▲ 22 ■ Miami, FL 76.31 ■ ▲ ▲ 23 ■ Wichita, KS 75.79 ● ▲ ■ 24 ■ Dayton, OH 75.62 ▲ ● ■ 25 ■ Spokane, WA 74.64 ■ ▲ ▲ 26 ■ Cincinnati, OH 74.39 ▲ ■ ■ 27 ■ Tucson, AZ 74.22 ▲ ■ ■ 28 ■ Chicago, IL 74.03 ▲ ■ ▲ 29 ■ Indianapolis, IN 73.99 ■ ▲ ▲ 30 ■ Atlanta, GA 73.79 ▲ ▲ ■ 31 ▲ Jacksonville, FL 73.48 ▲ ▲ ■ 32 ▲ Omaha, NE 73.16 ▲ ■ ▲
asthmacapitals.com ©2022 Asthma and Allergy Foundation of America 8 2022 NATIONAL RANKINGS ■ Worse Than Average ▲ Average ● Better Than Average (Factors are not weighted equally) RankingsNational2022 Overall Metropolitan Area Total Score (Avg. 63.79) PrevalenceEstimatedSubtotal:Asthma DeathSubtotal:CrudeRateforAsthma forSubtotal:EDVisitsAsthma 33 ▲ Tampa, FL 70.98 ▲ ▲ ■ 34 ▲ Phoenix, AZ 70.35 ■ ▲ ▲ 35 ▲ New Orleans, LA 69.80 ▲ ▲ ■ 36 ▲ Palm Bay, FL 68.77 ■ ▲ ▲ 37 ▲ Las Vegas, NV 68.58 ▲ ▲ ▲ 38 ▲ McAllen, TX 68.28 ■ ● ● 39 ▲ Columbia, SC 68.16 ▲ ▲ ▲ 40 ▲ San Antonio, TX 67.95 ▲ ● ▲ 41 ▲ Stockton, CA 67.53 ● ▲ ■ 42 ▲ Akron, OH 67.37 ● ▲ ■ 43 ▲ Sacramento, CA 66.61 ▲ ▲ ▲ 44 ▲ Nashville, TN 65.97 ▲ ▲ ▲ 45 ▲ Dallas, TX 65.79 ▲ ● ▲ 46 ▲ Daytona Beach, FL 65.37 ▲ ● ▲ 47 ▲ Jackson, MS 64.98 ● ■ ▲ 48 ▲ Milwaukee, WI 64.78 ● ■ ■ 49 ▲ Baton Rouge, LA 64.60 ▲ ● ▲ 50 ▲ Pittsburgh, PA 64.42 ▲ ▲ ▲ 51 ▲ Sarasota, FL 63.42 ▲ ▲ ▲ 52 ▲ Springfield, MA 62.06 ■ ▲ ● 53 ▲ Kansas City, MO 60.80 ● ▲ ▲ 54 ▲ Riverside, CA 60.24 ▲ ● ▲ 55 ▲ Minneapolis, MN 59.76 ▲ ▲ ● 56 ▲ El Paso, TX 59.69 ▲ ● ▲ 57 ▲ Tulsa, OK 59.68 ▲ ▲ ● 58 ▲ Providence, RI 58.91 ■ ▲ ● 59 ▲ Washington, DC 58.50 ▲ ▲ ● 60 ▲ Memphis, TN 57.07 ● ■ ▲ 61 ▲ Syracuse, NY 56.96 ■ ● ● 62 ▲ Los Angeles, CA 56.92 ▲ ▲ ● 63 ▲ Worcester, MA 56.91 ▲ ■ ● 64 ▲ Houston, TX 56.35 ▲ ● ▲ 65 ▲ Buffalo, NY 56.35 ▲ ▲ ▲ 66 ▲ Austin, TX 56.19 ▲ ● ▲ 67 ▲ Virginia Beach, VA 55.78 ▲ ● ▲
asthmacapitals.com ©2022 Asthma and Allergy Foundation of America 9 2022 RankingsNational2022 Overall Metropolitan Area Total Score (Avg. 63.79) PrevalenceEstimatedSubtotal:Asthma DeathSubtotal:CrudeRateforAsthma forSubtotal:EDVisitsAsthma 68 ▲ Chattanooga, TN 55.51 ● ■ ▲ 69 ▲ Hartford, CT 55.22 ▲ ▲ ● 70 ▲ San Francisco, CA 55.13 ▲ ● ▲ 71 ▲ San Diego, CA 54.98 ▲ ● ▲ 72 ▲ Grand Rapids, MI 54.68 ● ● ■ 73 ▲ Oklahoma City, OK 54.48 ● ▲ ▲ 74 ▲ Bakersfield, CA 53.92 ▲ ▲ ▲ 75 ● Des Moines, IA 53.61 ● ● ■ 76 ● Seattle, WA 52.96 ● ▲ ▲ 77 ● Scranton, PA 52.45 ● ▲ ● 78 ● Denver, CO 51.52 ▲ ▲ ● 79 ● San Jose, CA 50.95 ● ▲ ▲ 80 ● Boise, ID 48.75 ▲ ● ● 81 ● Albuquerque, NM 48.65 ▲ ▲ ● 82 ● Charlotte, NC 48.33 ▲ ▲ ● 83 ● Portland, OR 47.69 ● ▲ ● 84 ● Augusta, GA 47.38 ● ● ■ 85 ● Bridgeport, CT 47.35 ▲ ▲ ● 86 ● Birmingham, AL 45.70 ● ■ ● 87 ● Knoxville, TN 45.41 ● ▲ ● 88 ● Ogden, UT 44.08 ● ▲ ● 89 ● Greensboro, NC 43.92 ● ▲ ▲ 90 ● New Haven, CT 43.48 ● ■ ▲ 91 ● Boston, MA 41.52 ● ■ ● 92 ● Durham, NC 40.71 ● ▲ ● 93 ● Little Rock, AR 39.60 ● ● ▲ 94 ● Salt Lake City, UT 39.55 ● ▲ ▲ 95 ● Oxnard, CA 39.34 ● ● ● 96 ● Madison, WI 37.99 ● ● ▲ 97 ● Raleigh, NC 36.92 ● ● ● 98 ● Colorado Springs, CO 36.77 ● ● ● 99 ● Winston-Salem, NC 35.74 ● ▲ ● 100 ● Provo, UT 29.47 ● ● ● NATIONAL RANKINGS ■ Worse Than Average ▲ Average ● Better Than Average (Factors are not weighted equally)
asthmacapitals.com ©2022 Asthma and Allergy Foundation of America 10 2022 REGIONAL RANKINGS ■ Worse Than Average ▲ Average ● Better Than Average (Factors are not weighted equally) NORTHEAST RankingsRegional2022 Overall Metropolitan Area Total Score (Avg. 63.79) PrevalenceEstimatedSubtotal:Asthma DeathSubtotal:CrudeRateforAsthma forSubtotal:EDVisitsAsthma 1 ■ Allentown, PA 98.62 ■ ▲ ■ 2 ■ Harrisburg, PA 89.06 ■ ■ ▲ 3 ■ Poughkeepsie, NY 88.38 ■ ▲ ● 4 ■ Philadelphia, PA 87.50 ■ ■ ▲ 5 ■ Albany, NY 81.39 ■ ▲ ● SOUTH RankingsRegional2022 Overall Metropolitan Area Total Score (Avg. 63.79) PrevalenceEstimatedSubtotal:Asthma DeathSubtotal:CrudeRateforAsthma forSubtotal:EDVisitsAsthma 1 ■ Lakeland, FL 97.72 ■ ▲ ■ 2 ■ Charleston, SC 90.18 ■ ▲ ■ 3 ■ Baltimore, MD 85.84 ■ ■ ▲ 4 ■ Richmond, VA 83.49 ▲ ■ ■ 5 ■ Cape Coral, FL 82.81 ■ ● ■ MIDWEST RankingsRegional2022 Overall Metropolitan Area Total Score (Avg. 63.79) PrevalenceEstimatedSubtotal:Asthma DeathSubtotal:CrudeRateforAsthma forSubtotal:EDVisitsAsthma 1 ■ Detroit, MI 100.00 ■ ■ ■ 2 ■ Cleveland, OH 99.51 ■ ■ ■ 3 ■ Columbus, OH 85.55 ■ ▲ ■ 4 ■ St. Louis, MO 82.23 ▲ ■ ■ 5 ■ Toledo, OH 79.45 ■ ▲ ■ WEST RankingsRegional2022 Overall Metropolitan Area Total Score (Avg. 63.79) PrevalenceEstimatedSubtotal:Asthma DeathSubtotal:CrudeRateforAsthma forSubtotal:EDVisitsAsthma 1 ■ Fresno, CA 91.36 ■ ■ ▲ 2 ■ Spokane, WA 74.64 ■ ▲ ▲ 3 ■ Tucson, AZ 74.22 ▲ ■ ■ 4 ▲ Phoenix, AZ 70.35 ■ ▲ ▲ 5 ▲ Las Vegas, NV 68.58 ▲ ▲ ▲
Prevalence rates differ significantly by race and ethnicity. Puerto Ricans have the highest rate of asthma prevalence compared to any other racial or ethnic group in the United States. Black Americans are also disproportionally diagnosed with asthma compared to white Americans.5
1 4 Lakeland,
Asthma Health Outcomes
ESTIMATED ASTHMA PREVALENCE
4. Centers for Disease Control and Prevention. (2020). Most recent national asthma data. U.S. Department of Health and Human Services. https://www.cdc.gov/asthma/most_recent_national_asthma_data.htm
©2022 Asthma and Allergy Foundation of America 11 2022
Asthma prevalence data often relies on self-report, and prevalence comparisons between cities and/or states may not be reliable due to differences in data collection methods and reporting. Data limitations should be considered when comparing different cities to each other or with year-over-year comparisons.
About 25 million people living in the United States have asthma.4 Factors such as sex, race, ethnicity, and socioeconomic status are associated with asthma, with the disease being more common in males than females in childhood. In adulthood, it reverses and more females than males have asthma.
AAFA ranks cities based on three health outcomes: asthma prevalence (how many people have asthma), asthma-related emergency department visits, and asthma-related mortality (death) rates. The outcomes are not weighted equally.
†For each city included in the 2022 Asthma Capitals, AAFA obtained an estimated asthma prevalence for its respective MSA. The estimates ranged from 0.75% to 7.42%.
asthmacapitals.com
7 7
10
2 8
PrevalenceAsthmaRanking Metropolitan Area AsthmaOverallCapitalNationalRanking 1 Poughkeepsie,

2 Albany,
5 6
9
4 5 Fresno,
5. Asthma and Allergy Foundation of America, (2020). Asthma Disparities in America: A Roadmap to Reducing Burden on Racial and Ethnic Minorities. aafa.org/asthmadisparities
16 3 Detroit,
Poughkeepsie, NY
The cities with the highest estimated asthma prevalence† are: NY 8 NY MI FL CA Harrisburg, PA Cleveland, OH McAllen, TX 38 Allentown, PA 3 Philadelphia, PA 9
EMERGENCY DEPARTMENT VISITS
• Avoid (or reduce) exposure to known asthma triggers
Asthma can trigger severe symptoms that require a visit to the emergency department (ED). In 2019, asthma accounted for 169,330 discharges from hospital inpatient care and 1.8 million emergency department visits.6, 7
9 Stockton, CA 41
To prevent asthma emergencies, people with asthma must:
10 Lakeland, FL 4
12 2022
4 Dayton, OH 24
5 Louisville, KY 17
AsthmaOverallCapitalNationalRanking
3 Columbus, OH 11
2 Allentown, PA 3
asthmacapitals.com Asthma and Allergy Foundation of America
Asthma triggers include air pollution, cold air, and allergens like pollen, among others. It can be difficult to fully avoid all asthma triggers. When exposed to asthma triggers, the airways begin to swell, constrict, and fill with mucus. Asthma control medicines treat and prevent airway inflammation but are only effective if people have access to them and use them.
Metropolitan Area
Wichita, KS
©2022
Effective asthma management may help reduce ED visits and hospitalizations. Increased ED visits are a sign of poor asthma control. To improve asthma control, people with asthma should reduce exposure to triggers, have access to and take prescribed medicines, and follow an asthma action plan.
6. National Center for Health Statistics. (2022). National Ambulatory Medical Care Survey: 2019 Summary Tables. U.S. Department of Health and Human Services, Centers for Disease Control and Prevention. https://www.cdc.gov/nchs/data/ ahcd/namcs_summary/2018-namcs-web-tables-508.pdf
• Use medicines to keep their airways open
7 Akron, OH 42
6 Jacksonville, FL 31

†For each city included in the 2022 Asthma Capitals, AAFA obtained the total number of ED visits where an asthma ICD-10 code was included in a diagnosis field, for the respective census-designated metropolitan statistical area, or MSA, for calendar year 2021. Analyses included estimating the ED rate per 10,000 asthma patients.
8 New Orleans, LA 35
The cities with the highest asthma-related ED visits† are:
7. Agency for Healthcare Research and Quality. (2022). Healthcare Cost and Utilization Project (2019). U.S. Department of Health and Human Services, Centers for Disease Control and Prevention. https://www.cdc.gov/asthma/nationalsurveillance-data/healthcare-use.htm
There are large asthma disparities in terms of ED visits based on race as well as age. When taking ethnicity into account, asthma-related ED visits are more than five times as high for non-Hispanic Black patients compared to non-Hispanic white patients. Children are much more likely than adults to have asthma-related ED visits, with children ages 5 to 17 at the highest rate.
DepartmentEmergencyVisitsRanking
1 Wichita, KS 23
• Avoid or reduce exposure to asthma triggers
13
Tragically, asthma can be fatal. In 2020, there were 4,145 deaths attributed to asthma in the U.S.8 This means about 11 people per day lose their life to asthma. There hasn’t been meaningful improvement in these numbers in the last decade. In 2020, deaths due to asthma rose for the first time in 20 years.9
Asthma-RelatedDeathsRanking
10 Cleveland, OH 2
8. Centers for Disease Control and Prevention. (2022). Most recent national asthma data. U.S. Department of Health and Human Services. https://www.cdc.gov/asthma/most_recent_national_asthma_data.htm
©2022 Asthma and Allergy Foundation of America 2022
asthmacapitals.com
ASTHMA ACTION PLAN #: Day Night/Weekend EmergencySignature: The traffic light your asthma medicines. GREEN means Use preventive medicine. YELLOW Caution Zone!Add quick-relief medicine. means Danger help from Personal Best Peak Flow: GO Use these daily controller medicines:have all NoBreathingcough wheezetheSleep play MEDICINE HOW MUCH HOW OFTEN/WHEN For exercise, take: CAUTION Continue with green zone medicine and add:have First Exposuresigns known CoughingCoughtriggerchestat night MEDICINE HOW MUCH HOW OFTEN/ WHEN CALL ASTHMA CARE DANGER Take these medicines and call your doctor now.Your asthma worse fast:Medicine helpingNose&Breathingfastspeakingwide(inchildren) MEDICINE HOW MUCH HOW OFTEN/WHEN GET HELP FROM DOCTOR NOW! Your doctor will want you right away. important! you cannot contact your doctor, go directly to the emergency room. DO NOTMake an appointment with your asthma provider within two an ER visit or hospitalization.aafa.orgfrom Peak reading
• Have access to asthma medicines and take them as prescribed
St. Louis, MO

• Seek medical care if symptoms occur more than twice per week
6 New York, NY 21
Some populations are at higher risk for dying from asthma than others. The causes of higher asthma death rates are complex but must be addressed to save lives. The top 10 cities for asthma-related deaths must take action to prevent more tragedies.
If someone’s life is in danger, seek emergency care immediately. An asthma action plan can help identify when asthma is a medical emergency. Visit aafa.org/actionplan to download a sample plan.
2 Baltimore, MD 10 3 Jackson, MS 47
7 Tucson, AZ 27
The cities with the most asthma-related deaths† are:
AsthmaOverallCapitalNationalRanking
8 Detroit, MI 1
9. National Center for Health Statistics. National Vital Statistics System: Mortality (1999-2018). U.S. Department of Health and Human Services, Centers for Disease Control and Prevention. https://wonder.cdc.gov/ucd-icd10.html
Metropolitan Area
ASTHMA-RELATED MORTALITY
†For each city included in the 2022 Asthma Capitals, AAFA obtained the estimated asthma-related crude death rate per 100,000 people for its respective county from 2016-2020. The estimates range from 0.3% to 2.8%.
4 Richmond, VA 12 5 Fresno, CA 5
9 Chattanooga, TN 68
To reduce the risk of death from asthma, it is important to:
1 St. Louis, MO 14
• Have an asthma action plan and take quick action according to the plan
• Learn the signs and symptoms of asthma, including early warning signals
10. World Health Organization. (2010). A conceptual framework for action on the social determinants of health. https://www.who. int/publications/i/item/9789241500852
Social determinants are “the conditions in which people are born, grow, live, work, and age.” These include factors such as socioeconomic status, education, neighborhood and physical environment, employment, social support networks, and access to health care.
• Asthma quick-relief medicine use*
SDOH can affect how people control their asthma or gain access to health care. Inequities in SDOH are key drivers in asthma disparities, especially among Black Americans.
• Lack of access to specialists
• Smoking (cigarettes, cigars, vapes)
• Air pollution
©2022
14 2022
• Lack of health insurance
A risk factor is any attribute, characteristic, or exposure of an individual that increases the likelihood of developing a disease, like asthma. While the risk factors outlined in this report are not calculated as part of the overall ranking, they are important to address as they contribute to rates of asthma prevalence, emergency room visits, and mortality. These are some of the top risk factors for asthma:
Structural determinants are “the wider set of forces and systems shaping the conditions of daily life.” These forces, which are deeply embedded in society and have historically influenced policies and governance, lead to systemic disadvantages of a particular social group. Examples include structural racism, discrimination, and segregation.
Historically, local and federal policies and programs negatively affected these factors. To improve asthma health outcomes, policies and programs must address and remove barriers to:
• Access to technology, such as the internet
• Food and economic security
asthmacapitals.com Asthma and Allergy Foundation of America
• Access to job and educational opportunities
• Access to health care
• Access to transportation
• Asthma control medicine use*
• Poor indoor air quality (poor housing quality)
• Pollen
• Poverty
• Good quality housing
The World Health Organization (WHO) defines social determinants of health (SDOH) as “the conditions in which people are born, grow, work, live and age, and the wider set of forces and systems shaping the conditions of daily life.”10 SDOH includes social determinants and structural inequities.
SOCIAL AND STRUCTURAL DETERMINANTS OF HEALTH
Risk Factors That Can Worsen Asthma or Influence Asthma Rates
*High numbers of prescriptions for asthma medicines can indicate a larger population managing persistent asthma or more frequent severe or uncontrolled asthma.
Good asthma management can be difficult when families are worried about paying for housing, clothing, utilities, and food. The cost of care may affect the decision to seek medical care. A lack of reliable transportation may influence a person’s ability to attend regular health care
1
asthmacapitals.com Asthma and Allergy Foundation
5
14 6*
©2022
10 6*
$18,310 • 3
household: $13,590 • 2
RankingPoverty
POVERTY
$23,030 • 4
$32,470 11.
(*Tie) Metropolitan Area
cities have the highest rates of poverty†:
2022 Poverty Guidelines for the 48 Contiguous States and the District of Columbia12:
10
These
of America 15 2022
38 4
1
$27,750 • 5
AsthmaOverallCapitalNationalRanking Jackson, MS Augusta, GA 84 McAllen, TX New Orleans, LA 35 St. Louis, MO Baltimore, MD Detroit, MI Philadelphia, PA 9 Memphis, TN 60 Milwaukee, WI
†For each city included in the 2022 Asthma Capitals, AAFA obtained the poverty rate for its respective county. The estimates range from 6.6% to 25.9%.
47 2
9
Personsappointments.livingbelow
100% of the poverty level are more likely to have asthma than those living at any percentage above the poverty level.11
12. Office
Jackson, MS

Poverty plays a major role in the development of asthma and a person’s ability to manage it. This can be because people with low income and low wealth are more likely to have poor quality of housing, live near highways and other highly polluted areas, and struggle to pay for treatment. Many cities on our report have poverty as a top risk factor.
• person in persons in household: persons in household: persons in household: persons in household: Centers for Disease Control and Prevention. (2022). Most recent national asthma data. U.S. Department of Health and Human Services. https://www.cdc.gov/asthma/most_recent_national_asthma_data.htm of the Assistant Secretary for Planning and Evaluation. (2022). HHS Poverty Guidelines for 2022. U.S. Department of Health and Human Services. https://aspe.hhs.gov/topics/poverty-economic-mobility/poverty-guidelines
3
Communities with high poverty levels are often the same communities at greatest risk of harm from the climate crisis. These communities lack the infrastructure and investment required to be climate resilient. In August 2022, Jackson, Mississippi, experienced historic flooding and its residents lost access to safe water.
48
1 8
Differences in annual medical cost per person13:
Middle income: $3,232 Uninsured: $2,145 High income: $3,204
Some of these strategies are better than others at safely reducing asthma costs while maintaining asthma care. If finances are a barrier to asthma management, local resources may be able to help. Many communities have free clinics that will treat all patients regardless of insurance status or ability to pay. Some programs may also be able to help cover costs of some medicines, such as state pharmaceutical assistance programs, nonprofit programs, and financial assistance programs and coupons offered by pharmaceutical companies. Visit aafa.org/asthma-assistance for more information.
Foundation of America 16 2022
• Shopping: comparing medicine prices across pharmacies, using medication coupons or free samples, switching to lower-cost medications
• Prevention: minimizing exposure to asthma triggers and following medicine regimens
Poverty has a direct impact on the ability to pay for asthma care. This can include direct costs, such as emergency department visits, hospital stays, or medicines, but it can also include indirect costs, such as lost pay due to missed work. Even with insurance, the cost of asthma care can prevent many people from getting the help they need.
Race/Ethnicity Income Health Insurance
• Forgoing recommended care: skipping medicine doses, replacing prescription medications with different therapies
With the growing costs of asthma, many families managing asthma have to choose between life-saving treatments and basic costs like rent, mortgage, food, and utilities. To better understand the difficult decisions families have to make, AAFA, Harvard Pilgrim Health Care Institute, and Harvard Medical School conducted a study to interview commercially-insured adults in the U.S. who had asthma and/or a child with asthma. The results of the study found four overarching strategies individuals use to manage asthma care costs14:
Black: $3,145 Poverty: $3,581 Medicare: $3,720 Hispanic: $2,905 Near poverty: $3,274 Medicaid: $3,454 White: $3,323 Low income: $3,183 Private insurance: $3,248
13. Nurmagambetov, T., Kuwahara, R., & Garbe, P. (2018). The economic burden of asthma in the United States, 2008-2013. Annals of the American Thoracic Society, 15(3), 348–356. https://doi.org/10.1513/AnnalsATS.201703-259OC
From 2008-2013, the annual economic cost of asthma was estimated to be about $82 billion.13 For the average American, this adds up to about $3,266 annually for asthma-related medical costs. But people living below the poverty line actually pay more to manage their asthma –about $3,581 each year per person. Today’s costs may be even higher, but the current economic impact is yet to be studied.
14. Gilkey, phd, M. B., Cripps, L. A., Przywara, K. M., Batista, M. I., & Galbraith, A. A. (2022). Strategies commercially-insured families use to manage the cost of asthma care: a qualitative interview study. Journal of Asthma, 1–9. https://doi.org/10.1080/ 02770903.2022.2030749
• Budgeting: putting aside funds or taking on debt to pay for care
©2022 Asthma
asthmacapitals.com and Allergy
LACK OF HEALTH INSURANCE
of America 17 2022
These cities have the highest number of uninsured residents†: InsuranceofRanking
Lack
1 McAllen, TX 38

10 Augusta, GA 84
15. Kaiser Family Foundation. (2020). The Effects of Medicaid Expansion under the ACA: Studies from January 2014 to January 2020. from-a-literature-review-report/https://www.kff.org/report-section/the-effects-of-medicaid-expansion-under-the-aca-updated-findings-
16. Kaiser Family Foundation. (2022). Status of State Medicaid Expansion Decisions: Interactive Map. https://www.kff.org/ medicaid/issue-brief/status-of-state-medicaid-expansion-decisions-interactive-map
5 Cape Coral, FL 13
†For each city included in the 2022 Asthma Capitals, AAFA obtained the uninsured rate for its respective county. The estimates range from 2.8% to 33.1%.
©2022
3 Dallas, TX 45
6 San Antonio, TX 40
18. Asthma and Allergy Foundation of America. (2017). My Life With Asthma: Survey Overview. aafa.org/asthmalife
McAllen, TX
Health care and medicines can be very costly. For patients managing a chronic condition like asthma that requires medicine year-round, having insurance is often a big help. However, insurance itself can also be costly. These costs may vary depending on employment status and whether the job offers health insurance as a benefit and pays any of the costs. Other options include marketplace health insurance and government-sponsored insurance, like Medicare or Medicaid. Some states have expanded health insurance options for their residents while others have not.
4 Houston, TX 64
2 El Paso, TX 56
7 Miami, FL 22
Numerous studies have shown that the Affordable Care Act’s (ACA) Medicaid expansion has improved access to coverage and care since states began implementing expansion in 2014.15
In previous research conducted by AAFA, the top three reasons people cited as reasons why they didn’t take their prescribed asthma treatments were due to not being able to afford the medicines, the cost of the medicines, and the lack of health insurance coverage.18
Only 12 states in the U.S. have yet to expand their Medicaid programs: Alabama, Florida, Georgia, Kansas, Mississippi, North Carolina, South Carolina, South Dakota, Tennessee, Texas, Wisconsin, and Wyoming.16 Texas is home to the largest number of uninsured Americans of any state in the country.17 For the millions of uninsured people in these states, the decision not to expand has left them without an option for affordable health insurance.
8* Oklahoma City, OK 73
asthmacapitals.com Asthma and Allergy Foundation
8* Tulsa, OK 57
17. Kaiser Family Foundation. (2020). Health Insurance Coverage of the Total Population. https://www.kff.org/state-category/ health-coverage-uninsured/health-insurance-status/
(*Tie) Metropolitan Area AsthmaOverallCapitalNationalRanking
†For each city included in the 2022 Asthma Capitals report, AAFA obtained the grades for high ozone days and particle pollution for the respective county. Grades were averaged to produce an overall grade, ranging from A to F.
Salt Lake City, UT 94
Fresno, CA 5
asthmacapitals.com Asthma and Allergy Foundation of America 2022
Metropolitan Area NationalAsthmaOverallCapitalRanking
Bakersfield, CA 74
AIR POLLUTION
Denver, CO 78
Sacramento, CA 43
Poor air quality can negatively affect everyone’s health. Research shows that air pollution can make asthma worse and trigger asthma symptoms. Air pollution includes gases, smoke from fires, volcanic ash, dust particles, emissions from transportation, and other substances that can harm the lungs. Places near manufacturing plants and roadways with heavy traffic tend to have high rates of air pollution.
Las Vegas, NV 37
San Jose, CA 79
Riverside, CA 54
Other forms of air pollution can also trigger asthma. Small particles in the air can pass through your nose or mouth and get into your lungs. Airborne particles, found in haze, smoke, and airborne dust, present serious air quality problems. People with asthma are at greater risk from breathing in small particles. The particles can make asthma worse.
Stockton, CA 41
Ozone, a gas, is one of the most common air pollutants. Ozone contributes to what we typically experience as smog or haze. Ozone triggers asthma because it is irritating to the lungs and airways.
Pittsburgh, PA 50
More than 40% of the U.S. population live in areas with unhealthy levels of ozone or particle pollution, and this number has increased in recent years.19 Climate change—a public health emergency—is one of the most critical explanations for this increase in pollution.
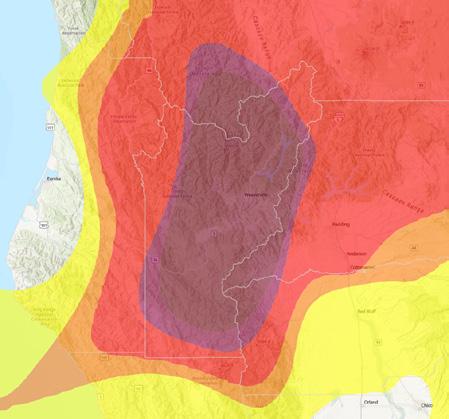
Fresno was ranked the “most polluted” city by year-round particle pollution in the 2022 State of the Air Report.

San Diego, CA 71
©2022
19. American Lung Association. (2022). State of the Air Report 2022. https://www.lung.org/research/sota
These cities all received an F rating from the American Lung Association’s 2022 State of the Air Report for high ozone days and particle pollution†:
Oxnard, CA 95
Phoenix, AZ 34
Los Angeles, CA 62
Provo, UT 100
Detroit, MI 1
California dominates this list because of wildfires. In 2020, record-setting wildfires raged across the western United States, putting millions of people with respiratory conditions like asthma at risk. The smoke and ash from the fires pollute the air, creating unhealthy and hazardous air quality.
18
And unfortunately, this is not an isolated incident – a 2020 Reuters review shows that the EPA’s monitoring network identified no risks from 10 of the biggest refinery explosions over the past decade, despite thousands of hospitalizations and other toxic emissions reports.20
The Air Quality Index (AQI) shows how clean or polluted the air is, and what associated health effects could be a concern. Forecasts and current measurements are availableat AirNow.gov
Air Quality Index Levels of Health Concern
Given air quality’s connection to health, it is important for individuals to have access to accurate and timely information about the air quality in their neighborhoods. The U.S. Environmental Protection Agency (EPA) launched its air quality monitoring program as a result of the 1970 Clean Air TheAct.EPA’s website for air quality data, AirNow, provides current and forecast air quality maps and data for more than 500 cities across the United States. Air quality information is combined into an air quality index (AQI) score from 0-500. The higher the AQI value, the higher the level of air pollution and the greater the health concern.
asthmacapitals.com
Even in areas where there are monitors, monitors may miss important information on pollution based on their location and data collection procedures. For example, after a 2019 Philadelphia oil refinery explosion that released nearly 350 tons of hazardous chemicals, the federal AQI score for Philadelphia showed no impact to air quality that day. This is largely because the closest monitor operated once every six days and was not operating the day of the explosion. Other monitors in the area were either upwind or too far away to detect the explosion’s pollution.
This information can help people with asthma make informed decisions about when to stay indoors and minimize exposure to outdoor asthma triggers.
However, there are gaps in the EPA program. For example, some areas may not be covered or pollutants in that area may not be captured accurately. Currently, about 120 million people living in the United States live in counties that do not have any EPA pollution monitors for small particle pollution. This means about a third of the U.S. population may not have access to information about local small particle pollution. This is concerning because small particles easily enter the bloodstream and have a bigger impact on human health.
UnhealthyModerateGood for Sensitive Groups
©2022 Asthma and Allergy Foundation of America 19 2022
AQI values are color coded by level of health concern. Green (AQI value of 0-50) means air quality is good. When the air quality reaches yellow (AQI value of 51-100) or higher, those who are sensitive to air pollution need to take caution, especially when outside.
20. McLaughlin, T., Kearney, L., & Sanicola, L. (2020, December 1). Special Report: U.S. air monitors routinely miss pollutioneven refinery explosions. Reuters. monitors-routinely-miss-pollution-even-refinery-explosions-idUSKBN28B4RThttps://www.reuters.com/article/usa-pollution-airmonitors-specialreport/u-s-air-
HazardousVeryUnhealthyUnhealthy
Collaboration is key for Darren. Darren is currently involved with several local Michigan coalitions including efforts led by the Ecology Center, the city of Grand Rapids, and other grassroots organizations. He is encouraged by the increased attention to climate justice and funds promised by the federal Inflation Reduction Act.
of America 20 2022
The shortcomings of current monitoring systems have led to innovation in air quality monitoring at the neighborhood level.
asthmacapitals.com Asthma and Allergy Foundation
Darren’s vision is multi-faceted and goes beyond air quality measurement. He hopes to equip residents with granular-level neighborhood air quality data that can help improve individual health outcomes. Residents can sign up for text alerts on air quality concerns. His technology can also determine the source of pollution within a particular neighborhood. This data can help inform policy or other strategies to work toward more equitable air quality.
Environmental justice is “the fair treatment and meaningful involvement of all people regardless of race, color, national origin, or income, with respect to the development, implementation, and enforcement of environmental laws, regulations, and policies,” according to the EPA.
When the primary burden of negative impacts from the environment falls on some groups of people but not others, this is called environmental injustice. To achieve health equity, we must fight environmental injustice.
Darren Riley is the co-founder and CEO of JustAir. JustAir provides a solution for local air quality monitoring using neighborhood-level sensors, particularly in neighborhoods that experience health disparities. JustAir currently has neighborhood-level sensors in communities including Detroit and Grand Rapids, Michigan (Detroit is the #1 Asthma Capital for 2022, and the city received an ‘F’ rating for high ozone days and particle pollution).
Darren Riley is the co-founder and CEO of JustAir, a Michigan-based organization mapping air quality on a local level.

Decades of discriminatory government policies caused certain areas to have worse air quality than others. For example, major roadways tend to be in low-income or minority communities, exposing these populations to higher concentrations of air pollution.
©2022
“We want to make sure some of those funds are allocated to the benefit of Black, Brown, Indigenous, and often marginalized communities,” says Darren. “I really want to make sure that these dollars are intentional, given to those communities that need it the most, and actually move the needle on disparities. I’m very excited and optimistic about the future not only for JustAir, but for the future of an equitable environment for everyone.”
Darren’s experiences and exposure to tech are what led him to co-found JustAir. “After being diagnosed with asthma while living in southwest Detroit, I became more aware of just how much our environment influences our quality of life,” says Darren. “My experience also helped me realize the severity of health disparities that disproportionately impact communities of color.”
• Allergens, such as dust mites, animal dander, cockroaches, and mold
Homeowners and rental tenants can use AAFA’s Healthier Home Checklist to identify areas of their living spaces that may be contributing to asthma. It can be expensive to remediate an entire home, so AAFA recommends focusing on the areas where the person with asthma spends most of their time. This is usually the bedroom or sleeping areas.
• Emissions from vehicles, gas-powered generators, and other machinery
• High levels of humidity that encourage mold growth and dust mites
Due to limited data on the MSA level, AAFA’s Asthma Capitals report does not yet evaluate indoor air quality or housing quality as a risk factor for asthma. But this is a critical area to address in housing policy, building maintenance, school environmental policies, and workplace Publicaccommodations.buildingsshould improve their ventilation, use integrated pest management, and evaluate the products they use to reduce indoor air pollution.
Indoor air quality is just as important as outdoor air quality. Outdoor air can contain harmful pollution. But indoor air can be up to five times more polluted than outdoor air. We spend most of our time indoors, and our buildings can trap harmful air pollution and other asthma triggers inside. Reducing asthma triggers in homes, schools, and workplaces is an important part asthma management.
• Burning fuels and wood (from cooking food or heating the indoor space)
• Chemicals and volatile organic compounds (VOCs) from building materials, cleaning products, and new furniture
asthmacapitals.com
Look for the CERTIFIED asthma & allergy friendly® mark to confirm the product meets the standards to reduce exposure to allergens and improve air quality. Visit aafa.org/certified to search for CERTIFIED products and learn more about the asthma & allergy friendly® Certification Program.
There are ways to improve indoor air quality and reduce exposure to allergens and airway irritants. Many products make claims such as being “hypoallergenic.” But there are no federal regulations on these claims. To improve indoor environments for people with asthma and allergies, AAFA and Allergy Standards Limited developed strict standards and certify only the products that meet all the standards.
• Scents and fragrances from candles, scent diffusers, cleaning products, personal hygiene products
Asthma management involves more than just taking medicine. People with asthma also need to reduce exposure to asthma triggers like air pollution, animal dander, pollen, dust mites, or mold.
• Outdoor air pollution that enters the building
©2022 Asthma and Allergy Foundation of America 21 2022
AAFA works with many stakeholders including state health departments, building inspectors, home product manufacturers, asthma educators, community health workers, and state legislators to improve indoor environments for the health of people with asthma and allergies.
SPOTLIGHT: INDOOR AIR QUALITY AND HEALTHY BUILDINGS
The following can negatively affect indoor air quality:
CONTROLLING ASTHMA TRIGGERS AND ALLERGENS
asthmacapitals.com ©2022 Asthma and Allergy Foundation of America 22 2022
Pollen is a common allergen that can cause allergic asthma (asthma triggered by allergens). Many people have been experiencing worsening pollen allergy symptoms over the years. Due to climate change, pollen seasons have been getting longer and more intense. Global warming is leading to more extreme weather, like heat waves and droughts. These changes lead to warmer temperatures, increases in ground-level ozone, higher carbon dioxide (CO2) levels, and air pollution. And the cycle continues.
10
21. Centers for Disease Control and Prevention. (2021). FastStats - Allergies and Hay Fever. U.S. Department of Health and Human Services. https://www.cdc.gov/nchs/fastats/allergies.htm
9
The longer growing seasons mean that in some areas, pollens begin to release in January and may not stop until November. Throughout the U.S., trees produce the most pollen from March through May. In the northern U.S., grass pollen usually appears in the late spring and early summer. Weed pollen appears in the late summer and fall and may continue until the first frost. In the South, tree pollen starts earlier, grass pollen may be year-round, and weed pollen may continue late into the year. people affected by
1* McAllen, TX 38 San Antonio, TX 29 Scranton, PA 77 Richmond, VA 12 Bridgeport, CT 85 Hartford, CT 69 New Haven, CT 90 Springfield, MA 52 Buffalo, NY 65 Albany, NY 16
4
5*
5*
5*
1*
RankingPollen
CONTROLLING ASTHMA TRIGGERS AND ALLERGENS
22. Climate Central. (2021). Pollen & Allergy Season. https://www.climatecentral.org/climate-matters/pollen-allergy-season
3
A change in growing seasons is causing plants to increase the amount of pollen they produce. Allergy seasons are starting earlier and ending later in the year. With warmer, longer seasons, allergy-causing plants can move into new areas. This is troubling. More than 24 million Americans already have seasonal allergic rhinitis, and pollen allergies are a major cause.21 That number could rise in the coming years due to climate change.22
These cities have the highest estimates of
POLLEN
5*
San Antonio, TX

†For each city included in the 2022 Asthma Capitals report, AAFA obtained a comprehensive index of the population at risk of being affected by airborne allergenic pollen for the respective Designated Market Area (DMA) from 2021. Pollen affected populations are derived from actual pollen counts, allergy prevalence for each pollen type, and related factors.
AAFA also releases annual Allergy Capitals reports for spring and fall allergies. Visit allergycapitals.com to learn how your city ranks and what to do if you live in an Allergy Capital and have pollen allergies. Scranton, Pennsylvania, ranked #1 on the 2022 Allergy Capitals™ report.

AsthmaOverallCapitalNationalRanking
(*Tie) Metropolitan Area
pollen†:
Harrisburg, PA 7
According to the CDC, smoking is the leading cause of preventable death in the U.S.23 Smoking is not only harmful to the person doing the smoking but also to those nearby who inhale secondhand smoke or come into contact with thirdhand smoke. Many chemicals and substances in secondhand and thirdhand smoke can irritate the lungs and airways.
Chattanooga, TN 68
Many state and local jurisdictions have passed laws that prohibit smoking in some places. These may include workplaces, restaurants, hotels, parks, and transit systems. Research your state or county to see what the laws are in your area.
asthmacapitals.com Asthma and Allergy Foundation
of America 23 2022
24. Matt, Georg E., et al. “Thirdhand Tobacco Smoke: Emerging Evidence and Arguments for a Multidisciplinary Research Agenda.” Environmental Health Perspectives, vol. 119, no. 9, 2011, pp. 1218–26. Crossref, doi:10.1289/ehp.1103500.
©2022
Virginia Beach, VA 67
23. Centers for Disease Control and Prevention. (2021). Health Effects of Cigarette Smoking. U.S. Department of Health and Human Services. https://www.cdc.gov/tobacco/data_statistics/fact_sheets/health_effects/effects_cig_smoking/
Cities can further strengthen policies to protect people from the harmful effects of tobacco smoke by making additional smoke-free zones (like public parks), supporting smoking cessation programs, and encouraging tobacco-free youth campaigns that also teach about the dangers of vaping.
Secondhand smoke refers to smoke that is released in the air when a smoker exhales, as well as smoke released from a burning cigarette, cigar, e-cigarette, or pipe. Thirdhand smoke is residue from tobacco smoke. When a cigarette is smoked, chemicals in the smoke stick to surfaces and dust for months after the smoke is gone. The chemicals in the residue then react to other pollutants in the air, like ozone, to create harmful particles you can easily inhale.24
Oklahoma City, OK 73 Tulsa, OK 57
Metropolitan Area
Knoxville, TN 87
Harrisburg, PA
SMOKING CIGARETTES, CIGARS, VAPES
AsthmaOverallCapitalNationalRanking
Memphis, TN 60
Nashville, TN 44
State-level clean air laws can create smoke-free zones for the public. All indoor, public buildings should be smoke-free, and a buffer near entrances/exits should also be provided (e.g., no smoking within 25 feet of a building door or window). States should also fund smoking cessation programs.

†For each city included in the 2022 Asthma Capitals, AAFA obtained data on whether there was a 100% smoking ban for cars with minors, non-hospitality workplaces, restaurants, bars, and multi-unit housing. Cities on this list have fewer than two of the five smoking laws we analyzed.
These cities do the least to protect their residents and visitors from tobacco smoke and have fewer smoke-free laws†, comparatively:
MedicineQuick-ReliefAsthmaUseRanking
Metropolitan Area
©2022
ASTHMA QUICK-RELIEF MEDICINE USE
2 Pittsburgh, PA 50
A good way to know if your asthma is not well-controlled is by answering these questions:
• Do you need your quick-relief medicine to treat symptoms more than two times a week?
Quick-relief medicine use† is highest in these cities:
asthmacapitals.com Asthma and Allergy Foundation 2022
†For each city included in the 2022 Asthma Capitals, AAFA obtained the total number of quick-relief medicine prescriptions for the respective census-designated metropolitan statistical area, or MSA, from 2021. Analysis included estimating the prescription rate per patient prevalence.
Both control medicines (sometimes called “controllers”) and quick-relief medicines (sometimes called “rescue inhalers”) may be necessary for optimal asthma management. Quick-relief medicines help relieve asthma symptoms as they are happening. These medicines act fast to relax the constricting smooth muscles around the airways. This allows the airways to open up so air can flow through them. Frequent use of a quick-relief medicine (like albuterol) is an indication there is a high number of asthma episodes and lack of asthma control.
If the answer is “yes” to any of these questions, it is a sign that your asthma is not under control. There are many treatment options to support asthma control.
• Do you wake up from asthma more than two times a month?
Rochester, NY

AsthmaOverallCapitalNationalRanking
10 Harrisburg, PA 7
3 McAllen, TX 38
• Do you have asthma symptoms more than two times a week?
• Do you use oral corticosteroids (like prednisone) more than two times a year?
7 Lakeland, FL 4
4 Toledo, OH 19
of America 24
9 Columbus, OH 11
1 Rochester, NY 20
5 Dayton, OH 24
25. Anderson, W., Gondalia, R., Hoch, H., Kaye, L., Szefler, S., & Stempel, D. (2019). Screening for inhalation technique errors with electronic medication monitors. The Journal of Allergy and Clinical Immunology: In Practice, 7(6), 2065–2067. https:// doi.org/10.1016/j.jaip.2019.02.006
For inhalers to work well they need to be used correctly, but they can be difficult for people to use. There are different types of inhalers and this may cause confusion for patients and caregivers. More than half of all people who use inhalers don’t do each step correctly.25 It is important for patients, nurses, and doctors to learn proper inhaler technique and review inhaler use at every appointment.
8 Cleveland, OH 2
6 Akron, OH 42
10 Toledo, OH 99
Updates to the asthma treatment guidelines in the U.S. now recommend different options for using asthma control medicines. The first option is to take ICS every day to control asthma and to use quick-relief medicine at the first sign of asthma symptoms. A second and new option recommends that people with asthma take ICS controller medicines as needed. This means using ICS and quick-relief inhalers one after another when there are symptoms present. This can be as effective as using a controller medicine every day.
Both control and quick-relief medicines may be necessary for optimal asthma management. Control, or controller, medicines help prevent and control asthma symptoms. There are several kinds of asthma control medicines, including inhaled corticosteroids (ICS). ICS medicines prevent and reduce airway swelling, as well as reduce mucus in the lungs. Combination inhaled medicines combine ICS with a long-acting beta agonist (LABA). LABAs open the airways by relaxing the smooth muscles around the airways. Other types of controller medicines include biologics or leukotriene modifiers.
1 Pittsburgh, PA 26
A third and also new option is a treatment option known as SMART (which stands for single maintenance and reliever therapy). SMART uses one inhaler that combines an ICS controller and a long-acting reliever medicine together into one device. When on SMART, a person can either take the combo medicine only as needed to relieve sudden symptoms; or take it daily as a controller and then also as needed for quick relief. This is based on age and the severity of asthma. The FDA has not yet approved these medicines to be used in this way. If you are interested in SMART, talk with your doctor.
Pittsburgh, PA

3 Harrisburg, PA 9
2 Rochester, NY 22
asthmacapitals.com ©2022 Asthma and Allergy Foundation of America 25 2022
7 El Paso, TX 30
8 Jackson, MS 73
†For each city included in the 2022 Asthma Capitals, AAFA obtained the total number of controller medicine prescriptions for the respective census-designated metropolitan statistical area, or MSA, from 2021. Analyses included estimating the prescription rate per patient prevalence.
AsthmaOverallCapitalNationalRanking
Asthma control medicines are prescribed for persistent cases of asthma. A high number of these prescriptions may indicate that a city’s residents have more severe or uncontrolled cases of asthma.
MedicineAsthmaControlUseRanking Metropolitan
5 Grand Rapids, MI 76
6 McAllen, TX 77
9 Boise, ID 100
4 Virginia Beach, VA 16
These cities have the highest rates of asthma controller medicine use†: Area
ASTHMA CONTROL MEDICINE USE
Metropolitan Area AsthmaOverallCapitalNationalRanking
Living in an area where there are fewer specialists can mean traveling long distances for care. This can be a burden on personal finances and time, especially when frequent trips are needed. And it may take months to get an appointment.
3 Toledo, OH 19 4 Poughkeepsie, NY 8 Albany, NY 16 Fresno, CA 5
6
Hartford,

Successful asthma management requires coordination of care between the person with asthma and their health care team. In addition to a primary care doctor, a person with persistent asthma might need to be in the care of a specialist. Pulmonologists, allergists, and immunologists, for example, can provide specialized care for people with asthma and may have more experience treating patients with severe asthma or allergic asthma than a primary care physician.
ACCESS TO SPECIALISTS
5
7 McAllen, TX 38 8 Bridgeport, CT 85 9 New York, NY 21 10 Lakeland, FL 4
26. Association of American Medical Colleges. (2019). Percentage of All Active Physicians by Race/Ethnicity, 2018. aamc.org/data-reports/workforce/interactive-data/figure-18-percentage-all-active-physicians-race/ethnicity-2018.www. CT
SpecialistsFewestRanking
asthmacapitals.com
2
Access to appropriate medical care is dependent upon different factors, including socioeconomic status, insurance status, and availability of specialists in nearby locations. The lack of availability of nearby asthma specialists may be associated with poor asthma outcomes.
©2022 Asthma and Allergy Foundation of America 26 2022
These cities have the fewest asthma specialists per asthma patient†:
1 Hartford, CT 69 New Haven, CT 90
†For each city included in the 2022 Asthma Capitals, AAFA obtained data on specialists per 10,000 asthma patients.
Emphasis on increasing diverse representation in the physician workforce is integral to addressing health equity. According to the Association of American Medical Colleges, the racial and ethnic makeup of active physicians in 2019 was as follows26:
56.2%WhiteAsian17.1% Unknown13.7%Hispanic5.8%Black5.0% Other: Non-Hispanic:Multiple0.8%Race, 1% American Indian or Alaska Native: 0.3% Native Hawaiian or Pacific Islander: 0.1%
Health Equity
©2022 Asthma
On May 3, 2022 (World Asthma Day), AAFA launched its Health Equity Advancement and Leadership (HEAL) program. The HEAL program reinforces AAFA’s commitment to drastically reduce health disparities in communities that bear the heaviest burden of asthma.
asthmacapitals.com and Allergy Foundation
of America 27 2022
AAFA’s Asthma Disparities in America report examines how asthma affects Black, Hispanic, and Indigenous populations in the United States. This report is an update to AAFA’s 2005 report on asthma disparities. The report reviews the current state of asthma disparities and serves as a national call to action to fix the social inequities caused by structural racism that continues to harm Black, Hispanic, and Indigenous individuals and families with asthma. Read the report at aafa.org/asthmadisparities
This report acknowledges that where a person lives can significantly impact their health. Social, economic, and environmental disadvantages play a role in determining asthma outcomes. Many of the top Asthma Capitals are also facing major challenges and inequities that lead to health disparities.

Health disparities happen when a health condition, like asthma or allergies, affects one group of people differently than another group. Health disparities not only have an impact on affected groups but also limit the overall quality of health care for the entire population. Health equity is the state in which everyone has a fair and just opportunity to reach their highest level of health. It is a core value and mission-critical priority for AAFA.
Each year, HEAL Innovation will award funding and resources to four local pilot programs tailored to at-risk populations most impacted by asthma. In the first year of the program, AAFA is funding programs in Detroit, St. Louis, Los Angeles, and Chicago. The focus of these four programs will be on adults and teens with asthma.
As part of AAFA’s HEAL program, AAFA announced its HEAL Innovation awards. This is a multiyear project with the goal of building and supporting community-based interventions to address inequities in asthma.
In addition to the four cities chosen for HEAL Innovation funding, AAFA is also supporting programs in New York dedicated to addressing asthma disparities. AAFA is funding a community health pilot program by AIRnyc to connect households managing asthma with health education, health care, and social programs. With the New York State Energy Research and Development Authority (NYSERDA), AAFA is supporting the state’s $30 million Building Better Homes and $40 million Buildings of Excellence Competition initiatives which will advance climate friendly, carbon neutral homes that have health benefits like better indoor air quality, across the State, including to disadvantaged communities.
The following pages will highlight these five cities: Detroit, St. Louis, Los Angeles, Chicago, and New York City.
Detroit is one of the four cities chosen for AAFA’s HEAL Innovation project. AAFA is partnering with the AAFA Michigan Chapter (AAFA-Michigan) to conduct a multi-component intervention. This intervention will improve asthma control through general health and wellness, access to specialty care, assessment of home environments, and asthma self-management education.
#1DETROITAsthma
asthmacapitals.com
“Due to polluting industries, Southwest Detroit has the worst air quality in the state of Michigan, and it predominately impacts a community of color,” says Dr. Attisha. “Sadly, many children and families living with asthma in Detroit don’t have immediate access to the tools and resources that can help bring asthma under control. They also may not know the triggers that set off their asthma.”
Capital and HEAL Innovation Site
Dr. Elliott Attisha is a school health expert in Detroit and member of AAFA-Michigan’s board of directors.
This year’s top Asthma Capital is Detroit, Michigan, up from #15 in 2021. Detroit ranks “worse than average” for all three outcomes calculated in the ranking: asthma prevalence, asthma-related emergency room visits, and asthma-related deaths. Detroit also has the sixth highest rate of poverty in all 100 MSAs analyzed (20% of the population is living in poverty), and it received an F rating for high ozone days and particle pollution.
©2022 Asthma and Allergy Foundation of America 28 2022
Dr. Attisha is a current resident of the Detroit metro area and spent 12 years serving students in Detroit with mobile health clinics at schools. He is also a person who lives with asthma and knows that control is key to maintaining health. This is often a luxury that not all families in Detroit have access to.
The reasons behind the high rate of asthma in Detroit are complex. “Children who live in low-income communities are at higher risk for asthma, with childhood asthma prevalence in Detroit nearly double the rates across Michigan (14.6% vs. 8.4%, respectively)”, says Dr. Attisha, referencing a Michigan Department of Health and Human Services report highlighting the local health disparity of asthma.27 “Children with asthma also face significant challenges. Many families lack transportation, and most Detroit neighborhoods are recognized Health Professional Shortage Areas. Asthma also impacts academic achievement and is also the leading contributor to missed school days; nearly 14 million missed school days annually are due to asthma.”
Dr. Elliott Attisha is member of AAFA-Michigan’s Board of Directors. He is the former inaugural Chief Health Officer at Detroit Public Schools Community District and current Senior Fellow for Health with AttendanceWorks

27. Michigan Department of Health and Human Services. (2021). Detroit: The Current Status of Asthma Burden. https://www. michigan.gov/mdhhs/0,5885,7-339-71550_5104_5279-213824--,00.html
Dr. Attisha is an advocate for a team-based, whole-child approach when it comes to asthma management and treatment. Improving asthma locally must incorporate community education (which includes schools), identification and reduction of environmental asthma triggers, access to a health care provider, and improvement of upstream determinants of asthma care (such as housing quality and economic stability).
Asthma is one of the top health concerns for many Detroit residents. The “Motor City” has a history of deep ties to the auto and manufacturing industry and is the home to the busiest international crossing in America, with more than 40,000 commuters, tourists, and truck drivers passing through Detroit to Windsor, Ontario each day.
Laonis serves her community by using social media and word of mouth for her events. Her longterm goal is to open a free asthma clinic for children in Detroit. The clinic would be affordable and accessible for individuals with limited transportation and other resources. “There are plenty of pulmonologists in the suburbs, but not many in the city,” says Laonis.
©2022 Asthma and Allergy Foundation of America 29 2022
Adriana also helps families navigate their asthma care. She helps them overcome barriers like finding affordable medication, lack of transportation, and lack of access to medical care. She is working with AAFA-Michigan to serve participants through the new HEAL Innovation program.
While Detroit residents with asthma face significant challenges and burden, AAFA is encouraged by the partnerships, initiatives, and programs serving the asthma community. The passion and dedication of these organizations and advocates will help lead to more equitable asthma outcomes in Detroit.
Laonis Quinn is the founder of Breathe: Anthony J. Chapman Asthma Foundation. She holds a photo of her son, Anthony Chapman, who passed away due to asthma in 2007.

Adriana helps educate families about asthma triggers in their home, provides training on how to use asthma medication correctly, and helps ensure that her patients have an asthma action plan in place.
Adriana Zuniga, a certified community health worker (CHW) and resident of Southwest Detroit, has spent the last 22 years serving and educating her community. She works with children with asthma and their families by doing home visits. Adriana is one of many CHWs committed to asthma care in the Detroit community.
“I like to educate about asthma triggers because there are many that people may not be aware of. For example, many individuals don’t know household pests like mice or roaches can trigger asthma symptoms. Different hair products or chemicals that they use can also be triggers for some people. Candles are a big one that I come across, as well as scented plug-ins,” says Adriana. “I always say that knowledge is power. I live by that!”
Laonis knows that having access to affordable care is critical for asthma management. “If you cannot afford to buy food, you’re probably not able to buy a spacer, which many insurance companies do not cover,” says Laonis. “Spacers cost about $20. But, $20 is a lot of money for someone who can’t afford to buy food for their family.”
Laonis is now a passionate advocate for helping families in need learn about their asthma. A registered nurse for over 25 years and now a Certified Asthma Educator (AE-C), she spends her free time operating her foundation and educating families about asthma control. She provides asthma trigger reduction resources to families in need, such as pillow and mattress covers, air cleaners, and asthma spacers for inhalers.
asthmacapitals.com
Detroit is also the hometown to Laonis Quinn, the founder of Breathe: Anthony J. Chapman Asthma Foundation. Laonis founded the organization in 2019 in honor of her son, Anthony Jamar Chapman who passed away due to asthma complications in 2007.
Laonis has asthma herself, though her asthma is thankfully well-controlled. “No one should die of asthma!” she points out. “People should have the tools, resources, and care that they need to understand and recognize symptoms before their asthma gets out of hand,” she says. Laonis reflects on her foundation, “This is a passion for me...I’m working to save lives and serve families.”
Anthony lived with severe asthma since the age of two. Laonis recalls the hardships her family experienced getting treatments and medical care. Missing days of school and work were an ongoing challenge for her family. When Anthony’s health insurance coverage ended at age 21, this started a cascade of health complications for him.
ST. LOUIS
#14 Asthma Capital and HEAL Innovation Site
30. Battaglia, S., Benfante, A., Spatafora, M., & Scichilone, N. (2016). Asthma in the elderly: a different disease? Breathe, 12(1), 18–28. https://doi.org/10.1183/20734735.002816
Chris Martinez is the Executive Director of the AAFA St. Louis Chapter.

asthmacapitals.com ©2022 Asthma and Allergy Foundation
28. Harris, K. M. (2019). Mapping inequality: Childhood asthma and environmental injustice, a case study of St. Louis, Missouri. Social Science & Medicine, 230, 91–110. https://doi.org/10.1016/j.socscimed.2019.03.040
While the health disparities among children with asthma in St. Louis are better known, another vulnerable population is older adults with asthma. A needs assessment conducted by Seniors Count of Greater St. Louis found that adults age 65+ in the St. Louis area experience a 20% higher rate of asthma hospitalizations and ED visits than those in Missouri as a whole.29 The study also found that many older adults are living below the economic security threshold that is set for the St. Louis area, with 56% of older adults facing difficult decisions about maintaining adequate housing, quality food, and paying for medical expenses.
The St. Louis community hopes to learn more about asthma health disparities affecting local older adults. As part of AAFA’s HEAL Innovation program, the AAFA St. Louis Chapter (AAFA-STL) has launched a new home visitor program to address this gap in care for adults with asthma in the greater St. Louis area.
St. Louis has a long history of asthma disparities. A study of asthma and environmental injustice in St. Louis examined local hotspots for asthma. The study found correlation between high rates of asthma and areas with poverty, public housing, deteriorating housing, and limited access to health care resources.28 These disparities can be addressed in part through investments to improve the local environment, health, and economic resources.
Asthma care and proper diagnosis can become complicated as individuals grow older. Asthma is thought to be widely undertreated in older adults due to a variety of variables that include the presence of other comorbid illnesses and the structural changes of aging lungs.30 Older adults are often excluded from clinical trials and may experience age-related adverse effects of asthma medications.
of America 30 2022
St. Louis, Missouri, ranks #14 in the 2022 Asthma Capitals report, up from #32 in 2021. While the city’s prevalence scores fall within the “average” range, St. Louis received a “worse than average” score for asthma-related emergency department (ED) visits and asthma-related deaths. In fact, St. Louis had the highest rate of asthma deaths in all 100 MSAs that were analyzed. The asthma death rate in St. Louis is nearly three times the national average, and three times the rate of Missouri as a whole.
Chris Martinez is the executive director of AAFA-STL and is leading the HEAL project in his community. “We hope to gain a clear understanding of the needs of older adults with asthma in our region, the interventions that work best for this population, and the delivery model that is most effective,” says Chris. “Health equity is a priority for AAFA-STL, and through the HEAL program we feel we can make a difference for older adults who experience disproportionate burden of asthma in St. Louis.”
29. Seniors Count of Greater St. Louis. Needs Assessment. https://stlseniorfund.org/wp-content/uploads/2018/07/ SeniorsCountStLouisCity.pdf
AAFA is partnering with Breathe Southern California (Breathe SoCal) as one of our HEAL Innovation program sites to help address asthma disparities in LA. Breathe SoCal a is a community-based organization that is committed to promoting clean air and healthy lungs through research, education, advocacy, and technology. The Breathe Easier™ Asthma Management (BEAM) Project will focus on working with adults with asthma in underserved communities of Southeast Los Angeles. The team will utilize home visits, patient education with an asthma certified health educator, and indoor environmental assessment for asthma trigger prevention.
AAFA’s HEAL Innovation program in Chicago plans to use evidence-based strategies that reduce asthma-related ED visits and hospitalizations. The program will utilize tools such as home visits by a community health worker and asthma educator to help reduce the exposure to environmental asthma triggers. The program will provide remediation tools such as CERTIFIED asthma & allergy friendly® air cleaners, pillow mattress covers, and more. The asthma educator will also provide self-education tools for the program participants to learn how to manage their asthma effectively.
©2022
31. Ann & Robert H. Lurie Children’s Hospital of Chicago. (2020). Rate of Asthma in Chicago Children Surpasses State and National Levels. https://www.luriechildrens.org/en/news-stories/rate-of-asthma-in-chicago-children-surpasses-state-andnational-levels/
LOS ANGELES
Breathe SoCal has established relationships with over 200 community partners and Federally Qualified Health Centers in the LA community and plans to expand their reach for BEAM. “We are excited about our partnership with other organizations to conduct the BEAM project. Breathe SoCal can’t do this alone, but through our partners we will be able to reduce the burden of asthma on underserved communities in L.A.,” says Gilmar Flores, MPH, Senior Manager of Programs and Research for Breathe SoCal.
of America 31 2022
Capital and HEAL Innovation Site
asthmacapitals.com Asthma and Allergy Foundation
Communities of color in Los Angeles continue to bear a high burden of asthma. Black LA residents are nearly twice as likely to die from asthma than white LA residents. Black children enrolled in Medi-Cal (California’s Medicaid program) have a higher rate of ED visits and hospitalizations due to asthma than any other race or ethnicity in the LA area.32 These are only some of the disparities among LA residents. (Note: In 2022, California became the first state to provide reimbursement for Asthma Preventive Services and Asthma Remediation for patients enrolled in Medi-Cal. This is a long-awaited step toward more sustainable financing for asthma home visits and care.)
#62 Asthma Capital and HEAL Innovation Site
Children in Chicago experience higher rates of asthma than state and national levels.31 In 2021, Black children ages 5-19 were 4.3 times more likely to have an asthma-related ED visit than white children. Unfortunately, this racial gap is increasing for the local Chicago community.
#28CHICAGOAsthma
Chicago, Illinois, also faces a well-known asthma disparity. Chicago is #28 in this year’s Asthma Caps report, up from #54 in 2021. While falling within the “average” scores for asthma prevalence and ED visits, Chicago ranks “worse than average” for asthma-related mortality. When looking at mortality alone, Chicago has the 12th highest asthma mortality rate of all MSAs analyzed. When looking at mortality rate by race and ethnicity, Black people in Cook County (where Chicago is located) are over six times more likely to die from asthma than white people in Cook County.
32. Yonsu, K., Pirritano, M., Miller Parrish, K. (July, 2022). Determinants of racial and ethnic disparities in utilization of hospitalbased care for asthma among Medi-Cal children in Los Angeles https://www.tandfonline.com/doi/abs/10.1080/02770903. 2021.1955131
NEW YORK
New York City ranks as #21 in this year’s Asthma Capitals report. The city received an “average” score for asthma-related emergency department visits but received “worse than average” scores for both asthma prevalence and asthma-related deaths. In fact, New York City has the sixth-highest rate of asthma-related deaths of all 100 cities analyzed.
To better serve people and families in areas of New York with the highest burden, AAFA is collaborating with AIRnyc. AIRnyc is a community-based organization dedicated to providing care and support to New York City’s most marginalized residents and their families.
33. NYC Health. (2021). Disparities among children with asthma in New York City. New York City Department of Health and Mental Hygiene. https://www1.nyc.gov/assets/doh/downloads/pdf/epi/databrief126.pdf
AIRnyc Community Health Workers (CHWs) host a table at a street fair in East Harlem aimed at improving adolescent health.

asthmacapitals.com ©2022 Asthma and Allergy Foundation of America 32 2022
Though New York City avoided being in the top 20 of this year’s Asthma Capitals, it is important to note that the Asthma Capitals data is analyzed at the Metropolitan Statistical Area (MSA) level. The New York City MSA covers 23 counties, including 10 counties in New York State (the five boroughs of New York, the two remaining counties of Long Island, and three counties in the Lower Hudson Valley), 12 counties in Northern and Central New Jersey, and one county in northeastern Pennsylvania.
34. Citizens’ Committee for Children of New York. (2022). Keeping track online: The status of New York City children, asthma hospitalizations 2016. https://data.cccnewyork.org/data/table/7/asthma-hospitalizations
#21 Asthma Capital
AIRnyc has over two decades of practice developing and refining its Community Health Worker (CHW) model of care. It’s this unique approach that spurred a partnership with AAFA. With financial and technical support from AAFA, AIRnyc launched the Asthma Care Intervention pilot program to connect 50 households managing asthma with health education, health care, and social programs.
Given the expanse of the MSA, some areas with the highest burden of asthma may get diluted when the data is analyzed. Historically, residents of the Bronx have consistently experienced higher rates of asthma-related emergency department visit and hospitalizations. In South Bronx neighborhoods, asthma-related emergency department visits among children 5-17 years old are nearly 20 times higher than neighborhoods in the other boroughs.33 Poor air quality caused by highways and mixed-use industrial zones, as well as high poverty rates, contribute to these asthma disparities. While the Bronx historically sees the highest rates for asthma hospitalizations, some Brooklyn neighborhoods have similar asthma hospitalization rates. In 2016, Bedford Stuyvesant and East New York had the 3rd and 6th highest hospitalization rates in New York City for children ages 5-17 years old, respectively.34
The team at AIRnyc is working tirelessly to help New York City households break through barriers to better health. AIRnyc is a technology-enabled, data-driven, Community-Based Organization headquartered in the Bronx, NY. AIRnyc serves people of all ages, ethnicities, and faiths throughout NYC who bear the highest burdens of poverty and chronic diseases.
asthmacapitals.com
©2022 Asthma and Allergy Foundation of America 33 2022
Major policy changes in health care, climate, and housing can support a more equitable future for asthma health. Building climate-resilient communities and healthier homes will support better health.
Lola Simpson (left) is the CEO of AIRnyc, a community-based organization serving marginalized communities in New York. Mariluz Garcia (middle) and Alex Moreno (right) are community health workers (CHWs) leading the asthma project for AIRnyc.
As part of the Building Better Homes initiative, NYSERDA is partnering with New York State Builders Association and AAFA to advance construction of carbon neutral homes and promote their non-energy benefits, particularly indoor air quality improvements associated with the absence of combustion appliances and the inclusion of balanced ventilation. These partnerships will provide information about the health benefits of carbon neutral construction that builders and developers can integrate into their own materials to educate homebuyers. Through the partnership with AAFA and its existing diversity, equity and inclusion programming, special attention will be paid to educating the builder network about the health benefits of carbon neutral construction in disadvantaged communities, which traditionally have higher rates of asthma and allergy, in part due to the siting of fossil fuel plants and transportation corridors in these neighborhoods as well as in-home combustion.
Two CHWs—Mariluz Garcia and Alex Moreno—are leading the AIRnyc pilot program supported by AAFA. AAFA and AIRnyc’s alliance is an exciting opportunity to bridge local community expertise to the national level.

“AIRnyc hopes to elevate the credibility of CHW work at the local and national level through partnership with a national organization like AAFA, especially when it comes to populations that have had inequitable access to healthcare and other resources,” Lola shares. “We are excited to shift policy and address structural inequities – moving towards addressing root causes instead of band-aid solutions.”
Lola Simpson is the CEO of AIRnyc. “The mission of AIRnyc Community Health Worker care model is to meet people where they live to connect families to care and build health equity at the individual, family, and community levels,” says Lola. “This work is conducted in partnership with its stakeholders of health systems, managed-care organizations, government agencies and philanthropies.”


The CHW is the engine behind the success of AIRnyc’s approach. The CHW partners with each household to help families understand asthma medicine management and techniques, they provide education for the whole family, address social needs, and complete an environmental assessment to identify potential triggers at home that could be affecting the patient’s asthma. The CHW co-creates a health action plan with the patient to help set goals that will help increase the patient’s health and quality of life.
With the New York State Energy Research and Development Authority (NYSERDA), AAFA is supporting the state’s $30 million Building Better Homes and $40 million Buildings of Excellence Competition initiatives which will advance climate friendly, carbon neutral homes that have health benefits like better indoor air quality, across the state, including to disadvantaged communities.
A Note From New York State Senator Gustavo Rivera
From New York State Senator Gustavo Rivera, Gustavo Rivera 33rd District, New York State Senate
As the State Senator representing the 33rd Senate District since 2010, my district covers neighborhoods across the Bronx, from Fordham Road to the Cross Bronx Expressway and Morris Park Avenue to the Major Deegan. Our borough has a disproportionately high rate of asthma and currently sees 210.7 asthma emergency department visits per 10,000 people per year as of 2019. As of 2021, I represent 23,472 constituents that are Medicaid beneficiaries living with asthma. I am committed to legislative solutions and policy changes that address these high rates of asthma, ensure accessible healthcare and treatments, and to combat the root causes of asthma in our community like environmental injustice.
S4934 relates to coverage for the treatment of asthma; and ensures that every health insurance policy includes coverage for the equipment and supplies for the treatment of asthma, and for children under 19 years old include additional equipment for use in school, if needed.
Gustavo Rivera
As Chair of the Health Committee, I was proud to co-chair two Asthma Roundtables in the Bronx alongside health and advocacy organizations, including the Asthma and Allergy Foundation of America. During our 2019 roundtable, we discussed causes of asthma, barriers to receiving care, costs associated, and issues around insurance coverage as well as the environmental factors in our communities and homes that contribute to asthma and other respiratory issues. We learned about treatment devices that help people manage their asthma, existing programs to assist those with asthma in their homes, and barriers that exist in schools and childcare settings.
During our 2021 roundtable, we continued the discussion around expanding prevention measures and improving access to treatment, with a focus on the effect that the COVID-19 Pandemic was having on New Yorkers with asthma. My office and I work to ensure that my efforts in Albany are a reflection of the needs of my consistency in the Bronx. Looking towards the next legislative session, I hope to advocate and push for policies that reduce the impact of asthma in New York State. I thank you all for your continued advocacy on this issue.
During our 2021 roundtable, we continued the discussion around expanding prevention measures and improving access to treatment, with a focus on the effect that the Covid Pandemic was having on New Yorkers with asthma. My office and I work to ensure that my efforts in Albany are a reflection of the needs of my consistency in the Bronx. Looking towards the next legislative session, I hope to advocate and push for policies that reduce the impact of asthma in New York State. I thank you all for your continued advocacy on this issue.
• S1574 relates to integrating home care into the state’s public health and prevention efforts, that includes asthma and respiratory condition management as a public health priority initiative to promote home care’s integration into the state’s health continuum strategy in disease prevention, intervention and population health improvement.
● S1410 relates to including diagnosis of asthma or other respiratory diseases for which rescue inhaler treatment is prescribed in the statewide immunization information system.
● S1574 relates to integrating home care into the state's public health and prevention efforts, that includes asthma and respiratory condition management as a public health priority initiative to promote home care’s integration into the state’s health continuum strategy in disease prevention, intervention and population health improvement.
From New York State Senator Gustavo Rivera,
• S1412 relates to providing for a program of asthma disease management and control within the department of health.
● S1412 relates to providing for a program of asthma disease management and control within the department of health.
A Note from New York State Senator Gustavo Rivera


• S1410 relates to including diagnosis of asthma or other respiratory diseases for which rescue inhaler treatment is prescribed in the statewide immunization information system.
• S4934 relates to coverage for the treatment of asthma; and ensures that every health insurance policy includes coverage for the equipment and supplies for the treatment of asthma, and for children under 19 years old include additional equipment for use in school, if needed.
As Chair of the Health Committee, I was proud to co chair two Asthma Roundtables in the Bronx alongside health and advocacy organizations. During our 2019 roundtable, we discussed causes of asthma, barriers to receiving care, costs associated, and issues around insurance coverage as well as the environmental factors in our communities and homes that contribute to asthma and other respiratory issues. We learned about treatment devices that help people manage their asthma, existing programs to assist those with asthma in their homes, and barriers that exist in schools and childcare settings.
With this knowledge, I wrote bills that directly impact statewide systems, issues surrounding insurance coverage, and ultimately reduce the impact of asthma. The following bills were introduced:
As the State Senator representing the 33rd Senate District since 2010, my district covers neighborhoods across the Bronx, from Fordham Road to the Cross Bronx Expressway and Morris Park Avenue to the Major Deegan. Our borough has a disproportionately high rate of asthma and currently sees 210.7 asthma emergency department visits per 10,000 people per year as of 2019.
With this knowledge, I wrote bills that directly impact statewide systems, issues surrounding insurance coverage, and ultimately reduce the impact of asthma. The following bi lls were introduced:
33rd NewDistrictYorkState Senate
As of 2021, I represent 23,472 constituents that are Medicaid beneficiaries living with asthma. I am committed to legislative solutions and policy changes that address these high rates of asthma, ensure accessible healthcare and treatments, and to combat the root causes of asthma in our community like environmental injustice.
New York State Senator Gustavo Rivera represents the 33rd District in the Bronx. He is the Chair of the Health Committee and co-chair of two Asthma Roundtables.


asthmacapitals.com ©2022 Asthma and Allergy Foundation of America 35 2022
City, county, state, and federal policies all influence the health and environment where we live. AAFA applauds the work of policymakers who champion asthma-specific legislation, climate-related policies, and laws that improve access to high-quality affordable health care. New York State Senator Gustavo Rivera (representing the 33rd Senate District in the Bronx) advocates for better policies to support communities disproportionately impacted by asthma. Local communities heavily burdened by asthma need champions like Senator Rivera. They also need advocates like you. On page 39, you can find out how you can be an effective asthma advocate to encourage policymakers to support and protect people with asthma.
• Promoting equitable access to affordable, quality healthcare for the diagnosis, treatment, and management of asthma and allergies
The NACP is currently only funded at $30.5 million which only allows it to fund 23 states, Puerto Rico, and Houston, Texas. For fiscal year 2023, AAFA requested an increase to $40 million. This increase would continue to fund the program and would allow the CDC to expand the Asthma Call-back Survey to more states, as the CDC does not currently have comprehensive surveillance data for asthma nationwide.
Priority issues vary from year to year, but in fall under the following public policy priorities:
• Encouraging federal funding for basic, clinical, preventive and health services research
Specific legislative and funding priorities for 2022 include:
of America 36 2022
• National Asthma Control Program
NATIONAL ASTHMA CONTROL PROGRAM (NACP)
By working with state health departments on community-based care models, the NACP has been able to reduce the number of deaths, hospital stays, and emergency department visits. In fact, since it started in 1999, asthma-related deaths have gone down by 41% even though the number of people with asthma has gone up since that time.
In addition to providing funding for state asthma programs, the NACP also supports national asthma programs. AAFA’s project—Community Health Interventions to Advance Self-Management of Asthma (CHI-ASMA)—is backed by a five-year $1 million cooperative agreement with the CDC. The aim of CHI-ASMA is to empower patients and their families to improve asthma control, which will reduce morbidity and mortality due to asthma.
• Inflation Reduction Act
asthmacapitals.com and Allergy Foundation
• Elijah E. Cummings Family Asthma Act
Federal Policies and Programs to Support People With Asthma
• Ensuring clean, safe air for everyone and combatting the harmful health impacts of climate change
• Health Equity and Accountability Act
©2022 Asthma
Administered by the CDC, the NACP is a program that awards competitive grants to states, territories and municipalities. This means the government gives funding to state and local health departments to help improve asthma surveillance (data collection), train health professionals, and educate people with asthma.
AAFA works to support public policies that will benefit people with asthma and allergies at a federal (national) level. AAFA works with key stakeholders to help shape legislation and regulation that impacts people with asthma and allergies.
• Creating healthy settings for people with asthma or allergies especially in schools and childcare settings, restaurants, and airplanes
You can join AAFA and ask your legislators to support the Health Equity and Accountability of 2022 using AAFA’s easy advocacy tool
asthmacapitals.com Asthma and Allergy
The Congressional Tri-Caucus has introduced HEAA in every Congress since 2003. The time to act is now. The Tri-Caucus includes the Congressional Asian Pacific American Caucus (CAPAC), the Congressional Black Caucus (CBC), and the Congressional Hispanic Caucus (CHC).
Reps. Debbie Dingell (D-MI) and Fred Upton (R-MI), co-chairs of the House Asthma and Allergy Caucus, introduced the Elijah E. Cummings Family Asthma Act with support from their colleagues Lisa Blunt Rochester (D-DE) and Brian Fitzpatrick (R-PA). This bill aims to expand federal, state, and local efforts to improve care for people with asthma.
The Family Asthma Act was first introduced in the previous Congress in 2019 (and reintroduced in 2022). It is named in honor of the late Rep. Elijah E. Cummings, a long-time supporter of the asthma community. If passed, the bill would allow the CDC’s NACP to serve all 50 states, the District of Columbia, and Puerto Rico.
You can join AAFA and ask your legislators to support the Elijah E. Cummings Family Asthma Act using AAFA’s easy advocacy tool.
HEALTH EQUITY AND ACCOUNTABILITY ACT OF 2022 (H.R. 7585)
ELIJAH E. CUMMINGS FAMILY ASTHMA ACT (H.R. 7055)
The Health Equity and Accountability Act of 2022 (HEAA or H.R. 7585) is a bill aimed at addressing racial and ethnic health disparities in the United States.
• The development of state asthma plans
• Improved asthma surveillance and data collection
• Increased asthma education on prevention and management
Foundation of America 37 2022
HEAA includes asthma as a disease that has a high impact on minority groups. It lays out specific actions for the CDC to reduce asthma disparities. These actions include:
The bill directs the CDC to work with state and local health departments to give out information and teach the public about asthma. It would also require states to make plans to address asthma, especially for communities bearing the highest burden of asthma. The bill also aims to address the disproportionate burden of asthma on Black, Hispanic, and Indigenous Americans. The bill acknowledges the high rates of asthma and asthma-related deaths among Black Americans. And it proposes to expand efforts to improve care for people with asthma.
• Reporting on additional steps needed to reduce the disproportionate burden of asthma
The bill covers 10 topics that serve as a roadmap to health equity: data collection and reporting; culturally appropriate health and health care; health workforce diversity; improving health care access and quality; improving health outcomes for women, children, and families; mental health and substance use disorders; addressing high impact minority disease; health information technology; accountability and evaluation; addressing economic and social conditions and improving environmental justice.
©2022
The law will also improve access to health care for people with Medicare and people who buy health care coverage through their state’s Affordable Care Act (ACA) Marketplace. Two significant provisions for which AAFA advocated were the $2,000 out-of-pocket cap for prescription drugs in Medicare Part D and a 3-year extension of enhanced advance premium tax credits (APTCs). The $2,000 out-of-pocket cap will help seniors and people with disabilities insured by Medicare to afford vital prescription medication. The extension of APTCs will ensure that millions of Americans who do not have access to employer-sponsored health insurance or who do not qualify for Medicare or Medicaid will continue to benefit from subsidies to make Marketplace coverage more affordable.
asthmacapitals.com ©2022 Asthma and Allergy Foundation of America 38 2022

INFLATION REDUCTION ACT
On Aug. 16, 2022, President Biden signed the Inflation Reduction Act into law. The new law makes significant investments to address the climate crisis and to improve access to health care – two areas that directly impact over 60 million people in the United States with allergies and asthma. The law includes a $369 billion investment to fight climate change in the United States. It aims to reduce greenhouse gas emissions by 40% from 2005 levels by the year 2030. There is a direct link between climate change, allergies, asthma, and health equity. Black, Hispanic, and Indigenous populations in the U.S. have higher rates of poor asthma outcomes, including hospital stays and deaths. These are the same groups that have higher exposure to air pollution that is made worse by climate change.
Expand health insurance coverage for socioeconomically disadvantaged adults and children. Reduce drug costs for patients.
asthmacapitals.com ©2022 Asthma and Allergy Foundation of America 39 2022
Physical environment
Economic stability
Combat environmental injustice and reduce exposure to pollution by strengthening clean air policies, reducing transportation-related emissions, restricting zoning of polluting sources and transitioning to a clean energy economy.
Education
AAFA’s 2020 Asthma Disparities in America report outlines additional policy strategies in those four categories that you can bring to your local, state, or federal representatives to initiate change in your community.
Examples of Policy Strategies
TakinglegislatorAction
Improve school nurse to student ratios to ensure students have support to effectively manage their asthma and allergies.
• Tips for finding, contacting, and addressing your state legislators
• Sample letter to your at the State and Local Level
Implement tax policies that help low-income families accumulate more wealth.
• Tips for requesting a meeting with your legislators
Advocacy is a critical pillar of AAFA’s mission to reduce the burden of disease for people with asthma, allergies, and related diseases. In previous years, AAFA has used our Asthma Capitals reports to educate public officials on the challenges of living with asthma. We have primarily shared the reports with Congress to help promote policy solutions to improve the health and safety of people with asthma. This year, AAFA is calling on our community to join us in these advocacy efforts—particularly at the state and local level.
Reduce exposure to environmental triggers by improving school building conditions and improving air quality in and around schools.
Access to health care
Keys areas of advocacy to improve asthma outcomes include:
Key Issues
Your voice is critical to help build awareness in your community and to educate your elected officials who can lead change. On the following pages, we’ve included:
• Tips for communicating and advocating effectively
This report outlines significant risk factors that impact asthma outcomes as well as racial and ethnic disparities in those outcomes. There is no single policy solution to address the complex and structural issues facing the asthma community. AAFA therefore supports a “health in all policies” approach that recognizes the health implications of policy decisions in all sectors—including health, education, environment, labor, housing, social services, and city planning.
©2022
The easiest way to request a meeting is by phone or email. Legislators all have public email addresses and/or contact forms on their websites. Using the tips above, contact your representative’s office and add a request for a meeting. You may need to be flexible on timing but be persistent. You will most likely meet with a member of staff and not the lawmaker themself.
WRITING TO LEGISLATORS
CONTACTING YOUR LEGISLATORS
asthmacapitals.com Asthma and Allergy Foundation
of America 40 2022
If you live in one of the 50 states, you have one state senator and one state representative. You can find your senator and representative by going to openstates.org and entering your home address in the search bar. The results will include both your state and federal representatives. The state results will say either “upper” or “lower” chamber. Your state senator is a member of the upper chamber and your state representative is a member of the lower chamber.
CALLING YOUR LEGISLATOR
Writing to legislators is another advocacy tool you can use whether by physical mail or by email. Again, you will want to identify yourself as a constituent and make your request for support clear and concise at the beginning of the letter or email. You should then provide any relevant background information and personal stories related to the request. We have provided a sample letter in support of asthma policies on page 43
FINDING YOUR STATE LEGISLATORS
If you live in the District of Columbia or a U.S. territory, you can still use openstates.org to find your local representatives. You also have non-voting members of Congress at the federal level.
Calling elected officials is an extremely easy and effective way to raise important issues. First, you will want to introduce yourself and let the staff member know that you are a constituent (someone who lives in their district). Do not be surprised if they ask for your zip code. This is because constituent concerns are prioritized. You will then want to briefly raise your concern or request for your legislator using our communication tips on page 42.
You may also ask to speak to the appropriate legislative assistant based on the topic. Here is a brief example: “Hi, my name is Jane Doe from Virginia, zip code 22202. As a mother of child with asthma, I am calling to encourage the senator to support legislation to combat environmental injustice in our community and to clean up polluting sources near our schools. Is there a legislative assistant who covers these types of issues that I could speak with?” You can also ask to talk about topics like access to medicines, health insurance, or funding for local asthma programs.
REQUESTING A MEETING WITH LEGISLATORS
Once a virtual or in-person meeting is scheduled, be prepared, on time, and concise. Review communication tips on page 42 prior to a meeting and be prepared with any additional background “leave-behind” materials, such as a copy of the Asthma Capitals report. It is also important to follow up with a thank you note or email after the meeting.
United States Senate Washington, DC 20510
asthmacapitals.com Asthma and Allergy
Foundation of America 41 2022
Conversation Senator (Last Name)
United States Senator United States Representative
The Honorable (Full Name)
©2022
ADDRESSING LEGISLATORS
Dear “Mr./Ms./Mrs.” or “Representative” (Last Name)
Conversation Senator (Last Name)
The Honorable (Full Name) (Name of State Legislature Upper (AddressChamber)of State Legislature)
United States House of Washington,RepresentativesDC 20515
Dear “Mr./Ms./Mrs.” or “Representative” or “Assemblyman, “Delegate”Assemblymember”Assemblywoman,or(LastName)
The Honorable (Full Name) (Name of State Legislature Lower (AddressChamber)of State Legislature)
When addressing legislators in writing or in conversation, refer to the chart below:
State Representative
State Senator
Formal Address
“Mr./Ms./Mrs.” “Representative”or or “Assemblyman, “Delegate”Assemblymember”Assemblywoman,or(LastName)
Salutation Dear Senator (Last Name)
Salutation Dear Senator (Last Name)
“Congressman, Congresswoman” or “Representative” (Last Name)
The Honorable (Full Name)
Note: The names of upper and lower chambers of state legislatures vary by state. You can find information on your state legislatures by clicking on your state at congress.gov/state-legislature-websites
Formal Address
TIPS FOR COMMUNICATING WITH LEGISLATORS AND THEIR STAFF
8. Follow Up
• Personal stories are extremely powerful and are often remembered.
4. Increase Number of Communications
• Legislators are more likely to focus on issues pertaining to their district and constituents.
• Keep a record of your communications to maintain dialogues and foster relationships.
• Let your legislator know that you live in their district and identify yourself as a constituent.
6. Keep Materials Brief, Straightforward, and Simple
2. Share Personal Stories
• Advocates should craft key messages and consider asking friends and family to help in contacting legislators on important issues.
• Stay informed on where legislators stand on issues and actions they have taken.
• Keep stories very brief (under two minutes) and tied to legislation and policy issues.
• When sharing printed materials with a legislator, try to keep it to a one-page, bulleted fact sheet that reinforces the key points on the issue.
1. Remember that Legislators and Their Staff are Human Beings
• Be specific on the action you want taken, such as support for a bill or policy.
• The frequency legislators hear about an issue plays a role in whether they favor a cause.
10. Take Notes
©2022 Asthma
• In advocacy, respectful relationships build the foundation for change.
3. Identify Yourself as a Constituent
5. Repeat Your Main Points
9. Share Media Coverage
asthmacapitals.com and Allergy
• Thank legislators when they support the issue or take a public stance on it.
• If a media story covers an issue you have previously raised with the legislator, share a copy of the article and remind them about the previous communication on the topic.
Foundation of America 42 2022
Legislators serve many constituents and address a wide range of policy issues. Here are some important points to keep in mind when communicating with legislators.
• Lengthy materials are often not read.
• Conversations should not be argumentative or confrontational.
7. Clearly Communicate What You are Asking for
• The more communications a legislator receives about an issue the more likely they will act.
Sincerely, [your name] [your home address, optional]
SAMPLE LETTER TO YOUR STATE OR LOCAL LEGISLATOR
Dear [Legislator Title and Name]:
Every year, AAFA releases its Asthma Capitals™ Report (www.asthmacapitals.com) which ranks the largest 100 U.S. metropolitan cities by how challenging they are to live in with asthma. This year, [your city name] ranked as the [your city’s ranking] most challenging city to live with asthma in the continental United States. This ranking is based on asthma prevalence, asthmarelated emergency department visits, and asthma-related deaths. The report also examines risk factors that can influence asthma outcomes: poverty, lack of health insurance, air pollution, poor indoor air quality, pollen, medicine use, smoking, and access to asthma specialists.
of America 43 2022
[Date]
To address the complex social and structural determinants of health that impact asthma outcomes, AAFA’s Asthma Disparities in America Report suggests 19 policy solutions that I ask you to consider. These policy strategies aim to improve access to affordable, quality health care; promote economic stability; ensure safe learning environments for children; and address environmental harms that impact people with asthma.
©2022
On behalf of the Asthma and Allergy Foundation of America (AAFA) and as your constituent, I am writing to encourage you to champion legislation to improve health outcomes for people with asthma in [your state name]
asthmacapitals.com Asthma and Allergy Foundation
Approximately 25 million Americans have asthma and it is the leading chronic disease in children. Asthma causes your airways to become inflamed, making it hard to breathe. There is no cure for asthma. Over 4,100 people die each year from asthma—that’s about 11 people a day. These are preventable deaths.
Thank you for prioritizing the health of your constituents and I look forward to seeing improvements in asthma care and outcomes in our community.
Additionally, the burden of asthma falls disproportionately on the Black, Hispanic, Indigenous populations in the United States. These groups have disproportionately high rates of poor asthma outcomes, including hospitalizations and deaths. In fact, as documented in AAFA’s 2020 Asthma Disparities in America Report (www.aafa.org/asthmadisparities), Black Americans are three times more likely to die from asthma than white Americans and five times more likely to be treated in an emergency room. Black women also have the highest death rates from asthma versus any other group.
©2022
and ranking is reported by the Asthma and Allergy Foundation of America (AAFA). The ranking is based on analysis of data from the 100 most-populated Metropolitan Statistical Areas (MSAs) in the contiguous 48 states as determined by most recent U.S. Census Bureau population estimates (2019). The three (3) individual factors analyzed for the 2022 rankings are: estimated asthma prevalence; crude death rate from asthma; and emergency department visits due to asthma For prevalence and emergency department factors, AAFA used data from the most recently available 12-month period. For mortality, AAFA used data from the most recent five-year period. Weights are applied to each factor and factors are not weighted equally. Total scores are calculated as a composite of all three factors, and cities are ranked from highest total score (city rank #1) to lowest total score (city rank #100).
• Public Smoking Laws – Number of “100% smoke-free” public smoking bans (e.g., bars, restaurants, workplaces, etc.) as of July 1, 2022. Data were obtained from the American Nonsmokers Rights Foundation.
• Poverty Rate – Estimated population living in poverty. Data were obtained from the United States Census Bureau Small Area Income and Poverty Estimates (2020).
For each MSA, AAFA obtained the total number of emergency department visits where an asthma ICD 10 code was included as a diagnosis. Data were obtained from the Komodo Health Prism Health Care Database for the most recent calendar year (2021). In 2022, AAFA updated data collection procedures to more accurately capture emergency department visit estimates. The updated data source may impact cities’ rankings in comparison with previous years.
• Medicine Use – Number of long-term controller and quick-relief medication prescriptions per patient prevalence. Data were obtained from the Komodo Health Prism Health Care Database for the most recent calendar year (2021). In 2022, AAFA updated data collection procedures to more accurately capture medication use estimates. The updated data source may impact cities’ rankings in comparison with previous years.
CRUDE DEATH RATE FROM ASTHMA
RISK FACTORS
ESTIMATED ASTHMA PREVALENCE
asthmacapitals.com Asthma and Allergy Foundation
TheMethodology2022AsthmaCapitals™research
• Annual Pollen Score – A comprehensive index of the population at risk of being affected by airborne allergenic pollen, derived from actual pollen counts, allergy prevalence for each pollen type, and related factors (by Designated Market Area). Data were obtained from the IQVIA Allergy Activity Notification (AAN) Program Database for the most recent spring and fall allergy seasons (2021).
of America 44 2022
For each city, AAFA obtained the estimated asthma prevalence for the respective county. Prevalence data were obtained from the Komodo Health Prism Health Care Database for the most recent calendar year (2021). In 2022, AAFA updated data collection procedures to more accurately capture prevalence estimates. The updated data source may impact cities’ rankings in comparison with previous years.
For each city, AAFA obtained the estimated asthma-related crude death rate per 100,000 people for the respective county. Data were obtained from the Centers for Disease Control and Prevention WONDER Online Database; death rates from the most recent 5-year period (2016-2020) were analyzed.
Data on the following asthma-related risk factors were obtained and analyzed; however, these data did NOT factor into the scores or rankings. Data are from the most recently available calendar year.
EMERGENCY DEPARTMENT VISITS DUE TO ASTHMA
• Annual Air Quality – Pollution levels and number of unhealthy outdoor ozone days, scored on a scale of A (best) to F (worst). Data were obtained from the American Lung Association 2022 State of the Air Report, which analyzed air quality monitoring data from 2018, 2019, and 2020.
• Uninsured Rate – Estimated population without health insurance. Data were obtained from the United States Census Bureau Small Area Health Insurance Estimates (2020).
Find an allergist or immunologist: allergist.aaaai.org/find
Follow the EPA’s air quality reports: airnow.gov
Get general information on allergies: aafa.org/allergies
Download an Asthma Action Plan: aafa.org/asthmaactionplan
Learn how to improve your indoor air quality: aafa.org/iaq

Learn how to manage pollen allergies: aafa.org/pollen
National Asthma and Allergy Awareness Month: aafa.org/awarenessmonth
Join AAFA’s patient support community for emotional support and asthma education: aafa.org/join
Find school resources for managing your child’s asthma: aafa.org/school
For help to quit or reduce smoking: cdc.gov/tobacco/quit_smokingsmokefree.gov
AAFA’s COVID Resource Center: aafa.org/covid-19
Find products to help you create a healthier home through our asthma & allergy friendly® Certification Program: aafa.org/certified
asthmacapitals.com
©2022 Asthma and Allergy Foundation of America 45 2022
GetResourcesgeneralinformation on asthma: aafa.org/asthma
AAFA’s Allergy Capitals™ Report: allergycapitals.com
American Lung Association’s State of the Air Report: stateoftheair.org
Follow our blog for news on asthma and allergies: aafa.org/blog
AAFA’s Asthma Disparities Report: aafa.org/asthmadisparities
Continuing Education for Health Care Professionals: aafa.org/ameo
Follow daily local pollen counts: pollen.aaaai.org