Hawkes Bay OneRoof Property Report - 5th December 2022

Page 1

SUMMER UMMER LOVING LOVING Whatgoesup …Housingmarket’sbiggestwinnersandlosersof2022 Monday, December5,2022 PROPE RTY REPORT HowKiwis wentallinon beach real estate 1744,London.1976,NewYork. 2012,Hawke’sBay. Celebrating adecadeinHawke’sBay and alegacydating back 278 years.
Eachoffice isindependently ownedandoperated.SHBLimited(licensedundertheREAA 2008)MREINZ. team effort IT’SA SOLD 20 ENFIELDROAD, HOSPITALHILL SOLD 238WHIRINAKI ROAD,ESKDALE SOLD 47 WAIMAKARIRIDRIVE SOLD 14 BAYVIEWROAD, BLUFFHILL SOLD 3/81WELLESLEYROAD, NAPIER SOUTH SOLD 22GOULTER STREET,CLIVE SOLD 10 MCVAYSTREET,NAPIER SOUTH SOLD 14 HEYNESPLACE,CLIVE SOLD 2COBDEN ROAD,BLUFFHILL KikiAbel+64 27 8719111 | kiki.abel@nzsir.com Nick Fryer+6421 477604 | nick.fryer@nzsir.com
ateameffort to bring your home to themarket.Withthe assistanceofmyenergeticand
team, Nick Fryer
Associateand Katherine Robinson
Personal Assistant,weensureevery
of themarketingand sales
2 OneRoof.co.nz
Itis
proficient
,Sales
,
aspect
process is seamless. Contactus todaytodiscusshow our teamapproachwill resultinan outstanding salesresult foryouand yourhome.
Notavailableeverywhere.Oneligiblebroadbandplans. Compatiblesoftware/device required.Spark andpartnertermsapply.Visitwww.spark.co.nz/myspark/myinternet/movehousetolearnmore. Sparkcanhelpsetup yourbroadband. OneRoof.co.nz 3
ALTO GET HER BET TE R bayleyshawkesbay.co.nz EASTERN REALTY LTD, BAYLEYS, LICENSED UNDER THE REAACT 2008 OF BAYLEYS AUCTION CAMPAIGNS SOLD IN 2021/22* 89% d *Based on BayleysNational Auction statistics for the period over the financial year 2021/22. 4 OneRoof.co.nz

Welcometo ourtimelycelebrationof aNew Zealandrealestateicon:the summerbach. It’ssafetosaythatmostKiwis dreamof owning aholidayhomebythebeach.Andour research intothe stateofthebachmarketpost-Covidshowsjust howmanyKiwis realisedthatdream.Therewas asurge insecond-homepurchasesin coastallocationsaround NewZealandin2020and2021, as buyers respondedto borderclosuresand record-lowinterestrates.

It’sclear fromtheprices beingpaidthatsomelocations aremorepopularthanothersandthattheluxuryendof thebachmarkethasdoneextremelywell.Forthose in the market, we’vealsoproduced ahelpfulguidetobuyinga holiday home.

Our finalPropertyReportof2022also contains ourendof-year reviewofthehousingmarket. We’veidentifiedthe winnersandlosersinwhathasbeen aturbulent12 months in realestate andgiven ourpredictionsfor2023.

AlsoinsidearethelatestsuburbvaluesforallofNew Zealand,providedbyourdatapartner,Valocity,and insightsandcommentaryfromindependenteconomist TonyAlexander,propertycommentatorAshleyChurch and mortgagebrokerRupertGough.

Keepintheknow!

Whenitcomestowritingarticlesaboutthe housingmarketanditsvarioussubcomponentsthereisatypeofsongbook fromwhichweeconomistssing.Whenan economyisjustcomingoutofadownturnwetalkabout theadvantagesforabuyerofcompliantvendors,low fixedinterestrates,bankswantingtogrowtheirbooks afteraweakperiod,probablysomeeasinginReserveBank mortgagerestrictions,andextrademandfromotherslikely tosooncomealong.

Whentheeconomyis chuggingalongstronglywe notethat demandishighandcapitalgains seemtobe easily occurring,plentyofpeoplehavejobs,butclouds aregathering.We’ll warnabouteventuallyrising inflation,risinginterestrates,thecheappriceshaving beenandgone,andtheneedforgreaterthoughttobe giventopotentialincomelossifandwhentheeconomy turns down.

risetooffsetthe higher costoflivingmeansinterest inpurchasing aholiday homeis likelyto stay strong throughtheperiodofeconomicchallengein2023.

Butthereisasecondnon-traditionalfactortotakeinto account.Thepandemichas made people reassesstheir lifestyles,theirlifegoals. Manyofusseetheopportunity tospend alotmoretimein aholidayhomethan previouslyenvisionedbecauseofthegreaterscopefor workingfromhome.

Infact,theoldequations of length of timetodrivetoa weekendhomeona Fridaynightthenbackon aSunday nightgetradically alteredwhenyoucan makethetrip atyourleisure on aWednesdayor Thursday andcome back maybeon aMonday –thoughstillwiththeusual limitationsforhouseholdswithchildrenatschool.

Therehasbeen astructural shiftupwardinthe feasibilityof owningandgettinggooduseoutofa holiday homefortensofthousandsofpeople.

We canaddina thirdfactor.Thepopulationis aging, andthepandemichas seenmanyolderpeoplesellup outofthe maincitiestoshifttothe regions. Thishas already producedunusualupwardpressureonnotjust regionalhousepricesingeneralbutprices forholiday homes. Becausesomeofthisbuyingwas ashifting forwardin timeofpurchasesthiscouldmean abit less thanexpectedBabyBoomer demandforholidayhomes inthenext coupleof years.

Thenwhentheeconomyisturningdown(now)wetalk abouttheuncertaintiesastowheninterestratestopout andatwhatlevels,howfarhousepricesmightfall(pure guessworkexperiencetellsus),whenlendingcontrols mightease,andtryourbesttogiveananswerwhen peopleaskwhenthemarketwillstartrisingagain.

Thetrouble withsuchanapproachthistimearoundis that oureconomy is experiencingsomeuniqueaspects neverseenbeforeduring adownturn andthatmakes forecastingextremelyfraught.Thebigdifferenceisthe labourmarket.The unemploymentratehas satat3.3% all year,businessesarehighlypessimisticyetplan hiring many more people,andthefeelingofjobsecuritywhich peoplehaveisunusuallystrong.

Thisisimportantintermsofsupportingthehousing market overalleven aspricespullbackfromtheabsurd levelsof2022.Itis alsoimportantin termsofsupporting the holiday homesmarket. Were theunemployment raterising firmlyas we haveseeninthepastwhen interestratesjumpupand sentimentis verynegative thentherewouldbefalling demandforholiday homes. Manypeople wouldbelookingto sellin factto freeup cashforeithertheir businessesortosupporttheirhome mortgageincase of redundancy.

Thistimearound thestrongexpectationpeople haveofkeepingtheirjob andsecuring adecentwage

Butoffsettingthisfactoristheextentofthewealthgain onassetsexperiencedbymanypeopleoverthepastfew years.Theunexpectedhikeinwealthfromhigherpricesfor sharesandpropertyisencouragingmanypeopletomake purchasestheymightotherwisenothaveconsideredwise.

Formanythishasmeantpurchasingaspaorengaging inhomerenovations.Butforothersithasmeantpaying alotlessattentiontothecostsofowningaholiday homethanwouldnormallybethecase.Peoplemaystill runthespreadsheetofmaintenancecosts,travelcosts, bankinterestsacrificedetc.Butwhensetagainstthe unexpectedwealthsurgeofrecentyears,especiallyfor peopleinthetraditionalholidayhomebuyingagegroup, thecostsgetdiscountedfairlyquickly.

Orinsimplerterms,insteadofcomparingholiday home running costswithexpectedincomepeople comparethemwith accrued wealthandthecoststhan paleintoinsignificance.

Thereare otherfactorstoconsidersuchas rising interestrates, recentlyslowpopulationgrowth,getting insuranceon properties near waterinfutureyears,and aprofitabilitycrunch formany smalltomedium-sized business ownersdue torisingcosts.Butallup,themild natureofthe slowing inNZgrowthexpected next year, thefirmlabour market, thewealthgains,working from home,andanagingpopulation, allsuggestacontinuing stronglevelofunderlyingsupportfortheholidayhomes marketin thecoming fewyears.

•TonyAlexanderisanindependenteconomics commentator.

NUMBER 1NAPIER AGENT EASTERNREALTY LTD 2020/2022 M +642102220387 E caroline.meo@bayleys.co.nz MARKET WATCH
Whythe holidayhomemarket is unlikely toloseitsshine Thereisastronglevelofunderlyingsupportforbachpurchases inthecomingfewyears,writes TONYALEXANDER “THEUNEXPECTEDHIKEIN WEALTHFROMHIGHERPRICES FORSHARESANDPROPERTYIS ENCOURAGINGMANYPEOPLE TO MAKEPURCHASESTHEY MIGHT OTHERWISENOTHAVE CONSIDEREDWISE.” From theeditor 6 Coverstory:Homefortheholidays 15 TheOneRoofguidetobuyingabach 17 TheYearinReview 22 NineraterisesthatturnedNZonitshead 23 Whatbuyersandsellers canexpectin2023 25 RupertGough:Moneymatters 26 Housingmarket’sbiggest winnersandlosers 28 OneRoof-ValocityHouseValueIndex 38 AshleyChurch: We’llsoonbe complainingaboutrisingpricesagain Inside Design Beth Walsh │ Cover Derek WattsandBeth Walsh │ Artwork Derek Watts,GuyBodyandPaulSlater │Subeditor Akanisi Taumoepeau Photos FionaGoodall, TedBaghurst,Peter Meecham,GettyImages OneRoof.co.nz 5

HOMEFORTHE

COASTALCOMMUNITIES upanddownthe countryarechangingshapewithCovid speeding uppeople’sdecisionstoeithermovetothebeachor buyaholidayhometoescapeto.

Thevirushasledtoshiftingpatternsof residency withagents reportinginsteadofthetraditionalheading offtothebachfromtownonaFridaynightthere’sagrowing trendofpeopleoptingtoliveatthebachandcommutetotheoffice.

AnalysisofNewZealand’sbachmarketbyOneRoofanditsdatapartner Valocityfoundanexplosioninsecondhomepurchasesincoastallocations inthemonthsafterthefirstCovidlockdown,withmorethan6000snapped upbyKiwiseagertobeclosetothebeachandthewater.

Theboominsales camehandinhandwith aboominbeachtown propertyvalues,withhouseprices in someofthemorepopularlocations risingbymorethan$500,000post-Covid.

James Wilson,headofvaluationsat Valocity,saysthedataandanalysis showsjusthowhotmanyofNZ’scoastalmarketswereaftertheinitial Covidlockdown.

“Manyhomeownerswereabletoutiliseequityfromtheirmainhometo leveragethepurchaseofasecondhome/holidayhome.Alowinterestrate environmentalsohelpedfueldemand,”hesays.

Wilsonadds:“The‘seachange’wasnotjust aKiwithing;this phenomenonwasalsoobservedinternationallyasthedesireto liveand

workfromcoastallocationsgrew,supportedbyincreasingworkfrom homeflexibilityofferedbymanyemployers.

“Interestingly,whilstsalesactivityhasslowedsignificantlyinmany coastallocations,wearenotseeingsignsofsignificantdownward pressureon valuelevels,headwindsare notyetstrongenoughtopush themdown.

“Anecdotally,weare hearingofincreasedinterestlevelsduringearly spring,andwewillbewatchingcloselytoseewhetherthisinterest correlatestostrongervaluelevelsaswemovetowardssummermonths.”

LOCKDOWN EFFECT

Aconsequencehasbeenstandardsliftedinwhatwereoncepurely

Otherbigbuyersofholidayhomeshavebeenolderpeoplewho hatedbeinglockeddownawayfromtheirfamiliessomuchtheysold upandbought aplaceatthebeachwithineasy reachofchildrenand grandchildren.

Even grandparentslivinginidyllicholidayspotsliketheBayof

fterthearrivalofCovidand closureofinternationalborders, Kiwisheadedtothebeachand wenton aproperty-buyingspree. CATHERINEMASTERS
stateofNew Zealand’sbachmarket
A
examinesthe
COVERSTORY | SUMMERESCAPE
AgentsspokentobyOneRoof repeatedlytalkedofpeopletakingstockof theirlivesoverthelastcoupleofyearsandtakingadvantageofthenew workfrom homefreedoms,settingup anofficeat the bach.
holidayhomes –olderstyleKiwianabachesmadeofpatched-together corrugatedironpaintedbrightcoloursarehardto
findthesedays.
RTHE

HOLIDAYS

Islandshavemovedtocoastallocationsfurthersouthtobenearfamily, determinednotto repeattheisolationtheyfeltduringlockdowns.

Agentsalso reportthebigdemandtheyhaveseenoverthelast fewyearsatsomeholidayspotshasmeantbuyingatthebeachisnot necessarily acheaper optionanymore.

Justtobuy abasictwoorthree-bedroomholidayhomebackfrom thebeachhashitthe$1m-plusmarkinplaceslikeCooksBeachonthe CoromandelPeninsulaandthatwon’thaveseaviews.Beachfrontthere, asinmanycoastallocations,isnowinstantlyinthemillions.

Formostpeople,beingabletodrivetotheirholidayhomewithina coupleofhoursisstillabigmust.ForCantabriansthatmightbeAkaroa; forAucklandersit’straditionallybeentheCoromandelPeninsulaor northofthecitytoplaceslikeOmahaand Mangawhai.

WithOmahabecomingthedomainoftheuber-wealthy(beachfront therecancost$7m-plus),Aucklandershavepushedfurthernorthto Mangawhaiwhichinturnhasmorphedfrompurely aholidayspottoa bustlingtownwithsubdivisionsandemployment.

Aresulthasbeenpeoplesearchingfurtherupthecoastinlocations like WaipuandRuakakainBreamBay –andRuakakaisbooming,says JoanneDews,ofBreamBayRealty.

ShethinkstheoncesleepybeachcommunityisprobablythefastestgrowingcoastallocationnorthofAuckland.“Peoplehavebeenbuying upbachesleft,rightandcentre. We havewaitinglistsforpeoplethatare

lookingfortherightpropertyforthem.” Thesettlement,whichboastsboth asurfbeachandaninnerharbour beach,isabout130kmnorthofAucklandand30kmsouthofWhangarei. LONG WAITINGLIST DewsonsayswhileAucklandersarethe biggestbuyers,she’salsoseen peoplecomingdownfromtheBayofIslandsandupandacrossfrom WaihekeIsland. PeoplefromfurthernorthliketobeclosertoAucklandandits amenities,andpeoplefrom Waihekelikethenostalgicvibe. “Theyfeel Waiheke’soutgrownthem.It’sgotsoverybusyand (Ruakaka) remindsthemof Waihekefunnilyenough.” “PEOPLEHAVEBEENBUYINGUPBACHES LEFT,RIGHTANDCENTRE.WEHAVE WAITING LISTS FORPEOPLETHATARELOOKINGFOR THERIGHTPROPERTYFORTHEM.” JOANNEDEWS,BREAM BAYREALTY
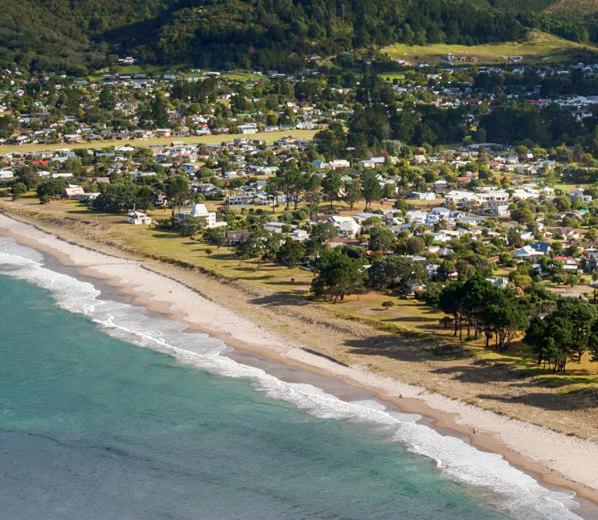
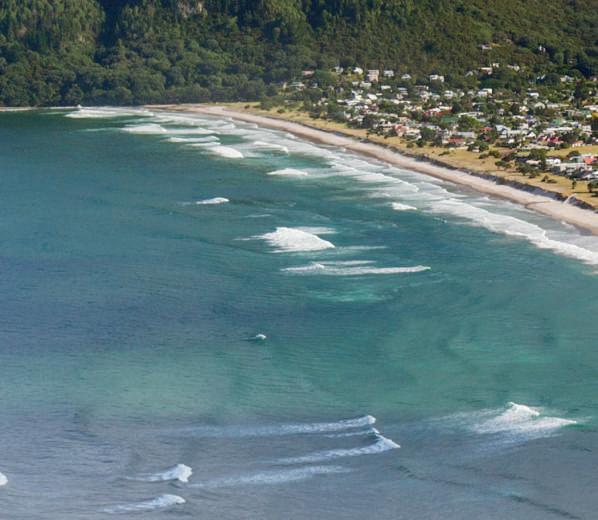
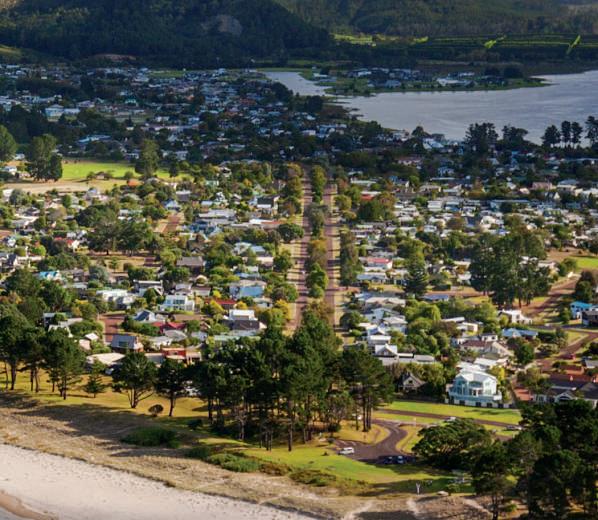
POPULAR WITHHOLIDAY HOMEBUYERS: PAUANUI,INTHE COROMANDEL. PHOTO /GETTY IMAGES
Not available everywhere. Modem Shippingfees apply.T&Cs apply Getinternetting hard outwith Skinny Broadband skinny.co.nz/broadband Forlow cost broadband visit 8 OneRoof.co.nz

Dewson has also seen an increase in older people who weren’t able to go on cruises or travel overseas putting their money into beach properties so the whole family can come together.“They arethinking about not much point in having the money in the bank because it’s not earning any interest.”

She thinks Ruakaka has overtaken the Coromandel in popularity for Aucklanders, saying traffic-wise it’s easier to get to, and she says people who can no longer affordtobuy in Mangawhai can probably affordRuakaka.

Mangawhai is an example of aholiday destination which has turned into alifestyle destination, says Stephen Owles, from Bayleys Mangawhai. “We’ve learned alot over the last two years of how to work remotely so our influx of population and the way the region is developing is going to continuefor the next two to fiveyears at least.”

Mangawhaihasbecomepricey,though.A400-500sqmsectionwithout views is around half amillion dollars. The price doubles for aview and to buy right on the water,orone back from the beach, now costs $2m to $3.5m, alot of money for aholiday home.

OverthehillfromMangawhaiiscovetedLangsBeach,whichhasfew facilities but big, quality multi-million dollar homes. Owles says there’s along waiting list to get into Langs Beach so while few properties come to market when they do they sell quickly

Aucklanders after aholiday home also headed to the Coromandel in droves after Covid arrived. Chris Speedy,ofWhangamata Real Estate, says the market in the surf town was hectic after Covid arrived.

“Wefound alot of people, Aucklanders especially,weresick of the lockdown and wanted to get outofthere.”

The general consensus was if people had to be locked up they would ratherbelockedupattheseaside:“Thatwasamotivatorforsometoget aholiday home.”

LOCKDOWN EFFECT

Speedy has noticed new trends, saying people arestill transitioning out of thecities. Some arebuyingholiday homesaspermanenthomes by perhapsdownsizing or sellinguptheir Auckland property.“They got a practicestart at working remotelyoverCovid,” he says.

“There’s quite alot of people that will shoot up (toAuckland) for two days aweek or just shoot up for ameeting and if you time your run you’reonly acouple of hours away.”

Other people have aplan, Speedy says: “They arestarting the move now and buying something they can go ‘right, we can either do this up or they’ve got a2,3,4,5-year plan to transition here permanently.”

PeoplewhohavesoldupinAucklandarenotregrettingtheirdecision, either,Speedy says. “It’s moreonce they get herethey go ‘why didn’t I do it sooner?’.”

People from the Waikato and Bay of Plenty,including farmers, also like to buy in Whangamata.

FurtheruptheCoromandelPeninsula,CooksBeachhasalsoseen an increase in permanent residents who work remotely.“There’s definitely been amindshift Ithink, or areset,” says Merv Gardiner, branch manager of Richardsons Cooks Beach.

“We’ve definitely got morepeople wanting to buy abeach house especially at entry level, which now in Cooks is above $1m, which used to be probably half that three years ago.

“It’snotacheaperoptionnowthanAuckland,assuch,butitseemsto be amindset option Ithink.”

Cooks Beach has limited stock, however,soagain thereis awaiting list to get in and Gardiner says that’s especially at the entry level. “Just recently we sold aplace, two-bedroom older bach. It was tidy,good sectionbutnowaterviewsoranything,sleepoutdowntheback,andthat soldfor$1.2m–youwouldn’thavedreamtofthatpriceafewyearsago.”

Alot of the holiday homes in Cooks Beach arestill empty half the year but those who do live therepermanently often rent them out in peak times wherethey might fetch $400 anight. “Friends of mine built themselves alittle sleepout down the back. Thereare only two of them and so they go downthere and rent their house out for six weeks.

“You usually have alockable cupboardintherethat you put all your personal stuff in and just lock it which tenants can’t access,” Gardiner says.

Hesayspropertytypeshavechangedovertheyearswithdemandfor rough, old Kiwi baches petering out as people these days want modern, liveable holiday homes.

“I can remember going back 30 years we’d be renting out some pretty rough looking beach houses …nobody will rent that sort of property anymoresopeople have tidied their baches up and when they rent it’s maybe not five-star but it’s alot better than it used to be.”

While most buyers arefromAuckland or Hamilton and the Waikato, somecomefrommuchfurtherafield,suchasSouthlanderswhorecently bought there: “They wanted to get away from their cold winters.”

Butmostpeoplewanttobeabletodrivetothebachcomfortably,hesays.

PERMANENT SHIFT

Furthersouth,theKapitiCoastonthe westcoastingreaterWellington is another example of aholiday spot which has become amore

COVER STORY | SUMMER ESCAPE
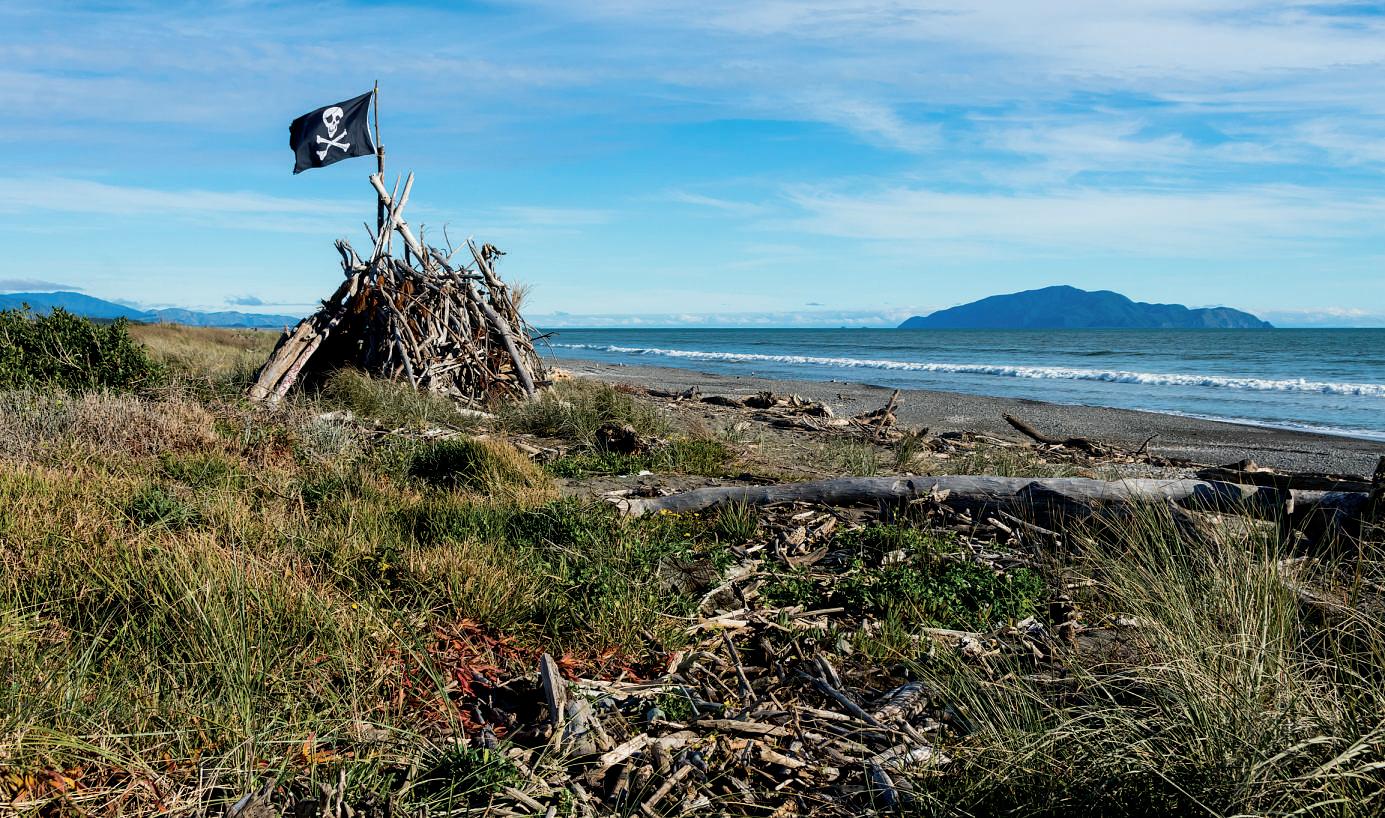
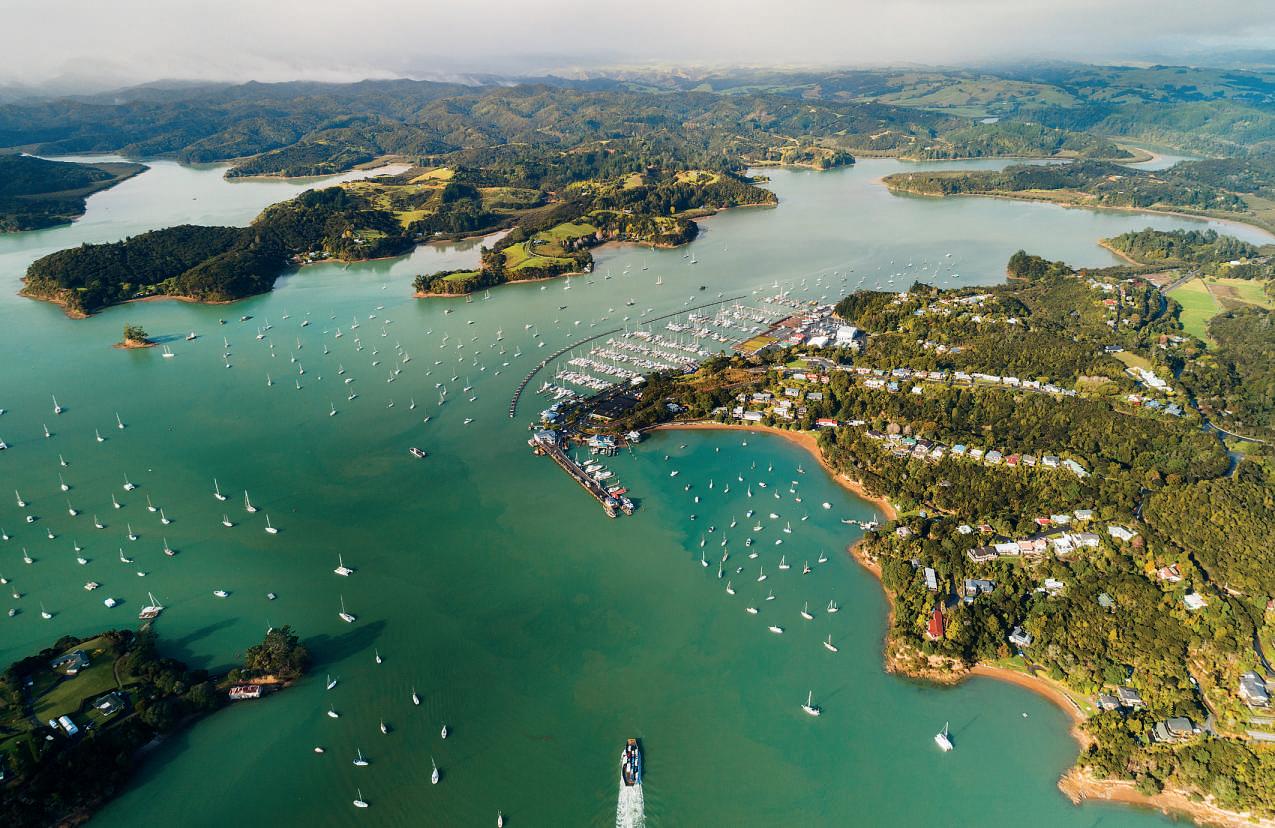
LEFT,OTAKI BEACH,ONTHE KAPITI COAST; RIGHT, BAYOF ISLANDS, IN NORTHLAND PHOTOS / GETTY IMAGES
“WE FOUND ALOT OF PEOPLE,AUCKLANDERS ESPECIALLY,WERE SICK OF THE LOCKDOWN AND WANTED TO GET OUT OF THERE.”
OneRoof.co.nz 9
CHRIS SPEEDY, WHANGAMATA REAL ESTATE

permanentsuburb.

ThatwashappeninglongbeforeCovidbutCovidledtoevenmore interestinthecommunitiesscatteredupthecoast,saysCeinwenHoward, directorofHoward&Co.

GrandparentsfromNewPlymouthorPalmerstonNorthhavebeen buyingtobenearerfamilieswholivein Wellington,andheragencyhas hadbuyersfromHavelockNorthinHawke’sBayandtheBayofIslands aswell.

“Iaskedthem,‘whyonearthareyoucomingdown?’andthesame answerfromeverysingleoneofthemwas‘ouradultkidslivein Wellingtonandwedon’teverwanttobesofarawayinlockdownagain’. It reallyaffected retiredpeople,theyfelt reallyisolated.”

Retiredpeopleonelectricbikeshavebecome acommonsightatthe beach,shesays.

Again,holidayhomesatplaceslike WaikanaeBeach,RaumatiBeach andParaparaumuBeachareboughttobelivedinpermanentlythese dayswitholderstylebachesmostlybeendemolishedtomakewayfor $2mor$3mhomes.“Orwe’vegotpeoplethathaveboughtthatwill retireorlivetherepermanentlybutnotatthemoment.”

LiketheeastcoastnorthofAuckland,buyersarespillingfurther northwithallthebeachcommunitiesgrowingaseachbecomesmore expensivetobuyin.

“Ourpricesarenottoodissimilarto WellingtonCity.You’dnormally cashupin Wellingtonandputmoneyinthebankandchangeyourcarthat’snot reallythecaseanymore.”

SOUTHISLANDBACHES

WellingtoniansoftenheadtoMarlboroughSoundstobuyholidayhomes, makingupabout20%ofthemarket,butthemainbuyersareCantabrians andotherSouthIslanders,saysGlennDickofMarlboroughBayleys.

Dicknoticed abiguptickininterestwhenCovid restrictionsstopped peopletravellingabroad,withhideawaysinplaceslikeQueenCharlotte Sound,KenepuruSoundandPelorusSoundallpopular.

He’snoticedfewerimpactsfromtheworkfromhometrendsaying bachesintheSoundsare stillpredominantlyholidayhomes,although thereare somepermanent residents,too.

Mostly,peoplearebuyingpropertiesastheyalwayshave,as aboltholetogotoatweekends,hesays.

Whilethereare stillsomeolder-styleKiwibachestobefoundthey arelessdesirable,withmosthomesnowfeaturingmono-pitched roofs, boardandbattencladdinganddouble-glazing.

Dicksaysthere’snotmucharoundforunder$500,000withthestarting pointaround$800,000or$900,000throughtothemillions –Bayleys agentssold ahomeonKenepuruRoadinBroughtonBayfor$2.255min January,andanotheratQueenCharlotteDriveinNgakutaBaysoldfor $2.295minApril.

WhilesomeCantabriansdodrivefivehourstogettoMarlborough Sounds,mostliketoonlyspendanhourorsogettingtotheirholiday home,saysJulieGraham,ofBayleysRangiora.

PlaceslikeMotunauBeach,ontheeastcoastjustoveranhourfrom Christchurch,areareaswhereboatiesgo:“Thetraveldistancefrom

Christchurchis reallyattractiveifyou’retowing aboat.”

BuyersforMotunauareusuallyfromChristchurchorthewider Hurunuidistrict,she says.

“They’llcomefromoverthehillfrommaybeCulverdenwayor somewherelikethat.Iftheyarerurally-based people butstillwanttobe bythecoastit’snotfartoputyourboatin –that’swhatitboilsdownto alotofthetime.”

AlsonearChristchurchisFrench-influencedAkaroa, atownonthe BanksPeninsulaknownforitsheritagebuildings.

Akaroaislargely aholidaydestination,saysChrisMangels,ofBayleys, butherethebachesareabitmorewell-heeledwithalotofheritagecottages andalsomodernbuildsalongstreetswithFrenchnames.

MostareownedbypeoplefromChristchurchorfrommid-Canterbury butMangelshasnoticed amarkedincreaseinAucklanderslookingto buy,somewith aviewto relocatingtherepermanently.

CovidputAkaroabackonthemap,Mangelsthinks:“Peoplewere stuckinNewZealand,weren’tthey,andtheytravelled regionallyand they realisedeverythingtheyneedisonthedoorstepanyway.”

CHANGE OF LIFESTYLE

Buyersarelookingatpermanentsolutionsforthefuture,hesays.“They maybe aholidayhomeintheshorttermbutdefinitelysomethingto spendmoretimeat,potentially retireat.Ifyoumoveto atownlike

Grab abach: SALESINNZ’SCOASTAL TOWNSAND SUBURBS

OneRoofandValocityexaminedsalesactivityandvalue movementin251beachandcostallocationsaroundNew Zealand.Theanalysiscoveredthefiveyearstotheendof June2022,andincludednonurbancentreswithmorethan 100residentialpropertieswithin800metresofthecoastline. Thetotalnumberofsettledsaleswas35,356.Ofthose,45% (15,997)were“secondhome”purchases-iepurchasesthat tooktheownerintothemulti-homeownercategory.

OverallsalesplungedatthestartoftheCovidcrisisto76but thenexplodedfollowingtheliftingofthelockdownrestrictions, withthemonthlyaverageforthesecondhalfof2020risingto justover760andtheshareofsecondhomepurchasesrising above50%.Salesdeclinedinthefirsthalfof2021astighter lendinglawsmadesecondpurchasesharderbutthetherewas abriefresurgenceinthemarkettowardstheendoftheyear. Salesvolumesnowarebelow20172019levelswithrisinginterestrates likelyakeyfactorintheoverall marketslump.

COVERSTORY | SUMMERESCAPE
2017 2018 2019 2020 2021 2022 700 600 500 400 300 200 100 0 NO.OFSALESWHEREOWNEROWNSMORE THANONEPROPERTYPURCHASE TOTALNO.OFSALESINCOASTAL TOWNSANDSUBURBS 10 OneRoof.co.nz

Bach hot spots

SALESIN NZ’S COASTAL

TOWNSANDSUBURBS

TheOneRoof-Valocityanalysislookedatthepercentageof dwellingsownedbymulti-homeownersandsinglepropertyowners in251beachandcostallocationsaroundNewZealand.Themultihomeownerfigureisanindicationofhowmanypropertiesineach locationareusedasholidayhomes.Themapshowsthe90locations wheretheshareofdwellingsownedbymulti-homeownerswasmore than50%.Thedarkertheshadingonthemaphigherthepercentage ofmulti-homeowners.

Thelocationswiththehighestshareofdwellingsownedbymultihomeownersare:TeAraroa,Gisborne(83%);Taharoa,inWaikato (82%);TokomaruBay,Gisborne(78%);OkuraBush,Auckland(74%); andTeKaha,BayofPlenty(73%).

TwelvelocationsscatteredaroundthefringesofAuckland’s urbancentreshavemorethan50%ofdwellingsownedbymultihomeowners,whichsuggestsAucklandersstillliketobewithin drivingdistanceoftheirbaches.

Theanalysisalsofound: ThemedianpurchasepriceofasecondhomeinQ1ofthisyear was$1mormorein79locations,and$2mormoreinnine.The locationswiththehighestmedianpurchasepriceinQ1were: Okura,Auckland($5,300,000);Omaha,Auckland ($4,395,000);TataBeach,Tasman($3,450,000); Sandspit,Auckland($3,388,000);andOneroa, WaihekeIsland($2,460,000).

Twentylocationshadamedianpurchase priceoflessthan$500,000forasecond homeinQ12022,withtheWestCoast accountingforthelion’sshare.The cheapest“second”purchaseswerein: Waipapakauri,Northland($130,000); Cobden,WestCoast($191,000); Patea,Taranaki($260,000); Blaketown,WestCoast ($275,000);andGladstone, WestCoast($295,000).

Theanalysisalsolooked athowmuchproperty valueshadchanged,

%OFTOTAL DWELLINGSOWNED BY MULTI HOMEOWNERS

Suburb %oftotal dwellings owned by multi-homeowners

Te Araroa Taharoa TokomaruBay OkuraBush Te Kaha WaihauBay Charleston LangsBeach Omaha OnahauBay Whangaruru Takamatua HicksBay Kaiteriteri Pauanui Wainui Whangapoua Matarangi Portage OpitoBay Whananaki Akaroa

bothindollarandpercentageterms,ineachofthe locationsinthetwoyearstotheendofSeptember togaugehowpopularanareawaswithbuyers.The timeframewaschosenbecauseitcoveredthepostCovidpropertyboomandtheclosureofinternational borders,anecdotallykeydrivingfactorsofthesecond homemarket.Ofthe251locationsanalysed,30enjoyed valuegrowthofmorethan50%inthetwo-yearperiod,and five,mostlyinfringecoastalspotsinDunedin,registered growthoflessthan20%.

In26locationstheaveragepropertyvaluejumped morethan$500,000inthetwo-yearperiodwhilein 12locationsgrowthwaslessthan$100,000.Thefive locationswiththebiggestpricejumpswere:Waiheke Island,Auckland(up$1,011,000to$3,622,000);Tawharanui Peninsula,Auckland(up$920,000to$2,659,000);Whitford, Auckland(up$893,000to$3,633,000);Omaha,Auckland (up$761,000to$2,724,000);andOneroa,WaihekeIsland (up$673,000to$2,349,000).

Overall,thosewhoboughtasecondhomeintheclosing monthsof2020gotthebestbachbargains.

TaupoBay RiversdaleBeach Hampden KaikouraFlat Haast Whiritoa Onemana Oakura Papatowai Orepuki TataBeach PatauaNorth CooksBeach Purakaunui Urenui Castlepoint KawauIsland Hahei Matapouri Maketu MoetapuBay Kawhia Te Rapaki oTeRakiwhakaputa WaikawaBeach Duvauchelle Moeraki Mataikona ManukauHeads Mahia Mokau Tangoio Port Underwood OkiwiBay ColacBay Kuaotunu West Tawharanui Peninsula Bowentown PalmBeach JacksonBay Whitford RakinoIsland Motunau Waimarama Te Mahia KaiumaBay Onetangi NgakutaBay WaihiBeach WaitarereBeach Porangahau Omapere MangawhaiHeads Waiotahe GreatBarrierIsland (Aotea) RobinsonsBay HalfmoonBay MahurangiEast WyunaBay Whangamata ParekuraBay Karikari Peninsula MahauSound Te Mata SouthBay CharterisBay Kakanui Mahurangi West Cape Palliser

83% 82% 78% 74% 73% 69% 68% 67% 66% 66% 65% 65% 65% 64% 64% 64% 63% 63% 63% 63% 62% 62% 61% 61% 61% 61% 61% 60% 60% 60% 60% 60% 59% 59% 59% 59% 59% 59% 58% 58% 58% 58% 58% 58% 58% 58% 57% 57% 57% 56% 56% 56% 56% 56% 56% 56% 56% 55% 55% 55% 55% 55% 55% 55% 55% 55% 55% 54% 54% 54% 54% 54% 54% 53% 53% 53% 53% 53% 53% 53% 52% 52% 52% 52% 52% 51% 51% 51% 51% 51%

OneRoof.co.nz 11

Akaroait’sgotfantasticinfrastructure,youcanwork fromhomeeasilyenoughandthencommuteintotowna coupleofdays aweek -it’sallverydoablenow.”

ButwhileAucklandersloveAkaroa’svibe,they haven’ttakenover,hesays.Mostlybuyersare peoplewholiveanhourand10minutes’ driveaway,includingfarmersfrom rural Canterbury. Price-wisethetransitionmightnotbesoeasy either.MangelssayspriceshadbeenflatinAkaroa sincetheGlobalFinancialCrisisbuttherewas a“pretty impressiveincrease”post-Covid.

DownDunedinway,peopleusuallyheadinlandto QueenstownLakesand Wanakatobuytheirholiday homes, saysex-AllBlackKeesMeeuws,fromBayleys.

“That’sthebigthingdifferenttothe restofthe country.Ifyou’refromOtago,Dunedin,Goreand everywherelikethat,youheadtothelakes,so you’rebuyingin Wanaka.Theyallgoskiinginthewinterandinthe summertheyareallupthereonthelakessoDunedinislike adeserted townwhenitcomesto Christmas.”

WhileDunedinfolkgoinland,inlandersgotothecoast.Rhys Vidgen,fromOneAgency,livesinKaritane, asmallsettlementonthe eastcoastabout40minutesnorthofDunedin.

PeoplefromQueenstownandWanakabuytheirsecondhomesonthe coastbecausetheywanttobeabletoseethesea–andit’swarmer,hesays. ButevenallthewaydownontheeastcoastoftheSouthIsland,Covid

hashadanimpact. Vidgensaystherehasbeen a“reasonablespike”of outoftownerslookingdowncountry.“Wehadalotofpeoplethatcame downfromtheNorthIsland,fromallover,notnecessarilyfromplaces likeAucklandbutfromplaceslikeWhanganuiand Tauranga.”

TheAucklandersespeciallyhad“Covidburnout”,hesays.“Theyjust went‘Idon’twanttolivelikethisanymore’;soalotofpeopledidgofor changeoflifestyles.”

ThecoastmaybealongwayforanAucklandertorelocatebutVidgen saysiftheysellup“theygetto stick$500,000intheirbackpockets”.

PricesalongthecoastandtheOtagoPeninsuladependonthelocation andthe(sometimesminimal)servicesbutthere’snotmuchunder $300,000anymore,andthereare alsohousesonthebeachthatmight fetch$1.7matKaritane.

ButCovidalsobroughtout alotofnostalgiaforwhat Vidgencalls “oldZealand”withcribs(whatSouthIslanderscallbaches)inplaces likePurakanuiandLongBeachpopulardespitelimitedservices.

“Thereare alotofpropertiesandcommunitiesonthepeninsulalike that.Peoplecollecttheir waterfromthe roof,theyhave abigtank.”

Karitaneitself,anoldfishingvillage,ismoredevelopedwithmains waterandsewerage,plusthere’s ashopand anicecafé.

Dunedinbuyerslikethesettlementbecauseit’sonlyhalfanhour away,whichisfarenoughtofeelliketheyareoutoftownbutclose enoughtodashbackhomeiftheyneedto.

Thecoastlineisdottedwithlittletownshipsand Vidgensays newcomersarewelcomedwithopenarms,evenAucklanders.“They hireoldguystomowtheirlawnsandthingslikethat.Theybring revenueintotheselittletownsandtheshopsloveit.”

With 120 yearsofexperience,backthebrand thatbacksthe valueofyourhome. Get in touchwithyourlocal RayWhiteoffice today!

WHY WA IT? Ra yW hit eR eal Es tate Li mite dL ic ense d( RE AA2008)
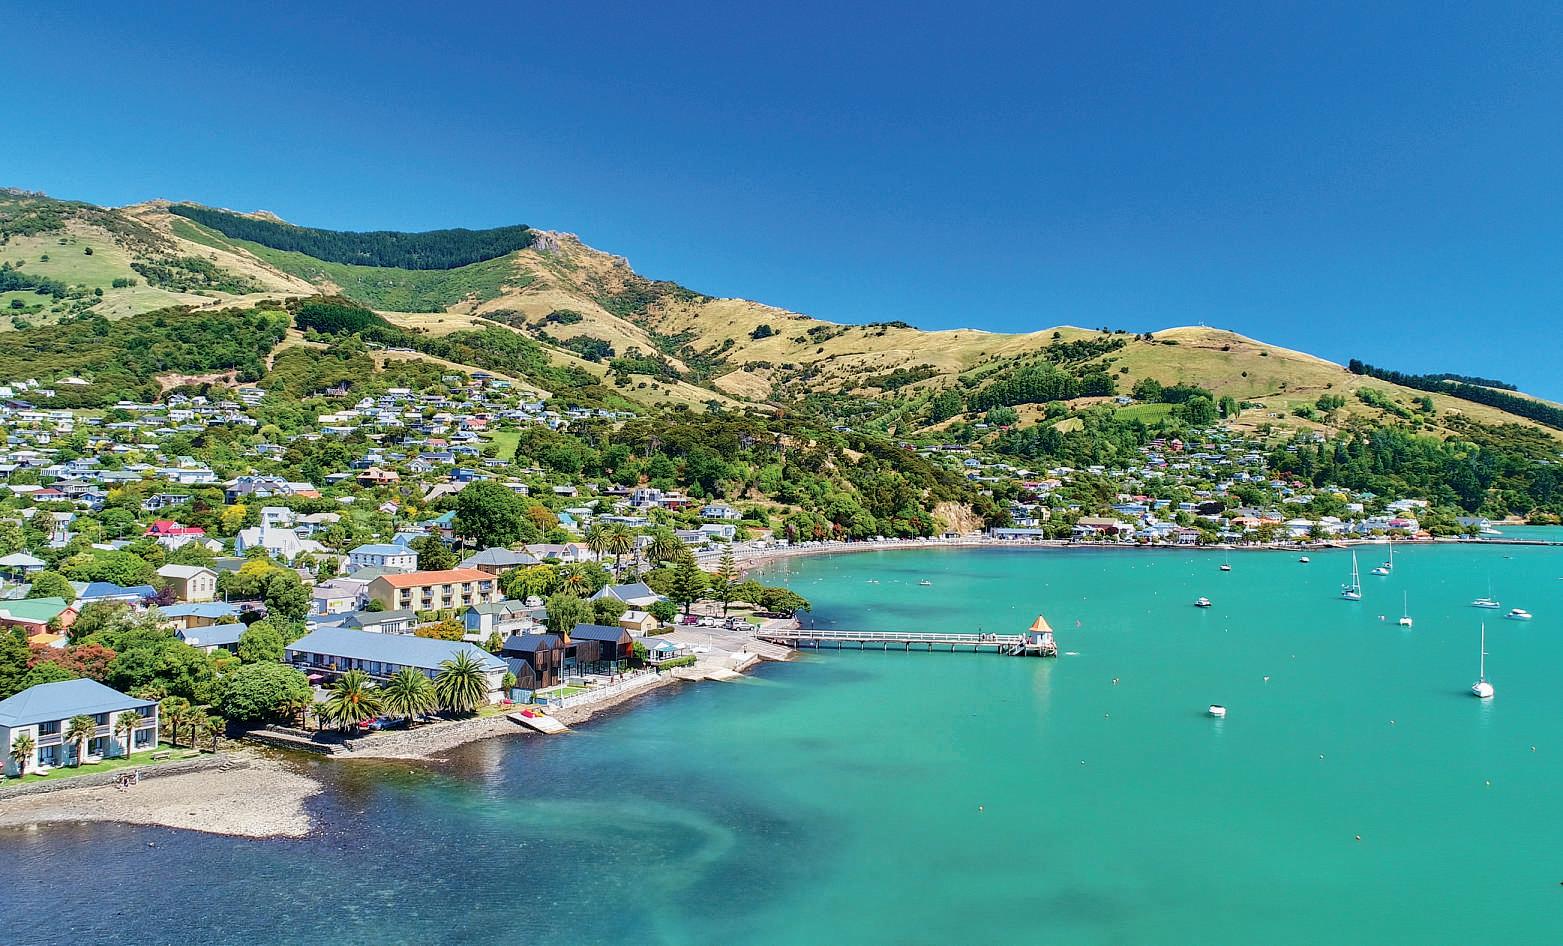
AKAROA HARBOUR,IN CANTERBURY. PHOTO /GETTY IMAGES

YOUR HOME OUR SERVICE

At Harcourts, youcanbeassured of getting the goldstandardinSERVICE.

Service matters,especially whenit comes to selling yourhome! Our reputation forproviding exceptional serviceyearafteryearis whyHarcourts hasbeen awarded Gold forQualityServiceforthefifthyearin arow.Whenit’s time to sellyourproperty,lookto Harcourtsforprofessional,personalisedserviceand thepeaceofmindthat comes withknowingyou’ll get thebest result.

Findwhere youbelong. harcourts.co.nz/sellwithus

HarcourtsGroup LtdLicensedREAA2008 OneRoof.co.nz 13

Howthe superrich live on fantasyisland

Thereare baches that ordinary Kiwisaspire to and then thereare the baches that only a Lottowinwouldsecure.

Waiheke Island has someofthe most luxurious, although not everyone gets acoveted sea vieweveniftheydopartwithseveralmilliondollars

Andanyway,that panoramic view is not always as important as being close to aboat ramp for easy access for the Sealegs, an amphibious boat, says MatthewSmith,ownerofWaihekeRealEstate.

At the time of interview,Smith had just listed a high-endproperty on Kennedy Point Road.The vendors had just completeda two-year $3 million renovation of thehome, which sits on a3700sqm estate,ashortwalkfromthenewcarferry

“Hardly everdoesanything like this cometothe marketonWaiheke,”Smithsays

“We’renot saying aprice, but smart people can dothemath,”Smithsays,addingthattheproperty’s $7.6m CV doesn’t even get closetothe likely price buyerswillpay(thevendorsthemselvespaidnearly $4mfortheun-renovatedproperty14yearsago).

Smith says thatthe four-bedroom house, designed by notedarchitect Simon Carnachan, has aspectacular 300-degree ocean view almost to the Coromandel and includes aluxurious new kitchen andbathrooms, Europeanoakflooring,new double glazing, and gib boardthroughout and, on the outside, new cedar siding reclad with acavity systemandnewroofing.

Earlier this year,Smith’s agency solda section for $3.1m.Thenewownersplantobuildabachrightby the boat ramp.Another buyer went on to pay$3.2m for an old housethat sits behinditeven though the view will now be blocked out.“Thebuyer is going to bowlthe old housethat’s on thereand build a new house that will have no view of thewater and obviouslybythetimehebuildsahousehe’sgoingto beover$5m.”

What’s importanttothese buyers is the location, Smith says, becausethey canput the Sealegs in the water nearly straight across the road.Not only that, thebuyersoftheoldhouseliveinthecityandwillbe able to motor across and drive straight to their bach intheirboat.

On Palm Beach, Wall Real Estatehas justlisted a five-bedroomhome on amassive1700sqmdouble sectiononthe beachfront at 43 Palm Road. It has a CVof$9.3m,butisexpectedtofetchmorethan$10m

The 17-year-old architect-designed house also featuresone of the vintage train carriages rescued from Parnell’sWhiteHeron hotel beforeitwas torn down,nowrepurposedasasleepout.

“Weexpect it to sell for over $10m. In 2018 the neighbouring property sold for $7.5m, and that has less than half the land size,” says Ollie Wall, who is marketingthepropertywithGrahamWall.

“Palm Beach is one of the only places on Waiheke whereyoucanhaveatrulybeachfronthomewithout aroad between you and the beautiful white sand.” Headdsthatthecompanyissettingupabaseonthe islandastheyexpecttodomuchmorebusinessthere inthecomingyears.

And on one of Waiheke’s highest points, Omiha, Bayleys agent Mana Tahapehi is marketing afivebedroomestateon3.9haat1O’BrienRoad.Tahapehi, who is showing the house to buyers with budgets of over$8m,saysheisseeingmoreinternationalbuyers, mainlyexpatKiwis,helpedbytheweakKiwidollar

“Itmakesthingsalotmoreattractive,that’sUS$1m lessthanlastyear.Forthatyouhavetotalprivacy,but you’reonly minutes from Onetangi,” he says. The 463sqm accommodation is split between the main houseandtwoself-containedguestunits.

As well as the swimming pool and spa pool, the property includes asauna/steam room and cabana with an open-air fireplace, set in native bush and a

NZ'S MOSTEXPENSIVE BEACHHOMES

SALEPRICE SALE DATE ADDRESS

$10.25m November2021

$10.25m June 2021

Ocean View Road, Oneroa, WaihekeIsland

Alan Murray Lane, Oneroa, WaihekeIsland

$9.1m March 2022 Kutai Lane, Omaha, Auckland

$9m April 2022 Newton Rd, Oneroa, WaihekeIsland

$8.45m March 2022

Sea View Road, Ostend, WaihekeIsland

$8.32m October 2021 Inanga Lane, Omaha, Auckland

$8.225m October 2021

productivefruitandvegetablegarden.

Earlier this year Tahapehiclosed the deal for a Church Bay Road homefor $9.2m, which is now undergoinganextensiverenovation

The islandis bursting with award-winning architecture.

Ray White agents Keith Dowdle and Mike Simpsonare marketingastriking timber home on 28 CoromandelRoad,Waiheke, that won architects StevensLawson aNew Zealand Institute of Architects awardin2019.The three-bedroom home on 1047sqm,which has atender closing November 2, is billed as aSealegs drive from the water edge at SandyBay

Buyersare also coming to the island from other rich-listerholidaytowns

Smith recently sold asection at exclusive Wawata Estate on the island to an oral surgeon who has sold his bach at Omaha and who is also building another housein Queenstown. In anothersale, acouplefrom QueenstownboughtahouseinOneroafor$6.5mand areplanninga$3mrenovation.

“TheyliveinQueenstownandthisistheirWaiheke bach.”

Smith says for buyers of baches costing around $5m or $6m the locality is moreimportant than the view, but forholidayhomes worth $10m or more, thenbothareimportant:“Theywantthelocationand theview.”

Wealthy people come to him with alist of requirements but often havetocompromise because of limited stock: “Wedon’toften haveadecent handfulofreallygoodqualityhigh-endhomesatall, let alone closetothe beach or closetothe ferry with bigviews.”

Among the requirements is privacyand often people want to be able to come and go by helicopter, which is not often available. People also wanta principal suiteaway from the rest of the houseso when guests stay they maintain their privacy, and theyliketohavemultiplelivingspaces.

Like othercoastal spots, Smith has noticed new trendsonWaiheke,saying peopleare not only living in their bachmorenights aweek but manypeople haveupgradedtheproperty

Sea View Road, Ostend, WaihekeIsland

$7.75m August 2021 Inanga Lane, Omaha, Auckland

$7.625m October 2021 Rita Way, Omaha, Auckland

$7.41m June 2021 Seaview Road, Whangamata, Coromandel

“People want more quality now.Theywant everything to offer muchgreater lifestyle so the bach might have just been asimple bachbut they’ve put innew kitchens, newbathrooms,they’veputthe spa poolin,they’veputfireplacesin.

“Everyone’s kindofpimpeduptheir baches to be alot moreluxurious so they’reokay to spendmore timethere.”

LUXURYESCAPE
$3m renovations and $10m-plus price tags abound on WaihekeIsland. CATHERINE MASTERS and CATHERINE SMITH checkout some of the country’s mostexpensivebeachhomes
table shows the highest settled sale prices for beach homes in NZ. Street numbers left off for privacy reasons.
The
THIS LUXURYHOMEONSEA VIEW ROAD ON WAIHEKE ISLAND SOLD FOR $8.225M IN OCTOBER LAST YEAR. PHOTO /SUPPLIED

TheOneRoof guideto buyinga bach

❷Getting nance

Buying abachorcribforthefamilytoenjoy overdecadesisstilltheultimateKiwi dream.It’s alot moredifficultnowthanthe dayswhenfamilieswouldbuildtheirown Fibrolite(asbestoscement)shackonsite,orbuyland, add atoiletandelectricity,andcamp.

These days,seven-figuremortgages,complicated taxbills,anddesignerdecoraremorelikelytocomeup inconversationthanthepriceofFibrolite.Butfamilies stillfindwaystobuytheirownsliceofparadise.

Bachescome inallshapesandsizes.InWaihi Beach,forexample,pricesrangefromjustunder $400,000tojustover$4m.LJHookerprincipalGary Alwayssayssimplebachesare stillinhotdemand, butnotallwillsurvivethewreckingball,however. “Old-schoolbachesareunfortunatelybecominga thingofthepast.Peoplewantholidayhomesthat aremoreuptodate.”

ChrisFarhi,headofinsightsatBayleys,says Kiwiattitudestobacheshavealsochanged,with many recentbuyerstreatingbeachhousesastheir permanenthome.“We’reseeingincreasingnumbers ofbuyerswhoareplanningtopermanentlylocate intoholidayhomelocations,”hesays.

“Remoteworkingmeanssome professionals areinfrequentlyintheoffice,sothey’retakingthe opportunitytopermanently resideintheplacethat theylove.Thishas thepotentialtoimpactmarket pricingdynamicsbecausesomebuyerswillbeable topricepropertiesastheirmainhome,ratherthanas asecondhome.”

What youcan expect to pay

Luxuryholiday homescansellformore than $10m,butthoselookingforsomethingmoreaffordable, it’sworthhuntingoutsidethemostdesirablebeach towns.

PalmerstonNorthCentury21principal Tim KearinsthoughtjustthataftervisitingKawhia,on Waikato’swestcoast,anhour’sdrivesouthofRaglan. Thecoastalspot’saveragepropertyvalueis$620,000 –halfoftheaveragepropertyvalueinRaglan.

“Thereare somelovely Waikato beachesthat Auckland[buyers]maynotbeawareof.Kawhiais oldNewZealand,likeWhitianga,intheCoromandel, was30yearsago,”Kearinssays.

Furthersouth,inMangakino,on theedges of LakeMaraetai,in Taupo,thepriceof renovated bachesstartinthe mid-$400,000s,whilebuyers who arewillingtotakeon arenovationprojectcanbuy somethingforless.

SouthIslanderscanpickupsectionsonthe West Coastforaslittleas$50,000,withhomesonthecoast someofthecheapestinNewZealand.

Gettingfinancetobuyabachisoftenthehardest step,butthegoodnewsisthatholidayhomescanbe boughtwith a20%deposit, evenifthebuyersplanto letthemoutfor asmallnumber ofdaysayear.“It’sa littlequirk[oftheLVRrules]whereyoucanborrowup to80%,”mortgagebrokerRupertGoughsays. “The consistentwordingacross all[bank]policiesseems to bethatabach‘mustreceiveminimalrentalincome’.”

Buyerswhowanttoletthepropertyshortorlongtermfallunderthe LVRrules for rentals andneed a40%depositunlessbuying abrand-newproperty whenonly20%isneeded.Andiftheywantto turntheirbachinto ashort-term rental,theycan’t countthepotentialincomeagainsttheirmortgage repaymentsandwillhavetoprove to alenderthat theycanaffordtopaytheentiremortgage,overand abovetheir existingcommitments.

That’sbecauseshort-termrentalincomeisviewed bythebanksinthesamewayas self-employed incomeandneedstwoyearsofaccountstoprove, whichbuyers don’thavewhenpurchasing.“You can’treallyprove thataheadoftimeunlessthere was along-termtenantthere,”Goughsays. Heurgesbuyerstobeupfrontwiththeirlender. Buyerssign declarationswhenbuyinganyhome,so pretendingapurchasewon’tbelettopayingtenants orfalselypromisingthatitwillbelettolong-term tenants canendintrouble.

Havingsaidthat,turningalong-termrentalproperty into ashort-termoneafterareasonableperiodoftime won’tbe aproblem formostbanks,says Gough.“It’s thesameaschangingjobsintwoyears’timeandtaking apaycut.Youdon’tneedtotellthebank.”

Findinglong-termtenantsisn’tdifficult.Farhi pointsoutthatinmostholidaylocationslong-term rentalshaveverylowvacancies.“Thisislargely duetopropertiesbeingpulledintoshort-stay servicessuchasAirbnbratherthanbeingoffered aspermanent rentals.Forexample,Whitianga currentlyhashalf adozen rentallistings,butthere areacouple ofhundredAirbnboptions.”

❸Maximisingincome

It’seasytoletbacheson theshort-term rental marketoverChristmas/New Yearand on long weekends.Butfor adecent returnownersneedto dosomeseriousmarketingtokeeptheplacefulland maximiseincome.

Goneare thedaysofhavingone rentalforthe winterandshort-termtenantsinthesummer.The Residential TenanciesAct(1986)makesitdifficultto getwintertenantstoleaveforthesummerholiday period,unless theownersaremovingbackinas their mainhome.

Thenextproblem isthatletting through thelikes ofAirbnborBachcare,isn’talways straightforward. Ownerscomplainthatwhen tenantsdodamageor holdpartiestheagenciesdon’thavetheirbacks.

❹Taxobligations

Incomefrombachlettingisfullytaxable.The rulesaren’tentirelysimpleanditcanbe agoodidea tousean accountant.

The mostcommontax rulethatappliestoa holidayhomeistheInlandRevenue Department’s mixed useassetrulewherethereisboth business andprivateuse.

Theruleallowsownerstodeductdirectcostssuch ascleaningafter apaidguest,butonlyapportion otherexpensessuchasratesandinsuranceaccording tothenumberof daysusedas abusiness.

Likeother rentalproperties,mortgageinterest deductibilityisbeingphasedout,althoughnewbuildsare exempt.Alsolikeother rentalproperties, “ringfencing”applies whether it’s anew-buildor not.Ringfencingmeansifapropertymakes alossit can’tbeclaimedagainsttheowner’sotherincome. Itcanonlybeoffsetagainstfuturerentalincome, whichneedsthepropertytomake aprofit.

Occasionally a“bach”orholidayhomeis registeredfor GST.Anyone purchasingsucha holidayhomeneedstoseekspecialisttaxadvice. Sotoo doesanyonewhoexpectstomakemorethan $60,000 ayearin rentontheproperty.

Themostaccurate property estimates. Thelatestproperty listings acrossthe country. Leadingmarketinsightsandproperty commentary.

Download the FREEappon:
Everything youneedto knowaboutproperty in one easy-to-useapp.
GETTINGSTARTED
/G ETTYIMAGES OneRoof.co.nz 15
Everwonderedwhatitwouldbeliketobuy abeach housein NewZealand? DIANA CLEMENT walksyouthroughtheprocess. PHO
TO
*Termsand Conditionsapply |LicensedREAA2008 pb.co.nz/bdo FEBRUARY2023 The BIDDAY OUT auctionextravaganza featuresadiscountedmarketingprogramme, morequalifiedbuyers,morecompetitionand ultimately,more moneyinyourpocket. If youwanttogetSOLD,there is no better opportunity thissummer. AN AUCTIONEVENTGEARED TO GETYOU MORE! Don’tmissout;callustoday on08003675263

Over the following pages OneRoof examines a turbulent year in real estate in whichasoaring housing market was brought backdown to earth by the twin pressures of rising interest rates and atighter lending environment.The Year in Reviewidentifies the market'swinners and losersand looksat factorsthatwillhavean impact on buyerand seller decisions in 2023.

OneRoof.co.nz 17

$1,100,000

$1,075,000

$1,050,000

Whatgoesup…

$1,025,000

$1,000,000 $975,000 $950,000 $925,000 $900,000 $875,000 $850,000 $825,000 $800,000 $775,000 $750,000 $725,000 $700,000

The housing market wentfromFOMO (Fear of Missing Out)to FOOP(Fear of Overpaying), as the unexpected Covid-related boom times gave way to fallinghouse prices, tighter credit conditions and uncertainty about the year ahead.

Agents andexperts spoken to by OneRoof say the last12 monthsin real estatehave been amongthe strangest they have encountered, with one saying “existential” factors influenced the marketasNew Zealanders grappled with events outside their control.

Economist Brad Olsen says house priceshave fallen morethan anyone would have expected becausethey had wentway higher than expected during the post Covid boom, which hit its peakin the closing monthsof2021.

Therehas beenanelement of helplessnessback in New Zealand.“We can'tdoa lotabout some of theselarger global issues, we areatthe mercyofthe rest of the world. But we also have to take responsibility for whatwecan hereathome because the challenges coming through arequite significant hits to households and businesses.”

EMPTYAUCTION ROOMS

Barfoot &Thompson auctioneer Campbell Dunoon, who noticed auction rooms emptyout in late March, says people wererattled by worldevents.

“Therewereexistential factors affecting people'sdecision to buy aproperty -Idon't thinkitwas interestrates and Idon't think it wasthe local economy, because we'veall gotjobsand we've gota shortage of people forjobs.

“But what Idobelieve is therewerejust so many things happening outsideofNew Zealand thatcaused ourselves and our cousinsacross the ditch to stop for asecond and say‘OK,do we needtogointodebt right now, should we justhold off and see what happens?’.”

“Partofitreally wasthatlow interest rate environment stuck aroundfor toolong, certainlyinhindsight,” says the principal economist and director at Infometrics

It’s beenchallenging, “to putitmildly”, to forecast the market since Covid arrived, he says.

“I think everyonewas abit reluctant to allofasuddencall a turnaround[earlier this year] given we’dall been burnt at the start of Covid,given things didn’t turn around.”

The country saw debate around whether highinflation would be transitory or persistent and outbreaks of theDeltaand Omicronstrains clouded thepicture

“You couldn’t geta full reading on how strong or not the economymight have been andsoI thinkthere wasjusta huge numberofballsupinthe airand none of us was quite sure which one was going to come down first.”

Inflation has turned out to be the highestfor 32 years in a strangeyear which saw war in Europe and the threat of nuclear weapons being used, Olsen says.

“I remember at the start of this year specificallybringingup the conversationabout Ukraine andthe geopolitical outlook.

“I wasn'tformallyforecasting war if you will but Iremember havingthat conversationand the risks that it posed.

“That wassomething we highlighted to our clients and those we spoke with earlier in the year andsoto see that then come out andthrough that firstand second quarter of theyear was very unsettling.”

The fact people weretalking openly about the possibility of atactical nuclear bomb explodinginthe battlefieldis“insane”, Olsen says

The absence of people at auction roomscontinued through the winterthen started to pick up,he says Bayleys national auction managerConnorPatton says Auckland was the firstto noticethe slowdownin auction rooms butother parts of thecountry, such as Canterbury, Queenstown, Marlborough andBlenheim, werestill goingstrong into the middle of the year PattonthinksAuckland was faster to fallbecause the numbers arebigger: “If you buya $2.5m house inAuckland, which we sell every week,you might have amortgage of circa $2m,which in terms of interest rate rises and the effect of that is muchdifferent to Christchurch, whereyour average sales price is $800,000to$1m andyou've got amortgage of $600,000.”

By September,the market wasstarting to pick up inAuckland but the pacewas still slower than the boom times.

“Lastyear,Ican remember sceneswhere we literally had two different buyers on thephone andboth of them just hadtheir arms up andwouldn't take them down -asquick as Icould count, thatwas howfast the bidding was going up.”

The frenzied pace slowed in conjunction with changes to the CCCFA,which affected people’sability to get finance:“It wasn't just the affordability of money butinhindsight the relativeease of it,”Patton says.

FASTER AND HIGHER

2018 2019 2020 PRE LOCKDOWN PEAK:04 20 $795,300 1 2022 | THE YEAR IN REVIEW NEWZEALAND’SAVERAGEPROPERTYVAL
SanjeevJangra, aLoan Market mortgage adviserwho works
Rising interest rates, falling house prices and global turmoil -analysts and agents say the last12months have been some of the most turbulent and challenging for the housingmarket, writes CATHERINE MASTERS
THINKEVERYONE WASA BIT RELUCTANT TO ALLOFA SUDDEN CALL ATURNAROUND [EARLIER THIS YEAR] GIVEN WE’D ALL BEEN BURNT AT THESTART OF COVID,GIVEN THINGS DIDN’T TURN AROUND.”
“I
INFOMETRICS ECONOMIST BRAD OLSEN

inAuckland’s south, saysinterest rate hikes took people by surprise, especially last year's borrowers who werenot expecting them togo so highsofast

Prices have come down but so has affordability meaning people who bought a$1m house last year with a10% deposit will have to find another $1500 to $2000 if their loan comes up for renewal this year

One of the big changes Jangra has noticed this year is a switch in his client base from 40 or 50% investors to around 80% first-home buyers.

Investors havehit problems, he says, because with property values down 15 or 20% they don’thave enough equity

“Generally,aninvestor will borrow almost 100% of an investment property but given the value of their ownproperty has dropped quite abit there's not enough equity and so they're just probably sitting on the sidelines.”

Jangra recalls panic buying in October and November last year ahead of the CCCFAchanges on December 1but says after that every thirdorfourth loan was declined by the banks.

He has still had abusy year,saying therehave been alot of first-home buyers around, including around 165,000 migrants getting residency.“Alot of them have been saving for deposits for their first home and they arepretty active.”

Steve Koerber,who works the wealthy Remuera market for Ray White, has seen ayear of little urgency from buyers.

He says somebuyers expected to see desperate sellers and werewaiting to swoop but very few people have appeared to be in financial trouble.

Prior to November last year the market was “frothy” with some big prices being paid as buyers threw caution to the wind.

In hindsight, people werepaying too much: “Itwas a bit reckless really,and that allcame to an end pretty much around last November.”

Koerber also says higher interest rates and the CCCFAchanges slowed the market with the market hereslowing much faster than across the Tasman: “Our lending rules changed and Australia’s didn't.”

He also says fear in the market stopped people from listing their properties.

“Fear that they won't get what

they would have got, that they arenot as wealthy (on paper) as they were. They know the house is not worth as much as it was last year and it does make them procrastinate.”

Koerber says the year has been a good learning experience. “In the past when it was ahot market and people were climbing all over eachother,weneeded to focus on the top two or three people. Now, we have to dig deeper and go to the top 20 because the top 19 might drop off.”

‘IT WILLGET BETTER’

In Wellington,Nicki Cruickshank, the principal of Tommy’s, says“turbulent”isthe best descriptorfortheyear.

She, too, says prices went higher than expected lastyear so the drop this year was to be expected -but she had not expected the turnaround to be so sudden.

“But in the big picturemost people own houses for10yearsplus so overall they've still done well.”

Her high point has been seeing morefirst-home buyers returning to the market after apretty direstart to the year, saying they dropped out for various reasons but especially because of the CCCFAchanges.

By September,she was seeinga lot morepeople looking who werenolonger waiting for the bottom of the market.

Cruickshank says her low point was trying to keep nervous sellers positive when thereweresofew buyers.

“Probably the hardest part of these sorts of market is trying to keep owners’spirits up, telling them it will get better.”

She says the year has been the most unusual she can remember in nearly 20 years of being in real estate, aside from the GFC.

“Just to watch it go up so quickly, unbelievably quickly,people paying what seemed like ridiculous money for properties, to it going down equally quickly and the impactthat's had.”

2021 2022 3 4 MARKETPEAK02 22 $1,109,700 42%INCREASE SINCECOVIDDROP AVERAGEPROPERTY VALUEON10 22 $1,009,000 9%DECREASESINCE MARKETPEAK 2 COVIDDROP 5 20TO6 20 $781,000 YVALUEFROMJANUARY2018TOENDOFOCTOBER2022
YEAR, ICAN REMEMBER SCENES WHERE WE LITERALLY HAD TWODIFFERENT BUYERS ON THE PHONE AND BOTH OF THEM JUST HAD THEIR ARMS UP AND WOULDN'T TAKE THEM DOWN AS QUICK AS ICOULDCOUNT, THATWAS HOWFAST THE BIDDINGWAS GOING UP.”
“LAST
BAYLEYSAUCTION MANAGER CONOR PATTON
MONEY MATTERS 2022 | THE YEAR IN REVIEW BYTHENUMBERSNZ NZ'saverage propertyvalue fellby2.7% intheyearto Nov1,2022. Downfromanincreaseof 27.2% intheyeartoNov1,2021. Thefallfrom marketpeakwas -9.8%inAuckland -3.1%inChristchurch -9.1%inDunedin -7.8%inHamilton -1.1%inQueenstown -8.5%inTauranga -17.7%inWellington Settledhousesalesinthethirdquarter of2022were21.7%downonthe samequarterlastyear. Thedropinsaleswassteepest inBayofPlenty(-29.1%) overthesameperiod.
What’s forsale. What it’s worth. Discoverthousands of propertylistingsright acrossthe country and FREE estimated valuesbased on the very latest sales figures. DownloadtheOneRoofapp today. MONEYMATTERS NZ'smostexpensive Queenstcityforpropertyis own,wherethe averagepropertyvalueis$1.884mWithanaverage propertyvalueof $3.816m HerneBayisthecountry'smost expensiveresidentialsuburb. Themedianpricepaidby first-homebuyersinthe thirdquarterof2022was $700,000 down4.8% onthesamequarterlastyear. Themedianpricepaidby investorsinQ32022was $780,000 down7.4% onthesamequarterlastyear. NOTE:SettlementlagforQ32022meansnotallsalescompletedinthelatest quarterhavebeencaptured.AsofendofOctober2022,thetotal valueofsalesthatwascapturedwas$7,701,335,498. Thetotalvalueofsettledsales inthefirsthalfof2022*was $30,236,651,442 -down29%onthesame six-monthperiodlastyear. Theleast expensivetownis Buller.Itsaverage propertyvalueis $385,000

Nine raterises that turned NZ on itshead

Interest rates and inflation arethe biggest influencing factors in the housingmarketright now KELVIN DAVIDSON charts therapid rise of the Official Cash Rate

It’s now been overayear sincethe Reserve Bank of New Zealand (RBNZ) first started to increase theofficial cash rate (OCR), with amovefrom0.25%to0.5%onOctober 6last year.The direct aim of these OCR increases has been to quell inflationary pressuresinthe economy, but also as theysimultaneously try to stick to the high employment part of their mandate too. Butthe housing marketclearly hasn’t been immune to this monetary policy tighteningphase either,and so we take alook here at key developments over the past year or so

October 6, 2021

•OCRrisesfrom0.25%to0.5%

•Typicalone-yearfixedmortgagerate:2.9%

•Three-monthchangeinaverageproperty values:5.2%

•SalesvolumesversusOctobernorm:-3.3%

InAugust’sMonetaryPolicyStatementlastyear, theRBNZhaddecidedtokeeptheOCRat0.25%, notingthat“recentincreasesininflationarelargely temporary”.However,mortgageratesstartedto increasemoreappreciablyfromearlySeptember,and then–onlytwomonthsafternotingthepotentialfor short-lastedinflation–theRBNZactuallydelivered thefirstOCRrise.Forcontext,theSeptemberquarter inflationdata(publishedalittlelateronOctober18) showedafigureof4.9%,wellabovetheaverageof around1.5%overthepreviousfiveyears.

Inthepropertymarket,saleshadalreadybegunto weaken,andforthemonthofOctoberwerearound 3%belowthenormforthatmonthoftheyear(going back20years).Butpropertyvalueswerestillrising.

November24, 2021

•OCRrisesfrom0.5%to0.75%

•Typicalone-yearfixedmortgagerate:3.3%

•Three-monthchangeinaverageproperty values:5.4% •SalesvolumesversusNovembernorm:-2.6%

At this stage, economic matters wereprobably best summed up as “steady as she goes”, with inflation stillakey talkingpoint, butthe RBNZfeeling comfortable withonly a0.25 percentage point increase in theOCR at November’s meeting.

The property marketwasn’tnecessarily doing anythingdramatic either, although of coursemore new borrowerswerebeing curtailed by afurther rise in mortgage rates, andsome existing borrowers wouldhave been facing up to higherrepayments as their current loan term ended. Indeed,asat November 2021, the one-year fixed rate had risen by aboutone percentage point over 12 months. However,the bigger factor in the property market was the tighteningofthe loan to value ratiorules for owner-occupiers on November 1, from 20% of loans being allowedatless thana 20% deposit, to only 10% of loans at lowdeposit. Moreover,the CCCFA rules wereabouttobetightened too…

February23, 2022

•OCRrisesto1%

•Typicalone-yearfixedmortgagerate:3.6%

•Three-monthchangeinaverageproperty values:4.9%

•SalesvolumesversusFebruarynorm:-28.7%

By now,someofthe key variableshad begun to change noticeably.CPI inflationhad risen to 5.9%inthe December 2021 quarter,and inflation expectationsremainedelevated too, with businesses fearingthe outlook forinputcost pressures, and consumers facing up to cost of living strains(which the Governmentlater attempted to mitigate with the cuts in fueltax andthe $350 CostofLiving Payment). That said,the RBNZ stillstucktothe conventional0.25%OCR rise,taking it to 1%

The property market was also shifting. With the CCCFArulechanges having been enacted (from December 1, 2021) and the tighter LVRs also biting, the market sharefor first-home buyers was declining, hitting 23% in February.Itwasn’t much easier for mortgaged investors either,as they continued to grapple with low rental yields, higher mortgage rates, 40% deposits (unless buying newbuilds), and the interest deductibility adjustments

April13, 2022

•OCRrisesto1.5%

•Typicalone-yearfixedmortgagerate:4.1%

•Three-monthchangeinaverageproperty values:0.7%

•SalesvolumesversusAprilnorm:-32.2%

April saw thefirst of theso-called “double shot” hikes in the OCR, taking it from 1% to1.5%,as inflationwas confirmedat6.9% (annual rate) in the first quarterof2022(albeitthe CPI data wasn’t released untilApril 21, after the OCR decision).

The effects of tighter monetary policy were showing through very clearly in the housing market, with atypical one-year fixed mortgage rate climbing above 4%, with the change since borrowers originally fixed one year prior standing at about 2% –i.e. adoubling of mortgage rates in the space of a year.Property sales volumes remained at very low levels and property values had stalled as well.

May25, 2022

•OCRrisesto2%

•Typicalone-yearfixedmortgagerate:4.4%

•Three-monthchangeinaverageproperty values:-0.9%

•SalesvolumesversusMaynorm:-28.9%

The process of monetary policy tightening was certainly in full stride by the timeMay rolled around, and the OCR reached 2% on the25th, with a typical one-yearfixed mortgage rate sitting at close to 4.5%. We didn’t have the Q2 CPI data at that stage, of course, but we now know thatinflationover the second quarter climbedto 7.3%. The net result is intense pressureonhousehold finances, both from the cost of living itself, but also higher mortgage repayments (albeitabenefit for savers).

Inthepropertymarket,salesremainedsluggish,and valuescontinuedtodrop.Theeffectsofpastchanges totheLVRsandCCCFAruleswereclearlyimpacting firsthomebuyers,whosawtheirmarketsharedipto just22%,lessthanmortgagedinvestorsat23%

July 13, 2022

•OCRrisesto2.5%

•Typicalone-yearfixedmortgagerate:5.2%

•Three-monthchangeinaverageproperty values:-2.5%

•SalesversusJulynorm:-33.6%

July saw another 0.5 percentagepoint OCR increase, taking it to 2.5%, asthe inflationfightremained front and centrefor the RBNZ –not just actual inflation, butalso expectations ofwhereitmight go next.

The periodfromMay toJulyhad also seen mortgage rates rise even moresharply,and anybody repricing aloan that had been securedone year earlierwould have been looking at arate rise of at least 2.5%,probably closer to 3%.

Themarketsharesforvariousbuyergroupswere alsostagnant,butatleastfromtheperspectiveoffirst homebuyers,theCCCFAruleshadbeenloosened fromJuly7–meaninglessscrutinyofexpenses,and aslightlylooserborrowingenvironment

August17, 2022

•OCRrisesto3%

•Typicalone-yearfixedmortgage:4.9%

•Three-monthchangeinaverageproperty values:-3.5%

•SalesvolumesversusAugustnorm:-31.2%

August brought the fourth consecutive 0.5 percentage point rise in the OCR,taking it to 3%.

However,competition amongst the banksfora shrinking pool ofnew mortgage lending, combined with some fallsin offshorewholesale interest rates, saw domestic NZ mortgage rates dip abit, back down below the 5% mark.Alongside the effects of looser CCCFAregulations– and perhaps also a change in mood amongst would-be buyers –a hiatus for mortgage rateincreases helped bring back some first-home buyers, who saw their market sharerise to 24% inAugust.

October 5, 2022

•OCRrisesto3.5%

•Typicalone-yearfixedmortgagerate:5.2%

•Three-monthchangeinaverageproperty values:-4.1%

•SalesversusSeptembernorm-33.3%

The foot was still flattothe floor,withanother 0.5%

OCR increase in October,taking thelevel to 3.5%.

MORTGAGEHOLDERS ARE FEELING THE SQUEEZE. PHOTO /GETTY IMAGES
2022 | THE YEAR IN REVIEW 22 OneRoof.co.nz

We alsonowknowthatCPIinflationinQ3barely changed,onlyslowingslightlyto7.2% –hardly reassuring,and“lockingin”furtherOCRincreases inNovember thisyear, andinto2023aswell. Ultimately, apeakofatleast4.5% nowlookslikely, potentiallyashighas 5%ormore.Atypicalone-year fixed“special”mortgagerate couldeasilytop7%.

Inthepropertymarket,salesvolumes remain ultra-low,andpropertyvaluescontinuetofall. Moreencouragingly,atleastfirst-homebuyersare showingsignsoflife,atleastintermsof %market share(evenifthenumberofdealsis stilllow).

However,August’sfallsinmortgagerateshavenow been reversed,andthepeakisnotyetonthecards.

November 23, 2022

•OCRrisesto4.25%

•Typicalone-yearfixedmortgagerate:6%

•Three-monthchangeinaverageproperty values:-4.5%

•SalesvolumesversusOctobernorm:-38.6%

ThelatestOCRincreaseisthebiggestonrecord,and theReserveBankhasalsosignalledplentymore tocome(apossiblepeakof5.5%),withinflation potentiallynotundersomekindofcontroluntil laternextyear,arecessioneminentlypossible,and unemploymentedginghigher.Housepricesare anticipatedbytheRBNZtoultimatelydropby20%, sointermsofthepropertymarket,atypicaloneyearfixedrate(highequity)couldeasilytop7% overthecomingmonths.Thiswillputpressureon newborrowers,butalsothoserollingoffpreviously lowerfixedratesandontoamuchhigherrepayment schedule.

Conclusion

Clearly,the pastyearhasbeenatoughonefor the propertymarket,whichhasbeencollateraldamage intheRBNZ’sdeterminedpathtoknobbleinflation. But theworkisn’tdoneyet,andboththeOCRand mortgagerateshavefurther torise.

Thismeansthatinalllikelihoodpropertysales volumeswill remainlacklustrefor awhileyetand thatvalueshavefurthertofall.However,it’sstill conceivablethatiftheeconomyticksover(and unemploymentstayslow), wagescontinuetorise, netmigrationturnsaroundtosomedegree,and mortgageratesfindsomekindofpeak,wemightsee propertysalesactivitystarttoriseagainin 2023and thefallsinpricescouldcometo anend.

Inthatenvironment,itwouldn’tbeasurpriseto seeadecentpresenceforfirsthomebuyers,butthe outlookremainstrickyfornewinvestorslookingto makeapurchaseorforexistinglandlordswantingto addtotheirportfolios.Otherhomeowners/borrowers willalsocontinuetofacepressuresastheyreprice theirloansoffolder,lowerfixedratesandontocurrent levels.

Finally,thereare twootherimportantpoints toputacrossallofthistoo.First,the regulatory environmentissettoloosenagainin Marchnext year,withfurtherchangestotheCCCFArules.And second,theRBNZ’sconsultation on formalcapsfor debttoincomeratiosstilllingersinthebackground–anychangeshereearlyin2024couldpotentiallyalso beaccompaniedby relaxationofthe LVRrulesatthe sametime.

•KelvinDavidsonischiefeconomistatproperty

Whatthehousingmarket can expectin 2023

JAMESWILSON looksat thefactorsthathaveanimpactonbuyersand sellersinthenext12months.

❶Reducedsalesactivity

There’snothingthatpointsto abiguptickinsalesvolumesnextyear.We're seeingmorepropertiescometo marketoff thebackofspringandweexpectthatto continueintosummerbutwe'renotnecessarilyseeingthem flyingoff theshelf,they’re still aweebitsubduedinterms of gettinginkonpaper. Theremightbe abitmoreactivityintermsofpeopleoutlookingbutit remainstobe seenwhetherthattranslatesintosales.

Volatilityinthenumbers

If thereare lotsofsalesonemonthand hardlyanysalesthenextmonth,the numberscouldreally starttojumparound.Theperformanceofvarioussubmarketswill bekeyto understanding what’sgoingon.Forexample,performingquitestronglyright inAucklandarenew-buildtownhousesinthesub-$1.5m pricebracket –yourtypical firsthomebuyer-typeterritory.Butif youlookat the$3m-pluslarger townhouse marketinAuckland,there’snot thesamelevelofdemand.

Whowillbuyand sell?

Firsthomebuyerswillbeonthehuntforopportunitiesnextyear.Lesscompetition frominvestorsmeanstheywill beabletostaymore activeinthemarket,andkeeptheir share high,eveniftheactualnumberofdealsfallsaway. Investorsareverysensitive tointerestrateincreases,andwhilewecouldn’tsaywithconfidencetheirshare ofthe marketwilldecline significantlyfromcurrentlevels,theywillbeunderpressure.

Theelection

Nodatehas beensetbutin thepast peoplehaveusuallyhit pause on anyhousing marketdecisionsinthelead uptoageneralelection. In ahotmarket,theFOMO(fearof missingout)effecttakesoverbut wedon'thavethatanymore sothepauseeffectcould begreaterthanthelast fewelections.

Achangeofgovernmentcouldbe aboosttotheinvestormarket,giventhatNational hassignalledthatitwantstoaddresssomeofthechangesbroughtinbyLabourto curbinvestoractivity.Watchthisspaceonwherepolicylands;thebrightline rule couldbe reducedandthelawsaroundtheringfencingoflosses couldberolledback.

OCR/Interestrates

Interestraterisesare likelytokeeprising,withtheReserveBankclearlysignalling initslaststatementof the yearthatfurtherincreasesintheOfficial CashRateareon thecardsinabid tobringdowninflation.Whiletheriseof75basispointslastmonthis thebiggestcashrateriseintheBank’shistory, the referencestoarecessionand rising unemploymentthatcouldhavea much biggerimpact,scaringwould-bebuyersand sellersintohittingpause.

❻In ation

Inflationisthe elephantinthe roomandwon’tdisappearovernight.But whilecost oflivingpressuresarereachingacrossnearlyallpartsofourdailylives,we'reactually notseeing asignificantdropinspendingandthat's probablybecause alotofpeoplestill haven'thadtofixtheirmortgageatahigherrate. Whenthathappensandthosemortgageratesbeginto reallybite,thenspendingis likelytodryup.

Obviously,thathasbiggereconomicimpactsbut thekeyquestionis:willinflationbetamedby traditionalpolicyorwillahard,economic landingdothejob?Atthispoint,alotofsigns pointtoaharderlandingthanwouldbeideal.

❼Property values

Propertyvalues havesoftenedand that trendislikely to continue intonextyear but at aslowerrate.

Expectprobablymoreofa flatmarketasa ruleasopposedtoacontinuallydeclining market,but Iwouldn'tbesurprisedif thatcouldtake acoupleofquarters to really revealitself.

JamesWilsonisdirectorof valuationatValocity

FORECAST
BECALLING AGENERAL
OneRoof.co.nz 23
insightsfirmCoreLogic PMJACINDA ARDERNWILL
ELECTIONIN 2023.PHOTO/ GETTYIMAGES
What’sfor sale. Whatit’sworth. Discoverthousandsofproperty listings rightacross thecountry and FREE estimated values based onthe very latest sales figures. DownloadtheOneRoofapp today. 24 OneRoof.co.nz

2022 wasthe yearofmortgage pain–will next year be anybetter?

Ithas,withoutquestion,beenahardyearformost homeownerswithamortgage.Thecostofliving ismorethandoubletheacceptablerateofinflation, mortgageinterestratesaredoublewhattheywere ayearago,andmostKiwihomeownerswillhavefeltthe additionalcostofhighermortgageratesatsomepointthis yearastheirfixedratesmatured.

Butwhataboutthose whoarelookingtobuyin 2023?This year,borrowersweremetwiththe strictest borrowingpoliciessince2008,makingitextremely difficulttogetonthe propertyladder. Will2023beany better? To forecastwhatborrowingwilllooklikeinthe nearfuture, wemustfirstlookatwhatgotustothis position.

Attheriskof minimisingthepain causedbyinterest rateincreases,thebiggestbrakeonthemarketthisyear wasthesudden withdrawaloffinanceduetolastyear’s changestotheCredit ContractsandConsumerFinance Act(CCCFA). “Withdrawaloffinance”isn’tactuallya fairtermasitinsinuatesthatthebanksvolunteeredto makeborrowingmoredifficult. Instead,thebankshad toadheretothe new rulesthat madeitalmostimpossible tolendto mostapplicants.

Thissuddeninabilityforallbuttheverybest applicantstogetfinance hadtwo outcomes; it removed asignificant percentageofthebuyersfromthe market astheir mortgage pre-approvalsweredeclined,and shooktheenthusiasmforthosewhowereapprovedby thebank.Addinthe mixthe sharplyincreasinginterest

rates boilin wass

Fastforwa itornot,things hom have mortgag tomeet servicing wasa Allthat buyer willgoandho former listoff around6%.

Foranyone consideringbuying ahomein2023,the firststepI wouldsuggestistofind outhowmuchyou canaffordunderthecurrentbankpolicies.There is almostnoharminasking thebank oryourbrokerwhat yourcurrent mortgageaffordabilityis.It’sunlikely thatbanklending policieswillchange muchinthenext 12 months;ifanything, they may relax abitfurther, so findingout howmuchyoucanborrowtodaywill probablyletyouknowwhereyoustand forallof2023.

Ifyoucan’t borrowenoughtopurchasethehouseyou want, findoutwhatisholdingyouback.Itisusually your depositoryourincome/expenses. Takethe nextsix

urdle; deposit ry to penses. orrow ndthemselveshesitant omenttoconsider monthsago:queues

ould er hiscool you aluescould anissuefor story tellsusthatbythe timewerealisehouseshavereached thebottomandstartedtoincreaseinvalueagain,the openhomeshavestartedtofillagainandyou’vemissed out on thebuyer’s market.

In short,Iexpect2023tobetheyearofthenewnorm. Interestratesshould remainfairly closeto wherethey arenowandstaythere, house pricesmay drop alittle furtherbutevenoutinthe early partoftheyear.Bank lendingpolicies willremain alittlepainfulbut shouldn’t getsignificantlyharsher. Thispresentsthebestbuying opportunityfor apre-approvedbuyerinyears. •RupertGoughworksforMortgageLabandisauthorof TheSuccessfulFirstHomeBuyer.

List yourhomewith usbefore Christmas* andbein to win foryou and your family (That’sa whole lotofpavlova!) *T&Csapply –propertymustbelistedby MONEYMATTERS
OneRoof.co.nz 25
Believeitornot,butthingsarelookingup forhomebuyers,writes

Winnersand losers

Even in ayear beset by financeand sales challenges, thereweresome suburbs that managed to defymarketgravity and record strong value growth. But the trend-linefor much of the housing marketnationally and in Napierand Hastings has been downwards.

NEW ZEALAND

MOST EXPENSIVE:HIGHEST AVERAGEPROPERTYVALUES

#SuburbValue $

Herne Bay(Auckland)$3,816,000

Coatesville (Auckland)$3,752,000

Whitford (Auckland)$3,611,000

Waiheke Island (Auckland)$3,520,000

Saint Marys Bay(Auckland)$3,091,000

Remuera(Auckland)$2,949,000

OkuraBush (Auckland)$2,760,000

Westmere(Auckland)$2,699,000

Omaha (Auckland)$2,683,000

Ponsonby(Auckland)$2,558,000

MARKETHEAT: BIGGEST 12 MONTH VALUECHANGE #Suburb% change ➊ Glenorchy(Queenstown-Lakes) 28.9%

Ohai (Southland)28.5%

Tuatapere(Southland)28.0%

Takapau (Central Hawke's Bay) 24.4%

Reefton(Buller) 24.3%

Lake Hayes(Queenstown-Lakes) 24.2%

Lake Hawea (Queenstown-Lakes) 23.7%

Karamea (Buller) 22.8%

Turua (Hauraki)22.5%

LONG TERM GROWTH: BIGGEST 5 YEAR VALUECHANGE #Suburb% change

Raetihi (Ruapehu) 212.3%

Patea(SouthTaranaki)175.6%

Mangakino (Taupo) 175.6%

Takapau (Central Hawke's Bay) 174.6%

Waverley(SouthTaranaki)167.3%

Eketahuna (Tararua) 166.9%

Castlecliff (Whanganui)162.3%

Elgin (Gisborne) 155.1%

Manaia (SouthTaranaki)152.9%

Hunterville (Rangitikei)152.8%

Paritai Drive,Orakei, Auckland May-22 $20,000,000

RemueraRoad, Remuera, Auckland May-22 $12,000,000

ArneyRoad, Remuera, Auckland Jul-22 $11,550,000

Ranui Road, Remuera, Auckland May-22 $11,400,000

Victoria Avenue, Remuera, Auckland Feb-22 $11,000,000

Oceanbeach Rd,Mount Maunganui, Tauranga May-22 $11,000,000

Wood Lane, Fendalton, Christchurch Mar-22 $11,000,000

Victoria Avenue, Remuera, Auckland Aug-22 $10,250,000

Marine Parade, Mount Maunganui, Tauranga Apr-22 $10,000,000

StateHighway2North,Bethlehem, Tauranga Jun-22 $10,000,000

CHEAPEST:LOWEST AVERAGEPROPERTYVALUES

Ohai (Southland)$158,000

Runanga (Grey) $247,000

Mataura(Gore)$254,000

Cobden (Grey) $262,000

Blaketown (Grey) $280,000

Ross (Westland)$298,000

Kaitangata (Clutha) $298,000

Tuatapere(Southland)$311,000

Appleby(Invercargill)$323,000

Bluff (Invercargill)$324,000

DANGER ZONE:LOWEST 12 MONTH VALUECHANGE #Suburb% change ➊ Waiwhetu (Lower Hutt)-19.7%

Maoribank (Upper Hutt)-19.5% ➌ Boulcott (Lower Hutt)-19.3%

Fairfield (Lower Hutt)-18.9%

Brown Owl (Upper Hutt)-18.9%

Clouston Park (Upper Hutt)-18.9%

Waterloo (Lower Hutt)-18.8%

Alicetown (Lower Hutt)-18.4%

Melrose (Wellington) -18.2%

Ebdentown (Upper Hutt)-18.0%

LONG TERM GROWTH: LOWEST 5 YEAR VALUECHANGE

Auckland Central (Auckland)0.3%

Grafton(Auckland)7.2%

Long Bay(Auckland)7.5%

Waiwera(Auckland)11.2%

Wainui (Auckland)12.4%

Waiake (Auckland)13.2%

Manukau (Auckland)13.6%

Castor Bay(Auckland)14.2%

Mairangi Bay(Auckland)14.5%

Mission Bay(Auckland)15.5%

BOTTOM SALES

Thedatacoversthe12monthstotheendofOctober2022andisderivedfromtheOneRoof-ValocityHouseValueIndex.Onlysuburbswith15ormoresettledsales inthe12-monthperiodtotheendofOctoberareincluded.Thetopsalestablesfeaturesettledsalesofpropertiesthatwerelistedontheopenmarketandsold privately.ThedatacoverstheyeartotheendofOctober2022.Streetaddressesaregivenbutforreasonsofprivacy,streetnumbersareomitted.

#SuburbValue $ ➊
➓ Patea(SouthTaranaki)21.9%
TOPSALES #Address Sale dateSale price
#Suburb% change
#Address
price ➊ RomillyStreet,Westport,
➌ Wakefield
➍ Wakefield
➎ Wakefield
➓ Wakefi
*Denotes
Sale dateSale
Buller Jun-22 $32,500
Coates Street,Westport, Buller Apr-22 $40,000
Street,Auckland Central, Auckland *Jun-22 $42,000
Street,Auckland Central, Auckland *Sep-22 $43,000
Vincent Street,Auckland Central, Auckland *Jun-22 $43,200
DerbyStreet,Westport, Buller Apr-22 $45,000
Beach Road, Auckland Central, Auckland *May-22 $48,000
GoreStreet,Auckland Central, Auckland *May-22 $50,000
eld Street,Auckland Central, Auckland *Jun-22 $50,100
address of apartment block /apartment sale
2022 | THE YEARINREVIEW 26 OneRoof.co.nz

NAPIER AND HASTINGS

HIGHEST AVERAGEPROPERTYVALUE

Puketapu (Hastings) $1,475,000

Maraekakaho (Hastings) $1,408,000

Eskdale (Hastings) $1,354,000

Poraiti(Napier) $1,302,000

Havelock North (Hastings) $1,263,000

BIGGEST 12 MONTH VALUECHANGE

Maraekakaho (Hastings) 12.8%

Haumoana (Hastings) 6.2%

Puketapu (Hastings) 5.7%

Te Awanga (Hastings) 1.6%

Eskdale (Hastings) 0.1%

BIGGEST 5-YEAR VALUECHANGE

Maraenui (Napier) 143.0%

Flaxmere(Hastings) 124.1%

Te Awanga (Hastings) 120.3%

Maraekakaho (Hastings) 111.7%

Hastings (Hastings) 93.6%

TOPSALES #Address Sale dateSale price

DuartRoad, Havelock North,Hastings May-22 $8,800,000

Mchardy Street,Havelock North,Hastings Mar-22 $4,550,000

Lane Road, Havelock North,Hastings Mar-22 $3,400,000

LindsayStreet,Havelock North,Hastings Feb-22 $3,250,000

Gummer Road, Havelock North,Hastings Aug-22 $2,925,000

MAJOR METROS

Manukau $662,000 Auckland Central $612,000

CHRISTCHURCH

SuburbValue $

Fendalton $1,679,000

Merivale $1,484,000 Richmond Hill $1,328,000

Linwood $485,000 Aranui $446,000 Phillipstown $439,000

HAMILTON

SuburbValue $

Flagstaff $1,192,000

Huntington $1,115,000

Rototuna North $1,077,000

Deanwell $661,000

Enderley$632,000

Bader $611,000

WELLINGTON

SuburbValue $

Oriental Bay$2,310,000

Seatoun $1,848,000

Karaka Bays $1,664,000

Mount Cook $829,000

Te Aro$767,000 Wellington Central $576,000

LOWEST AVERAGEPROPERTYVALUE

Flaxmere(Hastings)

$493,000

Maraenui (Napier) $542,000

Marewa (Napier) $618,000

Onekawa (Napier) $631,000

Mayfair (Hastings) $631,000

LOWEST 12 MONTH VALUECHANGE #Suburb% change

Pirimai (Napier) -10.5%

Tamatea (Napier) -10.2%

Saint Leonards (Hastings) -9.1%

Onekawa (Napier) -8.6%

Marewa (Napier) -8.4%

LOWEST 5-YEAR VALUECHANGE #Suburb% change

Eskdale (Hastings) 63.3%

Ahuriri (Napier) 63.5%

Awatoto(Napier) 64.1%

Te Awa(Napier) 65.8%

Bluff Hill (Napier) 67.1%

BOTTOM SALES #Address Sale dateSale price

Livingstone Road, Flaxmere, Hastings Jul-22 $275,000

Bowling Road, Greenmeadows, Napier Aug-22 $320,000

Cartier Crescent,Flaxmere, Hastings Aug-22 $325,000

Bangor Street,Flaxmere, Hastings Mar-22 $330,000

Walton Place, Flaxmere, Hastings May-22 $340,000

AUCKLAND

Suburb% change

Coatesville 13.3%

Pollok 12.3% Te Arai 11.9% Wesley-12.8% Manurewa East -15.0% Point England -15.5%

CHRISTCHURCH

Suburb% change

Burwood 11.9% Marshland 11.9% Westmorland 11.2% Redcliffs1.8% Merivale 0.7% Fendalton -2.6%

HAMILTON

Suburb% change

Queenwood 6.3% Whitiora4.3% Beerescourt2.9%

Deanwell -4.3%

Rototuna North -6.3% Hamilton Lake -7.5%

WELLINGTON

Suburb% change

Te Aro-7.6%

Seatoun -8.0% Maupuia -8.3%

-18.2%

#SuburbValue $ ➊
#Suburb% change
#Suburb% change
$ ➊
#SuburbValue
AUCKLAND SuburbValue $ Herne Bay$3,816,000 Coatesville $3,752,000 Whitford $3,611,000 Grafton$704,000
OneRoof.co.nz 27
Berhampore-17.6% Roseneath-17.7% Melrose
MOSTEXPENSIVE AND CHEAPEST 12 MONTH VALUECHANGE TOPAND BOTTOM

PROPERTY VALUES UNDER PRESSURE

EWZEALAND’S average propertyvalue recorded its first annualdecline inmorethanadecade, figuresfromtheOneRoofValocityHouse Value Indexshow. Thenationwide averagepropertyvalue dropped2.7%($28,000) inthe 12 monthstothe endofOctoberto$1.009 million,amidfearsthat furtherinterestratehikesin responseto inflation could prolongthedeclinewellinto2023.

Thelasttimethe country'saveragepropertyvalue sufferedanannualdeclinewasin July2011,whenitfell 0.9%,butbackthenthehousingmarketwasonthe cusp of revivalfollowingtheGFC-inducedslump.

Six regions recordedannualdeclines,upfrom fivein theyeartotheendofSeptember, withhousepricesin GreaterWellingtontakingthe biggestknock

The region'saveragepropertyvalue dropped13.1% ($142,000)inthelast12monthsto$940,000 -andtherate ofdecline doesnotappeartobeslowing either.Inthe lastthreemonthsalone,propertyvaluesinthe region fell8.1%($83,000),andaredown17%sincepeakingin March.

Alsodownyear-on-yearareAuckland(-5.5%to $1.398m); Manawatu-Whanganui(-4.5%to$633,000); Hawke'sBay(-4%to $833,000);Nelson(-2.9%to $832,000);andBayof Plenty(-0.2%to$1.002m).

Quarterlydeclines wererecordedbyevery region bar WestCoast, where theaverageproperty valueclimbed2.7%($11,000)to $414,000.

Ofthe country’s72territoriallocal authorities,15sawvaluegrowthinthe threemonths totheendofOctober. Opotiki,intheBayofPlenty, enjoyedthe biggestgrowthspurt, withitsaveragepropertyvalue up9.7% to$666,000.Also recording relativelystrong growthwereHurunui, inCanterbury(+5.7%to $700,000); Westland,in West Coast(+3.9%to $458,000);andBuller, also WestCoast(+3.5%to $385,000).

Propertyvaluesin most TAswereupyearonyear, but marginsaregettingsmaller, withjust 14 TAsrecordingdouble-digitgrowth. Thebiggestyear-on-yeardropswere inGreater Wellington, butalso coming underpressureare Palmerston North (-8.4%),Napier(-8.2%)andDunedin(-6.1%).

Nationwidesalesvolumesfellfrom93,847inthe 12months totheend of Septemberto90,687inthe12 monthstotheendofOctober.Ofthe2265suburbs where therewassalesactivityin thelast12months,just905

Fallfrommarket peak: Whatthemaptells you

ThemapshowsforNZandeachregionthe changeinthe averagepropertyvaluesince marketpeak -whenvalueswere attheirhighest. Alsogivenisthechangesincepeakforeachof themajormetros.Thedateofmarketpeakforeach locationisdifferent. WestCoast'schangeismarked0% asitsaveragepropertyisstillgrowing,and hasnotyet reached peak.Thedataisderivedfromthe OneRoofValocityHouse ValueIndex,takenonOctober20,2022.

recorded20ormore settledsales, downfrom 914inthe12monthstothe endofSeptemberand down from1014inthe12monthsto theendof March. Ofthe905suburbswith 20ormoresettledsales inthelastyear,just88 recordedquarterlyvalue growth,while445saw year-on-yeardropsintheir averagepropertyvalue.

James Wilson,headofvaluations atOneRoof'sdatapartner,Valocity, said:"Propertypricescontinuedtheir downwardtrendinOctober,dropping by4.1%,or$43,000,sinceJuly,and8.6%, or $95,500,sincetheFebruarypeak.Therateofvalue declinehasalsoincreased,from-3.7%threemonths agoto-4.1%inOctober,withtheaveragepropertyvalue nowindangerofdroppingbelowthe$1mmark."

Wilsonadded:"Thearrivalofspringhasseenan increaseinnewlistings.However,inamarketthat alreadyhasanoversupplyofpropertiesavailablefor purchase,thisincreasehassimplyexacerbatedthe issue.Asinterestratesandthecostoflivingcontinue toriseandlendersapplyhighertestratesaspartofthe mortgageapplicationprocess,borrower’spurchasing

powercontinuesto reduce.Thenumberof daystosell also roseasthe resultofmoreoptionsforbuyersonthe marketanddisappearanceoftheFOMOeffect.

"Acrossthe regions,15of16hadvaluesdeclinefrom threemonthsago,and sixare nowbelowvaluesfrom Octoberlastyear.Wellington continuestoholditsspotas the regionwiththepoorestperforminghousingmarket, whilethebest-performinglocationscontinuetobethose atthelowerendofthepricescale."

Wilsonsaidthefactthatinflation remainedhigher thanthetargetedrangewaslikelytoleadtofurtherrises intheOfficialCashRate(OCR).

"Placingadditionalpressureonpropertyisuncertainty intheglobalinvestmentmarket.Thishashampered KiwiSaverperformanceandthereforereducestheamount availableforwithdrawalbyfirst-homebuyers,"hesaid.

"Whatthismeansisthatpropertyvalueswillcontinue todeclineinto2023.

WayneShum,headof researchat Valocity,said mortgage registrationsweredown12%onthe previousquarter.

"First-homebuyers’shareofregistrations rosefrom 38%to39.3%nationwide.Thiscouldbeduetothelower prices,whichmeanslowerdeposits –somethingthathas been asignificant roadblockinthepast.Thatsaid,the numberoffirst-homebuyer registrationsdroppedby 2437overthesameperiod,"Shum said.

"Investors’ share remainedsimilartotheprevious quarterat25.4%."

AllNZ -8.15% Northland -5.5% Auckland -12% Waikato -3.3% Hamilton -10% BayofPlenty -8% Tauranga -10.7% Gisborne -4% Hawke’sBay -11% Taranaki -1.5% ManawatuWhanganui -9.8% QueenstownLakes -4.8% Greater Wellington -17.7% Tasman -3.7% Marlborough -3.5% Nelson -9.9% WestCoast 0% Canterbury -3.6% Otago -3.7% Dunedin -10.6% Southland -2.7% Wellington -22.5% Christchurch -5.5% ONEROOF VALOCITYHOUSE VALUEINDEX
0%+ -2% -4% -6% -8% -10% -12% -14%
Thenationwideaveragepropertyvaluesuffersits first annualdeclineinmorethan adecade, butsome regionsarefeelingthechangingmarketenvironmentworsethanothers.
AND
28 OneRoof.co.nz
OVER

Aboutthetables

TheOneRoof-Valocity House ValueIndextracks theaveragevalueofNewZealand residentialandlifestylepropertiesata suburb, territorialauthority,regionaland nationwidelevel.Theindexisdesignedto beableto estimatedollarvalues,movements, andindexation.Theindexisdesignedtobeableto use arangeofsources of property andsalesdata,ensuringthatestimatesprovidedare abletotakeintoaccount themost recentinformation. The resultsarebasedonacompositeofstatisticalmodelsandare fullystratified.Thefiguresinthetable coverthe12-monthperiodendingonOctober 31,2022,withdatafromthe OneRoof-ValocityHouse Value Index takenonOctober20, 2022.Onlysuburbswith20-plussettledsalesduringthe 12-monthperiodareshown.

NORTHLAND

NORTHLAND

$874,000$900,000$826,000 2.9%5.8%3992

FARNORTH $792,000$799,000$714,000 0.9%10.9%1312

AHIPARA

CABLEBAY

$674,000$654,000$573,0003.1%17.6%31

$871,000$858,000$752,0001.5%15.8%50

COOPERSBEACH $906,000$907,000$783,000 0.1%15.7%30

HARURU

$881,000$867,000$777,0001.6%13.4%41

KAEO $823,000$844,000$706,000 2.5%16.6%38

KAIKOHE $388,000$389,000$346,000 0.3%12.1%60

KAITAIA $451,000$464,000$400,000 2.8%12.8%130

KARIKARIPENINSULA

KAWAKAWA

$787,000$810,000$669,000 2.8%17.6%77

$495,000$513,000$472,000 3.5%4.9%33

KERIKERI $1,140,000$1,140,000$1,032,0000.0%10.5%301

MANGONUI $839,000$826,000$714,0001.6%17.5%37

OKAIHAU $787,000$784,000$683,0000.4%15.2%23

$560,000$563,000$498,000 0.5%12.4%27

OPONONI

PAIHIA $837,000$820,000$725,0002.1%15.4%62

RUSSELL $1,455,000$1,537,000$1,355,000 5.3%7.4%41

TAIPA $774,000$765,000$660,0001.2%17.3%20

WAIPAPA

4.7% 5.5%27265

AUCKLANDCITY$1,583,000$1,658,000$1,693,000 4.5% 6.5%6966

AUCKLANDCENTRAL $612,000$618,000$665,000 1.0% 8.0%840

AVONDALE $1,069,000$1,111,000$1,193,000 3.8% 10.4%253

BLOCKHOUSEBAY $1,237,000$1,293,000$1,343,000 4.3% 7.9%183

EDENTERRACE $854,000$877,000$887,000 2.6% 3.7%102

ELLERSLIE

$1,354,000$1,428,000$1,464,000 5.2% 7.5%153

EPSOM $2,277,000$2,419,000$2,366,000 5.9% 3.8%217

FREEMANSBAY $1,798,000$1,859,000$1,816,000 3.3% 1.0%84

GLENINNES $1,233,000$1,315,000$1,400,000 6.2% 11.9%129

GLENDOWIE $2,438,000$2,568,000$2,546,000 5.1% 4.2%113

GRAFTON $704,000$723,000$778,000 2.6% 9.5%72

GREAT BARRIERISLAND (AOTEA) $835,000$836,000$754,000 0.1%10.7%51

GREENLANE $1,963,000$2,072,000$2,069,000 5.3% 5.1%75

GREYLYNN $1,937,000$2,048,000$2,028,000 5.4% 4.5%194

HERNEBAY $3,816,000$3,880,000$3,907,000 1.6% 2.3%64

HILLSBOROUGH $1,390,000$1,470,000$1,515,000 5.4% 8.3%81

KINGSLAND $1,507,000$1,545,000$1,608,000 2.5% 6.3%60

KOHIMARAMA $2,328,000$2,410,000$2,475,000 3.4% 5.9%75

LYNFIELD $1,414,000$1,502,000$1,505,000 5.9% 6.0%45

MEADOWBANK $1,798,000$1,840,000$1,937,000 2.3% 7.2%78

MISSIONBAY $2,346,000$2,448,000$2,430,000 4.2% 3.5%83

MORNINGSIDE $1,379,000$1,453,000$1,486,000 5.1% 7.2%67

MOUNTALBERT $1,470,000$1,534,000$1,574,000 4.2% 6.6%235

MOUNTEDEN $1,924,000$2,011,000$2,018,000 4.3% 4.7%307

MOUNT ROSKILL $1,229,000$1,310,000$1,318,000 6.2% 6.8%276

MOUNTWELLINGTON $1,060,000$1,130,000$1,087,000 6.2% 2.5%344

NEWWINDSOR $1,344,000$1,411,000$1,419,000 4.7% 5.3%52

NEWMARKET $963,000$998,000$1,031,000 3.5% 6.6%31

ONETREEHILL $1,439,000$1,523,000$1,546,000 5.5% 6.9%56

ONEHUNGA $1,220,000$1,277,000$1,330,000 4.5% 8.3%290

ORAKEI $2,526,000$2,642,000$2,612,000 4.4% 3.3%91

OTAHUHU $846,000$899,000$886,000 5.9% 4.5%175

PANMURE $1,102,000$1,163,000$1,206,000 5.2% 8.6%107

PARNELL $2,211,000$2,238,000$2,240,000 1.2% 1.3%155

POINTCHEVALIER $2,038,000$2,131,000$2,209,000 4.4% 7.7%140

POINTENGLAND $1,169,000$1,243,000$1,384,000 6.0% 15.5%42

PONSONBY $2,558,000$2,645,000$2,631,000 3.3% 2.8%87

REMUERA $2,949,000$3,047,000$2,995,000 3.2% 1.5%395

ROYALOAK $1,501,000$1,615,000$1,580,000 7.1% 5.0%60

SAINTJOHNS $1,579,000$1,705,000$1,710,000 7.4% 7.7%91

SAINTMARYSBAY $3,091,000$3,212,000$3,111,000 3.8% 0.6%32

SANDRINGHAM $1,530,000$1,583,000$1,583,000 3.3% 3.3%172

ST HELIERS $2,406,000$2,606,000$2,512,000 7.7% 4.2%222

STONEFIELDS $1,675,000$1,753,000$1,726,000 4.4% 3.0%74

THREEKINGS $1,246,000$1,303,000$1,326,000 4.4% 6.0%45

WAIOTAIKIBAY $1,629,000$1,701,000$1,804,000 4.2% 9.7%32

4.9% 9.1%40

WATERVIEW

5.1%0.2%40 MAUNU $1,060,000$1,119,000$1,044,000 5.3%1.5%78

MORNINGSIDE $608,000$643,000$609,000 5.4% 0.2%46

NGUNGURU $1,088,000$1,188,000$1,066,000 8.4%2.1%32

ONETREEPOINT $1,155,000$1,222,000$1,114,000 5.5%3.7%173

ONERAHI $686,000$715,000$690,000 4.1% 0.6%139

PARAHAKI $812,000$856,000$800,000 5.1%1.5%26

PARUABAY $1,177,000$1,257,000$1,146,000 6.4%2.7%39

RAUMANGA $540,000$577,000$537,000 6.4%0.6%61

REGENT $720,000$784,000$737,000 8.2% 2.3%33

RIVERSIDE $779,000$828,000$789,000 5.9% 1.3%20

RUAKAKA

$986,000$1,051,000$937,000 6.2%5.2%89

RUATANGATAWEST $1,079,000$1,144,000$1,031,000 5.7%4.7%22

TAMATERAU $1,158,000$1,279,000$1,182,000 9.5% 2.0%24

TIKIPUNGA $649,000$697,000$652,000 6.9% 0.5%189

TUTUKAKA $1,397,000$1,431,000$1,254,000 2.4%11.4%39

WAIPU $1,213,000$1,302,000$1,141,000 6.8%6.3%103

WAIHEKEISLAND $3,520,000$3,610,000$3,423,000 2.5%2.8%31

FRANKLIN

$1,174,000$1,226,000$1,119,000 4.2%4.9%1246

BOMBAY $1,778,000$1,862,000$1,681,000 4.5%5.8%22

CLARKSBEACH $1,279,000$1,358,000$1,255,000 5.8%1.9%52

GLENBROOK $1,251,000$1,367,000$1,261,000 8.5% 0.8%58

HUNUA

PAERATA

PATUMAHOE

PUKEKOHE

RAMARAMA

WAIUKU

$1,562,000$1,654,000$1,496,000 5.6%4.4%31

$1,419,000$1,509,000$1,399,000 6.0%1.4%38

$1,338,000$1,408,000$1,313,000 5.0%1.9%31

$989,000$1,044,000$995,000 5.3% 0.6%605

$1,764,000$1,871,000$1,744,000 5.7%1.1%42

$959,000$1,025,000$945,000 6.4%1.5%261

$785,000$801,000$727,000
PAPAROA $769,000$784,000$720,000
$1,128,000$1,122,000$992,0000.5%13.7%53 KAIPARA$981,000$974,000$891,0000.7%10.1%610 DARGAVILLE $574,000$569,000$542,0000.9%5.9%97 KAIWAKA $1,022,000$1,052,000$943,000 2.9%8.4%64 MANGAWHAI $1,401,000$1,431,000$1,263,000 2.1%10.9%123 MANGAWHAIHEADS $1,529,000$1,475,000$1,302,0003.7%17.4%101 MAUNGATUROTO
2.0%8.0%44
1.9%6.8%20 TINOPAI $672,000$673,000$622,000 0.1%8.0%20 WHANGAREI $899,000$950,000$883,000 5.4%1.8%2070 AVENUES $581,000$614,000$614,000 5.4% 5.4%35 GLENBERVIE $1,300,000$1,380,000$1,200,000 5.8%8.3%28 HIKURANGI $629,000$673,000$618,000 6.5%1.8%41 HORAHORA $707,000$744,000$736,000 5.0% 3.9%24 KAMO $817,000$853,000$785,000 4.2%4.1%278 KAURI $1,225,000$1,277,000$1,117,000 4.1%9.7%21 KENSINGTON $683,000$729,000$673,000 6.3%1.5%101 MAUNGATAPERE $1,147,000$1,209,000$1,145,000
LOCATION CURRENT AVERAGE PROPERTY VALUE THREE MONTHS AGO 12 MONTHS AGO QoQ CHANGE YoY CHANGE SETTLED SALES LAST12 MONTHS GREATERAUCKLAND $1,398,000$1,467,000$1,480,000
WHANGAREIHEADS $1,142,000$1,228,000$1,126,000 7.0%1.4%36 WHAUVALLEY $740,000$777,000$733,000 4.8%1.0%48 WOODHILL $626,000$670,000$647,000 6.6% 3.2%42
$1,114,000$1,171,000$1,226,000
WESLEY $1,194,000$1,286,000$1,369,000 7.2% 12.8%28 WESTMERE $2,699,000$2,751,000$2,782,000 1.9% 3.0%70 WAIHEKEISLAND $2,087,000$2,192,000$1,951,000 4.8%7.0%286 OMIHA $1,169,000$1,206,000$1,263,000 3.1% 7.4%20 ONEROA $2,300,000$2,388,000$2,246,000 3.7%2.4%72 ONETANGI $2,071,000$2,124,000$2,062,000 2.5%0.4%40 OSTEND $1,522,000$1,568,000$1,520,000 2.9%0.1%53 PALMBEACH $2,080,000$2,134,000$2,048,000 2.5%1.6%20 SURFDALE $1,502,000$1,556,000$1,487,000 3.5%1.0%50
CURRENT
THREE
AGO 12
QoQ
YoY
SETTLED SALES LAST12 MONTHS
LOCATION
AVERAGE PROPERTY VALUE
MONTHS
MONTHS AGO
CHANGE
CHANGE
$874,000 5.8% AVERAGEPROPERTY VALUEYEARONYEARCHANGE
$1,398,000 5.5% AVERAGEPROPERTY VALUEYEARONYEARCHANGE OneRoof.co.nz 29
GREATER AUCKLAND

MANUREWA $893,000$923,000$945,000 3.3% 5.5%678

MANUREWAEAST $771,000$809,000$907,000 4.7% 15.0%94

MARAETAI $1,613,000$1,684,000$1,731,000 4.2% 6.8%37

MELLONSBAY $2,191,000$2,292,000$2,394,000 4.4% 8.5%47

NORTHPARK $1,472,000$1,563,000$1,631,000 5.8% 9.7%53

OTARA $832,000$892,000$860,000 6.7% 3.3%116

PAKURANGA $1,269,000$1,338,000$1,336,000 5.2% 5.0%137

PAKURANGAHEIGHTS $1,258,000$1,307,000$1,304,000 3.7% 3.5%127

PAPATOETOE $885,000$959,000$937,000 7.7% 5.5%755

RANDWICK PARK $816,000$855,000$893,000 4.6% 8.6%96

SHELLYPARK $1,628,000$1,729,000$1,784,000 5.8% 8.7%31

SOMERVILLE $1,550,000$1,657,000$1,730,000 6.5% 10.4%52

SUNNYHILLS $1,792,000$1,869,000$1,841,000 4.1% 2.7%53

THE GARDENS $1,357,000$1,443,000$1,421,000 6.0% 4.5%49

TOTARA HEIGHTS $1,084,000$1,147,000$1,165,000 5.5% 7.0%29

TOTARA PARK $2,262,000$2,446,000$2,332,000 7.5% 3.0%31

WATTLEDOWNS $1,107,000$1,189,000$1,146,000 6.9% 3.4%117

WEYMOUTH $860,000$901,000$897,000 4.6% 4.1%197
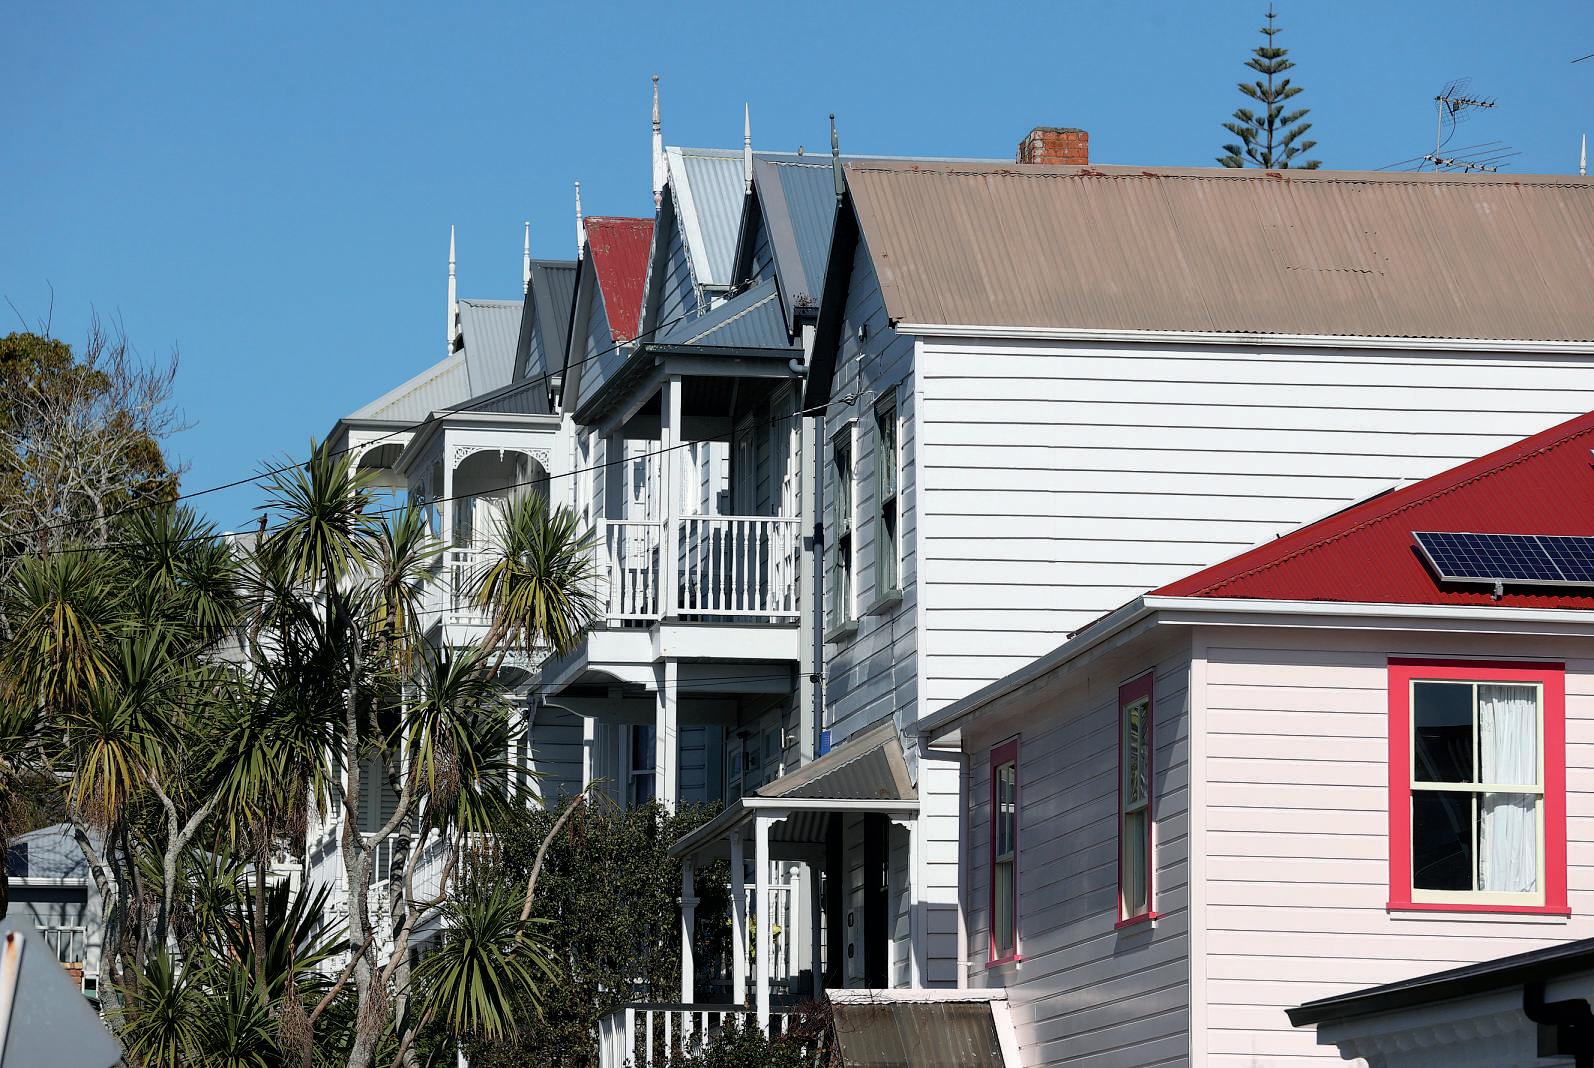
ONEROOF VALOCITYHOUSE VALUEINDEX
WIRI
NORTHSHORE $1,541,000$1,607,000$1,606,000 4.1% 4.0%3986 ALBANY $1,178,000$1,232,000$1,159,000 4.4%1.6%164 ALBANYHEIGHTS $1,444,000$1,510,000$1,494,000 4.4% 3.3%109 BAYSWATER $1,810,000$1,926,000$1,971,000 6.0% 8.2%33 MANUKAU $1,281,000$1,344,000$1,300,000 4.7% 1.5%5857 BEACHLANDS $1,670,000$1,769,000$1,671,000 5.6% 0.1%128 BOTANYDOWNS $1,332,000$1,402,000$1,443,000 5.0% 7.7%121 BUCKLANDSBEACH $1,810,000$1,885,000$1,839,000 4.0% 1.6%171 CLENDON PARK $782,000$818,000$853,000 4.4% 8.3%167 CLEVEDON $2,189,000$2,322,000$2,170,000 5.7%0.9%40 CLOVER PARK $894,000$954,000$954,000
WHITFORD $3,611,000$3,726,000$3,526,000 3.1%2.4%36
$734,000$777,000$803,000 5.5% 8.6%41
6.3% 6.3%82 COCKLEBAY $1,695,000$1,759,000$1,767,000 3.6% 4.1%77 DANNEMORA $1,693,000$1,768,000$1,856,000 4.2% 8.8%29 EAST TAMAKI $1,178,000$1,233,000$1,235,000 4.5% 4.6%88 EAST TAMAKIHEIGHTS $1,787,000$1,910,000$1,961,000 6.4% 8.9%55 EASTERNBEACH $1,965,000$2,097,000$2,126,000 6.3% 7.6%22 FARMCOVE $1,853,000$1,893,000$1,962,000 2.1% 5.6%33 FAVONA $919,000$968,000$927,000 5.1% 0.9%64 FLAT BUSH $1,436,000$1,490,000$1,500,000 3.6% 4.3%739 GOLFLANDS $1,348,000$1,418,000$1,515,000 4.9% 11.0%43
HILLPARK $992,000$1,039,000$1,072,000
HOWICK $1,257,000$1,353,000$1,395,000
MANGERE $955,000$1,037,000$973,000 7.9%
MANGEREBRIDGE $1,347,000$1,447,000$1,381,000 6.9% 2.5%129 MANGERE EAST $936,000$1,015,000$947,000 7.8% 1.2%233 MANUKAU $662,000$688,000$732,000 3.8% 9.6%89 LOCATION CURRENT AVERAGE PROPERTY VALUE THREE MONTHS AGO 12 MONTHS AGO QoQ CHANGE YoY CHANGE SETTLED SALES LAST12 MONTHS LOCATION CURRENT AVERAGE PROPERTY VALUE THREE MONTHS AGO 12 MONTHS AGO QoQ CHANGE YoY CHANGE SETTLED SALES LAST12 MONTHS
AUCKLAND.THESUBURB'S AVERAGEPROPERTY VALUEHASDROPPED2.8%INTHE
30 OneRoof.co.nz
GOODWOODHEIGHTS $1,144,000$1,227,000$1,238,000 6.8% 7.6%53 HALFMOONBAY $1,709,000$1,793,000$1,749,000 4.7% 2.3%94 HIGHLAND PARK $1,222,000$1,289,000$1,299,000 5.2% 5.9%69
4.5% 7.5%81
7.1% 9.9%231
1.8%174
HOUSESINPONSONBY,
LAST12MONTHS.PHOTO /FIONAGOODALL

LOCATION

BAYVIEW

CURRENT

$1,047,000$1,130,000$1,164,000 7.3% 10.1%121

BEACHHAVEN $1,111,000$1,206,000$1,261,000 7.9% 11.9%218

BELMONT $1,667,000$1,725,000$1,720,000 3.4% 3.1%48

BIRKDALE $999,000$1,059,000$1,082,000 5.7% 7.7%175

BIRKENHEAD $1,401,000$1,462,000$1,430,000 4.2% 2.0%190

BROWNSBAY $1,291,000$1,377,000$1,370,000 6.2% 5.8%223

CAMPBELLSBAY $2,401,000$2,486,000$2,591,000 3.4% 7.3%44

CASTORBAY $1,999,000$2,075,000$2,179,000 3.7% 8.3%64

CHATSWOOD $1,561,000$1,630,000$1,733,000 4.2% 9.9%43

DEVONPORT $2,240,000$2,324,000$2,374,000 3.6% 5.6%103

FAIRVIEWHEIGHTS $1,650,000$1,732,000$1,771,000 4.7% 6.8%41

FORRESTHILL $1,461,000$1,522,000$1,605,000 4.0% 9.0%134

GLENFIELD $1,125,000$1,175,000$1,184,000 4.3% 5.0%275

GREENHITHE $1,810,000$1,913,000$1,881,000 5.4% 3.8%126

HAURAKI $2,111,000$2,229,000$2,165,000 5.3% 2.5%80

HILLCREST $1,302,000$1,381,000$1,405,000 5.7% 7.3%147

LONGBAY $1,731,000$1,801,000$1,815,000 3.9% 4.6%93

MAIRANGIBAY $1,827,000$1,904,000$2,012,000 4.0% 9.2%91

MILFORD $1,850,000$1,974,000$1,980,000 6.3% 6.6%148

MURRAYSBAY $1,827,000$1,889,000$1,991,000 3.3% 8.2%70

NARROW NECK $2,055,000$2,163,000$2,237,000 5.0% 8.1%31

NORTHCOTE $1,352,000$1,383,000$1,363,000 2.2% 0.8%130

NORTHCOTEPOINT $1,781,000$1,837,000$1,938,000 3.0% 8.1%46

NORTHCROSS $1,360,000$1,417,000$1,458,000 4.0% 6.7%48

OTEHA $1,196,000$1,234,000$1,267,000 3.1% 5.6%78

PAREMOREMO $1,939,000$2,066,000$2,057,000 6.1% 5.7%28

PINEHILL $1,724,000$1,814,000$1,842,000 5.0% 6.4%37

ROTHESAYBAY $1,647,000$1,716,000$1,876,000 4.0% 12.2%53

SCHNAPPER ROCK $1,662,000$1,749,000$1,796,000 5.0% 7.5%54

STANLEYPOINT

$2,530,000$2,665,000$2,788,000 5.1% 9.3%20

SUNNYNOOK $1,279,000$1,355,000$1,384,000 5.6% 7.6%64

TAKAPUNA $2,331,000$2,421,000$2,356,000 3.7% 1.1%157

TORBAY $1,322,000$1,370,000$1,398,000 3.5% 5.4%264

TOTARA VALE $1,086,000$1,148,000$1,164,000 5.4% 6.7%93

UNSWORTHHEIGHTS $1,210,000$1,280,000$1,316,000 5.5% 8.1%61

WAIAKE $1,659,000$1,710,000$1,809,000 3.0% 8.3%25

WINDSOR PARK $1,446,000$1,525,000$1,537,000 5.2% 5.9%25

PAPAKURA $1,118,000$1,161,000$1,092,000 3.7%2.4%1957

CONIFERGROVE $1,105,000$1,147,000$1,157,000 3.7% 4.5%86

DRURY $1,463,000$1,512,000$1,392,000 3.2%5.1%26

KARAKA $1,803,000$1,922,000$1,830,000 6.2% 1.5%238

OPAHEKE $1,161,000$1,206,000$1,170,000 3.7% 0.8%136

PAHUREHURE $1,069,000$1,129,000$1,130,000 5.3% 5.4%86

PAPAKURA $930,000$951,000$932,000 2.2% 0.2%831

REDHILL $890,000$940,000$877,000 5.3%1.5%64

ROSEHILL $988,000$1,032,000$976,000 4.3%1.2%90

TAKANINI $997,000$1,040,000$1,011,000 4.1% 1.4%390

RODNEY$1,497,000$1,559,000$1,470,000 4.0%1.8%2998

ALGIESBAY $1,426,000$1,496,000$1,501,000 4.7% 5.0%20

ARMYBAY $1,193,000$1,259,000$1,303,000 5.2% 8.4%28

COATESVILLE $3,752,000$3,737,000$3,311,0000.4%13.3%48

DAIRYFLAT $2,417,000$2,547,000$2,349,000 5.1%2.9%64

GULFHARBOUR $1,158,000$1,223,000$1,127,000 5.3%2.8%180

HATFIELDSBEACH $1,170,000$1,215,000$1,261,000 3.7% 7.2%25

HELENSVILLE $1,263,000$1,323,000$1,277,000 4.5% 1.1%119

HUAPAI $1,342,000$1,435,000$1,355,000 6.5% 1.0%62

KAUKAPAKAPA $1,488,000$1,554,000$1,486,000 4.2%0.1%50

KUMEU

$1,664,000$1,797,000$1,727,000 7.4% 3.6%169

LEIGH $1,547,000$1,635,000$1,478,000 5.4%4.7%23

MAKARAU $1,257,000$1,334,000$1,246,000 5.8%0.9%22

MANLY $1,308,000$1,388,000$1,366,000 5.8% 4.2%112

MATAKANA

$2,024,000$2,058,000$1,893,000 1.7%6.9%36

MURIWAI $1,520,000$1,597,000$1,652,000 4.8% 8.0%28

OMAHA $2,683,000$2,780,000$2,675,000 3.5%0.3%32

OREWA $1,321,000$1,386,000$1,302,000 4.7%1.5%361

POINTWELLS $2,299,000$2,358,000$2,160,000 2.5%6.4%27

REDBEACH $1,301,000$1,381,000$1,345,000 5.8% 3.3%122

RIVERHEAD $1,992,000$2,063,000$1,907,000 3.4%4.5%107

SILVERDALE $1,478,000$1,536,000$1,474,000 3.8%0.3%180

SNELLSBEACH $1,145,000$1,202,000$1,177,000 4.7% 2.7%88

STANMOREBAY

$1,139,000$1,252,000$1,159,000 9.0% 1.7%252

STILLWATER $1,681,000$1,739,000$1,670,000 3.3%0.7%26

WAIMAUKU $1,700,000$1,791,000$1,699,000 5.1%0.1%63

WAINUI $1,582,000$1,693,000$1,677,000 6.6% 5.7%167

WAITOKI $2,113,000$2,218,000$2,121,000 4.7% 0.4%21

WARKWORTH $1,267,000$1,314,000$1,238,000 3.6%2.3%192

WELLSFORD $859,000$921,000$878,000 6.7% 2.2%54

WAITAKERE

$1,140,000$1,192,000$1,164,000 4.4% 2.1%4255

GLENEDEN $952,000$1,021,000$1,023,000 6.8% 6.9%373

GLENDENE $1,024,000$1,104,000$1,085,000 7.2% 5.6%82

GREENBAY $1,273,000$1,370,000$1,378,000 7.1% 7.6%55

HENDERSON $1,072,000$1,111,000$1,094,000 3.5% 2.0%611

HENDERSON VALLEY $1,428,000$1,508,000$1,464,000 5.3% 2.5%46

HOBSONVILLE $1,240,000$1,270,000$1,228,000 2.4%1.0%511

KELSTON $988,000$1,038,000$1,055,000 4.8% 6.4%64

LAINGHOLM $1,099,000$1,173,000$1,175,000 6.3% 6.5%45

MASSEY $1,096,000$1,113,000$1,105,000 1.5% 0.8%498

NEW LYNN $940,000$976,000$1,023,000 3.7% 8.1%317

ORATIA $1,632,000$1,726,000$1,708,000 5.4% 4.4%21

RANUI $937,000$985,000$996,000 4.9% 5.9%202

SUNNYVALE $983,000$1,028,000$1,020,000 4.4% 3.6%94

SWANSON $1,262,000$1,324,000$1,249,000 4.7%1.0%109

TE ATATUPENINSULA $1,234,000$1,324,000$1,384,000 6.8% 10.8%264

TE ATATUSOUTH $1,050,000$1,108,000$1,098,000 5.2% 4.4%248

TITIRANGI $1,284,000$1,401,000$1,377,000 8.4% 6.8%237

WAITAKERE $1,563,000$1,642,000$1,512,000 4.8%3.4%32

WESTHARBOUR $1,366,000$1,476,000$1,436,000 7.5% 4.9%151

WESTGATE $1,022,000$1,092,000$1,121,000 6.4% 8.8%63

WHENUAPAI $1,359,000$1,432,000$1,451,000 5.1% 6.3%162

$744,000$775,000$758,000 4.0% 1.8%46

FITZROY $813,000$855,000$817,000 4.9% 0.5%39

FLAGSTAFF $1,192,000$1,221,000$1,209,000 2.4% 1.4%244

FORESTLAKE $773,000$800,000$764,000 3.4%1.2%55

FRANKTON $683,000$697,000$698,000 2.0% 2.1%157

GLENVIEW $793,000$815,000$810,000 2.7% 2.1%146

GRANDVIEWHEIGHTS $931,000$956,000$938,000 2.6% 0.7%25

HAMILTONCENTRAL $796,000$817,000$805,000 2.6% 1.1%52

HAMILTONEAST $750,000$766,000$779,000 2.1% 3.7%258

HAMILTONLAKE $934,000$977,000$1,010,000 4.4% 7.5%45

HILLCREST $819,000$833,000$840,000 1.7% 2.5%121

HUNTINGTON $1,115,000$1,150,000$1,128,000 3.0% 1.2%139

MAEROA $752,000$780,000$752,000 3.6%0.0%52

MELVILLE $677,000$700,000$690,000 3.3% 1.9%126

NAWTON $694,000$714,000$710,000 2.8% 2.3%200

PUKETE $852,000$885,000$875,000 3.7% 2.6%88

QUEENWOOD $1,071,000$1,104,000$1,008,000 3.0%6.3%63

RIVERLEA

$896,000$935,000$917,000 4.2% 2.3%23

ROTOTUNA $1,038,000$1,085,000$1,054,000 4.3% 1.5%66

ROTOTUNANORTH $1,077,000$1,119,000$1,150,000 3.8% 6.3%133

SAINTANDREWS $870,000$908,000$882,000 4.2% 1.4%133

SILVERDALE $761,000$791,000$777,000 3.8% 2.1%34

WHITIORA $696,000$712,000$667,000 2.2%4.3%39

AVERAGE PROPERTY VALUE THREE MONTHS AGO 12 MONTHS AGO QoQ CHANGE YoY CHANGE SETTLED SALES LAST12 MONTHS LOCATION
CURRENT AVERAGE PROPERTY VALUE THREE MONTHS AGO 12 MONTHS AGO QoQ CHANGE YoY CHANGE SETTLED SALES LAST12 MONTHS
WAIKATO$960,000$981,000$927,000 2.1%3.6%9901 HAMILTON$854,000$875,000$878,000 2.4% 2.7%3195 BADER $611,000$622,000$632,000 1.8% 3.3%47 BEERESCOURT $1,027,000$1,070,000$998,000 4.0%2.9%53 CHARTWELL $901,000$912,000$881,000 1.2%2.3%261 CHEDWORTH $953,000$992,000$952,000
CLAUDELANDS
DINSDALE
ENDERLEY
FAIRFIELD
FAIRVIEWDOWNS
3.9%0.1%28
$801,000$825,000$796,000 2.9%0.6%53
$755,000$768,000$778,000 1.7% 3.0%172
$632,000$647,000$639,000 2.3% 1.1%74
$798,000$848,000$823,000 5.9% 3.0%138
3.6% AVERAGEPROPERTY VALUEYEARONYEARCHANGE OneRoof.co.nz 31
WAIKATO $960,000

HILLTOP $917,000$977,000$908,000 6.1%1.0%56

KINLOCH $1,384,000$1,413,000$1,260,000 2.1%9.8%77

MANGAKINO $496,000$541,000$474,000 8.3%4.6%39

MOTUOAPA $790,000$825,000$793,000 4.2% 0.4%33

NUKUHAU $894,000$951,000$886,000 6.0%0.9%103

OMORI $796,000$839,000$789,000 5.1%0.9%23

RANGATIRAPARK

RICHMONDHEIGHTS

TAUHARA

$1,064,000$1,079,000$994,000 1.4%7.0%42

$807,000$847,000$808,000 4.7% 0.1%59

$613,000$630,000$603,000 2.7%1.7%35

TAUPO $765,000$800,000$746,000 4.4%2.5%203

TURANGI $492,000$514,000$481,000 4.3%2.3%93

TWOMILEBAY

$961,000$977,000$947,000 1.6%1.5%29

WAIPAHIHI $1,115,000$1,132,000$1,079,000 1.5%3.3%38

WAIRAKEI $1,131,000$1,168,000$1,029,000 3.2%9.9%22

WHAREWAKA $1,346,000$1,432,000$1,336,000 6.0%0.7%80

THAMES COROMANDEL$1,296,000$1,276,000$1,198,0001.6%8.2%1050

COOKSBEACH

COROMANDEL

$1,568,000$1,457,000$1,399,0007.6%12.1%24

$912,000$921,000$872,000 1.0%4.6%36

MATARANGI $1,238,000$1,186,000$1,129,0004.4%9.7%75

PAUANUI $1,662,000$1,574,000$1,438,0005.6%15.6%94

TAIRUA $1,266,000$1,237,000$1,164,0002.3%8.8%66

THAMES

$806,000$804,000$748,0000.2%7.8%113

WHANGAMATA $1,548,000$1,518,000$1,418,0002.0%9.2%183

WHITIANGA $1,153,000$1,161,000$1,050,000 0.7%9.8%231

WAIKATO$1,158,000$1,188,000$1,073,000 -2.5%7.9%1514

BUCKLAND $1,442,000$1,457,000$1,354,000 1.0%6.5%31

HUNTLY $581,000$584,000$560,000 0.5%3.8%126

MANGATAWHIRI

$1,384,000$1,394,000$1,237,000 0.7%11.9%24

MATANGI $1,836,000$1,912,000$1,647,000 4.0%11.5%38

MEREMERE $545,000$523,000$505,0004.2%7.9%23

NGARUAWAHIA $813,000$826,000$786,000 1.6%3.4%193

POKENO $1,115,000$1,163,000$1,057,000 4.1%5.5%192

PORTWAIKATO $663,000$657,000$647,0000.9%2.5%22

PUKEKAWA $1,232,000$1,236,000$1,110,000 0.3%11.0%23

RAGLAN $1,276,000$1,286,000$1,193,000 0.8%7.0%153

TAMAHERE $2,194,000$2,219,000$1,955,000 1.1%12.2%70

OPOTIKI $494,000$455,000$471,0008.6%4.9%59 WAIOTAHE $1,109,000$974,000$1,048,00013.9%5.8%21

ROTORUA$752,000$782,000$755,000 3.8% 0.4%993

FAIRYSPRINGS $574,000$625,000$588,000 8.2% 2.4%33

FORDLANDS $393,000$421,000$386,000 6.7%1.8%20

GLENHOLME $691,000$703,000$704,000 1.7% 1.8%80

HAMURANA $1,347,000$1,379,000$1,202,000 2.3%12.1%29

HILLCREST $628,000$657,000$640,000 4.4% 1.9%26

KAWAHAPOINT $806,000$816,000$812,000 1.2% 0.7%37

KOUTU $525,000$542,000$543,000 3.1% 3.3%21

LYNMORE $957,000$980,000$936,000 2.3%2.2%60

MAMAKU $582,000$611,000$557,000 4.7%4.5%23

MANGAKAKAHI $541,000$571,000$554,000 5.3% 2.3%54

NGONGOTAHA $734,000$743,000$721,000 1.2%1.8%67

OWHATA $691,000$712,000$687,000 2.9%0.6%104

POMARE $765,000$785,000$757,000 2.5%1.1%20

PUKEHANGI $643,000$673,000$659,000 4.5% 2.4%67

SPRINGFIELD $834,000$843,000$836,000 1.1% 0.2%50

SUNNYBROOK $739,000$760,000$739,000 2.8%0.0%33

VICTORIA $556,000$571,000$560,000 2.6% 0.7%33

WESTERNHEIGHTS $538,000$563,000$545,000 4.4% 1.3%50

TAURANGA$1,126,000$1,184,000$1,163,000 4.9% 3.2%3019

BELLEVUE $822,000$869,000$855,000 5.4% 3.9%66

BETHLEHEM $1,198,000$1,250,000$1,187,000 4.2%0.9%159

BROOKFIELD $838,000$886,000$858,000 5.4% 2.3%113

GATE PA $697,000$743,000$722,000 6.2% 3.5%128

GREERTON $759,000$802,000$770,000 5.4% 1.4%67

HAIRINI $819,000$861,000$840,000 4.9% 2.5%45

JUDEA $761,000$809,000$809,000 5.9% 5.9%69

MATUA $1,256,000$1,296,000$1,288,000 3.1% 2.5%89

MAUNGATAPU $945,000$1,000,000$985,000 5.5% 4.1%49

MOUNTMAUNGANUI $1,538,000$1,609,000$1,562,000 4.4% 1.5%445

OHAUITI $1,157,000$1,210,000$1,158,000 4.4% 0.1%122

OTUMOETAI $1,107,000$1,152,000$1,158,000 3.9% 4.4%149

PAPAMOA $969,000$1,052,000$990,000 7.9% 2.1%143

PAPAMOABEACH $1,163,000$1,238,000$1,162,000 6.1%0.1%621

PARKVALE $692,000$719,000$712,000 3.8% 2.8%59

POIKE $720,000$744,000$735,000 3.2% 2.0%24

PYESPA $1,158,000$1,230,000$1,191,000 5.9% 2.8%292

TAURANGA $1,056,000$1,121,000$1,074,000 5.8% 1.7%51

TAURANGASOUTH $962,000$1,038,000$938,000 7.3%2.6%110

WELCOMEBAY $959,000$1,017,000$940,000 5.7%2.0%205

0.9%5.6%30 KATIKATI $850,000$882,000$804,000 3.6%5.7%139 MINDEN $1,667,000$1,789,000$1,624,000 6.8%2.6%28 OMANAWA $1,407,000$1,568,000$1,369,000 10.3%2.8%29 OMOKOROA $1,182,000$1,212,000$1,142,000 2.5%3.5%177

OROPI $1,556,000$1,719,000$1,500,000 9.5%3.7%24

PAENGAROA $1,119,000$1,158,000$1,031,000 3.4%8.5%33

PUKEHINA $1,278,000$1,336,000$1,145,000 4.3%11.6%37

TAHAWAI $1,313,000$1,394,000$1,238,000 5.8%6.1%26

TEPUKE $854,000$895,000$832,000 4.6%2.6%157 TEPUNA $1,912,000$2,041,000$1,819,000 6.3%5.1%24

WAIHIBEACH $1,469,000$1,545,000$1,379,000 4.9%6.5%67

ONEROOF VALOCITYHOUSE VALUEINDEX HAURAKI $771,000$812,000$662,000 5.0%16.5%370 NGATEA $744,000$867,000$661,000 14.2%12.6%32 PAEROA $603,000$665,000$530,000 9.3%13.8%86 WAIHI $760,000$829,000$632,000 8.3%20.3%149 MATAMATA PIAKO$840,000$875,000$796,000 4.0%5.5%657 MATAMATA $860,000$880,000$782,000 2.3%10.0%235 MORRINSVILLE $839,000$883,000$790,000 5.0%6.2%237 TEAROHA $755,000$769,000$684,000 1.8%10.4%94 OTOROHANGA$698,000$681,000$691,0002.5%1.0%126 KAWHIA $620,000$612,000$589,0001.3%5.3%21 OTOROHANGA $656,000$668,000$666,000 1.8% 1.5%76 SOUTH WAIKATO$546,000$548,000$516,000 0.4%5.8%417
TIRAU
PUTARURU $580,000$592,000$550,000 2.0%5.5%91
$713,000$728,000$697,000 2.1%2.3%37 TOKOROA $470,000$468,000$425,0000.4%10.6%265 TAUPO $924,000$963,000$903,000 4.0%2.3%1074 ACACIABAY $1,464,000$1,498,000$1,351,000 2.3%8.4%56
CAMBRIDGE
4.5%1.1%326 KARAPIRO $1,536,000$1,637,000$1,463,000 6.2%5.0%22 KIHIKIHI $809,000$841,000$756,000 3.8%7.0%119 LEAMINGTON $997,000$1,031,000$960,000 3.3%3.9%251 MAUNGATAUTARI $1,629,000$1,751,000$1,550,000 7.0%5.1%20 NGAHINAPOURI $1,461,000$1,554,000$1,375,000 6.0%6.3%55 OHAUPO $1,374,000$1,406,000$1,281,000 2.3%7.3%44 PIRONGIA $1,074,000$1,130,000$1,051,000 5.0%2.2%46 TE AWAMUTU $813,000$862,000$761,000 5.7%6.8%361 WAITOMO $467,000$462,000$405,0001.1%15.3%167 TE KUITI $478,000$470,000$395,0001.7%21.0%109 BAYOFPLENTY$1,002,000$1,044,000$1,004,000
KAWERAU $435,000$436,000$420,000
OPOTIKI
TAUPIRI $1,177,000$1,207,000$1,092,000 2.5%7.8%29 TE KAUWHATA $907,000$907,000$839,0000.0%8.1%114 TE KOWHAI $1,432,000$1,395,000$1,333,0002.7%7.4%33 TUAKAU $902,000$910,000$848,000 0.9%6.4%147 WHATAWHATA $1,313,000$1,348,000$1,229,000 2.6%6.8%32 WAIPA$1,068,000$1,115,000$1,053,000 4.2%1.4%1331
$1,236,000$1,294,000$1,223,000
4.0% 0.2%5676
0.2%3.6%132
$666,000$607,000$623,0009.7%6.9%99
WESTERN BAYOFPLENTY $1,216,000$1,282,000$1,179,000
AONGATETE $1,330,000$1,423,000$1,279,000
ATHENREE $1,124,000$1,134,000$1,064,000
5.1%3.1%896
6.5%4.0%28
WHAKATANE $790,000$809,000$759,000 2.3%4.1%537 COASTLANDS $1,030,000$1,033,000$951,000 0.3%8.3%45 EDGECUMBE $660,000$664,000$619,000 0.6%6.6%36 MATATA $856,000$875,000$815,000 2.2%5.0%22 OHOPE $1,231,000$1,277,000$1,177,000 3.6%4.6%86 WHAKATANE $707,000$736,000$685,000 3.9%3.2%251 LOCATION CURRENT AVERAGE PROPERTY VALUE THREE MONTHS AGO 12 MONTHS AGO QoQ CHANGE YoY CHANGE SETTLED SALES LAST12 MONTHS LOCATION CURRENT AVERAGE PROPERTY VALUE THREE MONTHS AGO 12 MONTHS AGO QoQ CHANGE YoY CHANGE SETTLED SALES LAST12 MONTHS BAYOF PLENTY $1,002,000 0.2% AVERAGEPROPERTY VALUEYEARONYEARCHANGE 32 OneRoof.co.nz
WHAKAMARAMA $1,571,000$1,703,000$1,567,000 7.8%0.3%44

$940,000$994,000$945,000 5.4% 0.5%39

CLIVE

ESKDALE $1,354,000$1,423,000$1,352,000 4.8%0.1%23

FLAXMERE $493,000$511,000$504,000 3.5% 2.2%108

FRIMLEY $909,000$978,000$928,000 7.1% 2.0%71

HASTINGS $633,000$670,000$668,000 5.5% 5.2%63

HAVELOCKNORTH $1,263,000$1,311,000$1,291,000 3.7% 2.2%257

MAHORA $730,000$789,000$787,000 7.5% 7.2%67

MAYFAIR $631,000$676,000$674,000 6.7% 6.4%77

PARKVALE $707,000$741,000$750,000 4.6% 5.7%81

RAUREKA $642,000$706,000$701,000 9.1% 8.4%63

SAINTLEONARDS $639,000$681,000$703,000 6.2% 9.1%39 NAPIER $829,000$887,000$903,000 -6.5% -8.2%1124
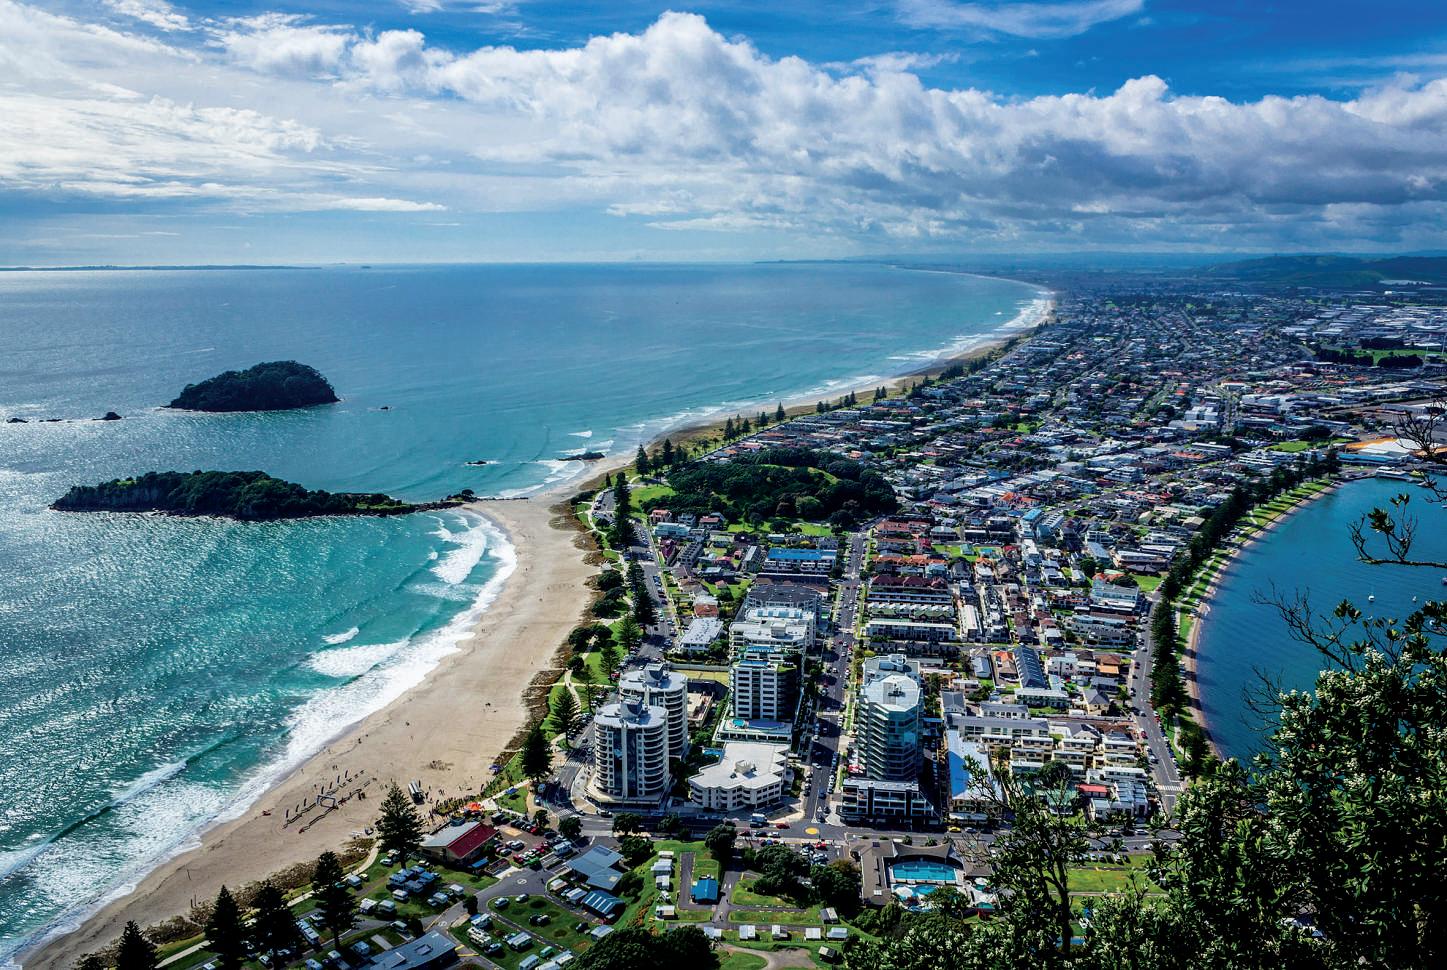
$1,076,000$1,151,000$1,107,000 6.5% 2.8%33 AWATOTO $970,000$1,050,000$1,012,000 7.6% 4.2%34 BAYVIEW $1,088,000$1,174,000$1,152,000 7.3% 5.6%37 BLUFFHILL $1,086,000$1,144,000$1,144,000 5.1% 5.1%52 GREENMEADOWS $847,000$935,000$905,000 9.4% 6.4%118 HOSPITALHILL

GISBORNE $701,000$710,000$683,000 1.3%2.6%622 ELGIN $505,000$530,000$502,000 4.7%0.6%33 GISBORNE $586,000$592,000$580,000 1.0%1.0%35 INNER KAITI $733,000$752,000$742,000 2.5% 1.2%33 KAITI $505,000$544,000$495,000 7.2%2.0%37 LYTTONWEST $936,000$924,000$925,0001.3%1.2%25 MANGAPAPA $664,000$672,000$653,000 1.2%1.7%90 OUTER KAITI $501,000$531,000$482,000 5.6%3.9%45 RIVERDALE $812,000$820,000$822,000 1.0% 1.2%23 TEHAPARA $595,000$619,000$600,000 3.9% 0.8%96 WHATAUPOKO $889,000$901,000$875,000 1.3%1.6%70 HAWKE'S BAY$833,000$876,000$868,000 4.9% 4.0%2750 CENTRALHAWKE'S BAY$704,000$738,000$664,000 4.6%6.0%357 OTANE $814,000$859,000$773,000 5.2%5.3%43 WAIPAWA $674,000$710,000$627,000 5.1%7.5%81 WAIPUKURAU $682,000$710,000$620,000 3.9%10.0%137 HASTINGS$910,000$948,000$934,000 4.0% 2.6%1156 AKINA $646,000$705,000$689,000 8.4% 6.2%78
MARAENUI
MAREWA
NAPIER
ONEKAWA
7.3% 8.6%107 PIRIMAI $656,000$715,000$733,000 8.3% 10.5%60 PORAITI $1,302,000$1,378,000$1,308,000 5.5% 0.5%51 TAMATEA $653,000$706,000$727,000 7.5% 10.2%88 TARADALE $874,000$946,000$947,000 7.6% 7.7%228 TE AWA $852,000$907,000$910,000 6.1% 6.4%21 WESTSHORE $1,127,000$1,169,000$1,193,000 3.6% 5.5%34 WAIROA$467,000$467,000$402,0000.0%16.2%113 WAIROA $336,000$336,000$286,0000.0%17.5%71 MANAWATU WHANGANUI $633,000$668,000$663,000 5.2% 4.5%4615 HOROWHENUA$664,000$699,000$684,000 5.0% 2.9%757 FOXTON $547,000$553,000$568,000 1.1% 3.7%65 FOXTONBEACH $647,000$692,000$678,000 6.5% 4.6%63 LEVIN $633,000$676,000$665,000 6.4% 4.8%415 OHAU $1,037,000$1,075,000$985,000 3.5%5.3%38 SHANNON $532,000$560,000$558,000 5.0% 4.7%45 TAURANGA'S AVERAGE PROPERTY VALUEIS3.2%YEARONYEAR. PHOTO/GETTYIMAGES LOCATION CURRENT AVERAGE PROPERTY VALUE THREE MONTHS AGO 12 MONTHS AGO QoQ CHANGE YoY CHANGE SETTLED SALES LAST12 MONTHS LOCATION CURRENT AVERAGE PROPERTY VALUE THREE MONTHS AGO 12 MONTHS AGO QoQ CHANGE YoY CHANGE SETTLED SALES LAST12 MONTHS CENTRAL NORTH ISLAND GISBORNE$701,000 2.6% HAWKE'S BAY$833,000 4% MANAWATU-WHANGANUI $633,000 4.5% TARANAKI$716,000 8.2% AVERAGE PROPERTY VALUE YEARONYEAR CHANGE OneRoof.co.nz 33
AHURIRI
$1,046,000$1,138,000$1,095,000 8.1% 4.5%41
$542,000$554,000$584,000 2.2% 7.2%46
$618,000$651,000$675,000 5.1% 8.4%75
SOUTH $717,000$775,000$782,000 7.5% 8.3%86
$631,000$681,000$690,000

TOKOMARU

SOUTH TARANAKI

$727,000$764,000$736,000 4.8% 1.2%20

WAITAREREBEACH $699,000$734,000$730,000 4.8% 4.2%40

MANAWATU

FEILDING

HALCOMBE

$713,000$734,000$730,000 2.9% 2.3%609

$686,000$714,000$707,000 3.9% 3.0%406

$828,000$851,000$784,000 2.7%5.6%37

HIMATANGIBEACH $553,000$563,000$571,000 1.8% 3.2%20

RONGOTEA $719,000$749,000$725,000 4.0% 0.8%41

PALMERSTONNORTH$713,000$765,000$778,000 6.8% 8.4%1513

AOKAUTERE

ASHHURST

$1,162,000$1,298,000$1,170,000 10.5% 0.7%26

$750,000$798,000$781,000 6.0% 4.0%72

AWAPUNI $660,000$711,000$711,000 7.2% 7.2%148

BUNNYTHORPE

CLOVERLEA

FITZHERBERT

HIGHBURY

HOKOWHITU

KELVINGROVE

$943,000$1,009,000$927,000 6.5%1.7%32

$584,000$632,000$664,000 7.6% 12.0%31

$969,000$1,088,000$1,070,000 10.9% 9.4%91

$567,000$602,000$605,000 5.8% 6.3%96

$851,000$907,000$907,000 6.2% 6.2%181

$842,000$899,000$892,000 6.3% 5.6%161

MILSON $671,000$705,000$716,000 4.8% 6.3%131

PALMERSTONNORTH

ROSLYN

TAKARO

$661,000$724,000$712,000 8.7% 7.2%116

$580,000$626,000$634,000 7.3% 8.5%109

$509,000$513,000$458,000 0.8%11.1%563

ELTHAM $439,000$439,000$415,0000.0%5.8%44

HAWERA $563,000$567,000$503,000 0.7%11.9%298

MANAIA $397,000$396,000$351,0000.3%13.1%23

NORMANBY $521,000$531,000$496,000 1.9%5.0%24

OPUNAKE

$497,000$499,000$467,000 0.4%6.4%55

PATEA $339,000$331,000$278,0002.4%21.9%24

WAVERLEY $449,000$442,000$374,0001.6%20.1%30

STRATFORD $562,000$573,000$539,000 1.9%4.3%198

STRATFORD $545,000$561,000$510,000 2.9%6.9%150

PAEKAKARIKI $1,026,000$1,080,000$1,118,000 5.0% 8.2%25

PARAPARAUMU $871,000$909,000$933,000 4.2% 6.6%152

PARAPARAUMUBEACH $940,000$1,009,000$1,006,000 6.8% 6.6%174

RAUMATIBEACH $945,000$1,012,000$1,007,000 6.6% 6.2%72

RAUMATI SOUTH $939,000$997,000$1,043,000 5.8% 10.0%75

WAIKANAE $992,000$1,060,000$1,052,000 6.4% 5.7%193

WAIKANAEBEACH $1,018,000$1,072,000$1,137,000 5.0% 10.5%78

LOWERHUTT$835,000$902,000$1,002,000 7.4% 16.7%1466

ALICETOWN $853,000$923,000$1,045,000 7.6% 18.4%23

AVALON $763,000$851,000$912,000 10.3% 16.3%63

BELMONT $991,000$1,077,000$1,127,000 8.0% 12.1%51

BOULCOTT $932,000$1,012,000$1,155,000 7.9% 19.3%39

EASTBOURNE $1,226,000$1,277,000$1,361,000 4.0% 9.9%44

EPUNI $859,000$921,000$1,025,000 6.7% 16.2%35

FAIRFIELD $809,000$888,000$997,000 8.9% 18.9%37

HUTTCENTRAL $1,148,000$1,252,000$1,325,000 8.3% 13.4%47

KELSON $866,000$944,000$1,022,000 8.3% 15.3%45

MAUNGARAKI $910,000$1,011,000$1,092,000 10.0% 16.7%40

NAENAE $666,000$737,000$800,000 9.6% 16.8%94

NORMANDALE $957,000$1,030,000$1,105,000 7.1% 13.4%25

PETONE $930,000$994,000$1,083,000 6.4% 14.1%104

STOKES VALLEY $684,000$751,000$795,000 8.9% 14.0%149

TAITA $647,000$726,000$776,000 10.9% 16.6%89

WAINUIOMATA $678,000$737,000$797,000 8.0% 14.9%303

WAIWHETU $783,000$879,000$975,000 10.9% 19.7%67

WATERLOO $889,000$1,010,000$1,095,000 12.0% 18.8%63 WOBURN $1,283,000$1,365,000$1,471,000 6.0% 12.8%44 MASTERTON $704,000$777,000$748,000 9.4% 5.9%600

KURIPUNI $580,000$637,000$630,000 8.9% 7.9%50 LANSDOWNE $675,000$737,000$718,000 8.4% 6.0%100 MASTERTON $588,000$650,000$631,000 9.5% 6.8%205

LOWER VOGELTOWN $743,000$762,000$685,000 2.5%8.5%36

LYNMOUTH $706,000$724,000$666,000 2.5%6.0%26

MARFELL $493,000$489,000$432,0000.8%14.1%28

MERRILANDS $816,000$828,000$754,000 1.4%8.2%66

MOTUROA $778,000$795,000$700,000 2.1%11.1%45

NEWPLYMOUTH $889,000$898,000$839,000 1.0%6.0%94 OKATO $693,000$708,000$622,000 2.1%11.4%36

SPOTSWOOD $571,000$600,000$538,000 4.8%6.1%41

STRANDON $1,017,000$1,001,000$911,0001.6%11.6%55

UPPER

ONEROOF VALOCITYHOUSE VALUEINDEX
WESTEND
WESTBROOK
RANGITIKEI $530,000$554,000$527,000 4.3%0.6%271 BULLS $584,000$621,000$586,000 6.0% 0.3%40 MARTON $572,000$603,000$552,000 5.1%3.6%144 TAIHAPE $401,000$409,000$412,000 2.0% 2.7%45 RUAPEHU $459,000$458,000$422,0000.2%8.8%234 OHAKUNE $581,000$572,000$545,0001.6%6.6%71 RAETIHI $406,000$424,000$362,000 4.2%12.2%25 TAUMARUNUI $375,000$380,000$347,000 1.3%8.1%58 TARARUA$479,000$533,000$520,000 10.1% 7.9%404 DANNEVIRKE $493,000$534,000$511,000 7.7% 3.5%155 EKETAHUNA $435,000$494,000$472,000 11.9% 7.8%32 PAHIATUA $504,000$562,000$534,000 10.3% 5.6%93 WOODVILLE $454,000$498,000$478,000 8.8% 5.0%65 WHANGANUI $559,000$585,000$571,000 4.4% 2.1%827 ARAMOHO $488,000$521,000$485,000 6.3%0.6%69 CASTLECLIFF $438,000$453,000$432,000 3.3%1.4%109 DURIEHILL $609,000$646,000$630,000
WHANGANUI
WHANGANUI
TARANAKI $716,000$727,000$662,000
$585,000$630,000$631,000 7.1% 7.3%96 TERRACEEND $671,000$726,000$730,000 7.6% 8.1%84
$633,000$684,000$699,000 7.5% 9.4%76
$594,000$642,000$648,000 7.5% 8.3%35
5.7% 3.3%36 GONVILLE $435,000$461,000$451,000 5.6% 3.5%109 OTAMATEA $888,000$952,000$906,000 6.7% 2.0%24 SAINTJOHNSHILL $688,000$731,000$716,000 5.9% 3.9%31 SPRINGVALE $601,000$640,000$611,000 6.1% 1.6%84 TAWHERO $548,000$562,000$562,000 2.5% 2.5%54 WESTMERE $1,006,000$1,106,000$995,000 9.0%1.1%26
$419,000$425,000$438,000 1.4% 4.3%81
EAST $472,000$485,000$483,000 2.7% 2.3%112
1.5%8.2%2249 NEWPLYMOUTH $792,000$804,000$733,000 1.5%8.0%1488 BELLBLOCK $762,000$791,000$689,000 3.7%10.6%123 BLAGDON $594,000$624,000$568,000 4.8%4.6%31 BROOKLANDS $716,000$736,000$652,000 2.7%9.8%20 FITZROY $946,000$951,000$883,000 0.5%7.1%33 FRANKLEIGH PARK $733,000$752,000$672,000 2.5%9.1%53 HIGHLANDS PARK $957,000$963,000$874,000 0.6%9.5%40 HURWORTH $1,205,000$1,208,000$1,078,000 0.2%11.8%26 INGLEWOOD $656,000$688,000$613,000 4.7%7.0%98
VOGELTOWN $708,000$725,000$651,000 2.3%8.8%21 VOGELTOWN $649,000$665,000$606,000 2.4%7.1%41 WAITARA $501,000$524,000$483,000 4.4%3.7%102 WAIWHAKAIHO $1,184,000$1,149,000$1,032,0003.0%14.7%24 WELBOURN $723,000$748,000$691,000 3.3%4.6%35 WESTOWN $657,000$672,000$622,000 2.2%5.6%126 WHALERS GATE $800,000$810,000$716,000 1.2%11.7%44
LOCATION CURRENT AVERAGE PROPERTY VALUE THREE MONTHS AGO 12 MONTHS AGO QoQ CHANGE YoY CHANGE SETTLED SALES LAST12 MONTHS LOCATION CURRENT AVERAGE PROPERTY VALUE THREE MONTHS AGO 12 MONTHS AGO QoQ CHANGE YoY CHANGE SETTLED SALES LAST12 MONTHS GREATER WELLINGTON $940,000 13.1% AVERAGEPROPERTY VALUEYEARONYEARCHANGE GREATERWELLINGTON$940,000$1,023,000$1,082,000 8.1% 13.1%7783 CARTERTON $817,000$861,000$828,000 5.1% 1.3%225 CARTERTON $702,000$742,000$730,000 5.4% 3.8%153 KAPITICOAST $944,000$1,006,000$1,027,000
6.2% 8.1%1051 HAUTERE $1,465,000$1,488,000$1,395,000 1.5%5.0%22 OTAKI $764,000$826,000$813,000 7.5% 6.0%133 OTAKIBEACH $693,000$737,000$746,000 6.0% 7.1%62
SOLWAY
PORIRUA$900,000$958,000$1,034,000 6.1% 13.0%706 AOTEA $1,275,000$1,366,000$1,423,000 6.7% 10.4%101 ASCOT PARK $694,000$749,000$806,000 7.3% 13.9%28 CAMBORNE
4.9%
CANNONSCREEK
KENEPURU
PAPAKOWHAI
PAREMATA
PLIMMERTON
PUKERUABAY
TITAHIBAY
WHITBY
34 OneRoof.co.nz
$654,000$719,000$689,000 9.0% 5.1%148
$976,000$1,026,000$1,105,000
11.7%28
$601,000$626,000$681,000 4.0% 11.7%29
$906,000$973,000$1,031,000 6.9% 12.1%28
$934,000$981,000$1,116,000 4.8% 16.3%32
$1,020,000$1,097,000$1,144,000 7.0% 10.8%30
$1,116,000$1,157,000$1,192,000 3.5% 6.4%27
$947,000$994,000$1,076,000 4.7% 12.0%23 RANUI $661,000$733,000$766,000 9.8% 13.7%38
$758,000$830,000$893,000 8.7% 15.1%95
$1,024,000$1,092,000$1,135,000 6.2% 9.8%202

SOUTH WAIRARAPA$947,000$1,030,000$996,000 8.1% 4.9%316

FEATHERSTON $646,000$717,000$699,000 9.9% 7.6%66

GREYTOWN $1,032,000$1,119,000$1,065,000 7.8% 3.1%98

MARTINBOROUGH $1,077,000$1,166,000$1,114,000 7.6% 3.3%66

UPPERHUTT$829,000$885,000$988,000 6.3% 16.1%692

BIRCHVILLE $749,000$810,000$891,000 7.5% 15.9%40

BROWNOWL $805,000$871,000$993,000 7.6% 18.9%30

CLOUSTONPARK $703,000$768,000$867,000 8.5% 18.9%26

EBDENTOWN $715,000$779,000$872,000 8.2% 18.0%50

ELDERSLEA

$767,000$836,000$924,000 8.3% 17.0%32

PINEHAVEN $807,000$871,000$952,000 7.3% 15.2%30

RIVERSTONETERRACES

$1,102,000$1,170,000$1,256,000 5.8% 12.3%28

SILVERSTREAM $942,000$991,000$1,091,000 4.9% 13.7%59

TIMBERLEA $819,000$859,000$978,000 4.7% 16.3%32

TOTARA PARK $709,000$765,000$863,000 7.3% 17.8%35

TRENTHAM $727,000$807,000$849,000 9.9% 14.4%137

WALLACEVILLE $789,000$853,000$941,000 7.5% 16.2%91

WELLINGTON$1,070,000$1,180,000$1,244,000 9.3% 14.0%2727

$1,017,000$1,150,000$1,233,000 11.6% 17.5%32

AROVALLEY

BERHAMPORE $900,000$993,000$1,092,000 9.4% 17.6%69

BROADMEADOWS $936,000$1,062,000$1,105,000 11.9% 15.3%20

BROOKLYN $1,134,000$1,269,000$1,292,000 10.6% 12.2%84

CHURTONPARK $1,128,000$1,248,000$1,309,000 9.6% 13.8%104

CROFTONDOWNS $1,089,000$1,226,000$1,256,000 11.2% 13.3%26

GRENADAVILLAGE $1,065,000$1,214,000$1,236,000 12.3% 13.8%38

HATAITAI $1,246,000$1,355,000$1,422,000 8.0% 12.4%81

ISLANDBAY $1,223,000$1,344,000$1,386,000 9.0% 11.8%93

JOHNSONVILLE $909,000$980,000$1,025,000 7.2% 11.3%148

KARORI $1,203,000$1,316,000$1,367,000 8.6% 12.0%205

KELBURN $1,590,000$1,708,000$1,776,000 6.9% 10.5%43

KHANDALLAH $1,385,000$1,575,000$1,575,000 12.1% 12.1%126

KILBIRNIE $954,000$1,053,000$1,112,000 9.4% 14.2%42

LYALLBAY $1,030,000$1,163,000$1,220,000 11.4% 15.6%46

MAUPUIA $1,001,000$1,126,000$1,092,000 11.1% 8.3%25

MELROSE $1,086,000$1,229,000$1,328,000 11.6% 18.2%28

MIRAMAR $1,109,000$1,222,000$1,239,000 9.2% 10.5%114

MOUNTCOOK $829,000$920,000$987,000 9.9% 16.0%54

MOUNTVICTORIA $1,294,000$1,402,000$1,500,000 7.7% 13.7%63

NEWLANDS $875,000$1,005,000$1,037,000 12.9% 15.6%100

NEWTOWN $1,041,000$1,122,000$1,187,000 7.2% 12.3%94

NGAIO $1,152,000$1,281,000$1,307,000 10.1% 11.9%74

NORTHLAND $1,170,000$1,283,000$1,361,000 8.8% 14.0%56

PAPARANGI $889,000$1,006,000$1,040,000 11.6% 14.5%35

ROSENEATH $1,593,000$1,732,000$1,936,000 8.0% 17.7%22

SEATOUN $1,848,000$2,077,000$2,009,000 11.0% 8.0%36

STRATHMORE PARK $1,111,000$1,250,000$1,226,000 11.1% 9.4%38

TAWA $931,000$1,020,000$1,027,000 8.7% 9.3%185

TEARO $767,000$848,000$830,000 9.6% 7.6%223

THORNDON $1,044,000$1,151,000$1,199,000 9.3% 12.9%78

WADESTOWN $1,339,000$1,462,000$1,580,000 8.4% 15.3%48

WELLINGTONCENTRAL

$576,000$642,000$634,000 10.3% 9.1%59

WILTON $1,022,000$1,143,000$1,187,000 10.6% 13.9%30

WOODRIDGE $985,000$1,101,000$1,151,000 10.5% 14.4%26

MARLBOROUGH $783,000$799,000$757,000 2.0%3.4%1094

BLENHEIM $627,000$641,000$629,000 2.2% 0.3%176

BURLEIGH $1,039,000$1,069,000$981,000 2.8%5.9%21

HAVELOCK $708,000$719,000$631,000 1.5%12.2%24

MAYFIELD $590,000$608,000$601,000 3.0% 1.8%35

PICTON $669,000$683,000$635,000 2.0%5.4%85

REDWOODTOWN $623,000$635,000$622,000 1.9%0.2%135

RENWICK $786,000$798,000$762,000 1.5%3.1%41

RIVERSDALE $568,000$585,000$584,000 2.9% 2.7%26

SPRINGLANDS $851,000$873,000$820,000 2.5%3.8%130

WAIKAWA $954,000$960,000$900,000 0.6%6.0%35

WITHERLEA $784,000$809,000$761,000 3.1%3.0%137

NELSON $832,000$867,000$857,000 4.0% 2.9%953

ATAWHAI $954,000$987,000$973,000 3.3% 2.0%57

BISHOPDALE $781,000$802,000$775,000 2.6%0.8%23

ENNERGLYNN $904,000$963,000$906,000 6.1% 0.2%31

MARYBANK $953,000$1,000,000$939,000 4.7%1.5%24

MONACO $709,000$737,000$742,000 3.8% 4.4%25

NELSON $1,137,000$1,205,000$1,162,000 5.6% 2.2%32

NELSON SOUTH $793,000$825,000$805,000 3.9% 1.5%69

STOKE $772,000$813,000$775,000 5.0% 0.4%322

TAHUNANUI $718,000$764,000$703,000 6.0%2.1%79

THEBROOK $734,000$768,000$740,000 4.4% 0.8%33

THE WOOD $817,000$853,000$853,000 4.2% 4.2%59

TOITOI $563,000$583,000$598,000 3.4% 5.9%42

WASHINGTONVALLEY $638,000$659,000$676,000 3.2% 5.6%44

TASMAN $982,000$1,011,000$959,000 -2.9%2.4%1193

APPLEBY $1,207,000$1,240,000$1,251,000 2.7% 3.5%109

BRIGHTWATER $990,000$1,037,000$963,000 4.5%2.8%62

HOPE $1,378,000$1,408,000$1,244,000 2.1%10.8%23

KAITERITERI $1,469,000$1,496,000$1,367,000 1.8%7.5%25

MAPUA $1,162,000$1,206,000$1,083,000 3.6%7.3%44

MOTUEKA $778,000$814,000$775,000 4.4%0.4%135

REDWOOD VALLEY $1,636,000$1,689,000$1,514,000 3.1%8.1%27

RICHMOND $903,000$927,000$882,000 2.6%2.4%422

RUBYBAY $1,544,000$1,590,000$1,459,000 2.9%5.8%25

TAKAKA $701,000$719,000$694,000 2.5%1.0%32

UPPERMOUTERE $1,339,000$1,366,000$1,256,000 2.0%6.6%29

WAKEFIELD $940,000$990,000$911,000 5.1%3.2%66

LOCATION CURRENT AVERAGE PROPERTY VALUE THREE MONTHS AGO 12 MONTHS AGO QoQ CHANGE YoY CHANGE SETTLED SALES LAST12 MONTHS
THREE MONTHS AGO 12 MONTHS AGO QoQ CHANGE YoY CHANGE SETTLED SALES LAST12 MONTHS
LOCATION CURRENT AVERAGE PROPERTY VALUE
WESTCOAST $414,000$403,000$367,0002.7%12.8%1003 BULLER $385,000$372,000$333,0003.5%15.6%318 REEFTON $338,000$320,000$272,0005.6%24.3%29 WESTPORT $381,000$376,000$332,0001.3%14.8%156 GREY$411,000$404,000$360,0001.7%14.2%378 BLAKETOWN $280,000$278,000$240,0000.7%16.7%24 COBDEN $262,000$261,000$225,0000.4%16.4%47 GREYMOUTH $397,000$401,000$347,000 1.0%14.4%93 PAROA $627,000$610,000$563,0002.8%11.4%20 RUNANGA $247,000$239,000$211,0003.3%17.1%25 WESTLAND $458,000$441,000$421,0003.9%8.8%307 ARAHURAVALLEY $629,000$615,000$558,0002.3%12.7%21 FRANZJOSEFGLACIER $488,000$489,000$448,000 0.2%8.9%30 HOKITIKA $409,000$401,000$379,0002.0%7.9%92 RUATAPU $569,000$548,000$499,0003.8%14.0%23 UPPER SOUTH ISLAND MARLBOROUGH $783,000 3.4% NELSON$832,000 2.9% TASMAN$982,000 2.4% WESTCOAST $414,000 12.8% AVERAGE PROPERTY VALUE YEARONYEAR CHANGE OneRoof.co.nz 35

AKAROA $964,000$959,000$918,0000.5%5.0%36

ARANUI $446,000$469,000$429,000 4.9%4.0%114

AVONDALE $537,000$545,000$491,000 1.5%9.4%75

AVONHEAD $825,000$840,000$757,000 1.8%9.0%167

AVONSIDE $533,000$545,000$497,000 2.2%7.2%28

BECKENHAM $818,000$846,000$786,000 3.3%4.1%28

BELFAST $688,000$700,000$638,000 1.7%7.8%80

BISHOPDALE

$665,000$696,000$644,000 4.5%3.3%163

BROMLEY $501,000$529,000$476,000 5.3%5.3%53

BROOMFIELD $705,000$715,000$664,000 1.4%6.2%67

BRYNDWR $785,000$803,000$746,000 2.2%5.2%107

BURNSIDE $894,000$902,000$849,000 0.9%5.3%179

BURWOOD $686,000$694,000$613,000 1.2%11.9%177

CASEBROOK $834,000$846,000$758,000 1.4%10.0%90

CASHMERE $1,106,000$1,135,000$1,034,000 2.6%7.0%138

CHRISTCHURCHCENTRAL $695,000$719,000$645,000 3.3%7.8%327

DALLINGTON $573,000$570,000$546,0000.5%4.9%37

DIAMONDHARBOUR $814,000$864,000$735,000 5.8%10.7%30

EDGEWARE $534,000$558,000$493,000 4.3%8.3%119

FENDALTON $1,679,000$1,829,000$1,723,000 8.2% 2.6%87

HALSWELL $864,000$903,000$814,000 4.3%6.1%403

HAREWOOD $1,091,000$1,119,000$993,000 2.5%9.9%35

HEATHCOTE VALLEY

$807,000$809,000$741,000 0.2%8.9%35

HEIHEI $601,000$614,000$562,000 2.1%6.9%87

HILLMORTON $678,000$700,000$634,000 3.1%6.9%60

HILLSBOROUGH $791,000$794,000$737,000 0.4%7.3%55

HOONHAY $656,000$700,000$624,000 6.3%5.1%159

HORNBY $593,000$616,000$550,000 3.7%7.8%137

HUNTSBURY $1,101,000$1,126,000$1,039,000 2.2%6.0%59

ILAM $946,000$978,000$898,000 3.3%5.3%168

ISLINGTON

$571,000$582,000$526,000 1.9%8.6%43

LINWOOD $485,000$498,000$460,000 2.6%5.4%241

LYTTELTON

1.6%7.8%43

1.4%5.6%183

2.9%10.8%95

SPREYDON $627,000$663,000$612,000 5.4%2.5%196

ST ALBANS $861,000$874,000$829,000 1.5%3.9%395

STROWAN $1,173,000$1,271,000$1,126,000 7.7%4.2%71

SUMNER $1,103,000$1,149,000$1,069,000 4.0%3.2%48

SYDENHAM $554,000$578,000$531,000 4.2%4.3%179

TEMPLETON $806,000$864,000$730,000 6.7%10.4%49

UPPERRICCARTON $690,000$729,000$641,000 5.3%7.6%96

WAIMAIRIBEACH $942,000$952,000$885,000 1.1%6.4%26
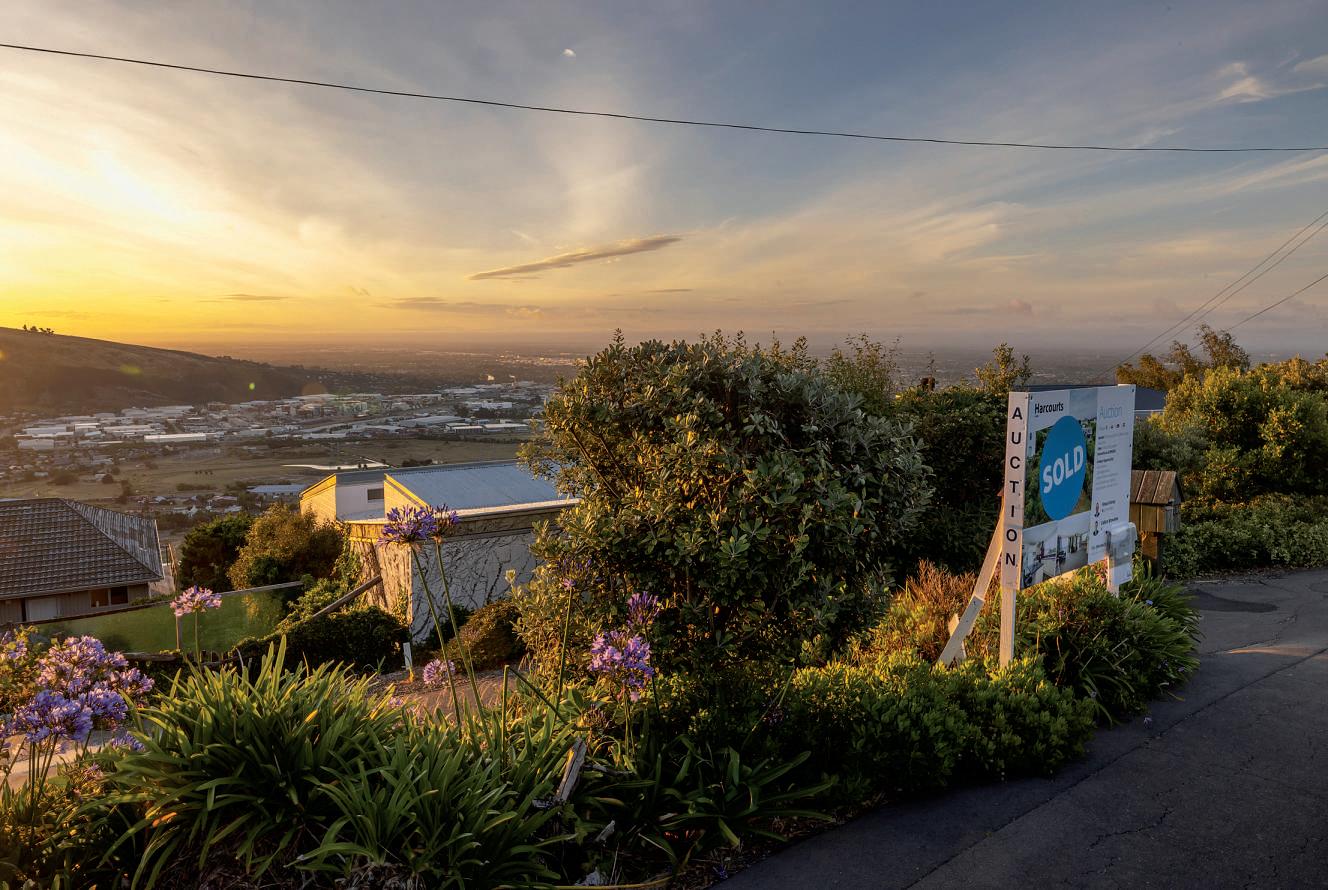
WAINONI $494,000$493,000$462,0000.2%6.9%56

WALTHAM $498,000$510,000$460,000 2.4%8.3%106

WESTMORLAND $1,139,000$1,166,000$1,024,000 2.3%11.2%37

WIGRAM $876,000$903,000$805,000 3.0%8.8%147

WOOLSTON $546,000$551,000$492,000 0.9%11.0%271

YALDHURST $1,056,000$1,074,000$951,000 1.7%11.0%44

ONEROOF VALOCITYHOUSE VALUEINDEX
CHRISTCHURCH'S AVERAGEPROPERTY VALUEISUP4.1%ON LASTYEAR.PHOTO /PETERMEECHAM
HURUNUI $700,000$662,000$613,0005.7%14.2%382 AMBERLEY $733,000$710,000$632,0003.2%16.0%117 HANMERSPRINGS $800,000$756,000$716,0005.8%11.7%91 LEITHFIELD $690,000$670,000$590,0003.0%16.9%33 KAIKOURA$733,000$740,000$668,000 0.9%9.7%106 KAIKOURA $684,000$660,000$607,0003.6%12.7%52 KAIKOURAFLAT $850,000$807,000$745,0005.3%14.1%27 MACKENZIE $794,000$798,000$745,000 0.5%6.6%230 FAIRLIE $530,000$546,000$475,000 2.9%11.6%45 LAKETEKAPO $1,126,000$1,098,000$1,089,0002.6%3.4%51 TWIZEL $748,000$739,000$684,0001.2%9.4%98 SELWYN$965,000$1,000,000$921,000 3.5%4.8%1918 DARFIELD $833,000$874,000$751,000 4.7%10.9%108 DUNSANDEL $812,000$872,000$759,000 6.9%7.0%24 KIRWEE $1,036,000$1,104,000$898,000 6.2%15.4%39 LEESTON $776,000$811,000$702,000 4.3%10.5%80 LINCOLN $1,019,000$1,055,000$912,000 3.4%11.7%316 PREBBLETON $1,321,000$1,381,000$1,176,000 4.3%12.3%122 ROLLESTON $876,000$906,000$863,000 3.3%1.5%904 SOUTHBRIDGE
TIMARU $578,000$581,000$543,000
GERALDINE $587,000$582,000$527,0000.9%11.4%90 CANTERBURY$770,000$789,000$727,000 2.4%5.9%14451 ASHBURTON $613,000$612,000$559,0000.2%9.7%868 ALLENTON $628,000$624,000$549,0000.6%14.4%210 ASHBURTON $508,000$509,000$459,000 0.2%10.7%104 HAMPSTEAD $445,000$448,000$396,000 0.7%12.4%83 HUNTINGDON $1,067,000$1,083,000$1,005,000 1.5%6.2%45 METHVEN $687,000$693,000$616,000 0.9%11.5%91 MOUNT SOMERS $559,000$573,000$534,000 2.4%4.7%23 NETHERBY $552,000$560,000$502,000
RAKAIA $556,000$567,000$515,000
TINWALD $607,000$606,000$545,0000.2%11.4%115 CHRISTCHURCH $765,000$794,000$735,000 3.7%4.1%8276 ADDINGTON $531,000$551,000$513,000 3.6%3.5%128 AIDANFIELD $943,000$942,000$865,0000.1%9.0%68
$653,000$679,000$602,000 3.8%8.5%38 SPRINGSTON $1,005,000$1,064,000$944,000 5.5%6.5%32 TAITAPU $1,466,000$1,562,000$1,314,000 6.1%11.6%38 WESTMELTON $1,370,000$1,445,000$1,221,000 5.2%12.2%89
0.5%6.4%987
1.4%10.0%63
1.9%8.0%67
NORTHWOOD
PAPANUI $752,000$781,000$737,000
PARKLANDS $750,000$760,000$692,000
PHILLIPSTOWN $439,000$458,000$428,000 4.1%2.6%122 REDCLIFFS $1,141,000$1,169,000$1,121,000
REDWOOD $665,000$685,000$620,000
RICCARTON $725,000$775,000$699,000 6.5%3.7%172 RICHMOND $533,000$554,000$503,000 3.8%6.0%120 RUSSLEY $716,000$729,000$671,000 1.8%6.7%49 SAINTMARTINS $727,000$752,000$682,000 3.3%6.6%52 SHIRLEY $641,000$672,000$600,000 4.6%6.8%152 SOCKBURN $619,000$655,000$600,000 5.5%3.2%103 SOMERFIELD $725,000$766,000$697,000 5.4%4.0%146 SOUTHNEWBRIGHTON $589,000$609,000$547,000 3.3%7.7%55 SOUTHSHORE $680,000$704,000$631,000 3.4%7.8%21 LOCATION CURRENT AVERAGE PROPERTY VALUE THREE MONTHS AGO 12 MONTHS AGO QoQ CHANGE YoY CHANGE SETTLED SALES LAST12 MONTHS LOCATION CURRENT AVERAGE PROPERTY VALUE THREE MONTHS AGO 12 MONTHS AGO QoQ CHANGE YoY CHANGE SETTLED SALES LAST12 MONTHS CANTERBURY $770,000 5.9% AVERAGEPROPERTY VALUEYEARONYEARCHANGE 36 OneRoof.co.nz
$757,000$769,000$702,000
MAIREHAU $636,000$645,000$602,000
MARSHLAND $1,076,000$1,120,000$962,000 3.9%11.9%100 MERIVALE $1,484,000$1,549,000$1,473,000 4.2%0.7%127 MOUNTPLEASANT $1,129,000$1,163,000$1,019,000
NEWBRIGHTON $520,000$543,000$481,000 4.2%8.1%170 NORTHNEWBRIGHTON $555,000$568,000$515,000 2.3%7.8%92 NORTHCOTE $582,000$609,000$548,000 4.4%6.2%63
$1,112,000$1,160,000$1,011,000 4.1%10.0%96 OPAWA $781,000$759,000$714,0002.9%9.4%26
3.7%2.0%143
1.3%8.4%179
2.4%1.8%51
2.9%7.3%161

GLENITI

$823,000$806,000$743,0002.1%10.8%72

GLENWOOD $549,000$546,000$509,0000.5%7.9%45

HIGHFIELD $607,000$606,000$550,0000.2%10.4%80

KENSINGTON $441,000$457,000$423,000 3.5%4.3%27

MAORIHILL $567,000$574,000$551,000 1.2%2.9%27

MARCHWIEL

PARKSIDE

PLEASANTPOINT

$514,000$522,000$485,000 1.5%6.0%75

$440,000$446,000$425,000 1.3%3.5%71

$580,000$581,000$527,000 0.2%10.1%36

SEAVIEW $457,000$469,000$443,000 2.6%3.2%47

TEMUKA

WAIMATAITAI

$484,000$496,000$462,000 2.4%4.8%111

$491,000$507,000$472,000 3.2%4.0%44

WATLINGTON $448,000$462,000$444,000 3.0%0.9%28

WESTEND $487,000$488,000$452,000 0.2%7.7%65

WAIMAKARIRI

ASHLEY

$856,000$837,000$762,0002.3%12.3%1523

$1,011,000$985,000$857,0002.6%18.0%20

BURNTHILL $956,000$921,000$819,0003.8%16.7%23

EYREWELL $1,052,000$1,045,000$895,0000.7%17.5%24

FERNSIDE $1,304,000$1,265,000$1,122,0003.1%16.2%30

KAIAPOI $699,000$685,000$633,0002.0%10.4%299

LOBURN

OHOKA

OXFORD

$1,141,000$1,124,000$959,0001.5%19.0%47

$1,508,000$1,465,000$1,264,0002.9%19.3%45

KINMONT PARK $760,000$815,000$829,000 6.7% 8.3%24

MAORIHILL $1,073,000$1,132,000$1,082,000 5.2% 0.8%50

MARYHILL $596,000$638,000$670,000 6.6% 11.0%20

MORNINGTON $575,000$619,000$650,000 7.1% 11.5%59

MOSGIEL $734,000$771,000$768,000 4.8% 4.4%312

MUSSELBURGH $652,000$696,000$700,000 6.3% 6.9%33

NORTHDUNEDIN $756,000$798,000$804,000 5.3% 6.0%48

NORTH EAST VALLEY $552,000$585,000$600,000 5.6% 8.0%71

PORTCHALMERS $555,000$567,000$594,000 2.1% 6.6%22

RAVENSBOURNE $548,000$566,000$575,000 3.2% 4.7%20

ROSLYN $904,000$940,000$938,000 3.8% 3.6%38

SAINTCLAIR $915,000$968,000$933,000 5.5% 1.9%49

SAINTKILDA $512,000$538,000$553,000 4.8% 7.4%119

SAWYERSBAY $659,000$724,000$673,000 9.0% 2.1%32

SHIELHILL $776,000$865,000$850,000 10.3% 8.7%22

SOUTHDUNEDIN $412,000$438,000$455,000 5.9% 9.5%96

TAINUI $612,000$650,000$669,000 5.8% 8.5%23

WAIKOUAITI $506,000$539,000$530,000 6.1% 4.5%36

WAKARI $610,000$643,000$667,000 5.1% 8.5%38

WAVERLEY $780,000$856,000$854,000 8.9% 8.7%36

QUEENSTOWN LAKES$1,884,000$1,883,000$1,651,0000.1%14.1%1287

ALBERTTOWN $1,537,000$1,507,000$1,303,0002.0%18.0%72

ARROWTOWN $2,396,000$2,427,000$2,025,000 1.3%18.3%86

ARTHURSPOINT $1,580,000$1,595,000$1,415,000 0.9%11.7%30

FERNHILL $1,202,000$1,207,000$1,169,000 0.4%2.8%48

FRANKTON $1,130,000$1,129,000$1,084,0000.1%4.2%82

GLENORCHY $1,446,000$1,423,000$1,122,0001.6%28.9%21

JACKS POINT $1,909,000$1,909,000$1,582,0000.0%20.7%134

KELVINHEIGHTS $2,556,000$2,593,000$2,257,000 1.4%13.2%22

KINGSTON $802,000$793,000$697,0001.1%15.1%23

LAKEHAWEA $1,261,000$1,212,000$1,019,0004.0%23.7%47

LAKEHAYES $2,424,000$2,435,000$1,952,000 0.5%24.2%57

LOWERSHOTOVER $1,620,000$1,627,000$1,403,000 0.4%15.5%78

QUEENSTOWN $1,599,000$1,587,000$1,484,0000.8%7.7%139

WANAKA $1,997,000$1,984,000$1,728,0000.7%15.6%341

WAITAKI

$551,000$570,000$514,000 3.3%7.2%561

HAMPDEN $452,000$459,000$417,000 1.5%8.4%22 HOLMESHILL $587,000$606,000$538,000 3.1%9.1%45 KAKANUI $606,000$625,000$563,000 3.0%7.6%27 OAMARU $449,000$462,000$414,000 2.8%8.5%64 OAMARUNORTH $494,000$503,000$458,000 1.8%7.9%131 OTEMATATA $557,000$575,000$513,000 3.1%8.6%21 PALMERSTON $431,000$440,000$405,000 2.0%6.4%42

$426,000$438,000$424,000 2.7%0.5%81 GRASMERE $471,000$484,000$461,000 2.7%2.2%62 HARGEST $534,000$535,000$500,000 0.2%6.8%23

HAWTHORNDALE $477,000$481,000$468,000 0.8%1.9%26 HEIDELBERG $408,000$419,000$396,000 2.6%3.0%52

KINGSWELL $398,000$405,000$387,000 1.7%2.8%60

NEWFIELD $438,000$445,000$433,000 1.6%1.2%55

OTATARA $759,000$753,000$708,0000.8%7.2%80

RICHMOND $487,000$501,000$478,000 2.8%1.9%50

ROCKDALE $431,000$439,000$425,000 1.8%1.4%20

ROSEDALE $714,000$728,000$670,000 1.9%6.6%28

SEAWARDBUSH $933,000$953,000$869,000 2.1%7.4%22

STRATHERN $366,000$380,000$367,000 3.7% 0.3%77

WAIKIWI

$618,000$622,000$590,000 0.6%4.7%80

WAVERLEY $564,000$572,000$545,000 1.4%3.5%40

WINDSOR

WOODEND
WAIMATE $512,000$514,000$462,000 0.4%10.8%161 WAIMATE $498,000$497,000$438,0000.2%13.7%132
$705,000$693,000$625,0001.7%12.8%73 PEGASUS $878,000$851,000$758,0003.2%15.8%175 RANGIORA $724,000$729,000$656,000 0.7%10.4%419 SEFTON $1,017,000$1,008,000$858,0000.9%18.5%24 SWANNANOA $1,260,000$1,251,000$1,070,0000.7%17.8%47 WAIKUKUBEACH $692,000$674,000$608,0002.7%13.8%24
$753,000$759,000$688,000 0.8%9.4%164
SOUTHHILL
WESTON
SOUTHLAND $520,000$525,000$492,000 1.0%5.7%2155 GORE $448,000$460,000$432,000 2.6%3.7%278 EAST GORE $396,000$391,000$346,0001.3%14.5%29 GORE $457,000$479,000$446,000
MATAURA $254,000$249,000$241,0002.0%5.4%47 INVERCARGILL $509,000$518,000$497,000
APPLEBY $323,000$334,000$321,000
AVENAL $495,000$505,000$484,000
BLUFF
CLIFTON
GEORGETOWN
GLADSTONE
GLENGARRY
$537,000$551,000$495,000 2.5%8.5%75
$734,000$748,000$634,000 1.9%15.8%27
4.6%2.5%169
1.7%2.4%1284
3.3%0.6%84
2.0%2.3%25
$324,000$329,000$321,000 1.5%0.9%50
$377,000$381,000$370,000 1.0%1.9%35
$374,000$385,000$369,000 2.9%1.4%40
$617,000$640,000$598,000 3.6%3.2%61
WINTON $603,000$612,000$539,000
LOCATION CURRENT AVERAGE PROPERTY VALUE THREE MONTHS AGO 12 MONTHS AGO QoQ CHANGE YoY CHANGE SETTLED SALES LAST12 MONTHS LOCATION CURRENT AVERAGE PROPERTY VALUE THREE MONTHS AGO 12 MONTHS AGO QoQ CHANGE YoY CHANGE SETTLED SALES LAST12 MONTHS OTAGO$935,000$958,000$887,000 2.4%5.4%4985 CENTRAL OTAGO$883,000$905,000$801,000 2.4%10.2%601 ALEXANDRA $747,000$763,000$686,000 2.1%8.9%128 BRIDGEHILL $867,000$915,000$824,000 5.2%5.2%38 CLYDE $941,000$973,000$804,000 3.3%17.0%32 CROMWELL $943,000$959,000$845,000 1.7%11.6%190 MOUNTPISA $1,300,000$1,328,000$1,150,000 2.1%13.0%29 CLUTHA $447,000$441,000$427,0001.4%4.7%328 BALCLUTHA $443,000$442,000$426,0000.2%4.0%87 KAITANGATA $298,000$285,000$263,0004.6%13.3%21 MILTON $441,000$443,000$432,000 0.5%2.1%56 WAIHOLA $677,000$650,000$658,0004.2%2.9%20 DUNEDIN $679,000$717,000$723,000 5.3% 6.1%2208 ABBOTSFORD $630,000$667,000$695,000 5.5% 9.4%37 ANDERSONSBAY $677,000$724,000$750,000 6.5% 9.7%45 BELLEKNOWES $799,000$856,000$846,000 6.7% 5.6%40 BROCKVILLE $515,000$546,000$567,000 5.7% 9.2%20 CALTONHILL $482,000$510,000$532,000 5.5% 9.4%32 CAVERSHAM $461,000$487,000$511,000 5.3% 9.8%45 CONCORD $585,000$622,000$644,000 5.9% 9.2%27 CORSTORPHINE $610,000$660,000$646,000 7.6% 5.6%35 DUNEDINCENTRAL $717,000$762,000$756,000 5.9% 5.2%55 FAIRFIELD $774,000$809,000$782,000 4.3% 1.0%43 FORBURY $463,000$491,000$513,000 5.7% 9.7%25 GREENISLAND $601,000$635,000$658,000 5.4% 8.7%62 HALFWAYBUSH $647,000$687,000$680,000 5.8% 4.9%34 HELENSBURGH $725,000$771,000$766,000 6.0% 5.4%29 KAIKORAI $587,000$631,000$645,000 7.0% 9.0%39 KARITANE $685,000$751,000$676,000 8.8%1.3%22 KENMURE $624,000$668,000$674,000 6.6% 7.4%41 LOWER SOUTH ISLAND OTAGO$935,000 5.4% SOUTHLAND$520,000 5.7% AVERAGE PROPERTY VALUE YEARONYEAR CHANGE OneRoof.co.nz 37
$576,000$592,000$567,000 2.7%1.6%102 SOUTHLAND $576,000$572,000$509,0000.7%13.2%593 LUMSDEN $368,000$368,000$324,0000.0%13.6%29 MAKAREWA $730,000$730,000$677,0000.0%7.8%21 RIVERTON $653,000$660,000$564,000 1.1%15.8%56 TEANAU $729,000$718,000$645,0001.5%13.0%142
1.5%11.9%90

Onething’scertain, we’ll soon be complaining about rising houseprices again

What cananiconicAucklandradioadteach usaboutthepropertymarket?

Duringthe25yearsthat Ilivedin Aucklandbeforemovingto Hawke’sBay, there werea fewthings thatregularlyprovidedcomfort tome andwhichweresofamiliar as to definethe city. Theseincludedsomeoftheobviousicons– theSky Tower, theharbourbridge, andthe majesty of Rangitoto -buttherewerealsosomelessobvious,butequally reassuringthings, which willalwaysbe“Auckland” inmy memory.Theseincludethepicture frame at Shakespear RegionalPark,thestunningvistafrom almostanyvantagepointalong TamakiDrive,andthe MagnessBenrowradiocommercials.

ForthoseofyououtsideAuckland, Magness Benrowis aniconicAucklandappliancestore,which,foryears, has runa seriesofquirkyradioads featuringtheownerand one of histeam(or,atleast,they didwhen Iwas there).

Theadchangedeveryweekandalwaysfeatured some entertainingstoryorsituationasa backdroptowhatever the“dealoftheweek” was. Itwasinvariablyfunnyand engaging– andthe point,ofcourse,wastocontinueto find newwaysto repackage aconsistentandfamiliar messageofinnovation,concernforthelittleguyand pricecompetitiveness.

Inthisrespect,theMagnessBenrowadshavemuchin commonwiththeroleofthemoreresponsibleproperty commentatorsamongstus.Inthefaceofanavalanche

ofpropheciesofdoomandgloomfrom varioussources,eachtryingtooutdothe otherintheseverityoftheirpredictions,ther fewofuswhohavebeenaroundfora havingseenseveralcyclescomeandgo,aren’tpanicked abouttheprospectsforthemarketinthemediumterm.

Forus,aswithMagnessBenrow,it’smostlyabout repeatingthesamemessageindifferentways–butalways reinforcingthesamebasicpoints.Sadly,it’sadifficult messageto“reinvent”becausethereareonlysomany waystotellpeoplethatthemarketispredictable;thatit isn’tgoingtocrash;thatwe’vebeenherebefore;thatthis difficultperiodwillpass;andthatwe’lleventuallybe complainingaboutrisinghousepricesagain.

Butit alsohappenstobetrue.Weknowwhatcaused thedownturn (highinflation,which requiredextreme Reserve Bank intervention,anddraconianchanges tolendinglaws, whichmadeitalmostimpossible to borrowmoneyfor awhile)– andwe knowthat oneof these(thelendingobstacle)hasbeen partially resolved andthat lendingisgrowingagain.

We alsoknowthattheReserve Bank willeventually gettheinflation bogeymanback undercontrol –wejust don’tknowwhen –andit’sthisthat’satthe heartof our continuingnervousness.Once theReserveBankis confidentthatithastamedinflation,we’llsee interest ratesbegintostabiliseand,depending on theeconomic outlook,even startingtoedge downagain.Once this

willquicklystartto see marketagain.

ilemostofthecountry ealimpactfromthe“correction”and most propertiesarestillworthsubstantiallymorethan they weretwoyearsago, Iknowthatsomepeopleare doingittoughandworriedabouttheimpactofthose interestratesandtheirabilitytopaythe mortgage. For you,the smartapproachistotake chargeofthethings thatyoucancontrol. Theseincludefixingyourmortgage for aperiodthatwill giveyoucertaintywithoutpaying higherratesforlongerthanyouneedto.Thebest advice onthis seems to betofixforeither ayearor18months. Otherstrategiesincludetakingahardlook atyour weeklybudgettoseewhetherthereare thingsthatyou candowithout fornow,talkingto yourbanktosee if there areoptionsforrelieving some of thepressure,and consideringwaystoincreaseyour householdincome overthistime.

I’mnotsuggestingthatanyofthesethingsareeasy todo,and Icertainlydon’twanttotrivialisethe reality ofthestressthatyoumaybe underbutthe medium tolong-termoutlookforyourpropertyiswhatit hasalwaysbeen– itwillalmost certainlybeworth substantiallymorethanitisrightnow.

•AshleyChurchisapropertycommentatorfor OneRoof.co.nzandarealestatebusinessowner. Emailhimatashley@nzemail.com

Connecttoeverythingyoulove withSparkBroadband. Notavailableeverywhere.Oneligiblebroadbandplans. Compatiblesoftware/device required.Sparkand partnertermsapply.Visitwww.spark.co.nz/shop/internet/plans/tolearnmore. COMMENT
There’snoneedtopanic -propertiesarestillworthsubstantiallymore thantheyweretwoyearsago,writes ASHLEYCHURCH 38 OneRoof.co.nz
Get theperfectlook foryourproperty with OneRoof’s Homes We Love. Fromthelatestdesigntrends to renovation tips-and-tricks,there’ssomething foreveryone. Find inspirationat OneRoof.co.nz/homeswelove Brought to youby Be property prepared OneRoof.co.nz 39

1744,London. 1976,New York. 2012,Hawke’s Bay.

Celebrating adecade in Haw and alegacydating back 278

wke’s Bay 8 years.

With over two centuriesofhistory behind the Sotheb yearsofexceptional real estate, in Hawke’sBay.Our local market paired with our unrivaled global reach, c

Justlikethose whocame before us,webring excelle assurancethatyour propertywill be treasured, eleva the rest

Thank youtoall ourclients, suppliers, friends and us in making these first tenyears exceptional.

by’sname,2022marks ten innateknowledgeofthe continuestoset us apart nce, expertiseand an atedand valued above

familiesfor supporting

L R:NarelleMcCormick NatashaBousfield MichaelLock NickyBerr JamesHaggerty, ConnieCawood, RichardPurchas, KikiAbel, ChantéC DebbieDudding PipNorris NickFryer VaughanWilson JacquiTaylor DamianSweetapple, RitaLynch, KassieSwinburne, KatrinaLoach, Sop DarrylBuckley, MarleneNathan,JohnHolmes, LibbyButler, FraserHol
Each office is independently owned and operated. SHB Limited (licensed under the REAA 2008) MREINZ Z
y BrianCawood MaryMassara rasborn, MellisaCloete, PhilQuinney, DarrenvanDeventer SabineDavison hieSheild Barrett, FionaHorne, land

Turn static files into dynamic content formats.

Create a flipbook
Issuu converts static files into: digital portfolios, online yearbooks, online catalogs, digital photo albums and more. Sign up and create your flipbook.