


annual
& Financial statements 20 15 RIC® LOGO DESIGN
report
LIST OF TABLES AND FIGURES ……………………………………………… 2 LETTER OF TRANSMITTAL …………………………………………………… 3 CHAIRMAN’S REMARKS 4 VISION, MISSION AND ORGANISATIONAL STRUCTURE …………… 5 RIC AT A GLANCE 7 THE YEAR IN REVIEW …………………………………………………………… 8 SECTOR REPORTS 9 The Electricity Sector ………………………………………………………… 10 The Water/Wastewater Sector …………………………………………… 16 CUSTOMER SERVICES …………………………………………………………… 18 CORPORATE COMMUNICATIONS ……………………………………… 23 HUMAN RESOURCES/ADMINISTRATION 24 FINANCES OF THE RIC …………………………………………………………… 26 COMMISSIONERS AND MANAGEMENT TEAM 2015 27 FINANCIAL STATEMENTS 2015 ……………………………………………… 29 CONTENTS
LIST OF TABLE AND FIGURES
Table 1: Guaranteed Standards …………………………………………………………………………………………………………………… 11
Table 2: Compliance With Guaranteed Standards, 2015 ……………………………………………………………………………… 12
Table 3: Details of Breaches and Compensatory Payments due under the Guaranteed Standards, 2015 ………… 12
Table 4: Compliance with Overall Standards, 2015 ……………………………………………………………………………………… 13
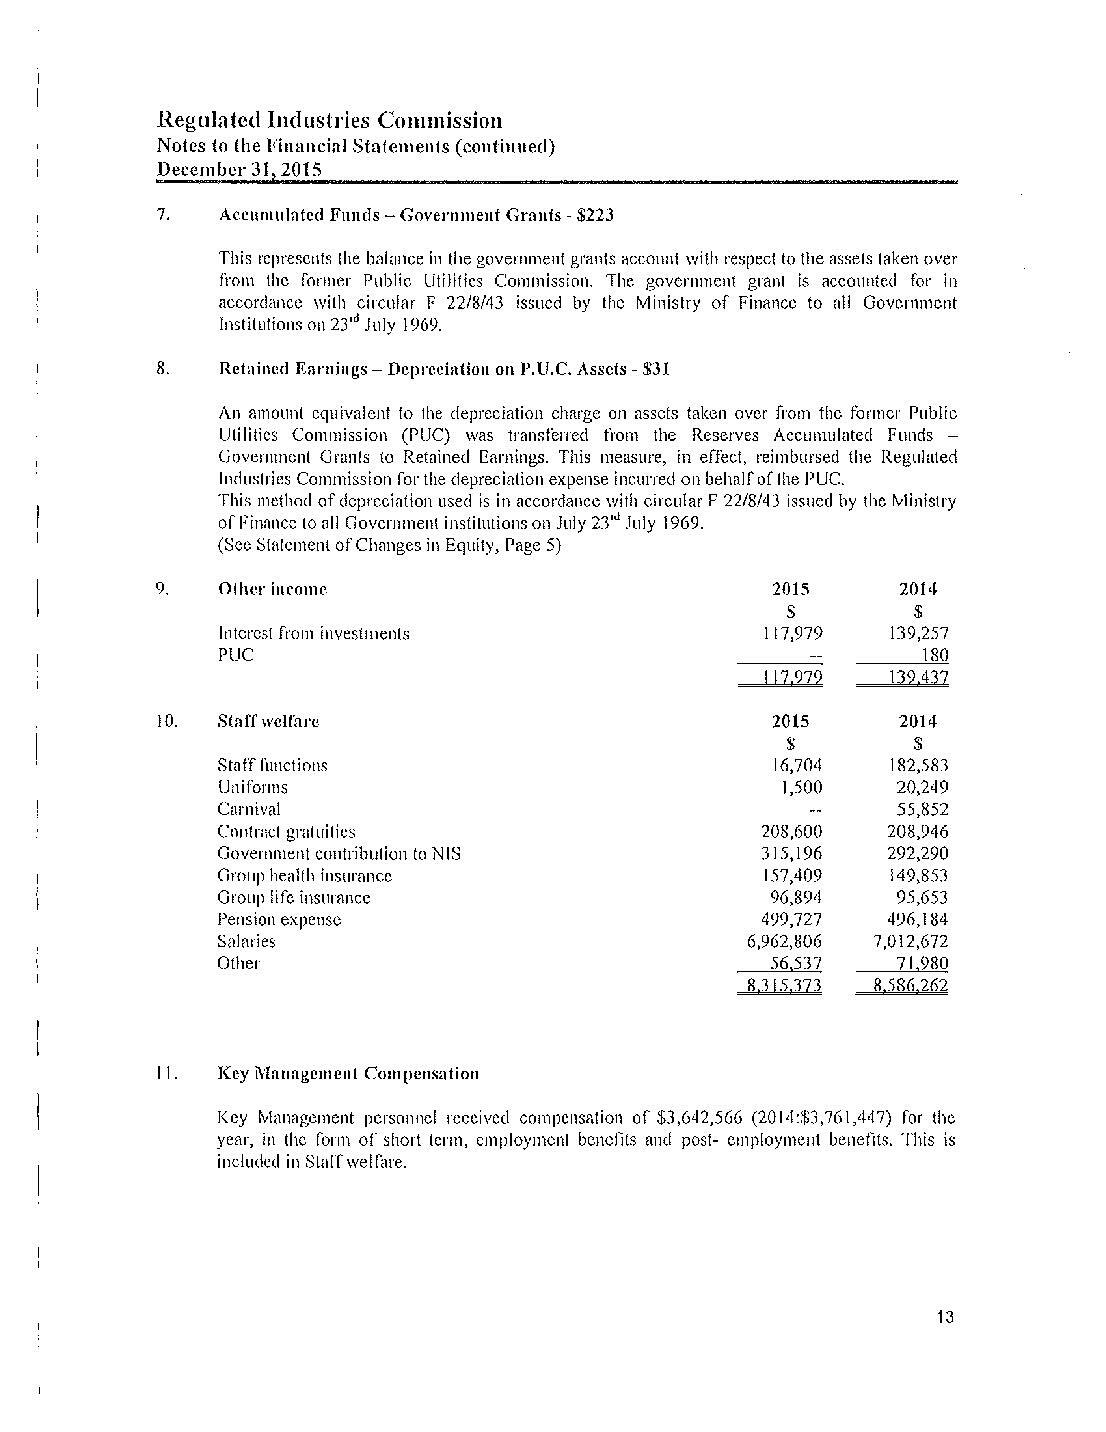
Table 5: ENRMP – Summary Report for Electricity Sector, 2015 15
Table 6: ENRMP – Summary Report for WASA, 2015 17
Table 7: Status of Complaints Received for 2013-2015 18
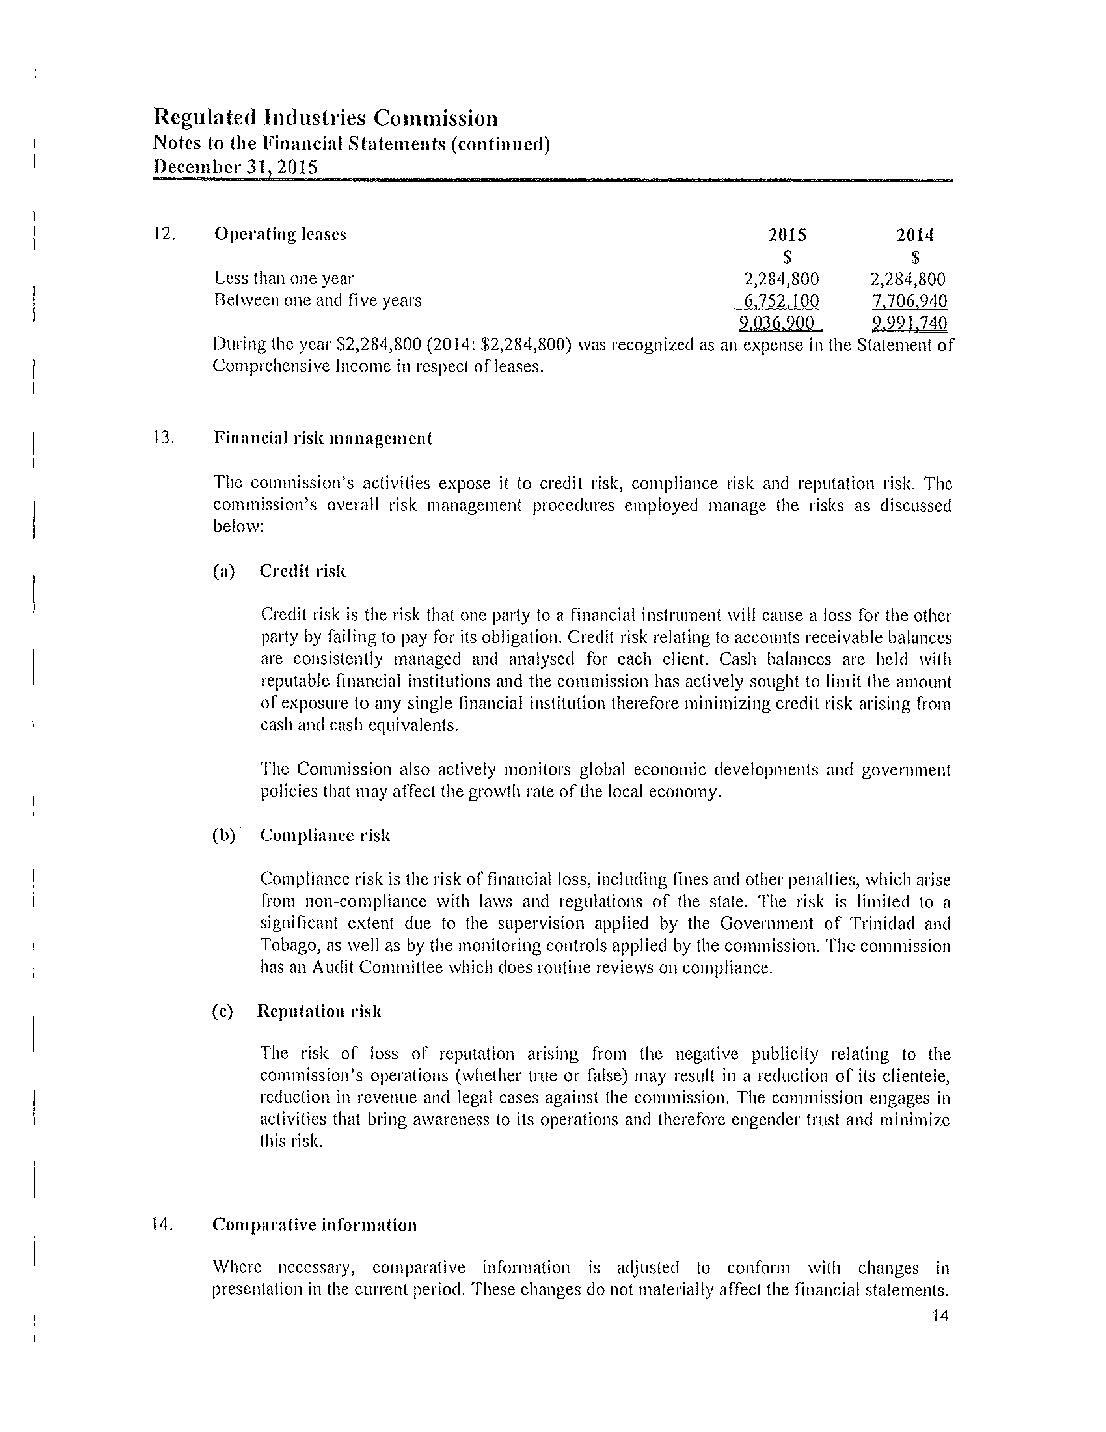
Table 8: Distribution of Complaints Received by Category and Service Provider for the period, 2013-2015 20
Table 9: The top 5 Water Stressed Areas in each Region, 2013-2015 …………………………………………………………… 21
Table 10: RIC’s Internal Performance Standards, 2013 - 2015 ……………………………………………………………………… 22
Table 11: Cess Paid by Service Provider, 2015 ……………………………………………………………………………………………… 26
Table 12: Actual vs Budgeted Expenditure, 2015 26
Figure 1: Status of Complaints Received in 2015 19
Figure 2: Distribution of Complaints in 2015, by Category 19
Figure 3: Distribution of Complaints by Region, 2015 ………………………………………………………………………………… 21
annual
2
regulated industries commission
report 2015
LETTER OF TRANSMITTAL

Senator, The Honourable Robert Le Hunte Minister of Public Utilities One Alexandra Place
#1 Alexandra Street, St Clair Trinidad. W.I.
Dear Minister,
RE: Annual Report and Financial Statements 2015
In accordance with Section 34 of the Regulated Industries Commission (RIC) Act, Chapter 54:73, I have the honour to submit the RIC’s audited Statement of Accounts as certified by the Auditor General and the Annual Report, for the year ending December 31, 2015.
Sincerely, f/Chairman
2015 3
regulated industries commission annual report
CHAIRMAN’S REMARKS

enable the Commission to become even more effective, as it carries out the mandate, as intended by its legislation. As always, these draft proposals to amend the governing legislation were developed based on RIC’s practical experience, current regulatory practices both regionally and internationally and legal precedent.
The Commission also reviewed a number of its internal policies as it recognises the importance of keeping up to date with best practices and changing mores. This year also marked a change in leadership at the Executive level. Mr. Sherman Baksh took up the role of Executive Director, receiving the reins of stewardship from Mr. Glenn Khan, Deputy Executive Director. A number of new recruits also joined the organisation this year, injecting new life into a cross section of departments.
The work of the Commission was interrupted during this year owing to the expiry of the respective terms of appointment of all Commissioners, with the exception of the Chairman, in October 2015.
Notwithstanding this interruption, a number of important decisions were taken to ensure that the work of the Commission could continue despite the expiration of the said terms of appointment.
The service providers which fall under the RIC’s jurisdiction operate in an environment which is demanding on all aspects of their operations, as they seek to undertake projects and programmes intended to expand service delivery and to satisfy customers’ needs. It is my continued view that legislative reform of the Regulated Industries Commission (“RIC”) Act is necessary for the utility sectors and the public to benefit from effective regulation and to incorporate positive developments within the regulatory landscape.
The Commission has reviewed its legislation in order to draft fresh proposals to amend the RIC Act. These proposals are intended to strengthen the legislative framework within which the RIC operates and would
As always, the RIC was represented at the 13th Annual Conference of the Organisation of Utility Regulators held in the Turks and Caicos Islands in October 2015.
The theme of the Conference was “Facilitating a Dynamic Regulatory Environment” which as can be seen, mirrored the activities of the Commission during the year 2015, given the reviews and changes contemplated for the organisation.
I would like to thank my fellow Commissioners for the support they have provided to me as Chairman. I acknowledge the contributions of Ms. Liana RamsahaiAchan, as former Deputy Chairman, with Ms. Debra Singh-Khan, Ms. Sunita Ganpat, Mr. Mark Dolsingh and Mr. Niegel Subiah as former Commissioners.
I wish to also commend the staff of the Commission for their dedication, diligence and continued commitment to the organization. f/Chairman

regulated industries commission annual report 2015 4
Dr. Anne-Marie Mohammed, Chairman
VISION
To be a world-class regulator

m ISSION STATE m ENT
To ensure the promotion of the highest quality of utility services at fair and reasonable rates while building a credible regulatory regime that responds adequately to stakeholders concerns and also to ensure fairness, transparency and equity in the provision of utility services throughout the country.
ORg ANI zATIONA l STR ucT u RE
The Executive Director is responsible for the supervision and direction of the work and staff of the Commission. The staff provide a range of services to support the Commission in all aspects of its work.
industries commission annual report 2015 5
regulated
RIC® LOGO DESIGN
regulated industries commission annual report 2015 6
STRUCTURE Legal/Corporate Secretary Executive Director Executive Assistant Executive Assistant Board of Commissioners Chairman Manager, Human Resources and Administration Administrative Assistant Asst. Executive Director Technical Operations Asst. Executive Director Economics & Research Compliance Analyst (2) Standards Engineer (2) Tariff Analyst (2) Senior Tariff Analyst (2) Librarian Senior Utility Accountant Utility Accountant (2) Accounts Officer Customer Services Manager Accounts Clerk Senior Customer Service Officer Customer Service Officer (2) Administrative Assistant Human Resource Assistant Clerical Assistant Receptionist / Tel. Operator Messenger / Driver Office Attendant IT Manager IT Specialist Corporate Communications Manager Administrative Assistant Chief Financial Officer Deputy Executive Director Administrative Assistant
ORGANIzATIONAL
RIC AT A GLANCE
This, the thirteenth report of the Regulated Industries commission, covers the activities of the RIc for the period January 1st to December 31st, 2015.
The Regulated Industries Commission Act, No. 26 of 1998, established the Regulated Industries Commission (RIC) as a body corporate, with the responsibility for regulating the following service providers:
• The Water and Sewerage Authority (WASA);
• The Trinidad and Tobago Electricity Commission (T&TEC);
• The Power Generation Company of Trinidad and Tobago (PowerGen); and
• Trinity Power Limited (formerly InnCogen).
Functions oF the Ric
Section 6 of the RIC Act grants onto the RIC the following powers and functions, inter alia:
• advise the Minister on matters relating to the operation of the Act including the granting of licences;
• establish the principles and methodologies by which service providers determine rates for services;

• carry out periodic reviews of the rating regimes of service providers;
• carry out studies of efficiency and economy of operation and of performance of service providers and publish results thereof;
• monitor service providers and conduct checks to determine their compliance with the standards of service; and
• investigate complaints by consumers, of their failure to obtain redress from service providers in respect of rates, billings and unsatisfactory service and facilitate relief where necessary.
Furthermore Section 6 (3), the RIC Act places direct functional responsibility upon the RIC to have regard to the public interest, namely:
• to ensure maximum efficiency in the use and allocation of resources and that services are reliable and provided at the lowest possible cost;
• to ensure equal access by consumers to service and the fair treatment of consumers and service providers who are similarly placed;
• to ensure non-discrimination in terms of service access, pricing and quality; and
• to ensure that current national environmental policies are adhered to.
industries commission annual report 2015 7
regulated
THE YEAR IN REVIEW
In 2015, the RIC continued its review of the RIC Act and its engagement with the Ministry of Public Utilities (MPU), with the aim of proposing appropriate amendments to the said Act. This became necessary as over the course of time, certain limitations arose with respect to the parent legislation which have negatively impacted the work of the Commission. The amendments that are being contemplated include enhancement of the RIC’s coercive and enforcement powers and making certain regulatory instruments available for use in the regulation of the Sectors under its purview. The RIC is also seeking legislative amendments to enable the regulation of new services and service providers, as well as improve its consumer protection functions and clarify its rate setting powers.
The RIC continued its monitoring of the quality of service provided by two of the service providers under its purview, more specifically, the Trinidad and Tobago Electricity Commission (T&TEC) and the Water and Sewerage Authority (WASA). In the case of T&TEC, the RIC established Quality of Service Standards which are minimum standards that T&TEC are expected to meet in terms of service delivery. In 2015, T&TEC achieved 99% compliance in seven (7) out of the eight (8) categories under the Guaranteed Standards Scheme (GSS) and there was a noteworthy 78% reduction in the number of breaches under Guaranteed Electricity Standard (GES) 1 - Response and Restoration time. With respect to the Overall Standards, T&TEC achieved above 94% compliance in four (4) out of seven (7) categories. The RIC noted that T&TEC had difficulty achieving a similar level of compliance with the other three Overall Standards including street light maintenance, responding to customer queries and notifying customers of receipt of their GES 1 claims. In the case of WASA, the RIC developed similar Quality of Service Standards however, these were not implemented previously and the process of reviewing these Standards commenced in 2015. Notwithstanding, the RIC previously implemented several measures to assist in monitoring the service
provided by WASA, including the Emergency Notification and Response Management Plan, which continued to be utilized in 2015.
One of the functions of the RIC that is aimed at protecting consumers’ interests, is the investigation of complaints by consumers upon their failure to obtain redress from service providers with respect to rates, billing and unsatisfactory service. In 2015, the RIC received over 2,200 complaints, the majority of which were lodged against WASA. The RIC was able to resolve 88% of the complaints received, most of them in favour of the customer. Seventy (70) customers benefitted from the recovery of TT$530,000 in 2015, of which 85% was to WASA’s account and the remainder attributed to T&TEC.
The RIC continues to explore strategies aimed at increasing public awareness and improving public education on the role of the RIC as an economic regulator and how the public can benefit from its services. External engagement with the public was executed through a multi-faceted approach and one major conduit was the Outreach Programme (OP), which has both public awareness/education and complaintsredress components. A total of thirteen (13) outreach programmes were conducted across Trinidad and Tobago in 2015.
In July 2015, the RIC commenced a new strategic planning exercise as its last Strategic Plan expired at the end of 2014. With the assistance of external consultants, the RIC’s Strategic Planning team comprising Management and Staff have made considerable progress and have developed a draft Plan with a strategic focus on achieving operational and service excellence. At the end of 2015, the draft Plan was being reviewed and it is envisaged that the Strategic Plan would be completed shortly.
regulated industries commission annual report 2015 8
SECTOR REPORTS
RIC is the economic regulator of the water, wastewater and electricity sectors in Trinidad and Tobago. One of its main functions as economic regulator is to ensure that the service providers in these sectors deliver an acceptable quality of service to customers at a reasonable cost, while operating on such terms that would allow them to earn sufficient return to meet their efficient expenditure and also finance necessary investment.

regulated industries commission annual report 2015 9
THE E l E c TRI c ITY SECTOR THE WATER / WASTEWATER SECTOR
THE E l E c TRI c ITY SECTOR
The electricity sector consists of a governmentowned, monopoly electric utility, the Trinidad and Tobago Electricity Commission (T&TEC), which purchases bulk power from three (3) independent power producers (IPPs) and delivers electricity to customers through its transmission and distribution network. T&TEC sells electricity on a retail basis to residential, commercial and industrial customers. The number of customer accounts totalled over 450,000 at the end of 2015, with residential customers accounting for more than 90% of that number. However, industrial and commercial customers account for roughly 70% of total electricity demand. The three independent power producers have a combined generating capacity of over 2,200 megawatts (MW), as recorded at the end of 2015. T&TEC also has its own generating assets located in Tobago, with a capacity of 85 MW that is used to supply electricity to the island. Electricity generation in Trinidad and Tobago is primarily produced from natural gas that is sourced locally and T&TEC sells over 8,000 gigawatt hours (GWh) annually.
QUALITY OF SERVICE STANDARDS FOR
T&TEC
The RIC prescribes and publishes Quality of Service Standards (QSS) and monitors service providers to determine compliance with these standards. The QSS for the Electricity Transmission and Distribution Sector were first implemented in April 2004, and subsequently revised and published in the Trinidad and Tobago Gazette in December 2009. These standards comprise both

Guaranteed Standards and Overall Standards, and apply to the operation of T&TEC. Guaranteed Standards are those that set service levels which must be met by the service provider for every individual customer, whereas Overall Standards cover broader areas of service and generally relate to the reliability of service affecting a group of customers. Table 1 presents a description of the Guaranteed Standards, the required performance units, and the compensatory payment levels for each standard.
T&TEC’S PERFORmANCE UNDER GUARANTEED STANDARDS
There are eight guaranteed standards for T&TEC, and at this time, all but the first (GES 1) carry automatic compensatory payments for breaches1 of the guaranteed standards. T&TEC’s performance under the guaranteed standards for 2015 is presented in table 2.
Generally, T&TEC’s performance under the guaranteed standards improved in 2015, as there was a 77% reduction in the number of breaches against the number recorded in 2014. A significant reduction in the number of breaches occurring under Guaranteed Standard, GES 1 (Response and Restoration Time) was the main contributor to this improvement. However, GES 1 still recorded the largest number of breaches (96%) in 2015. Generally, compliance rates were maintained at the previous levels across all the standards except GES 8 (Payments Owed under Guaranteed Standards), where performance continues to be low.
1 A breach occurs for each incidence of non-compliance of the stipulated level of performance for a standard by the service provider.
regulated industries commission annual report 2015 10
Table 1: Guaranteed Standards
code Service Performance
Restoration of supply after unplanned outage on the distribution system.
Time for restoration of supply to affected customers
Within 10 hours
Payments
$60 (residential) $600 (non-residential)
For each further 12 hr period $60 (residential) $600 (non-residential)
Billing Punctuality (New customers)
Time for first bill to be mailed after service connection:
(a) Residential (b) Non-Residential
60 days 30 days
Reconnection of service after payment of overdue amounts or agreement on payment schedule
Making and keeping appointments
Time to restore supply after payment is made (All customers)
Where required, appointments will be made on a morning or afternoon basis
Investigation of Voltage Complaints
Responding to billing and payment queries
Time to visit, correct problem and notify affected customers
Provide a substantive reply
Within 24 hours
24 hours notice of inability to keep an appointment with customers.
Within 24 hours, Correct within 15 working days.
Within 15 working days
$50 for both residential and nonresidential Refund of reconnection fee for both residential and non-residential
$50 for both residential and nonresidential
$50 (residential) $600 (non-residential)
$50 for both residential and nonresidential
GES 7
GES 8
New Connection of supply
Payments owed under guaranteed standards
Service drop and meter to be installed
Time to credit compensatory payment.
Within 3 working days
Within 30 working days for nonresidential and 60 days for residential.
$50 for both residential and nonresidential
$50 for both residential and nonresidential
regulated industries commission annual report 2015 11
Required
Description measure Performance units Per customer GES1 GES2 GES3 GES4 GES5 GES6
Table 2: Compliance with Guaranteed Standards, 2015
2014 2013 compliance Rate (%)
and Restoration Time after unplanned (forced) outages on the distribution system. Billing Punctuality (new customers) Reconnection After Payment of Overdue Amounts or Agreement on Payment Schedule Making and Keeping Appointments
Investigation of Voltage Complaints Responding to Billing and Payment Queries.
New Connection of Supply Payments Owed under Guaranteed Standards
Time for restoration of supply to affected customers – within 10 hours
Time for first bill to be mailed after service connection: (a) Residential – within 60 days (b) Non-Residential –within 30 days
Time to restore supply after payment is made – within 24 hours
Where required, appointments will be made on a morning or afternoon basis
(i) Response – All voltage complaints to be responded to within 24 hours. (ii) Rectification – All voltage complaints to be rectified within 15 working days.
Substantive reply within 15 working days.
Service drop and meter to be installed within 3 working days.
Time to credit compensatory payment: Residential – within 30 working days Non-Residential – within 60 working days
99.90 99.96 96.90 99.96 100.0 99.9 99.7 100.0 99.9 0.0 N/A
99.9 99.4 92.5 99.9 100.0 99.9 100.0 100.0 99.5 0.0 0.0
regulated industries commission annual report 2015 12 Standard Number of Penalty minimum Payment Total Number of claims Total Payments Breaches Payment ($) Due ($) Submitted/Processed made ($) Table 3: Details of Breaches and Compensatory Payments due under the Guaranteed Standards, 2015 GES 1 1,524 60 91,440 1 60 GES 2 8 50 400 8 400 GES 3 11 118 1,298 11 1,298 GES 4 0 50 0 0 0 GES 5 9 50 450 7 350 GES 6 0 50 0 0 0 GES 7 18 50 900 3 150 GES 8 18 50 900 2 0 TOTAl 1,588 95,388 32 2,258 code Service Description Performance measure GES1 GES2 GES3 GES4 GES5 GES6 GES
GES
7
8
Response
99.5 99.1 98.6 99.9 100.0 99.7 99.1 100.0 99.8 1.0 N/A 2015
T&TEC is not yet able to identify the individual customers who experienced breaches under GES 1 due to existing limitations with its outage management system. Hence, customers are still required to submit claims for breaches under this standard. The RIC estimates that at least $95,388 would have been due in compensatory payments to customers, if claims were submitted/processed for all the breaches that occurred in 2015. Table 3 provides more details.
T&TEC’S PERFORmANCE UNDER OVERALL STANDARDS
Overall Standards cover areas of service where it is not appropriate or feasible to give individual guarantees, but where the expectation of stakeholders is that the utility will provide pre-determined minimum levels of service. These seven standards generally relate to the reliability of
service affecting a group of customers. Compliance rates for T&TEC’s performance under the overall standards during 2015 are presented in table 4.
As was the case in 2014,T&TEC maintained full compliance under OES 1 (Frequency of Meter Reading), OES2 (Billing Punctuality) and OES 7 (Notifying Customers of Receipt of Claim under Guaranteed Standard GES 1). There was a marginal improvement in performance under OES 3 (Responding to Meter Problems), OES 4 (Prior Notice of Unplanned Outages) and the final position under OES6 (Response to Customer Queries/Requests). However, there was a decline in performance under the initial response of OES 6. Performance under OES 5 (Street Lights Maintenance) worsened for street light maintenance and improved for highway lights maintenance.
Table 4: Compliance with Overall Standards, 2015 90% of industrial meters should be read every month 90% of residential and commercial meters read according to schedule 98% of all bills to be mailed within ten (10) working days after meter reading or estimation
Responding to Meter Problems Prior Notice of Planned Outages Street Lights Maintenance
Visit or substantive reply within 10 working days 95% of the time.
3 days advance notice of planned outages 100% of the time
Street Lights – within 7 working days Highway Lights – within 14 working days
compliance Rate (%)
2015 2014 2013
Response to Customer Queries/ Requests (written)
Notifying Customers of Receipt of Claim under Guaranteed Standard GES 1
Time to respond after receipt of queries: Initial Response – within 10 working days
Final Position – within 30 working days
100% of customers to be notified of receipt of claim within 10 working days.
100.0 100.0 100.0 94.7 96.9 40.5 88.5 84.2 45.9 100.0
100.0 100.0 100.0 87.6 91.2 50.1 85.6 95.2 34.8 100.0
regulated industries commission annual report 2015 13
Service Description
code
Required Performance measure OES1 OES2 OES3 OES4 OES5 OES6 OES7 100.0 100.0 100.0 85.5 97.2 70.2 90.7 89.6 76.5 100.0 Frequency of Meter Reading Billing Punctuality
T&TEC’S PERFORmANCE
UNDER ThE QUALITY OF SERVICE STANDARDS
The Guaranteed Standards Scheme was designed to encourage T&TEC to focus on improving the quality of service delivered to customers in the specified areas. This is the sixth year for which there has been automatic compensation for non-compliance of all the Guaranteed Standards, except GES1. T&TEC’s performance with respect to the processing of automatic payments improved significantly during 2015. In 2015, T&TEC paid 56% of the automatic compensatory payments on time, compared to only 26% in 2014. T&TEC has assured that all affected customers are eventually compensated, however the policies and systems involved in processing these compensatory payments still need to be revised and improved by T&TEC.
T&TEC is in the process of implementing an outage management system. This system will allow the utility to identify breaches under GES 1, and facilitate the implementation of automatic compensation to affected customers. T&TEC indicated that a pilot program has been implemented in the Central Distribution Area, and there will be a full roll-out to all distribution areas by the end of 2016.
The RIC is currently reviewing the QSS with plans to implement revised QSS in 2016. This process will not only review the individual standards, but also critically examine the existing processes and methods employed with respect to monitoring and enforcement.
ELECTRICITY SECTOR REPORTING UNDER ThE EVENTS NOTIFICATION AND RESPONSE mANAGEmENT PLAN
The RIC requires service providers under its purview to report on events that may have a significant impact on their ability to provide service to their customers. The RIC published the document “Event Notification and Response Management Plan (ENRMP)” in May, 2004 to provide guidance to service providers (SPs) regarding the appropriate notification to the RIC of incidents and events which have affected, or are likely to have an adverse effect on, a large number of customers.
In the electricity sector, an event, as classified under the ENRMP, may include events leading to the risk/loss of life or injury to persons, any occurrence affecting the health or safety of the public or employees, any major failure of electrical and mechanical equipment, and the significant and unexpected loss of the supply of electricity or deterioration in the quality of the electricity supply.
There are three (3) SPs in the electricity sector that are required to report such events to the RIC as soon as they occur, as well as to notify affected customers about the duration and extent of the impact. These are the Trinidad & Tobago Electricity Commission (T&TEC), Power Generation Company of Trinidad & Tobago (PowerGen) and Trinity Power Limited (TPL). There is another independent power provider to T&TEC, the Trinidad Generation Unlimited (TGU), however, this company does not currently fall under the purview of the RIC and is not required to report under the ENRMP.
The SPs reported a total of twenty (20) events for 2015 which was 100% greater than that reported for 2014. Most of the events reported in 2015 were as a result of the loss of electrical supply to large numbers of customers. The total number of events reported were comprised of the following: 60% were major electricity outages (12 events), 20% were house fires (causes still to be determined) and damages of T&TEC’s plant and customers’ property by third party (4 events), 10% were fatalities caused by electrocution (2 events) and 10% were related to equipment mal-operation (2 events).
There were twelve (12) significant unplanned electrical outages in 2015 which affected large numbers of T&TEC’s customers as compared to six (6) in 2014. The most impactful of these events occurred on December 28, 2015 when the TGU Power Station in La Brea became separated from the electricity grid as a result of a nearby fault on the grid. This resulted in the partial loss of electrical supply to T&TEC, which affected approximately 130,000 customers throughout Trinidad and Tobago. These customers experienced outages of different durations as supply was gradually restored throughout the country. The electricity supply was restored to all affected customers within two hours and twelve minutes of the incident. Three (3) of the unplanned outages were related
regulated industries commission annual report 2015 14
to equipment malfunctioning at PowerGen’s Port of Spain B Station, where two (2) of those outages occurred in December 2015 as steps were being taken leading up to the planned de-commissioning of its power station, which was scheduled to take place in January 2016.
T&TEC reported two (2) incidents in which persons were electrocuted in 2015. One (1) fatality resulted when a person made indirect contact with T&TEC’s overhead lines in Arima, Trinidad while road paving works were being carried out. The tray of a truck came into contact with the T&TEC 12kV line when it breached the safe clearance of the 12kV line above the roadway. The victim
was electrocuted while operating the controls of another vehicle that made contact with the truck. The other fatal incident involved a victim who was electrocuted at home, and did not involve T&TEC’s infrastructure. There was one (1) reported non-fatal incident involving a T&TEC worker in 2014 in which he was severely burnt during the course of his duties. The worker remained hospitalized since that injury and passed away during this year from medical complications.
A summary of the events reported in the electricity sector for 2015 is shown in table 5 below.
2015 15
regulated industries commission annual report
% TYPE OF EVENT 1st Qtr 2nd Qtr 3rd Qtr 4th Qtr TOTAl of Total T&TEc Powergen TPl Table 5: ENRMP – Summary Report for Electricity Sector, 2015 No. of reports Fatalities 0 0 2 0 2 10% 2 0 0 Equipment Damage/ Mal-operation 0 0 0 2 2 10% 0 2 0 Electrical Outages 0 4 3 5 12 60% 12 0 0 Other 1 1 1 1 4 20% 4 0 0 Total No of Events Reported 1 5 6 8 20 100% 18 2 0 % of Total 5% 25% 30% 40% 100% 90% 10% 0%
THE WATER / WASTEWATER SECTOR
The water/wastewater sector consists of a government-owned, monopoly utility, the Water and Sewerage Authority (WASA), which is solely responsible for the production, transmission and distribution of potable water, as well as for the treatment of non-industrial wastewater, in Trinidad and Tobago. WASA produces 83% of the water that it sells to its customers from surface sources and wells. The remaining 17% is sourced from two privately-owned desalination plants.

QUALITY OF SERVICE STANDARDS FOR WASA
One of the mandates of the RIC under the Act is to prescribe and publish Quality of Service Standards (QSS) and monitor service providers to determine compliance with these standards. The RIC has drafted QSS for WASA and is in the process of revieiwing same. Once this is completed, the RIC will liaise with the Ministry of Public Utilities to have these published in the Trinidad and Tobago Gazette.
mAjOR C APITAL WORkS IN ThE WATER/ WASTEWATER SECTOR
Construction works began on two wastewater projects under a multi-phase wastewater rehabilitation programme funded by a loan of US$546.5 million from the Inter-American Development Bank (IDB). In April 2015,
WASA launched the Malabar Wastewater Project, which involves the construction of a US$96 million state-of-theart Wastewater Treatment Plant and Collection System to serve 100,000 persons. The plant has a treatment capacity of 40 million litres per day, and is being constructed by Sinohydro Corporation Limited of China. In May 2015, ACCIONA Agua of Spain, in partnership with Atlatec of Mexico, began work on the San Fernando complex. This project includes the construction of a 45 million litres per day Wastewater Treatment Plant and the laying of a network of sewerage piping. The project costs US$102 million and will serve 111,600 persons.
WATER/WASTEWATER SECTOR REPORTING UNDER ThE EVENTS NOTIFICATION AND RESPONSE mANAGEmENT PLAN
In the water utility sector, an event, as classified under the ENRMP, may include a major reduction in the amount of water provided to customers, a significant impairment in the quality of water supplied, or an activity affecting the health or safety of customers or employees. The Water and Sewerage Authority of Trinidad and Tobago (WASA) is required to report such events to the RIC as soon as they occur, as well as to notify affected customers about the extent and duration of the impact.
regulated industries commission annual report 2015 16
WASA reported 36 events for the year 2015, representing an average of 9 events per quarter. The number of events reported for 2015 was 2.7% less than that reported for 2014. Most of the events reported in 2015 resulted in a significant loss of water supply to a large number of customers. Of the total number of events, 30.6% were the result of capital improvement works, 25% were due to emergency repairs, 25% resulted from maintenance activities and 8.3% were due to reduction in the amount of water supplied by desalination plants.
A summary of the number of events reported in 2015 by WASA is shown in the table 6 below.
Table 6: ENRMP – Summary Report for W ASA , 2015
Maintenance 3 1 2 3 9 25 2.25 Reduction in Supply from Desalination Plants 0 0 1 2 3 8.3 0.75 Emergency Repairs 2 3 2 2 9 25 2.25
Capital improvement works 4 3 3 1 11 30.6 2.75
Excessive turbidity due to rainfall 0 0 0 0 0 0 0
Other 1 1 1 1 4 11.1 1
Total No of Events Reported 10 8 9 9 36 100 9
regulated
commission
2015 17
industries
annual report
% AVERAgE
TOTAl
TYPE OF EVENT 1st Qtr 2nd Qtr 3rd Qtr 4th Qtr
of Total Per Qtr
CUSTOMER SERVICES
Investigating complaints and facilitating relief, where necessary, is one of the RIC’s core functions and this is achieved by investigating complaints from consumers regarding their failure to obtain redress from the Water and Sewerage Authority (WASA) and the Trinidad and Tobago Electricity Commission (T&TEC) with respect to rates, billings and unsatisfactory service.
In 2015, the RIC received 2,231 complaints as shown in Table 7, which represented a seven percent (7%) decrease in the number of complaints received when compared to 2014. These complaints were filed by 1,334 customers, 64% of whom accessed the service of the RIC for the first time. The RIC was able to maintain a relatively high resolution rate in 2015, having resolved 1,952 or 88%
The RIC has a statutory responsibility to ensure the fair treatment of consumers and service providers similarly placed. The RIC ensures that this is done through an objective assessment of each complaint. In 2015, 1,893 or 97% of the complaints that were resolved by the RIC, were in the favour of customers, as indicated in Figure 1.
The top three (3) complaint categories reported to the RIC in 2015 were Interruption in Pipe Borne Supply, Streets Lights - Repair & Installation and Request for Truck Borne Supply, which accounted for 728 (33%), 551 (25%) and 368 (17%) complaints respectively, as shown in Figure 2.
The disaggregation of complaints by SPs reveal that Street Lights - Repair & Installation, Request for Service
Table 7: Status of Complaints Received for 2013-2015
Status 2013 2014 2015 % change
Number of complaints brought forward 697 467 521 12%
Number of complaints received 2469 2390 2231 -7%
Number of complaints withdrawn 36 20 14 -30%
Number of complaints resolved 2176 2042 1952 -4%
Number of complaints unresolved 257 328 265 -19%
R ESO lu TION RATE 89% 86% 88% 2%
No. of outstanding complaints resolved 487 274 397 45%
Total number of complaints resolved 2663 2316 2349 1%
Total number of complaints outstanding 467 521 389 -25%
of the complaints received. There was also a decrease in the number of complaints withdrawn, which declined from twenty (20) in 2014 to fourteen (14) in 2015. There were several reasons for customers withdrawing their complaints including the resumption of service and/or the resolution of the matter between the time the complaint was lodged and RIC’s intervention in the matter and, in some cases, there was a lack of required documentation from the customer for the RIC to process their complaint.
and the category “Other”, which includes such complaints as tree trimming and sparking wires, were the most reported complaints against T&TEC for 2015. As shown in Table 8 below, they accounted for 66%, 9%, and 5% of the complaints respectively for this service provider. In addition, the category of Street Lights – Repair & Installation recorded the highest percentage increase of 111% when compared to 2014. This may have been attributable to a significant increase in the number of Street Lighting complaints due to challenges faced by
regulated industries commission annual report 2015 18

regulated industries commission annual report 2015 19 Number of complaints 1893 2000 1800 1600 1400 1200 1000 800 600 400 200 0 Resolved in favour of Customers 59 265 Unresolved Status
Complaints
14 Withdrawn Resolved
favour of Utilities Inadequate Supply 2% Interruption in Pipe Borne Supply 33% Leaks 5% Request for Truck Borne Supply 17% Billing Query 5% Road Restoration 1% Street Lights - Repair & Installation 25% Request for Service 4% Power Outages 1% Poles - Relocation & Removal 1% Other 3% Lines - Removal/ Relocation/ Repair 1% High/ Low Voltage 1% Damaged Appliances 1%
Figure 1: Status of
Received in 2015
in
Figure 2: Distribution of Complaints in 2015, by Category
T&TEC’s Public Lighting Department (PLD) to repair streetlights in a timely manner.
An analysis of WASA complaints indicated that Interruption in Pipe-Borne Supply, Request for TruckBorne Supply and Leaks were the most reported complaints for 2015 and accounted for 52%, 26% and 8% respectively of the total number of complaints for WASA. The number of complaints for all of the categories showed significant decreases when compared to 2014. The Road Restoration category reflected the largest percentage decrease of 60% in 2015.
The number of complaints received by the RIC was disaggregated by geographic location and is shown in Figure 3.
The RIC reviewed the data in relation to complaints received for 2015 to determine which areas in the four (4) geographic regions in Trinidad were considered water stressed (worst served). This was determined by the accrual of all Interruption in Pipe-Borne Supply, Request for Truck-Borne Supply and Inadequate Water Supply complaints. Table 9 indicates the five (5) top areas (City/ Town/Village) that are most affected in each region. The record shows that in the Central Region, complaints from Claxton Bay and Chaguanas decreased by 34% and 33% respectively, while complaints from Tortuga increased by 167%. In the North East Region, the number of complaints from Arima and Arouca decreased by 22% and 52% respectively. A review of the complaints from the North West Region, showed an increase in complaints from Santa Cruz by 6%, while those from San Juan and
regulated industries commission annual report 2015 20
Service complaint category 2013 2014 2015 % change Provider Table 8: Distribution of Complaints Received by Category and Service Provider for the period, 2013-2015
High
Low Voltage
Lines
Removal/relocation/repair
T&TEC Billing Query 41 33 33 0% Damaged Appliances 59 40 23 -43%
/
26 34 33 -3%
-
57 39 29 -26% Other 45 55 39 -29% Poles - Removal & Relocation 40 35 29 -17% Power Outages 28 14 23 64% Request for Service 65 88 72 -18% Street Lights - Repair & Installation 89 261 551 111% 450 599 832 39% WASA Billing Query 134 103 71 -31% Inadequate Water Supply 72 59 41 -31% Interruption in Pipe Borne Supply 863 834 728 -13% Leaks 203 169 113 -33% Other 66 59 33 -44% Request for Service 18 23 20 -13% Request for Truck Borne Supply 618 481 368 -23% Road Restoration 45 63 25 -60% 2019 1791 1399 -22% TOTA l 2469 2390 2231 -7%
location Areas
Table 9: The top 5 Water Stressed Areas in each Region, 2013-2015
2013 2014 2015
Total Areas
Total Areas Total
C ENTRAL Claxton Bay 62 Claxton Bay 67 Claxton Bay 44 Freeport 19 Freeport 12 Tortuga 16 Cunupia 14 Chaguanas 9 Chaguanas 6 Chaguanas 11 Tortuga 6 California 3 Las Lomas No. 1 10 Las Lomas No. 1 4 Carapichaima 3
N ORTH E AST Arima 44 Arima 27 St. Joseph 36 D’Abadie 23 D’Abadie 25 Arima 21 Talparo 15 Arouca 21 Brazil 11 Brazil 11 Champ Fleurs 13 Arouca 10 Arouca 9 Manzanilla 11 Talparo 10
N ORTH W EST Diego Martin 67 Santa Cruz 70 Santa Cruz 74 Carenage 42 San Juan 47 Belmont 42 St. Anns 36 Diego Martin 38 San Juan 37 Glencoe 31 Maraval 34 St. Anns 33 San Juan 25 Morvant 29 Maraval 32
S OUTH Barrackpore 274 Barrackpore 202 Barrackpore 138 Penal 136 Penal 152 Princes Town 105 Princes Town 92 Princes Town 129 Penal 90 Debe 91 San Fernando 36 Siparia 40 Moruga 34 Debe 34 Moruga 29
Figure 3: Distribution of Complaints by Region, 2015
Maraval decreased by 21% and 6% respectively. The South Region has historically been the area from which the RIC has received the most complaints and 2015 was no exception. The region accounted for 43% or 946 of the complaints. Nevertheless, there was a general decline in the number of complaints recorded from this region in 2015. Analysis of the data showed a decrease in the number of complaints from Barrackpore, Princes Town and Penal by 32%, 19% and 41% respectively. The RIC will continue to monitor these trends and engage in discussions with WASA to improve the delivery of service to the identified worst served areas.
regulated industries commission
2015 21
annual report
24% 18% 43% 14% 1% North
West North East Central South Tobago
The RIC uses Key Performance Indicators (KPIs) in its complaints resolution process which allows stakeholders to assess its performance. Three (3) main KPIs that are used are:
• the percentage of complaints resolved;
• the amount of credit/rebate/compensation that is recovered; and
• adherence to internal service standards, especially response times.
Performance of the RIC against the first KPI was reported in Table 7 above. The second KPI is the quantum of credit/ rebate/compensation that is recovered for customers who have lodged their complaints with the RIC. This KPI allows consumers to make their own assessment on the added value the RIC has brought in terms of protecting consumers’ interests. Over the last three (3) years, the RIC has assisted in the recovery of $4.43Mn dollars in credits/rebates/compensation and in 2015 alone, seventy
(70) customers benefited from the recovery of $0.53Mn in credit/rebate/compensation. 15% or $0.08Mn of this amount was credited by T&TEC to eleven (11) of its customers’ accounts and WASA credited $0.45Mn or 85% to fifty-nine (59) of its customers’ accounts. The third KPI that the RIC utilises to measure the quality of its service delivery is its response time to complaints, based on its internal service standards. Table 10 highlights the RIC’s performance during the period 2013 to 2015 against four (4) established standards.
The RIC assisted 113 walk-in customers in 2015, resulting in 57 complaints being processed. Interestingly, only two percent (2%) of the customers came to the RIC’s office with an appointment and 100% compliance was achieved with its internal service standards. Additionally, all complaints submitted via letter, email and telephone were responded to within 10 working days.
Table 10: RIC’s Internal Performance Standards, 2013 - 2015
Performance Rating
Target Area Standard 2013 2014 2015
Response to Written Complaints
95%
Within ten (10) working days. 100% 100% 100%
Response to Telephone and 95% E-mail Complaints
Response to Overnight Messaging
Keeping Appointments
Within ten (10) working days. 100% 100% 100%
100%
Within one (1) working day 100% 100% 100%
100%
Within ten (10) minutes 100% 100% 100%
regulated industries commission annual report 2015 22
CORPORATE COMMUNICATIONS
The major objectives of the RIC’s Corporate Communications efforts are to educate and encourage the public to take a proactive role in the regulatory decision making process, to build and maintain a positive perception of the RIC in the public domain and to keep stakeholders informed of the work of the RIC. The RIC utilized a variety of communication tools to achieve these objectives in 2015.
Social media
The RIC has a social media presence on Facebook, Twitter, You Tube and LinkedIn. These platforms are utilised to increase brand awareness and upload useful information about the functions of the RIC. Information about the RIC’s line ministry as well as WASA and T&TEC are also uploaded on these platforms, which are updated on a daily basis. In 2015, the number of “likes” on RIC’s Facebook Page increased by approximately 50% when compared to the previous year.
Newsletter – RIC News
The RIC News is a quarterly newsletter which is distributed to other regulatory bodies, agencies, community-based organisations, non-governmental organisations and all other affiliated organisations. This newsletter features informative technical papers on a range of regulatory issues, RIC events, human resource updates, customer service updates, training sessions/workshops completed by staff and other informative papers on the electricity and water sectors. The RIC News has a quarterly circulation of 2,100 copies.
Exhibits and Displays
The RIC utilizes every opportunity to participate in a number of external events to promote its work. The RIC took part in the UWI World of Work Workshop 2015 which took place over two days, 26th – 27th March, 2015. The first day was open to non-final year students seeking vacation employment and the second day was dedicated to final year students only. Companies and organisations from a variety of fields were invited to recruit students for either vacation or graduate employment. The RIC also used this occasion to educate the students about the role
and responsibilities of the RIC and the job opportunities available at the organisation.
conferences
The RIC engaged in a number of initiatives to increase public awareness of the organization, while building staff capacity.
•
UWI Conference of the Economy (COTE)
The RIC participated in the seventh annual Conference of the Economy (COTE), which took place on Thursday 8th and Friday 9th October, 2015 at the University’s Learning Resource Centre. The RIC supported this conference through Silver Sponsorship. COTE is an annual landmark event of UWI’s Department of Economics at which findings from research and other studies are presented to inform stakeholders on economic and social policy. The theme for the 2015 conference was Managing Development in Caribbean Economies: The Key Role of Health and Social Security.
•
13th Annual Conference of Caribbean Utility Regulators
The RIC occupied the position of Deputy Chairman of the Organization of Caribbean Utility Regulators (OOCUR) for the past two years. During the period 27th -30th October 2015, the RIC’s Chairman, Dr. AnneMarie Mohammed and Executive Director, Mr. Sherman Baksh attended the Executive Council Meeting and Conference held in the Turks and Caicos Islands.
The 13th Annual OOCUR Conference was titled “Facilitating a Dynamic Regulatory Environment”, and presenters articulated various perspectives on regulating the Information and Communications Technology (ICT), Water and Wastewater and Energy Sectors to address both current and future regulatory challenges.
corporate Social Responsibility
As part of the RIC’s Corporate Social Responsibility initiatives and Ministry of Public Utilities’ ‘Do Good’ Project 2015, the RIC sponsored the Hoopla stall at the 8th Annual Just Because Foundation’s Kiddi K, Children’s
regulated industries commission annual report 2015 23
Walk Against Cancer which took place on Saturday May
2nd, 2015 at the Jean Pierre Complex. The Just Because Foundation is a non-profit charitable organization and its primary function is to provide emotional and practical support for parents and families whose children are affected with cancer. This service is provided without cost to the affected families. The Just Because Foundation also aims to generate greater awareness of childhood cancers.
The RIC’s Hoopla stall was one of the more popular stalls that attracted participants of every age and raised thousands of dollars for the Foundation. The stall was also set-up, decorated and manned by the staff of the RIC.
huMAn ResouRces / ADMinistRAtion
Recruitment and Selection
Following the retirement of the Executive Director in 2014 the Commission advertised the vacant position in the local daily newspapers in March 2015. The position was subsequently filled and the new Executive Director commenced duties at the Commission with effect from June 01, 2015.
The position of Chief Financial Officer was advertised within the Commission and externally in the local newspapers. After conducting interviews of shortlisted candidates the Board of Commissioners appointed the then acting incumbent to the position of Chief Financial Officer in June 2015.
After conducting interviews for the position of Assistant Executive Director - Technical Operations, a Standards Engineer from within the Commission emerged as the successful candidate for the position and was appointed to the position with effect from March 01, 2015.
Other positions that were advertised and filled during 2015 included one Compliance Analyst for the Technical Operations Department and one Tariff Analyst for the Economics and Research Department. Three Utility Accountants were also hired for the Finance Department. One of these was the Commission’s Accounting Officer who was appointed after being interviewed with other applicants for the position. One of the Utility Accountants did not complete the probationary period owning to personal challenges.
Resignations
During 2015, the Commission lost one of its Utility Accountants from the Finance Department through resignation.
compensation Packages
The staff of the Commission continued to operate under expired remuneration packages. The commission’s staff salaries and benefits expired on July 31st, 2013. Proposals that were submitted to the Commission’s line Ministry by letter dated November 14th 2014 for the new period August 1st, 2013 to July 31st, 2016 remain outstanding to date.
Summer Internship Programme
The Commission developed and implemented a “Summer Internship Policy” in September 2015. The Policy is aimed at streamlining the recruitment process and clarifying the internal responsibilities for both interns and supervisors.
The Commission accepted two interns from the University of the West Indies to participate in the Summer Internship Programme for 2015, one second-year student pursuing a BSc, Management Studies and another a third-year student pursuing BSc, Mechanical Engineering. The second-year student pursuing BSc, Management Studies was assigned to the HR & Administration Department and the thirdyear student pursuing a BSc, Mechanical Engineering was assigned to the Technical Operations Department. While the interns were assigned to their specific sections, the they were given exposure to other departments within the organization for short periods, to garner information and appreciate the work of the other departments.
annual report
24
regulated industries commission
2015
Training
In light of the Commission’s continued commitment to promote employees’ effectiveness through training and development, staff members participated in a number of training programmes during 2015, both locally and abroad and through on-line programmes at recognized training establishments.
Foreign Training
During the first half of 2015, several members of staff attended foreign training programmes as follows:
• Conference on Net Metering and Utility Solar Rates hosted by the Electric Utility Consultants Inc. over the period January 26th – 28th in California, USA.
• One-week Utility Rate School hosted by the National Association of Regulatory Utilities Commission’s (NARUC) over the period May 11th -15th in California, USA.
• Two (2) foreign-based online training courses offered by Public Utilities Research Centre (PURC) were completed by certain professional staff members.
The Executive Director (Ag.) attended two important conferences, as follows:
• ECTEL Conference held in St Lucia during the period May 11th to 13th, 2015.
• 6th World forum for Energy Regulators held in Istanbul, Turkey from May 24th to 28th, 2015.
The newly hired Executive Director attended the OOCUR 2015 Conference which was held in Turks and Caicos during the period October 27th to 30th, 2015.
Other Training Activities
Several members of staff participated in a range of technical and non-technical workshops, conferences and seminars hosted by a variety of institutions including ACCA/ICATT, the Arthur Lok Jack Graduate School of Business, Trinidad and Tobago Bureau of Standards and Areef Ali & Associates.
group life and Health Insurances
The Commission’s Group Life Insurance and Group Health Insurance Plans were re-negotiated for another period without any rate increases.
Security upgrade
In July 2015 the Commission upgraded its CCTV system and addressed certain security gaps that existed. The security enhancements have resulted in improved the safety of staff and the public while at the RIC’s office.
Procurement
During 2015 a decision was taken to centralize the RIC’s purchasing function to one department, which is now responsible for all purchases of goods and services for the Commission.
2015 25
regulated industries commission annual report
FinAnces oF the Ric
The RIC derives its income through a Cess which is levied on the service providers that are listed in the First Schedule of the RIC Act. The Cess Order, which authorises the RIC to collect Cess from the regulated entities, was published in the Gazette on March 26th, 2015. The Cess Factor in 2015 was 0.35% of the cumulative revenue of the service providers under the RIC’s purview. The actual amount of Cess paid by each service provider is itemized in table 11 below.
2015 was similar to the previous year, with the largest expense categories being Personnel and Accommodation, at 59.2% and 13.64% respectively. Overall expenditure was lower than budgeted for a number of reasons. The hiring of new staff was included in the 2015 budget, however, all vacancies were not filled as planned. All of the training programmes that were planned for the year were not fulfilled and provisions made under Other Costs for rate review related costs were not incurred. A
Table 11: Cess Paid by Service Provider, 2015
Service Provider TT$ Amount
Trinity Power 488,002
The Trinidad and Tobago Electricity Commission 10,143,772
The Water and Sewerage Authority 2,985,881 TOTAl 16,475,704
The declared surplus from the previous year is carried forward into the following year. In this regard, $905,495 was carried forward as the surplus for the year 2014. Consequently, less Cess was requested from the service providers in 2015.
A Budget of $17,381,199 for the financial year was approved by the Minister of Public Utilities, by Cess Order dated March 18th 2015. The RIC’s actual expenditure in
breakdown of the main items of expenditure is presented in table 12 below.
The RIC is committed to ensuring that its costs are carefully controlled and that there is transparency in its operations. In keeping with these commitments, individuals who wish to access any information on the RIC’s financial operations may do so through the established channels.
regulated industries commission annual report 2015 26
The Power Generation Company of Trinidad & Tobago Limited 2,858,049
Actual
Budgeted Expenditure,
Budget ($) Actual ($) Personnel Expenditure
Accommodation
Consulting and Contracting
Training
Public Education, Promotion & Printing
Capital Expenditure and
Other Costs
Table 12:
vs
2015
10,873,650 10,072,632
2,675,820 2,320,850
601,729 1,195,447
640,000 450,739
425,000 484,821
IT 990,000 1,274,999
1,175,000 1,214,615 TOTAl 17,381,199 17,014,103
commissioners 2015


management team 2015


2015 27
regulated industries commission annual report
Ms. Liana Ramsahai Deputy Chairman
Dr. Anne-Marie Mohammed Chairman
Mr. niegel subiah Commissioner
Mr. Mark Dolsingh Commissioner
Ms. sunita Ganpat Commissioner Ms. Debra singh-Khan Commissioner
–
Administration
helen Peru
Manager
Human Resources and
–
Mohan chadee Manager
Customer Services
–
Martin haynes Manager
Information Technology
Financial Officer (June 1st 2015 –December 31st 2015)
shameel
Khan Chief
Derrick Phillips Assistant Executive Director
–
Technical Operations
–
Driselle Ramjohn Manager
Corporate Communications
Rishi Maharaj Assistant Executive Director – Economics & Research
(June 1st 2015 –December 31st 2015)
sherman Baksh Executive Director
31st
Glenn Khan Deputy Executive Director Ag. Executive Director (January 1st 2015
–May
2015)
nadia John Legal/Corporate Secretary
regulated industries commission annual report 2015

statements 20 15 FOR THE YEAR ENDED 31 D ECEMBER , 2015 RIC® LOGO DESIGN
Financial
30
regulated industries commission annual report 2015
2015 31
regulated industries commission annual report
CONTENTS
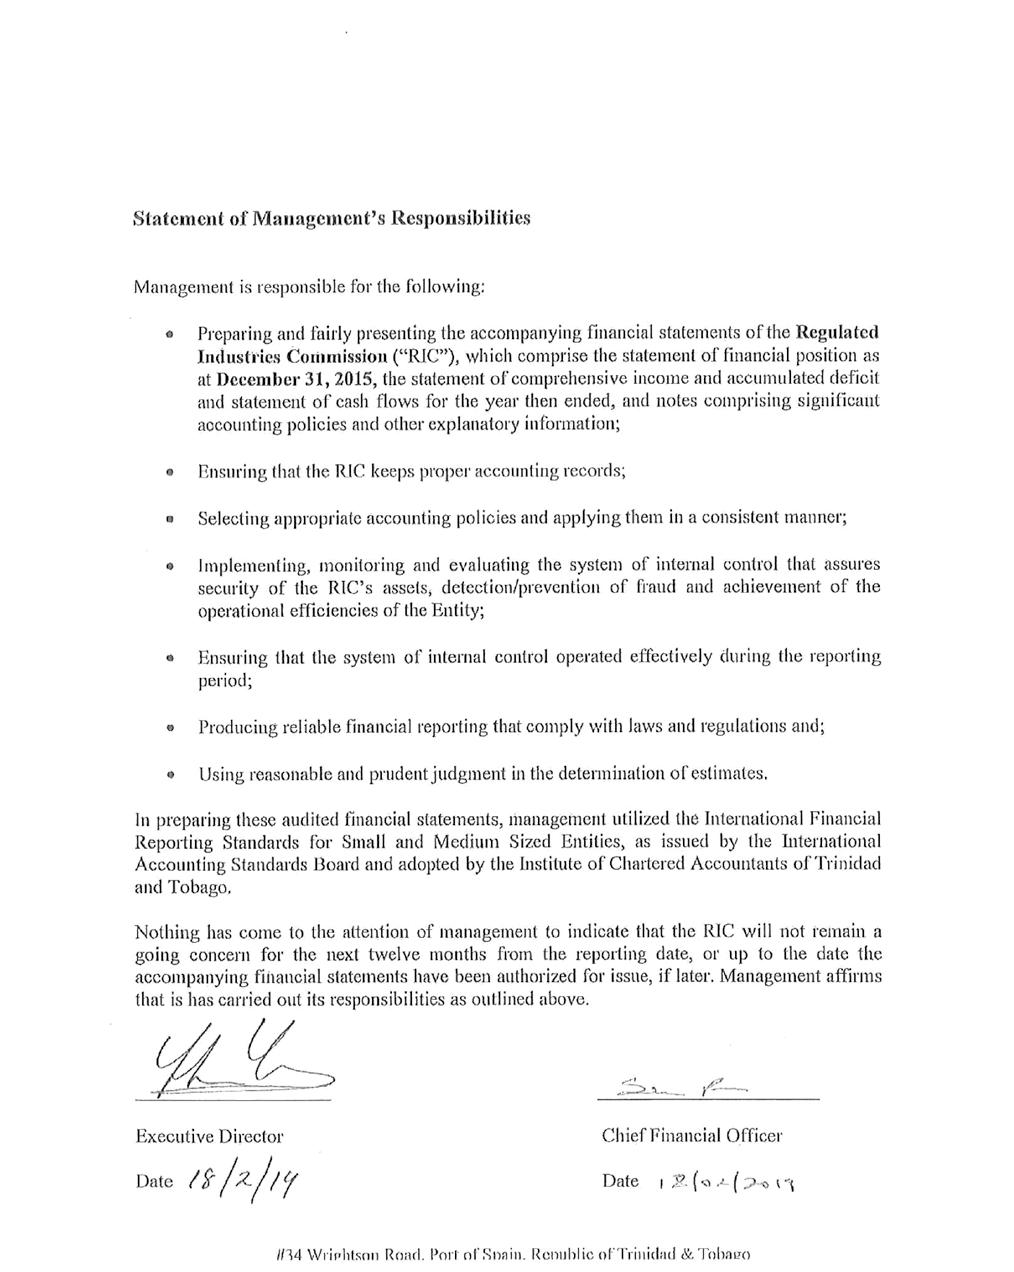
S tatement of Management Responsibilities 33
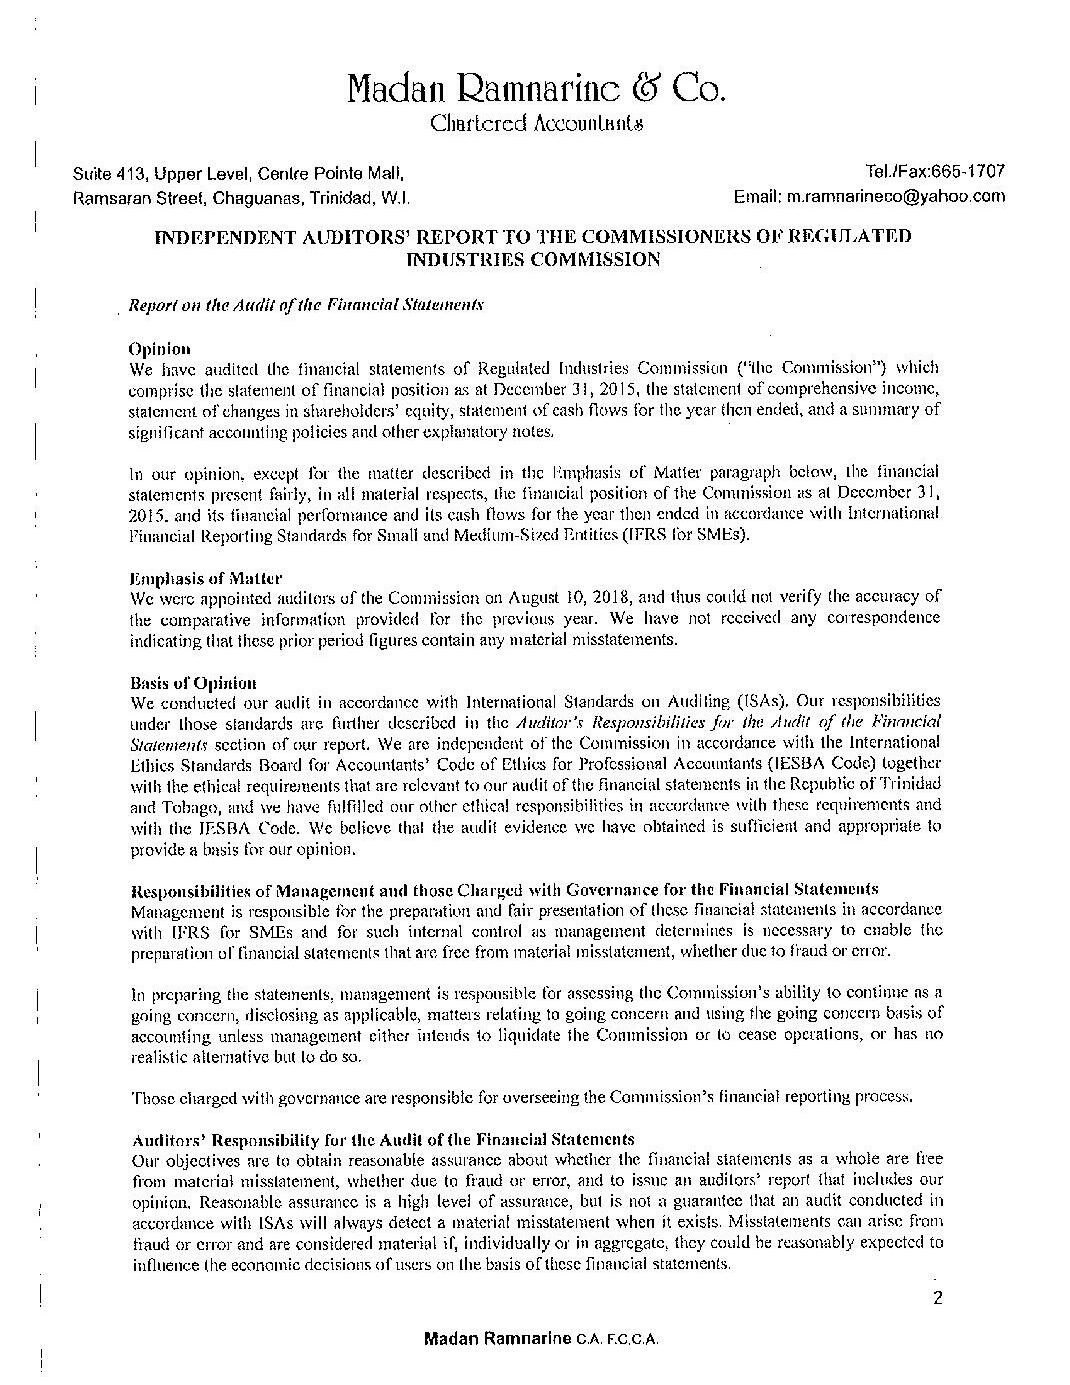
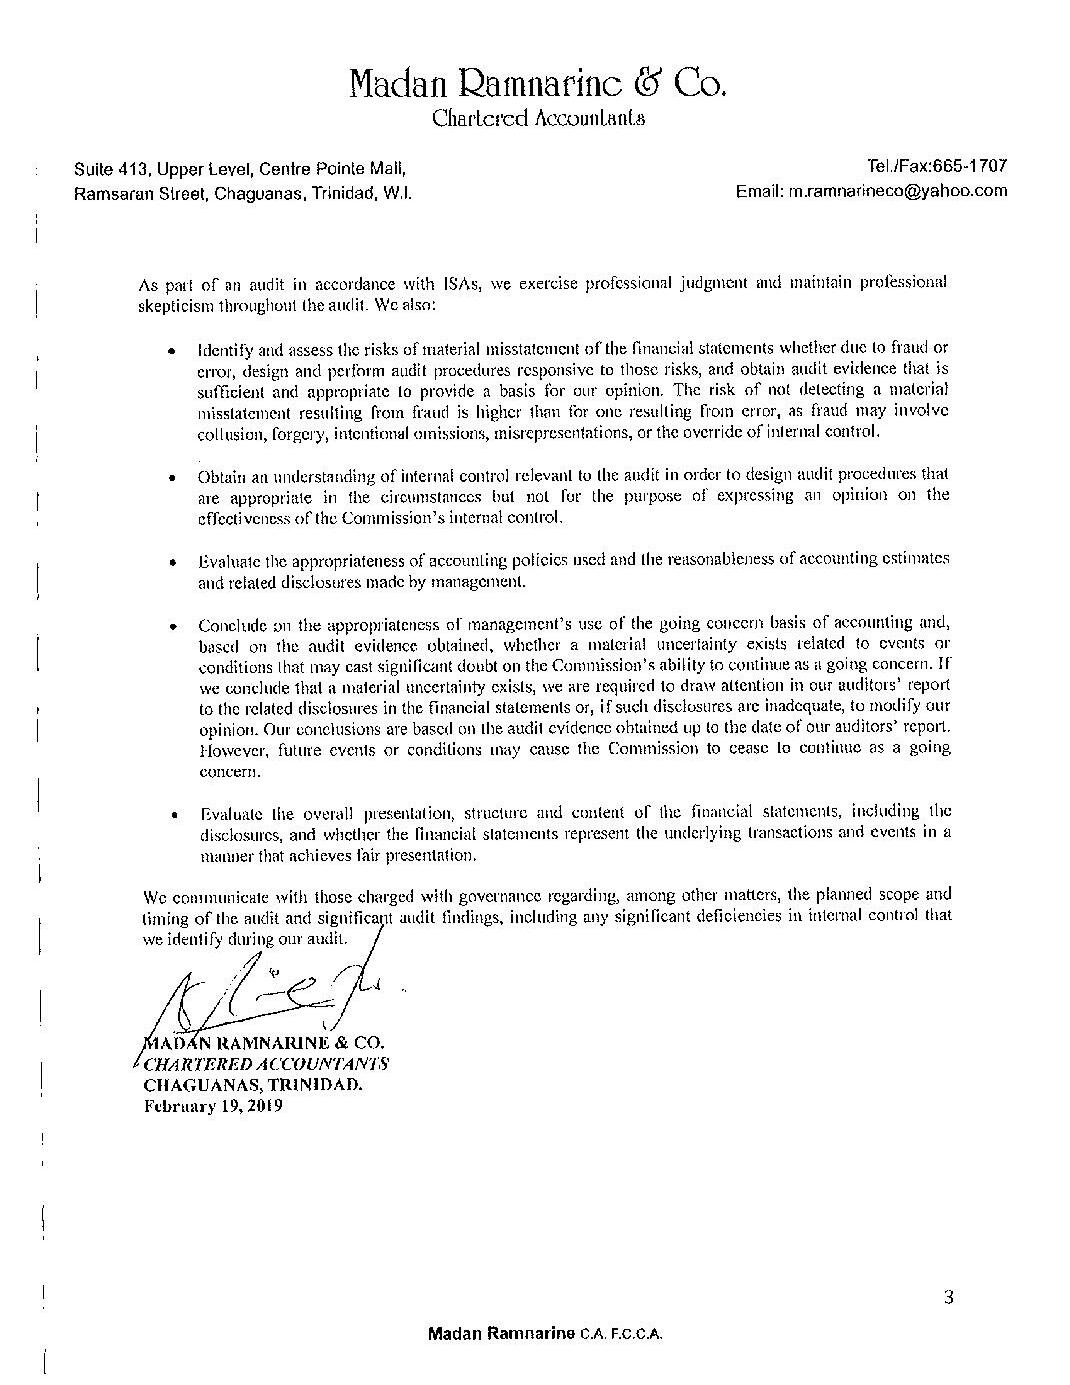
Auditors’ Report 34
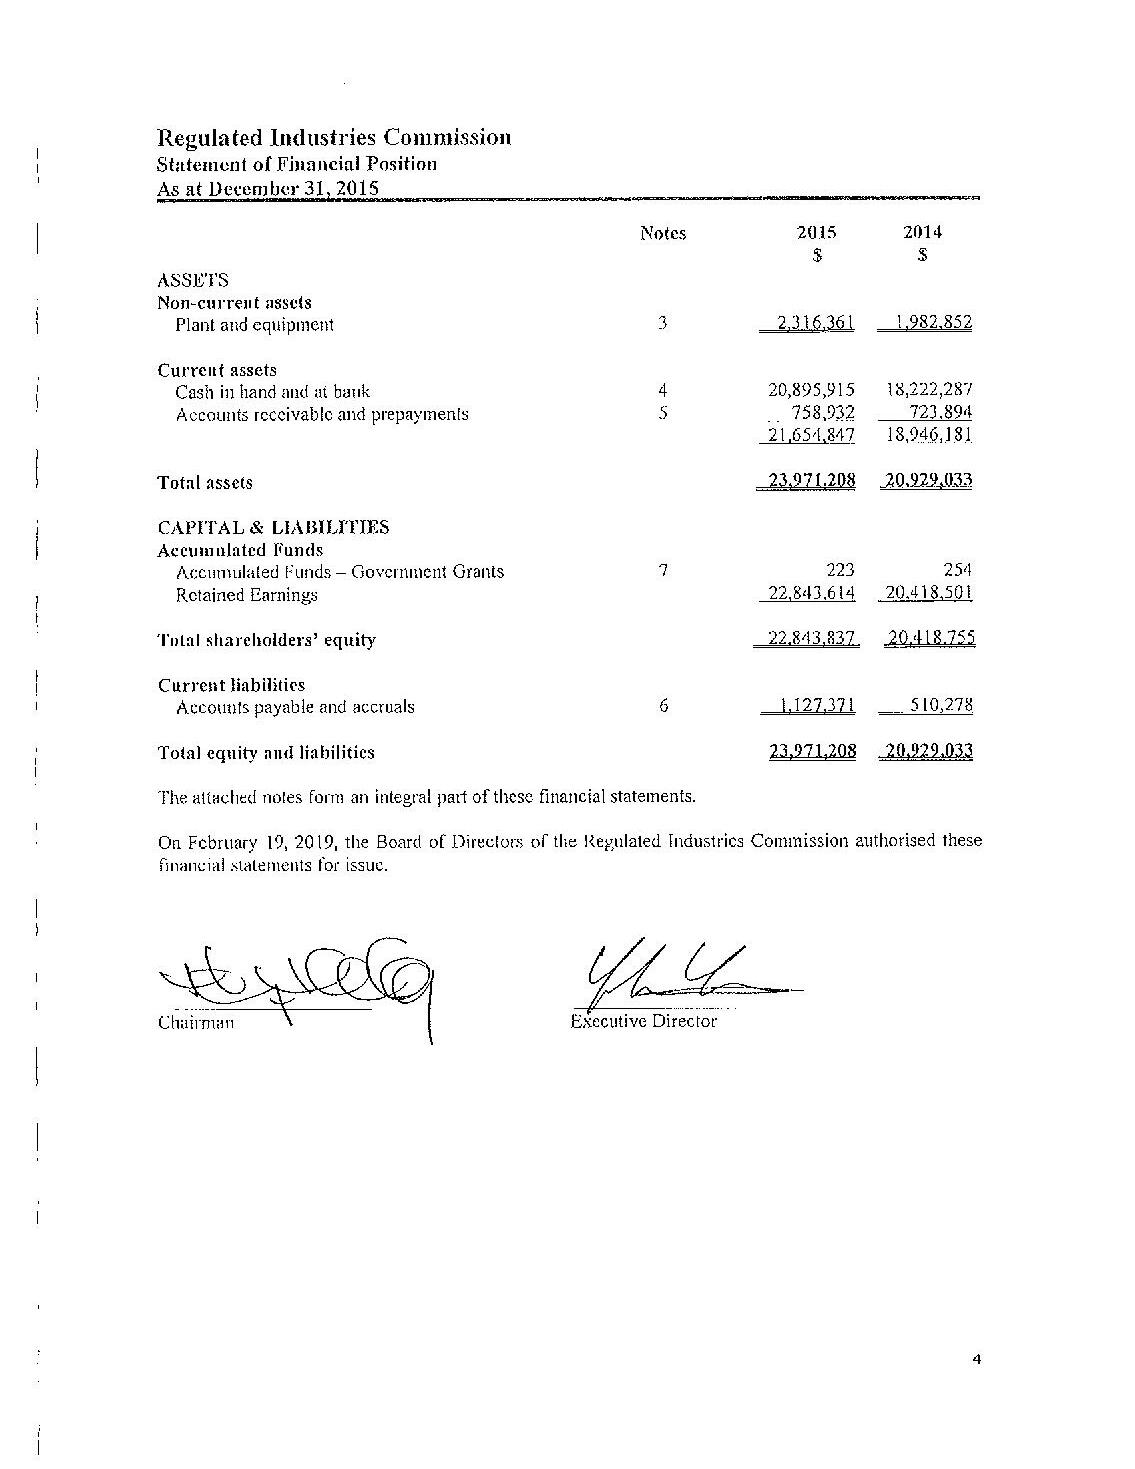
Statement of Financial Position 36
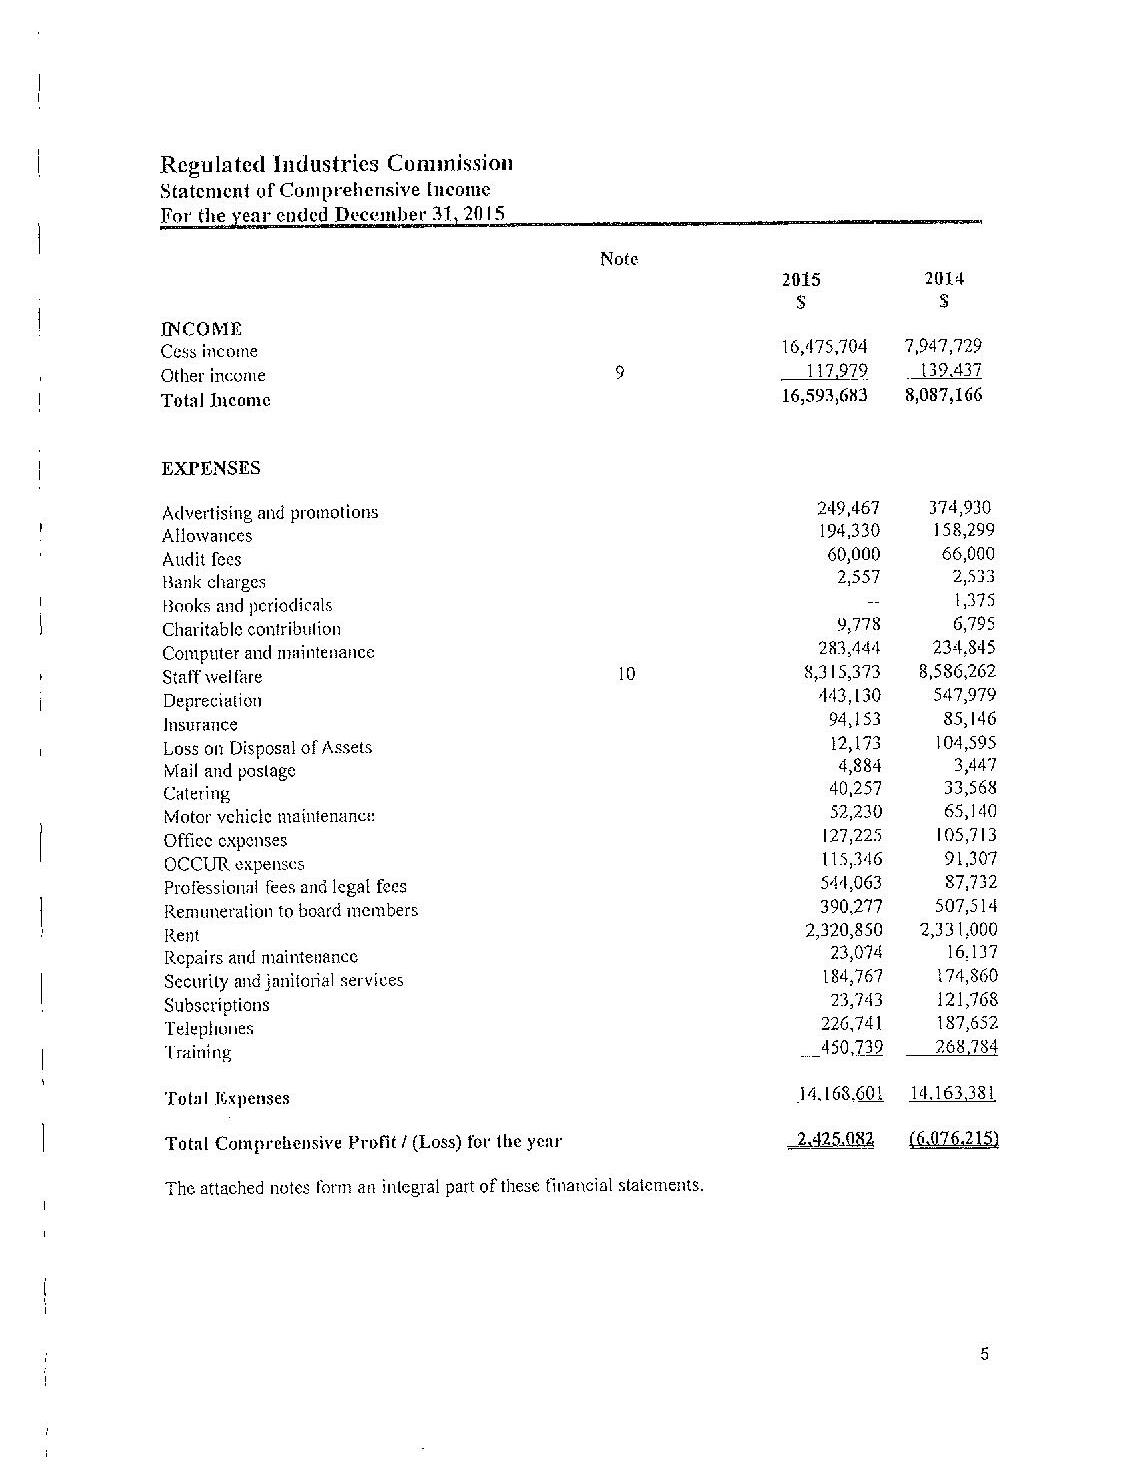
Statement of Comprehensive Income 37
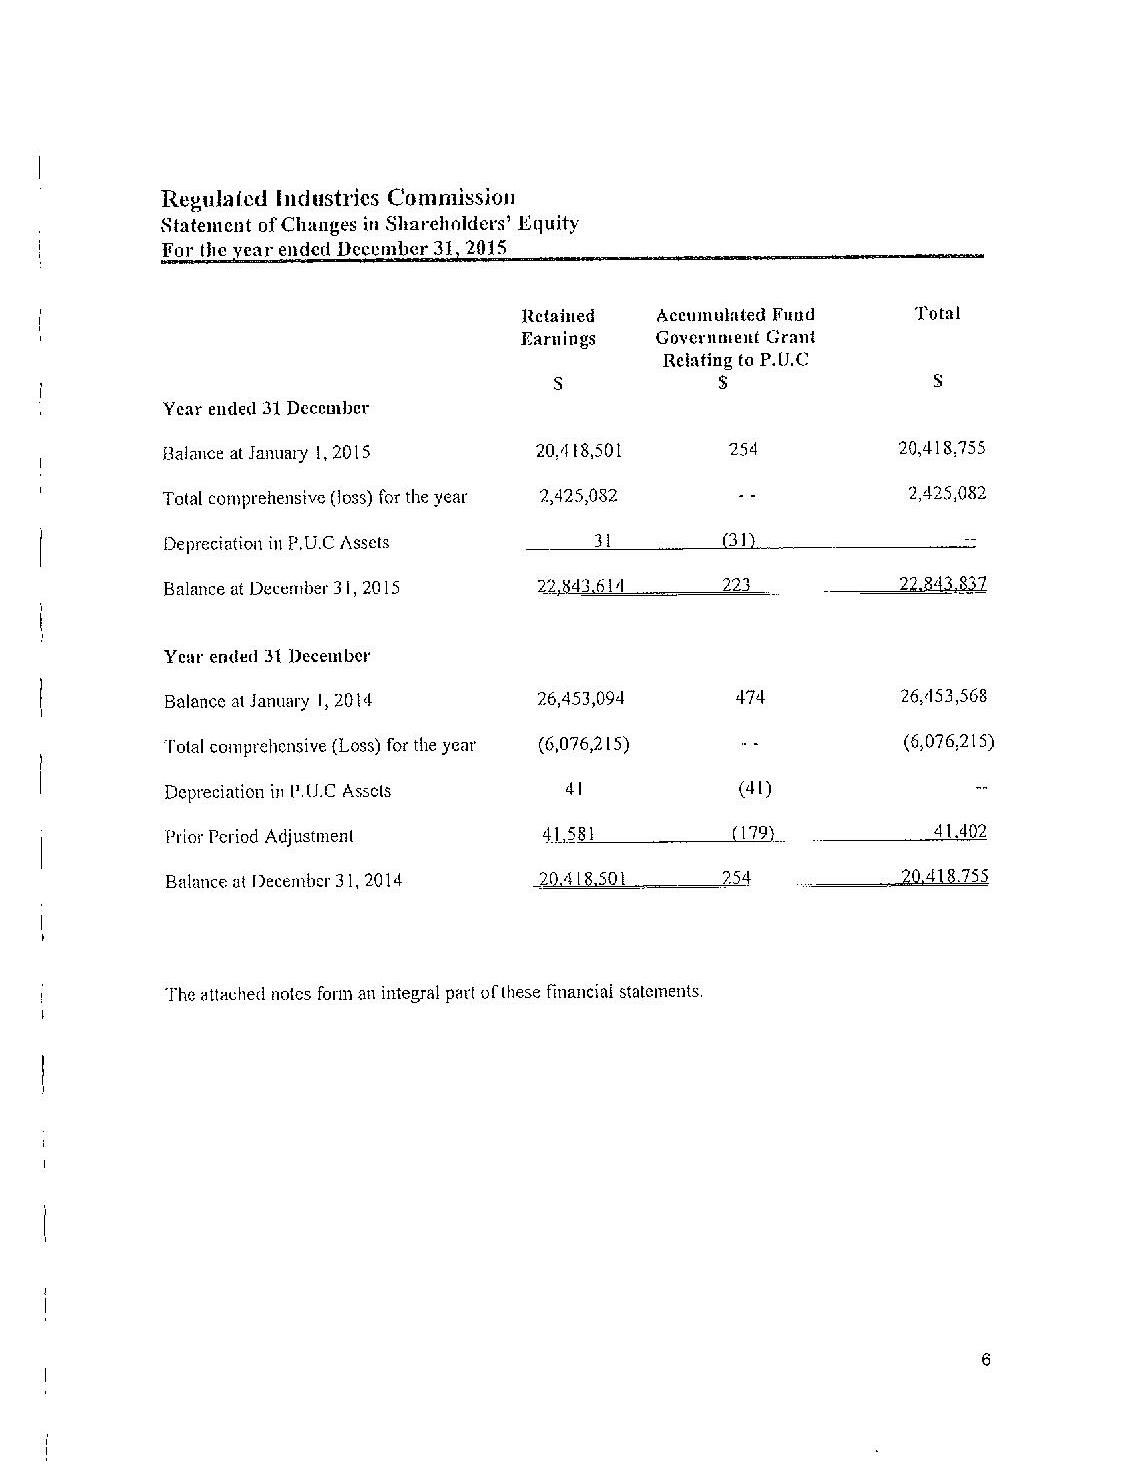
Statement of Changes in Shareholders’ Equity 38
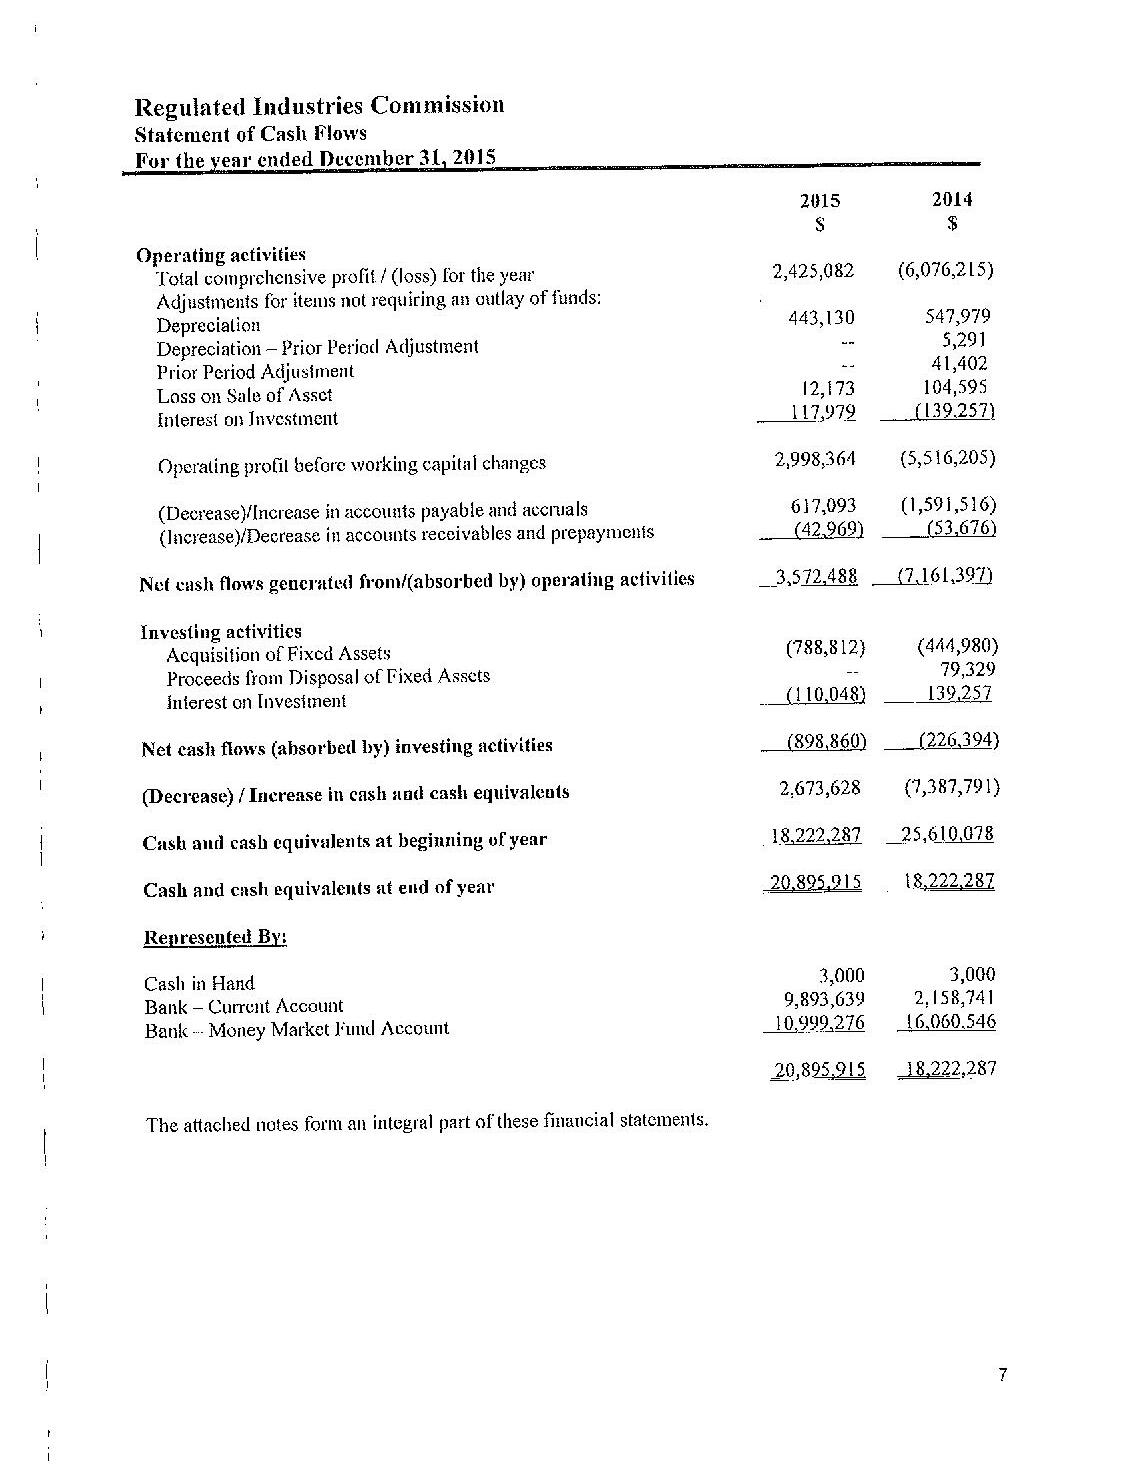
Statement of Cash Flows ……………………………………………………………………………………………… 39
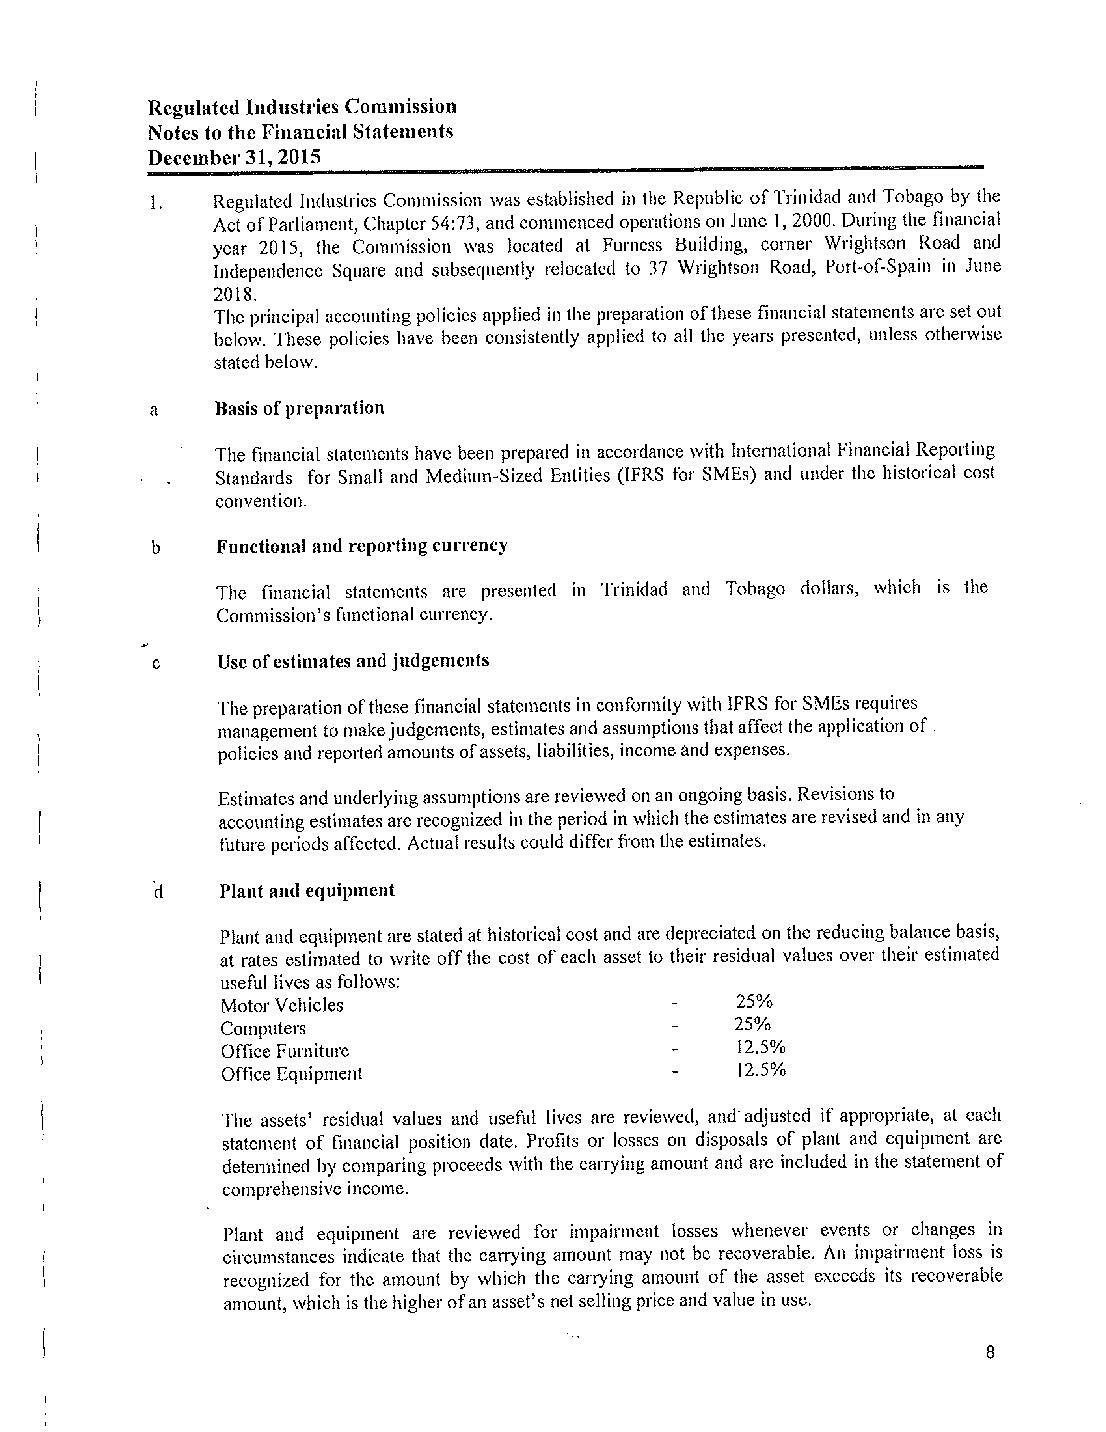
Notes to the Financial Statements ………………………………………………………………………………… 40
regulated industries commission annual report 2015 32
2015 33 RIC® LOGO DESIGN
regulated industries commission annual report
34
regulated industries commission annual report 2015
2015 35
regulated industries commission annual report
STATEmENT OF FINANCIAL POSITION
regulated industries commission 36
regulated industries commission 37
regulated industries commission 38
regulated industries commission 39
40
regulated industries commission annual report 2015
2015 41
regulated industries commission annual report
42
regulated industries commission annual report 2015
2015 43
regulated industries commission annual report
regulated industries commission annual report 2015
44
2015 45
regulated industries commission annual report
46
regulated industries commission annual report 2015
#37 Wrightson Road, Port of Spain, Trinidad, W.I. P.O. Box 1001
Tel: 800-4RIC (4742) 627-7820 627-0821 627-0503 625-5384 Fax: 624-2027 Email: ricoffice@ric.org.tt www.ric.org.tt


RIC® LOGO DESIGN
