
21 minute read
THE ANATOMY OF A WAVEFORM

from Auto Service Professional - June 2021
by EndeavorBusinessMedia-VehicleRepairGroup

SNAP ON SECONDARY KV PROBE & SYNCH
Fig. 1: On a distributor-equipped engine, the secondary KV probe is clamped around the coil wire, and the synch probe would be clamped around the #1 plug wire.
The Anatomy of a Waveform
Understanding how a DSO can improve diagnostics
BY BILL FULTON
OU HAVE CERTAINLY HEARD THE
Yphrase that “a picture is worth a thousand words of information.” That especially is true on lab scope waveforms from both sides of the ignition system as well as input sensors and output devices. Although our scan tools are still our No. 1 diagnostic weapons of choice, we sometimes realize that there are some severe limitations on the data. Someone once said that using scan data alone is basically back door diagnostics, meaning that the data we see, although mostly reliable, is basically homogenized has-been information. There are times when we need to go into the front door of diagnostics and look at the raw waveform.
In this example we want to bring some awareness to the credible use of the DSO (digital storage oscilloscope).
First and foremost there are 4 cardinal fundamental rules in order to master the use of the DSO.
1. THE TRIGGER LEVEL: This is where many technicians get discouraged because the waveform is not stable or walking across the screen. For example, if you are scoping out the secondary ignition system and looking at a 10 KV event, it would be necessary to set the trigger level at about the 4 KV point. Another example might be when scoping out a DREF or RPM signal for integrity we would set the trigger level at about the 2.5 volt level considering that the signal is a 5V/0V toggle.
2. THE TRIGGER SLOPE: The cardinal rule here is that if the output device, for example an injector, which in most cases is ground side controlled by the PCM, we would then set the trigger slope to the negative side. Another example would be when looking at a secondary firing event we would set the trigger slope to the positive side. We will look at the secondary in detail later. Most secondary firing events are negative firing events. When we use the invert function of the scope in this example we also invert the trigger slope function.
3. THE TRIGGER MODE: Typically, there are two modes: automatic and normal. When selecting the automatic mode, a trace will be on the scope’s screen. This is where you would want to vertically align the trace to the ground tick mark. When viewing a signal the trigger level must be set at a proper voltage level in order to view a stable signal horizontally. The normal scope mode will only display a waveform when the signal crosses a specific preset trigger level. This mode is best used when viewing a signal drop-out or glitch detection. Many DSOs have a record function for play-back purposes to confirm a signal drop out. There are some premium DSOs that have a free run mode where the trace is constantly moving across the screen and no trigger level is re-
UNIVERSAL KV PROBE UNIVERSAL COP WAND
ANATOMY OF A SECONDARY IGNITION WAVEFORM
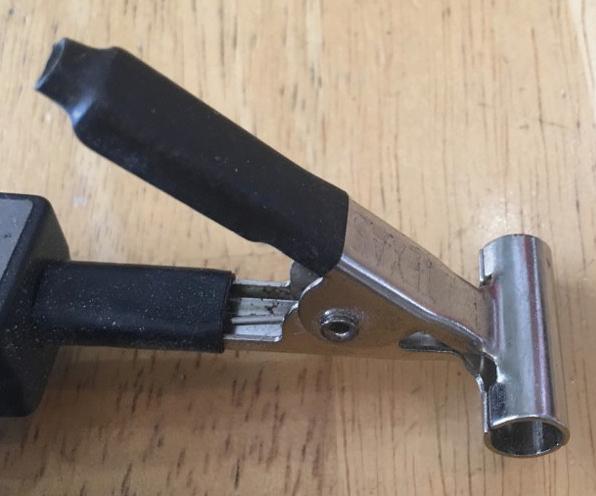
Fig. 2: We can use a single trace example from a DSO on the lab scope side and view secondary one cylinder at a time on a DIS system or on an engine equipped with COP coils. Here, we use the universal KV probe on the secondary lead.
quired. This is a valuable function for a TPS sweep check or by viewing the O2 sensor activity.
4. TRIGGER SOURCE: You must tell the DSO what channel input that you want the scope to use for a trigger input. If you are using a single channel, for example channel 1, the scope’s trigger input would need to be set for that channel. If you are doing a dual trace test, for example the CKP and CMP inputs, you can select either channel input for a trigger source. We will demonstrate these fundamentals during our screen captures. These four fundamental rules once learned will be etched into your long term memory.
Measurements on scope waveforms are often a necessity. On the vertical scale, there are eight squares or major divisions. Inside each major division are five minor divisions. The vertical major and minor divisions are used to measure a voltage value. If the voltage setting is 5 volts per division, then the ability to see 40 volts on the screen is available. If using a universal secondary KV probe or a COP wand with attenuation factors of 1,000 to 1, then a 1 volts per division becomes 1 KV per division. This is a popular voltage per division setting when looking at a secondary event with a DSO. The horizontal scale is used

Fig. 3: Here, we use the COP wand instead of the KV probe.
Fig. 4: It is vitally important to know the critical points of the waveform. More diagnostic information is available by viewing a secondary waveform.

to measure time. There are 10 major divisions on the horizontal square. Inside each major division are five minor divisions. If the time base is set at 1 millisecond per division, then the total time base on the screen is 10 milliseconds. When viewing a secondary event a 1 millisecond time base is usually ideal when viewing a single cylinder firing event.
Many of the premium DSOs such as the Snap on Modis, Verus and Zeus are a combination of a DSO and an ignition scope, as well as the Bosch 5200. What this means is that when selecting the ignition scope function, you can punch in the firing order and view each cylinder’s firing events individually or view all cylinders together in a superimposed pattern or a parade pattern or a raster pattern. These functions were very popular on the distributor equipped engines. The Secondary KV probe is clamped around the coil wire and the synch probe would be clamped around the #1 plug wire as seen in Figure 1. The critical point here is that we can use a single trace example from a DSO on the lab scope side and view secondary one cylinder at a time on a DIS system or an engine equipped with COP coils. Using this approach with the DSO, we can use the universal KV probe in Figure 2 on the secondary lead or use the COP wand as seen in Figure 3. Both of these probes have an input impedance of 1,000 to 1. This means that if the DSO is set at 1 volt per division the probes input impedance is now 1 KV per division on the vertical scale on the DSO. Again we will demonstrate this during our screen captures.
Let’s begin with the all important check of secondary ignition. One popular automotive technical instructor made this statement, “There is more diagnostic information from viewing a secondary waveform than any other waveform from the internal combustion engine.” First and foremost, it is vitally important to know the critical points of the waveform as indicated in Figure 4. Have you fixed engine misfire codes by simply removing and replacing worn or carbon impregnated spark plugs? Did you need proof that the worn spark plugs were in fact the cause of the misfire? This critical point is to view the spark duration period during park idle/ no-load conditions. Let’s say that the time base on the scope is set to 1 millisecond per division and the spark duration period measures below 1 millisecond.
GOOD SPARK DURATION PERIOD ON A CHRYSLER COP SYSTEM
5.4L COP PRIMARY MULTI-SPARK SYSTEM
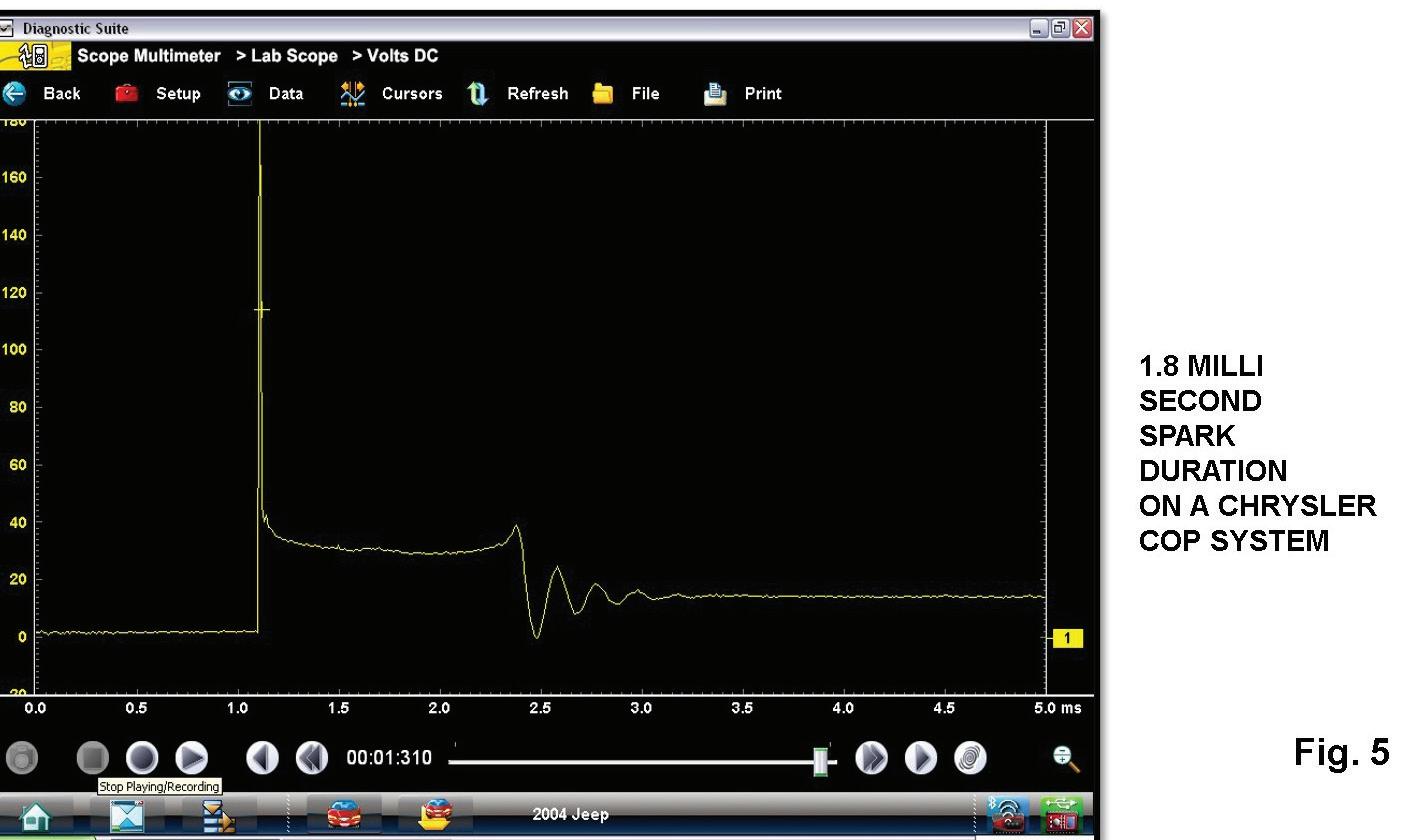
Fig. 5: This secondary ignition waveform was captured from a Chrysler COP-equipped engine after spark plugs were replaced, indicating a good increase of spark duration with the new plugs.
Fig. 6: Ford systems multi fire the coils below 1,000 RPM. If we add all three spark duration periods together we end up with over 1.5 milliseconds of total spark duration times. In offidle under-load, the mixture is enriched which helps to increase spark duration.

After replacing the worn spark plugs, the spark duration period now measures over 1.5 milliseconds with no more misfires. Figure 5 indicates the good increase of the spark duration period with the new spark plugs. This secondary ignition waveform was captured from a Chrysler COP-equipped engine after the plugs were replaced. There have been many times when we print a before and after hard copy to show the vehicle owner. A main reason that we need to examine the spark duration periods is that during park idle/no-load conditions the mixture is relatively lean and compression values are less that half the values as during a WOT cranking condition. When the engine comes into an off idle acceleration mode, the compression values drastically increase and spark timing is momentarily retarded causing a higher KV demand and a shorter spark duration period. With extremely lean conditions at idle/no-load conditions, the non conductive air molecules make it more difficult to create the flame kernel. Of all the different ignition systems that I have scoped out, I have found that the GM Type II DIS ignition systems have the shortest spark duration periods of barely more than 1 millisecond. The distributor equipped engines from GM and other makes will maintain a 1.5 millisecond duration period during park idle/no-load conditions. The COP systems will be in the 1.5 to 2.0 millisecond area.
These values were all captured during park idle/noload conditions.
The healthy spark duration period on the COP systems is due to the fact that there is only 1 air gap being the spark plug air gap. This is why the Ford systems multi fire the coils below 1,000 RPM. See Figure 6. If we add all three spark duration periods together, we end up with more than 1.5 milliseconds of total spark duration times. In off-idle, under-load conditions, the mixture is enriched with more conductive fuel molecules which helps to increase the spark duration period. Above 1,000 RPM, the Ford systems will revert back to a single firing event.
When scoping out the secondary circuit on a DIS system, keep in mind that half of the cylinders are fired negatively while the other half are fired with positive polarity. The point here is that the scope input inverse function must be used when viewing a
SECONDARY LEADS TO SCOPE CHECK SOME COP IGNITION SYSTEMS
SECONDARY RASTER (LEAN CYLINDER)

Fig. 7: Some COP coils are heavily potted, resulting in a weaker magnet field, making it difficult to obtain a s=good secondary waveform. The key is to use a secondary lead between the COP coil and the spark plug.
Fig. 8: Here, we see a lean density misfire on a distributor equipped engine using the raster pattern from the ignition scope side of the DSO. Notice the short spark line that is bending upward with an excess amount of turbulence on #6 cylinder.

negative firing event. The COP systems and the distributor equipped engines also conduct negative firing events in the secondary circuit so you must also use the invert function when using a DSO. With early Ford and Chrysler COP systems, the COP wand is laid right on top of the coil to obtain a stable secondary ignition waveform. The later years, the COP coils on Ford systems were more heavily potted resulting in a weaker magnet field, which made it more difficult to obtain a good secondary waveform. This also applies to other COP systems such as the Asian and GM systems. The key here is to use a secondary lead between the COP coil and the spark plug. Pico supplies these leads and by using the universal secondary KV probe clamped around the lead we can now view a good secondary waveform from these heavily potted COP units. The secondary Pico COP leads can be seen in Figure 7.
The important point here is that we primarily focus on the sparkline characteristics in three areas. 1. Length of duration during park idle/no-load conditions. 2. The sparkline angle during idle no-load conditions as well as during a power brake condition, 3. The presence of turbulence on the sparkline and sparkline angle during idle and power brake conditions. Turbulence on the sparkline is an indication of cylinder compression and cylinder pressures. A sparkline that shortens and bends upward with a lot of turbulence during a power brake condition is an indication of a lean density condition or a lean density misfire. As we will demonstrate these for you with screen captures, you will see that the sparkline characteristics represent our electronic window inside the combustion chamber to isolate a lean density misfire, a rich density misfire as in a fouled spark plug and a low compression issue. All of these factors also include a problem in the secondary circuit such as an open spark plug or an open spark plug wire as well as a shorted secondary lead. Internal coil carbon tracking problems that tend to be common will also be seen on the sparkline. A critical point here is that when using a DSO to scope trace the secondary events is to always use the peak detect function of the scope.
Let’s take a look at a lean density misfire on a distributor equipped engine during a light power brake
#1 SECONDARY DURING LOAD
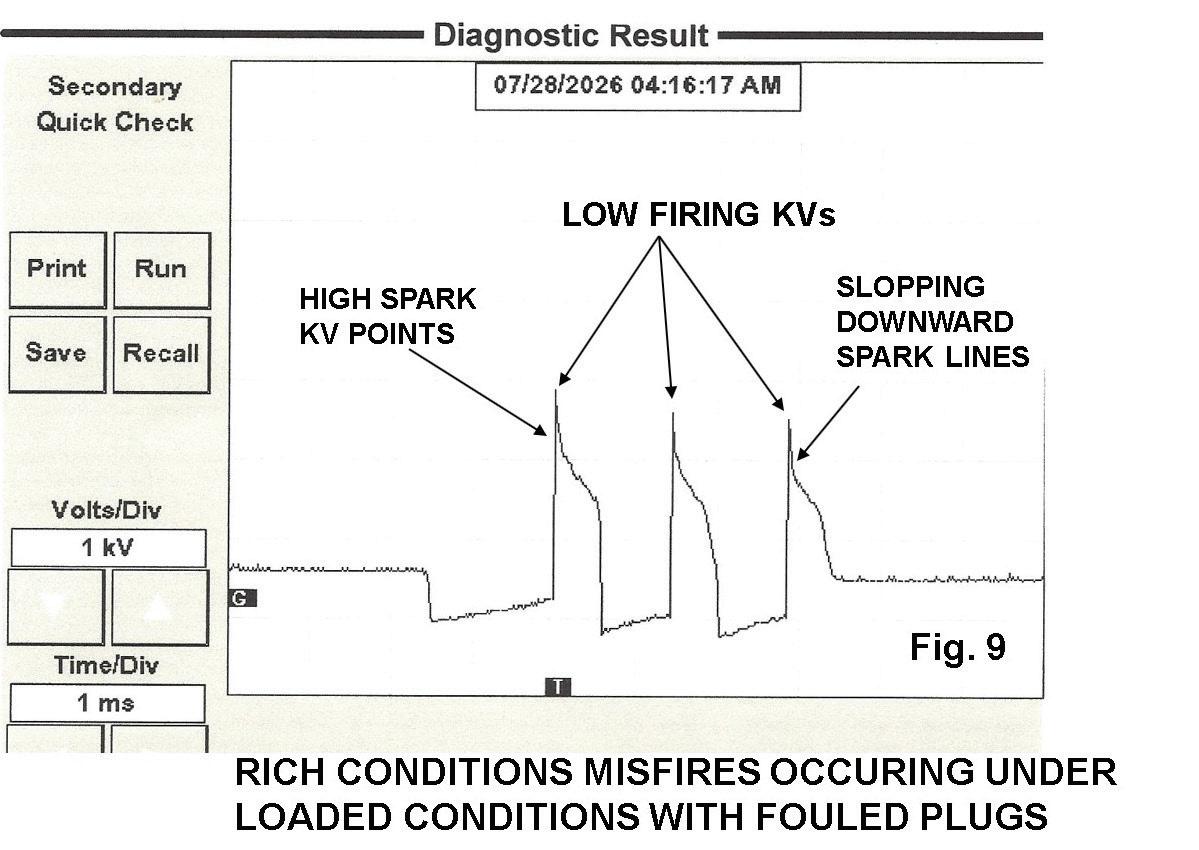
Fig. 9: A capture from a Ford COP system showing a rich density misfire from a fouled spark plug. Note, the slumping downward spark line voltages.
Fig. 9B: On a distributor equipped engine, there are two air gaps in the secondary circuit … the spark plug air gap and the rotor air gap. This figure shows a very short spark duration period.
TOYOTA 2.4L (INTERMITTENT MISS/BUCK)

condition in Figure 8 using the raster pattern from the ignition scope side of the DSO. Notice the short spark line that is bending upward with an excess amount of turbulence on #6 cylinder. On the opposite problem, let’s look t at a rich density misfire from a fouled spark plug in Figure 9. Notice the slumping downward spark line voltages due to high concentration of conductive fuel molecules inside the combustion chamber. This is an indication of a fouled spark plug, as well. This was captured from a Ford COP type system using a COP wand and the DSO side of the scope. How do we scope out Toyota distributor equipped engines when there is no coil wire and the coil is inside the distributor cap? We simply use the universal KV probe clamped around the coil tower. The vehicle has a misfire under light load conditions. The spark plugs have been replaced with no improvement. Remember on distributor equipped engines there are two air gaps in the secondary circuit ... the spark plug air gap and the rotor air gap. Figure 9B shows a very short spark duration period. Figure 9C shows a major improvement after the distributor cap and rotor were replaced. Cylinders with low compression will be indicated by low firing KVs and a long sparkline that lacks turbulence as indicated in Figure 10. This was captured from a GM system with the Coil Near Plug system. The COP wand was laid against the short secondary lead.
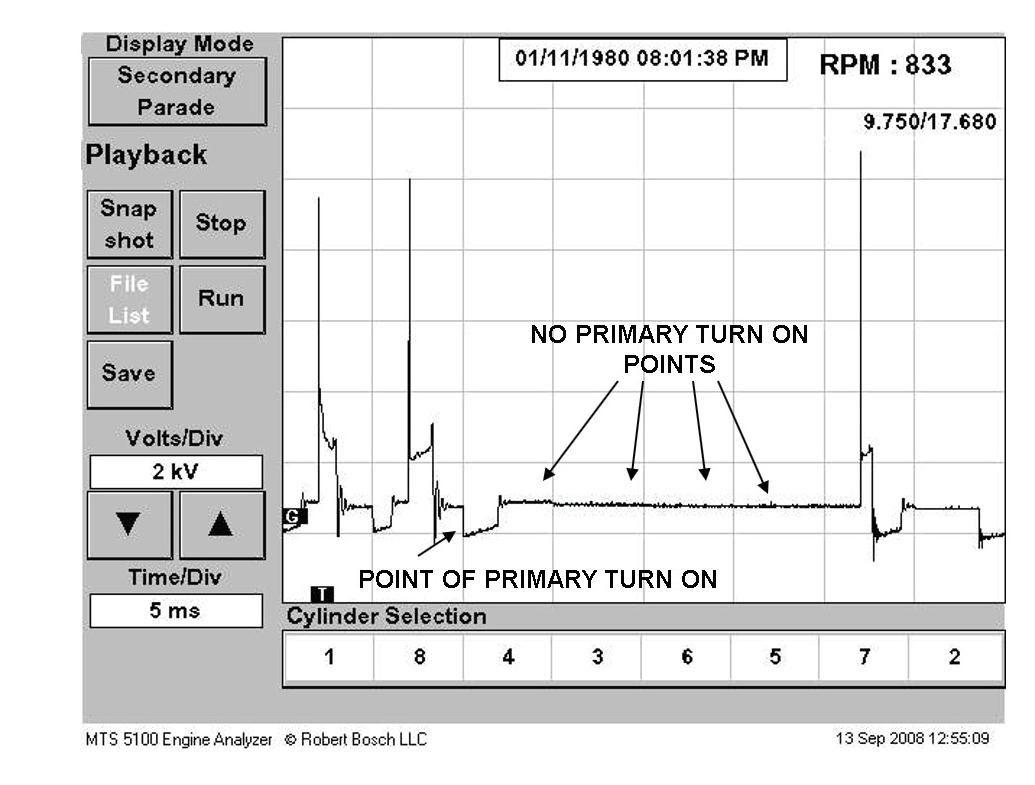
Going back to using the ignition scope side of the Modis, let’s look at a 5.7L Vortec engine in a Chevy Express Van with an intermittent misfire and stall symptom. On this distributor equipped engine, we clamp the secondary KV probe around the coil wire and the synch probe around the No. 1 secondary lead. We punch in the engine’s firing order and proceed. Let’s look back to our earlier picture in Figure 4, on the critical points on a secondary waveform. Notice the point of primary turn on. Now let’s look at a secondary parade pattern from the Express Van in Figure 11. Did you notice the missing points of primary turn on? We all know that the PCM uses the DREF (digitized reference voltage) or RPM signal to determine when to turn on and charge a coil and when to turn off and fire the coil. We would suspect a faulty CKP signal as indicated in Figure 12. These systems are known to have mechanical interference between the tip of the
TOYOTA SECONDARY (AFTER NEW CAP & ROTOR)
2002 SILVERADO #1 CYLINDER SECONDARY IGNITION
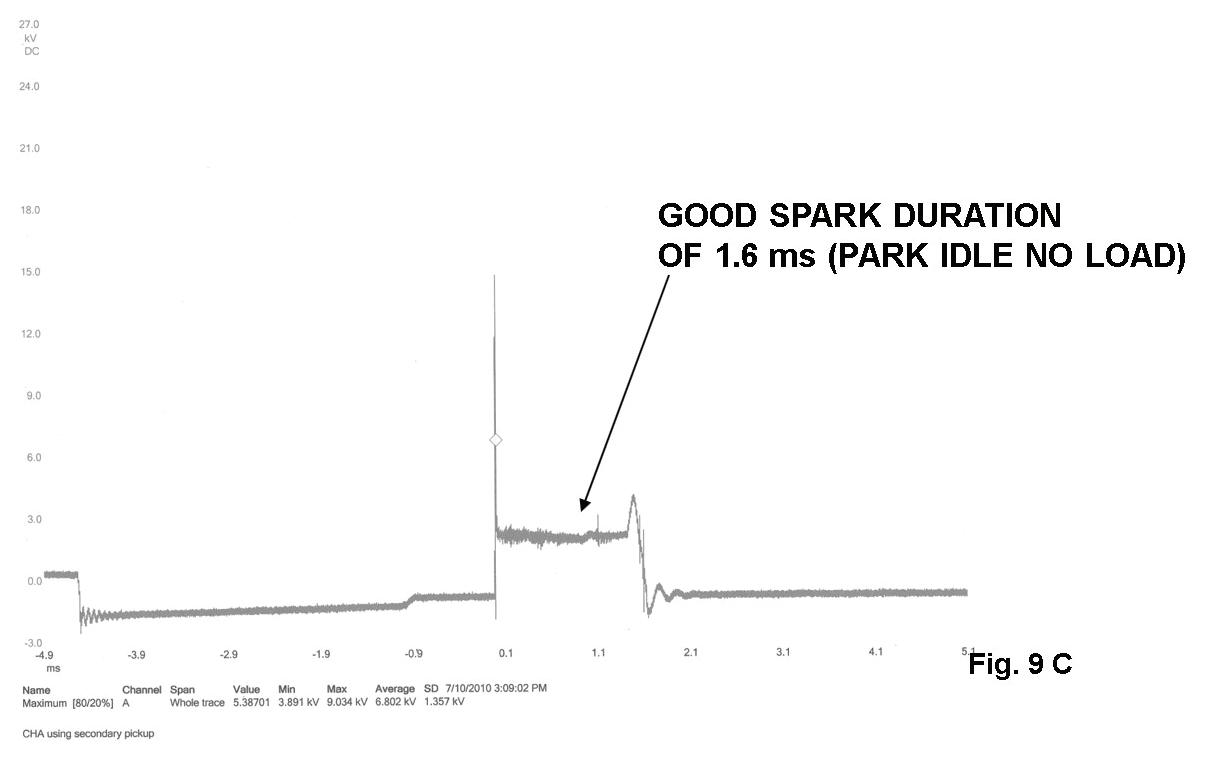
Fig. 9C: This figure shows a major improvement after the distributor cap and rotor were replaced.
Fig. 10: Here, we see a lean density misfire on a distributor equipped engine using the raster pattern from the ignition scope side of the DSO. Notice the short spark line that is bending upward with an excess amount of turbulence on #6 cylinder.

2001 CHEVY EXPRESS VAN (LOSS OF SECONDARY) 2004 MUSTANG 3.8L #5 SECONDARY
Fig. 11: An example of a secondary parade pattern from an Express Van. Note, the missing points of primary turn-on. The PCM uses the DREF or RPM signal to determine when to turn on and charge a coil and when to turn off and fire the coil. Fig. 13: An open in the secondary circuit can easily be seen by scoping secondary. Note the split firing line with no sparkline. This can be caused by an open plug wire or an open spark plug resistor.
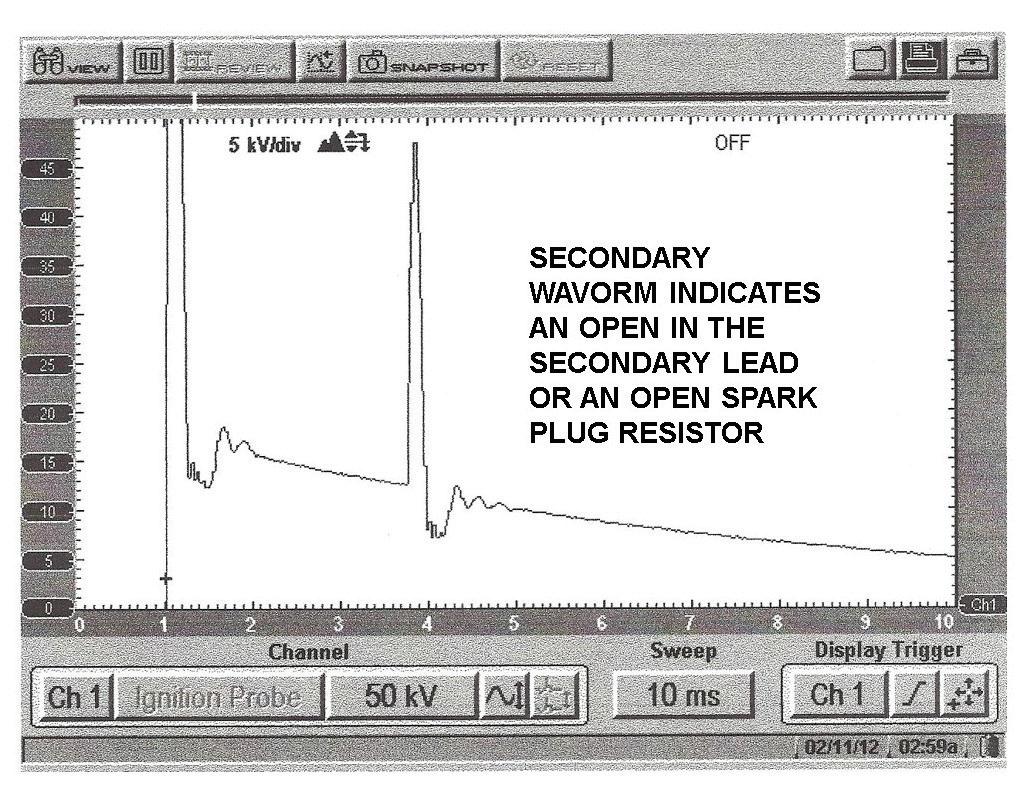
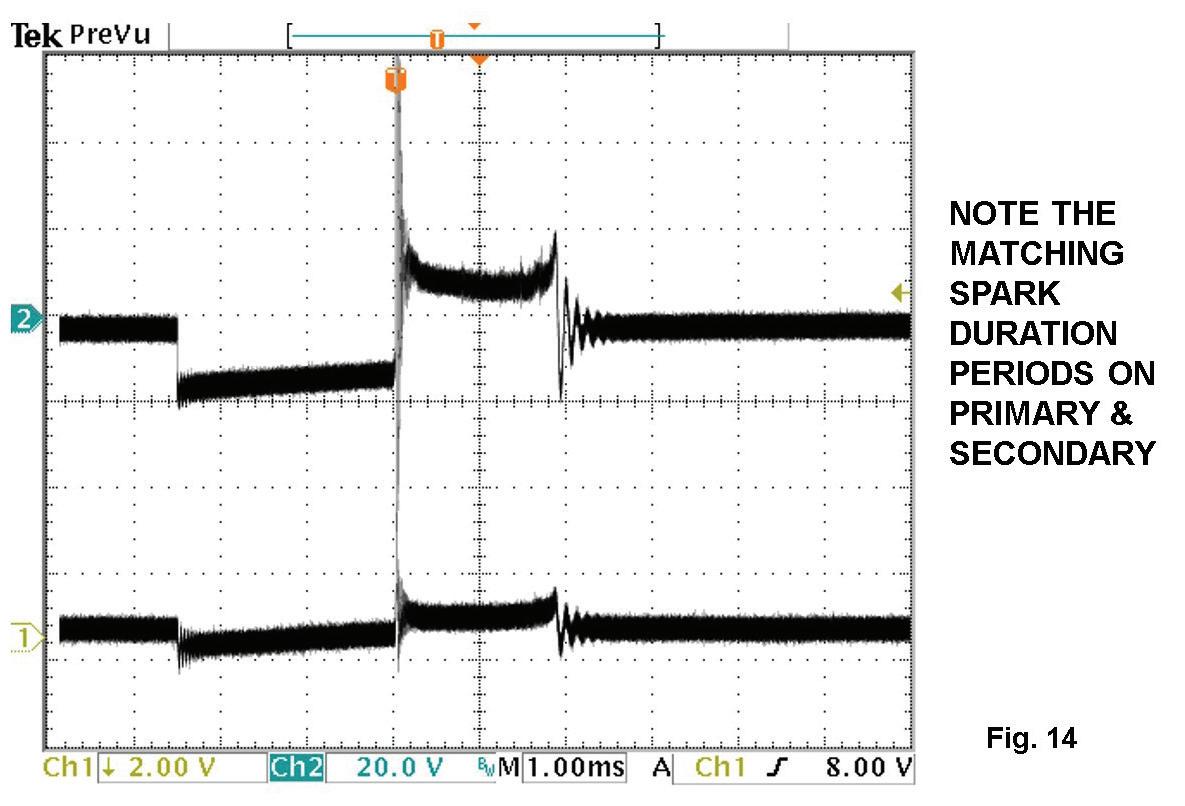
Fig. 14: This is a dual trace example from a Chrysler COP system. On channel 1, we’re using the COP wand on top of the COP that indicates the coil’s secondary side. On channel 2, we’re back-probing the negative coil terminal (primary side). Note, the healthy 1.9 millisecond spark duration matched between primary and secondary.
2001 EXPRESS VAN (LOSS OF CKP SIGNAL)
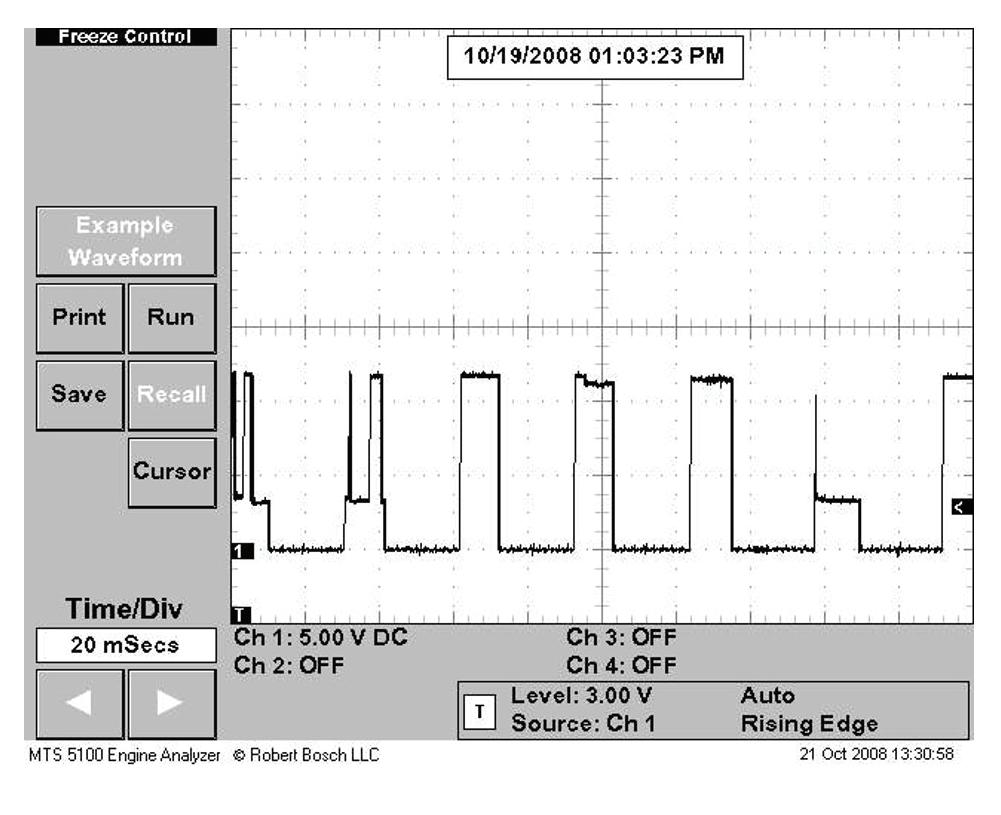
Fig. 12: Referring to Figure 11, we would suspect a faulty CKP signal as indicated here. These systems are known to have mechanical interference between the tip of the crank sensor and the reluctor wheel, creating a miss trigger, which might be caused by worn main bearings. GM offers a crank sensor shim to regain the correct air gap.
CHRYSLER COP (PRI./SEC.)
crank sensor and the reluctor wheel creating a miss trigger. This is caused by worn main bearings. GM is aware of this problem and actually supplies a shim to reestablish the air gap. A visual inspection of the crank sensor indicated no mechanical interference. We simply ran a redundant signal lead between the CKP sensor and the PCM to confirm the signal drop out was a circuit problem. We could have also used a DSO and done the same test. We would simply use two channels. Channel 1 using a universal KV probe around the coil wire with channel 2 using another KV probe around the #1 spark plug lead. Remember to use the invert function since secondary firing events are negative firing events.
An open in the secondary circuit can be easily seen by scoping secondary. Look at Figure 13. Notice the split firing line with no sparkline. This can be caused by an open plug wire or an open spark plug resistor. An ohmmeter check of the secondary lead confirmed an open.
On the Ford and Chrysler, COP systems access to the primary side of the coil is a good option. We simply use the DSO single channel and back probe the negative terminal of the coil. A 1 millisecond time base at 10 volts per division is often good settings when viewing the primary side of the coil. The spark duration periods of the secondary side of the coil will be mirrored on the primary side. Let’s take a look at Figure 14. This is a dual trace example from a Chrysler COP system. On Channel 1, we are using the COP wand on top of the COP that indicates the secondary side of the coil. Channel 2 in back probing the negative terminal of the coil that indicates the primary side of the coil. Notice the time base is set at 1 millisecond per division. Notice the healthy 1.9 milli-second spark duration period perfectly matched between primary and secondary.
The primary ignition drivers on Ford and Chrysler systems are inside the PCM. On late model Chrysler engines equipped with COP units, the PCM simply times the rate of the collapsing magnetic field from each firing event.
This is meant to represent the spark duration period. The data is relevant and not nearly 100% accurate. Take a look at Figure 15. The #1 cylinder shows a value of just more than 1 millisecond. The other cylin-
CHRYSLER COP SYSTEM SPARK DURATION PERIOD FROM SCAN CATA
FORD GOOD SPARK DURATION PERIODS @ IDLE
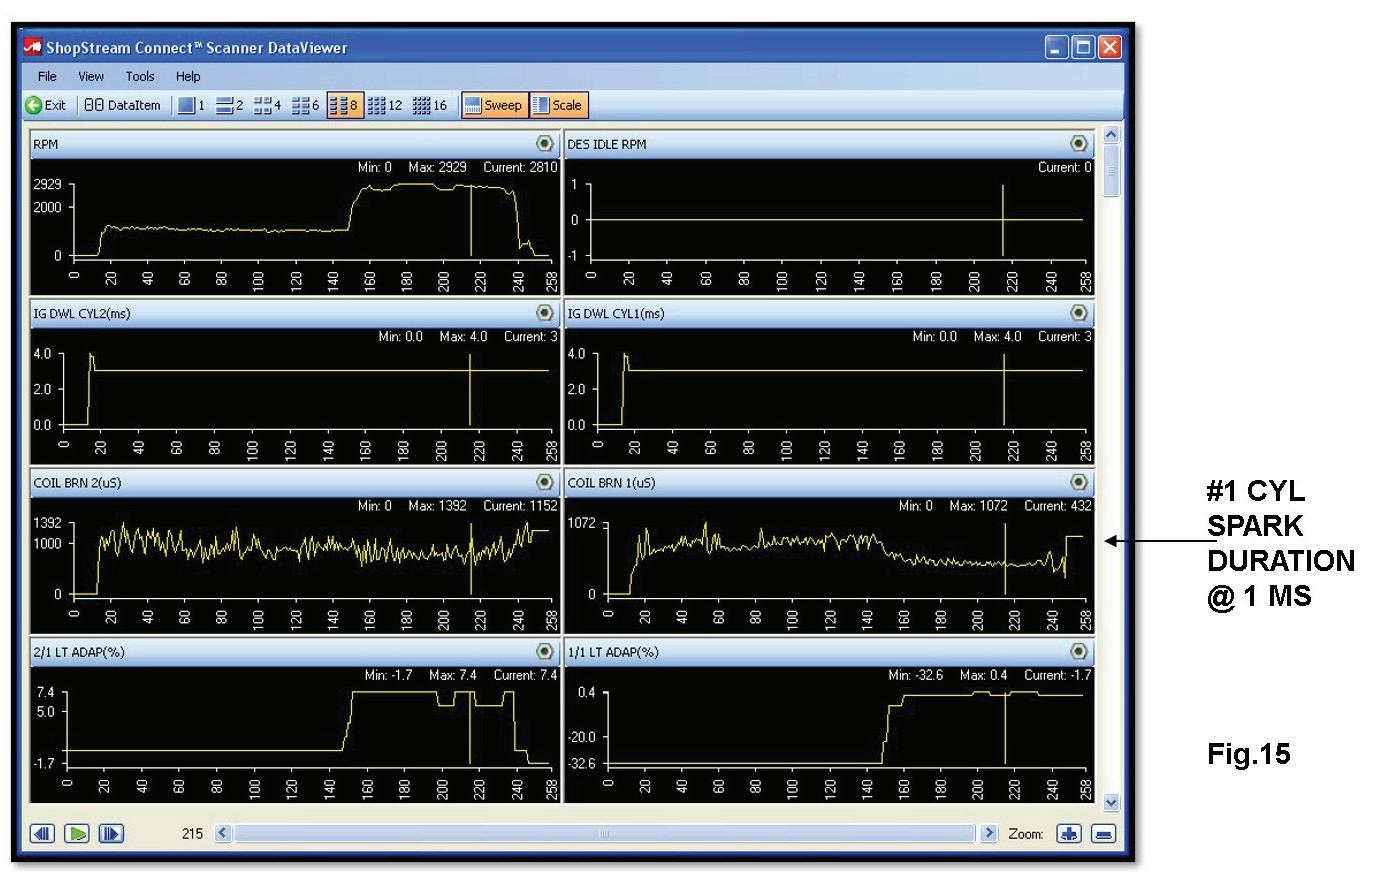
Fig. 15: The #1 cylinder on this Chrysler COP shows a value of just more than 1 millisecond. The other cylinders show a much longer value.
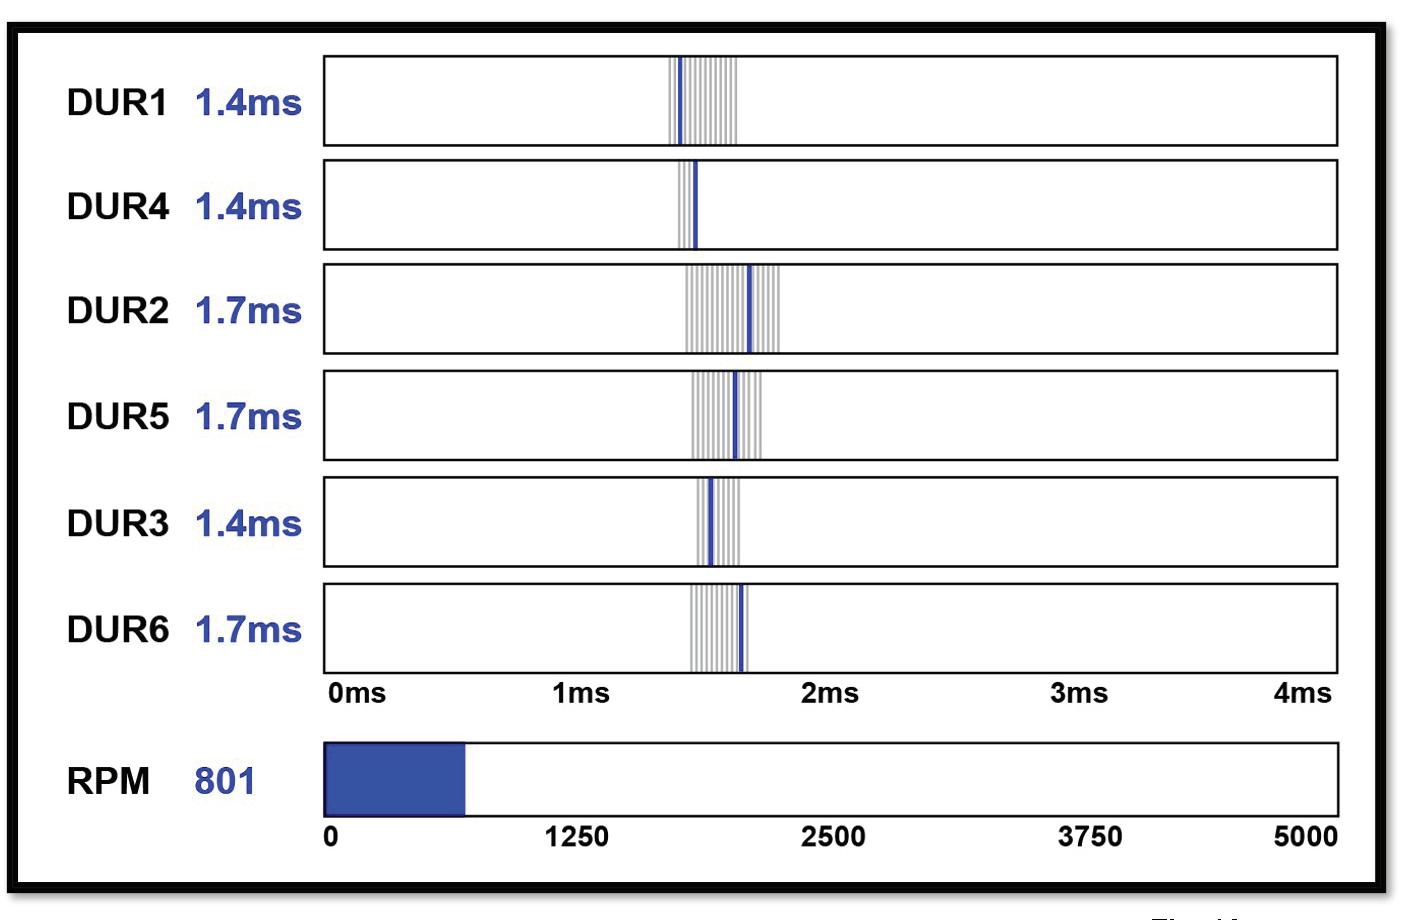
Fig. 16: A scan tool capture of a Ford with COP. During idle/no-load conditions, uniform spark duration periods are seen on all cylinders. In this capture, the PCM is adding all three spark duration periods together.
ders show a much longer value.
The late model Ford systems equipped with COP units will also have scan data relative to firing events that can be suspect. This data should be considered relative, as well. Take a look at Figure 16. In this scan tool capture during idle/no-load conditions indicate uniform spark duration periods on all cylinders. Since the coil drivers are inside the PCM, the PCM simply times the period of the collapsing magnetic field. In this example, captured at idle, the PCM is adding all three spark duration periods together. In Figure 17, the Ford PCM reverts back to a single firing event above 1,000 RPM. Ford also gives a scan tool parameter known as acceleration PIDS (on-board diagnostic parameter IDs) as seen in Figure 18. Note, cylinder #4 indicates a crank speed slow down. The distance between the crank sensor signals are known as numerator values. When a misfire occurs, the crank speed will slow down. The problem on #4 cylinder could be a bad spark plug, or bad coil or a lean density misfire. It does not pin-point the cause of the misfire. I know in the real world with a single misfire we simply use a spark tester to verify whether or not that the coil fired. Instead by using a DSO with a secondary KV probe or a COP wand and viewing the secondary event, will not only verify whether the coil fired or not, but the misfire might be caused by a lean density misfire, a richdensity misfire, a low compression problem or an open in the secondary circuit.
In your journey down the diagnostic road, I hope this information helps you, and I thank you for your commitment to this resilient industry.
Bill Fulton is the author of Mitchell 1’s Advanced Engine Performance Diagnostics and Advanced Engine Diagnostics manuals. He is also the author of several lab scope and drivability manuals such as Ford, Toyota, GM and Chrysler OBD I and OBD II systems, fuel system testing, and many other training manuals in addition to his own 101 Lab Scope Testing Tips. He is a certified Master Technician with more than 30 years of training and R&D experience. He was rated in the top three nationally on Motor Service magazine’s Top Technical Trainer Award and has instructed for Mitchell 1, Precision Tune, OTC, O’Reilly Auto Parts, BWD, JD Byrider, Snap-on Vetronix and Standard Ignition programs. You may have also seen Fulton in many Lightning Bolt Training videos and DVDs and read his articles in many auto service magazines. He owns and operates Ohio Automotive Technology, which is an automotive repair and research development center. Fig. 17: On the same Ford COP system, the PCM reverts back to a single firing event above 1,000 RPM.
Fig. 18: Ford gives a scan tool parameter known as acceleration PIDS. Note, cylinder #4 indicates a crank speed slowdown. When a misfire occurs, the crank speed will slow down.
FORD OFF IDLE SPARK DURATION PIDS

FORD CYLINDER ACCELERATION PIDS


