

MANUAL SPECIMEN DATABASE MANAGEMENT SYSTEM (SDBMS) FOR FAIR
BIODIVERSITY DATA STEWARDSHIP
Prepared by Associate Professor Dr Liew Thor Seng Institute for Tropical Biology and Conservation, Universiti Malaysia Sabah
Sheikh Muhammad Arif Shaifuddin Sh Zulrushdi Centre for Research in Biotechnology for Agriculture, Universiti Malaya
Edited by Dr Nurzatil Sharleeza Mat Jalaluddin Faculty of Science / Centre for Research in Biotechnology for Agriculture, Universiti Malaya

THE MANUAL OF SPECIMEN DATABASE MANAGEMENT SYSTEM (SDBMS) FOR FAIR BIODIVERSITY DATA STEWARDSHIP
This manual is developed by the subject matter experts under the FAIR Data Stewardship Guidelines for Reproducibility in Biodiversity Research (Phase I) project. This manual is prepared to guide the use of a specimen database management system towards achieving the FAIR principle. © Academy of Sciences Malaysia 2024
All Rights Reserved.
Copyright in photographs as specified below.
Front cover: Helix pomatia (Premium image by Wirestock.com on Freepik.com), Back cover: Scenery (Premium image by Wirestock.com on Freepik.com)
No part of this publication may be reproduced, stored in a retrieval system or transmitted in any form or by any means, electronic, mechanical, photocopying, recording or otherwise without prior permission in writing from the Academy of Sciences Malaysia.
Academy of Sciences Malaysia Level 20, West Wing, MATRADE Tower
Jalan Sultan Haji Ahmad Shah off Jalan Tuanku Abdul Halim 50480 Kuala Lumpur, Malaysia
Perpustakaan Negara Malaysia Cataloguing-In-Publication Data MANUAL - SPECIMEN DATABASE MANAGEMENT SYSTEM (SDBMS) FOR FAIR BIODIVERSITY DATA STEWARDSHIP e ISBN 978-629-7712-00-0
EXECUTIVE SUMMARY
This manual has been developed for the FAIR Biodiversity Data Stewardship Guidelines with regard to the use of the Specimen Database Management System (SDBMS) for the Biodiversity Data Management Workflow (See Chapter 4). The description of SDBMS and further explanation of the rationale and standards for each step listed in this manual can be found in the FAIR Biodiversity Data Stewardship Guidelines. The SDBMS can be downloaded at https://mybis.gov.my/pb/5399.
LIST OF FIGURES
Figure 4.6 Create new field in Taxonomy Information Table to include Storage Space Information (Part 2)
Figure 4.7 Create new field in Taxonomy Information Form to include Storage Space Information (Part 1)
Figure 4.8 Create new field in Taxonomy Information Form to include Storage Space Information (Part 2)
Figure 4.9 Create query for storage space label (Part 1)
Figure 4.10 Create query for storage space label (Part 2)
Figure 4.13 Customise report layout for storage space label (Part 1 – remove Page Header/Footer and Report Header/Footer)
Figure 4.14 Customise report layout for storage space label (Part 2 – Report View vs. Design View)
Figure 4.15 Customise report layout for storage space label (Part 3 – Change the size of the report and arrange the data fields in the report)
Figure 4.16 Customise
(Part
Figure 4.17 Customise report layout for storage space label (Part 5 – Grouping report item – label according to Storage Space –Full Storage Space Information)
Figure 4.18 Customise report layout for storage space label (Part 6 – text formatting)
Figure 4.19 Customise report layout for storage space label (Part 7 – Add text label to the information)
Figure 4.20 Customise report layout for storage space label (Part 8 – Remove “Alternate Back Color”)
Figure 4.21 Customise report layout for storage space label (Part 9 – Add line to mark the border of the label/report)
Figure 5.1. Design View of Query for information of recorded specimens per localities
Figure 5.2 Export Checklist report by localities from SDBMS to Microsoft Word file
Figure 5.3 Customise exported Checklist report by localities in Microsoft word for further editing
Figure
Figure 5.5 Export “Query to extract data” and save as Microsoft Excel spreadsheet
Figure 5.6 Using Pivot Table in Microsoft Excel to create biodiversity community data matrix
Figure 5.7 Remove empty column and row in biodiversity community data matrix
Figure 5.8 Add grouping of the species according to different taxonomy levels in biodiversity community data matrix
Figure
Figure 5.12 Select coordinates and title for the records (i.e., markers in the map)
Figure 5.13 Update the colour of the marker according to taxa
Figure 5.14 Update the taxa layer name and edit the title and description of the map
Figure 5.15 Export the Google My Maps as Google Earth KMZ file
LIST OF PROCEDURES
CHAPTER 1
PREPARING THE DATABASE FOR FIRST-TIME USERS
For first-time users and before using the SDBMS, it is important to check all the fields in all the tables of the SDBMS and change the tables, forms and reports of the SDBMS if necessary. At the same time, user may already have data that has been cleaned and normalised according to the data standard and format. In this case, user can import this data, especially staff profile information, taxonomy information and sampling information, into the SDBMS. However, it is advisable to import this data only once before using the SDBMS in a depository institution. Subsequent data entry should be done manually directly into the SDBMS.
After the SDBMS has been adapted and modified accordingly, you can create multiple copies of the SDBMS depending on the needs of the depository institutions, e.g. each collection with a separate SDBMS depending on the taxa group, for example, with a different collection code (see Procedure H).
1.1 CATALOGUING DATA FROM SPECIMENS
The data of the newly collected specimens from the field and the data from the existing collection are to be treated differently. While it is possible to impose a stricter requirement for completeness of data for new data, it is not realistic to apply the same requirement to backlog specimens as many old collections sometimes do not have complete data. However, the data attached to old specimens are still valuable for many purposes. It is important to remember that suboptimal data is better than none at all, and that the perfect should not be the enemy of the good. As long as the level of variable completeness and precision is clearly stated, the data can still be useful.
Data that were recorded in a physical logbook or are only available on the label of the specimen can be manually entered into the database. If the data are available in a digital spreadsheet, normalisation of the data in the spreadsheet is required. If the normalisation processes cannot be done, the data can still be entered manually into the SDBMS.
1.1.1 Personnel Profile Information
Throughout the workflow of managing biodiversity data, many personnel play different roles: as collectors of specimens from the field ("Recorded By" in the Sampling Information Table) and as curators who prepare and preserve the specimens (“Prepared By"), they identify the specimens to species level ("Identified By") and then catalogue the specimen data in a database ("Catalogued By"), all of which should be recorded in the Collection Information Table. One person can play all these different roles, therefore it is important to have a master list that contains the information of all the people in the workflow. The Personnel Profile Information Table in the SDBMS is used to store and manage all the profiles of the personnel in terms of their personal information, namely, "First Name", "Last Name", and "Initial Name". It is important that there is only one entry in the table for each person. Other profile information such as "Affiliation" and "Other Personal Information" must also be filled in the Profile Information Table, which can provide additional unique identification of users.
Procedure A. Add new fields to the table (example - Personnel Profile Information table)
1. Double-click on the “Personal Information” table (Step 1) (See Figure 1).

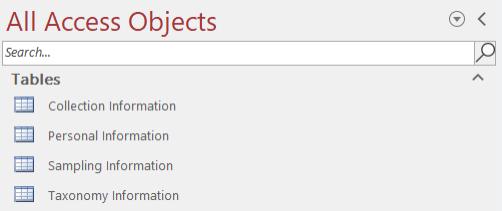
2. Once you have opened the Personnel Profile Information table, you will find a list with 5 fields for entering Personnel Profile Information. "ID" is automatically generated by the Table (See Figure 1.2).
3. User can add more fields to the Personal Information table if needed. Right-click on "Personal Information" and select "Design View". (Step 2) (See Figure 1.2).


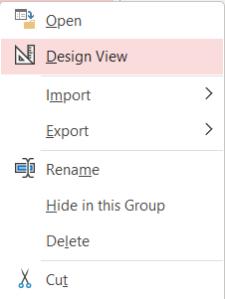
Figure 1.1 Information tables in the MS Access Database
Profile Information
Figure 1.2 Master list table for profile information
STEP 1 STEP 2
4. User SHALL NOT edit the existing “Field Name (A)” and “Data Type (B)” (See Figure 1.3).
5. User can add new field (Step 3) with an appropriate “Field Name (A)” and “Data Type (B)”.
6. After completed the update, click on the (×) icon to close the Table and click “Save”.


Design View of profile information table
Figure 1.3 Design view of profile information table
STEP 3
Data Type (B)
Field Name (A)
1.2 SAMPLING INFORMATION
Procedure B. Add new fields to the table (example – Sampling Information Table)
1. Double-click on the “Sampling Information” table (Step 1) (See Figure 1 4).

2. Right click on the “Sampling Information” and choose “Design View” (Step 2) (See Figure 1.5).

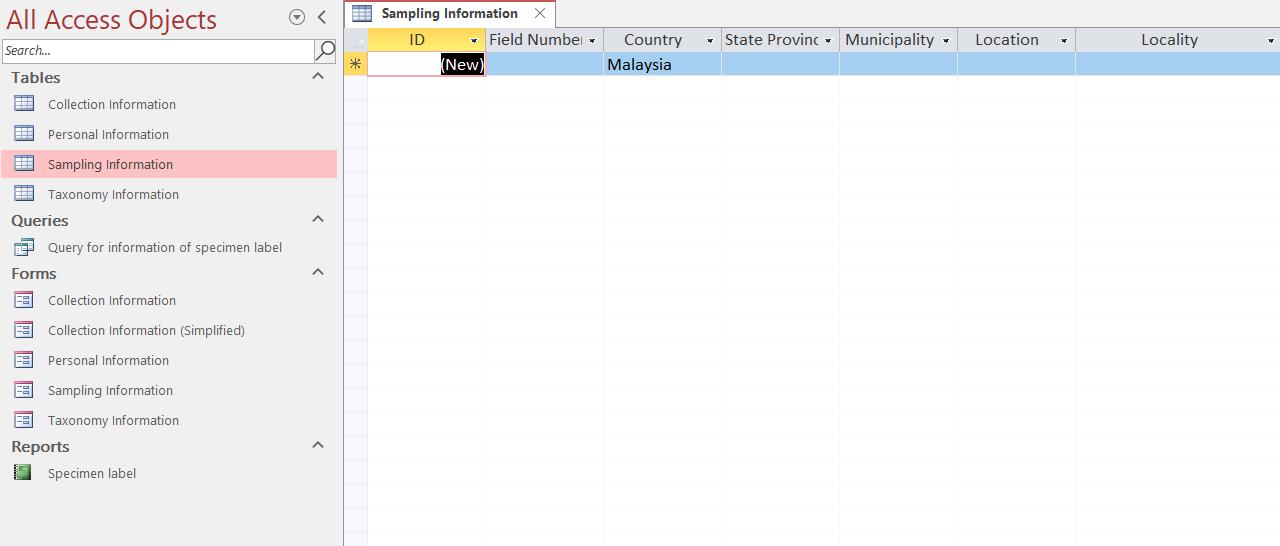

3. User SHALL NOT edit the existing “Field Name (A)” and “Data Type (B)” (See Figure 1.6).
4. User can add new field (Step 3) with an appropriate “Field Name (A)” and “Data Type (B)” according to user’s application.
5. User can edit the “Field Name (A)” to an appropriate heading according to user’s application of the database and define it by changing the “Data Type (B)” (See Figure 1.6).
Figure 1.4 Information tables in the MS Access Database
Sampling Information
Figure 1.5 Master list table for Sampling Information
STEP 1
STEP 2
6. After completed the update, click on the (×) icon to close the Table and click “Save”.


STEP 3


Design View of sampling information table
Figure 1.6 Design view of Sampling information table
Data Type (B)
Field Name (A)
Procedure C. Convert text fields in the form into a combo box and create a list of values in the combo box (example – Sampling Information Table)
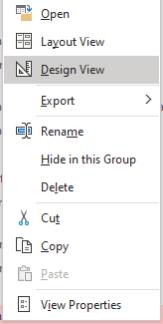
1. Double-click on the “Sampling Information” form (Step 1) on the left pane (See Figure 1.7).
2. The first four fields of the location details and the two fields of the sampling details (marked as red arrow) can be standardised by providing the standard value list to avoid confusion due to different spellings or different names for the same place and same sampling detail (A) (See
Figure 1.7)


Figure 1.7 Fields in the Sampling Information form that can be converted to a combo box to allow selection of predefined data or values
3. Right click on the “Sampling Information” (Step 2) and choose “Design View” (Step 3) (See
Figure 1.8). Right click at the “field” (Step 4) and select and chose “Change To” > “Combo Box” (Step 5).
STEP 3

STEP 2
STEP 4
STEP 5
Figure 1.8 Convert text field to Combo Box in Sampling Information form STEP 8 STEP 7
4. Double click on the “Field” (Step 6) to open “Property Sheet” of the “Field” and choose “Data” Tab (Step 7) (Figure 1.9). Select “Value List” in “Row Source Type (Step 8). Enter list of value in “Row Source”, with each value in quote - “ ” and separate each value with a semicolon - ; , for example, “Kulai”;“KotaKinabalu”;“Rawang” (Step 9).

Figure 1.9 Add values in the list of the Combo Box
5. After finalising the list of values in “Row Source”, click on the (×) icon to close the “Property Sheet” (Step 10) (Figure 1.10).
6. Right-click on “Sampling Information” form (Step 11) and choose “Open” (Step 12) (Figure 1.10). Enter data in the field with Combo Box to check (A).
STEP 10

STEP 12
STEP 11

Figure 1.10 Fields in the Sampling Information form that can be converted to a combo box to allow selection of predefined data or values
Data in the field (A)
1.3 TAXONOMIC INFORMATION
When users use the SDBMS for the first time, they can either enter the taxonomy information manually into the SDBMS or import tabular taxonomy information that follows the field names in the same format as the taxonomy information table directly into the SDBMS. Thereafter, the new taxa name can be added to the table from time to time by manual entry in the SDBMS. In addition to the default taxonomic classification level fields in the Taxonomy Information Table, user can add fields of other relevant classification levels according to the classification scheme for organisms. Whenever possible, the taxonomic information of each taxon (i.e., each entry) shall be provided at the lowest possible taxonomic level and at least at the “Kingdom”, “Phylum”, and "Class" levels.
In addition to taxa for which full taxonomic information is not available, it is worthwhile to establish a provisionally circumscribed genus or species name for a morphospecies in the Taxonomy Information Table for specimens that could not be identified to species or genus level during the cataloguing phase. In any case, the taxonomic information is considered curated data, as the taxonomic information may change, whether due to changes in taxonomic classification or misidentification of the collection. These are normal situations for many taxa, especially the invertebrates, whose classification is less stable compared to vertebrates. Therefore, the taxonomic information is not static and should be updated from time to time, and it is important to jot down the reasons causing the changes.
Procedure D. Add new fields to the table and form (example – Taxonomic Information Table)
1. Double-click on the “Taxonomy Information” (Step 1) on the left pane (Figure 1.11).

2. User shall check all the classification fields in Taxonomic Information table (Figure 1.12). User can add more columns by right-clicking (Step 2) at one of the columns and choose “Insert Field” (Step 3) (Figure 1.12).
3. Once user has added the “Field”, right-click on the “Taxonomy Information” (Step 4) and choose “Design View” (Step 5) to edit the “Field Name” and “Data Type” (Figure 1.12). User SHALL NOT edit the existing “Field Name” and “Data Type” in the Table, even if user does not need the fields in their workflow. However, user can create a duplicate of the complete form, then simplify it by removing some of the fields in the new duplicated form by following
Procedure E
Figure 1.11 Information tables in the MS Access Database STEP 1


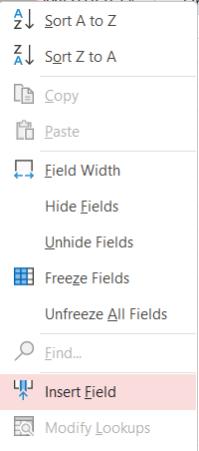
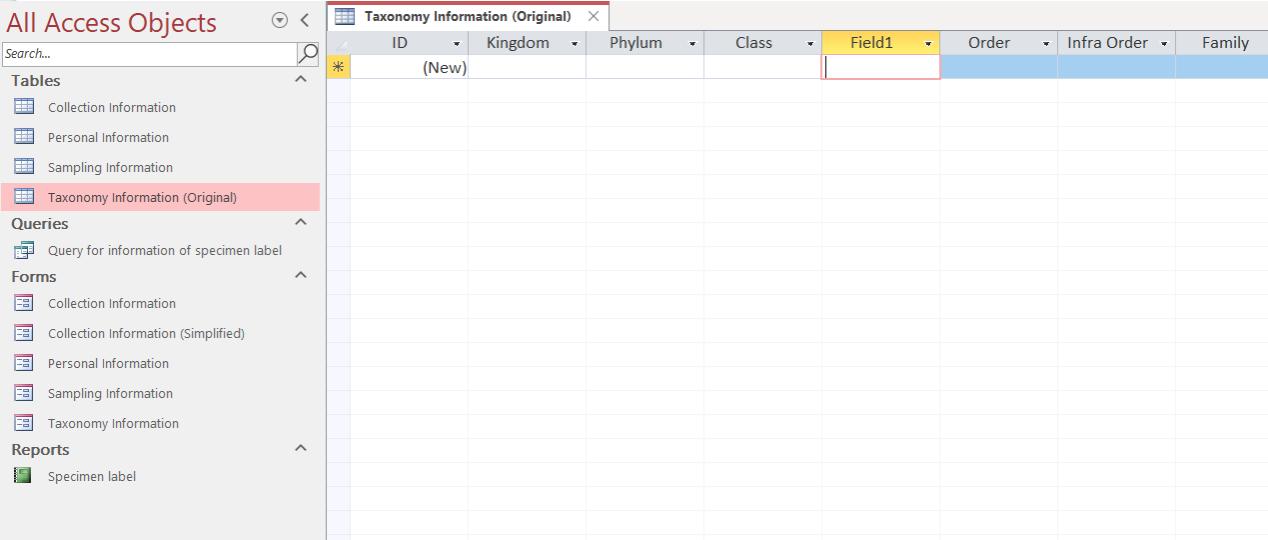
Figure 1.12 Add additional classification fields in Taxonomic Information table
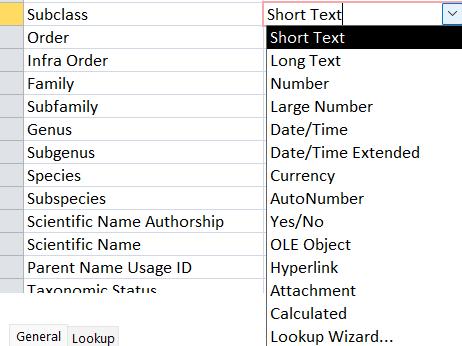
4. User can edit the new “Field Name” and define the “Data Type” (Step 6). For example, edit “Field 1” to “Subclass” (Step 7) and define it as “short text” from the drop-down options (Step 8) (Figure 1.13).
Design View for Taxonomic Information table
STEP 7
STEP 6
STEP 8
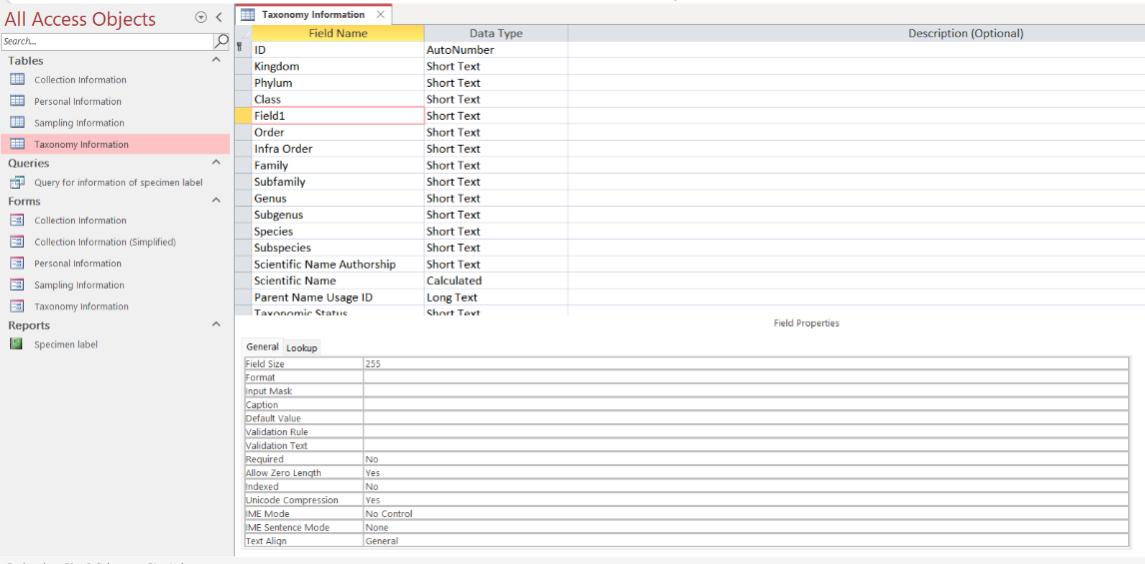

5. After finalising the update, click on the (×) icon to close the Design View and click “Save”.
6. After finalising the settings of the additional fields in Taxonomic Information table, user need to update the Taxonomic Information form as well to add the new fields into the form.
Figure 1.13 Design View of Taxonomic Information table
7. Double-click on the “Taxonomy information” under the “Forms” panel (Step 9) to open the Taxonomy information form (Figure 1.14).
8. User can add a new field, for example, the “Subclass” of the Taxonomy information table, into the form. Right-click on the taxonomic information form and choose “Design View” (Step 10) (Figure 1.14).


Figure 1.14 Taxonomy Information Form
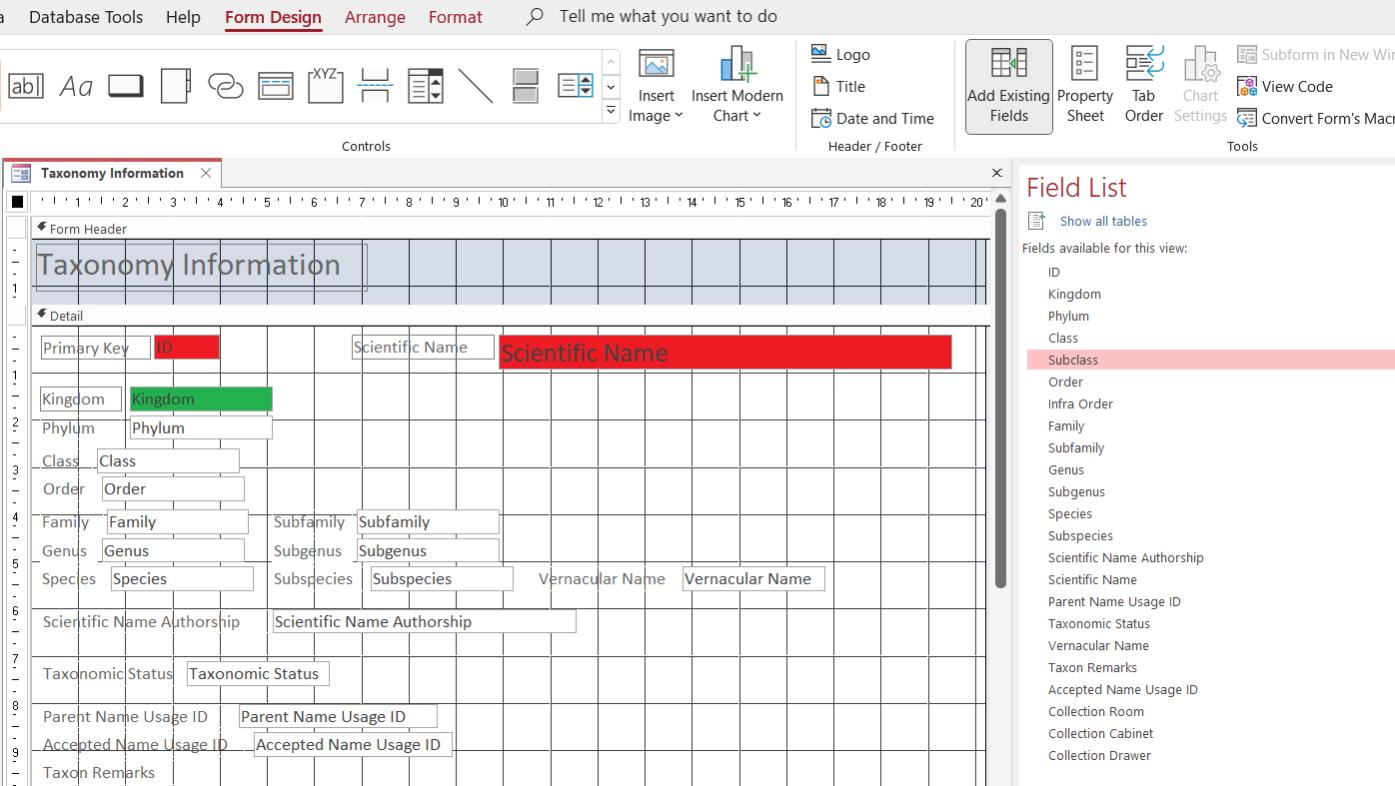
9. In design view, select to “Form Design” menu at the top (Step 11). Then, click on “Add Existing Fields” to open the “Field List” (Step 12) (Figure 1.15). STEP 10 STEP 9
STEP 11 STEP 12 STEP 15 STEP 14 STEP 13
Figure 1.15 Taxonomy Information Form design view
10. Select the new field by double-clicking on the “Subclass” (i.e., the new field), and it will appear in the form” (Step 13). Click on the (×) icon to close the “Field List” (Step 14) (Figure 1.15).
11. User can freely adjust the new field by clicking and dragging it into a preferred position in the form. Click on the (×) icon to close and click “Yes” to save (Step 15) (Figure 1.15).
Procedure E. Create a duplicated and simplified form (example – Taxonomic Information Table)
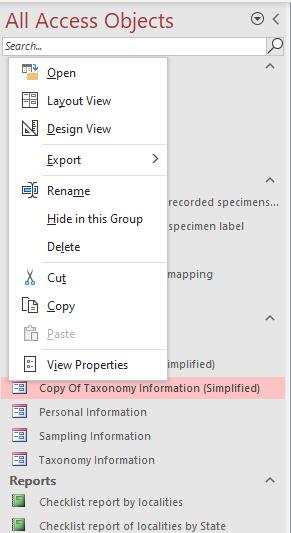
1. User can create a duplicate of the complete form and then simplify it by removing some of the fields in the new duplicated form (Figure 1.16).
2. Right-click on the form (Step 1) and select “Copy” (Step 2) (Figure 1.16). Then, right-click again on the form (Step 3) and click “Paste” (Step 4). Update the name of the newly duplicated form (Step 5) and click “OK” to save it (Step 6).
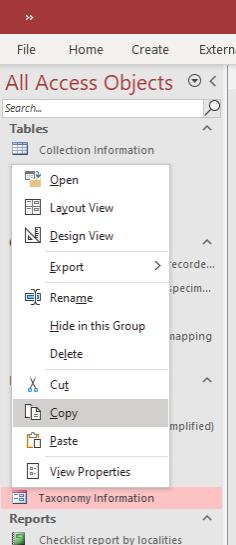
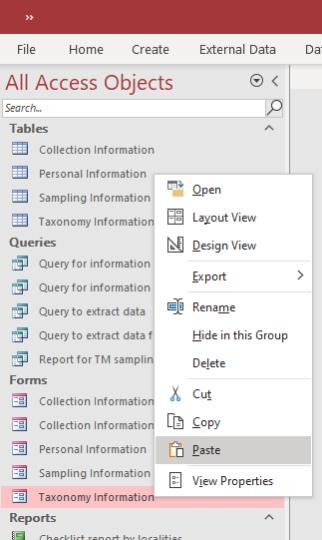

Figure 1.16 Create a duplicate form for editing and modification without changing the original field in the Tables
3. Select and right click on the new duplicate form (Step 7) and select “Design View” (Step 8) (Figure 1.17).
4. Click and drag selected field to remove (Step 9), the selected field will be highlighted in orange (Figure 1.17).
5. Right-click on the selected fields (Step 10) and select “Delete” (Step 11) (Figure 1.17).
6. After finalising the modification of the form, click on the (×) icon (Step 12) to close the form and click “Yes” to save the form (Figure 1.17).
STEP 8 STEP 12
STEP 7
STEP 9

STEP 11 STEP 10
Figure 1.17 Removing field in the form to simplify the form
Procedure F. Import a new table with data to replace the original table in SDBMS (example – Taxonomic Information Table)
There are two methods to insert field data into the database. The first method is to insert data manually one by one using the information table or form after Procedures D. The second method is by importing taxonomic information that was compiled by the user into SDBMS. However, this can be done only once.
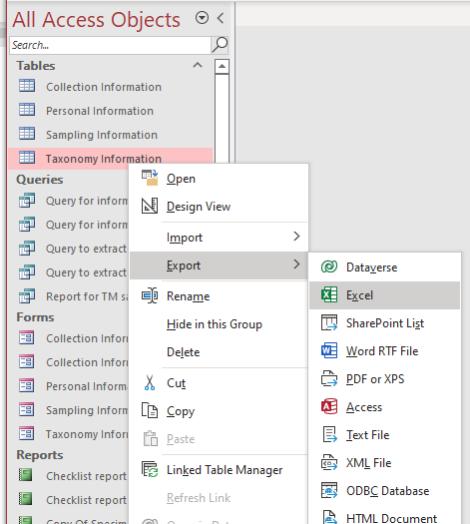
1. Right-click on the Table (Step 1), click “Export” (Step 2) and select “Excel” (Step 3) (Figure 1.18).
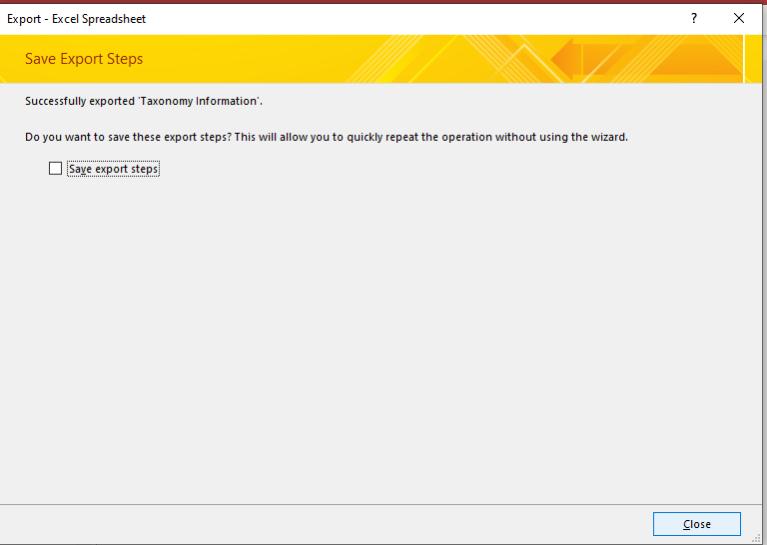
2. Choose the location in the computer to save the Excel Template of Taxonomic Information table (Step 4), click “OK” (Step 5) and then click “Close” (Step 6) (Figure 1.18).
STEP 2
STEP 4
STEP 1
STEP 3

STEP 5
STEP 6
Figure 1.18 Create Excel Template for finalised Taxonomic Information table
3. Open the Excel Template and complete the data for Taxonomic Information (Figure 1.19).
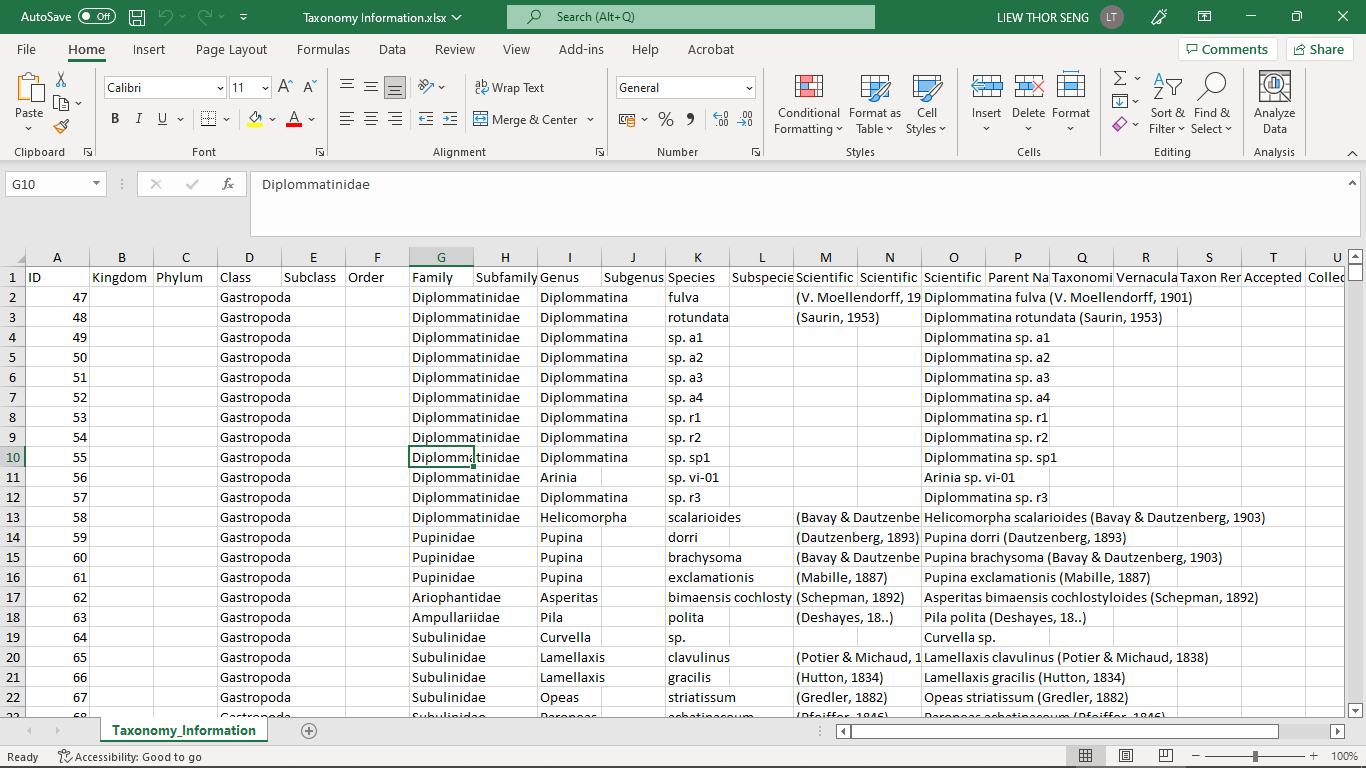
Figure 1.19 Excel template for taxonomic data to be completed and then imported into SDBMS
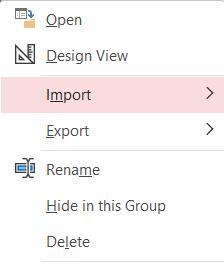
4. Select and right-click on the table (Step 7), select “Rename” (Step 8) and rename the original table (Step 9) (Figure 1.20).
5. Select and right-click on the table again (Step 10), select “Import” (Step 11) and select “Excel” (Step 12) (Figure 1.20) to open “Get External Data- Excel Spreadsheet” (Figure 1.21).

STEP 8

STEP 7
STEP 9

STEP 12


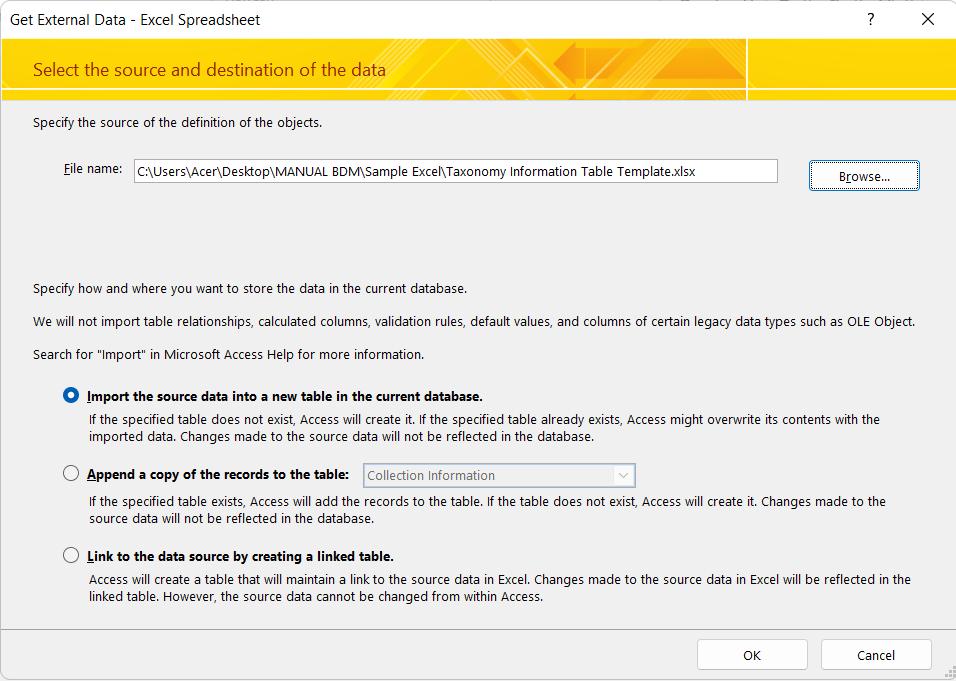
7. Select “Import the source data into a new table in the current database” (Step 15) and then click “OK” (Step 16) (Figure 1.21). STEP 10 STEP 11
Figure 1.20 Rename the original Taxonomy Information table and create a new Taxonomic Information table by importing data from Excel template into SDBMS
6. In “Get External Data- Excel Spreadsheet”, browse ( ) to select the Excel file and click “Open” (Step 14) (Figure 1.21).

STEP 13
STEP 15 STEP 16

Figure 1.21 Import new table to SDBMS. “Get External Data – Excel Spreadsheet” and “File Open” popup windows
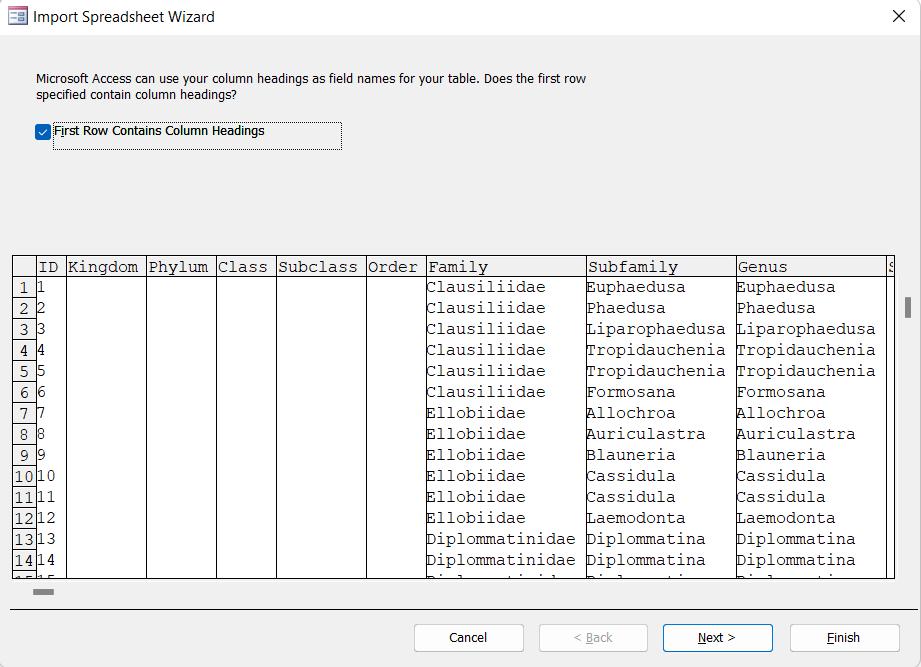
8. Check the “First Row Contains Column Headings” box (Step 17). Then, click “Next >” to proceed (Step 18) (Figure 1.22).
STEP 17
STEP 18
Figure 1.22 Import Spreadsheet Wizard popup window (Part 1)
STEP 14
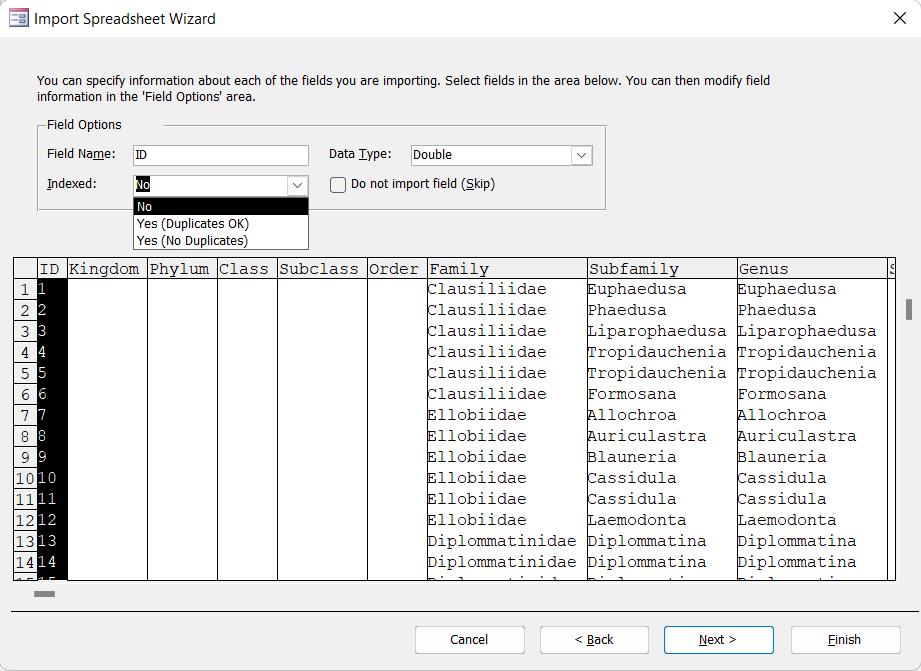
9. In the popup window, select “No” for “ID” at the “Indexed” (Step 19) and click “Next >” to proceed (Step 20) (Figure 1.23).
10. Select “Choose my own primary key” option (Step 22) to set the primary key “ID” from the imported Excel spreadsheet. Click “Next >” to proceed (Step 22) (Figure 1.23).

STEP 21
STEP 22
Figure 1.23 Import Spreadsheet Wizard popup window (Part 2)
STEP 19
STEP 20
11. Enter the original name of the table to be replaced (see No. 4 – No. 5) in the “Import to Table:” (Step 23) Click “Finish” to save the name of the new table into the database (Step 24) (Figure 1.24).
12. Click “Close” to complete the import of the Excel spreadsheet into the database (Step 25) (Figure 1.24).
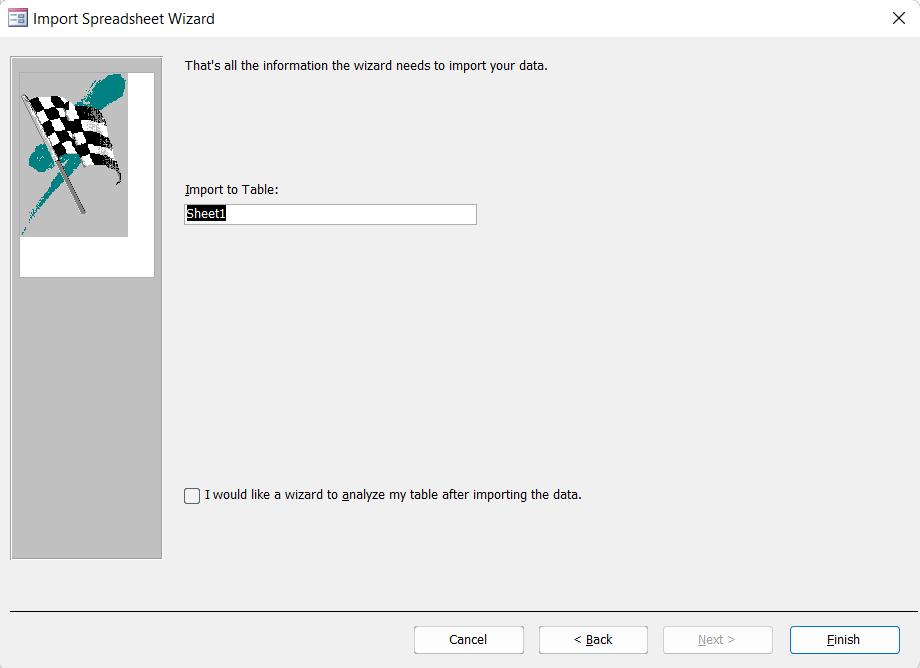
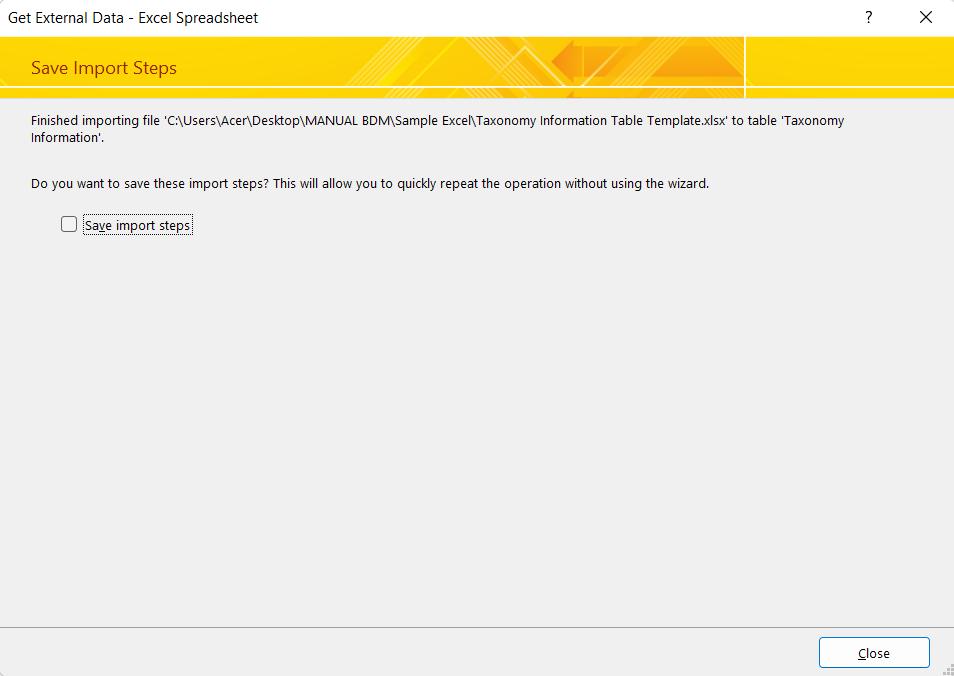
Figure 1.24 Import Spreadsheet Wizard popup window (Part 3)
STEP 23
STEP 24
Rename the new table
STEP 25
13. Click on the imported “Taxonomy Information” (Step 26) (Figure 1.25).


Figure 1.25 New “Taxonomy information” table added into one of the master lists STEP 26
14. Check the field and data of the newly imported table (Figure 1.26).
Imported taxonomic information

1.26 Imported taxonomic information table
1.4 COLLECTION INFORMATION
For the catalogue data element, “Institution Code”, “Collection Code”, and "Catalogue Number" are required. The concatenation of these three data into "Full Catalogue Information" must be a unique value. This is static data generated by the institution and serves as a unique identifier for the specimens and the other information associated with the specimens. The specimens cannot be catalogued until the depository institutions have given them an accession number. Reserving catalogue numbers should be avoided as it will mess up the running catalogue number sequence and create unnecessary confusion in future.
Figure
For the specimen with existing collection numbers (e.g., donated specimens from other depository institutions), the original voucher specimen number shall be entered in the field "Other Catalogue Numbers". If the specimen is a type specimen, then record this data in the field "Type Status". It is strongly recommended to enter the details of the person who catalogued the specimen in "Catalogued By". If the specimen is used in a publication, the citation of the scientific publication shall be indicated under "Material Citation".
Procedure G. Set default values in the fields ((example – Collection Information Table)
1. Right-click on the Collection Information table (Step 1), select “Design View” (Step 2) (Figure 1.27).
2. Click on “Institution Code” (Step 3) and select “General” Tab (Step 4) (Figure 1.27).
3. Enter the default value or text in “Default Value” for the institution code, for example, “BOR” (Step 5) (Figure 1.27).
4. Repeat No. 2 – No. 3, but for “Collection Code” (Step 6), enter the Collection Code that represents the Taxa Code in the depository institution, for example, “MOL” (Figure 1.27).
5. Click on the (×) icon to close the Table and click “Yes” to save.

STEP 2
STEP 1
STEP 6
STEP 3
STEP 4
STEP 5
Figure 1.27 Set default values for Institution Code and Collection Code for Collection Information table
Procedure H. Duplicate SDBMS for different collections under the same Depository Institution
1. Open Microsoft Access and create a new SDBMS for a collection, for example, Mammal collection in BORNEENSIS, by clicking on “Blank database” (Step 1) (Figure 1.28).
2. Name the new database (Step 2) and click “Create” (Step 3) (Figure 1.28).

Figure 1.28 Create a new database for a collection under the same depository institute (i.e., same Institution Code, but different Collection Code)
3. Click on “External Data” form the Menu (Step 4), click “New Data Source” (Step 5), select “From Database” (Step 6), and then click “Access” (Step 7) (Figure 1.29).
4. Click on “Browse” to locate SDBMS (Step 8), select the SDBMS (Step 9), Click “Open” (Step 10), and then click “OK” (Step 11) (Figure 1.29).


Figure 1.29 Import database structures and definition (Part 1)
5. Click on the “Tables” tab (Step 12) and click “Select All” (Step 13) (Figure 1.30).
6. Repeat No. 5 - (Step 12) and (Step 13) for the remaining Tabs, namely, “Queries”, “Forms”, and “Reports” (Figure 1.30).
7. Click on “Option >>” (Step 14) and select “Definition Only” (Step 15) (Figure 1.30).
8. Click “OK” (Step 16) and then click “Close” (Step 17) (Figure 1.30).
9. A new SDBMS has been created with the same setting and modifications that were done in Procedures A – G

16


Figure 1.30 Import database structures and definition (Part 2)
10. Update the Collection Code by right-clicking the Collection Information table (Step 18) and click “Design View” (Step 19) (Figure 1.31).
11. Select “Collection Code” (Step 20) and update the “Default Value”, for example, change “MOL” to “MAMM” (Step 21) (Figure 1.31). STEP 15
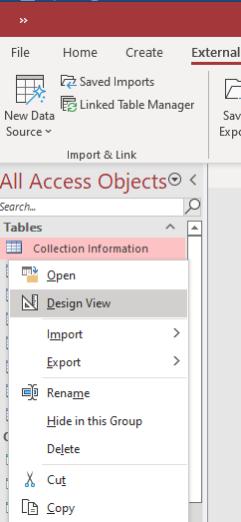

Figure 1.31 Update Collection Code for the new SDBMS
CHAPTER 2
CATALOGUING SPECIMEN DATA
The normal sequence of data entry is as follows:
- Enter collector information of the sampling event in the Personnel Profile Information form if the collector is not in the Personnel Profile Information list of SDBMS.
- Enter sampling information.
- Enter taxonomy information in the Taxonomy Information table or form if the taxa are not in the list Taxonomy Information of SDBMS.
- Enter collection information in the Collection Information form.
2.1 PERSONNEL PROFILE INFORMATION
Throughout the workflow of managing biodiversity data, many personnel play different roles: as collectors of specimens from the field ("Recorded By" in the Sampling Information Table) and as curators who prepare and preserve the specimens (“Prepared By"), they identify the specimens to species level ("Identified By") and then catalogue the specimen data in a database ("Catalogued By"), all of which should be recorded in the Collection Information Table. One person can play all these different roles, therefore, it is important to have a master list that contains the information of all the people in the workflow. The Personnel Profile Information Table in the SDBMS is used to store and manage all the profiles of the personnel in terms of their personal information, namely, "First Name", "Last Name", and "Initial Name". It is important that there is only one entry in the table for each person. Other profile information such as "Affiliation" and "Other Personal Information" must also be filled in the Profile Information Table, which can provide additional unique identification of users.
Procedure I. Enter data in the Form (example – Personnel Profile Information Table)
1. Double-click on the “Personal Information” under the “Forms” panel (Step 1) to open the Personal information form (Figure 2.1). User can key in profile information into the form, and it will be updated simultaneously in the Personal information table. “ID” will be automatically generated by the Form.
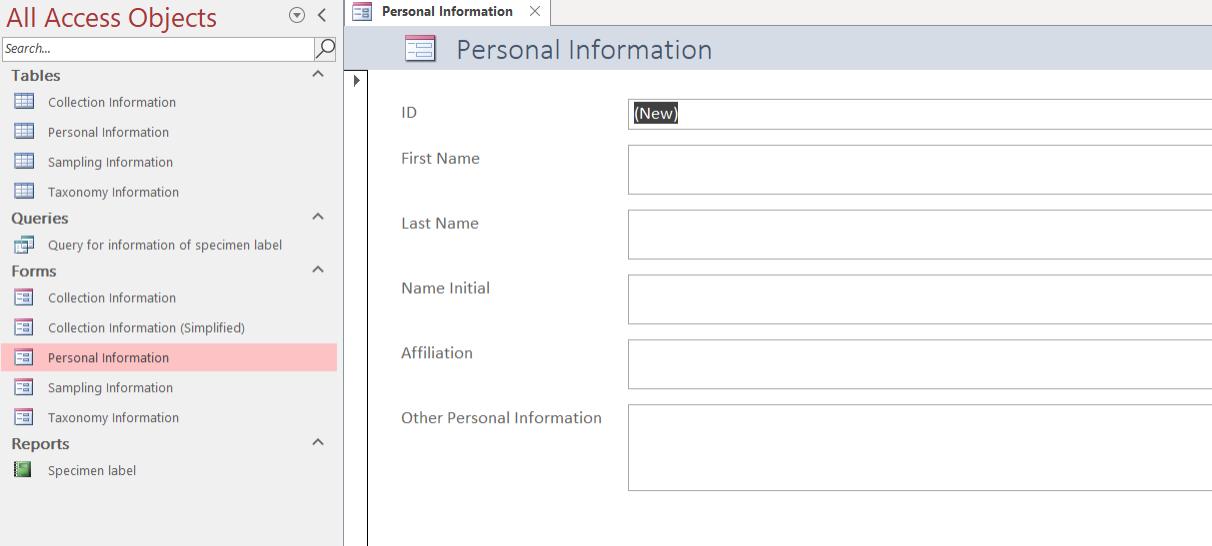

2.1 Personal Information form (Part 1)
2. After completing the data, user can click “New (blank) record” to enter the next record (Step 2). However, it is important to make sure there is no re-enter of the same record (same individual profile) in the SDBMS, and user can enter the name of the personnel in the “Search” box (Step 3) (Figure 2.2).
Personal Information form
STEP 1
Key-in information
Figure
3. After completing the data entry, click on the (×) icon to close and save the form with the keyedin information into the database (Step 4) (Figure 2.2)

Figure 2.2 Personal Information form (Part 2)
2.2 SAMPLING INFORMATION
The sampling data must be entered into the database as soon as possible to avoid loss of information. In the SDBMS, there are 16 fields in the sampling information table relating to GPS data, location data, elevation data, temporal data, sampling protocol data, of which 14 fields are required for newly collected specimens, one field is required when available, and one field is strongly recommended.
2.2.1 Newly collected specimens from the field
First, enter the "field number", which is a unique identifier for the sampling event. This information can be the reference of the sampling event recorded in the logbook of the data collector, e.g., ‘2022.Ali.01’, which means the first sampling event made by Ali in 2022. The field number must be as short but as informative as possible so that entering the sampling information for the specimen can be done more effectively by simply selecting the field number rather than reading and searching for the location details.
Next, enter the verbatim description of the site: "Country", "State Province", "Municipality", "Location", "Locality", and "Habitat". The first four fields can be standardised by providing the standard value list to avoid confusion due to different spellings or different names for the same place. For the "Locality", the description must be as detailed as possible, if possible, not only the name of the place, but with additional information that helps to identify the place.
In addition to the textual description of the location, it is important to include the coordinates "Decimal Latitude" and "Decimal Longitude" of the location or area, as the name of the location may change over time. If samples have been taken from more than one location in an area, the coordinates of the centroid of the area may be used, and a note of this needs to be made in the "Location Remarks". It is also recommended that the "Verbatim Elevation" of the area be entered in the sampling information.
It is recommended that the data collector enters information such as "Location Remarks" and "Location According To", especially when the coordinates of GPS are not available or the location description is based on the collector's own interpretation of the information on the specimen's label. Finally, the information on "Event Date", "Recorded By", "Sampling Protocol", and "Sampling Effort" are required. It is important that the sampling design, methods, and effort are specified to allow better inferences and to improve the re-use of data and the reproducibility of the analysis.
2.2.2 Existing specimens in collections with incomplete sampling data
Usually, Sampling information can be completed for new data or existing collections with complete data. However, for existing collections with incomplete data or data lacking accuracy in the datasheet or on the specimen label, it is important to digitise all the sampling information that is available. Do not dispose of the specimen as it can still be very useful for taxonomy and larger scale inventory research for coarser resolution data, such as general location description. Georeferenced the textual locality can still be estimated based on the gazetteer.
Procedure J. Enter data in the Form (example – Sampling Information Table)
1. Double-click on the “Sampling Information” from (Step 1) on the left pane (Figure 2.3).
2. User can start to key in the available data manually one by one using the “Sampling information form” (Step 2) (Figure 2.3). “ID” will be automatically generated by the Form.
STEP 1
STEP 2
3. In the form, user can key in sampling-related information by using the values in the dropdown list of the Combo Box (A) (Figure 2.3). Please refer to Procedure C for the steps to set up the value list in a Combo Box.
4. For collector information, it needs to be recorded in “Recorded By” in two different ways (Figure 2.3).
Data in the Combo Box (A)
Procedure C
Figure 2.3 Sampling information form
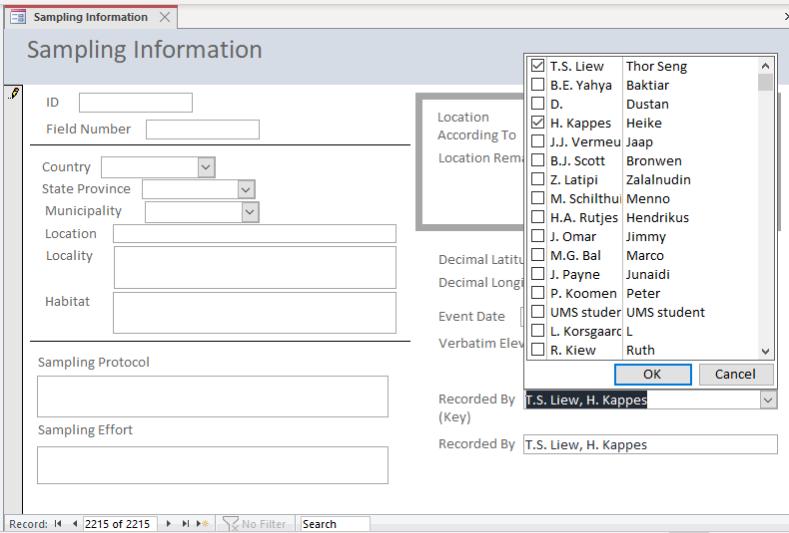
5. First, click on the Combo Box “Recorded By (Key)” (Step 3), then select the collectors by checking the box before the name; multiple selections are possible (Step 4), then click “OK” (Step 5) (Figure 2.4). If the names are not available in the list, user needs to close the Sampling Information form, and then follow Procedure I before reopening the Sampling Information form to continue the data entry.
6. Second, retype the information as shown in “Recorded By (Key)” into “Recorded By” (Step 6) (Figure 2.4).
2.4 Enter collector information
Figure
7. After completing the data entry for the sampling event, user can click “New (blank) record” to enter the next sampling event (i.e., next record) (Step 7) (Figure 2.5).
8. Click on the (×) icon to close and save the form with the keyed-in information into the database (Step 8) (Figure 2.5).
STEP 7

Figure 2.5 Save and enter the next record STEP 8
2.3 COLLECTION INFORMATION
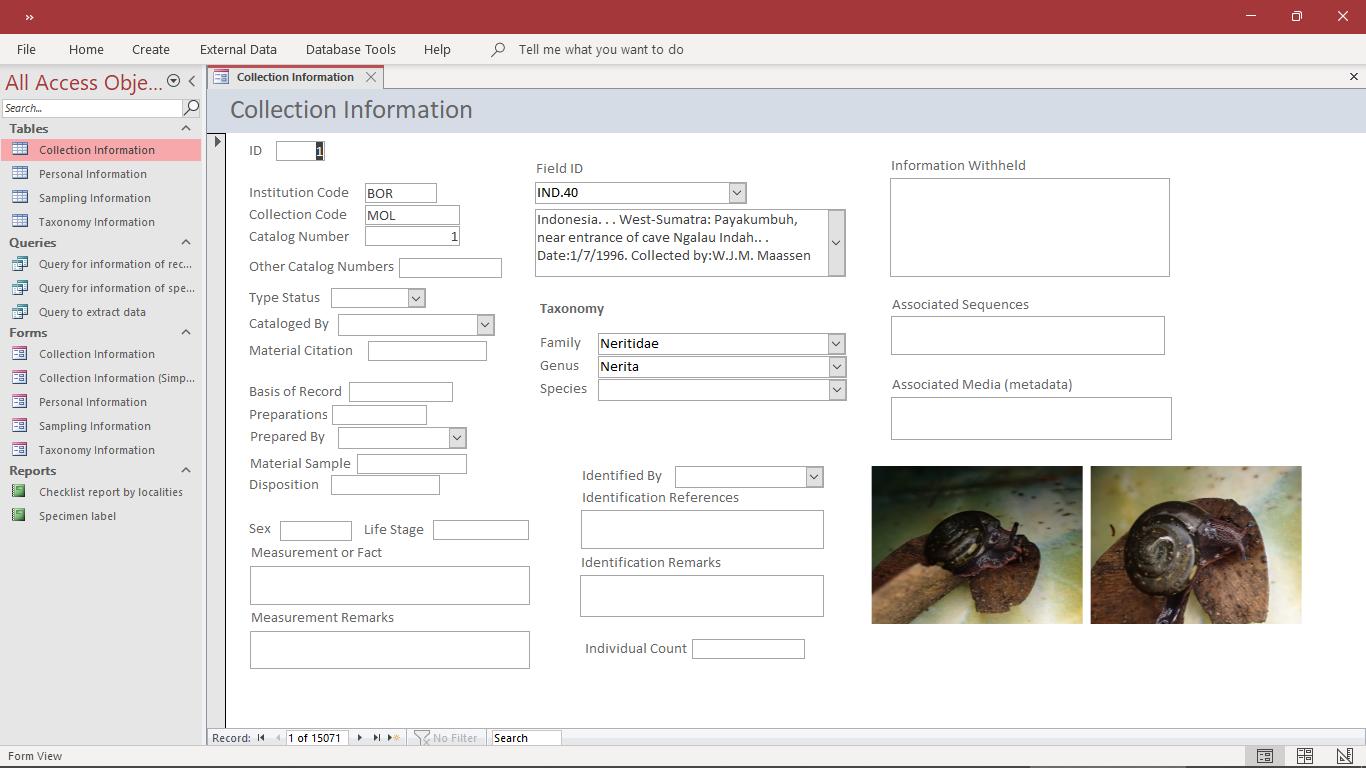
After the specimens collected from the field have been processed and stored, the collection information is then created. In the SDBMS, there are 26 fields in the collection information table, of which nine fields are required for newly collected specimens, two are required when available, 10 are strongly recommended, and five are recommended when available They are related to catalogue data, specimen collection data, specimen biological data, other specimen data, sampling data and taxonomic data (Figue 2.6). All of these are entered as new information by the data collector and data curator, except for the sampling and taxonomic data, which come from the Taxonomic Information Table and the Sampling Information Table.

2.6 Collection information form
2.3.1
Catalogue data
For the catalogue data element, "Institution Code"; "Collection Code"; and "Catalogue Number" are required. The concatenation of these three data into "Full Catalogue Information" must be a unique value. For the specimen with existing collection numbers (e.g., donated specimens from other depository institutions), the original voucher specimen number shall be entered in the field "Other Catalogue Numbers". If the specimen is a type specimen, record this data in the field "Type Status". It is strongly recommended that user enter the details of the person who catalogued the specimen in "Catalogued By".
Figure
2.3.2 Taxonomy and sampling data
We do not need to re-type country, state, locality, Kingdom, Phylum, Class, etc. again as the collection information is linked with taxonomy information and sampling information, and these data can be searched from a drop-down list at each field in the Collection Information Table. It is strongly recommended to enter the data on "Identified By", "Identification References", and "Identification Remarks" (Figure 2.6). If the collection cannot be identified at the species level, it is still important to label it at a higher taxonomic level for storage in depository institutions, as most institutions arrange and organise collections according to taxonomy.
2.3.3 Specimen collection data
Next, the descriptions of the specimen collection lots are required in terms of "Individual Count", "Preparations", and "Material Sample". At the same time, other information such as "Basis of Record”, "Prepared By", and "Disposition" are strongly recommended to be entered into the database (Figure 2.6).
2.3.4 Specimen biological data
Some biological data of the specimens might have been collected in the field or during the processing of the specimens, for example, measurements, colours and other fields of the morphological features of the specimens. If these data are available, it shall be entered into the SDBMS. These data with the status "recommended when available", includes "Sex", "Life Stage", "Measurement or Fact", and "Measurement Remarks” (Figure 2.6). Much of this biological data obtained from specimens immediately after their collection or preservation is valuable, as some of the characteristics may be lost after the death of the organisms and the preservation process.
2.3.5 Other specimen data
It is important to enter information into the database when the "Associated Media" and "Associated Sequences" are available (Figure 2.6). For "Associated Media", data users and curators can enter the data on the Digital Object Identifiers (DOI) of the images or videos in publications or online repositories
For some specimens, some information may be available but not entered in the designated fields of the tables. This information and the explanation for this decision shall be entered in the field "Information Withheld". Special attention must be given to sensitive data to prevent potential threats to biodiversity
Procedure K. Enter data in the Form (example – Collection Information Table)
1. Double-click on the “Collection Information” form (Step 1) (Figure 2.7).

STEP 1
Figure 2.7 Collection information form
2. Enter the core data for Collection Information (Step 2), if the default value for “Institution Code” and “Collection Code” do not appear as default value, user may close the Collection Information form and proceed to Procedure G, and then reopen the Collection Information form to continue data entry (Figure 2.8). “ID” will be generated automatically.
3. Enter the “Catalog Number” (Step 3) (Figure 2.8).
STEP 5
STEP 2
STEP 4
STEP 3
STEP 6
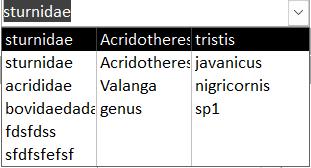
Figure 2.8 Enter the core data in “Collection information” form
4. Enter the core data for Personnel Information (Step 4), if the personnel profile does not appear in the list of Combo Box, user may close the Collection Information form and proceed to Procedure I, and then reopen the Collection Information form to continue data entry (Figure 2.8).
5. Enter the core data for Sampling Information (Step 5), if the Sampling information does not appear in the list of Combo Box, user may close the Collection Information form and proceed to Procedure J, and then reopen the Collection Information form to continue data entry (Figure 2.8).
6. Enter the core data for Taxonomic Information (Step 6) (Figure 2.8), and then proceed to Step 10. If the taxonomy information does not appear in the list of Combo Box, user may close the Collection Information form and proceed to Step 7 (Figure 2.9).
7. Double-click (Step 7) to open the Taxonomic Information form (Figure 2.9).

Figure 2.9 Enter the data in “Taxonomic information” form
STEP 7
STEP 8
STEP 9
8. Enter the data (Step 8) into the Taxonomic Information form (Figure 2.9) and then click on the (×) icon to close the form (Step 9).
9. Reopen the Collection Information form and enter the Taxonomic Information for the collection (Step 6) (Figure 2.8).
10. Enter the remaining data into the Collection Information form (Step 10 – see dotted boxes) (Figure 2.10).
11. Click “New (blank) record” to enter the next data for the next collection lot/specimen (Step 11) (Figure 2.10).
12. Click on the (×) icon to close the form (Step 12) (Figure 2.10).

STEP 11
STEP 12
STEP 10
Figure 2.10 Enter the other data in “Collection information” form
2.4 LINK THE IMAGES OF THE SPECIMENS TO THE SPECIMEN DATABASE
MANAGEMENT SYSTEM (SDBMS) AND DISPLAY THEM IN THE COLLECTION
INFORMATION FORM
It is possible to link and display images of the specimens with SDBMS (Figure 2.11). Instead of embedding and storing the images in SDBMS, which will exponentially increase the size of the database and compromise SDBMS functionality, it is better to store all the images in a folder on the external or internal storage of the computer.
The images of each specimen/collection can be viewed by specifying the path to the image folder in the Collection Information table under “Associated Media” and then adding image objects in the Collection Information form by specifying the source of the image as specified in “Associated Media”. The default path for the image folder is “C:\images\” and the images shall have the format “.jpg”. Each image shall be named with the catalogue number of the specimen, e.g., “15011.jpg”. If there is more than one image for each specimen/collection, the image files shall be named with the same catalogue number followed by the second level of the numbering, e.g., “15011.1.jpg”, “15011.2.jpg”, “15011.3.jpg”, etc.
In the default template of the Collection Information table and form, two images can be displayed for each collection, but more image objects can be added to the table and form. It is advisable to standardise the second level of numbering in the image file name with the type of specimen images, e.g., “#####.1.jpg” for an image in ventral view, “#####.2.jpg” for an image in dorsal view, etc.
Specimen images


Figure 2.11 Display the images of the specimens in the default Collection Information form
Procedure L. Link the images of the specimens to the SDBMS and display them in the Collection Information form
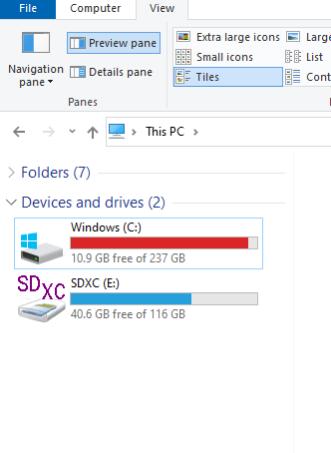
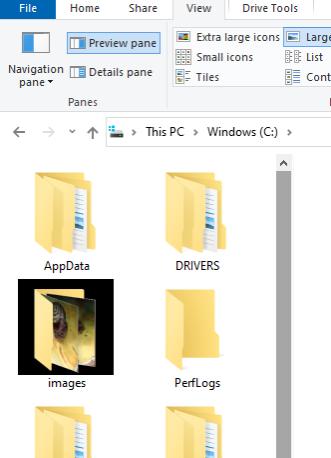
1. Open drive “C” in the computer (Step 1). Create a new folder and name it “images” (Step 2) (Figure 2.12).
2. Store all the images with “jpg” file format in the “images” folder (Step 3) (Figure 2.12).
3. Each image shall be named with the catalogue number of the specimen, e.g., “15011.jpg”. If there is more than one image for each specimen/collection, the image files shall be named with the same catalogue number followed by the second level of the numbering, e.g., “15011.1.jpg”, “15011.2.jpg”, “15011.3.jpg”, etc (Step 3) (Figure 2.12).
STEP 1 STEP 2

STEP 3
Figure 2.12 Display the images of the specimens in the Collection Information form
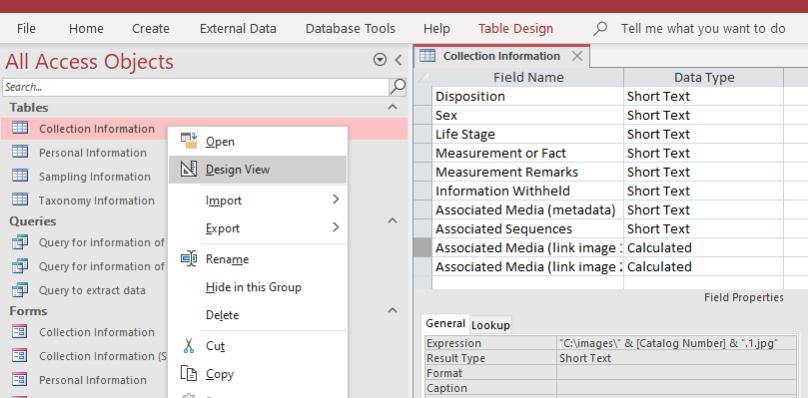
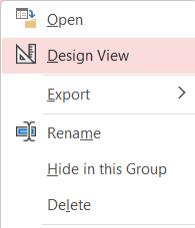
4. Open SDBMS and right-click on “Collection Information table (Step 4) and then select “Design View” (Step 5) (Figure 2.13).
STEP 4
STEP 5
STEP 6
Figure 2.13 Design view of Collection Information table
5. Select one of “Associated Media” (Step 6) (Figure 2.13), right-click on the selected row, and then click “Copy” (Step 7) (Figure 2.14).
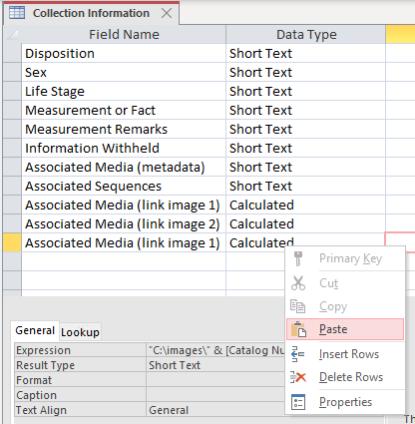
6. Right-click on the new row (Step 8), then click “Paste” (Step 9) to create a new “Associated Media” field (Figure 2.14).
7. Update the new “Associated Media” field name; for example, change “… (link image 1)” to “… (link image 3)” (Step 10) (Figure 2.14).
8. Update the “Expression”; for example, change ‘…& “. 1.jpg”’ to ‘…& “. 3.jpg”’ (Step 11) (Figure 2.14).
9. Click on the (×) icon to close the form (Step 12) and click “Yes” (Figure 2.14).
STEP 8
STEP 7

STEP 9
STEP 12
STEP 10

STEP 11
Figure 2.14 Add a new image field in the Collection Information table
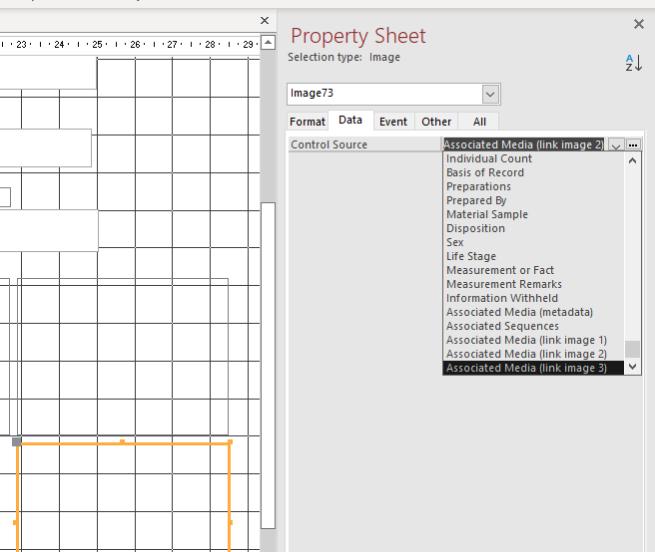
10. Right-click on the Collection Information form (Step 13) and select “Design View” (Step 14) to modify the image objects in the form (A) (Figure 2.15).
11. Right-click on one of the image objects in the Collection Information form (Step 15), select “Copy” (Step 16) and then right-click on the same selected image object, then select “Paste” (Step 17) (Figure 2.15). Move the copied image object to the designated location on the form.
12. Double click on the new image object (Step 18) and select the “Data” tab in “Property Sheet” (Step 19) (Figure 2.15).
13. Click “Control Source” (Step 20) to select the newly created “Associated Media” of the table (Step 21) (Figure 2.15). Click on the (×) icon to close the form and click “Yes”.


21
Figure 2.15 Add a new image object in the Collection Information form
CHAPTER 3
LABELLING
In the labelling stage, specimens must be labelled based on the information created in the cataloguing stage while initial preservation and at least preliminary sorting of specimens are completed, and specimens may be temporarily held in the processing laboratory for further examination and identification.
The label should be attached to the specimen at any time. There is a function in the SDBMS that enables the user to print labels once the specimens are catalogued. The data collector and curator can select the information in SDBMS, customise the format, including text font format and label size, and then create a label that is saved in PDF format for printing. In any circumstances, three important pieces of information must be included on the label, namely (1) "Full Catalogue Information" consisting of "Institution Code", "Collection Code" and "Catalogue Number", (2) "Field Number" and as much detail of the sampling information as can be accommodated on the label, and (3) "Taxonomic Information”. A label indicating the specimens are donated shall be attached to the specimens. Data curators, data users and data custodians shall bear in mind that any original labels with the specimens shall not be removed.
Procedure M. Selection of collection data and creation of a label for the specimen
1. Double-click on the “Query for information of specimen label” (Step 1) (Figure 3.1).

2. Right-click on the “Query for information of specimen label” and choose “Design View” (Step 2) (Figure 3.1).
3. Select the records from the SDBMS by specifying the query “Criteria” of the “Catalogue number” (Step 3) (Figure 3.2). “Criteria” for “catalogue number”:
a. For one record – enter exactly a value, such as a catalogue number, for example: 100. User to enter 100 in the “Criteria”.
b. For more than one record with continuous catalogue number, for example, 100 – 110. User to enter >=100 And <=110 in the “Criteria”.
c. For more than one record with discontinuous catalogue numbers, for example, 100, 102, 109. User to enter 100 OR 120 OR 109 in the “Criteria”.
d. For a catalogue number larger than a catalogue number, for example: records after 100. User to enter >= 100 in the “Criteria”.
4. Click “Run” (Step 4) to create the query for the list of records to be included in the “Specimen label” report (Figure 3.2).
5. Close the table by clicking (×) (Step 5) icon and click “Yes” to save the Query (Figure 3.2).
Figure 3.1 Query for information of specimen label
STEP 2

7. User can print the label by clicking on the “Print” (Step 9) (Figure 3.3). STEP 3 STEP 4

Figure 3.2 Design view of Query for information of specimen label STEP 7 STEP 8 STEP 6 STEP 9
6. Double-click on the “Specimen label” report (Step 6), click “View” (Step 7) and select “Print Preview” (Step 8) (Figure 3.3).
3.3 Specimen label of SDBMS STEP 5

Figure
CHAPTER 4
CURATING AND STORING
The collections shall be deposited in the collection facilities as soon as the processing and analysis of the specimen collection is completed. The collections must be stored in the designated collection facilities as soon as possible. Normally, the collections are stored in drawers and cabinets according to the taxonomic classification. Therefore, the information on storage in the collection facilities, which consists of the information "Collection Room", "Collection Cabinet" and "Collection Drawer", is included in the Taxonomic Information Table of the SDBMS. All collections of the same taxonomic unit, e.g., the same species, shall be stored in the same storage room adjacent to the other species of the same genus.
In a well-established depository institution, its storage facilities are more structured and organised where the entire storeroom has been catalogued and defined. In this case, a storage information table can be created in SDBMS for the depository institution, and reports such as the labelling of cabinets and a checklist of collection items in the storage room can be created.
Procedure N. Search and update the storage information
1. Right-click on the Taxonomy Information Table (Step 1) and click “Layout View” (Step 2) (Figure 4.1).
2. Select and right-click a field in the form (Step 3), select “Text Filters” (Step 4) and click “Contains…” (Step 5) (Figure 4.1).

STEP 1
STEP 2

STEP 3
STEP 5
STEP 4
Figure 4.1 Layout View of Taxonomy Information form and filtering a specific field in the form
3. Enter the keyword in “Custom Filter” (Step 6) and click “OK” (Step 7) (Figure 4.2).
4. A total of 3 records (B) of 2184 records (A) in Taxonomy Information form (i.e. table) with species “metcalfei” (Figure 4.2).
5. Click “Next record” (Step 8) to select the specific record and enter the storage information (Step 9) (Figure 4.2).
6. Click “Next record” (Step 10) to select the specific record and enter the storage information (Step 11) (Figure 4.2).
7. Before updating the storage information of the other records, click “Filtered” (Step 12) to remove the filter from the records.
8. Then repeat No. 3 – No. 7 until the updating of storage information completed
9. Click the (×) icon to close the form and click Yes (Step 13)

STEP 7
STEP 6
STEP 13
STEP 9 & 11
STEP 8 & 10

STEP 12
Figure 4.2 Search specific record according to the “Species” and update the storage information
Procedure N (1). Create Storage Information Table in SDBMS
1. Click to open the Taxonomy Information Table (Step 1) to check the storage information (A) (Figure 4.3). User may create a separate table to manage the Storage Space Information.
2. Click “Create” and select “Table Design” (Step 2) (Figure 4.3). A new table, “Table1”, will be created.


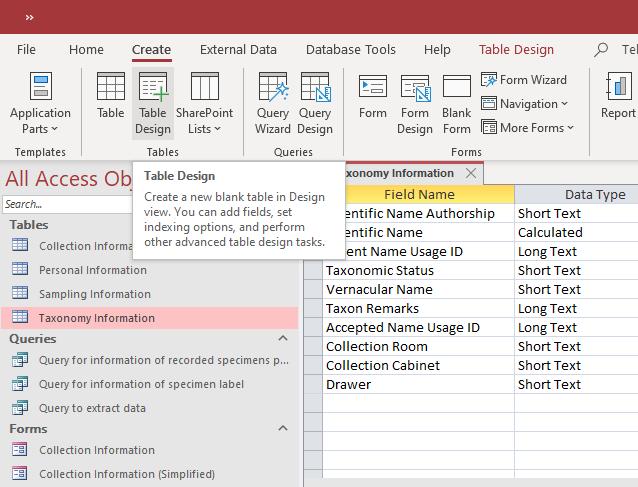

Figure
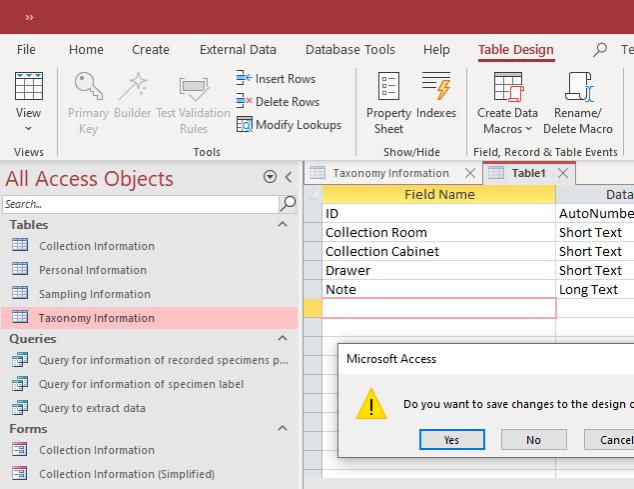
3. Create a new field “ID” as “AutoNumber” for “Data Type” and then “Collection Room”, “Collection Cabinet” and “Drawer” as “Short Text” and finally “Note” as “Long Text” (Step 3) (B) (Figure 4.3).
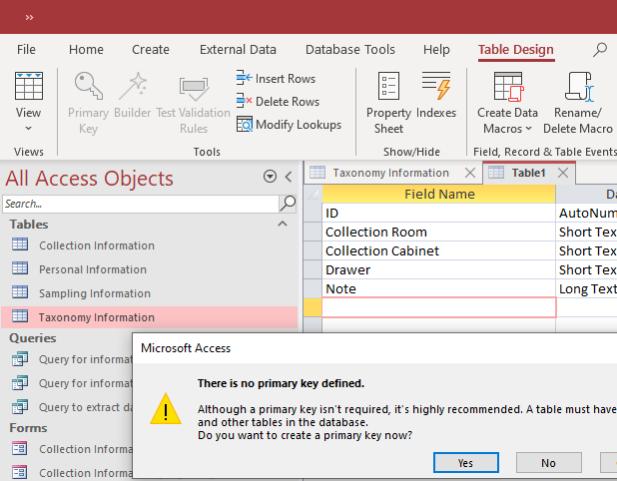
4. Click the (×) icon to close the new table (Step 4) and click “Yes” (Step 5) (Figure 4.3).
5. Enter the name of the new table “Storage Space Information” and click “OK” (Step 6) (Figure 4.3).
6. Click “Yes” (Step 7) to create the primary key for the table (Figure 4.3).
7. Right-click on “Storage Space Information” Table (Step 8) (Figure 4.4).
8. Select “Design View” (Step 9) (Figure 4.4).
9. Create a new field, “Full Storage Space Information” (Step 10), that contains the concatenated information for the three storage IDs, namely, “Collection Room”, “Collection Cabinet”, and “Drawer” (Figure 4.4).
10. Select “Calculated” for Data Type (Step 11) (Figure 4.4).
11. Double click on the first storage ID, “Collection Room” (Step 12) and then followed by the ‘& “ ” &’ (Step 13) (Figure 4.4).
12. Repeat No. 11 for the second storage ID “Collection Cabinet”, and then double-click on the last storage ID “Drawer”. Finally, Click “OK” (Step 14) (Figure 4.4).
13. Click the (×) icon to close the table (Step 15) and click “Yes” (Step 16) (Figure 4.4).
14. Enter the information in the table (Step 17) (Figure 4.4).
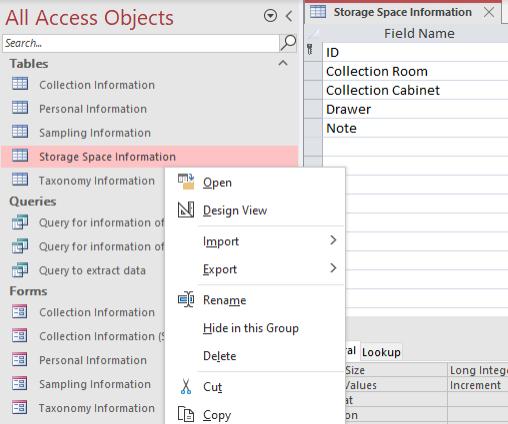
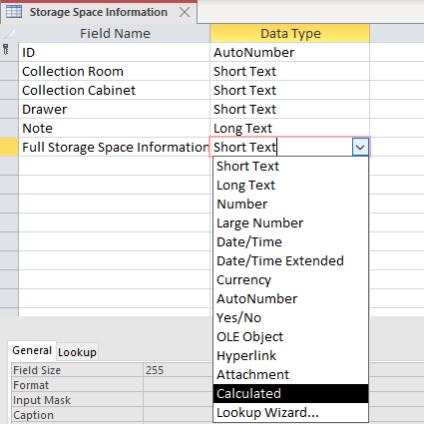


Figure 4.4 Create new table for Storage Space Information
Procedure N (2). Make Storage Information Table value available as Combo Box in Taxonomy
Information Table
1. Right-click (Step 1) to open the Taxonomy Information Table in “Design View” (Step 2) (Figure 4.5).
2. Keep the existing fields of storage information (A) (Figure 4.5). Create a new field, “Full Storage Space Information” (Step 3) (Figure 4.5).
3. Click on “Lookup” in the field property (Step 4), change “Display Control” to “Combo Box” and “Row Source Type” to “Table/Query” (Step 5) (Figure 4.5).
4. Click on the “Row Source” (Step 6) (Figure 4.5).
5. In the “Add Tables” panel, select the “Tables” tab, and double-click on the “Storage Space Information” Table to add to “Query Builder” (Step 7) (Figure 4.5).
6. Double-click on “Full Storage Space Information” (Step 8) (Figure 4.5).
7. Click the (×) icon to close the table (Step 9) and click “Yes” (Step 10) (Figure 4.5).
8. Return to “Lookup” in the field property and change “Allow Multiple Values” to “Yes” (Step 11) (Figure 4.6).
9. Click “Yes” (Step 12) again to confirm (Figure 4.6).
10. Click the (×) icon to close the table (Step 13) and click “Yes” (Step 14) (Figure 4.6).
11. Open the Taxonomy Information Table (Step 15) and check the newly added field (Step 16) (Figure 4.6).


Figure 4.5 Create new field in Taxonomy Information Table to include Storage Space Information (Part 1)
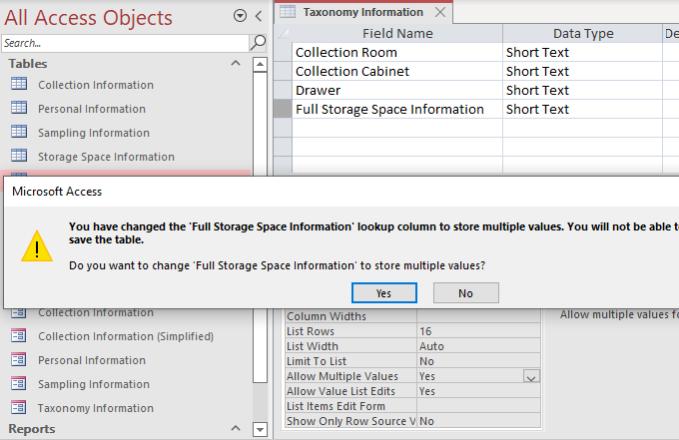


Figure 4.6 Create new field in Taxonomy Information Table to include Storage Space Information (Part 2)
Procedure N (3). Update the Full Storage Space Information field in the Taxonomy Information Form
1. Right-click to open the Taxonomy Information Form (Step 1) in “Design View” (Step 2) (Figure 4.7).
2. Select the existing fields of storage information (Step 3) (Figure 4.7).
3. Right-click on the selected fields and select “Delete” (Step 4) (Figure 4.7).


STEP 4
Figure 4.7 Create new field in Taxonomy Information Form to include Storage Space Information (Part 1)
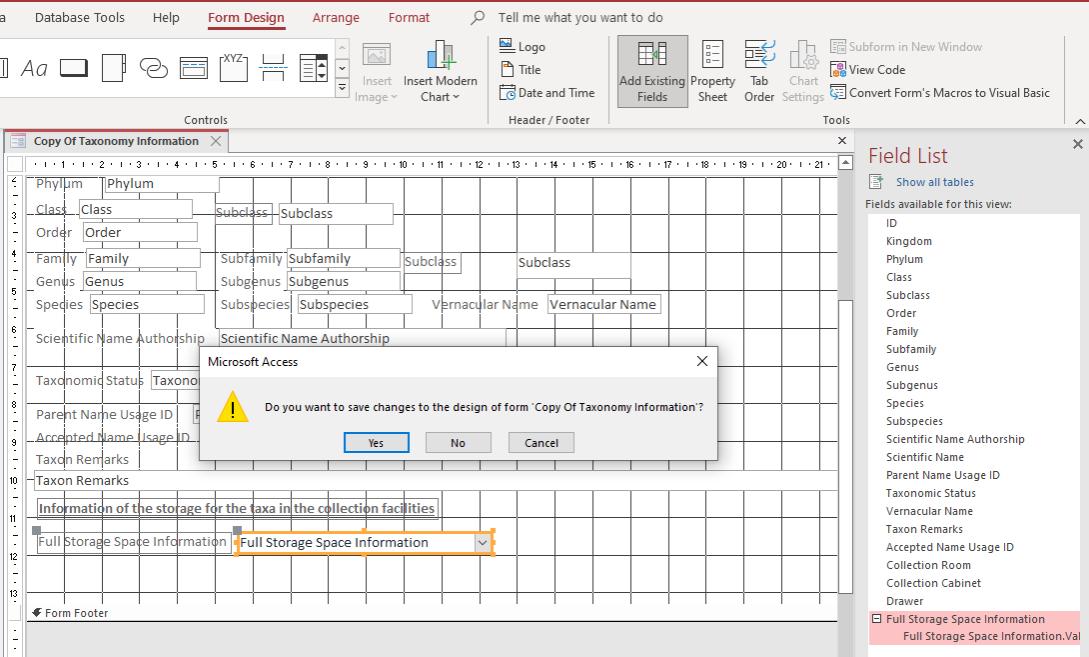
4. Click on “Form Design” (Step 5) and click “Add Existing Fields” (Step 6) (Figure 4.8).
5. Select “Full Storage Space Information” (Step 7) and drag the field to the form (Figure 4.8).
6. Click on the “grey square” and drag the boxes of the label and the field data to move the boxes to the desired location in the form (Step 8) (Figure 4.8).
7. Click on the “yellow square” and drag to resize the boxes of the label and the field data (Step 9) (Figure 4.8).
8. Click the (×) icon to close the table (Step 10) and click “Yes” (Step 11) (Figure 4.8). STEP 2 STEP 1 STEP 3
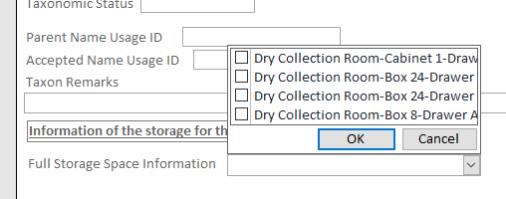
9. Open the Taxonomy Information form to check the newly added field (Figure 4.8).
STEP 8
STEP 10
STEP 5
STEP 11
STEP 9
STEP 6
STEP 7
Storage Information (A)
Figure 4.8 Create new field in Taxonomy Information Form to include Storage Space Information (Part 2)
Procedure N (4). Create query storage space
1. Click “Create” Panel (Step 1) and select “Query Design” (Step 2) (Figure 4.9). Double-click “Taxonomy Information” and “Storage Space Information” in the “Add Tables” panel (Step 3) (Figure 4.9).

2
1 STEP 3

Figure 4.9 Create query for storage space label (Part 1)
2. Click and drag the “Full Storage Space Information” of the “Storage Space Information” Table field and match it with “Full Storage Space Information.Value” of the Taxonomy Information” Table field (Step 4) (Figure 4.10).
3. Select and double-click on the table field “Full Storage Space Information.Value” to add the field to the query table (Step 5) (Figure 4.10).
4. Select and double-click on the other table fields “Collection Room”, “Collection Cabinet”, and “Drawer” of the “Storage Space Information” Table to add the field to the query table (Step 6) (Figure 4.10).
5. Select and double-click on the other table fields, “Class” (Step 7), “Family” (Step 8) and “Scientific Name” (or “Genus Species”) (Step 9) of “Taxonomy Information” Table to add the field to query table (Figure 4.10).
6. Click the (×) icon to close the “Design View” of the Query (Step 10) and click “Yes” (Step 11) to save the Query (Figure 4.10).
7. Check the query table and click the (×) icon to close the table (Step 12) and click “OK” (Step 13) (Figure 4.10).
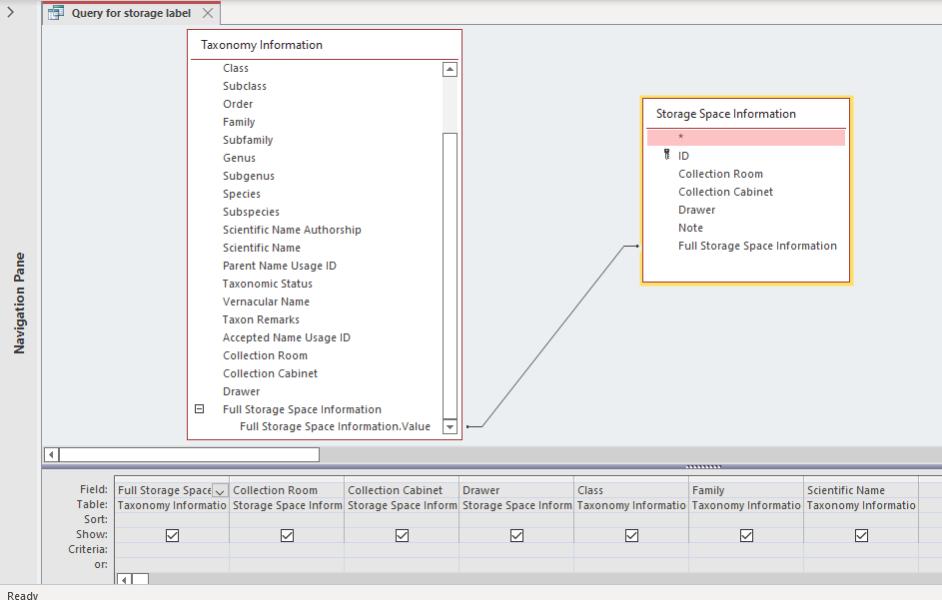

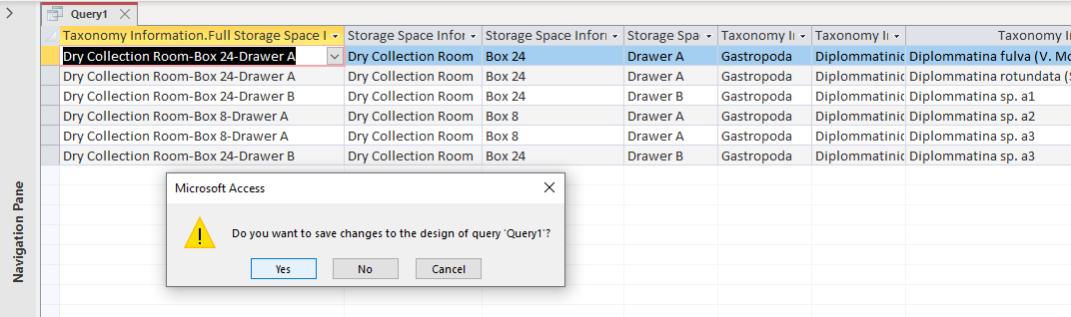
Figure 4.10 Create query for storage space label (Part 2)
Procedure N (5). Create a new label storage space
1. Click “Create” Panel (Step 1) and select “Report Wizard” (Step 2) (Figure 4.11).
2. Select “Query for storage label” that was just created (Step 3) (Figure 4.11).
3. Click “>>” to move all the “Available Fields:” to “Selected Fields:” (Step 4) and click “Next >” (Step 5) (Figure 4.11).
4. Select the Grouping level, first with “Storage Space Information.Collection Room” (Step 6), and then click “>” (Step 7) to add grouping (Figure 4.12).


5. Repeat No. 4 for “Storage Space Information.Collection Cabinet”, “Storage Space Information.Drawer” and “Taxonomy Information.Full Storage Space Information.Value” (A). Click “Next” (Step 8) to continue (Figure 4.12). STEP 3 STEP 4 STEP 5 STEP 1 STEP 2
Figure 4.11 Create report for storage space label (Part 1)
6. Select the remaining field as variable to sort the order of the label “Taxonomy Information.Class”, “Taxonomy Information.Family” and “Taxonomy Information.Scientific Name” (Step 9). Click “Next” (Step 10) to continue (Figure 4.12).
7. Select “Block” as “Layout” (Step 11), then click “Next” (Step 12) to continue (Figure 4.12).
8. Enter the name of the report (Step 13), then select “Preview the report” (Step 14) and click “Finish” (Step 15) (Figure 4.12).
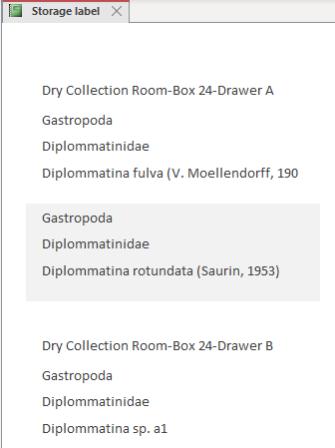
9. A report – a basic storage label is created (B) (Figure 4.12).
10. Click the (×) icon to close the report (Step 16) (Figure 4.12).


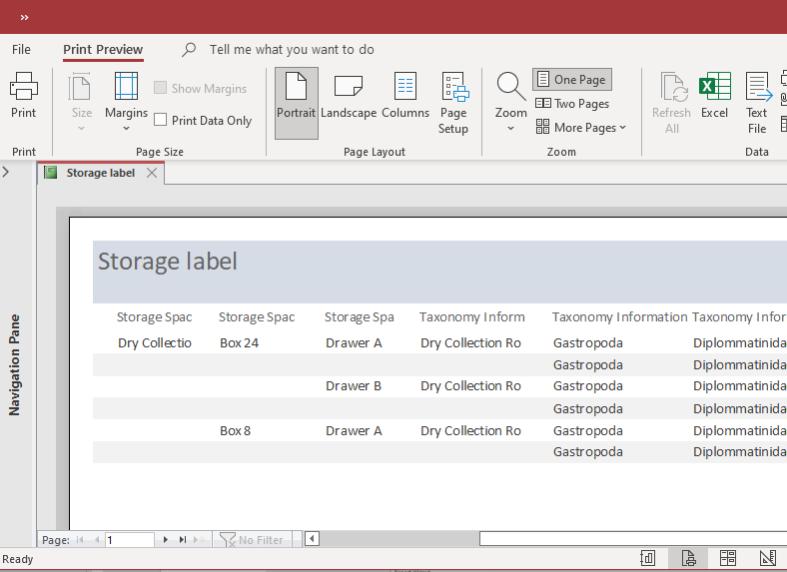
Figure 4.12 Create report for storage space label (Part 2)
Storage Label (B)
Procedure N (6). Customise and edit the layout and format of the report – Example of Storage Space Label
1. Right-click on the “Storage label” report (Step 1) and select “Design View” (Step 2) (Figure 4.13).
2. Right-click on the “Page Footer” (Step 3) and click on the select “Page Header/Footer” (Step 4) to remove it (Figure 4.13). Click “Yes” (Step 5) to confirm (Figure 4.13).
3. Right-click on the “Report Header” (Step 6) and click on the select “Report Header/Footer” (Step 7) to remove it (Figure 4.13). Click “Yes” (Step 8) to confirm (Figure 4.13).
4. Click on “View” (Step 9) and select “Report View” (Step 10) to check the layout of the Report (B) and switch back to “Design View” (A) for further editing (Step 3,4) (Figure 4.14).


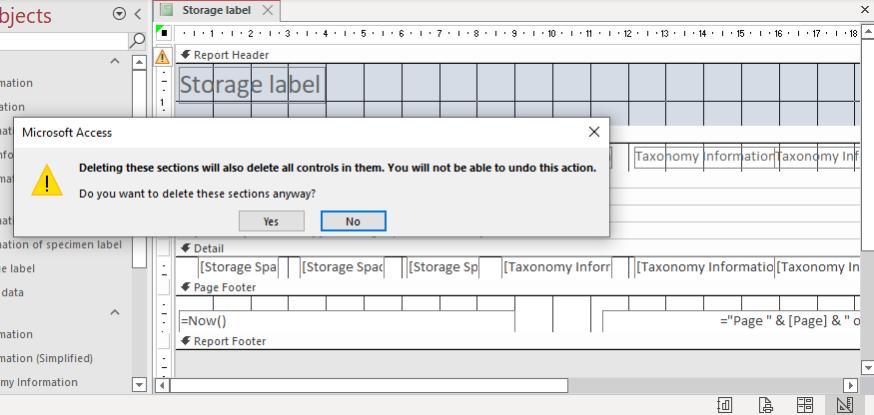
Figure 4.13 Customise report layout for storage space label (Part 1 – remove Page Header/Footer and Report Header/Footer)

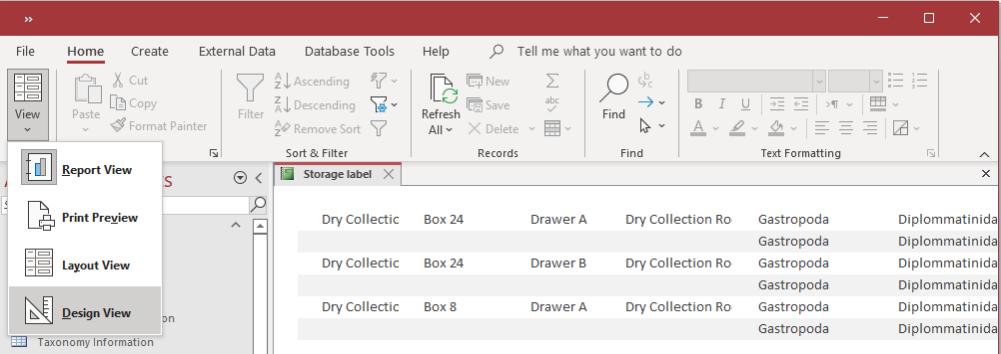
Figure 4.14 Customise report layout for storage space label (Part 2 – Report View vs. Design View)
5. Put the cursor at the vertical border of the report to resize the width of the report/label (Step 11) (Figure 4.15).
6. Put the cursor at the horizontal border of the report to resize the height of the report/label (Step 12) (Figure 4.15).
7. Click and drag the data field to the position in the space of the resized report/label (Step 13) (Figure 4.15).
Design View (A)
Report View (B)
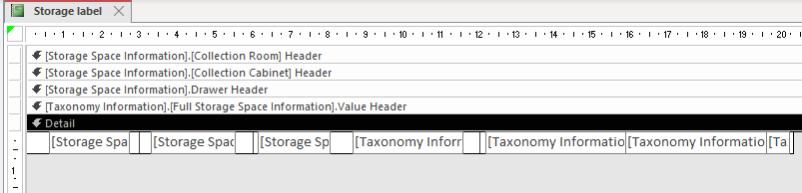
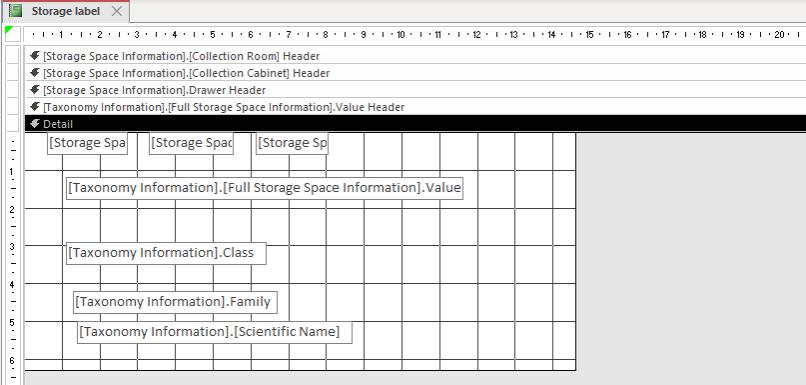
Figure 4.15 Customise report layout for storage space label (Part 3 – Change the size of the report and arrange the data fields in the report)
8. Select all or any of the data fields (Step 14) and use tools in “Arrange” panel (Step 15) to arrange the data fields in the report/label (Figure 4.16).
9. Use “Size/Space” (Step 16) to change the space in between data fields and size of the data fields in a batch (Figure 4.16).
10. Use “Align” (Step 17) to align the selected data fields (Figure 4.16).
11. Select and right-click on data fields: “Storage Space Information.Collection Room”, “Storage Space Information.Collection Cabinet”, “Storage Space Information.Drawer” (Step 18) and select “Delete” (Step 19) to remove these data fields from the report/label as these data fields were used to grouped the items in the report/label and the same information was available in “[Taxonomy Information].[Full Storage Space Information].Value” (Figure 4.16).
12. Repeat No. 4. Click on “View” (Step 9) and select “Report View” (Step 10) to check the layout of the Report (B) and switch back to “Design View” (A) for further editing (Step 3,4) (Figure 4.14).


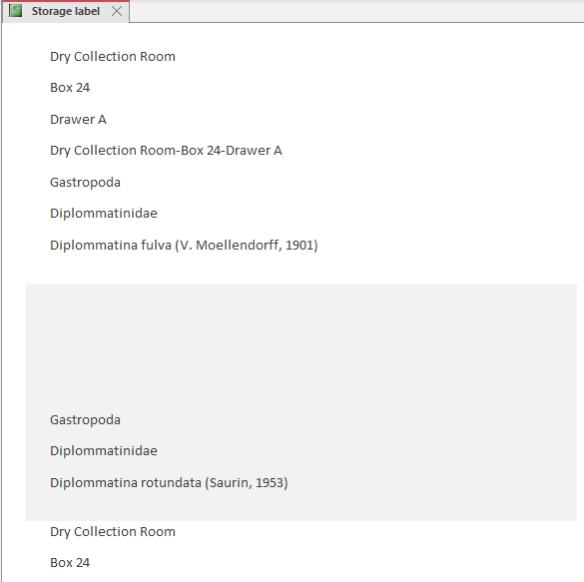


Figure 4.16 Customise report layout for storage space label (Part 4 – Change the size of the report and arrange the data fields in the report)
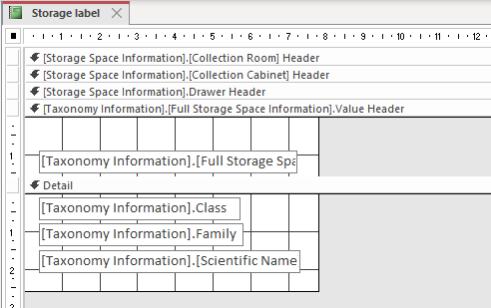
13. Select and move in “[Taxonomy Information].[Full Storage Space Information].Value” field to “[Taxonomy Information].[Full Storage Space Information].Value Header” (Step 20) (Figure 4.17).
14. Resize and arrange the data field in “[Taxonomy Information].[Full Storage Space Information].Value Header” space (Step 21) (Figure 4.17).
15. Resize and arrange the data field in the “Detail” space (Step 22) (Figure 4.17).

20
21
22
Figure 4.17 Customise report layout for storage space label (Part 5 – Grouping report item –label according to Storage Space – “Full Storage Space Information”)
16. Go to home to view the font formatting tool (Step 23) (Figure 4.18).
17. Select any of the data field, for example, “[Taxonomy Information].[Full Storage Space Information].Value” (Step 24) (Figure 4.18).
18. Change the format of the text for “[Taxonomy Information].[Full Storage Space Information].Value” data field (Step 25) (Figure 4.18).
19. Change the format of the text for other fields (Step 26) (Figure 4.18).
20. Repeat No. 4. Click on “View” (Step 9) and select “Report View” (Step 10) to check the layout of the Report (B) and switch back to “Design View” (A) for further editing (Step 3,4) (Figure 4.14).

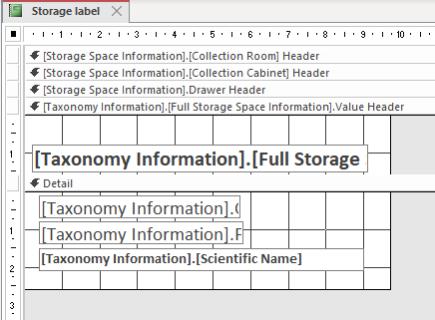

Figure 4.18 Customise report layout for storage space label (Part 6 – text formatting)
21. Click on the “Report Design” panel (Step 27) and scroll for the “Label” tool “Aa” (Step 28) (Figure 4.19).
22. Click on the “Label” tool “Aa” (Step 29) and add “Label” to the report/label (Figure 4.19).
23. Select the newly added “Label” (Step 30) and format the text by following No. 16 - No. 20.
24. Repeat No. 4. Click on “View” (Step 9) and select “Report View” (Step 10) to check the layout of the Report (B) and switch back to “Design View” (A) for further editing (Step 3,4) (Figure 4.14).


Figure 4.19 Customise report layout for storage space label (Part 7 – Add text label to the information)
25. Right-click in the “Detail” section (Step 31) to open the “Property Sheet” of the section (Figure 4.20).
26. Change “Alternate Back Colour” to “No Colour” (Step 32) to remove the background alternate colour (Figure 4.20).
27. Repeat No. 4. Click on “View” (Step 9) and select “Report View” (Step 10) to check the layout of the Report (B) and switch back to “Design View” (A) for further editing (Step 3,4) (Figure 4.14).


Figure 4.20 Customise report layout for storage space label (Part 8 – Remove “Alternate Back Colour”)
28. Click the “Report Design” panel (Step 33) and scroll for the “Line” tool “⸜” (Step 34) (Figure 4.21).
29. Click on the “Line” tool “⸜” (Step 35) and add “Line” to the report/label (Figure 4.21).
30. Double-click to select the newly added “Line” (Step 36) and to open the “Property Sheet” of the selected “Line” (Figure 4.21).
31. Change the format of the “Line” by changing the values for the “Line” properties (Step 37) (Figure 4.21).
32. Repeat No. 4. Click on “View” (Step 9) and select “Report View” (Step 10) to check the layout of the Report (B) and switch back to “Design View” (A) for further editing (Step 3,4) (Figure 4.14).
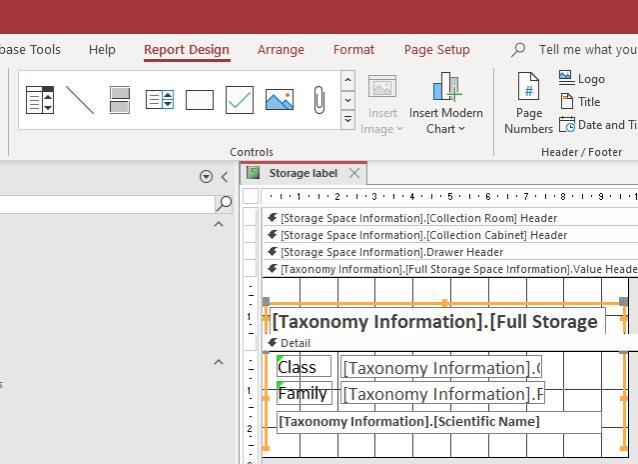
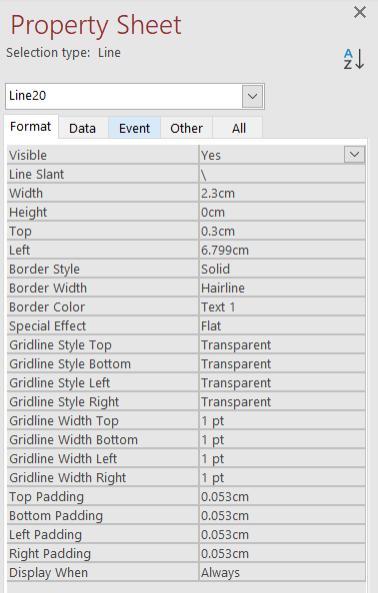

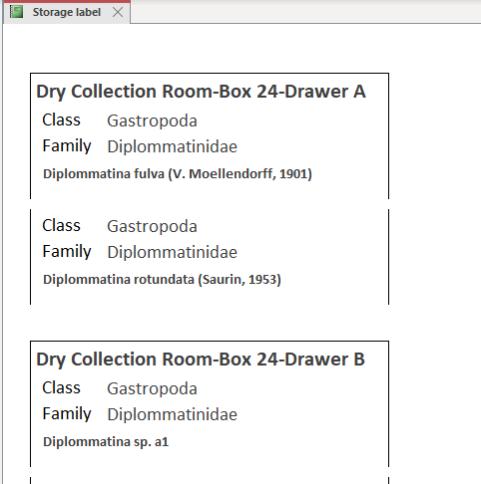
Figure 4.21 Customise report layout for storage space label (Part 9 – Add line to mark the border of the label/report)
CHAPTER 5
RETRIEVING AND ANALYSING
In the retrieving and analysing stages, the data is ready for use. The data collector, data curator, data user and data custodian can retrieve not only the data of the specimens that have just been entered into the database, but also the data of other specimens that were already in the database in order to perform data analysis. In this analysis phase of the data lifecycle, the data can be used to produce reports on the state of the collections for depository institutions’ administrative purposes and analysis in scientific research projects as part of the manuscript submitted to scholarly publication.
5.1 REPORTING
While managing biodiversity data according to the lifecycle of the data is an ongoing process, it is important for depository institutions to produce regular reports to document the status of their collections. This is the first step in enabling a paradigm shift from specimen and data ownership to specimen and data stewardship through explicit integration of specimens into existing data management plan guidelines and annual reporting. This regular reporting needs to be made public and include the basic statistics on the collection regarding new specimen collections added and the frequency of data sharing on the data aggregator platform.
There is a query function in the SDBMS to facilitate the documentation process in preparing the reports based on localities, i.e., "Query for information of recorded specimens per localities" and "Checklist report by localities". This function provides templates to retrieve the required data and generate a report summarising the records (collections) by localities. Both the query and report templates in the SDBMS are editable, and the status of the collections can be displayed by grouping the data by taxonomy, location, and year.
Procedure O. Create a Checklist report by localities
1. Right-click on the “Query for information of recorded specimen per localities” (Step 1) and select “Design View” (Step 2) (Figure 5.1).
2. Select the records by localities from the SDBMS by specifying the query “Criteria” of the “Field Number” (Step 3) (Figure 5.1). “Criteria” for “Field Number”:
a. For one locality/sampling event – enter exactly a string, such as Field Number, example: “2016.KH323”. User to enter 2016.KH323 in the “Criteria”.
b. For more than one locality/sampling event that contains the specified string, example: “2016.KH323”, “2016.KH324”, etc. User to enter Like “*KH*” in the “Criteria”.
c. For more than one locality/sampling event that contains more than one specific string, example: all “Field Number” with the number 23 or word Kanthan: “2016.KH323”, “Kanthan.1”, etc. User to enter Like “*23*” OR Like “*Kanthan*” in the “Criteria”.
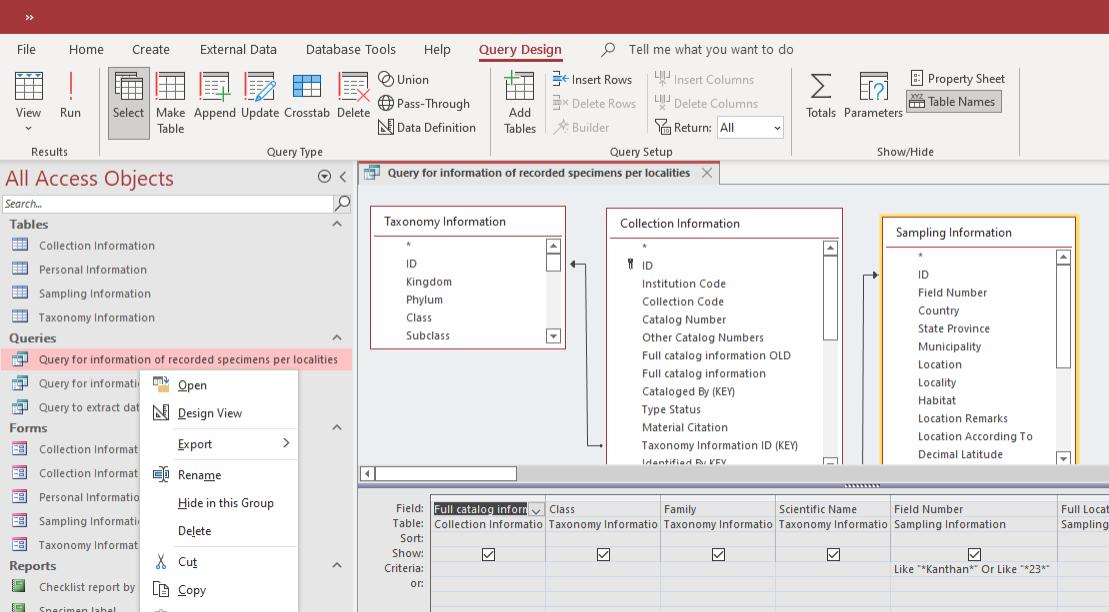

Figure 5.1 Design View of Query for information of recorded specimens per localities
3. Click “Run” (Step 4), and the list of records from the localities containing strings “KH” (A) and “Kanthan” will be generated (B) (Figure 5.1).
4. Click on the (×) icon (Step 5) to close the query table and click “Yes” to save the query table (Figure 5.1).
5. Open “Checklist report by localities (Step 6) (Figure 5.2).
6. Right-click on “Checklist report by localities (Step 7), select “Export” (Step 8) and Click “Word RTF File” (Step 9) (Figure 5.2).
7. Click “Browse…” to save the file (Step 10) and Click “OK” (Step 11) (Figure 5.2).
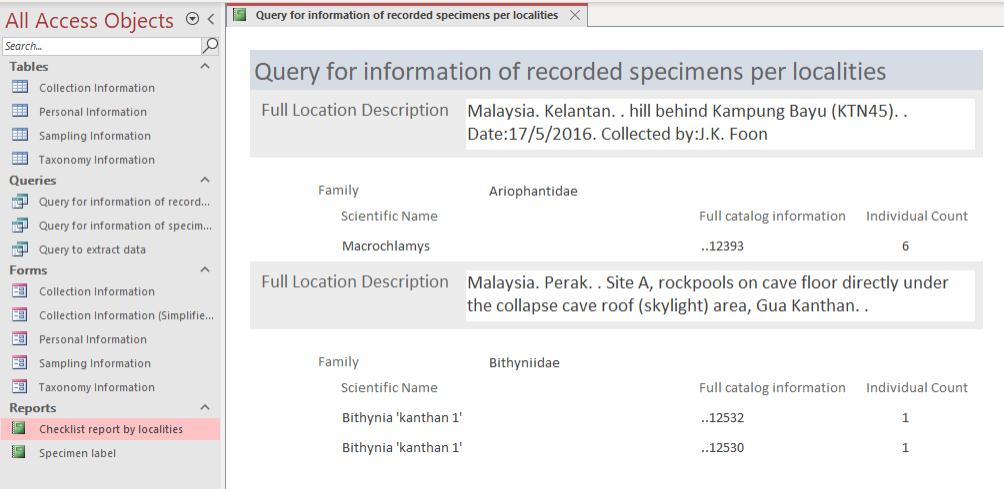


Figure 5.2 Export Checklist report by localities from SDBMS to Microsoft Word file
8. Open the export Checklist report by localities RTF file in Microsoft Word (Figure 5.3).
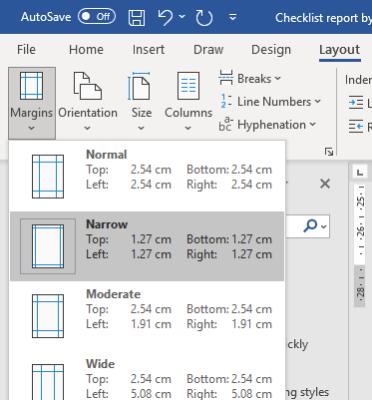
9. Click the “Layout” tab (Step 12), select “Margins” (Step 13) and click “Narrow” (Step 14) (Figure 5.3).
10. Click “Orientation” (Step 15) and select “Portrait” (Step 16) (Figure 5.3).
11. Click “Size” (Step 17) and select “A4” (Step 18) (Figure 5.3).
12. Click “View” (Step 19) and select “Print Layout” (Step 20) (Figure 5.3).
13. Continue editing the report in Microsoft Word.
14

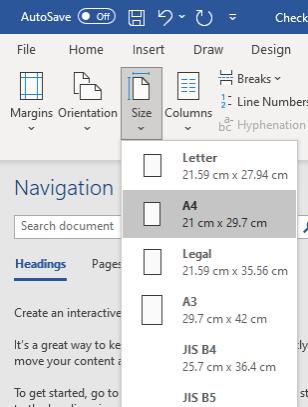
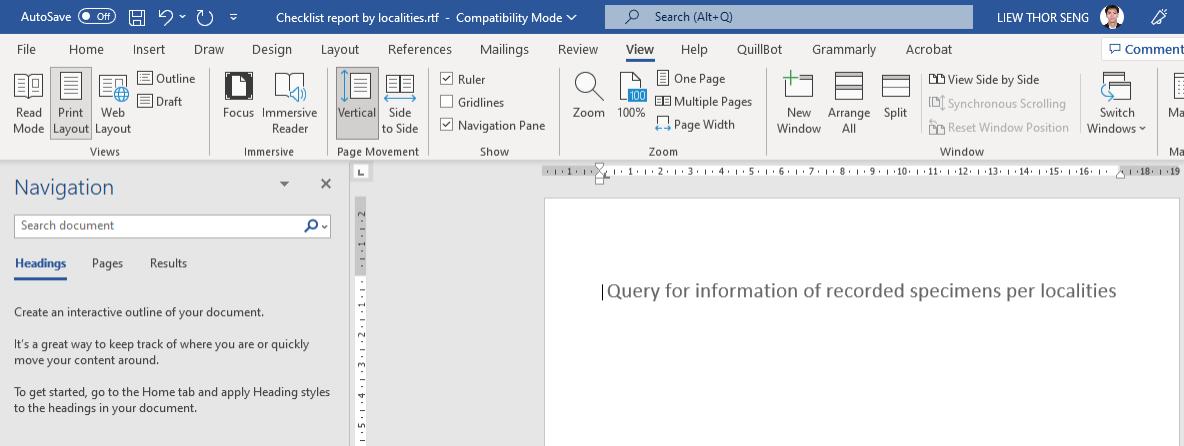

Figure 5.3 Customise exported Checklist report by localities in Microsoft word for further editing
5.2 ANALYSING
In addition to institutional reporting purposes, researchers who collected the data can use the SDBMS to retrieve the data in the format they need for data analysis in their research. The most common format used in various biodiversity analyses is a matrix of biodiversity community data with samples as rows and species as columns.
Data users and data collectors can use a query template in the SDBMS (Query to extract data) to retrieve data such as "Scientific name" from the Taxonomy Information Table, "Field number" from the Sampling Information Table, and "Full Catalogue Information" and "Individual Count" from the Collection Information Table of selected records from SDBMS. The query result can be exported to Microsoft Excel spreadsheet format as a list of records that can be converted into a biodiversity community data matrix using the Pivot Table function in Microsoft Excel – a data summary tool that automatically sorts, counts, and sums up data and displays the summarised data.
Another common request from researchers is to create a species distribution map. Similar to the creation of the biodiversity community data matrix, researchers can add additional fields from the Sampling Information Table, such as "Decimal Latitude" and "Decimal Longitude", to create a map.
Researchers do not need to keep separate data sheets for different needs in the research process for the information they have collected and curated from the sample collections. As suggested in this Guideline, they only need to enter the data into the SDBMS once and then retrieve it for analysis. This workflow makes it easier for researchers or data collectors to manage the same dataset in different ways for different purposes and minimises the errors in data consistency (e.g., entering the same information in different ways) that could arise from many different versions of datasets.
Procedure P. Biodiversity community data matrix in Microsoft Excel spreadsheet format
1. Right-click on “Query to extract data” (Step 1) and select “Design View” (Step 2) (Figure 5.4).
2. Select the records by localities from the SDBMS by specifying the query “Criteria” of the “Field Number” (Step 3) (Figure 5.4). “Criteria” for “Field Number”:
a. For one locality/sampling event – enter exactly a string, such as Field Number, example: “2016.KH323”. User to enter 2016.KH323 in the “Criteria”.
b. For more than one locality/sampling event that contains the specified string, example: “2016.KH323”, “2016.KH324”, etc. User to enter Like “*KH*” in the “Criteria”.
c. For more than one locality/sampling event that contains more than one specific string, example: all “Field Number” with number 23 or word Kanthan: “2016.KH323”, “Kanthan.1”, etc. User to enter Like “*23*” OR Like “*Kanthan*” in the “Criteria”.
3. Click “Run” (Step 4), then click on the (×) icon (Step 5) to close the query table and click “Yes” (Step 6) (Figure 5.4).
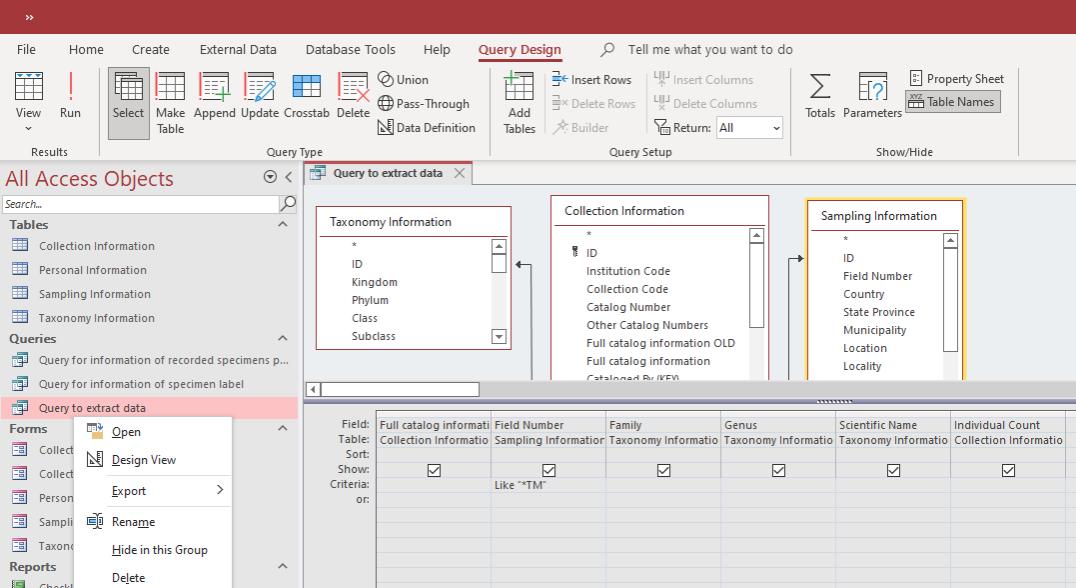
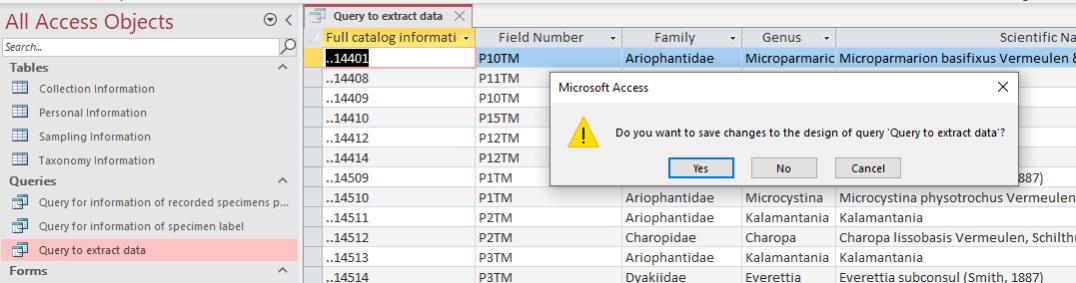
Figure 5.4 Query to extract data to create biodiversity community data matrix
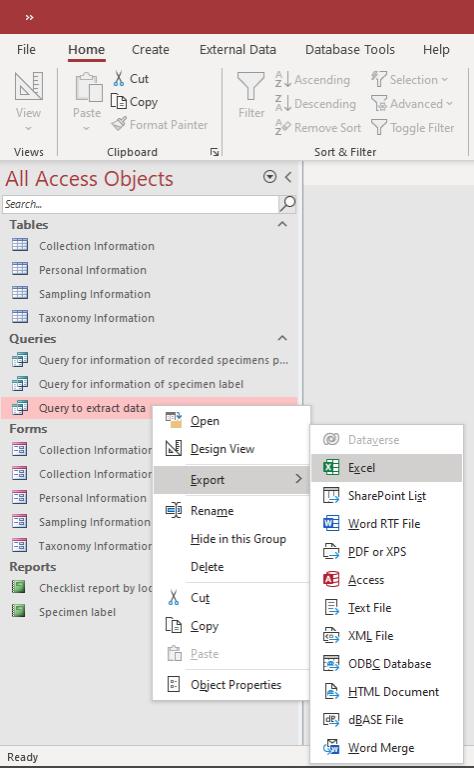
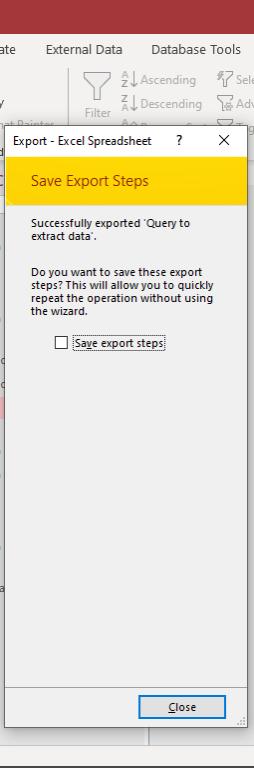
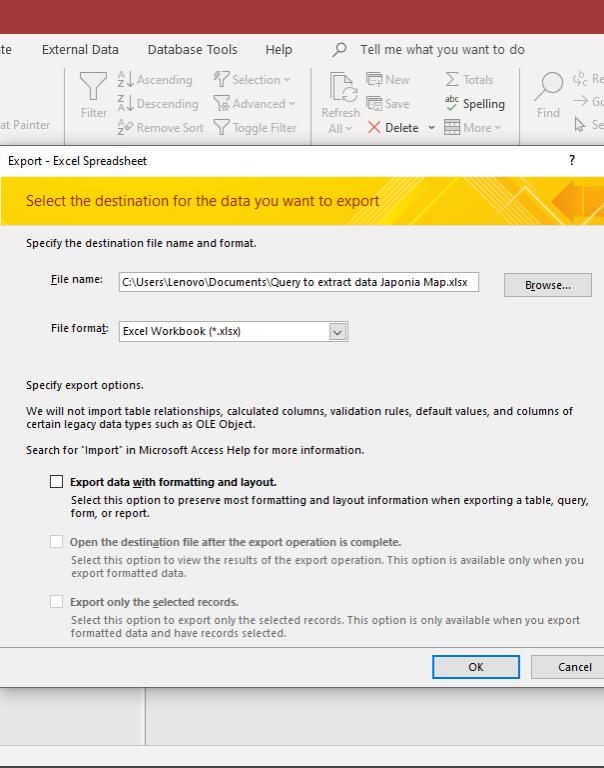
4. Right-click on “Query to extract data” (Step 7), select “Export” (Step 8), and click on “Excel” (Step 9) (Figure 5.5).
5. Click “Browse…” (Step 10) to save the file, click “OK” (Step 11) and click “Close” (Step 12) (Figure 5.5).
STEP 7
11
9

10
STEP 12
Figure 5.5 Export “Query to extract data” and save as Microsoft Excel spreadsheet
6. Open the exported Excel file (Figure 5.6).
7. Select all the column with data (Step 13) (Figure 5.6).
8. Click on the “Insert” tab (Step 14) and click “PivotTable” (Step 15) (Figure 5.6).
9. Select “New Worksheet” (Step 16) and click “OK” (Step 17) (Figure 5.6).
10. In the New Worksheet, drag the fields to respective “Columns”, “Rows”, and “Values”: “Scientific Name” to “Rows” (Step 18); “Field Number” to “Columns” (Step 19); “Full catalogue information” to “Values” (Step 20) (Figure 5.6).
11. A data matrix has been created (Figure 5.7).
12. To remove empty row, click “Manual Filters” next to “Row Labels” (Step 21), uncheck “(blank)” (Step 22) and click “OK” (Step 23) (Figure 5.7).
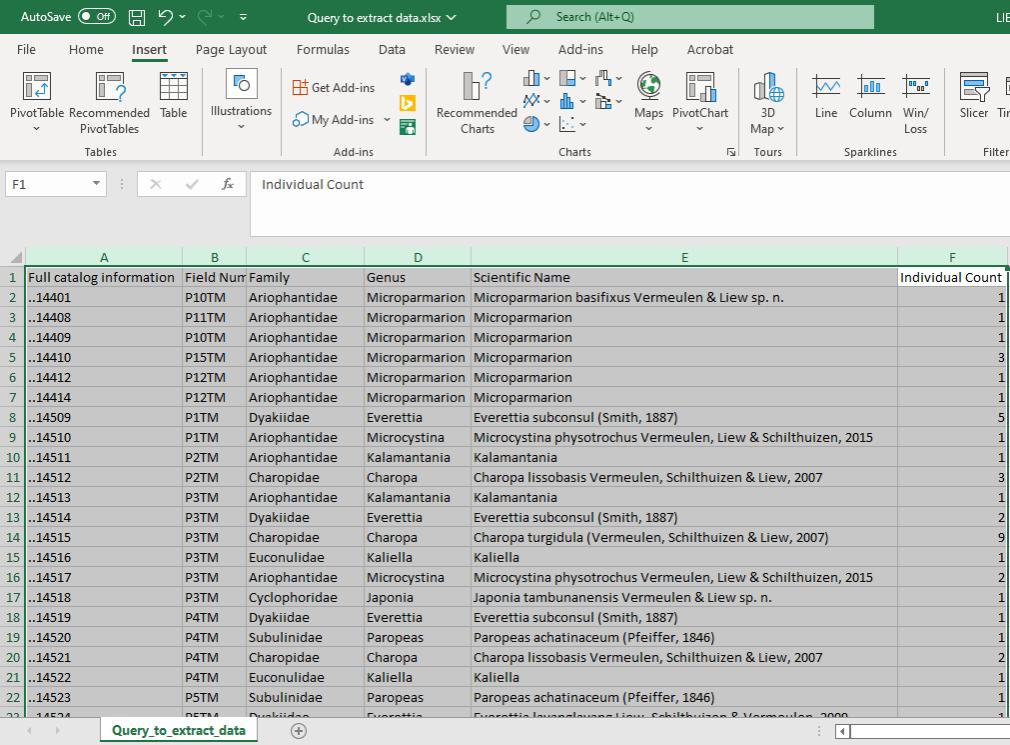


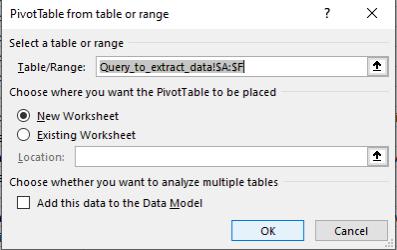
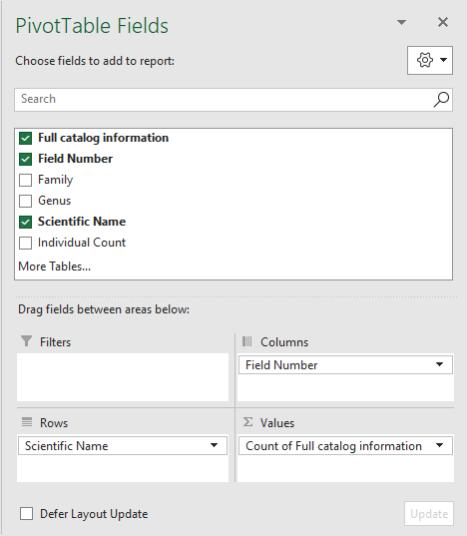
Figure 5.6 Using Pivot Table in Microsoft Excel to create biodiversity community data matrix
13. To remove empty row, click “Manual Filters” next to “Column Labels” (Step 24), uncheck “(blank)” (Step 25) and click “OK” (Step 26) (Figure 5.7).
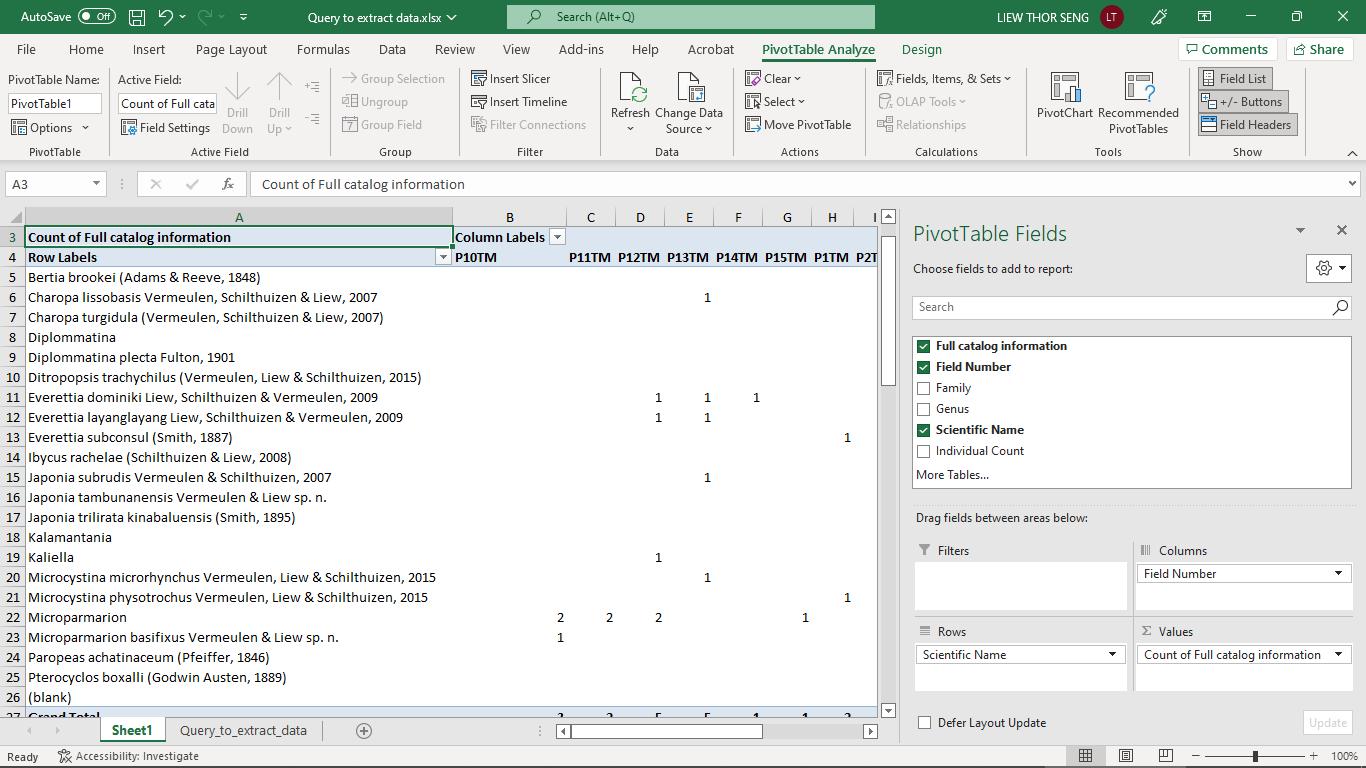
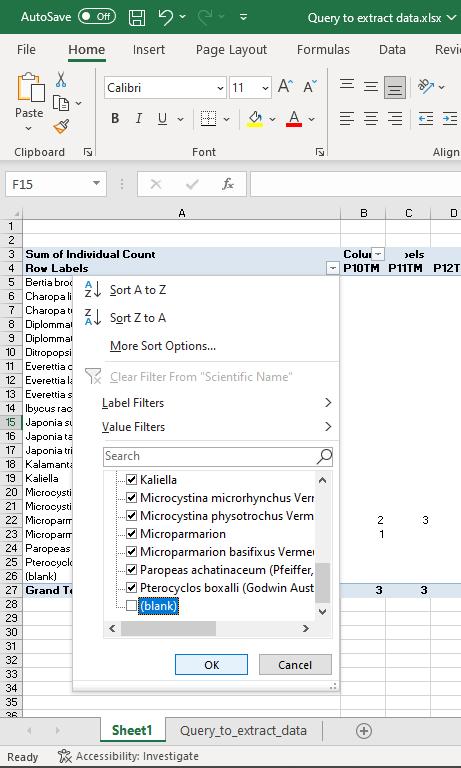

Figure 5.7 Remove empty column and row in biodiversity community data matrix
14. When it is needed, user can group the rows according to different taxonomy level (Figure 5.8).
15. To group the taxa according to “Family” (A), drag “Family” to “Rows” and place it above “Scientific Name” (Step 27) (Figure 5.8).
16. To group the taxa according to “Genus” (B), drag “Genus” to “Rows” and place it in between “Family” and “Scientific Name” (Step 28) (Figure 5.8).

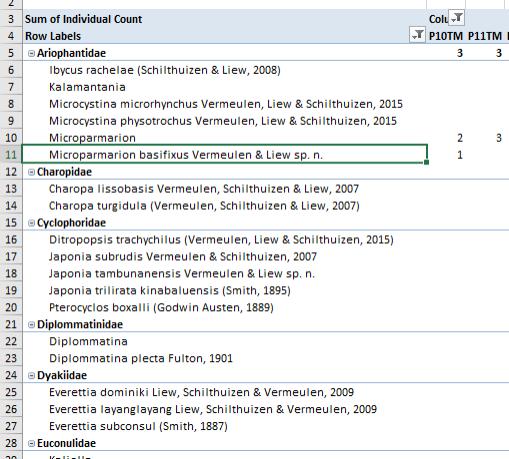


Figure 5.8 Add grouping of the species according to different taxonomy levels in biodiversity community data matrix
STEP 27
STEP 28
Family (A)
Family (B)
Procedure Q. Create a species distribution map with Google Drive My Maps
1. Right-click on “Query to extract data” (Step 1) and select “Design View” (Step 2) (Figure 5.9).
2. Select the records by taxa from the SDBMS by specifying the query “Criteria” of the “Genus” (Step 3) and “Scientific Name” (Step 4) (Figure 5.9).
a. “Criteria” for “Genus” – enter exactly a string, example: “Japonia.
b. “Criteria” for “Scientific Name” – enter a string that contains the species name, example: *borneensis*
3. Double-click on “Decimal Latitude” and “Decimal Longitude” of “Sampling information” to add these two fields to the query (Step 5) (Figure 5.9).
4. Click “Run” (Step 6), then click on the (×) icon (Step 7) to close the query table and click “Yes” (Step 8) (Figure 5.9).

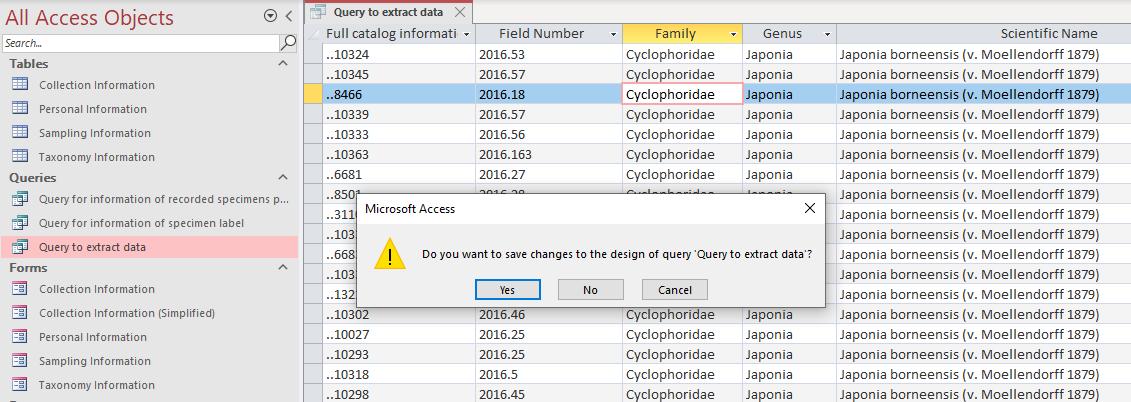
Figure 5.9 Query to extract records according to species
5. Right-click on “Query to extract data” (Step 9), select “Export” (Step 10), and click on “Excel” (Step 11) (Figure 5.10).
6. Click “Browse…” (Step 12) to save the file, click “OK” (Step 13) and click “Close” (Step 14) (Figure 5.10).

13
12 STEP 14
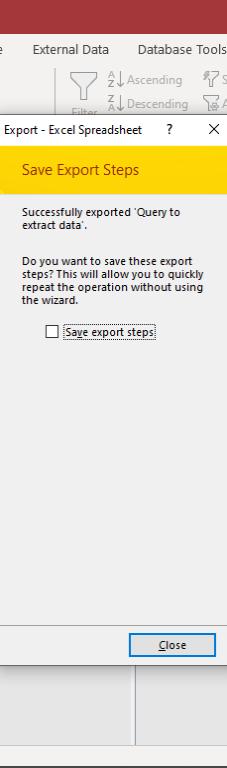
Figure 5.10 Export data to Microsoft Excel spreadsheet
7. Repeat No. 1 – No. 6 to export the data for other species.
8. Open Google Drive (Step 15) and click “+ New” (Figure 5.11).
9. Select “More” (Step 16) and click on “Google My Maps” (Step 17) (Figure 5.11).
10. Click “Import” (Step 18) to select a file (Step 19) and click one of the exported Excel files (Step 20) (Figure 5.11).
11. Click “Open” (Step 21) (Figure 5.11).
12. Check “Decimal Latitude” (Step 22) and select “Latitude” (Step 23); check “Decimal Longitude” (Step 24) and select “Longitude” (Step 25) (Figure 5.12). Click “Continue”. STEP 9 STEP 10 STEP 11
13. Check “Full catalogue information” (Step 26) and click “Finish” (Step 27) (Figure 5.12).
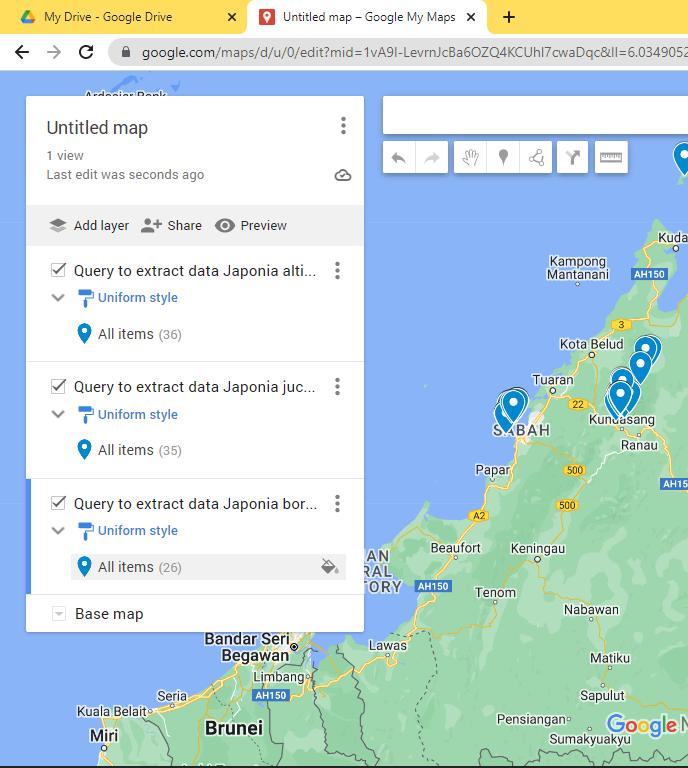
14. A map layer with the taxa distribution has been created (A) (Figure 5.12).
15. Click “Add layer” (Step 28) and Click “Import” (Step 29), then repeat No. 10 – No. 12 to import data of other taxa to create more map layers for other species (Figure 5.12).

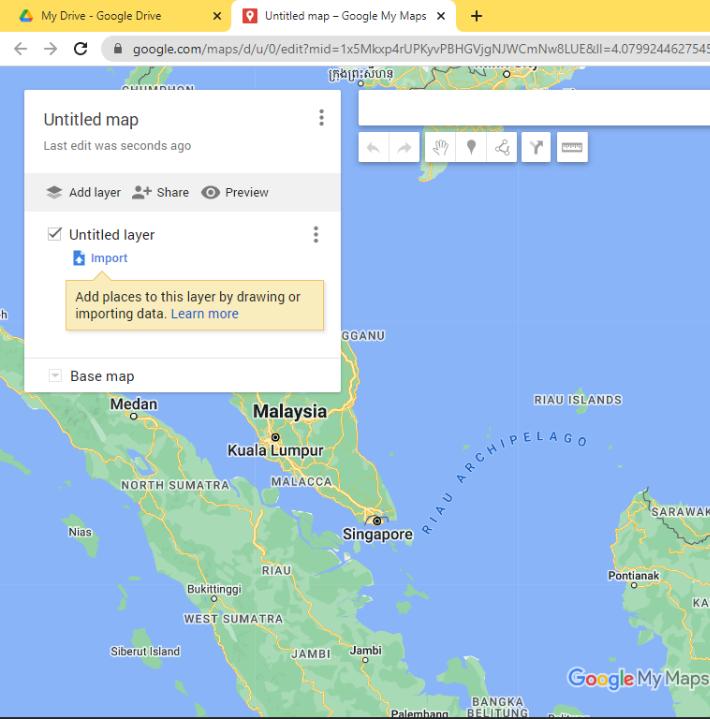
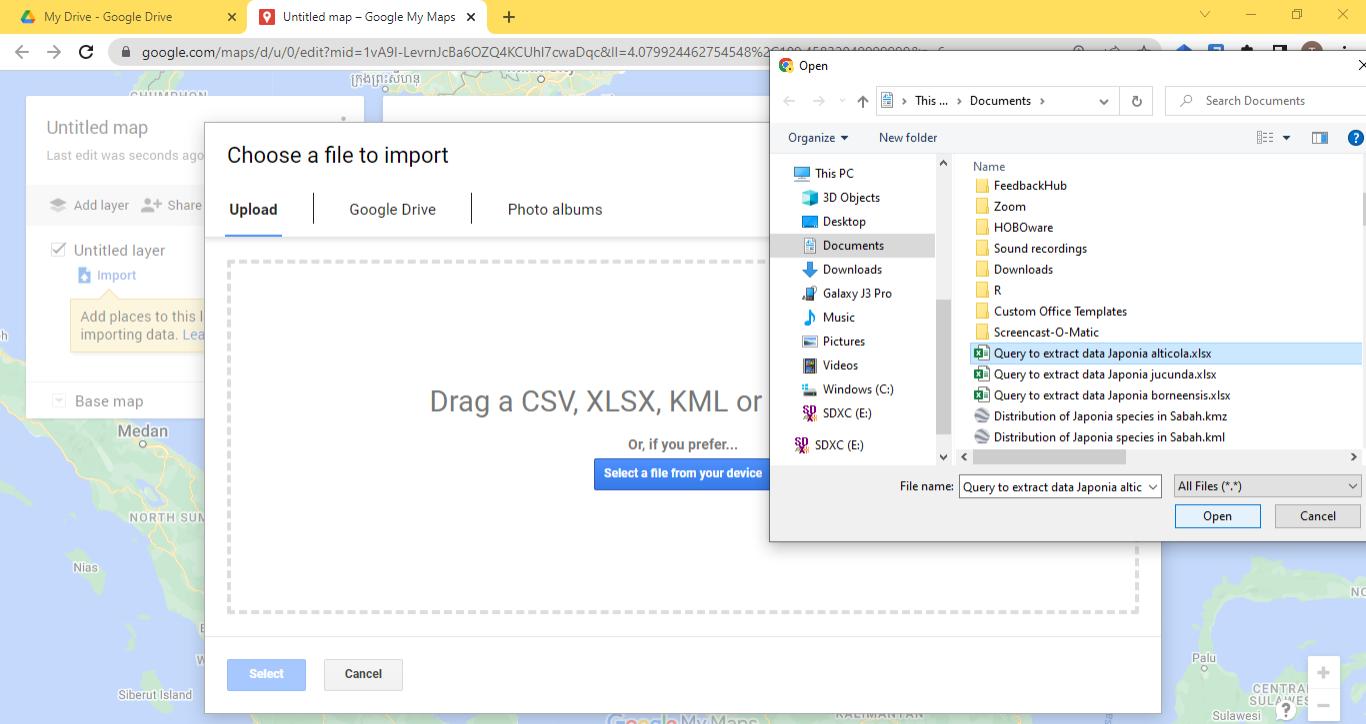
Figure 5.11 Import data to Google My Maps


Figure 5.12 Select coordinates and title for the records (i.e., markers in the map)
Map (A)
16. Click on “colour” of one of the layers (Step 30) and select a “colour” (Step 31) (Figure 5.13).
17. Repeat No. 16 for the remaining layers by setting different colours for different layers (Figure 5.13). STEP 31 STEP 30


5.13 Update the colour of the marker according to taxa
Figure
18. Click on the “Layer options” of one of the layers (Step 32) and select “Rename this layer” (Step 33) (Figure 5.14).
19. Enter the scientific name of the taxa for the layer name (Step 34) and Click “Save” (Step 35) (Figure 5.14).
20. Repeat No. 18 – No. 19 for the remaining layers.
21. Click on “Untitled map” (Step 36), update “Map title” (Step 37) and “Description” (Step 38). Click “Save (Step 39) (Figure 5.14).


Figure 5.14 Update the taxa layer name and edit the title and description of the map
22. Click on “Menu” (Step 40) and select “Export to KML/KMZ” (Step 41) (Figure 5.15).
23. Click “Download” (Step 42), name the file (Step 43) and click “Save” as “KMZ” (Step 44) (Figure 5.15).
24. Open the newly created KMZ file with Google Earth (Step 45), user can explore the distribution of different species (A) and click on the “Placemark” to check the details of the specimen/collection (Step 46).


Figure 5.15 Export the Google My Maps as Google Earth KMZ file
