16 minute read
What Is the Relationship Between Amoeba and Legionella in Non Potable Water Systems?
Shivi Selvaratnam, Ph.D., Weas Engineering, Inc.
Abstract Legionella is an opportunistic waterborne pathogen that exists as a free-living organism and an intracellular parasite in which several amoeba species serve as the host organism. The life cycle of Legionella is thought to be dependent on the existence of an amoeboid host that is present in a complex biofilm community. Whether this host–parasite relationship is a necessary or an opportunistic relationship is not well understood. In this article, we examine non-potable water systems for the presence of Legionella spp. and free-living amoeba (FLA). We use conventional culture techniques to determine the presence of and quantify Legionella spp. and a LIVE/ DEAD® stain to determine the presence of and quantify live and dead amoeba. The LIVE/DEAD stain uses the dyes SYTO®9 and propidium iodide to render viable amoeba green and dead amoeba red, respectively, using epifluorescence microscopy. This technique has been used on other eukaryotic cells but not on amoeba. We successfully used this technique when examining the relationship between Legionella and amoeba in potable water, as reported in our Summer 2020 Analyst article.
Introduction Legionella spp. are the most common cause of waterborne infections in the United States (1). Although Legionella are considered to be fastidious environmental organisms, they are readily cultivated in an aerobic environment on heterotrophic media, such as Buffered Charcoal Yeast Extract (BCYE) (2).
The natural environment in which Legionella thrive is complex and therefore not well understood. On one hand, there is a school of thought that the preferred state of existence for Legionella is that of an intracellular parasite residing within several host protozoan species, including free-living amoeba (FLA) (3). FLA are widespread in the environment. Indeed, Legionella is well adapted to this parasitic “lifestyle” and possesses several gene-based regulatory mechanisms to ensure its long-term survival (4). Nevertheless, Legionella has also been found as a resident of biofilms present in potable and non-potable water systems, independent of a parasitic existence (5). The requirement for L-cysteine and an unusually high demand for soluble iron to support its growth is indicative that in the absence of a parasitic relationship, Legionella may require a communal environment to provide these exogenous growth factors. The two modes of existence for Legionella also point to two modes of growth suppression. That is, control of growth within a biofilm and indirect control of growth by curtailing the growth of amoeba. Within the context of potable water, disinfectant mechanisms to control microorganisms include chlorine dioxide, chlorine and monochloramine. Almost all amoebicidal data on these disinfectants is derived from studies done to remediate drinking water that has been contaminated with amoeba that are pathogenic (e.g., Giardia spp.) (6).
Results from our previous study on the efficacy of chlorine, chlorine dioxide, and monochloramine on the growth of amoeba in potable water suggest that chlorine dioxide may effectively mitigate a contaminated system with as little as a single dose of 4.0 ppm in 24 hours, though this would be an offline use (7).
The purpose of this investigation was to determine if there was an association between amoeba and Legionella in non-potable water and how this association compares to our previous work with potable water.
Materials and Methods
Non-Potable Water Sample Collection
100 milliliters (mL) of non-potable water samples were collected in sterile wide-mouth screw cap polypropylene plastic bottle containing 100 milligrams (mg) sodium thiosulfate preservative.
A selective procedure was used to reduce the numbers of non-Legionella bacteria before culturing since water samples may contain high concentrations these bacteria (8). Samples were either heat or acid treated prior to plating.
For heat treatment, a 500 microliter (µL) of sample was incubated in a water bath at (50 ± 1) °C for (30 ± 2) minutes (min).
For acid treatment, 0.1 mL of sample was added to 0.9 mL of buffer pH 2.0. The suspension was then incubated for 5 min at room temperature.
Media for Legionella Growth and Isolation
BCYE agar containing 0.1% alpha-ketoglutarate was used as the base medium for the recovery of Legionella. Two types of selective BCYE agar were used in the processing of the samples. The first was designated BCYE complete with antibiotics (purchased from Hardy Diagnostics); the second was designated BCYE complete without antibiotics. Visualization of Live and Dead Amoeba From Non-Potable Water Samples
Plating of Samples
Plates (described above) were inoculated with 0.2 mL of either acid-treated or non-acid-treated suspension and distributed over the agar surface with a plastic spreader. They were then incubated at 36 °C in a humidified incubator for 14 days at a minimum humidity of 95%. Examination of Cultures for Legionella Plates were examined after 72 to 96 hours of incubation for Legionella. Suspect Legionella colonies were streaked onto BCYE agar plate without L-cysteine and antibiotics, and a positive control BCYE agar plate without antibiotics. The plates were incubated for 24 to 48 hours. Colonies that grew on BCYE agar, but not BCYE agar without L- cysteine, were considered to be presumptive Legionella species and later serotyped using the Dry Spot ™agglutination test (Oxoid, Dardilly, France) or direct fluorescent antibody (MTech).
Filtration of Samples for Amoeba Isolation 50 mL of non-potable water samples used for Legionella analysis (from above) were filter-concentrated using a 47-millimeter (mm) filter funnel assembly disinfected with 80% isopropyl alcohol between uses and containing a sterile 3.0 micrometer (µm) black polycarbonate filter. 3 mL of Tris buffer containing SYTO® 9 and propidium iodide (from LIVE/DEAD FungaLight™ Yeast kit) were added to the membranes and incubated at room temperature for 15 min. Liquid from the membranes were removed by filtration, and the membranes were transferred to a large microscope slide. A few drops of deionized water were added to each membrane and covered with a large cover slip. The slides were incubated at 36 °C for 15 min prior to microscopy.
The LIVE/DEAD FungaLight™ Yeast Viability Kit was used to visualize live/dead amoeba. The kit contains solutions of SYTO® 9 green fluorescent nucleic acid stain and the red-fluorescent nucleic acid stain propidium iodide. These stains differ both in their spectral characteristics and in their ability to penetrate healthy amoeba cells. When used alone, the SYTO® 9 stain generally labels all amoeba in a population—those with intact membranes and those with damaged membranes. In contrast, propidium iodide penetrates only amoeba cells with damaged membranes, causing a reducEven when tion in the SYTO® 9 stain fluorescence by fluorescence resonance energy transfer no detectable (FRET) when both dyes are present. Legionella or TPC were observed, Thus, with an appropriate mixture of the SYTO® 9 and propidium iodide stains, amoeba with intact cell membranes stain amoebae were fluorescent green, whereas amoeba with detected in 83 damaged membranes stain fluorescent red. and 24 samples, Stained amoeba slides were viewed under respectively. an epifluorescence microscope using a fluorescein long-pass filter. Fluorescence from both live (green fluorescent) and dead (red fluorescent) amoeba was viewed simultaneously, and respective counts were recorded. The number of live and dead amoeba were determined for each of the nine squares on the hemocytometer and used in computing live and dead amoeba/mL. The average number of live and dead amoeba for the nine squares, the surface area of the field of view, and the volume of water filtered were used in the final calculation to determine the number of amoebae per mL.
Efficacy of Disinfectants on Survival of Amoeba
Amoeba Culture Used in Disinfectant Experiment Axenic cultures of Acanthamoeba sp. were maintained by subculturing them in PYG (proteose-peptone-yeast extract-glucose) medium every few weeks. Preparation of Amoeba Samples Amoeba were concentrated from an active culture by centrifugation at 1,500 revolutions per minute (rpm) for 1 min. The supernatant was decanted, and the pellet was
resuspended in 1 mL of Tris buffer. The suspension was recentrifuged at 1,500 rpm, followed by decantation of supernatant and resuspension of pellet in 1 mL of Tris buffer. 500 microliter (µL) (500 µL) of the prepared culture was used for the positive control. For the negative control, 500 µL of prepared culture was treated with 1 mL of 70% isopropyl alcohol and incubated at room temperature for two minutes. The suspension was vortexed prior to use.
All disinfectant assays were performed in saline buffer at room temperature. Amoeba were concentrated from an active culture by centrifugation at 1,500 rpm for 1 minute. The supernatant was decanted, and the pellet was resuspended in 1 mL of saline buffer. The suspension was recentrifuged at 1,500 rpm, followed by decantation of supernatant and resuspension of pellet in 6 mL of saline buffer.
For each disinfectant assay, the 6 mL of suspension in saline buffer was divided into two 3 mL centrifuge tubes. One centrifuge tube was used as the untreated control, while the other was used for the treatment. 500 µL from each centrifuge tube was withdrawn at the various tested times for determination of disinfectant efficacy.
Experimental Protocol Chlorine (1, 5, and 10 parts per million [ppm]) and a microbiocide (isothiazalone; 35 and 219 ppm) were tested for efficacy against amoeba. For the chlorine experiments, at the end of each incubation period and before the addition of the staining dye, any remaining free chlorine was quenched by the addition of sodium thiosulfate. Times tested for all disinfectants were 0, 15, 30, 45, and 60 min, and 24 hours.
25 ppm of BARDAC® 2250 R was used to determine if the methodology used in these assays is effective against amoeba. This is a twin-chain dimethyl ammonium chloride, which is effective against a broad spectrum of microbial organisms, including algae. Times tested were 0, 15, 30, 45, and 60 min.
Determination of Disinfectant Efficacy on Survival of Amoeba At the end of each assay time, 0.5 mL each of propidium iodide and SYTO 9 were added to the assay microcentrifuge tube and incubated at room temperature for 15 min. The tubes were then incubated at 36 °C for 15 minutes. 10 mL of stained sample was loaded into the injection area of a C-Chip hemocytometer, ensuring that the chamber fills by capillary action.
Results and Discussion Table A shows data on the association of amoeba with Legionella and total plate count (TPC) in non-potable water samples.
Previously, 171 non-potable water samples were analyzed for the presence of Legionella and TPC bacteria. These were subsequently examined for the presence of amoeba to determine if there was a relationship between these
Table A: Association of Amoeba With Legionella and TPC in Non-Potable Water Samples
CFU/mL No. of Samples Amoeba Positive Samples
Legionella Legionella Legionella Legionella Legionella TPC TPC TPC TPC TPC TPC TPC 0 127
1–99
30 100–999 13 1,000–9,999 1 All ranges 171 0 36
1-99
55 100-999 49 1,000-9,999 11 10,000-100,000 11 >100,000 9 All ranges 171
P = Statistical probability 83 25 12 0 120 24 42 38 6 6 4 120 Average With Amoeba CFU/mL 0 Average Without Amoeba CFU/mL 0 p With and Without Amoeba NA
30 185 0 25 0 36 22 550 1,600 44 0 45 0.281 0.002 NA 0.211 NA 0.165
256 358 0.048
2,833 3,400
0.290 16,666 22,000 0.301 275,000 268,000 0.467 10,235 28,853 0.044
microorganisms in non-potable water. All samples were selected randomly.
As can be observed from the data in Table A, amoebae were present in all identified ranges, including when Legionella and TPC were absent. Though Legionella and TPC were absent in these samples (n=127 and 36, respectively), amoeba occurrence in these samples is not unexpected since FLA feed on fungi and algae in addition to bacteria. These results were in contrast to a previous investigation with potable water where amoebae were present in all the identified ranges, with the exception of samples with no Legionella and TPC concentrations of less than 10 colony-forming units per mL (CFU/mL).
The probability that TPC and Legionella concentrations had anything to do with the presence of amoeba is not demonstrated by t-test probabilities done for all available concentration ranges except for Legionella and TPC in the range of 100 to 999 CFU/mL. At this range, the p value with and without amoeba was 0.002 for Legionella and 0.048 for TPC, indicating that the relationship between Legionella and amoeba and TPC and amoeba is statistically significant. Even when no detectable Legionella or TPC were observed, amoebae were detected in 83 and 24 samples, respectively. These results are in contrast to our previous observations in potable water, where amoebae were present in all ranges except for samples with no Legionella and TPC concentrations of less than 10 CFU/mL (8).
Table B: Numbers of Legionella, TPC, and Amoeba for Positive-Testing Field Samples in Non-Potable Water
Legionella TPC Live Amoeba
Dead Amoeba
Maximum cells/ mL 430 500,000 123,708 477,158
Mode cells/mL 10 10 13,254 4418 Average cells/mL 78 10,931 25,977 33,744 Number of samples 171 171 95 96
Table B shows that when water samples tested positive for amoeba, these samples contained almost equal numbers of viable (n=95) and nonviable (n=96) amoebae. This could be an indication that between the times of collection and processing, there is some die-off of amoeba.
Modes for field samples tested positive for live/dead amoeba well above the minimum detectable concentration of 3 cells/mL. In our previous research, potable water samples were more likely to contain viable rather than nonviable amoebae, indicating that between the times of collection and processing, most of the amoebae remained viable (7). The numbers of Legionella and TPC were typical of previously reported values (7, 9).
Table C: Correlations Between Microorganisms in NonPotable Water
Cells/mL Correlation (r)
Legionella versus TPC 0.37 *Legionella versus Total Amoeba -0.014 TPC versus Total Amoeba -0.04 **Live versus Dead Amoeba 0.25
*Excluding Legionella samples pre-selected as having no detectable Legionella (<0.05 CFU/mL). **Excluding samples that had no detectable amoeba.
The presence of total number of amoeba (dead + alive) is weakly negatively correlated with the presence of either Legionella (r = -0.014) or TPC (r = -0.04), indicating that as one variable increases, there is a decrease in the other. There is a weak positive correlation (r = 0.25) between the concentration of live and dead amoeba, which is unexpected. There is also a weak positive correlation between Legionella and TPC (n = 0.37), which is different from the results obtained in potable water (8). This data is shown in Table C.
Figure 1: Effect of free chlorine on survival of amoeba in non-potable water.
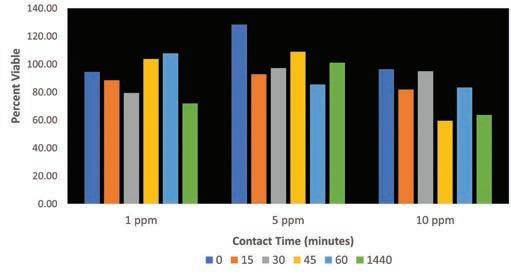
The data in Figure 1 indicate that a typical (1.0 ppm) and maximum allowable concentration (10.0 ppm) of free chlorine for non-potable water treatment are unable to exert a significant amoebicidal effect. There appears to be no linear relationship between contact time and percent viable amoeba at any of the tested concentrations, though there is a small decrease in viability by the end of 24 hours for the three tested concentrations. After 1,440 minutes of contact time at all three concentrations, 0 ppm of chlorine remained in solution.
Figure 2: Effect of Isothiazalone on survival of amoeba.
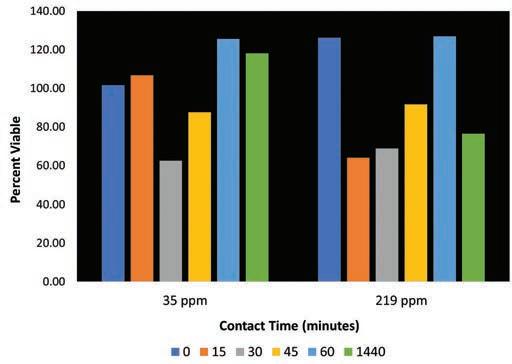
In Figure 2, data indicate that the two concentrations of isothiazalone tested are unable to exert a significant amoebicidal effect and that there is no linear relationship between concentration and time tested. The two concentrations tested were the minimum (35 ppm) and maximum (219 ppm) doses suggested by the manufacturer as maintenance concentrations when microbial control is evident in a system. Even after a 24-hour isothiazalone treatment with 219 ppm, the percent viability remained high at 76%, suggesting that this microbiocide is not an effective amoebicide at the concentrations tested.
Figure 3: Effect of DDAC on survival of amoeba.
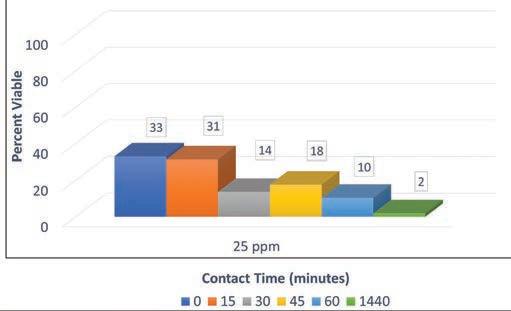
A quaternary ammonium compound (dodecyl dimethyl ammonium chloride [DDAC]) served as the positive control. In previous experiments, this compound affected a complete kill of amoeba (8) though in the current
investigation, viability of amoeba was 2% at the end of the experiment (1,440 minutes). Though DDAC did not affect complete kill, the significant reduction in viability of amoeba suggests that targeting the membrane of these organisms may be a more effective disinfection strategy rather than oxidation and/or chlorination of a reactive moiety such as primary and secondary amines. Figure 3 shows the effect of DDAC on amoeba survival.
Summary Based on this research, the author has the following observations about the relationship between amoeba and Legionella in non-potable water systems:
LIVE/DEAD® fungal/yeast stain can be used effectively to determine the presence of and quantify amoeba in non-potable water. Amoeba were present in all identified CFU/mL ranges, including when Legionella and TPC were absent. TPC and Legionella concentrations are not correlated to amoeba concentrations in non-potable water except in the 100 to 999 CFU/mL range. Amoeba and TPC concentrations appear to be correlated positively in the ranges of 100 to 999 CFU/ mL TPC and when all ranges are compared. There was no linear relationship between contact time and percent viable amoeba at any of the tested concentrations of free chlorine. The two concentrations of isothiazalone tested were unable to exert significant amoebicidal effect.
Acknowledgements The author would like to thank Carmel Holliday for her help with data collection, the U.S. Environmental Protection Agency’s Office and Research and Development for the amoeba cultures, and Weas Engineering for its continued support of our research projects.
References
1. CDC (November 2017). “Surveillance for Waterborne Disease Outbreaks
Associated with Drinking Water—United States, 2013–2014, Morbidity and Mortality Weekly Report 66(44), Centers for Disease Control and
Prevention, pp. 1216–1221. 2. Edelstein, P.H.; Edelstein, M.A. (1991). “Comparison of Different Agars
Used in the Formulation of Buffered Charcoal Yeast Extract Medium,”
Journal of Clinical Microbiology, 29, pp. 90–191. 3. Boamah, D.K.; Ghou, Z.; Ensminger, A.W.; O’Connor, T.J. (2017). “From
Many Hosts, One Accidental Pathogen: The Diverse Protozoan Hosts of
Legionella,” Frontiers in Cellular and Infection Microbiology, 7, p. 477. 4. Oliva, G.; Sahr, T.; Buchrieser, C. (2018). “The Life Cycle of L. pneumophila: Cellular Differentiation Is Linked to Virulence and
Metabolism,” Frontiers in Cellular and Infection Microbiology, 8, p. 3. 5. Abdel-Nour, M. Duncan, C.; Low, D.E.; Guyard. C. (2013). “Biofilms:
The Stronghold of Legionella pneumophila,” International Journal of Molecular Sciences, 14, pp. 21660–21675. 6. National Research Council (US) Safe Drinking Water Committee (1987).
Drinking Water and Health: Disinfectants and Disinfectant By-Products, vol. 7, National Academies Press, Washington, D.C. 7. Selvaratnam, S.; Coughlin, M.; Holliday, C. (2020). “Association of
Amoeba and Legionella in Potable Water Systems,” AWT Symposium,
Association of Water Technologies, Rockville, Maryland. 8. CDC (2005). “Procedures for the Recovery of Legionella from the
Environment,” U.S. Department of Health and Human Services, Public
Health Service, Atlanta, Georgia. 9. Selvaratnam, S.; Coughlin, M.; Sotkiewicz, E.; Holliday, C. (2018).
“Practical Recommendations for Meeting the Objectives of the CMS
Memorandum,” AWT Symposium, Association of Water Technologies,
Rockville, Maryland.
Shivi Selvaratnam, Ph.D., joined Weas Engineering in 2016 as the senior microbiologist and currently serves as the director of the chemistry and microbiology labs at Weas. Dr. Selvaratnam received her doctorate in microbiology from Drexel University and subsequently completed her post-doctorate at the University of Notre Dame. She worked in academia for seven years as an assistant professor of biology, teaching courses in microbiology and conducting research on the effects of pollutants on microbial communities in freshwater ecosystems. Prior to joining Weas Engineering, Dr. Selvaratnam worked as a technical environmental specialist at the Indiana Department of Environmental Management. She may be reached at shivi.selvaratnam@ weasengineering.com.
This paper was presented at the 2021 AWT Annual Convention & Exposition, which was conducted September 22–25, 2021, in Providence, Rhode Island.

