PRESENTING SPONSOR

You can support the environment and help make a positive impact on our Valley’s future with SRP’s community programs. Together, we have the power to make a difference.
See how at srp.net/change.


PRESENTING SPONSOR
You can support the environment and help make a positive impact on our Valley’s future with SRP’s community programs. Together, we have the power to make a difference.
See how at srp.net/change.

On behalf of SRP, welcome to the Arizona Hispanic Chamber of Commerce’s 2024 DATOS: The State of Arizona’s Hispanic Market report breakfast.
Since the first report 28 years ago, DATOS has become a much anticipated and highly regarded resource. It is the premier annual evaluation of the state of Arizona’s Hispanic market and its extraordinary economic power. In addition, the report offers valuable insight into the potential challenges and opportunities that may be ahead.
More than simply a look at numbers, DATOS takes a holistic approach to evaluating the Hispanic market and the community in general by also examining critical aspects of public health. This year, the report looks at the impact that access to quality, affordable food has on economic vitality. This is a strong reminder that many factors impact a community’s opportunity to grow and thrive.
SRP greatly values our relationship with the Arizona Hispanic Chamber of Commerce, and we are proud to continue our support of DATOS. Our mission is to deliver reliable, affordable and sustainable water and power, but we believe we have a greater responsibility to help ensure that everyone has the opportunity to succeed. We also believe that we are strongest when we work together and leverage Arizona’s incredible diversity and wonderful culture.
Thank you for your participation and your support of DATOS.

STEVEN LOPEZ
DATOS
Honorary Chair Senior Director, Supply Chain and Flight Services
Salt River Project (SRP)

I am proud to introduce the 28 th DATOS: The State of Arizona’s Hispanic Market. This year, we highlight a vital aspect of life that directly affects the health and prosperity of Arizona’s Hispanic population: quality, affordable food (p.157).
Six In Focus features and seven informative reprints explore rising food costs, food security, community efforts to address the meal gap and emerging small businesses that recognize the importance of providing nutritious, affordable food. Finally, a Special Feature (pp.171–173), courtesy of Univision Communications, looks at grocery shopping and both quick service and sit-down restaurants in the Phoenix and Tucson DMAs.
In this edition, backed by thorough market research and insightful analysis, we look at the significant role that access to nutritious, affordable food plays in our community. Like previous DATOS publications, there are also 12 other chapters that address critically important topics: population, economic and educational opportunity, affordable quality housing, the environment, health care, community safety, transportation, parks and recreation, community design, social/cultural cohesion and social justice. Throughout these chapters are many stories that will inspire you—like the article about Guillermina Coria and her tireless volunteer work with St. Vincent de Paul in Chapter 5 (Quality Affordable Food, p.186) and the incredible leaders profiled in Chapter 1 (Population, p.26).
I believe the insights provided by this year’s DATOS will help local business and public policy leaders recognize the importance of the Arizona Hispanic community and craft sensible solutions to current issues that affect all Arizona residents.
As we get ready to elect the next U.S. president on Tuesday, Nov. 5, consider this one fact: For the first time in its 95-year history, the League of United Latin American Citizens (LULAC), the oldest Hispanic civil rights organization in the U.S. has endorsed a U.S. presidential candidate: Vice President Kamala Harris and Tim Walz, her pick for her vice president.
The policies and leadership decisions made at the federal level will profoundly impact issues that matter most to Arizona’s Hispanic community and the businesses that serve it. In the last five presidential elections, 38 states have consistently voted red (Republican) or blue (Democrat). In every presidential election, a handful of “swing” states are less predictable.
Arizona is one of those “swing” states, which means that as an Arizona citizen, it is important for you to make your voice heard. Our Special Presidential Election Feature (p. 361) will give you the information you need. If you are not yet registered to vote, you have until Monday, Oct. 7, to register.
Remember, together, we really can change the world.

MÓNICA S. VILLALOBOS
President &
CEO,
AZ Hispanic Chamber of Commerce
Editor, DATOS: The State of Arizona's Hispanic Market PhotobyFonsecaPhotography
(LISTED IN ALPHABETICAL ORDER BY COMPANY/ORGANIZATION)
DR. LOUI OLIVAS
ARIZONA STATE UNIVERSITY
TARA JACKSON
ARIZONA TOWN HALL
ANDREA WHITSETT
ASU MORRISON INSTITUTE FOR PUBLIC POLICY
CHRISTINA TELLEZ
AZ REPUBLIC MEDIA
JOSEPH GARCIA
CHICANOS POR LA CAUSA (CPLC)
JAMES MONTOYA
CITY OF PHOENIX
MYRNA CARDENAS
EDUCATION FORWARD ARIZONA
KRISTEN STEPHENSON
G REATER PHOENIX
ECONOMIC COUNCIL
FRANCISCO AVALOS
LYFT
ERIC DIAZ
OYE! INTELLIGENCE
DALE BROWN
PHOENIX BUSINESS JOURNAL
LUIS CORDOVA
ROUNDS CONSULTING
STEVEN LOPEZ
SALT RIVER PROJECT (SRP)
DR. MARIA R. CHAVIRA
THE ROMAN CATHOLIC DIOCESE OF PHOENIX
DR. BERT VALENCIA
THUNDERBIRD SCHOOL OF GLOBAL MANAGEMENT
JAIME BOYD
UNIVISION ARIZONA
JAIME HINOJOS
VANTAGE WEST CREDIT UNION
GLENN IWATA
WESTGROUP RESEARCH
DR. FRANCISCO
LARA-VALENCIA
ASU SCHOOL
OF TRANSBORDER STUDIES
SUSANA MARTINEZ CITY OF PEORIA
KRISTEN RENEE
ONEAZ CREDIT UNION
VIRGINIA BEZERRA DE MENEZES
VITALYST HEALTH FOUNDATION
GABRIEL JARAMILLO
VITALYST HEALTH FOUNDATION
In DATOS 2024, the terms Hispanic, LatinX and Latino are used synonymously, as are Native American and American Indian and African American and Black. White, non-Hispanic is sometimes referred to as non-Hispanic white. Hispanics may be of any race.
MÓNICA S. VILLALOBOS
EDITOR
PAUL PADILLA
DATOS ASSOCIATE EDITOR DIRECTOR OF MARKET INTELLIGENCE
CARMEN G. MARTÍNEZ CREATIVE DIRECTOR
KAREN MURPHY STAFF WRITER/COPY EDITOR/ PROOFREADER
DANIELA CHAVIRA
WRITER/JOURNALIST INTERN
DR. LOUI OLIVAS SANDY FERNIZA
GEMA DUARTE-LUNA
RHONDA CARRILLO
DATOS TOTAL ACCESS SUBSCRIBER MODEL
SALVADOR RIVERA THYNKB
The information presented here was selected from standard secondary sources. However, data changes quickly and is not always collected annually. Data often offers a static picture of an ever-changing situation. The numbers calculated for any statistic depend on the definitions and assumptions used to produce them.

KEY CHARACTERISTICS
Owner/Partner/Top Management
Average number of company employees
Average company revenues
READER INVOLVEMENT
Average time spent reading the Book of Lists
16 minutes PAST MONTH
Average number of times used
2.5
The Book of Lists enables business professionals to look at the overall picture of their local area and industry, enabling them to identify the threats and opportunities facing their business and develop strategic plans to create a competitive advantage. Top executives rely on it all year long and call on advertisers appearing in the Book. of subscribers agree that advertisers in the Book of Lists are thought of as leaders in their industries 75% of subscribers have bought products/services from companies that advertise in the Book of Lists 65% of subscribers says the Book of Lists helps determine a short list of companies to use or do business with 71%
POPULATION


ECONOMIC OPPORTUNITY
EDUCATIONAL OPPORTUNITY
AFFORDABLE QUALITY HOUSING
QUALITY AFFORDABLE FOOD
ENVIRONMENTAL QUALITY
TRANSPORTATION OPTIONS
PARKS AND RECREATION
ACCESS TO CARE

• PLEASE NOTE THAT THIS IS A SEARCHABLE PDF AND BY CLICKING CTL-F ON A PC OR COMMAND-F ON A MAC, A SEARCH BOX WILL APPEAR TO LOCATE ANY WORD OR PHRASE. 6 7 8 1 5 2 3 4 9 11 13 10 12
• THIS IS A COMPREHENSIVE COMPILATION OF SECONDARY RESEARCH MADE AVAILABLE TO THE AZHCC FROM VARIOUS SOURCES. IT IS EITHER PUBLIC INFORMATION OR USED WITH PERMISSION FROM THOSE SOURCES.
COMMUNITY DESIGN

SOCIAL/CULTURAL COHESION
SOCIAL JUSTICE

• INFOGRAPHICS VECTOR DESIGN TEMPLATE FILE: #77345968,
OPCIONES DE TRANSPORTE
JUSTICIA SOCIAL
COHESIÓN SOCIAL / CULTURAL

ACCESO A LA ATENCIÓN DE SALUD
VIVIENDA DE CALIDAD A PRECIOS ACCESIBLES
RESI
NCIA
ELEMENTOS DE UNA COMUNIDAD SALUDABLE
PARQUES Y RECREACIÓN
DISEÑO DE COMUNIDADES SALUDABLES
ALIMENTOS DE CALIDAD A PRECIOS ACCESIBLES
OPORTUNIDADES ECONÓMICAS SEGURIDAD COMUNITARIA
OPORTUNIDADES EDUCATIVAS
CALIDAD DEL MEDIO AMBIENTE
Given how often data ends up challenging conventional wisdom, it’s almost funny how surprising an accumulation of facts and framing can be. This has held true with Hispanics and DATOS and it similarly applies to health.
Conventional thinking holds that health is the product of health care, subject to the influence of genes and personal choice. But the data tell a different story. The consensus finding of the World Health Organization (WHO) is that health care represents only about 10-20 percent of overall health. The science of epigenetics is clarifying that genetic profiles actually do not predetermine our individual fates. Meanwhile, public health officials worldwide agree that the choices we make are predicated by the choices we have.
In other words, health goes beyond health care. Health is everywhere — shaped by the contexts in which we live, work, learn and play. Many of health’s data experts assert that the strongest predictor of health and well-being is not your genetic code, but rather your zip code. In fact, conditions in neighborhoods separated by just a 10-20 minute drive in Phoenix have the capacity to affect life expectancy by up to 10-14 years. Phoenix is not an anomaly. Cities all over the U.S. share similar profiles.
These facts are not just attention-getting, they are also perception-shifting and empowering. They tell us that we have new options to improve health and well-being. We can call upon partnership with sectors like food, housing or transportation. We can delve into the health impacts of education and economic opportunity. We can extend ourselves toward impacting the visceral effect that social factors like isolation or toxic stress have on health. We can study how all of these factors are rooted by the cross-cutting issues of equity and resilience. We can use that knowledge to collaborate and integrate efforts among and across sectors. In so doing, we can be more powerful, more effective and more impactful in improving community health and well-being.
We are humbled to be partnered with the Arizona Hispanic Chamber of Commerce in order to more thoroughly understand what this approach can mean for the well-being of Hispanics. Part of the DATOS mission is to align perceptions of Arizona Hispanics with a data-based reality. Vitalyst’s Live Well Arizona goal is to realign perceptions with the facts as well — and to capitalize on that new understanding with cross-sector investments of time, talent and treasure that can propel Arizona to a more equitable, healthier future.
When it comes to honoring the Hispanic community’s unique assets and strengths within this new health paradigm, we couldn’t be more grateful to partner with DATOS.
Here’s to a future of working together to improve community health and well-being for us all.
The
To learn more, please visit VitalystHealth.org

1. The U.S. Hispanic population reached 63.6 million in 2022.
Source: U.S. Census Bureau
2. In 2022, Arizona had the 4th highest annual domestic net migration count (77,995 people) in the nation.
Source: U.S. Census Bureau
3. In 2022, U.S. Hispanics had the lowest median weekly earnings in nearly every major occupational group.
Source: U.S. Bureau of Labor Statistics
4. Between 2013 and 2022, wealth in U.S. Hispanic households has more than tripled from a median household wealth of $19,998 to $63,400.
8. In 2022, the Phoenix–Mesa–Chandler area had the 5th most severe shortage of affordable homes for extremely low-income households in the nation (19 affordable and available homes per 100 households).
Source: National Low Income Housing Coalition
9. In 2022, the U.S. food insecurity rate (12.8%) was the highest since 2014.
Source: U.S. Department of Agriculture
10. Between 2021 and 2022, the percentage of U.S. Hispanic households that were food insecure increased from 16.2% to 20.8%. This was the greatest percentage increase of any other group in the nation.
Source: U.S. Department of Agriculture
Source: Hispanic Wealth Project and National Association of Hispanic Real Estate Professionals (NAHREP)
5. Between 2010 and 2022, the percentage increase of Hispanic males (+116.5%) and Hispanic females (+129.3%) with graduate degrees was greater than all other groups in the nation.
Source: U.S. Census Bureau
6. During the 2020–2021 school year, Arizona had the 3rd lowest public school student investment ($10,899 per pupil) in the nation.
Source: U.S. Department of Education
7. In 2023, the U.S. Hispanic homeownership rate was 49.5%. This rate has never exceeded 51% since it began being tracked in 1994.
Source: Federal Reserve Bank of St. Louis
11. In 2022, nearly 40% (37.8%) of the total U.S. food supply was surplus (88.73 million tons).
Source: ReFed
12. Between 2020 and 2022, Arizona had the 23th lowest food insecurity rate (10.2%) in the nation.
Source: U.S. Department of Agriculture
13. In 2022, 1 in 8 people faced hunger (963,130 people) in Arizona, including 1 in 5 children (293,950 children). More than half of the food insecure people in Arizona (53%) were not eligible for SNAP assistance.
Source: Feeding America
14. In 2022, 70% of U.S. Hispanics perceived climate change as a critical threat over the next 10 years.
Source: The Chicago Council on Global Affairs
15. In January 2024, 76% of Arizonans believed the state has a serious water supply issue.
Source: Colorado College
16. In 2022, 36% of nonelderly U.S. Hispanic adults lacked a personal health care provider.
Source: KFF
17. In 2022, Arizona had the 4th highest diabetes rate for Hispanics in the nation.
Source: United Health Foundation
18. Between FY2021 and FY2023, the total weight of drugs seized by U.S. Customs and Border Protection at the southern border decreased by 43%, while fentanyl seizures increased by 151%.
Source: U.S. Customs and Border Protection
19. In FY2023, illegal entry (45%) was the most common criminal conviction type for noncitizens arrested by U.S. Border Patrol.
Source: U.S. Customs and Border Protection
20. In 2021, the total number of highway fatalities in Arizona (1,180) was at the highest level since 2006.
Source: United States Transportation Department
21. In 2022, 25% of Arizona’s roads were in poor condition.
Source: United States Transportation Department
22. Between 2020 and 2021, Arizona ranked second to last for youth sports participation (42.6%) in the U.S.
Source: Aspen Institute
23. In 2022, Hispanic adults in Arizona had the lowest participation in physical activity (72%) compared to other races and ethnicities.
Source: KFF
24. Between 2022 and 2023, people experiencing homelessness in the U.S. increased by 12%.
Source: U.S. Department of Housing and Urban Development
25. During the pandemic (2020–2022), Arizona ranked 5th among states with the largest increase in people experiencing homelessness (+2,574 people).
Source: U.S. Department of Housing and Urban Development
26. An estimated 36.2 million Latinos are eligible to vote in the U.S. in 2024.
Source: Pew Research Center
27. As of November 2023, inflation, the economy and housing were the top concerns for Arizona Latino voters.
Source: UnidosUS
28. In FY2023, most federal crimes committed by sentenced U.S. Hispanics were immigration related (57%).
Source: United States Sentencing Commission
29. Between 2021 and 2022, the imprisonment rate of U.S. Hispanic adults decreased by 2.6%.
Source: U.S. Department of Justice

1 10 100 1,000 10,000 100,000 1,000,000 10,000,000 100,000,000 1,000,000,000 10,000,000,000 100,000,000,000
1,000,000,000,000
Ones thousands millions billions trillions
• NEARLY ONE IN FIVE PEOPLE IN THE U.S. ARE HISPANIC
• THE OVERWHELMING MAJORITY OF U.S. HISPANICS DO NOT FIT INTO ANY SINGULAR MAJOR RACE GROUP
• MEXICANS NOW REPRESENT A SMALLER PERCENTAGE OF THE TOTAL U.S. HISPANIC POPULATION
• BY 2050, ONE IN FOUR PEOPLE IN THE U.S. ARE PROJECTED TO BE HISPANIC
• SINCE 2019, MEXICANS NO LONGER RESPRESENT THE MAJORITY OF UNAUTHORIZED IMMIGRANTS IN THE U.S.
• BETWEEN 2019 AND 2022, THE OVERALL NUMBER OF UNAUTHORIZED IMMIGRANTS IN THE U.S. INCREASED BY 8%, WITH MORE UNAUTHORIZED IMMIGRANTS COMING FROM THE CARIBBEAN, EUROPE, CANADA AND SOUTH AMERICA
• MEXICANS ARE PREDOMINANTLY CONCENTRATED IN THE WESTERN AND MIDWESTERN REGIONS OF THE U.S.
• NORTH DAKOTA EXPERIENCED THE LARGEST HISPANIC POPULATION GROWTH BY PERCENTAGE
• ONE IN THREE PEOPLE IN ARIZONA ARE HISPANIC
• SIX OUT OF THE 15 ARIZONA COUNTIES HAVE A LARGER HISPANIC POPULATION BY PERCENTAGE THAN THE OVERALL STATE
• THE OVERWHELMING MAJORITY OF ARIZONA HISPANICS DO NOT FIT INTO ANY SINGULAR MAJOR RACE GROUP
• OVER THE PAST DECADE, THE CENTRAL AMERICAN HISPANIC POPULATION IN ARIZONA HAS INCREASED BY OVER 90%
• ARIZONA IS THE 4TH MOST ATTRACTIVE STATE FOR THOSE LOOKING TO MOVE TO A DIFFERENT STATE IN THE U.S.
• ARIZONA’S DOMESTIC NET MIGRATION COUNT HAS DECREASED BY OVER 20% SINCE ITS PEAK IN 2017
• BY 2060, TWO IN FIVE PEOPLE IN ARIZONA ARE PROJECTED TO BE HISPANIC
• BETWEEN 2024 AND 2060, ARIZONA’S COCHISE AND LA PAZ COUNTIES ARE EXPECTED TO EXPERIENCE THE LARGEST HISPANIC POPULATION GROWTH BY PERCENTAGE
The Population chapter (Chapter 1) includes comparisons from the U.S. Census Bureau’s 2013 American Community Survey (ACS) 1-year estimates, 2022 American Community Survey (ACS) 1-year estimates and 2022 American Community Survey (ACS) 5-year estimates. Outcomes derived from these comparisons should be acknowledged with caution as each U.S. Census Bureau product has a different methodology. More information about comparing estimates can be found here.
Hispanics in Phoenix and Tucson
Univision Communications presents a broad overview of the Hispanic population in the Phoenix and Tucson markets
INSPIRING HISPANICS
Pick Your Role Model
These leaders each chose a different path, but what unites them all is their grit, determination and passion for their work BY
KAREN MURPHY
Depression, Suicide and the Rise of Social Media Use in Hispanic Communities
Most research points to a single fact: Too much social media use is negatively affecting our youth. Paradoxically, it can also create supportive communities BY
DANIELA CHAVIRA
COLLABORATION IS KEY
Arizona’s Mexican Consulate Network Fosters Strong Cross-Border Relations
Since Consul General Jorge Mendoza Yescas arrived in Phoenix, his team-building efforts have led to strong ties with Mexico BY DANIELA CHAVIRA
Abriendo Puertas/Opening Doors, in partnership with UnidosUS and BSP Research, surveyed and interviewed 1,500 Latino families with young children to understand the issues and concerns that shape their daily lives
The U.S. Treasury Department Report Card shows that Latino business ownership is up and that pandemic recovery efforts have helped grow Latino-owned businesses
EXCERPT
KFF, in partnership with the LA Times, did a Survey of Immigrants in Spring 2023 to better understand the U.S. immigrant experience. One fact stood out: Most immigrants came to the U.S. for more opportunities for themselves and their children

63,553,639 19.1%
63,553,639
NOTE: Caribbean Hispanics are Hispanics of Puerto Rican, Cuban and Dominican origin.
Sources: U.S. Census Bureau, B03001 2022 American Community Survey 1-Year Estimates data.census.gov/table/ACSDT1Y2022.B03001 U.S. Census Bureau, B03001 2013 American Community Survey 1-Year Estimates data.census.gov/table/ACSDT1Y2013.B03001
BY 2050, ONE IN FOUR PEOPLE IN THE U.S. ARE PROJECTED TO BE HISPANIC
U.S. HISPANIC POPULATION BY ORIGIN GROUPS (2013 & 2022)
• The number of unauthorized immigrants from Mexico dropped to 4.0 million in 2022 from a peak of 6.9 million in 2007. Mexico has long been and remains, the most common country of birth for unauthorized immigrants.
• From 2019 to 2022, the unauthorized immigrant population from nearly every region of the world grew. The Caribbean, South America, Asia, Europe and sub-Saharan Africa all saw increases.
• The unauthorized immigrant population grew in six states from 2019 to 2022 –Florida, Maryland, Massachusetts, New Jersey, New York and Texas. Only California saw a decrease.
• About 8.3 million U.S. workers in 2022 were unauthorized immigrants , an increase from 7.4 million in 2019. The 2022 number is essentially the same as previous highs in 2008 and 2011.
BETWEEN 2019 AND 2022, THE OVERALL NUMBER OF UNAUTHORIZED IMMIGRANTS IN THE U.S. INCREASED BY 8%, WITH MORE UNAUTHORIZED IMMIGRANTS COMING FROM THE CARRIBEAN, EUROPE, CANADA AND SOUTH AMERICA
U.S. UNAUTHORIZED IMMIGRANT POPULATION BY COUNTRY OF BIRTH, IN THOUSANDS (2019 & 2022)
U.S. TOTAL UNAUTHORIZED IMMIGRANT POPULATION
Source: Pew Research Center, "What we know about unauthorized immigrants living in the U.S.," Jeffrey S. Passel and Jens Manuel Krogstad, July 22, 2024 www.pewresearch.org/short-reads/2024/07/22/what-we-know-about-unauthorized-immigrants-living-in-the-us/
HISPANIC POPULATION IN METROPOLITAN STATISTICAL AREAS (MSA s) BY ORIGIN GROUPS (2022) NORTHEAST
PHILADELPHIA-CAMDENWILMINGTON, PA-NJ-DE-MD
BOSTON-CAMBRIDGE-NEWTON, MA-NH
MIDWEST
CHICAGO-NAPERVILLE-ELGIN, IL-IN-WI
MINNEAPOLIS-ST. PAULBLOOMINGTON, MN-WI
KANSAS CITY, MO-KS
Sources: Pew Research Center, "11 facts about Hispanic origin groups in the U.S.," Mohamad Moslimani, Mark Hugo Lopez and Luis Noe-Bustamante, August 16, 2023 pewresearch.org/short-reads/2023/08/16/11-facts-about-hispanic-origin-groups-in-the-us/ U.S. Census Bureau, B03001 2022 American Community Survey 1-Year Estimates data.census.gov/table/ACSDT1Y2022.B03001
MIAMI-FORT LAUDERDALEPOMPANO BEACH, FL
HOUSTON-THE WOODLANDSSUGAR LAND, TX METRO AREA
DALLAS-FORT WORTHARLINGTON, TX
LOS ANGELES-LONG BEACHANAHEIM, CA METRO AREA
RIVERSIDE-SAN BERNARDINOONTARIO, CA METRO AREA
PHOENIX-MESA-CHANDLER, AZ METRO AREA
Sources: Pew Research Center, "11 facts about Hispanic origin groups in the U.S.," Mohamad Moslimani, Mark Hugo Lopez and Luis Noe-Bustamante, August 16, 2023 pewresearch.org/short-reads/2023/08/16/11-facts-about-hispanic-origin-groups-in-the-us/ U.S. Census Bureau, B03001 2022 American Community Survey 1-Year Estimates data.census.gov/table/ACSDT1Y2022.B03001
TOP 10 STATES WITH THE LARGEST HISPANIC POPULATION GROWTH BY PERCENTAGE (2013—2022)
ARIZONA IS THE 4TH MOST ATTRACTIVE STATE FOR THOSE LOOKING TO MOVE TO A DIFFERENT STATE IN THE U.S.
10 U.S. STATES WITH THE HIGHEST ANNUAL DOMESTIC NET MIGRATION COUNT* (2022)
+249,064 +174,261
BETWEEN 2024 AND 2060, ARIZONA’S COCHISE AND LA PAZ COUNTIES ARE EXPECTED TO EXPERIENCE THE LARGEST HISPANIC POPULATION GROWTH


7 1 % of U.S. Hispanics agree that they wish they had more ways to show the world how proud they are of their culture and heritage.2

8 4 % of U.S. Hispanics say, “companies that make sincere efforts to be a part of,
8 4 % of Phoenix Hispanics Speak Any Spanish3

7
8
8
Theseleaderseachchoseadifferentpath,butwhatunites
BY KAREN MURPHY
BE INSPIRED
ARIZONA
CIVIL RIGHTS
Frank Barrios
Regina Romero Gonzalo and Felicitas Mendez
Luis Antonio Miranda Jr.
Jose Felipe Herrera
Ada Limón
Stephanie Pacheco
JOURNALISTS
OTHER PATHS
Jorge Ramos
Paola Ramos
José Andrés
Richard Cavazos
Victor Montalvo
George Meléndez Wright
You will hear many stories about the incredible lives of a few Hispanics during the annual Hispanic Heritage Month (Sept. 15–Oct. 15). In Arizona, it usually means co-founders Cesario Estrada Chavez (who was born in Arizona) and Dolores Huerta of the National Farm Workers Assn. (ultimately the United Farm Workers labor union) and Raúl Héctor Castro, who, in 1974, was the first Mexican American to be elected governor of Arizona.
The lives of Chavez, Huerta and Castro are inspirational, but you should already know their stories. In the large and colorful Hispanic/Latino stew, there are many other people, past and present, whose incredible lives reveal their passions and offer role models for future generations. This article highlights just a few of these leaders whose stories should inspire and motivate you. ARIZONA Frank M. Barrios, 81 4.8.42–9.11.23
Lifelong Phoenix resident Frank Barrios was an engineer by trade, but his true passion was preserving the history of the original
Mexican residents who settled in Phoenix. This passion led him to be a community activist and an author. His book, Mexicans in Phoenix, is a mostly pictorial history of the Mexican families who made Arizona their home beginning in the mid-1800s. Barrios died a year ago after a year-long battle with pancreatic cancer.
Honoring Frank Barrios’ Legacy and Impact phoenixcollege.edu
Mexicans in Phoenix amazon.com/Mexicans-Phoenix-Images-America-Arizona/
Regina Romero was elected in 2019 as the 42nd mayor of Tucson, AZ. She is also the first female and first Latina mayor of the city. In fact, she is the first Tucson mayor of Latino heritage in almost 150 years. The first was Estevan Ochoa, who was in office from 1875 to 1876.
Romero also is the chair of the Latino Alliance of the U.S. Conference of Mayors and co-chair of Mayors Against Illegal Guns. She is one of six children of Mexican farmworkers who emigrated to Arizona and settled in Somerton. She is the first person in her family to graduate
college (B.A., University of Arizona; post-graduate certificate from Harvard University's Kennedy School of Government) and the first member of her family to vote in the U.S. tucsonaz.gov

Gonzalo Mendez, 51 1913–1964
Felicitas Mendez, 82 2.5.16–4.12.98
The 1954 U.S. Supreme Court decision in the landmark civil rights case, Brown v. the Board of Education of Topeka is always the case cited when school desegregation in the U.S. is discussed. The precedent for that case, however, happened in California. Gonzalo Mendez, his mother and Gonzalo’s four siblings moved from Mexico to Westminster, CA, in 1919. In 1943, when Gonzalo was 30, he became a naturalized U.S. citizen. In 1945, Gonzalo and his
HISPANICS: PICK YOUR ROLE MODEL
wife Felicitas, who was originally from Puerto Rico, hired attorney David Marcus to represent them and four other Hispanic families (the families of William Guzmán, Frank Palomino, Thomas Estrada and Lorenzo Ramirez) in Mendez et al. v. Westminster School District of Orange County, et al. The case was filed on behalf of the approximately 5000 other persons of “Mexican and Latin descent.”
In that case, four school districts in Orange County were charged with violating the equal protection under the law clause of the 14th Amendment because Mexican American students were being sent to different schools to separate them from white students in the county. The California courts decided that this separation was unconstitutional, which made California the first state in the nation to end school segregation and set a precedent for the later landmark Brown decision.
As a result of the lawsuit, Sylvia Mendez, one of Gonzalo's and Felicitas's children, became one of the first Hispanic children to attend an all-white school in California. She went on to become a nurse and spent her life as a civil rights advocate who emphasized the importance of education and encouraged children to stay in school. She is now 88 years old and continues to tell her parents’ incredible story.
'No Dogs or Mexicans Allowed':
Mendez v. Westminster and its Legacy pbssocal.org/history-society
Sandra Robbie’s documentary Mendez v. Westminster: ForAll the Children youtube.com
Mendez Historic Freedom Trail and Monument Westminster-ca.gov
Luis Antonio Miranda Concepción is the chairperson of the Latino Victory Fund, the Northern Manhattan Arts Alliance, The Public Theater and ¡Viva! Broadway. He was the founding president of The Hispanic Federation, one of the largest Latinx advocacy groups in the U.S., with a network of more than 600 affiliate organizations. Miranda is a political strategist, philanthropist and advocacy consultant who also co-founded the MirRam Group 20 years ago.
His memoir, Relentless: My Story of the Latino Spirit That Is Transforming America, came out this past May. He also happens to be the father of another famous Miranda: Lin-Manuel Miranda, an actor, singer, songwriter, filmmaker, rapper and librettist who has won a Pulitzer Prize, an Emmy, a Tony and a Grammy. His most recent success is the smash hit Hamilton (he played Hamilton from 2013–2015).
The Hispanic Federation hispanicfederation.org
MirRam Group mirramgroup.com
Juan Felipe Herrera, 75
Juan Felipe Herrera, the son of migrant farmworkers, is a poet, writer, cartoonist and activist. He was the state of California’s poet Laureate from 2012–2014 and the first Latino poet laureate of the United States (2015–2017). He is a professor emeritus in the Department of Chicano and Latin American Studies at California
INSPIRING HISPANICS: PICK YOUR ROLE MODEL

State University, Fresno (Fresno State) and the Laureate Lab Visual Wordist Studio coordinator at the Fresno State Library. The studio is an open, free space for “students, writers, artists and community members to explore the dimensions of and connections between poetry, sound, movement, visual art and performance.”
Herrera unapologetically uses his poetry to celebrate his Hispanic heritage. In addition to writing short stories, young adult novels and children’s literature, he has released two collections: 187 Reasons Mexicanos Can’t Cross the Border: Undocuments 1971—2007 and Border-Crosser with a Lamborghini Dream. In 2022, the Juan Felipe Herrera Elementary School opened in Fresno (5090 E. Church Ave., Fresno). britannica.com
Ada Limón became the 24th Poet Laureate of the United States on July 12, 2022, the first Latina to hold the title. Limón will serve as poet laureate until spring 2025. Her signature initiative is You Are Here, which began this summer by installing poetry on tables in seven national parks. On Dec. 3, Na:nko Ma:s Cewagĭ /Cloud
Song by Ofelia Zepeda will be installed in Saguaro National Park in southern Arizona.
Limón has written six books of poetry and is one of 12 trailblazers who were the 2024 TIME Women of the Year. Her book, The Carrying, won the National Book Critics Circle Award for Poetry.
Ada Limón’s website adalimon.net
2024 TIME Women of the Year time.com/collection/women-of-the-year
Cloud Song by Ofelia Zepeda poetrysociety.org
Stephanie Pacheco was named the 2024 National Youth Poet Laureate, a moniker created by the youth literary arts organization Urban Word that typically recognizes young poets who focus on social advocacy. Pacheco is the eighth person to hold the title.
Amanda Gorman, who read her stunning work at the 2021 presidential inauguration, also won this prestigious award. Pacheco has previously been named New York City Youth Poet Laureate and the Inaugural New York State Youth Poet Laureate.
Read Pacheco’s poem, Yo,Steph!WhereYouFrom? wbur.org
The “Cultural Practice of Stephanie Pacheco: A Conversation with the 2024 National Youth Poet Laureate worldliteraturetoday.org
INSPIRING HISPANICS: PICK YOUR ROLE MODEL

Jorge Ramos, 66
Paolo Ramos, 37
Jorge Ramos is a Mexican-born American journalist, author and coanchor for Noticiero Univision. Ramos, one of the most influential people in the U.S., is lovingly called the “Walter Cronkite of Latin America.”
He has been instrumental in promoting literacy among Latinos and in 2002, created the first book club in the history of Hispanic television: Despierta Leyendo (Wake Up Reading). He has more than eight Emmy Awards and is the author of more than a dozen books. His most recent book, Así veo las cosas: Lo que nunca te conté/TheWayISeeThings:WhatINeverToldYou, was published in June.
His daughter, Paolo, has followed in his footsteps and has become a host/correspondent for VICE News and a contributor to Telemundo News and MSNBC. She is a Hauser Fellow at the Harvard Kennedy School.
NOTE: At press time, a New York Times story written by Jesus Jiménez reported that TelevisaUnivision said that “Mr. Ramos and Univision mutually agreed not to renew his contract, which is set to expire soon.” According to the article, Ramos will remain with the network through the presidential election, but “by the end of 2024, Mr. Ramos will step down as co-anchor on Noticiero Univision.” Ramos has been the co-anchor of the network’s evening news show for 38 years.
ThisJorgeRamosshouldnotbeconfusedwithJorgeL.Ramos,the 74-year-oldretiredeight-timeEmmyAward-winningPuertoRican broadcastjournalistforTelemundo’sNewYorkCityaffiliate,WNJU Telemundo47,whichislicensedtoLinden,NJ.
jorgeramos.com
paolaramos.com

José Andrés, 55
Spanish-American chef José Andrés has always had a not-sosimple mission: “To change the world through the power of food.” The José Andrés Group founded 30 years ago, currently has 40 restaurants—from two Michelin-starred restaurants and ones featuring small plates to fast-casual eateries and a food hall. Andrés’ humanitarian efforts, however, are the most awe-inspiring.
His World Central Kitchen (WCK), a nonprofit food relief organization founded by Andrés and his wife Patricia in 2010, goes right to the frontlines in war-torn countries, providing meals in response to humanitarian, climate and community crises. Tragically, this year, seven WCK workers were killed by an Israeli airstrike in Deir al Balah, Gaza, on April 2.
joseandres.com
World Central Kitchen wck.org
INSPIRING HISPANICS: PICK YOUR ROLE MODEL
Richard E. Cavazos, 88 1.31.29–10.29.17
Mexican American Richard Edward Cavazos grew up on a cattle ranch in Texas and became the first Hispanic four-star general in the U.S. Army. His father was a World War I veteran who became a ranch foreman. According to the U.S. Army National Museum, despite the rampant racism at the time, his parents managed to put all four of their children through college.
Cavazos is remembered as both a fearless leader who regularly joined his soldiers on the battlefield and a beloved mentor and teacher. Fort Hood in Texas is now named Fort Cavazos in his honor.
FromtheU.S.ArmyNationalMuseumwebsite:
“ItoldhimwhathemeanttouspoorHispanickids,”recalled Maj.Gen.AlfredValenzuela.“Hisimpactasamentorisprobably thegreatestimpactourarmyhad….Wealllookeduptohim asanAmericansoldier,aHispanicsoldier.Hewastheguywe wantedtobe.Ifwecouldn’tbehim,wewantedtobenearhim and servewith him.” thenmusa.org/biographies/richard-e-cavazos
FromthePritzkerMilitaryMuseumandLibrary,Chicago youtube.com
Victor Montalvo, 30
Breaking made its debut at the 2024 Paris Olympics in La Concorde, a Paris park. Mexican American breaking (breakdancing) champion
Victor Montalvo (aka B-boy Victor) was a favorite to win the gold, but instead took home the bronze for Team USA on Aug 20 in this new Olympic sport. Montalvo also has won two Red Bull BC One titles and a gold at the 2022 World Games.
He was introduced to breaking by his father, Victor Bermudez and uncle, Hector, who are described as “breaking pioneers” who first helped grow the sport in Mexico in the late 1980s.
NOTE: Breaking is currently not scheduled to be included in any upcomingSummerOlympicGames.
Montalvo’s Bronze Medal Performance youtube.com
Victory Dance: Interview with Olympic Bronze Medalist Victor Montalvo forbes.com
George Meléndez Wright, 31 6.20.04–2.25.36
In 1927, 23-year-old George Meléndez Wright started work at Yosemite National Park as a ranger naturalist. He was the first Hispanic to have any professional position in the National Park Service (NPS). Two years after his arrival, Wright organized the first science-based wildlife survey of the western parks. His visionary work revolutionized wildlife conservation and sustainability in U.S. parks and other public lands.
He tragically died in a car accident in 1936. A biography of Wright written by Jerry Emory titled, George Meléndez Wright: The Fight forWildlifeandWildernessintheNationalParks, was published in 2023 by the University of Chicago Press.
NOV. 20, 2024 | 7pm MT
The Glacier Book Club will host a free discussion of the Wright biography via Zoom with author Jerry Emory and Doug Mitchell, executive director of the Glacier National Park Conservancy. The conservancy is the fundraising partner for Glacier National Park in Montana.
glacier.org/glacier-book-club
Karen Murphyis a staffwriterand copyeditor/proofreaderforthe Arizona Hispanic ChamberofCommerce (AZHCC).

At Comerica Bank, we believe when everyone has an equal opportunity to thrive, we all thrive.
That’s why we invest time, resources and capital into creating economic opportunities that help build stronger communities.
From a ordable housing to financial education and workforce development, Comerica is committed to helping everyone … succeed.
BY DANIELA CHAVIRA
Depression is a common but severe and debilitating mood disorder characterized by persistent feelings of sadness, hopelessness and a lack of interest or pleasure in daily activities. It negatively impacts a person’s thoughts, emotions and overall quality of life, according to a September 2020 article in the Journal of the AmericanMedicalAssn.(JAMA).
Although not everyone who has depression will consider or commit suicide, there is a substantially increased risk of attempting suicide compared to the general population, according to the authors of a March 2020 article published online in Psychiatry Investigation, a publication of the Korean Neuropsychiatric Assn. It is primarily because depressed people experience feelings of hopelessness, despair and cognitive impairments such as impaired decisionmaking and rumination.
the
92.3%
SOURCE: “Hispanic Child Suicides in the United States, 2010—2019,” JournalofCommunityHealth,James H. Price and Jagdish Khubchandani (Jan. 8, 2022)
According to the Centers for Disease Control and Prevention (CDC), suicide rates increased by approximately 36% between 2000—2021. Surprisingly, many people battling depression or other mental health disorders may not show outward symptoms of their struggle. It also is important to note that suicide rates vary by race/ethnicity, age and factors such as location and coexisting mental health conditions.
U.S. Hispanic suicide rates, particularly among adolescents and women, have drastically risen in the last decade, according to an August 2018 article in Current Opinion in Psychology by Caroline Silva and Kimberly A. Van Orden. A 2014 report from the Albert Einstein College of Medicine of Yeshiva University and the Hispanic Community Health Study/Study of Latinos (HCHS/SOL) said that 27% of Hispanics/Latinos reported high levels of depressive symptoms with varying rates by subgroup.
Of the 27% who reported depressive symptoms, Mexicans had the lowest (22.3%), while Puerto Ricans had the highest (38%). The report was based on a study that sampled more than 16,000 Hispanics/Latinos ages 18 to 74 (specifically, Cubans, Central and South Americans, Puerto Ricans, Mexicans and Dominicans) in four diverse communities (New York, Chicago, San Diego and Miami) from 2008 to 2011.
A significant factor contributing to current mental health issues was the recent global COVID-19 pandemic, which caused lockdowns and severe disruptions to daily life, such as widespread unemployment. According to the September 2020 article in the Journal of the American Medical Assn. (JAMA) mentioned earlier, 32.8% of U.S. adults experienced increased depressive symptoms in 2021 compared to 8.5% before the pandemic. These rates can
DEPRESSION, SUICIDE AND THE RISE OF SOCIAL MEDIA USE IN HISPANIC COMMUNITIES

be attributed to issues such as the unprecedented stress caused by social isolation, financial hardship, food scarcity and/or the death of a loved one.
For Hispanics, the effects of the COVID-19 pandemic were even more extensive because this already vulnerable population is more susceptible to illness and poor health due to increased stress levels, according to a May 2021 article published online in Health Equity . In a 2021 CDC report, it was found that Hispanic adults reported higher levels of stress and worry about having basic needs such as food and stable housing during the COVID-19 pandemic compared to white adults. Additionally, the CDC said that the pandemic worsened existing social and economic inequalities, making it harder for Hispanics to access necessary resources and support due to language barriers and culturally appropriate care.
SUICIDE IS THE 11TH LEADING CAUSE OF DEATH IN THE U.S.
Number of Americans who died by suicide
Estimated number of suicide attempts
The age-adjusted suicide rate
Percentage of suicide deaths by white males
Percentage of suicide deaths attributed to firearms

If you or someone you know is struggling with depression or may be contemplating suicide, don’t wait until it is too late to reach out for help.
This national network of local crisis centers offers free and confidential emotional support to people in suicidal crisis or emotional distress 24 hours a day, 7 days a week. The 988 Lifeline offers Spanish call, text and chat services. To connect with a Spanish-speaking counselor, when you text 988, you will be asked to type “Ayuda.” 988lifeline.org
CRISIS SUPPORT IN ARIZONA La Frontera Arizona/EMPACT Suicide Prevention Center
618 S. Madison Dr., Tempe lafronteraaz-empact.org
24/7 CRISIS HOTLINE
480.784.1500
800.273.8255 toll free
Most of the research on social media use points to one alarming fact: Too much social media use is negatively affecting the mental health of adolescents in the United States. Over the past two decades, the rates of depression and suicide have increased, coinciding with the rise of social media usage, according to a February 2020 article in the InternationalReviewofPsychiatry.
However, the relationship of social media to depression and anxiety is paradoxical: There is extensive research on both sides. Social media use can both increase feelings of loneliness and decrease those feelings. In recent times, it also has unfortunately played a significant role in spreading both information and misinformation, causing users to experience increased feelings of anxiety and depression from constant exposure to distressing news and uncertainty.
In 2020, the most popular app among Hispanics was Facebook, with 59.7% of users; as of 2022, the frequency of Hispanics using social media as a daily source of news in the United States is 44%, according to Amy Watson (2024) and Tiago Bianchi (2023). Watson reported that U.S. adults demonstrated that, from 2019 to 2022, Facebook was the most popular social media platform for news. This suggests that Hispanic communities' constant use of social media at higher rates may contribute to their increased feelings of anxiety and depression compared to other racial/ethnic groups.
For Hispanics and other vulnerable communities, increased screen time can be linked to higher levels of anxiety and depression, especially among youth. A 2023 Pew Research Center survey found that about 1 in 3 Hispanic teens are “almost constantly” on social media platforms such as TikTok, YouTube, Snapchat and Instagram. Overall, Hispanic youth use social media at a higher rate: 55% compared to 38% for white teens.
Despite its link to significant adverse effects, social media can also provide a platform for social support and community building. This paradox demonstrates that as the use of social media continues to rise, so do the possibilities of using it to promote connectedness
DEPRESSION, SUICIDE AND THE RISE OF SOCIAL MEDIA USE IN HISPANIC COMMUNITIES
rather than isolation. During the lockdowns and isolation forced by the pandemic, many people used social media to stay connected with friends and family, providing a virtual emotional support platform.
Post-pandemic, the use of social media has shifted drastically, demonstrating the changes in social dynamics that occurred during the pandemic in terms of how people now work, connect and live. Even though the world has moved past the global pandemic, the rates of depression and suicide remain a significant public health problem.
In these times, when we are simultaneously so connected yet so disconnected, it is time to reach out to one another beyond the typical “How are you?” We now must ask ourselves and others this critical question: How do I (you) really feel? Then, be prepared to hear the good, the bad and everything in between. Most importantly, we must support our families and friends by giving advice, being a shoulder to cry on or simply listening.
Daniela Chavira is a writer/journalist intern at the Arizona Hispanic ChamberofCommerce (AZHCC) in Phoenix.

From the Todayshow online
Parents are primed for a smartphone ‘revolt,’ says this expert
From the National Library of Medicine
Suicide risk factors for young adults: testing a model across ethnicities
Deconstructing Cultural Aspects of Mental Health Care in Hispanic/Latinx People
From CurrentOpinioninPsychology
Suicide among Hispanics in the United States
From Statista
Most popular internet sites and apps among Hispanic internet users in the United States as of May 2020, by reach
BY DANIELA CHAVIRA
The Mexican consulate network in Arizona plays a significant role in fostering strong relations between Mexico and the United States. Its five locations—in Phoenix (Consulate General) plus four branches in Douglas, Nogales, Tucson and Yuma—serve as a bridge that provides many resources and services for communities on both sides of the border. Those services and resources include community outreach programs such as informational sessions on finances, medical services, education and upcoming elections.
Jorge Mendoza Yescas, Consul General of Mexico in Phoenix, was appointed on March 5, 2019, by Mexico’s then-President Andrés Manuel López Obrador. Mendoza Yescas most recently served as Consul for Legal Affairs and Documentation at the Consulate General of Mexico in Vancouver, B.C., Canada, from 2015 to 2019. As Consul General of Mexico in Phoenix, Mendoza Yescas says his role is to coordinate with the other Mexican consulates throughout the state to serve the Mexican and Mexican-American communities.
This year, he was named 2024 Advocate of the Year by the Arizona Hispanic Chamber of Commerce (AZHCC). Although he is honored to receive this award, he emphasizes that he does not do this important job alone. During the five years Mendoza Yescas has been in Phoenix, the work being done was always a team effort that created strong relationships with local elected officials and collaborated with community organizations and their leaders.
Under Mendoza Yescas’s leadership, the local Mexican consulate network focuses on three tasks: documentation, protection and community outreach. Even though all the consulates provide basically the same services, Mendoza says that the programs and services have different impacts on the five communities served because of their locations.
Consul Mendoza Yescas’s tenure was marked by two significant achievements: the reinstatement of the Consular Identification
COLLABORATION IS
Card (Matrícula Consular) in Arizona and the launch of the Consular Entrepreneurship Program.
After a 10-year hiatus, Arizona once again recognized the Matrícula Consular as a valid ID in 2021. This restored cardholders' access to essential services like health care, banking, education and government assistance. Mendoza played a pivotal role in this process, collaborating with state officials and community leaders to emphasize the card’s benefits and security features.
The Consular Entrepreneurship Program, developed in partnership with the Arizona Hispanic Chamber of Commerce and Thunderbird School of Global Management, has empowered over 150 women in northern and central Arizona. Its success led to its worldwide adoption by the Mexican Secretariat of Foreign Affairs, equipping graduates with the tools to launch and expand thriving businesses.
Mendoza Yescas emphasizes that the most significant role of the Mexican consulate is cultivating ongoing relationships
with political authorities such as Gov. Katie Hobbs, Phoenix Mayor Kate Gallego and other elected state officials. Fostering these relationships, he says, ensures that the needs of Mexican communities on both sides of the border are met.
Daniela Chavira is a writer/journalist intern for the Arizona Hispanic ChamberofCommerce (AZHCC) in Phoenix.
Consulate General of Mexico
320 E. McDowell Rd., #105 Phoenix, AZ 85004
602.242.7398 conphoenix@sre.gob.mx consulmex.sre.gob.mx/phoenix/
CONSULATES OF MEXICO IN ARIZONA Nogales
135 W. Cardwell St. Nogales, AZ 85621 informacionnog@sre.gob.mx
Tucson
3915 E. Broadway Blvd. Tucson, AZ 85711 contucmx@sre.gob.mx
Yuma
298 S. Main St. Yuma, AZ 85364 conyuma@sre.gob.mx
Douglas
1324 G. Ave. Douglas, AZ 85607
condouglas@sre.gob.mx douglas@sre.gob.mx

National Latino Family Report 2024: Strength, Resilience, and Aspiration
A comprehensive study of the economic and social issues impacting Latino families with children prenatal through five years old.

nationalsurvey.ap-od.org/2024-report/
This report presents an overview of the Latino community amidst economic challenges and a dynamic socio-political landscape. Abriendo Puertas/Opening Doors, in partnership with UnidosUS and BSP Research, surveyed and interviewed 1,500 Latino families with young children (prenatal through five years old) across the United States to understand the key issues, concerns, and aspirations that shape their daily lives and their vision for the future.
Latino families demonstrate remarkable resilience, resourcefulness, and a strong commitment to community, despite facing hardships like rising living costs and barriers to economic advancement.
The Pew Research Center reports that Latino eligible voters have increased by 4.7 million since 2018, representing 62% of the total growth in U.S. eligible voters.
As a significant and powerful voter base, representing around 34 million eligible voters in the 2024 election, it is crucial for institutions and policymakers to consider their voices,2 learn about their proposed solutions, and actively engage them in the legislative process.


As Americans entered 2023, predictions were dire for the economy, with rising interest rates and spiking inflation. However, over the course of the year, the U.S. saw increased economic output, improved consumer spending, and a reinvigorated job market. The Department of the Treasury reported the U.S. economy grew at a rate of 5.7% in 2023—the highest growth rate since 1984.3
However, Latino families with young children felt the impact of economic fluctuations on their daily lives. With the cost of living (also known as consumer price index) increasing 3.1% since 2022,4 our survey found the top concerns for Latino families are the rising cost of living and inflation and the need for improved wages and income.
Latino families remain persistent in their quest for financial stability. Respondents not only seek immediate financial relief but advocate for permanent changes that lead to sustainable economic growth, improved health outcomes, and better educational opportunities for their community.


7/15/24, 5:56 PM Treasury
October 12, 2023
Nearly 25% ofnew entrepreneurs in 2021 were Latino, the typical Latino employer saw 25% increase in revenues over the pandemic and recovery
WASHINGTON – Today, in recognition of Hispanic Heritage Month, the U.S. Department of the Treasur y released a report card showing that Latino business ownership and revenues in the U.S. are up, and detailing how federal investments – including those from President Bidenʼs American Rescue Plan – are growing and sustaining Latino-owned businesses
According to a report released last month by the Stanford Latino Entrepreneurship Initiative (SLEI), the U.S. is currently home to more than 62.5 million Latinos, representing 19% of the U.S. population. With an economic output of $2.8 trillion, there are approximately 5 million Latinoowned businesses across the U.S., generating more than $800 billion in annual revenue.
However, the COVID-19 pandemic caused disproportionate harm to Latino businesses and communities At the height of the pandemic, Latinos were more likely to lose their jobs, more likely to work in front-line positions that increased their risk of exposure, and had among the highest mortality rates. Latino unemployment peaked at nearly 19 percent in 2020.
In addressing a post-pandemic recover y, the Biden-Harris Administration took significant steps to build a fairer economy. While there is more work to do, these e�orts have led to the most equitable, broad-based economic recover y in modern histor y.
Beginning in 2020, there has been a lasting surge in business applications and startups Average monthly business applications were 50% higher in 2021-2023 than in 2018-2019, and nearly 25% of all new entrepreneurs in 2021 were Latino. There is evidence that the rise in business applications has resulted in a greater percentage of Latino and Black businessowners, given
Source: U.S. Department of the Treasury, “Treasury Department Report Card: Latino Business Ownership Up, Pandemic Recovery Efforts Helped Grow Latino-owned Businesses,” October 12, 2023 home.treasury.gov/news/press-releases/jy1798
that areas with a higher proportion of Latino and Black residents saw relatively larger increases in application rates in 2020.
Over the pandemic and recover y (2019-2022), the median growth rate in revenues was 25% for Latino employers. From 2019 to 2022, median weekly earnings increased 2.4% for Latino workers a�er accounting for inflation. At the same time, Latino unemployment hit a record low last September.
According to Treasur y Department calculations based on monthly Current Population Sur vey data, the number of self-employed workers that were Latino or Black has grown significantly since 2019. The growth in Latino and Black Americans working for themselves far exceeds what has happened in previous economic recoveries.
From 2019 to 2023, there was a 26% increase in the number of self-employed Latino workers in the United States.
The share of Latino workers that are self-employed increased from 8.9% in the first 8 months of 2019 to 10.2% in the first 8 months of 2023. In contrast, in the four years following the start of the Great Recession, the number of selfemployed Latino workers fell, and rose only slightly for Black workers
Americans – including Latino entrepreneurs – filed nearly 10.5 million applications to start new businesses in 2021 and 2022, the two highest years on record for new business formation. To sustain small business growth, record demand was met with new federal resources. For instance, in 2022, according to the aforementioned SLEI report, Latino-owned businesses were 50% more likely to request funding and financing than white-owned businesses, with plans to
7/15/24, 5:56 PM
use the funds to expand their businesses, acquire additional capital assets, and meet operating expenses. The Treasur y Department has taken a leading role in implementing programs and initiatives meant to support small businesses across all communities.
The nearly $10 billion State Small Business Credit Initiative (SSBCI) – reauthorized and expanded by the American Rescue Plan – includes $2 5 billion in funding and incentive allocations to support the provision of capital to underser ved businesses – with $1 billion of these funds to be awarded to jurisdictions that are successful in reaching underser ved businesses.
Through the Emergency Capital Investment Program (ECIP), the Treasur y Department has invested $1.6 billion in Latino-designated minority depositor y institutions. In total, ECIP participant institutions received more than $8 5 billion in Treasur y ECIP investments that may enable them to collectively increase lending in Latino communities by over $50 billion over the next decade.
The Treasur y Department prioritized equity in its spending guidelines for the American Rescue Planʼs State and Local Fiscal Recover y Fund (SLFRF) – the largest-ever infusion of direct pay to state, local, and Tribal governments. To address both the disproportionate impacts of the pandemic and historic underinvestment that le� some communities more vulnerable, the Department provided a broad menu of ser vices to enhance health, housing, employment, and economic equity in low-income and high poverty communities.
To boost workers and small businesses across the Island, the American Rescue Plan significantly expanded Puerto Ricoʼs version of the Earned Income Tax Credit (EITC), quadrupling benefits for workers through the first federal enhancement to Puerto Ricoʼs EITC since the credit was established nearly 50 years ago.
Procurement with government agencies plays an important role for many minority-owned businesses. At the Treasur y Department, there has been a 23% increase in the dollar amount of prime contracts awarded to Latino-owned businesses since FY 2020. The Department has also designated two minority-owned financial institutions as financial agents of the government
The Latino Connection (TLC), based in Harrisburg, Pennsylvania, is a consultancy focused primarily on outreach and education initiatives to support underser ved communities, with a mission to educate, empower, and upli� the Latino community. This year, the company hit
7/15/24, 5:56 PM
a growth milestone when it acquired another firm – a merger that will allow TLC to add marketing and communications business lines to its roster of ser vices. However, this meant the company needed a new space in order to better ser ve clients and attract new customers. Struggling to receive a loan from a traditional bank, TLC turned to Capital Region Economic Development Corp. (CREDC), a nonprofit community economic development organization participating in the Pennsylvania Department of Community and Economic Developmentʼs State Small Business Credit Initiative (SSBCI) loan participation program. Using federal SSBCI funds leveraged by private credit issued to purchase the real estate, CREDC was able to design a credit-enhanced deal of $250,000 to support renovation and fit out of the space, the hub of the growing TLC. Melissa Stone, Vice President of Economic Development with CREDC, noted the important role that the SSBCI dollars played in this transaction, and in others: “SSBCI helps us to ʻtickʼ the credit boxes on transactions that we really want to do, and otherwise, wouldnʼt be able to close.”
Washington, D.C. invested nearly $40 million of its SLFRF funds in DCʼs Bridge Fund 2.0, which made investments in small businesses in the community, including a $75,000 grant to Peruvian Brothers. Founded by Mario and Giuseppe Lanzone, two brothers who grew up in Peruʼs coastal La Punta district, Peruvian Brothers focuses on dishes that the brothers miss most from their childhood. The business started as a food truck, joining the cityʼs thennascent food truck scene It has since expanded into three food trucks, a catering operation, and a food stall location in the Latin American market called La Cosecha which features cooking talent from many South American countries.
The A sian Financial Corporation, based in Philadelphia, Pennsylvania, is a recipient of the Treasur y Departmentʼs Emergency Capital Investment Program funding, and created and o�ered a new loan product and financial ser vice, titled Small Business Booster Loans (SSBL), to underser ved business owners either as a term loan or line of credit. Examples of loans granted over the course of the pandemic recover y include:
In October 2022, the SSBL Program made a $50,000 loan to a Latino-owned cleaning ser vice to purchase additional equipment and so�ware, allowing the owners to run a more e�icient business.
In June 2023, the SSBL Program made a $30,000 working capital loan to a Latino-owned truck repair business, allowing the owners to replace higher priced debt with bank debt and fund the purchase of new equipment.
In September 2023, the SSBL Program made a $100,000 to a Latino-owned restaurant to replace aging kitchen equipment.

Shannon Schumacher (https://www.k .org /person/shannon-schumacher/),
Liz Hamel (https://www.k .org /person/liz-hamel/),
Samantha Artiga (https://www.k .org /person/samantha-artiga/),
Drishti Pillai (https://www.k .org /person/drishti-pillai/),
Ashley Kirzinger (https://www.k .org /person/ashley-kirzinger/),
Audrey Kearney (https://www.k .org /person/audrey-kearney/),
Marley Presiado (https://www.k .org /person/marley-presiado/), Ana Gonzalez-Barrera, and
Mollyann Brodie (https://www.k .org /person/mollyann-brodie/)
Published: Sep 17, 2023
FINDINGS
Executive Summary
The Sur vey of Immigrants, conducted by KFF in partnership with the Los Angeles Times during Spring 2023, examines the diversity of the U S immigrant experience It is the largest and most representative sur vey of immigrants living in the U S to date With its sample size of 3,358 immigrant adults, the sur vey provides a deep understanding of immigrant experiences, reflecting their varied countries of origin and histories, citizenship and immigration statuses, racial and ethnic identities, and social and economic circumstances. KFF also conducted focus groups with immigrants from an array of backgrounds, which
https://www kff org/report-section/understanding-the-u-s-immigrant-experience-the-2023-kff-la-times-survey-of-immigrants-findings/ 1/44
Source: KFF, “Understanding the U.S. Immigrant Experience: The 2023 KFF/LA Times Survey of Immigrants”, Shannon Schumacher etal.,September 17, 2023 www.kff.org/report-section/understanding-the-u-s-immigrant-experience-the-2023-kff-la-times-survey-of-immigrants-findings/
7/15/24, 5:50 PM
This report provides an over view of immigrantsʼ reasons for coming to the U S ; their successes and challenges; their experiences at work, in their communities, in health care settings, and at home; as well as their outlook on the future. Recognizing the diversity within the immigrant population, the report examines variations in the experiences of di�erent groups of immigrants, including by immigration status, income, race and ethnicity, English proficiency, and other factors. Given that this report includes a focus on experiences with discrimination and unfair treatment, data by race and ethnicity are o�en shown rather than by countr y of birth A companion report (https://www k� org /racial-equity-and-health-policy/issuebrief/health-and-health-care-experiences-of-immigrants-the-2023-k�-la-times-survey-of-immigrants) provides information on immigrantsʼ health coverage, access to, and use of care, and further reports will provide additional details for other subgroups within the immigrant population, including more data by countr y of origin.
Key takeaways from this report include:
•
• • expand upon information from the sur vey (see Methodology (https://www k� org /reportsection/understanding-the-u-s-immigrant-experience-the-2023-k�-la-times-survey-of-immigrantsmethodology) for more details).
Most immigrants – regardless of where they came from or how long they ve been in the U.S. – say they came to the U.S. for more opportunities for themselves and their children. The predominant reasons immigrants say they came to the U.S. are for better work and educational opportunities, a better future for their children, and more rights and freedoms. Smaller but still sizeable shares cite other factors such as joining family members or escaping unsafe or violent conditions.
Overall, a majority of immigrants say their financial situation (78%), educational opportunities (79%), employment situation (75%), and safety (65%) are better as a result of moving to the U.S. A large majority (77%) say their own standard of living is better than that of their parents, higher than the share of U.S.-born adults who say the same (51%) (https://www k� org /racial-equity-and-health-policy/poll-finding /k�-la-times-survey-ofimmigrants/view/footnotes/#footnote-598508-1),and most (60%) believe their childrenʼs standard of living will be better than theirs is now. Three in four immigrants say they would choose to come to the U.S. again if given the chance, and six in ten say they plan to stay in the U S However, about one in five (19%) say they want to move back to the countr y they were born in or to another countr y, while an additional one in five (21%) say they are not sure
Despite an improved situation relative to their countries of birth, many immigrants report facing serious challenges, including high levels of workplace and other discrimination, di iculties making ends meet, and confusion and fears related to U.S. immigration laws and policies. These challenges are more pronounced among some groups of immigrants, including those who live in lower-income households, Black and Hispanic immigrants, those who are likely undocumented, and those with limited English proficiency Given the intersectional nature of these factors, some immigrants face compounding challenges across them. 1
https://www kff org/report-section/understanding-the-u-s-immigrant-experience-the-2023-kff-la-times-survey-of-immigrants-findings/ 2/44
7/15/24, 5:50
•
•
About a third (34%) of immigrants say they have been criticized or insulted for speaking a language other than English since moving to the U.S., and a similar share (33%) say they have been told they should “go back to where you came from.” About four in ten (38%) immigrants say they have ever received worse treatment than people born in the U S in a store or restaurant, in interactions with the police, or when buying or renting a home. Some immigrants also report being treated unfairly in health care settings Among immigrants who have received health care in the U S , one in four say they have been treated di�erently or unfairly by a doctor or other health care provider because of their racial or ethnic background, their accent or how well they speak English, or their insurance status or ability to pay for care.
•
•
Immigrants who are Black or Hispanic report disproportionate levels of discrimination at work, in their communities, and in health care settings. Over half of employed Black (56%) and Hispanic (55%) immigrants say they have faced discrimination at work, and roughly half of college-educated Black (53%) and Hispanic (46%) immigrant workers say they are overqualified for their jobs. Nearly four in ten (38%) Black immigrants say they have been treated unfairly by the police and more than four in ten (45%) say they have been told to “go back to where you came from.” In addition, nearly four in ten (38%) Black immigrants say they have been treated di�erently or unfairly by a health care provider Among Hispanic immigrants, four in ten (42%) say they have been criticized or insulted for speaking a language other than English.
Even with high levels of employment, one third of immigrants report problems a ording basic needs like food, housing, and health care. This share rises to four in ten among parents and about half of immigrants living in lower income households (those with annual incomes under $40,000). In addition, one in four lower income immigrants say they have di�iculty paying their bills each month, while an additional 47% say they are “just able to pay their bills each month.”
• Most immigrants are employed, and about half of all working immigrants say they have experienced discrimination in the workplace, such as being given less pay or fewer opportunities for advancement than people born in the U.S., not being paid for all their hours worked, or being threatened or harassed. In addition, about a quarter of all immigrants, rising to three in ten of those with college degrees, say they are overqualified for their jobs, a potential indication that they had to take a step back in their careers when coming to the U.S. or lacked career advancement opportunities in the U.S.
Among likely undocumented immigrants, seven in ten say they worry they or a family member may be detained or deported, and four in ten say they have avoided things such as talking to the police, applying for a job, or traveling because they didn t want to draw attention to their or a family member s immigration status However, these concerns are not limited to those who are likely undocumented. Among all immigrants regardless of their own immigration status, nearly half (45%) say they donʼt have enough information to understand how U.S. immigration laws a�ect them and their families, and one in four (26%) say they worr y they or a family member could be detained or deported. Confusion and lack of information extend to public charge rules. About three quarters of all immigrants, rising to nine in ten among likely undocumented immigrants, say they are not sure whether use of public assistance for food, housing, or health care can a�ect an immigrantʼs ability to get a green card or incorrectly believe that use of this assistance will negatively a�ect the ability to get a green card.
https://www kff org/report-section/understanding-the-u-s-immigrant-experience-the-2023-kff-la-times-survey-of-immigrants-findings/ 3/44
• About half of all immigrants have limited English proficiency, and about half among this group say they have faced language barriers in a variety of settings and interactions. About half (53%) of immigrants with limited English proficiency say that di�iculty speaking or understanding English has ever made it hard for them to do at least one of the following: get health care ser vices (31%); receive ser vices in stores or restaurants (30%); get or keep a job (29%); apply for government financial help with food, housing, or health coverage (25%); report a crime or get help from the police (22%). In addition, one-quarter of parents with limited English proficiency say they have had di�iculty communicating with their childrenʼs school (24%). Working immigrants with limited English proficiency also are more likely to report workplace discrimination compared to those who speak English ver y well (55% vs. 41%).
https://www kff org/report-section/understanding-the-u-s-immigrant-experience-the-2023-kff-la-times-survey-of-immigrants-findings/ 4/44


• HISPANICS PARTICIPATE IN THE LABOR FORCE AT THE SECOND HIGHEST RATE IN THE U.S.
• U.S. HISPANICS OVERINDEX IN SERVICE, NATURAL RESOURCES, CONSTRUCTION AND MAINTENANCE OCCUPATIONS
• U.S. HISPANICS OVERINDEX IN AGRICULTURE, CONSTRUCTION, TRADE AND HOSPITALITY INDUSTRIES
• BLACK OR AFRICAN AMERICANS, AMERICAN INDIAN AND ALASKA NATIVES AND MULTIRACIAL AMERICANS CONSISTENTLY HAVE THE HIGHEST RATES OF UNEMPLOYMENT
• HISPANICS HAVE THE LOWEST MEDIAN WEEKLY EARNINGS IN EVERY MAJOR OCCUPATIONAL GROUP EXCEPT MANAGEMENT/ PROFESSIONAL
• COMPARED TO THE TOTAL POPULATION, LATINOS IN THE U.S. MAKE LESS IN ALL MAJOR OCCUPATIONS
• HISPANIC AND BLACK HOUSEHOLDS IN THE U.S. ARE DISPROPORTIONALLY IN THE LOWEST WEALTH TIER
• IN THE PAST DECADE WEALTH IN HISPANIC HOUSEHOLDS HAS MORE THAN TRIPLED
• HOMEOWNERSHIP IS A MAJOR SOURCE OF WEALTH FOR LATINOS IN THE U.S.
• ALTHOUGH THE GAP HAS NARROWED SIGNIFICANTLY, FOR EVERY DOLLAR HISPANICS MADE IN 2022, WHITES MADE $4.47
• U.S. HISPANIC OWNERSHIP STATISTICS (2019)
• WHITE-OWNED U.S. BUSINESSES EXPERIENCED A SUBSTANTIAL DECREASE IN FINANCING NEED COMPARED TO LATINOOWNED U.S. BUSINESSES
• OVER A TWO-YEAR PERIOD, U.S. LATINOOWNED BUSINESSES HAVE DIVERSIFIED THEIR CUSTOMER BASES
• LATINO-OWNED BUSINESSES RECEIVE SIGNIFICANTLY SMALLER STATE GOVERNMENT, FEDERAL GOVERNMENT AND CORPORATE CONTRACTS COMPARED TO WHITE-OWNED BUSINESSES IN THE U.S.
• WHITE-OWNED BUSINESSES HAD HIGHER APPROVAL RATES THAN HISPANIC-OWNED
BUSINESSES FOR LOAN SIZES GREATER THAN $50K IN THE U.S.
• BLACK AND HISPANIC ADULTS IN THE U.S. EXPERIENCED HIGHER CREDIT DENIAL RATES ACROSS ALL INCOME LEVELS
• A LARGER PERCENTAGE OF BLACK AND HISPANIC CONSUMERS RELY ON PAYMENT DEFERRALS
• A LARGER PERCENTAGE OF BLACKS AND HISPANICS CARRY A CREDIT CARD BALANCE DESPITE LOWER OWNERSHIP RATES
• AMERICAN CREDIT CARD DEBT HAS SURPASSED THE $1 TRILLION MARK, INCREASING BY MORE THAN 70 PERCENT IN THE PAST DECADE
• OVER THE PAST DECADE. MEXICO HAS REMAINED AS ARIZONA’S TOP IMPORT PARTNER WHILE TAIWAN HAS RECENTLY JOINED THE TOP 5
• MEXICO AND CANADA REMAINED ARIZONA’S TOP EXPORT PARTNERS BETWEEN 2013 AND 2023 AS THE NETHERLANDS JUMPED IN AND JAPAN DROPPED OFF
• COMPUTER/ELECTRONIC PRODUCTS REMAINED ARIZONA’S TOP IMPORTS WHILE ELECTRICAL EQUIPMENT, APPLIANCES & COMPONENTS JUMPED INTO THIRD PLACE IN 2023
• ARIZONA’S TOP 5 EXPORTS HAVE REMAINED THE SAME IN THE PAST 10 YEARS
Univision Communications presents a comprehensive look at the financial picture for Hispanics in the Phoenix and Tucson markets, from the top financial institutions, a portrait of Hispanic small business owners, specifically Latinas, to the employment picture and spending habits
CULTURE OF COMMUNITY
The Rise of Latina Entrepreneurs
Meet just three of the powerful Latinas in Arizona who are creating jobs and fostering economic growth BY DANIELA
CHAVIRA
Two hard-working women with a very big dream built this powerhouse boutique executive search firm BY JEAN SOLIVA
Innovative Credit Union Supports the Community by Offering Help with All Types of Financial Issues
Landings Credit Union focuses on serving underserved and underbanked groups BY CECILIA ESTRADA ASHE
EXCERPT
The latest report from The National Association of Hispanic Real Estate Professionals (NAREP) says that Hispanic household wealth has grown more rapidly than any other demographic group
EXCERPT
The Latino Entrepreneurship Initiative at the Stanford Graduate School of Business has found that the Latino/a community is a prominent consumer base and a growing force in economic development
EXCERPT
In the 6th annual edition of this report from the Latino Donor Collaborative, researchers found that U.S. Latinos generate a staggering $3.2 trillion in GDP, positioning them as the fifth-largest economy in the world, ahead of countries like the United Kingdom and India
EXCERPT
Results from the 2023 Survey of Household Economics and Decisionmaking (SHED) indicate that people’s overall financial well-being was nearly unchanged from the previous year but below the high reached in 2021
U.S. HISPANICS OVER-INDEX IN SERVICE, NATURAL RESOURCES, CONSTRUCTION AND MAINTENANCE OCCUPATIONS
U.S. LABOR FORCE PARTICIPATION RATES BY RACE/ETHNICITY (2022 ANNUAL AVERAGES)
U.S. EMPLOYMENT BY OCCUPATION AND RACE/ETHNICITY (2022 ANNUAL AVERAGES)
U.S. EMPLOYMENT BY
(2022 ANNUAL AVERAGES)
Source: U.S. Bureau of Labor Statistics, "Labor force characteristics by race and ethnicity, 2022," Table 9, November 2023 www.bls.gov/opub/reports/race-and-ethnicity/2022/home.htm
U.S. UNEMPLOYMENT RATES BY RACE/ETHNICITY (2013—2022 ANNUAL AVERAGES)
• Unauthorized immigrants represent about 4.8% of the U.S. workforce in 2022 . This was below the peak of 5.4% in 2007.
• Since 2003, unauthorized immigrants have made up 4.4% to 5.4% of all U.S. workers , a relatively narrow range.
• Fewer than 1% of workers in Maine, Montana, Vermont and West Virginia in 2022 were unauthorized immigrants
• Nevada ( 9% ), Texas ( 8% ), Florida ( 8% ), New Jersey ( 7% ), California ( 7% ) and Maryland ( 7% ) had the highest shares of unauthorized immigrants in the workforce.
—Jeffrey S. Passel and Jens Manuel Krogstad, Pew Research Center, July 2024
HISPANIC AND BLACK HOUSEHOLDS IN THE U.S. ARE DISPROPORTIONATELY IN THE LOWEST WEALTH TIER
Source: Pew Research Center, “Wealth Surged in the Pandemic, but Debt Endures for Poorer Black and Hispanic Families,” Rakesh Kochhar and Mohamad
www.pewresearch.org/race-ethnicity/2023/12/04/wealth-gaps-across-racial-and-ethnic-groups/
IN 2019, HISPANIC BUSINESS OWNERS:
Owned 4,537,836 businesses with total sales of $619.8 billion. Employed 2,930,540 workers. Had an annual payroll of $108.4 billion. THE BUSINESSES COMPRISED: 346,836 employer firms with total sales of $463.3 billion. 4,191,000 non-employer firms with total sales of $156.5 billion.
U.S.
WHITE-OWNED BUSINESSES HAD HIGHER APPROVAL RATES THAN HISPANIC-OWNED BUSINESSES FOR LOAN SIZES GREATER THAN $50K IN THE U.S.
Source:
NOTE: Data for Asians in the Paid Late category is not applicable. A LARGER PERCENTAGE OF BLACKS AND HISPANICS CARRY A CREDIT CARD BALANCE DESPITE LOWER OWNERSHIP RATES A LARGER PERCENTAGE OF BLACK AND HISPANIC CONSUMERS RELY ON PAYMENT DEFERRALS
Source: Federal Reserve, “Economic Well-Being of U.S. Households in 2022,” May 2023 www.federalreserve.gov/publications/files/2022-report-economic-well-being-us-households-202305.pdf
Source: Federal Reserve, “Economic Well-Being of U.S. Households in 2022,” May 2023 www.federalreserve.gov/publications/files/2022-report-economic-well-being-us-households-202305.pdf
AND
AMOUNT OF CREDIT CARD DEBT HELD BY ALL AMERICANS (2013—2023) TRILLIONS OF DOLLARS (USD)
Source: USA Today, "Americans have more credit card debt than savings again in 2024. How much do they owe?" Sara Chernikoff, February 23, 2024 www.usatoday.com/story/money/2024/02/23/americans-credit-card-debt/72701610007/
OVER THE PAST DECADE, MEXICO HAS REMAINED AS ARIZONA’S TOP IMPORT PARTNER WHILE TAIWAN HAS RECENTLY JOINED THE TOP 5
*NOTE:


1 out of 5

Latinas


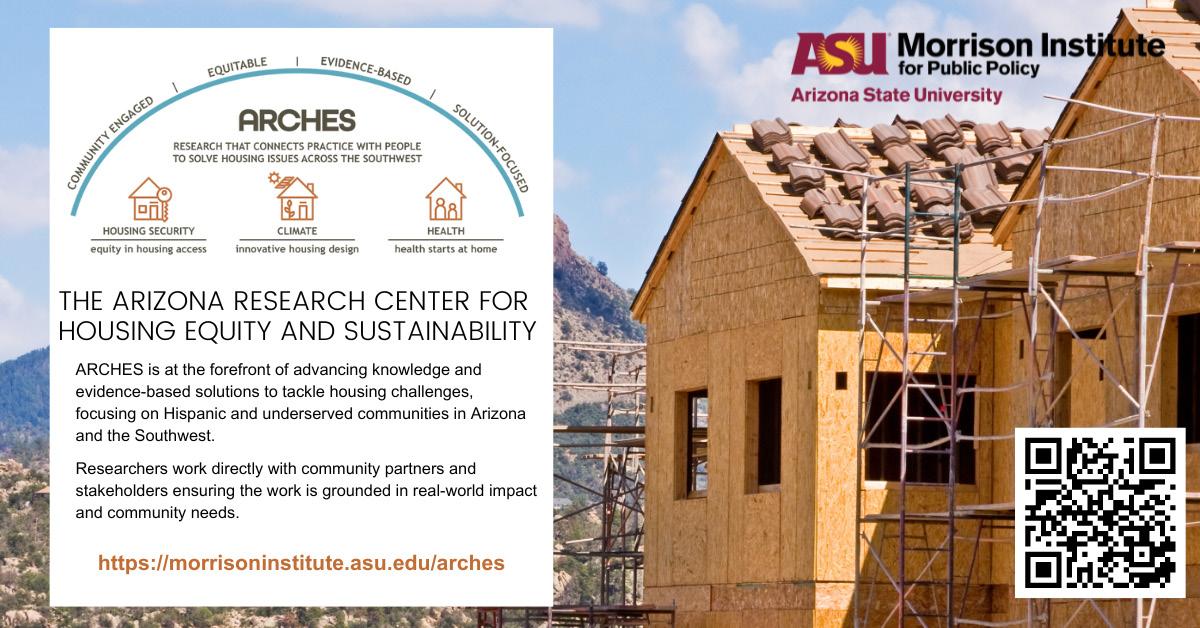
BY DANIELA CHAVIRA
Latina entrepreneurs are not just a force for economic development in the United States; they are the force. Latinas play an important role by creating jobs and fostering economic growth within their communities.
The ninth annual State of Latino Entrepreneurship report by the Stanford Latino Entrepreneurship Initiative (SLEI) found that Latina-owned businesses make up a significant portion of the U.S. economy: Latinas own 104,000 employer businesses, which is more than a quarter of all Latino/a-owned firms with employees. This year’s report focuses on three subgroups: women, techcentric firms and immigrants.
In Arizona, three prominent and rising Latina entrepreneurs— Priscilla Ornelas, Sonia Alejandra Saunders and Mariana Corona —are part of this powerful economic force in the U.S. economy.
Priscilla Ornelas, the CEO and founder of the nonprofit Community Comadres, exemplifies the resilience of Latina entrepreneurs. Her organization provides resources and community support to women in the Valley, helping them develop professionally and personally. When asked how she believes Latina entrepreneurs affect their local and national communities, she asked, “How don’t they?”
Ornelas believes that Latina entrepreneurs create an impact
Source: www2.claritas.com/Knowmore
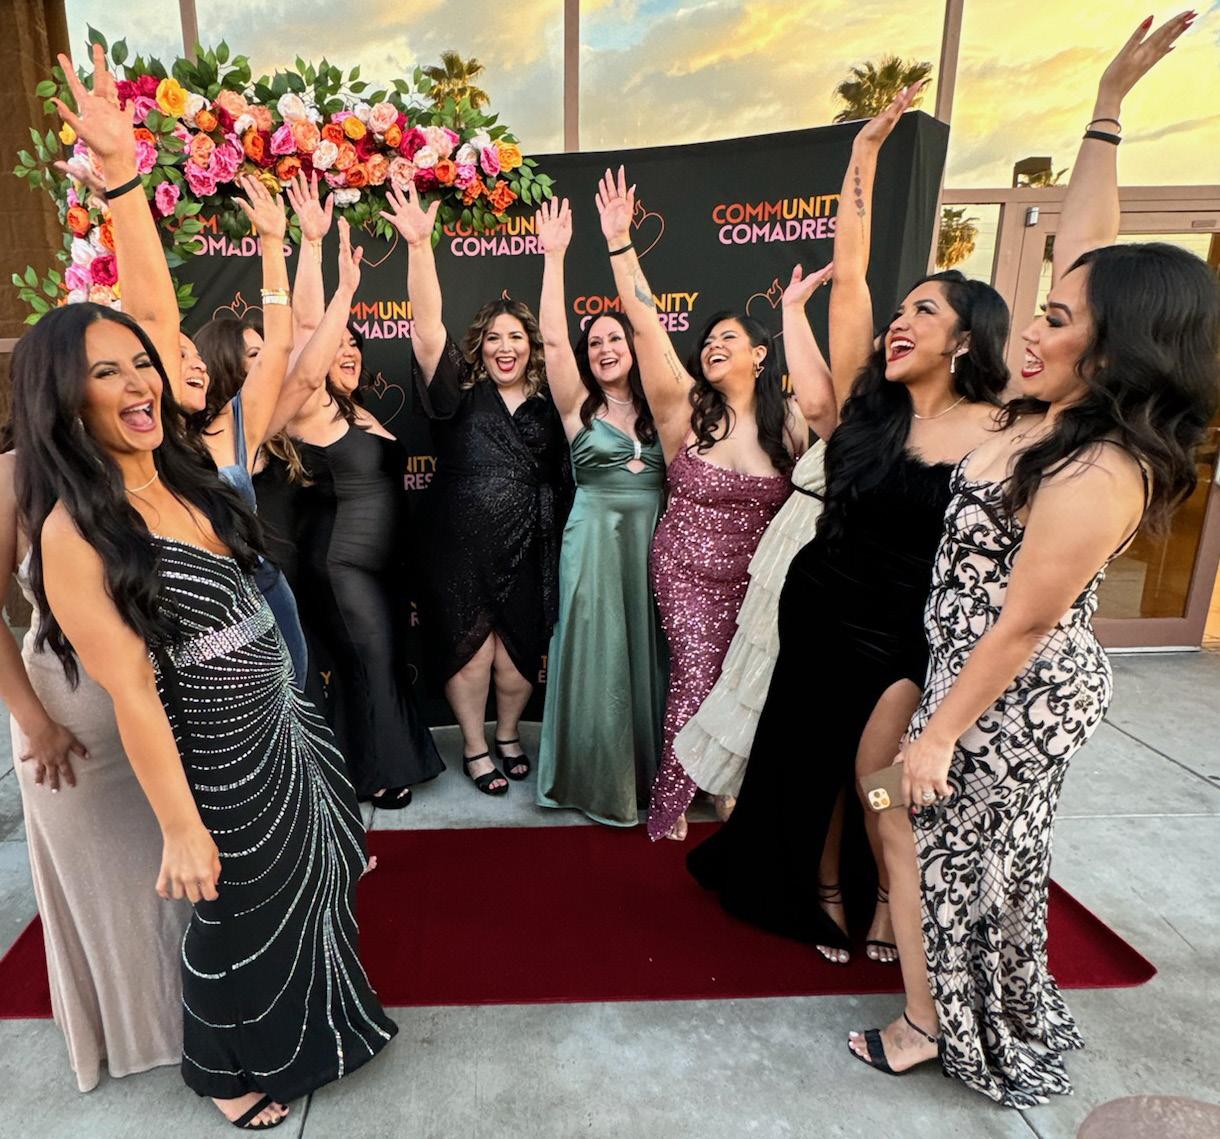
through intentional platforms built on deep cultural values. Even though she founded Community Comadres Ornelas says, she did not build the nonprofit on her own. Community Comadres was born through the many women who helped her when she first began her journey to the board of women who support her now.
Ornelas says that when creating Community Comadres, she wanted to cultivate a space where the community can grow alongside Community Comadres. She envisioned an organization that “serves the community while building community.”
As a dynamic Latina entrepreneur and the vibrant host of Mix 96.9 Ornelas is dedicated to empowering fellow Latina women to chase their dreams and explore diverse ventures. Reflecting on
her journey from a young girl with big doubts to a woman who now embraces those big roles Ornelas is on a mission to inspire others to do the same. Through Community Comadres, she passionately supports women in launching their businesses and organizations, fostering a thriving local economy and a rich culture of community.

Because Sonia Alejandra Saunders, CEO and founder of Mujerón Movement, also recognizes the importance of lifting up other Latinas, she created a movement to empower women to become the mujerónes of their dreams through community building and networking. For Saunders, the word mujerón did not always mean empowerment but instead meant uncertainty, doubt and rejection.
At 19-years-old, she dreamed about becoming a TV reporter. Although bittersweet, her experience with NuestraBellezaLatina, a Univision show in which women from the U.S. and Puerto Rico compete for first place in a beauty pageant, ignited a flame in her to pave the way for her own mujerón journey and the movement itself. Now, the word mujerónhas a far different meaning for her.
In 2018, she decided to enter NuestraBellezaLatinaagain, wearing a shirt with the word mujerón as a homage to her 19-year-old self. It was then that the movement began.
Trailblazing her way as an entrepreneur, she created a new purpose for herself and has helped other Latinas do the same. Through community building and uplifting other women on their journeys, Mujerón Movement has expanded tremendously; by the end of 2019, they had hosted 50+ events in 10 different cities nationwide.
In 2021, Saunders launched the Mujerón podcast and Mujerón University, a year-long leadership program tailored for modern Latinas. Beginning in 2022, Mujerón held its inaugural annual
Source: www2.claritas.com/Knowmore

event. This year, Mujerón will host its annual signature event on Oct. 5 in Chicago, where more than 100 women will attend. Through Mujerón University and Mujerón Movement, she has helped over 50 Latinas launch or grow their businesses and communities. Saunders believes this growth shows that providing Latinas the space to grow personally and career-wise through community building and support is a win for the economy and their local communities.

Mariana Corona is the owner of My Desert Boutique, a small business that sells jewelry and clothes inspired by Latina women and femininity. She is a rising Latina entrepreneur and a part of the Amor Collective based in Peoria, AZ.
As a first-generation Latina, she was inspired to break barriers within her family and become the first woman to start a business. Her business combines her passion for photography and fashion, both of which have been nurtured by her supportive family. Her boutique is more than just clothes and jewelry; it empowers women to feel confident in themselves and their femininity.
Corona believes the most rewarding part of her entrepreneurial journey is connecting with the community through pop-up events and hosting workshops to help other women who dream of owning small businesses. Committed to giving back to the community, she hopes to expand her business to a physical shop where she can provide a space for other Latina entrepreneurs. She also hopes to further her education in business to better serve her community. Her dedication to her personal and career growth and that of her community is another way Latina entrepreneurs can have a profound impact on their communities and the economy.
Daniela Chavira is a writer/journalist intern at the Arizona Hispanic ChamberofCommerce (AZHCC) in Phoenix.
Community Comadres Priscilla@communitycomadres.org communitycomadres.org
The Mujerón Movement mujeron.com
The Mujerón Podcast podcasts.apple.com/us/podcast/the-mujerón-podcast
OCT 5 2024
The Mujerón Movement 2024 Chicago mujeron.com/mujeronmovement2024 Adayofcommunity,empowermentandpurpose
My Desert Boutique Mariana@mydesertboutique.com mydesertboutique.com
The Amor Collective 9780 W. Northern Ave. Suite 1220 Peoria, AZ 85345 amorcollectiveaz.com/
HOURS MON-SUN 11 am–7 pm
Latinas Think Big latinasthinkbig.com
FromStanfordUniversity Report gives a richer picture of Latino entrepreneurs (April 30, 2024) news.stanford.edu/stories/2024/04/gender-generations-tech-give-richerpicture-latino-owned-entrepreneurs
The 2023 State of Latino Entrepreneurship (.pdf) gsb.stanford.edu/sites/default/files/publication/pdfs/state-latinoentrepreneurship-2023.pdf
From Inc. (Sept.5,2023)
7 Books by Latina Entrepreneurs to Add to Your Fall Reading List inc.com/alyssa-khan/7-books-by-latina-entrepreneurs-fall-reading-list.html
Thisboutiqueexecutivesearchfirmwasborn becausetwohard-workingwomenhadaverybigdream
BY JEAN SOLIVA
In August 2015, two longtime colleagues and friends decided to work together because of a shared passion for the executive recruitment industry and a dream to build a company that was their own.
Their dream became Performant Scout, a boutique executive search firm based in Phoenix. The search firm connects premier talent with mid- to executive-level positions across a variety of sectors throughout North America—from professional services, manufacturing, biotechnology and nonprofits to agribusiness, produce and the food and beverage industries.
Their mission was to identify and place "moving the needle" talent—individuals who drive significant, measurable results for a company. With more than 20 years of combined experience in executive search, the team they put together has weathered various market conditions, consistently delivering top-notch candidates to their clients. Performant Scout offers each client a customized solution to address their unique sourcing, recruiting, onboarding and retention challenges and coupled that approach

with strong market research, an extensive people network and a client-focused approach. The company excels in identifying talent that fits perfectly within each company's culture.
Fast-forward to 2024 and Performant Scout has entered a new chapter. Co-founder Stacey Rouse decided to retire and in May 2024, her business partner, Vanessa Garcia, successfully completed a buyout to become the sole owner of the firm. The move not only shows Garcia’s leadership and vision but also underscores her commitment to continuing the company's legacy of excellence with the support of her team members.
According to the results of a survey conducted among staffing and recruitment professionals, over 50 percent of the respondents indicated a talent shortage impact on the labor market as the main challenge for staffing firms in 2023.
—Statista Research Department, Feb. 29, 2024
Source: www2.claritas.com/Knowmore
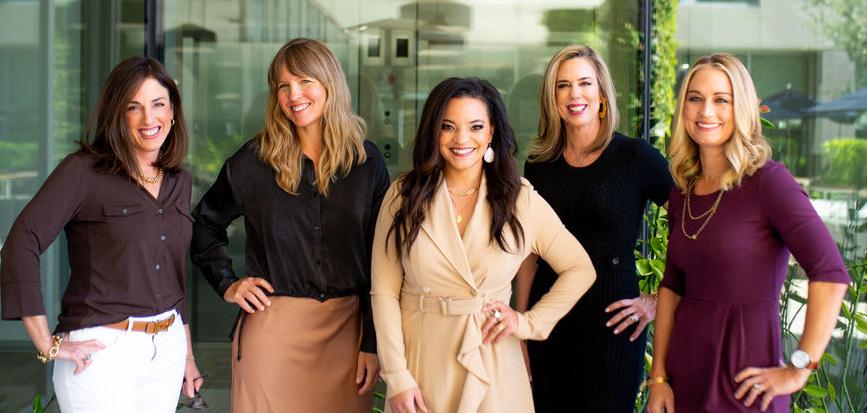
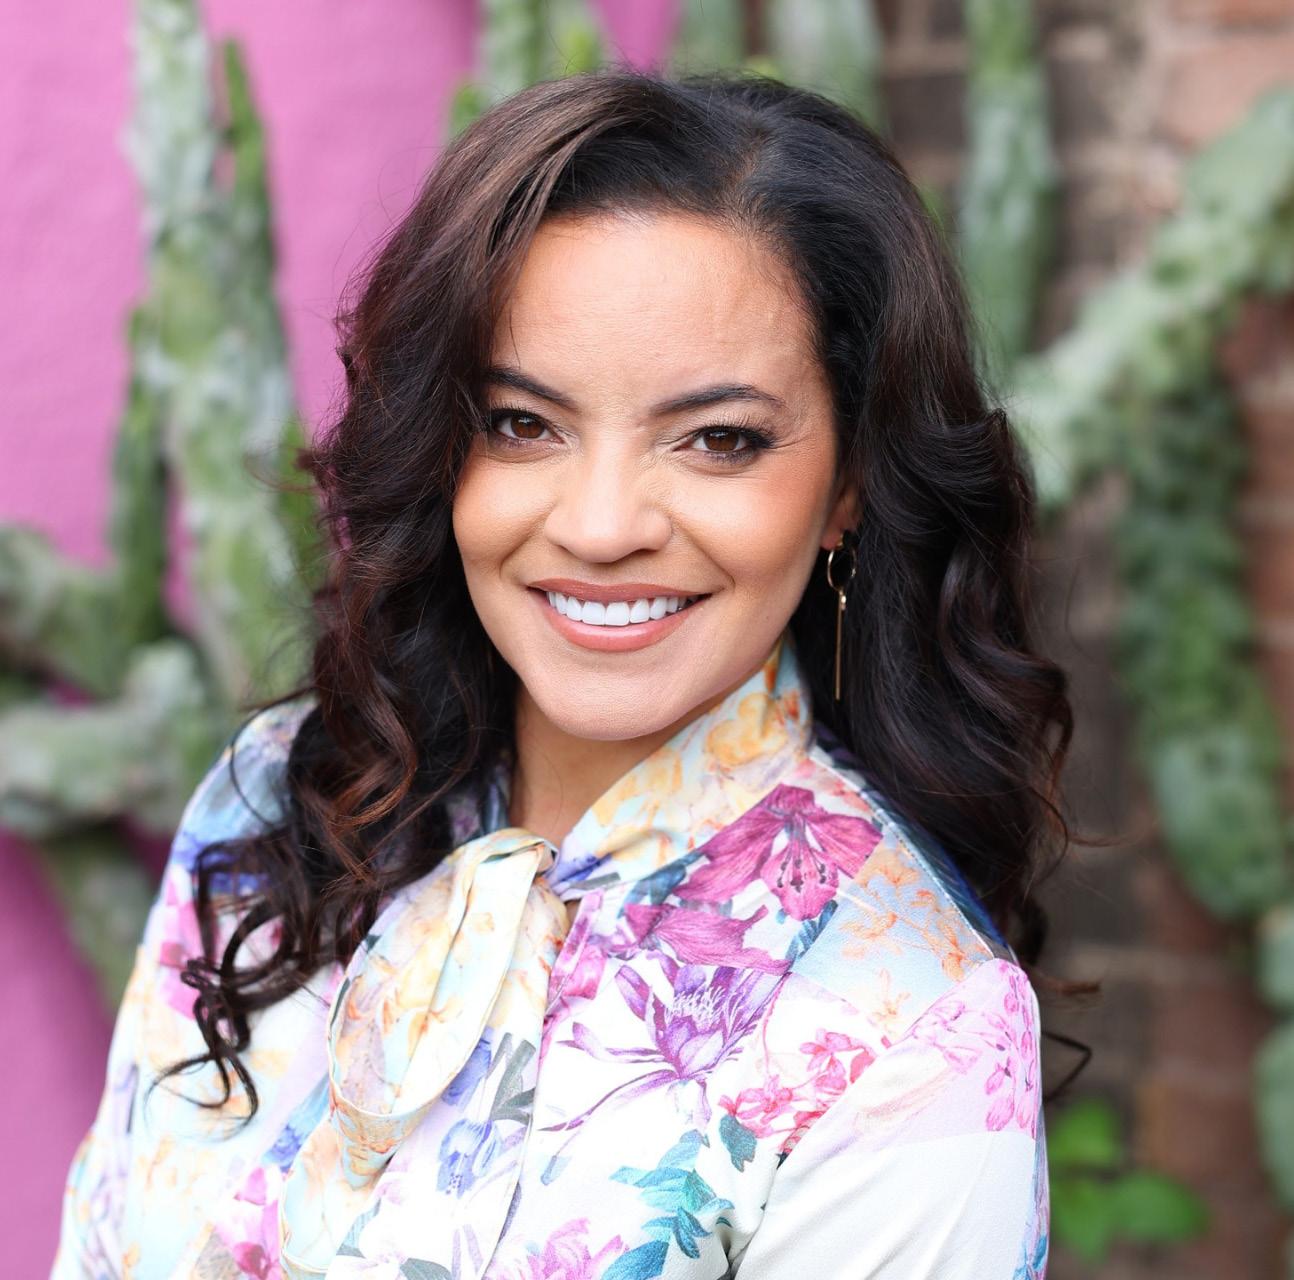
Vanessa Garcia, whose parents came to the United States from the Dominican Republic, is a proud first-generation Dominican American. She graduated from The Pennsylvania State University (Penn State) with a B.A. in applied psychology and initially worked in social work.
"Being afforded opportunities to go to college and own a business fills me with immense gratitude," Vanessa says. "I want to show my children that they can achieve more than I have, honoring my heritage and highlighting the importance of representation."
Since being introduced to the recruitment industry in 2007, Garcia has not looked back. Her story is a beacon of hope and inspiration for the Hispanic community, illustrating that with determination and support, incredible achievements are possible. In Vanessa's case, her achievements are deeply rooted in the sacrifices and hard work of her immigrant parents.
"This transition is about more than just business," Garcia explains. "It's about creating a legacy and ensuring that our work continues to empower and uplift the communities we serve."
Source: www2.claritas.com/Knowmore
"My parents' journey from the Dominican Republic to the United States has always been a source of inspiration for me," she says. "Their resilience and determination have shaped who I am today and motivated me to create opportunities for others."
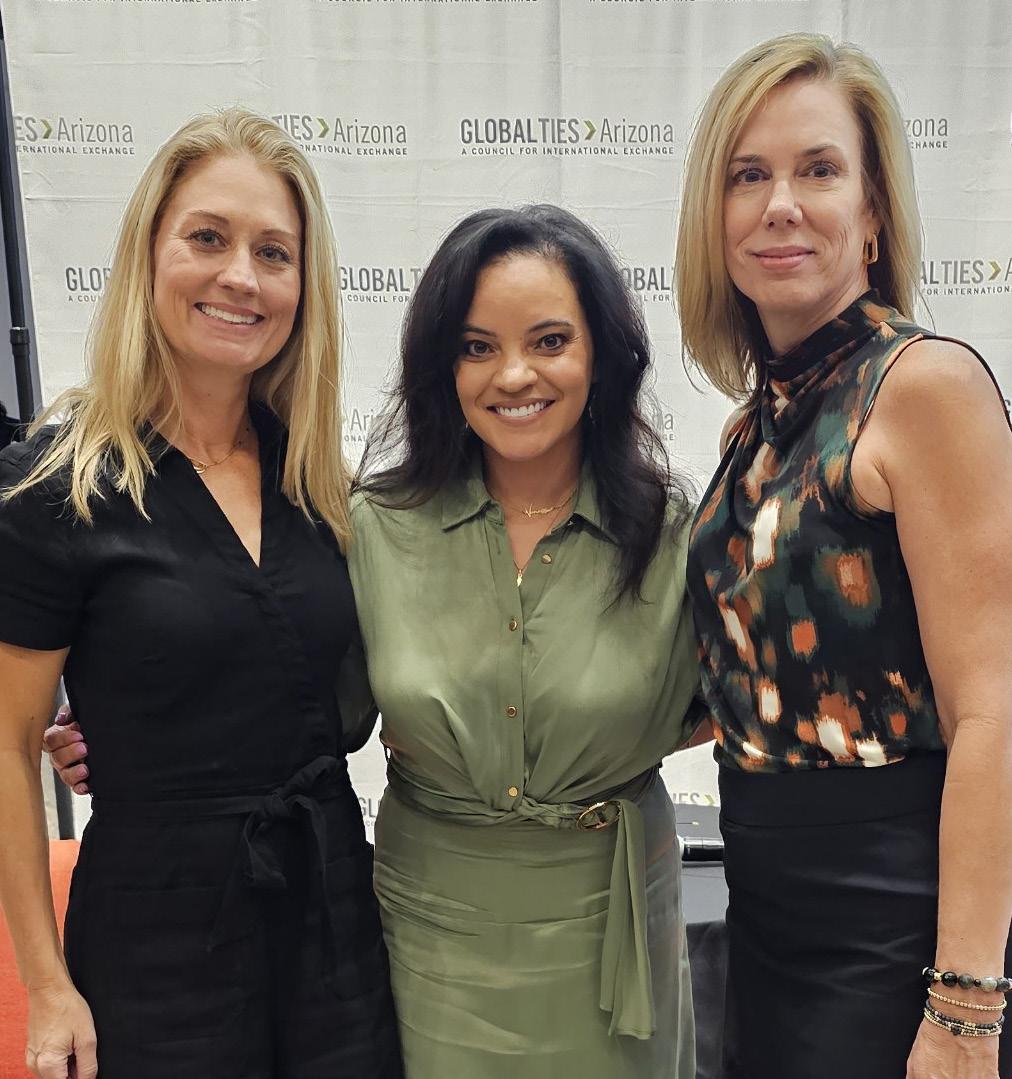
Under Garcia's leadership, Performant Scout is committed to making a positive impact on the Hispanic community. By actively seeking out and supporting Hispanic candidates for mid- to executive-level positions, Garcia is creating pathways for others to follow in her footsteps. Her dedication to diversity and inclusion ensures that the talents and contributions of Hispanic professionals are recognized and valued.
Garcia’s hard work was recently recognized by the Phoenix Business Journal in March 2024 when she was one of 26 honorees awarded the 2024 Outstanding Women in Business Award. The award recognizes “outstanding women in business who are blazing a trail in their companies and communities.”
Garcia's journey is a shining example of how embracing one's heritage and creating opportunities for others can lead to remarkable achievements. Her work at Performant Scout is not only transforming the executive recruiting industry but also making a lasting impact on the Hispanic community.
Source: www2.claritas.com/Knowmore
As she continues to lead Performant Scout in the coming years, her vision remains crystal clear: to empower individuals, honor her heritage and create a legacy of representation and excellence. By her example, she is paving the way for future generations to dream big and achieve more than they might ever have thought possible.
Jean Soliva holds a dual role as Executive Assistant and Sourcing OperationsManagerforPerformantScout. ShewashiredintheSpring of 2024 and has made a significant impact in streamlining processes and sourcing dynamictalentforthe organization’s clients.
Performant Scout 3104 E. Camelback Rd., #716 Phoenix, AZ 85018 602.663.9466 vanessa@performantscout.com performantscout.com
FromSecurecheck360(May31,2024)
Top 11 Recruitment Challenges Recruiters Are Facing in 2024 securecheck360.com/top-recruitment-challengesrecruiters-are-facing/
FromHRToday
HR Professionals Expect Hiring to Remain a Challenge in 2024 hrotoday.com/news/hr-professionals-expect-hiring-toremain-a-challenge-in-2024
Fromthe Phoenix BusinessJournal
2024 Outstanding Women in Business Awards bizjournals.com/phoenix/outstanding-women-inbusiness-awards
In Their Own Words: Vanessa Garcia bizjournals.com/phoenix/c/2024-outstanding-women-inbusiness-awards-event/23028/vanessa-garcia.html
BY CECILIA ESTRADA ASHE
Landings Credit Union, which has locations in Tempe, Gilbert and Chandler, AZ, celebrated its 70th anniversary in October last year. The credit union’s mission is “to make a meaningful financial impact for our members and community.” To accomplish this goal, we continue to explore new and innovative ways to help. In 2021, we partnered with Coopera Consulting, based in Des Moines, IA, to enhance our outreach to underserved communities, particularly Hispanic communities.
As we continue to focus on serving underserved and underbanked groups, Landings Credit Union has added the ability to lend to borrowers with individual tax identification numbers (ITINs) instead of social security numbers (SSNs), giving more members and prospective members access to borrow money. We have also reached out to more groups through financial wellness/education seminars and other support offerings. In 2023, we received a designation as a “Dementia Friendly Business” from the City of Mesa through Oakwood Creative Care. This new designation
THE 411 FRI, SEPT 27
Proclamation Ceremony and Raising of the Juntos Avanzamos flag
TIME: 8 am
LOCATION: Landings Credit Union
2800 S. Mill Ave, Tempe Open to the Public CELEBRATE!
Source: www2.claritas.com/Knowmore

represents our commitment to our members facing Alzheimer’s disease and other forms of dementia and their caregivers.
In the first quarter of 2024, we achieved national recognition of our commitment to financial inclusion by earning the prestigious Juntos Avanzamos designation from the National Juntos Avanzamos Selection Committee, a part of Inclusiv. Inclusiv is a credit union network that helps low- and moderate-income communities achieve financial independence.
Juntos Avanzamos, which translates to “Together We Advance,” is a national designation for credit unions dedicated to serving and empowering Hispanic and immigrant consumers, helping them navigate the U.S. financial system and providing safe, affordable and relevant financial services. Since the national launch of the Juntos Avanzamos network in 2015, the program now has a presence in 29 states, serving more than 12 million consumers and delivering responsible financial products at more than 141 credit unions with 1,196 community branches.
Juntos Avanzamos credit unions employ bilingual, culturally competent staff and leadership, accept alternative forms of identification and treat all their members with respect, regardless
INNOVATIVE CREDIT UNION SUPPORTS THE COMMUNITY BY OFFERING HELP WITH ALL TYPES OF FINANCIAL ISSUES
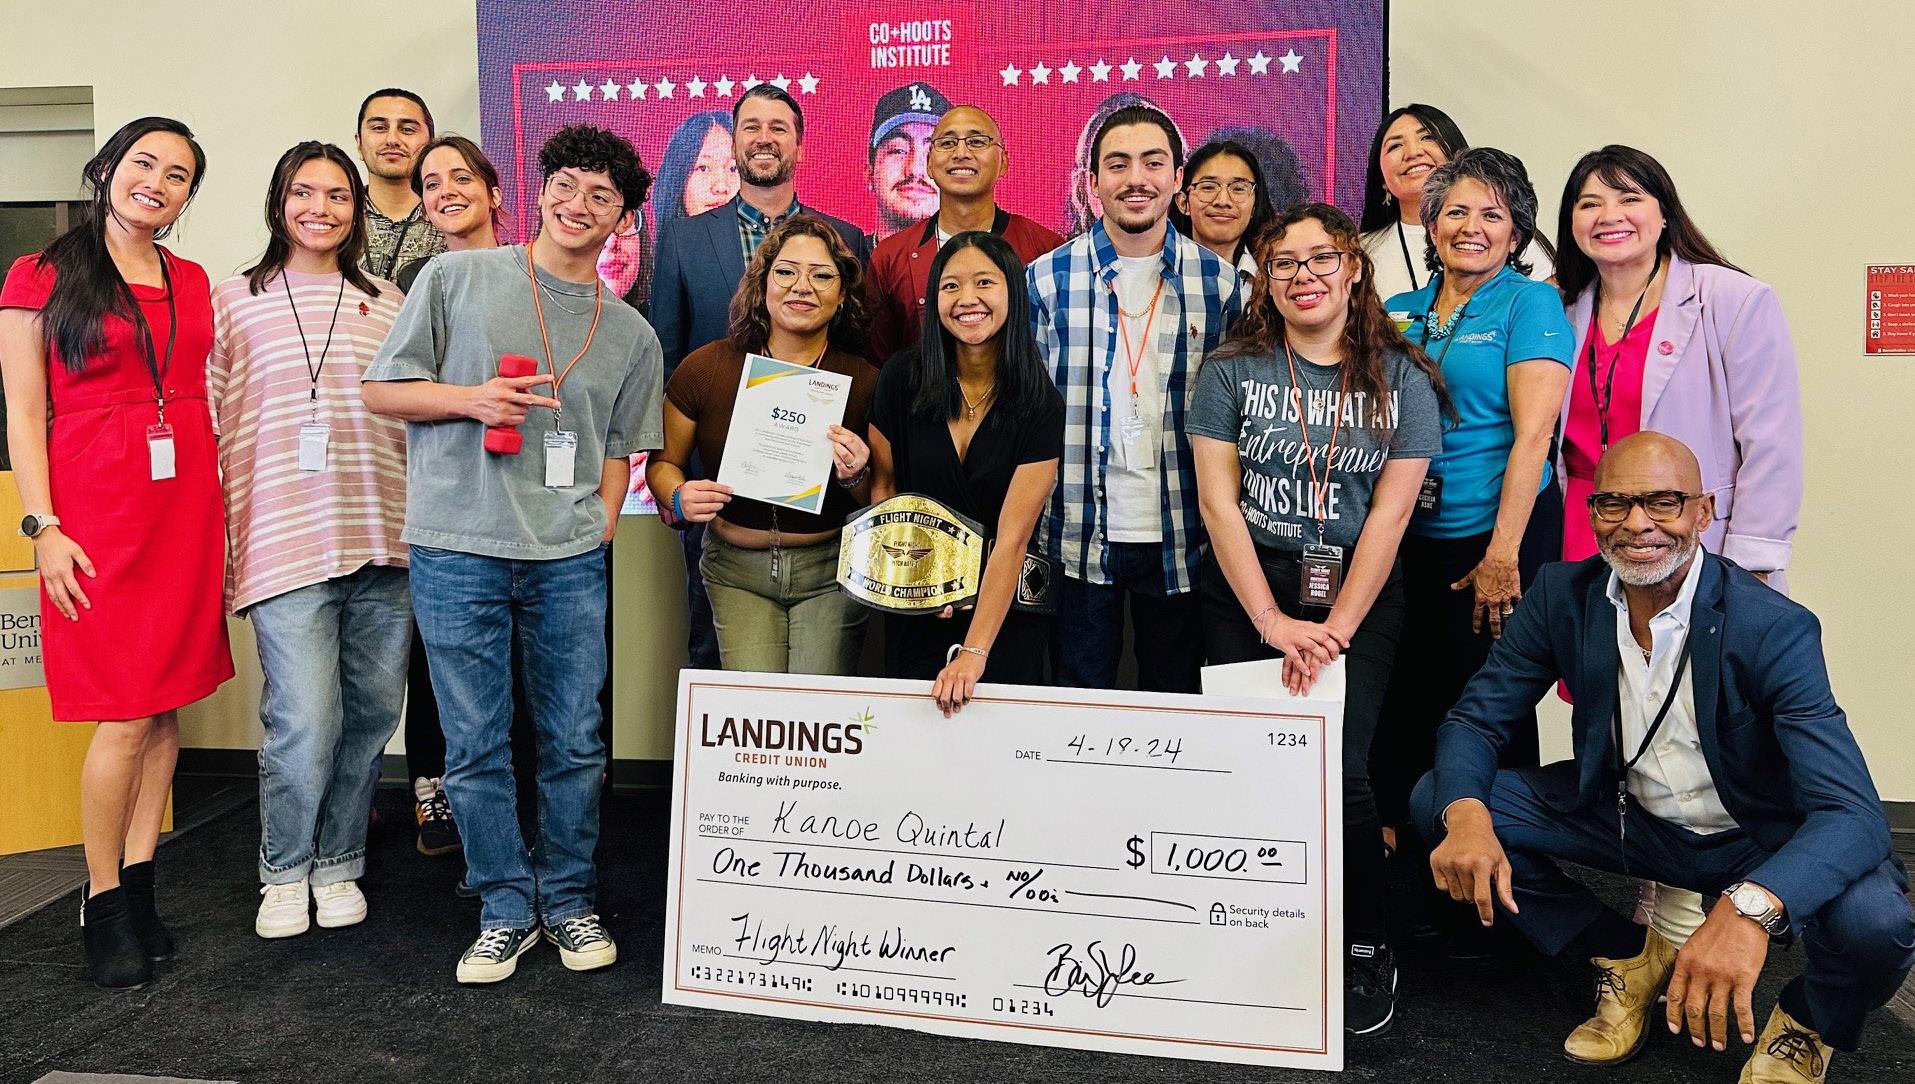
of immigration status, including those with ITINs. ITINs are issued by the U.S. Internal Revenue Service to people who do not have and are not eligible to get an SSN from the Social Security Administration.
There are nearly two dozen credit unions in the GoWest Credit Union Assn. region (Arizona, Colorado, Idaho oregon, Washington and Wyoming) that currently have a Juntos Avanzamos designation. There also are regional chapters of Juntos Avanzamos designated credit unions in the Pacific Northwest.
By breaking down barriers to access and fostering financial literacy and stability, this special designation shows that a credit union has a mission to uplift entire communities to create a brighter, more equitable future. As part of its mission, Landings Credit Union has continued to provide financial wellness education for the entire community: its members and nonmembers, students, nonprofits and small businesses. It also offers hands-on support for the local
Source: www2.claritas.com/Knowmore
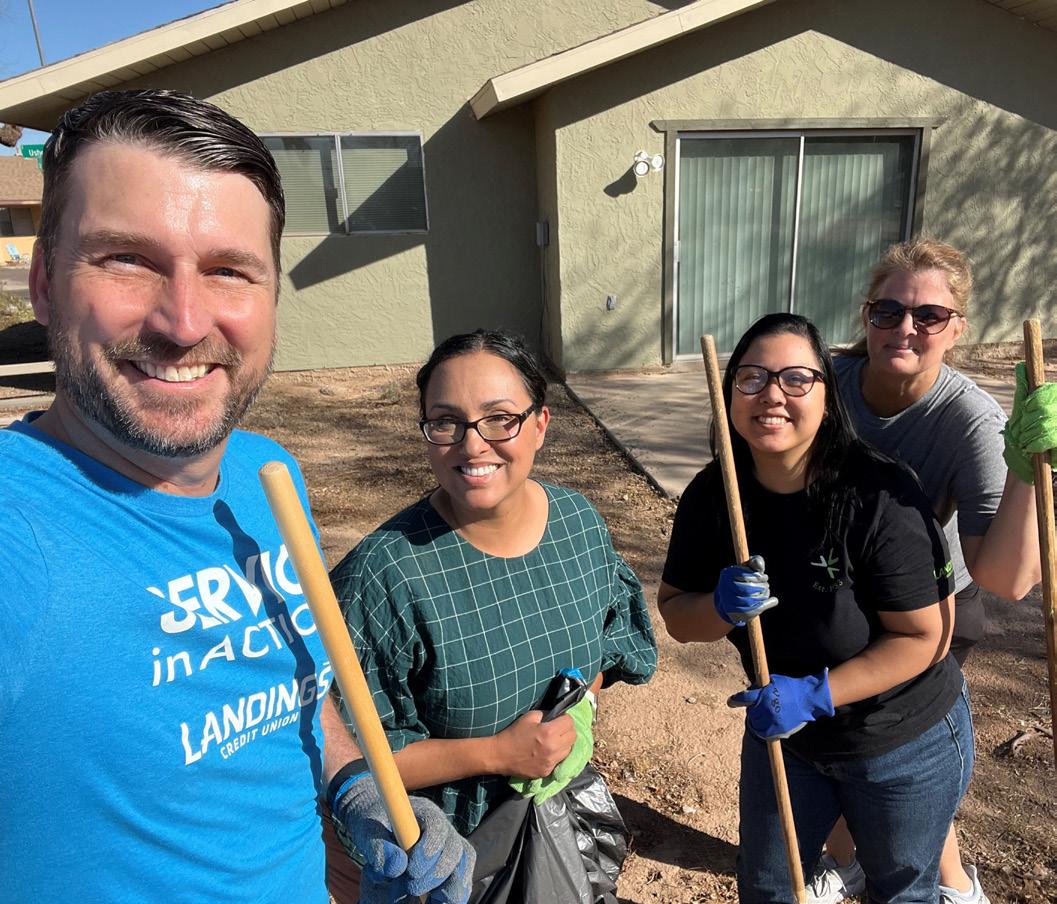
communities of Tempe, Gilbert, Chandler, Mesa, Phoenix and Guadalupe. Workshop topics include budgeting, credit, retirement, homeownership, auto financing, small business resources and wills & trusts.
Landings Credit Union provided $4.4M in Small Business Administration (SBA) paycheck protection loans (PPP) loans for small businesses to keep their staff onboard so they can remain in business from May 2020 through April 2021, assisted first-time homebuyers with down payment and closing cost assistance last year and secured nonprofit grant funding in 2019 and 2023 through the credit union’s membership with the Federal Home Loan Bank. Landings submitted 16 applications since 2016.
Landings Credit Union
2800 S. Mill Ave.
Tempe, AZ 85282
800.851.7749 Toll Free
480.967.9475 info@landingscu.org
Chandler Branch
4850 W Chandler Blvd. Chandler, AZ 85226 Phone numbers/email are the same as Tempe
Gilbert Branch 657 N. Gilbert Rd Gilbert, AZ 85234
Inclusiv inclusiv.org
Juntos Avanzamos juntosavanzamos.org
GoWest Credit Union Assn.
A six-state organization serving more than 300 credit unions and their 17.4 million customers. gowestassociation.org
Source: www2.claritas.com/Knowmore
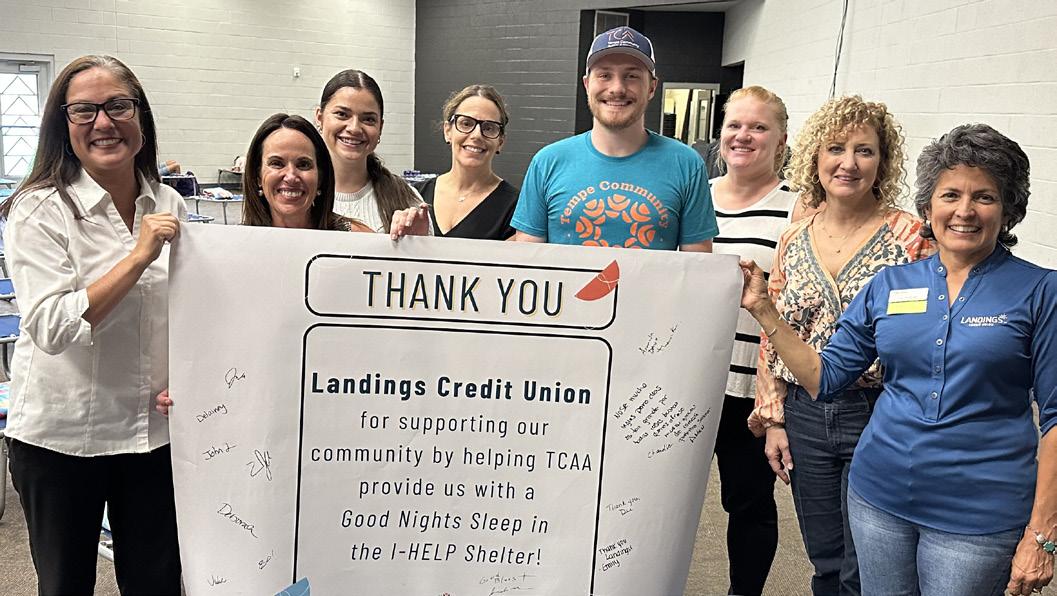
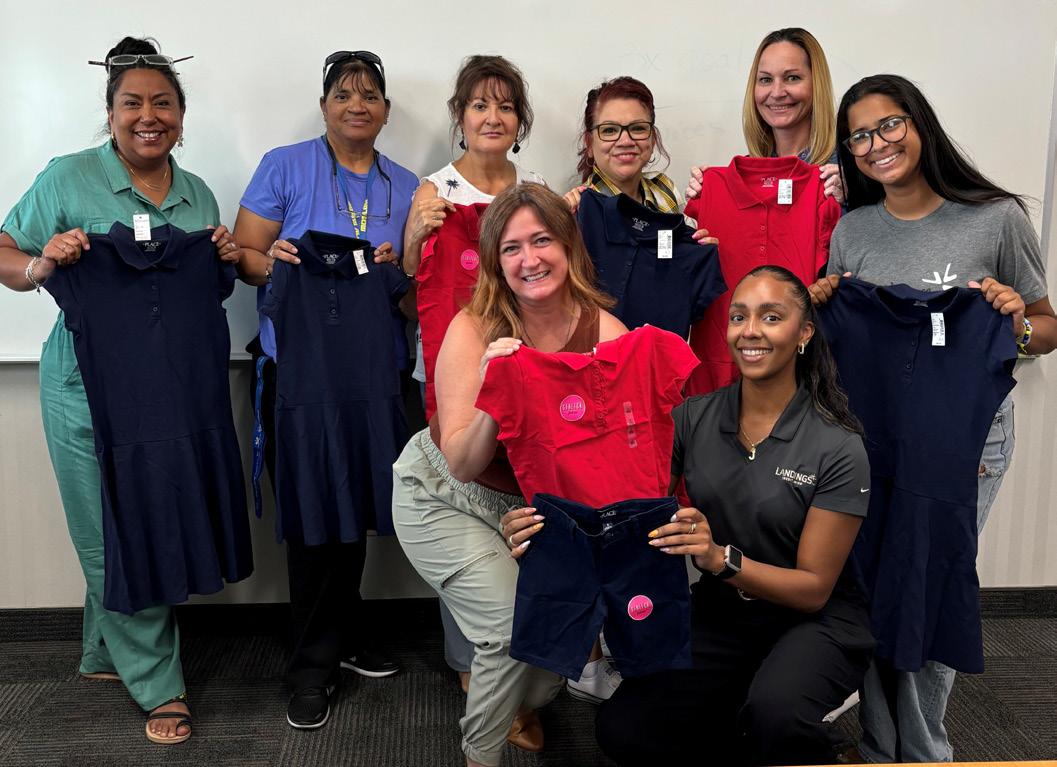
Our staff and board members are involved in the communities we serve through board positions and participation with organizations that include The Centers for Habilitation, Tempe Community Action Agency, Prestamos Women’s Business Center and Arizona Microcredit Initiative.
Cecilia Estrada Ashe is a native ofAlamogordo, NM, with over 45 years inthebankingindustry.Sheiscurrentlyvicepresident/chiefoperations officer for Landings Credit Union, based in Tempe, with branch offices in Gilbert and Chandler. She began her career in the credit union’s business work program as a high school senior. Estrada Ashe has resided inArizonafor18years and is a graduate ofSouthern Methodist University, Graduate School ofBanking, Dallas.
Source: Hispanic Wealth Project and National Association of Hispanic Real Estate Professionals (NAHREP), “2023 The State of Hispanic Wealth Report,” February 8, 2024 nahrep.org/downloads/2023-SHWR-Part-2.pdf
Source: www2.claritas.com/Knowmore
STATE OF HISPANIC WEALTH REPORT 4
In 2022, Hispanic household wealth rose to $63,400, reaching the Hispanic Wealth Project’s target two years ahead of schedule.1 While other racial and ethnic demographics have seen increases in household wealth during that same period, Hispanic household wealth has grown more rapidly than any other demographic group. Latinos were also the only racial or ethnic demographic to increase their wealth by more than threefold, significantly outpacing the general population.
For American families, homeownership continues to be the largest contributor to wealth. Hispanic families who own their homes have, on average, 26.4x the net worth of those who rent.2 And, while rapid home price appreciation in recent years has allowed homeowners to grow their wealth at remarkable rates, higher home prices have also inflated a growing affordability crisis and have raised the barrier of entry to homeownership for first-time buyers.
The Hispanic Wealth Project also emphasizes the wealth-building potential of business ownership. Self-employed Latino households have, on average, 2.0x the wealth of those who aren’t self-employed.3 Plus, the rate of entrepreneurship among Latinos outpaces any other demographic group. The number of Latino-owned businesses increased rapidly during the COVID-19 pandemic, when millions of Americans experienced changes in employment. Yet, accessing capital remains a challenge for Hispanic entrepreneurs, which limits opportunities to scale and build wealth.
Financial diversification is critical for building wealth and ensuring financial stability. The Hispanic community are enthusiastic real estate investors and open small businesses at an unmatched rate. Yet, the community has not fully tapped into the potential of financial investments. The share of Latinos who own non-cash financial assets is increasing, yet, continued financial education is necessary to help the community understand how to utilize these assets to their benefit.
The Hispanic Wealth Project orchestrates various initiatives to help the Hispanic community build wealth in three categories: homeownership, business ownership, and savings and investments. These initiatives include the NAHREP 10 Certified Trainers, the HWP’s Angel Community, and the NAHREP REACH Labs. The Project is also committed to education, hosting various events and media, including the Women Building Wealth series, Wealth Stream News, and the annual HWP Wealth Symposium. Collectively, these programs and events further the HWP’s goal to increase Hispanic household wealth, through increasing homeownership, scaling small businesses, and diversifying investments.
Source: www2.claritas.com/Knowmore
At its inception, the Hispanic Wealth Project established a ten-year goal to triple median Hispanic household wealth by 2024. To guide that goal, the HWP produced a blueprint outlining three primary areas of focus, along with a series of targeted component goals: increasing homeownership, scaling small businesses, and diversifying financial assets.
In line with these component goals, data from the Federal Reserve's 2022 Survey of Consumer Finances indicates that the rise in household wealth can be primarily attributed to Latino homeownership. Not only have more Latinos than ever before become homeowners over the last decade, but rapidly rising home values have helped grow wealth through home equity. Additionally, Latinos continue to start new businesses at a faster rate than any other demographic group, a trend that was only amplified during the COVID-19 pandemic. However, Latinos continue to lag in asset diversification, particularly in non-cash financial assets.
In 2022, Hispanic household wealth rose to $63,400, reaching the Hispanic Wealth Project’s target two years ahead of schedule.4 While other racial and ethnic demographics have seen an increase in household wealth during that same period, Latinos were the only racial or ethnic demographic to increase their wealth by more than threefold, significantly outpacing the general population.
While household wealth has grown substantially, a sizable wealth gap between Hispanic and non-Hispanic White households persists. In 2022, non-Hispanic White households held an additional $219,900 in median net worth over their Latino counterparts. Similarly, the general population holds more than twice the wealth of Hispanic households. While the wealth gap has grown nominally over the last decade, it is getting proportionally smaller. Since 2013, the proportional wealth gap between Hispanic and non-Hispanic White households has been cut in half. In 2022, non-Hispanic White households held on
Source: www2.claritas.com/Knowmore
GROWTH RATE BY RACE AND ETHNICITY (2013-2022)
SOURCE: FEDERAL RESERVE, SURVEY OF CONSUMER FINANCES (2022 INFLATION-ADJUSTED DOLL ARS), ANALYZED IN PARTNERSHIP WITH POLYGON RESEARCH
RATIO OF LATINO TO NON-HISPANIC WHITE NET WORTH
SOURCE: FEDERAL RESERVE, SURVEY OF CONSUMER FINANCES (2022 INFLATION-ADJUSTED DOLLARS), ANALYZED IN PARTNERSHIP WITH POLYGON RESEARCH
average $4.47 for every $1 held by Latino households, compared to $8.87 back in 2013.5 While this is promising, the gap is simply not shrinking quickly enough.
The COVID-19 pandemic presented unexpected financial challenges for many Americans. Many lost their jobs, while inflation steadily rose. In April 2020, the unemployment rate peaked at a staggering 14.8 percent.6 From May 2020 to June 2022, the 12-month change in the Consumer Price Index rose by 9 percent — its highest rate in over 20 years.7 While many Americans fared well during the pandemic, for others, the combination of unstable employment and rising inflation led to financial hardship.
Latinos, overrepresented in many of the industries affected the most by the pandemic, faced more economic difficulties than the general population. Half (49.3 percent) of Latino families reported facing financial hardship during the COVID-19 pandemic, in comparison to 34 percent of the general population.4 Specifically, Latinos mentioned missing a regular rent or mortgage payment at a rate nearly twice that of the general population (19.1 percent of Latinos compared to 10.6 percent of the general population).8
In 2022, exactly one-third of Hispanic household wealth could be attributed to home equity, or equity held in a primary residence. This was a substantial increase from 2013, when Latinos held just over a quarter (26.7 percent) of their net
worth in their homes. When considering all property holdings, including equity in residential and non-residential investment properties, real estate constitutes nearly half (45.5 percent) of Hispanic household wealth.9
This increase in household wealth held as home equity is likely due to growing Hispanic homeownership rates and rapid home price appreciation. However, the general population has not seen a similar increase. In 2022, the general population held 21.1 percent of their wealth in home equity, up from 19.7 percent in 2013.10
Comparatively, the general population holds a significantly larger share of wealth in non-cash financial assets. In 2022, nearly half of overall household wealth (41.7 percent) was held in financial investments, compared to just 28.1 percent for Hispanic households.11 While Latinos’ share of wealth held in financial investments has increased since 2013, they continue to underinvest in these assets.
Considering that homeownership is by far the greatest factor in net worth, it is unsurprising that such a large share of Latino household wealth is made up by real estate. It is important, however, that asset diversification remain a central focus for the Latino community, particularly given that disproportionate investment in real estate was the primary driver behind the economic devastation faced by Latino families after the 2008 housing crisis.


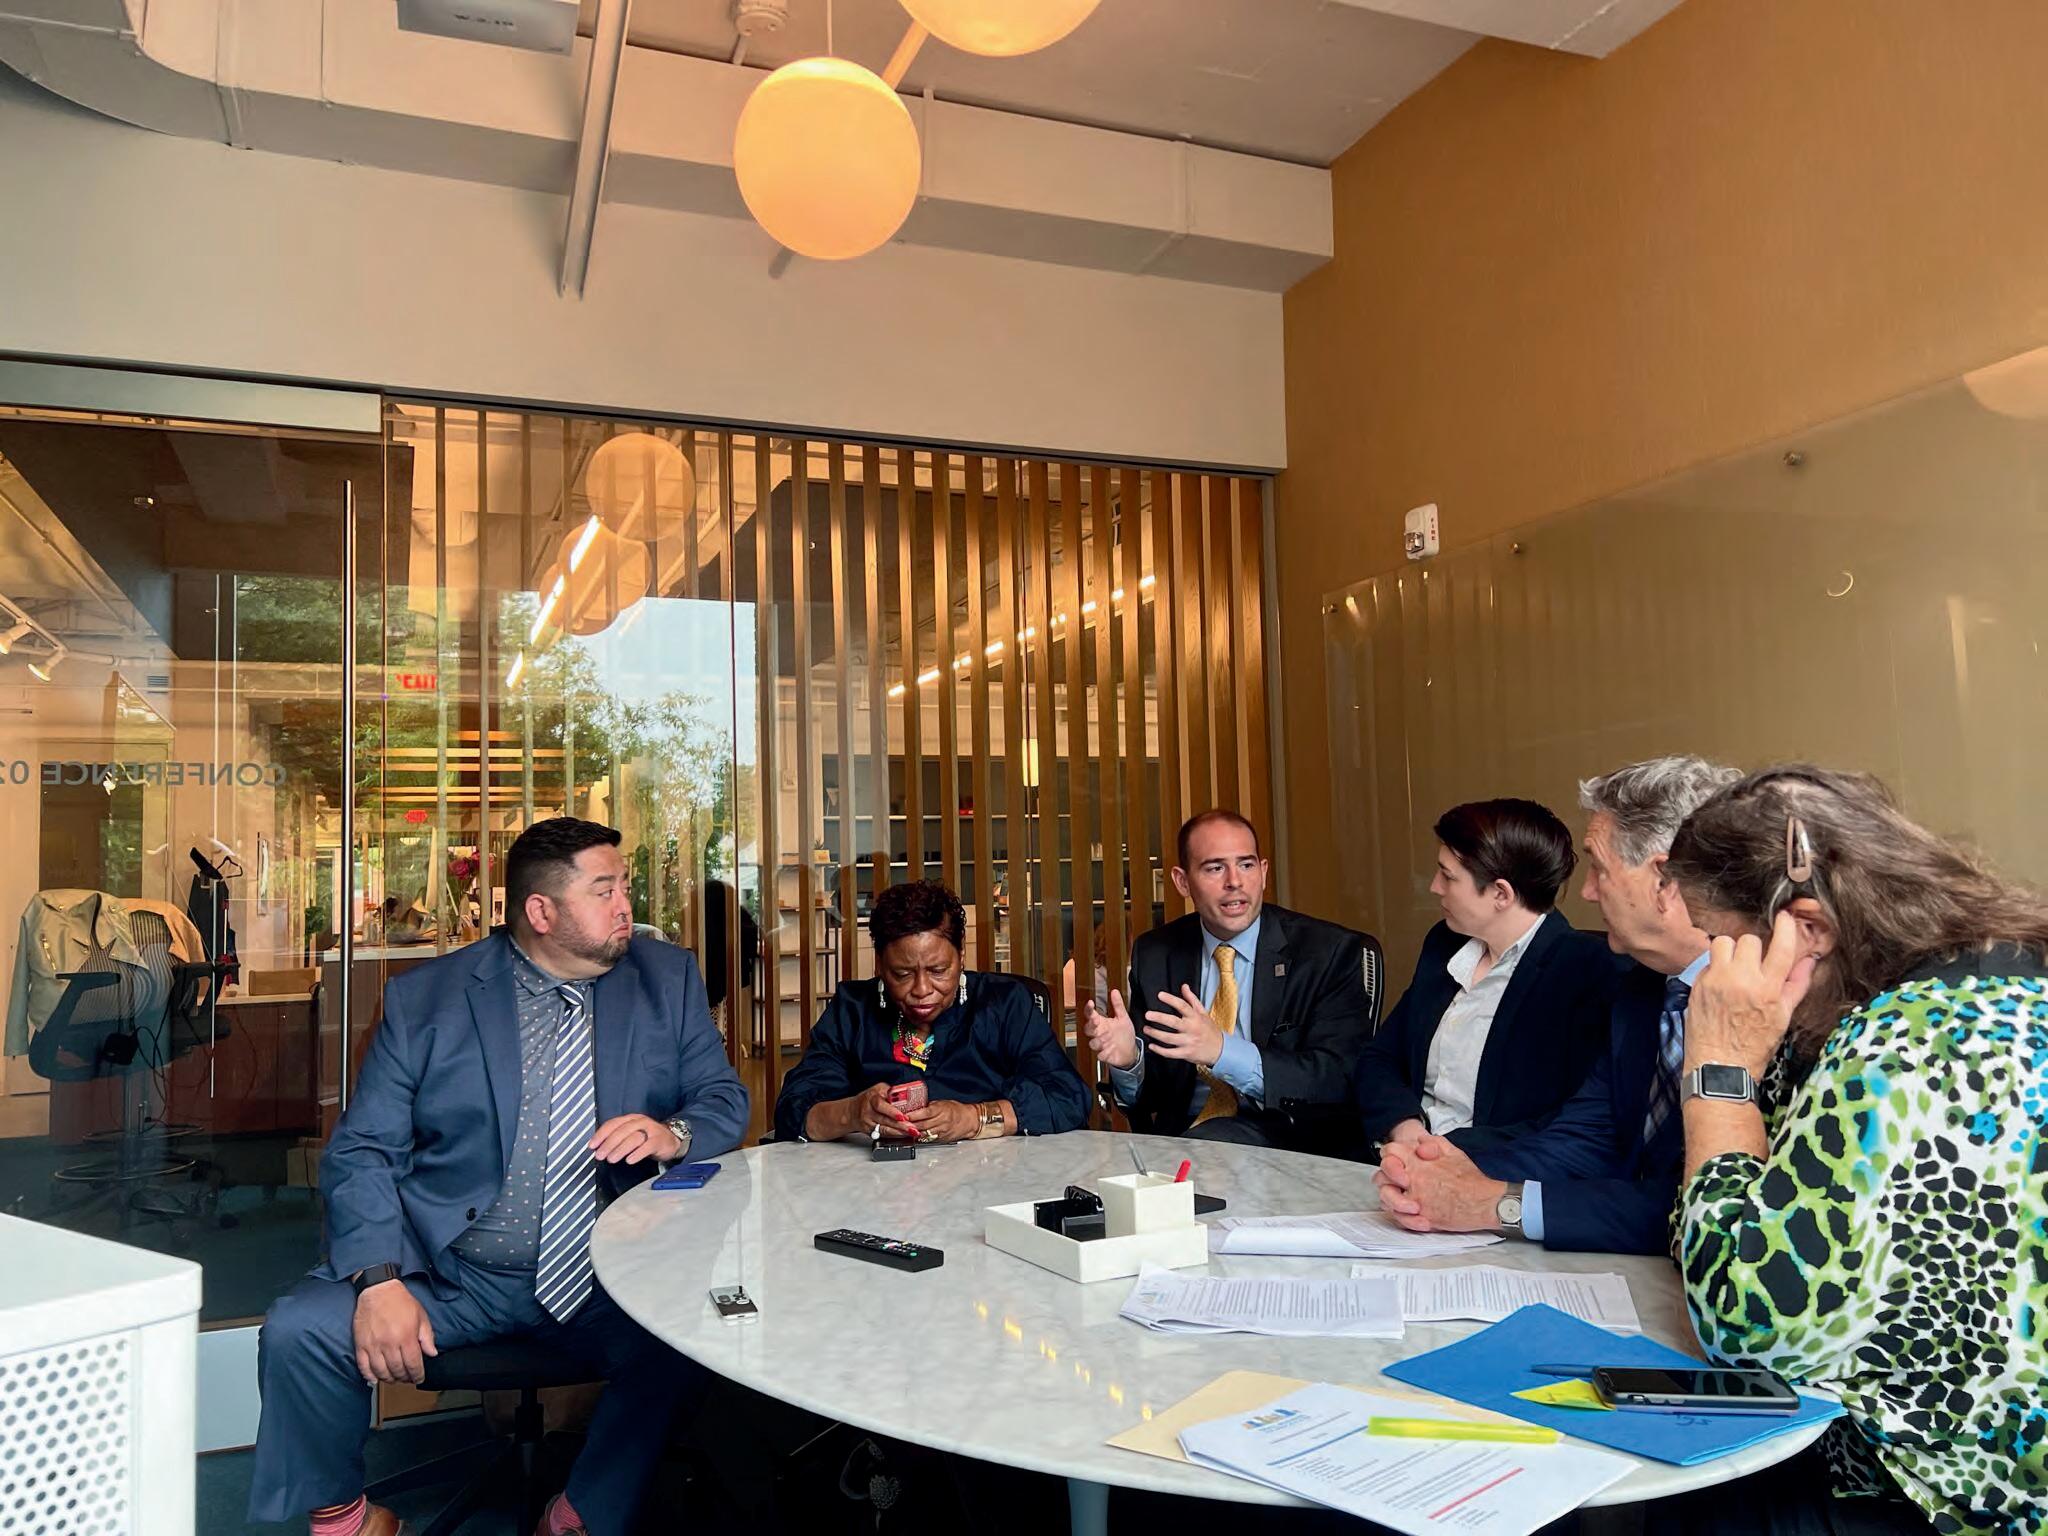


The U.S. is home to more than 63 million Latino/as, making up 19% of the country’s population. With a collective economic contribution of $3.2 trillion and ownership of nearly 5 million businesses generating more than $800 billion in annual revenue, the Latino/a community serves as a prominent consumer base and a growing force in economic development.
This year's report enhances our understanding of Latino/a entrepreneurship by embracing an inclusive approach, and delving deeper into the unique experiences of Latina-owned businesses, tech-centric firms, and immigrant entrepreneurs. We focus on employer businesses with at least one employee other than the owner generating at least $10,000 in annual revenue. Hereafter, all data presented in this report correspond to Latino/a-owned employer businesses (LOBs) and non-Hispanic White-owned employer businesses (WOBs) unless stated otherwise.
Growth and Scale: Latino/a-owned employer businesses continue to contribute and strengthen the U.S. economy. The landscape of Latino/a-owned firms is sizable in number but skews towards smaller operations with a lower share of employer and scaled firms than White-owned businesses (section III).
Despite these gaps, LOBs continue to accelerate their economic influence, posting higher rates of growth than WOBs in revenue and number of companies.
Industries and Innovation: Latino/a-owned businesses, typically younger in terms of firm age, show a parallel industry presence to White-owned. Despite being newer entrants to the market, Latino/aowned firms are carving out significant industry footprints and demonstrating innovation (sections III and V). Specifically, the adoption of Artificial Intelligence (AI) emerges as a distinctive feature of scaled and tech-centric Latino/a-owned firms, positioning them ahead of their White-owned firm counterparts in implementing these technologies. Such adaptability is characteristic of the Latino/a entrepreneurial spirit, evidenced further by strategic pivots during the COVID-19 pandemic and a diverse use of marketing technologies. The convergence of growth and innovation highlights the integral role LOBs play in the U.S. economy.
To better understand the intricacies of Latino/a entrepreneurship, we focus on three different subgroups: female-owned businesses, tech-centric businesses, and immigrant entrepreneurs. This approach is crucial for understanding the diverse experiences and challenges within the Latino/a business community.
Source: www2.claritas.com/Knowmore
Latina-owned Businesses: Latina entrepreneurs are forging paths in the US entrepreneurial landscape. Latina-owned businesses represent a considerable proportion of all Latino/a-owned firms in America and showcase promising trends in terms of revenue growth and new businesses started. Nonetheless, Latina-owned firms encounter unique challenges at the crossroads of gender and ethnicity that impact their resilience and profitability. These challenges include lower revenues and profitability, and smaller contracting opportunities from governments and corporations than Latino- and White male-owned businesses (section IV). Latina-owned businesses also experience the lowest approval rates on business loans from national and local banks.
Technology-centric Businesses: In the realm of tech-centric businesses, Latino/a-owned businesses outperform their White-owned counterparts in revenue growth and adoption of Artificial Intelligence. Additionally, tech-centric Latino/a-owned firms generate similar revenues as tech-centric White-owned companies, a unique phenomenon among employer firms. Nonetheless, tech-centric Latino/a-owned firms face substantive challenges notably in liquidity, access to financing, and contracting hurdles. The banking crisis of 2023 underscored these challenges, disproportionately impacting tech-centric Latino/a-owned businesses in their quest for financial stability and growth (section V). Despite these challenges, the resilience and innovative approaches of Latino/a-owned firms signal a promising future for the incorporation of new technologies and the broader U.S. economy.
Immigrant Entrepreneurship: Latino/a immigrants over-index in business ownership, representing 52% of all Latino/a-owned employer firms, compared to just 7% of White-owned employer businesses that are immigrant-owned. Despite being important contributors to the U.S. economy, Latino/a immigrant entrepreneurs who own employer businesses often navigate steeper barriers than U.S.-born Latino/as. The results of our study show a generational increase in median annual revenues and growth rates among immigrant Latino/a entrepreneurs, entrepreneurs who are children of immigrants, and entrepreneurs of subsequent generations, indicating a potential upward mobility trend. While immigrant Latino entrepreneurs primarily operate within consumer-facing industries, children of immigrants and subsequent generations diversify into a broader range of sectors, including B2B and B2G (section VI). These trends reveal a nuanced evolution in entrepreneurial focus across generations, highlighting the importance of supporting immigrant-owned ventures to tap into broader markets for enhanced economic impact.

Source: www2.claritas.com/Knowmore
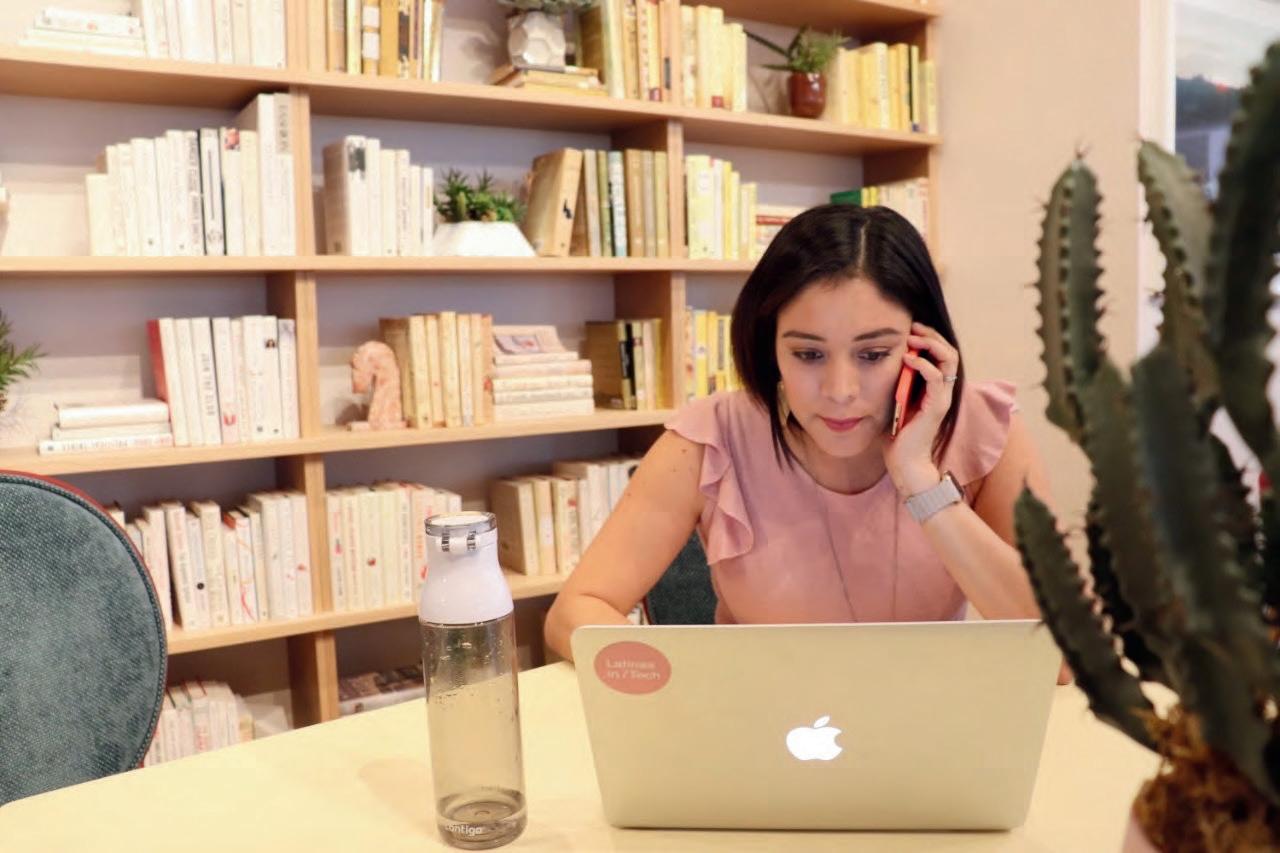

2.6x
Stanford Latino Entrepreneurship Initiative surveyed 15,000 employer businesses in 2021 as part of its annual national survey to assess the current state of U.S. Latino entrepreneurship. We have compiled some of the most pressing insights about Latino-owned employer businesses in the Phoenix metropolitan area.
5,554 Latino-Owned Businesses (LOBs)
60,007 White-Owned Businesses (WOBs)
There are 5,554 Latino-owned businesses in the area. With 9 Latino-owned companies for every 100 White-owned businesses, the Phoenix metro area has a higher concentration of Latino-owned businesses than the United States at large (8 LOBs for every 100 WOBs).
LOBs are 2.6 times more likely to be in tech than WOBs in the Phoenix metro area.
At the national level, LOBs are 1.4x more likely to be in tech than WOBs.
LOBs are substantially than WOBs (21% Phoenix metro patterns (43%
1.3x
Latino-owned businesses are 1.3 times as likely as WOBs to report their primary goal as an entrepreneur is to operate a business that can be inherited by their family.
LOBs report having business operations area. This pattern
The COVID-19 pandemic was challenging for Latinoowned firms across the country, although fewer Latino-owned firms in the Phoenix metro reported negative impacts of the pandemic than Latino businesses across the country (53% LOBs in Phoenix vs. 62% LOBs nationwide).
NOTES: All data (LOBs) and non-Hispanic Our research focuses revenue to resemble
SOURCES: SLEI
Annual Survey of
likely to the Phoenix are 1.4x than WOBs.
BUSINESSES
70% WOBs
23% WOBs
5% WOBs are to an a inherited by Positive effect
Latinofewer reported Latino Phoenix
LOBs are substantially less likely to be profitable than WOBs (21% and 52%, respectively) in the Phoenix metro area. This trend aligns with national patterns (43% LOBs and 49% WOBs).
LOBs report having less available cash to cover business operations than WOBs in the Phoenix metro area. This pattern is consistent with national trends.
Businesses in the Phoenix metro area have less outstanding debt than businesses across the country. Concurring with national trends, LOBs in the Phoenix metro area have higher outstanding business debt than WOBs.
In the Phoenix metro area, LOBs are more likely to be asked to provide collateral than WOBs when taking out loans. The double-digit gaps occur across all types of collateral requested.
NOTES: All data reported are for Latino-owned employer businesses (LOBs) and non-Hispanic White-owned employer businesses (WOBs). Our research focuses on employer firms earning over $10,000 in revenue to resemble Census parameters (MOE +/- 4%).
SOURCES: SLEI Survey of U.S. Business Owners, 2021; U.S. Census Bureau Annual Business Survey 2018, 2019, 2020; U.S. Census Bureau Annual Survey of Entrepreneurs 2015, 2016.
Source: www2.claritas.com/Knowmore
Barbara Gomez-Aguinaga, Jonathan Furszyfer, Jerry Porras, and Paul Oyer. “2021 State of Latino Entrepreneurship in the Phoenix Metro Area.” Stanford Latino Entrepreneurship Initiative. 2022.
For more information, visit gsb.stanford.edu/slei
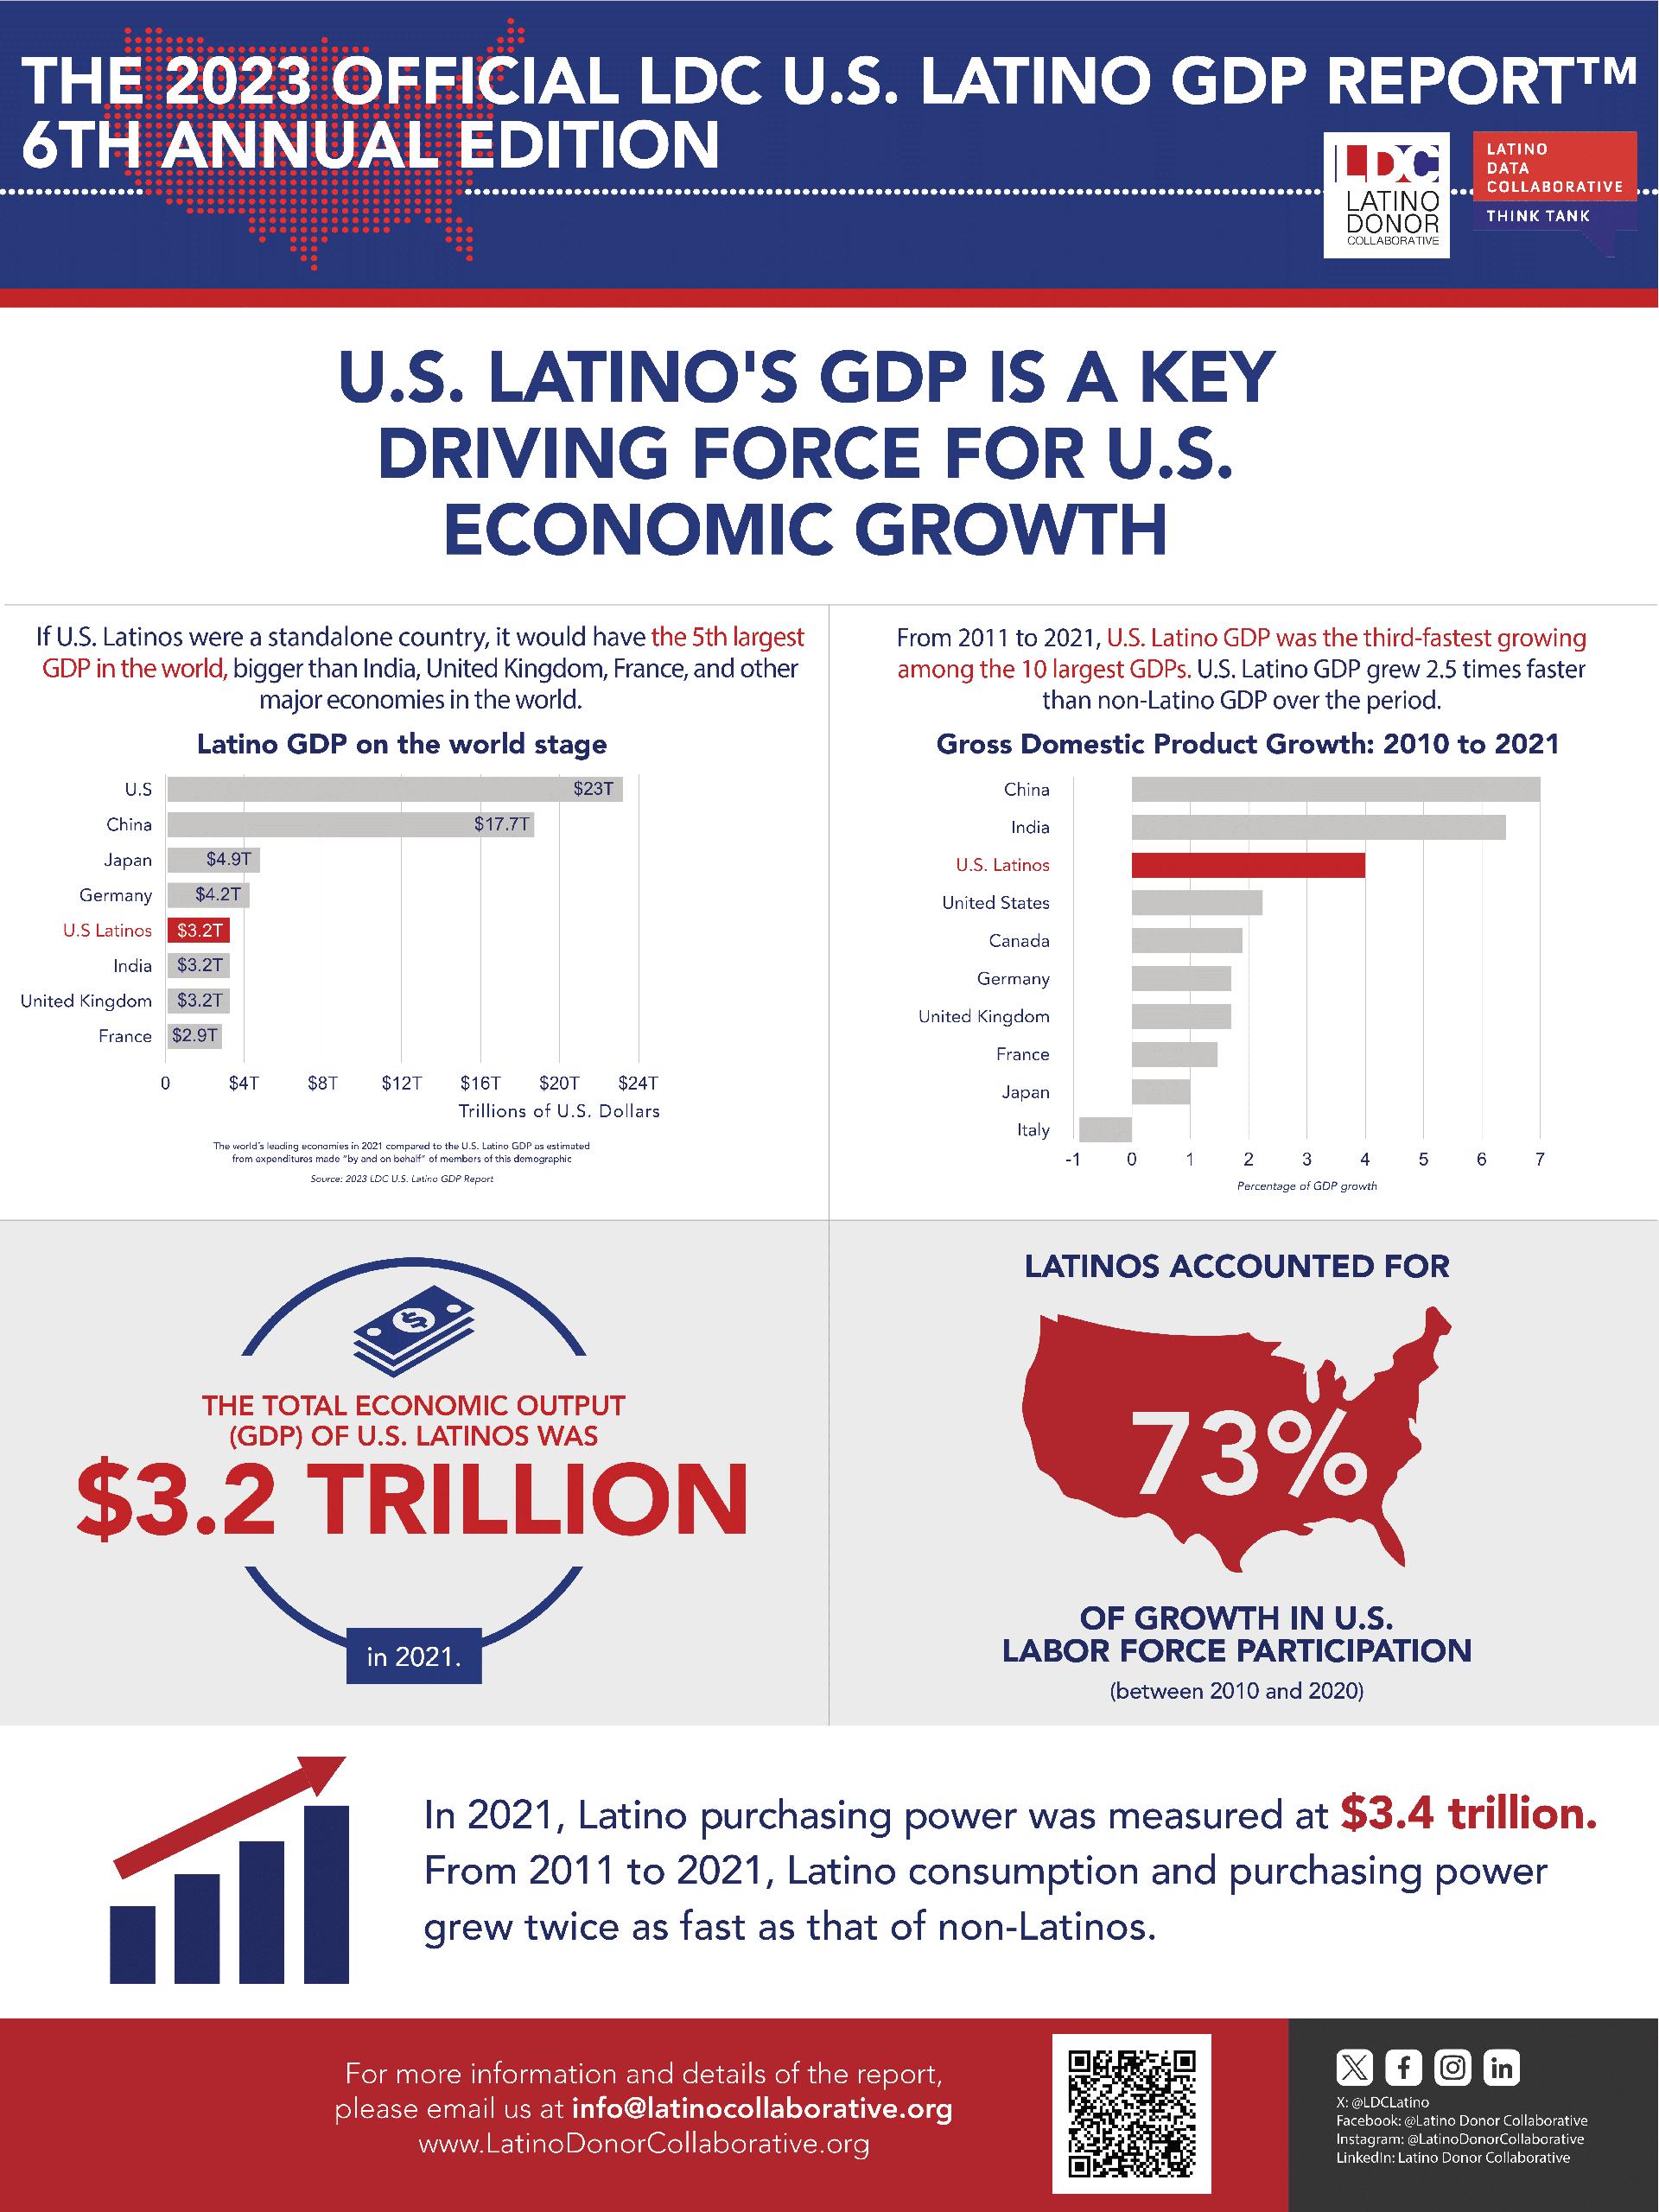
Economic
Source: Board of the Governors of the Federal Reserve System, “Economic Well-Being of U.S. Households in 2023,” May 31, 2024 www.federalreserve.gov/publications/2024-economic-well-being-of-us-households-in-2023-executive-summary.htm
Source: www2.claritas.com/Knowmore
May 2024

Results from the 2023 Sur vey of Household Economics and Decisionmaking (SHED) indicate that people’s overall financial well-being was near ly unchanged from the previous year but below the high reached in 2021.1 Despite the moderating pace of inflation, many adults continued to indicate that higher prices were a challenge in managing their finances.
The sur vey, which was fielded in October 2023, showed similar patterns for other measures of financial resiliency as well. Both the share of adults who spent less than their income in the month before the sur vey and the share who would pay for an unexpected $400 expenses with cash or the equivalent were near ly unchanged from 2022, yet both were down from 2021. Among adults who were not retired, the share who felt that their retirement savings plan was on track rose slightly from 2022, possibly reflecting stock mar ket gains, but remained below the share who felt their retirement savings was on track in 2021.
The rates at which wor kers star ted new jobs and received pay raises were consistent with those seen in 2022. Reflecting the continued strength in the labor mar ket, these measures remained above the levels seen in 2021. Relatedly, the share of prime-age adults (ages 25 to 54) not wor king because of difficulty finding wor k remained low
Some groups continued to experience financial stress at higher rates than others. Lower-income adults were more likely to experience material hardships including not paying all bills, not always having enough to eat, and skipping medical care because of cost. Additionally, the gap in financial well-being between parents of children under age 18 and other adults widened, as parents saw a continued decline in well-being in 2023.
Some topics in this year’s repor t were new to the sur vey in 2023, such as food sufficiency, caregiving , employment outcomes of those with a previous arrest or conviction, and homeowners insurance. The sur vey also continues to track other key topics related to financial outcomes, such as housing , value of education, and retirement. Key findings across each of the topics covered in the repor t include the following:
1 The Federal Reser ve has fielded the SHED annually in the four th quar ter of each year since 2013. The latest sur vey was fielded from October 20 until November 5, 2023. Since 99 percent of respondents completed the sur vey in October, this repor t describes the field period as October 2023. The anonymized data, as well as appendixes containing the SHED questionnaire and responses to questions in the order asked, are also available at https://www.federalreser ve.gov/ consumerscommunities/shed.htm.
Source: www2.claritas.com/Knowmore
• The 72 percent of adults doing at least okay financially was similar to the 73 percent in 2022 yet remained well below the recent high of 78 percent in 2021.
• F inancial well-being was generally unchanged from 2022 for most population segments. One notable exception was parents living with their children under age 18, where the share doing at least okay financially fell 5 percentage points from 2022.
• Inflation continued to be the top financial concern, despite the inflation rate falling over the prior year.
• Many people experienced a change in their family’s monthly income and spending from a year ear lier. Thir ty-four percent of adults said their family’s monthly income increased in 2023 compared with the prior year, while a higher 38 percent said their monthly spending increased.
• For ty-eight percent of adults repor ted spending less than their income in the month before the sur vey. The share of adults who saved money in the month before the sur vey was similar to the share in 2022 but down from highs in 2020 and 2021, and below pre-pandemic levels.
• The rates at which wor kers star ted new jobs, applied for new jobs, and received pay raises were similar to 2022. For example, the share of adults who received a raise and the share who asked for a raise were unchanged at 33 percent and 13 percent, respectively. Yet, reflecting the continued strength of the labor mar ket, rates of star ting new jobs and pay raises remained above 2021 levels.
• About 4 in 10 single wor king parents of a younger child (under age 13) used paid childcare, as did a similar share of parents living with a spouse/par tner where both parents wor ked.
• Childcare costs can be significant for parents. The median monthly amount that parents using paid care paid for childcare was $800. For those who paid for 20 or more hours of childcare each week, the median cost was $1,100.
• Sixty-three percent of adults said they would cover a hypothetical $400 emergency expense exclusively using cash or its equivalent, unchanged from 2022 but down from a high of 68 percent in 2021.
• Sixty-five percent of adults said that changes in the prices they paid compared with the prior year had made their financial situation worse, including 19 percent who said price changes had made their financial situation much worse. In contrast, 4 percent of adults said that price 2 Economic Well-Being of U.S. Households in 2023
Source: www2.claritas.com/Knowmore
changes compared with last year had made their financial situation better, while 31 percent said price changes had little to no effect on their financial situation.
• While 94 percent of adults had a bank account, notable differences remain by income, age, race, ethnicity, and disability status. For example, near ly all adults with incomes of at least $100,000 had a bank account, compared with 77 percent among adults with incomes less than $25,000.
• The share of adults who applied for credit has been near ly unchanged in recent years. Yet, among adults who applied for credit, the share who were denied credit or approved for less credit than they requested was up 2 percentage points from 2022 and up 5 percentage points from 2021.
• Four teen percent of adults used Buy Now, Pay Later (BNPL) in the prior 12 months, up 2 percentage points from 2022. The top two reasons for using BNPL were wanting to spread out payments (87 percent) and for convenience (82 percent). Additionally, over half of BNPL users said it was the only way they could afford their purchase.
• Challenges paying rent increased in 2023. The median monthly rent payment was $1,100 in 2023, up 10 percent from 2022. In addition, 19 percent of renters repor ted being behind on their rent at some point in the past year, up 2 percentage points from 2022.
• Nineteen percent of adults said they were affected financially by a natural disaster in the prior year, including 7 percent who were moderately or severely affected.
• At least 4 percent of homeowners did not have homeowners insurance. This share was much higher among cer tain populations. For example, more than 2 in 10 homeowners living in the South with an income less than $50,000 did not have homeowners insurance.
• Education was largely seen as a path to higher income and greater financial well-being. Most adults who completed a bachelor’s degree or higher said it was wor th the cost, but few who star ted an educational degree program after high school and did not complete at least an associate degree thought the same.
• Following the restar t of federal student loan payments in the fall of 2023, the share of student loan borrowers who were required to make payments returned back to pre-pandemic levels.
Source: www2.claritas.com/Knowmore
4
• Progress toward retirement savings goals improved slightly in 2023. Thir ty-four percent of nonretirees thought their retirement savings plan was on track, up from 31 percent in 2022, but down from 40 percent in 2021.
• Eighty percent of retirees said they were doing at least okay financially—a higher share than for U.S. adults overall.
• For ty-five percent of adults said they were mostly or ver y comfor table choosing and managing their investments, while 55 percent of adults said they were not comfor table or only slightly comfor table.
Source: www2.claritas.com/Knowmore

• FROM 2010 TO 2021, THE HISPANIC STUDENT POPULATION IN U.S. PUBLIC SCHOOLS HAS EXPERIENCED THE LARGEST GROWTH
• TOTAL COLLEGE ENROLLMENT IN THE U.S. HAS DECLINED SINCE ITS PEAK IN 2010
• THE PERCENTAGE INCREASE IN THE NUMBER OF HISPANIC MALES AND FEMALES WITH GRADUATE DEGREES WAS GREATER THAN ALL OTHER GROUPS
• MORE THAN ONE-THIRD OF LATINOS IN THE U.S. WITH GRADUATE DEGREES ARE IMMIGRANTS
• SINCE 2020, OVER 100K HISPANIC STUDENTS PER YEAR ARE BEING AWARDED A STEM DEGREE OR CERTIFICATE IN THE U.S.
• COLLEGE LOAN REPAYMENT IS THE GREATEST BURDEN FOR BLACK STUDENTS
• ARIZONA HAS THE 3RD LOWEST PUBLIC SCHOOL STUDENT INVESTMENT IN THE NATION
• ARIZONA IS TIED WITH WYOMING FOR THE 8TH HIGHEST DROPOUT RATE IN THE NATION
• THESE 10 AREAS IN THE U.S. HAVE THE HIGHEST COUNT OF LATINOS WITH GRADUATE DEGREES
• THE PERCENTAGE OF CHILDREN BETWEEN AGES 3 AND 5 ENROLLED IN ARIZONA SCHOOLS IS BELOW THE U.S. PERCENTAGE
• NEARLY HALF OF ARIZONA’S K–12 STUDENTS ARE HISPANIC
• TEACHER SALARIES IN ARIZONA ARE AMONG THE LOWEST IN THE U.S.
110 SPECIAL FEATURE Education
This Special Feature courtesy of Univision Communications presents back-to-school facts and continuing education figures on education in the Phoenix and Tucson markets for Hispanics
IN FOCUS
CREATING CHANGE
Arizona’s First Autism-Focused Charter Network
A former teacher whose child was diagnosed on the autism spectrum created an autism-focused charter network that can serve as a model for other schools throughout the U.S.
BY DIANA DIAZ-HARRISON
IN FOCUS
Unlimited Potential Sees Unlimited Possibilities within Our Communities
Forty years ago a group of South Phoenix parents worked together to create a brighter future for their children—and the group is still going strong
BY PAUL PADILLA
IN FOCUS
EXCERPT
Education is the Key to Economic Mobility
The ASU Helios Decision Center for Educational Excellence is committed to giving all Arizonans a pathway to economic mobility
BY CHRISTI GUEVARA, Ph.D
The goal is for Arizona to achieve 60% college attainment by 2030—and it will take bold action by educators, policymakers and business and community leaders
EXCERPT
This publication from the National Center for Education Statistics at the Institute of Education Sciences offers data from 2021–2023, shedding light on education during and recovery from the COVID pandemic
EXCERPT
The Arizona Board of Regents, the governing board for Arizona’s three public universities, is committed to meeting the needs of the diverse student population in the state
EXCERPT
MAPA: The State of Arizona Latino Education, Power and Influence
The ALL in Education report says Latino students continue to be underrepresented in the education system, making up 48% of the K–12 public school population, but only 17% of the state education board members are Latinos
FROM 2010 TO 2021, THE HISPANIC STUDENT POPULATION IN U.S. PUBLIC SCHOOLS HAS EXPERIENCED THE LARGEST GROWTH
*NOTE: The value for the
THE PERCENTAGE INCREASE IN THE NUMBER OF HISPANIC MALES AND FEMALES WITH GRADUATE DEGREES WAS GREATER THAN ALL OTHER GROUPS
MORE THAN ONE-THIRD OF LATINOS IN THE U.S. WITH GRADUATE DEGREES
Source: Pew Research Center, "Key facts about U.S. Latinos with
SINCE 2020, OVER 100K HISPANIC STUDENTS PER YEAR ARE BEING AWARDED A STEM DEGREE OR CERTIFICATE IN THE U.S.
NUMBER AND PERCENTAGE DISTRIBUTION OF STEM* DEGREES/CERTIFICATES CONFERRED IN THE U.S. (HISPANIC VS NON-HISPANIC)
*NOTE: STEM is an acronym for Science, Technology, Engineering and Math education.
Source: U.S. Department of Education, National Center for Education Statistics (NCES), Digest of Education Statistics, 2012–2022 nces.ed.gov/programs/digest/d23/tables/dt23_318.45.asp
AVERAGE AMOUNT OWED IN 2020 BY FEDERAL STUDENT LOAN BORROWERS AS A PERCENTAGE OF AMOUNT BORROWED*
*NOTE: Among federal student loan borrowers, average amount owed as a percentage of amount borrowed as of 4 years after 2015–16 bachelor’s degree completion, by race/ethnicity in 2020.
Source: U.S. Department of Education, National Center for Education Statistics (NCES) at the Institute of Education Sciences, “Report on the Condition of Education,” Véronique Irwin et al., May 2023 nces.ed.gov/pubs2023/2023144.pdf
NOTE: Includes current expenditures from funds authorized by the Coronavirus Aid, Relief and Economic Security (CARES) Act of 2020, the Coronavirus Response and Relief Supplemental Appropriations (CRRSA) Act of 2021 and the American Rescue Plan (ARP) Act of 2021. Due to the lag between when the funds were appropriated and when local education agencies (LEAs) began making expenditures from those funds, only a small portion of the total amounts allocated to LEAs were expended during 2019-20. In 2020-21, expenditures from these funds contributed to a large increase in current expenditures in several states.
Source: U.S. Department of Education, National Center for Education Statistics (NCES), Digest of Education Statistics, 1969–70 through 2020–21 nces.ed.gov/programs/digest/d23/tables/dt23_236.65.asp
Source: U.S. Department of Education, National Center for Education Statistics (NCES), Digest of Education Statistics, 2018–19 nces.ed.gov/programs/digest/d23/tables/dt23_219.50.asp
10 AREAS IN THE U.S. HAVE THE HIGHEST COUNT OF LATINOS WITH GRADUATE DEGREES
10 METROPOLITAN STATISTICAL AREAS (MSA
NEW YORK-NEWARK-JERSEY CITY, NY-NJ-PA METRO AREA
MIAMI-FORT LAUDERDALE-POMPANO BEACH, FL METRO AREA
LOS ANGELES-LONG BEACHANAHEIM, CA METRO AREA
HOUSTON-THE WOODLANDSSUGAR LAND, TX METRO AREA
WASHINGTON-ARLINGTON-ALEXANDRIA, DC-VA-MD-WV METRO AREA
CHICAGO-NAPERVILLE-ELGIN, IL-IN-WI METRO AREA
DALLAS-FORT WORTHARLINGTON, TX METRO AREA
SAN ANTONIO-NEW BRAUNFELS, TX METRO AREA
SAN FRANCISCO-OAKLANDBERKELEY, CA METRO AREA
RIVERSIDE-SAN BERNARDINOONTARIO, CA METRO AREA
Source: U.S. Census Bureau, 2022 American Community Survey 1-Year Estimates data.census.gov/table/ACSDT1Y2022.B15002I
PERCENTAGE OF 3- TO 5-YEAR-OLD CHILDREN
ENROLLED IN SCHOOL IN 2022 BY RACE/ETHNICITY, U.S. VS ARIZONA
NOTE: Data for Pacific Islanders in Arizona is unavailable.
Source: Arizona Department of Education, AZ School Report Cards, 2018–2023 azreportcards.azed.gov/state-reports
SALARIES IN ARIZONA ARE AMONG THE LOWEST IN THE U.S. AVERAGE ANNUAL WAGES FOR TEACHERS IN ARIZONA AND THEIR U.S. RANK
Preschool Teachers in Elementary and Secondary Education
Kindergarten Teachers in Elementary and Secondary Education
Elementary School Teachers in Elementary and Secondary Education
Middle School Teachers in Elementary and Secondary Education
Secondary School Teachers in Elementary and Secondary Education
NOTES: *Includes the District of Columbia. **Excludes Wyoming due to unavailable data. ARIZONA TEACHERS BY TYPE AVERAGE ANNUAL SALARY (2022, IN CURRENT DOLLARS)


BY DIANA DIAZ-HARRISON
Every parent deserves the right to choose the best educational environment for their child, whether it's in the performing arts, STEAM (science, technology, engineering, arts and mathematics) learning or a school that meets their special needs. Arizona has a diverse array of school options, but in 2003, none met the needs of my son, Sammy, who was diagnosed as being on the autism spectrum.
As a former teacher, I yearned for a specialized school where the staff had a deep understanding of autism and the necessary behavioral support for students. Over time, I discovered I wasn’t alone in my frustration with the lack of quality options for children with autism.
In 2012, I decided to take action. Arizona has a supportive environment for charter schools, which inspired me to create a unique space for children with autism. I gathered a team of parents, grandparents and professionals to develop a plan for Arizona’s first nonprofit charter school organization focused on children with autism: Arizona Autism Charter Schools (AZACS). This dedicated team formed the founding board and in 2013, we presented our proposal to the Arizona State Board for Charter Schools.
Despite the challenging process, we received unanimous approval. Using our personal family funds and seed grants, we secured our first facility, hired staff and successfully opened our K–5 school in Phoenix in 2014.
Our initial building was modest, yet it filled a significant gap. The state allowed us to initially enroll 90 students, although we had twice as many applicants. Per state law, we conducted a lottery to select the students. As an autism mom, my heart ached for families who had to be waitlisted.


Expanding to serve more children and families has always been central to our mission. Over the years, our positive academic and behavioral growth data led the Arizona State Board for Charter Schools to approve an expansion of AZACS to include a middle and high school in Phoenix.
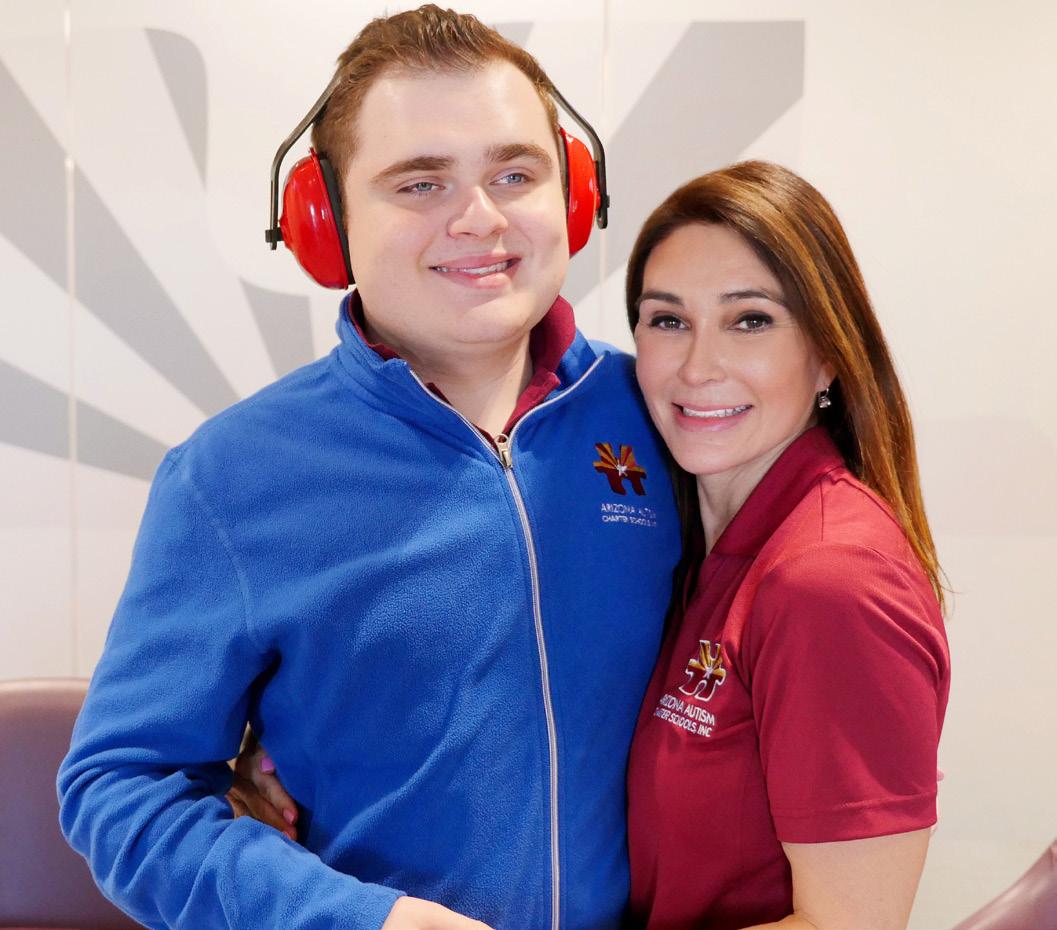
• More children with average intelligence are being identified with autism spectrum disorder (ASD) since the Arizona Developmental Disabilities Surveillance Program (ADDSP) began tracking in 2000.
• The percentage of boys identified with ASD is higher than the percentage of girls.
• More children are being diagnosed with ASD by age 4 than in previous reports.
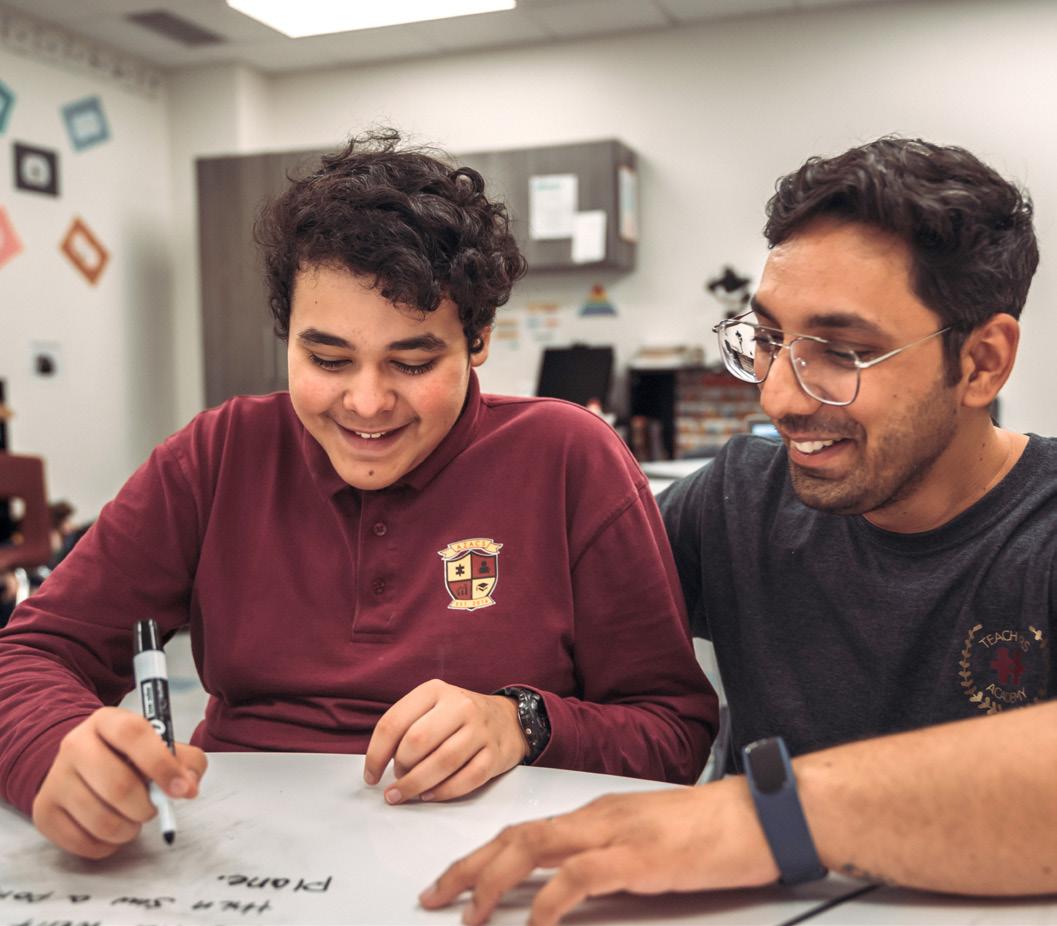
Over the last decade, we've opened five schools: two campuses in Phoenix, a campus in the West Valley, a fully accredited online school and our newest campus in Tucson. Our specialized model, which celebrates neurodiverse students with autism, includes small class sizes, with an average of 9–12 students per class and a 3:1 student-to-staff ratio. We also provide embedded behavior support and therapies during the school day. Our curriculum incorporates STEAM and innovation, engaging students in coding, animation and robotics from an early age.
AZACS has been a blessing for Sammy and the hundreds of students we’ve served. Next year marks a significant milestone: We will grow to serve nearly 1,000 students and families.
Our network has received national acclaim for its educational innovation. In 2022, AZACS won the million-dollar Yass Prize for Sustainable, Transformational, Outstanding and Permissionless education, considered the Pulitzer Prize of education. This year, we received the National Title I Distinguished School recognition for special population schools. As a proud Latina, I'm honored that more than 50% of our population identifies as Hispanic, many of whom would lack access to autism services if not for our school.
As we celebrate 10 years of success, we're expanding to support
CREATING CHANGE: ARIZONA'S FIRST AUTISM-FOCUSED CHARTER NETWORK
Arizona Autism Charter Schools, Inc.
4125 N. 14th St. Phoenix, AZ 85014
602.882.5544
autismcharter.org
FACEBOOK: @Arizonaautismcharterschools
INSTAGRAM: @azautismcharterschools
YOUTUBE: @arizonaautismcharterschool2278
National Accelerator of Autism Charter Schools (NAACS)
autismcharterschools.org
For information about NAACS, contact Lead Trainer Megan Vincent MVincent@autismcharter.org
Arizona Autism United (AZA United)
5025 E. Washington St., Unit 212 Phoenix, AZ 85034
602.773.5773
azaunited.org
Southwest Autism Research and Resource Center (SARRC)
602.340.8717
autismcenter.org
Autism Society of Southern Arizona 520.770.1541
as-az.org
From theUniversityofArizona
Arizona Developmental Disabilities Surveillance Program (ADDSP) publichealth.arizona.edu/research-project/arizona-developmental-disabilitiessurveillance-program-addsp
FromtheCentersforDiseaseControlandPrevention Autism Spectrum Disorder (ASD) cdc.gov/autism
Autism and Developmental Disabilities Monitoring (ADDM) Network
cdc.gov/autism/addm-network
Identifying Autism Among Children: An Easy-Read Summary cdc.gov/ncbddd/autism/addm-community-report/
A Snapshot of Autism Spectrum Disorder in Arizona www.cdc.gov/ncbddd/autism/pdf/Arizona.pdf
For the first time, the ADDM (Autism and Developmental Disabilities Monitoring) Network found that the percentage of 8-year-old Black, Hispanic and Asian or Pacific Islander children identified with ASD was higher than among 8-year-old White children, which was the opposite of previously observed racial and ethnic differences across the ADDM Network.
—Centers for Disease Control and Prevention (March 2023)
young adults on the spectrum with a new Entrepreneurial Training Center. Additionally, we've founded the National Accelerator of Autism Charter Schools (NAACS) to assist teams in other states to establish their own autism-focused charter schools.
When Sammy was diagnosed with autism in 2003, 1 in 150 children were considered to be on the spectrum. Today, the Centers for Disease Control and Prevention (CDC) says the number is now 1 in 36. I am proud that I was able to develop an exceptional educational solution in Arizona that can be replicated nationwide and will provide educational solutions for the growing number of children and young adults with autism.
Diana Diaz-Harrison is the founder and executive director of Arizona Autism CharterSchools (AZACS), Phoenix.
It is vital for our state’s success that every Arizonan has the opportunity to thrive, regardless of their background or circumstances or their zip code.
According to a recent study, Billions to Gain, increasing education after high school for underrepresented groups could lead to $8.7 billion in economic gains for Arizona.
It is time to come together to ensure that every Arizonan has the opportunity to pursue their educational aspirations and contribute to the prosperity of our state.


Join the Everything to Gain movement to support education in Arizona.


BY PAUL PADILLA
Like many other tremendous nonprofit organizations in Arizona, Unlimited Potential was born organically out of necessity. In 1985, a group of parents from South Phoenix saw problems and came together to create a better and brighter future for their children.
This pioneering group of parents quickly realized that if they wanted better for their children, they would first have to start with themselves. So, they did just that. Unlimited Potential began as an organization offering GED and English classes for parents in the South Phoenix community. The mission was simple: to provide better educational opportunities for their families to obtain better jobs.
Today, although Unlimited Potential’s reach and impact has grown considerably, they continue to embrace their roots. According to the group’s website, their mission is “to ignite unity, pride and dignity through education and advocacy.” To fulfill their mission, Unlimited Potential focuses on three main areas: workforce development, environmental justice and healthy living.
The reason Unlimited Potential was created 40 years ago—and why it still exists today— is simple: to serve as a valuable resource for the local community.
One of the most prominent programs within the workforce development area is the Community Health Worker Program. A community health worker serves as a guide and liaison between families and the U.S. health care system.
“The idea is to use or bring people from the community together to learn about health so they can close the gap between health services and social services within the community,” Ana Guzman, director of Community Health at Unlimited Potential, explains.
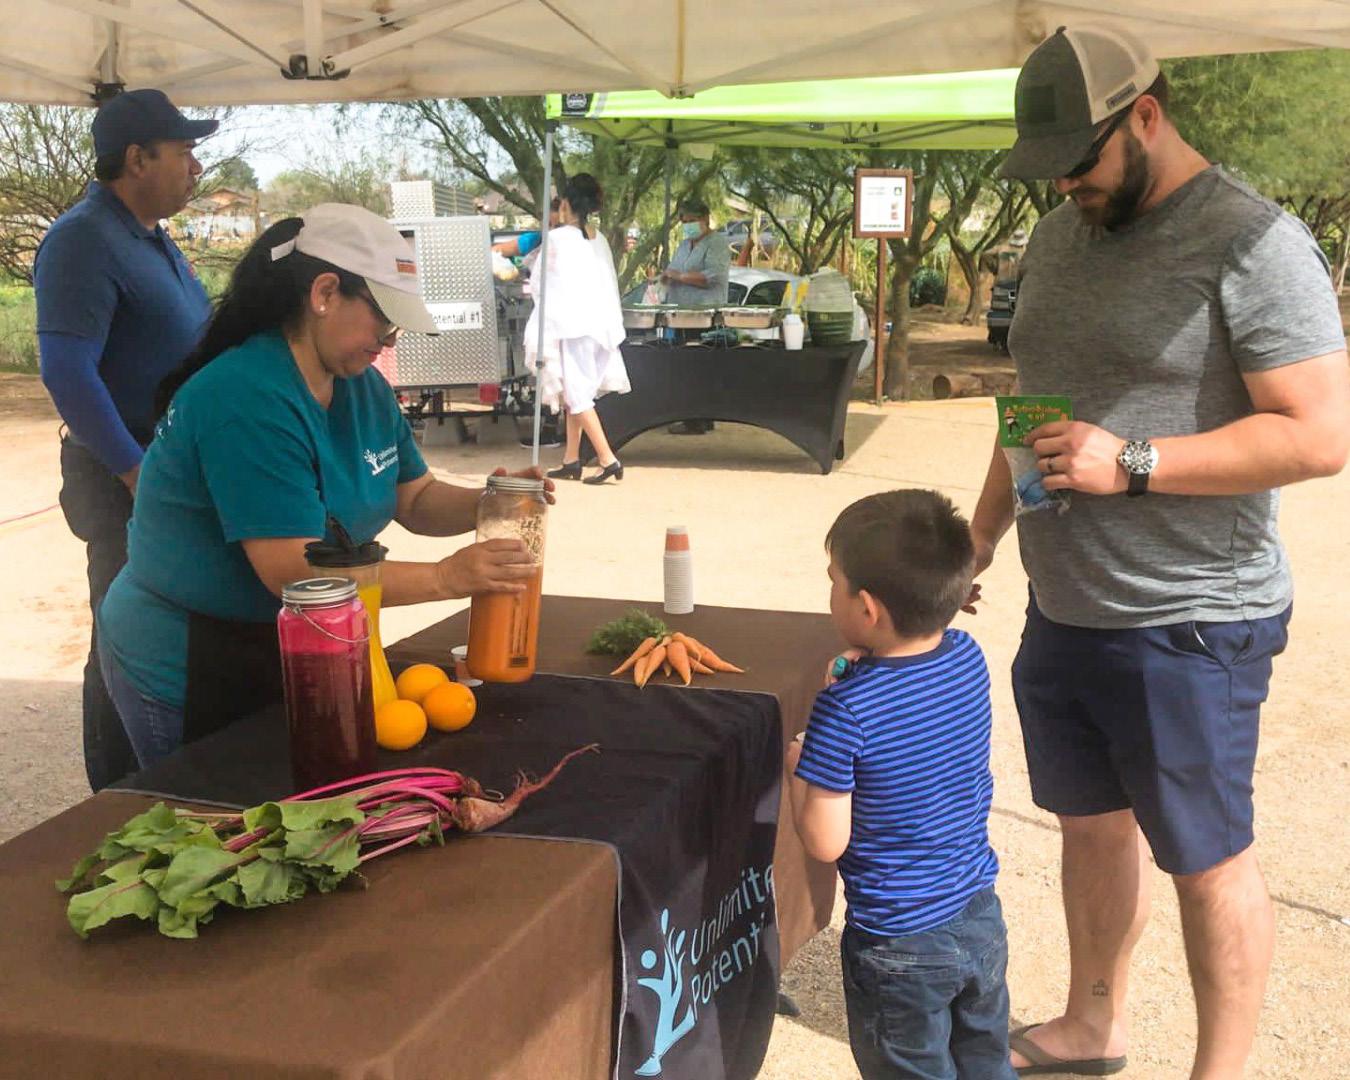
It is critically important work. The U.S. health care system is hard to navigate for anyone with coverage; it can be next to impossible for minority communities, whose cultural differences and language barriers can lead to critical gaps in getting adequate care.
Unlimited Potential offers programs for healthy living that range from prenatal health care to urban farming. The team is currently focusing on preventive care. However, Emma Viera, Unlimited Potential’s executive director, admits that changing a community’s mindset to one focused on preventive care has been a challenge.
“People value the treatment of cancer or they value the treatment of an amputation,” Viera says, “but education and lifestyle changes…engaging with the community and making the link to health? No one values that.”
“We are trying to create a culture of health,” Guzman adds, “because our culture is not used to taking care of themselves. Why [should you wait] until you are really sick? Let’s prevent [it from] going there.”
The current mentality of “sick care” indeed affects our immigrant community because they often must deal with many other issues
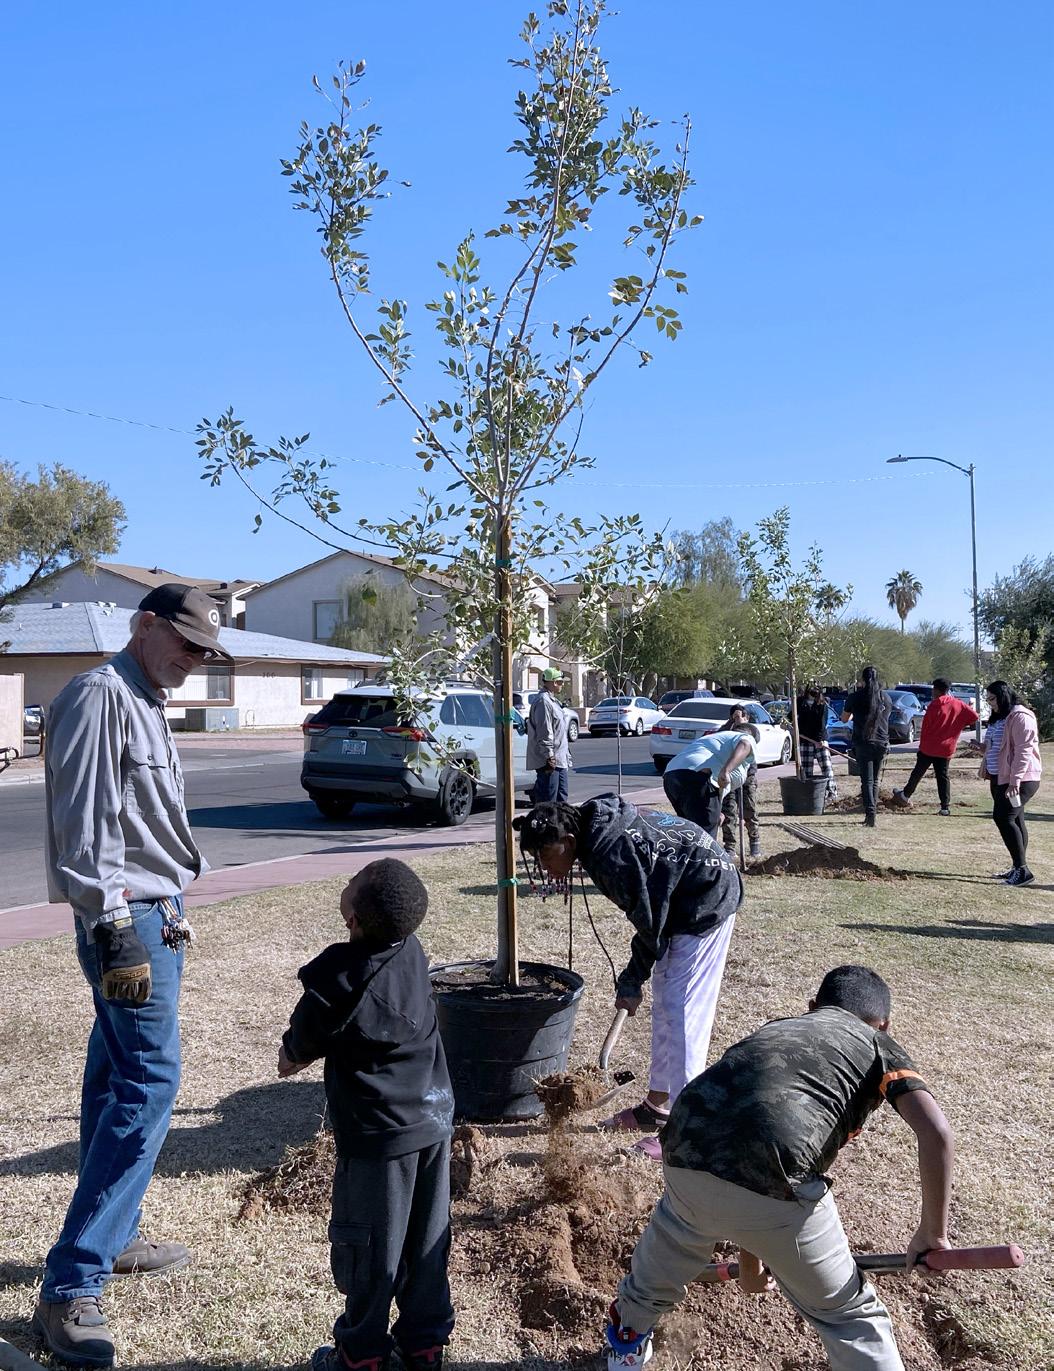
before they can consider personal health. Personal health is a low priority when people must deal with stressors such as high housing costs, expensive groceries and high transportation costs when they often earn lower wages than the average American and are forced to live paycheck to paycheck.
It is an unfortunate reality that causes people to ignore personal health care or address it only when it becomes unavoidable. It also is a problem within our health care system itself: Preventive care is simply not a top priority. However, this is the grim reality we must all face: The more we continue to ignore our health, the more social and economic damage will occur in our communities. Everyone wins when health is a top priority.
UNLIMITED POTENTIAL SEES UNLIMITED POSSIBILITIES WITHIN OUR COMMUNITIES
Unlimited Potential's third focus is environmental justice. In this area, the organization focuses on creating resilient urban environments and spreading knowledge about the critical relationship between the climate and our health. Building trust is key to getting community members on board.
“Really what we do is relationship building,” Tawsha Trahan, director of environmental justice at Unlimited Potential, says.
Unlimited Potential 3146 E. Wier Ave. Phoenix, AZ 85040
602.305.4742
unlimitedpotentialaz.org
PO Box 8814 Phoenix, AZ 85066
FACEBOOK:
@UnlimitedPotentialAZ
INSTAGRAM: @unlimitedpotentialaz
X: @Potential_AZ
“Trust is the glue that holds us together. When you damage that, it’s very hard to repair.”
Unlimited Potential must prove they exist to partner with communities to advocate for a better future. It must produce tangible results to demonstrate genuine intentions and to make positive changes in the community. To do this, Unlimited Potential must serve as a bridge between a community and its local government, advocating for the community and holding the local municipality responsible for fulfilling its commitments.
The reason Unlimited Potential was created 40 years ago—and why it still exists today—is simple: to serve as a valuable resource for the local community. The group knows, however, that it cannot successfully continue to operate without community input.
Guzman succinctly states Unlimited Potential’s mission: “[We use] the wisdom of the community to resolve problems without giving any advice.”
Guzman’s answer is a refreshing approach to problem solving and Unlimited Potential’s track record shows that listening more and commanding less is a winning strategy.
Paul Padilla is the director of market intelligence for the Arizona Hispanic ChamberofCommerce in Phoenix.
BY CRISTI GUEVARA, PH.D.
Arizona is one of the fastest-growing economies in the U.S., boasting a robust workforce of approximately 6.1 million working-age individuals. Among them, Hispanics comprise 38%, predominantly concentrated in Maricopa and Pima counties. In Santa Cruz, Yuma and Greenlee counties, Hispanics comprise 50% and 80% of the population. Across various sectors, Hispanics are notably present in agriculture, construction, hospitality and the food industry.
Despite a significant Hispanic presence in Arizona, only 20% of Hispanics hold high-skill, high-wage, high-demand (H3) jobs, which is 14 points lower than the general Arizona workforce. H3 jobs require advanced skills but are highly desirable because they offer high wages, are in high demand and are less susceptible to automation.
Here are some examples of H3 roles: paralegals, market researchers, dietitians, budget analysts, sales representatives, civil engineers, chefs, quality assurance analysts and logisticians.
Despite a significant Hispanic presence in Arizona, only 20% of Hispanics hold high-skill, high-wage, high-demand (H3) jobs, which is 14 points lower than the general Arizona workforce.

Even where Hispanics have a large presence—in sectors such as agriculture, construction, hospitality and food-related industries— only 22% to 26% of H3 jobs are held by Hispanics. Why?
The current Hispanic educational attainment levels might answer that question:
• only 9.5% of Hispanics in Arizona hold a bachelor’s degree or higher;
• only 21.1% have some college or an associate’s degree and
• the majority only have a high school diploma—or less.
Unfortunately, these statistics are not improving: Currently, only 73% of Hispanic seniors in Arizona graduate from high school and just 31% enroll in a postsecondary institution right after graduation. Unfortunately, these statistics translate to lower lifetime earnings, as shown in Figure 1 on p.120.
Targeted initiatives are crucial to address these challenges and unlock pathways to higher-paying jobs. Here’s an example: A Hispanic food preparation worker, after obtaining a food handler's postsecondary certificate, can advance to a supervisory role in the food and beverage industry. This transition typically results in a 32% median salary increase and a reduced risk of job automation that will ultimately lead to job loss. Similarly, pursuing a culinary
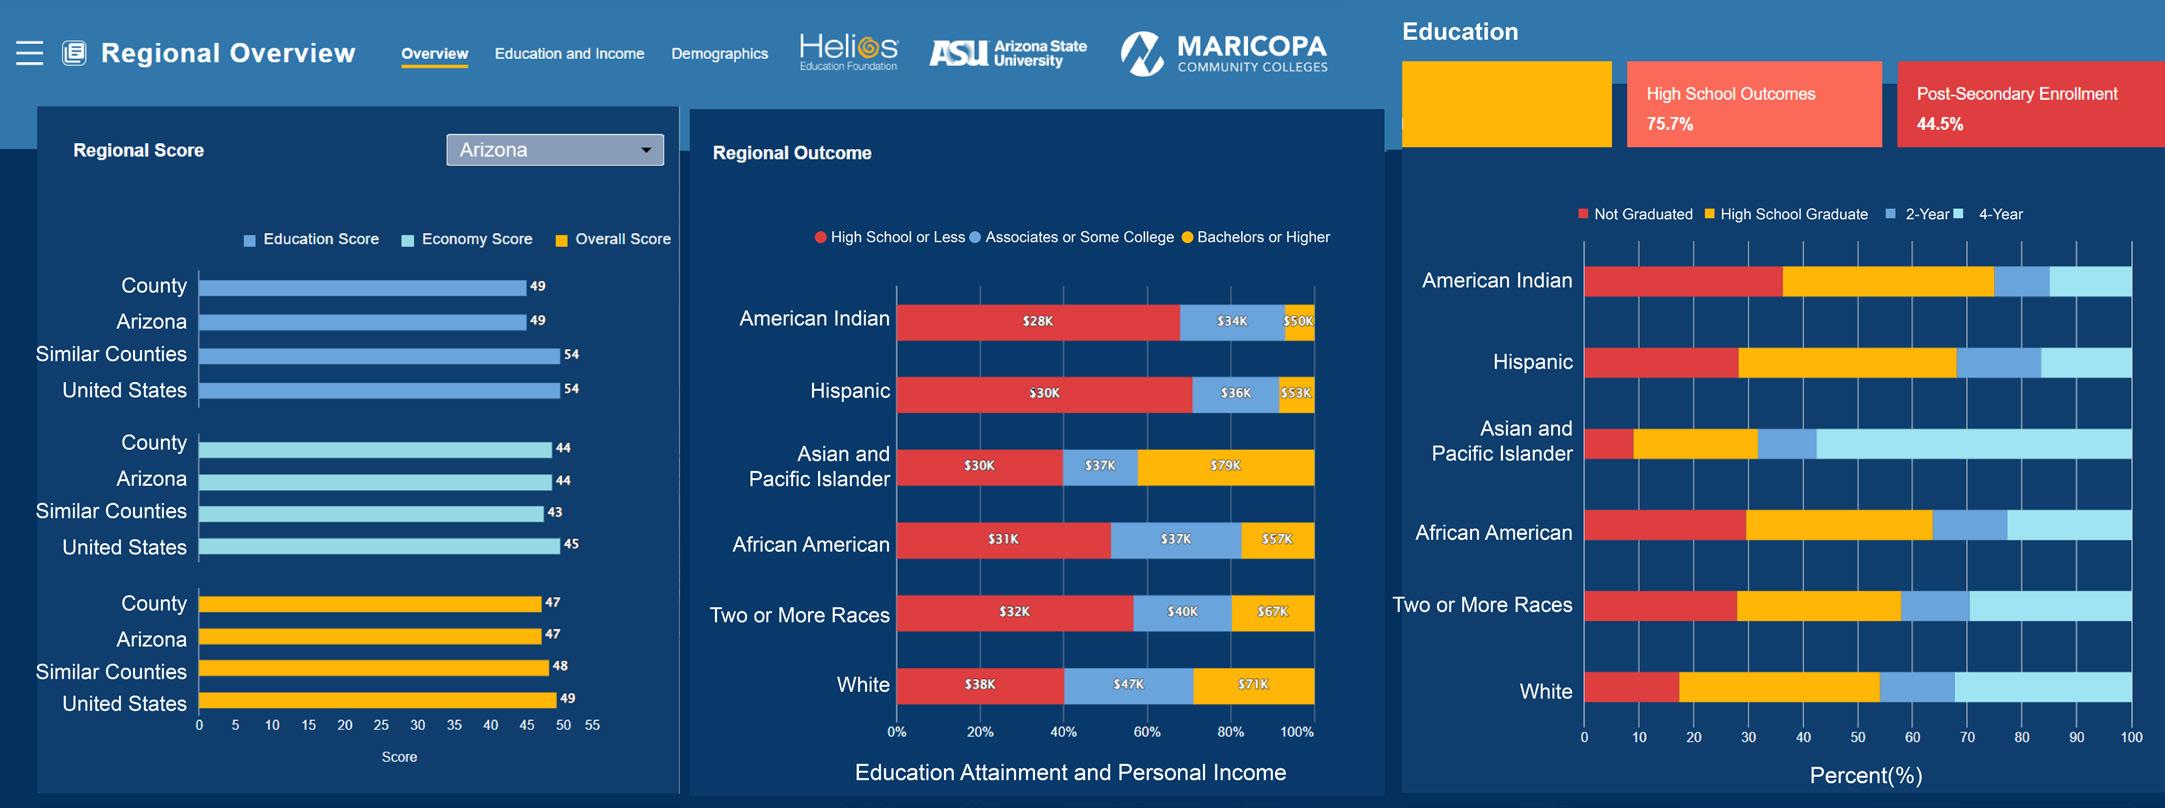
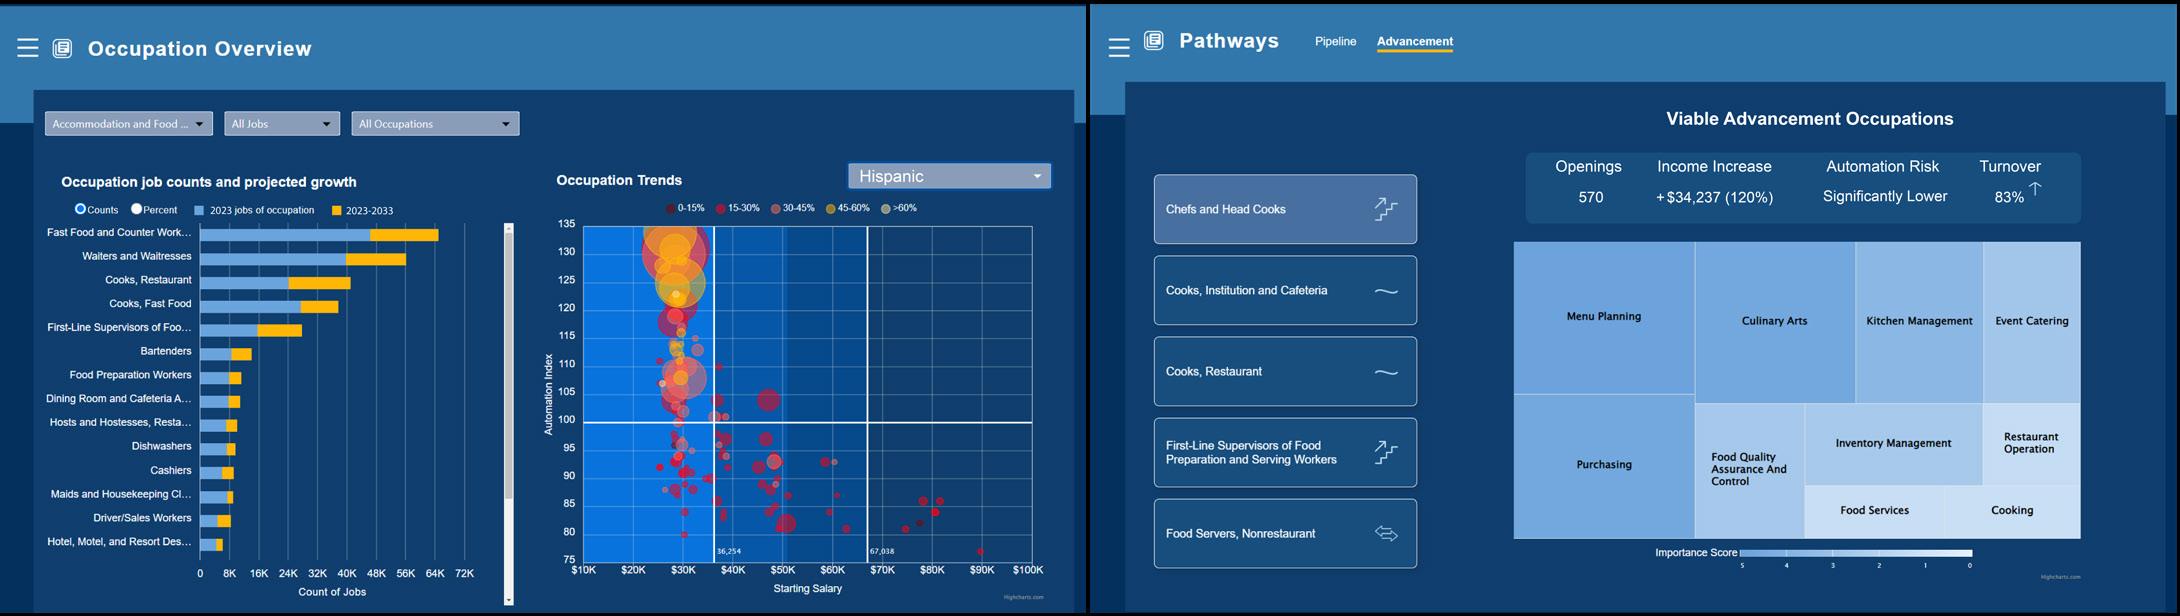
degree can double or even triple their income and lead to a highlypaid position such as a head cook or chef.
Agriculture is an example of an industry dominated by Hispanics. A low-paid farmworker who obtains an agribusiness certificate or associate’s degree can become a first-line supervisor or transition to another industry, which could potentially result in a 45% median income increase. Pursuing a bachelor’s degree in agriculture can lead to roles like agricultural business manager, agricultural operations specialist or agricultural marketer, with income increases ranging from 90% up to 200%.
The ASU Helios Decision Center for Educational Excellence, a partnership between Arizona State University and the Helios Education Foundation, is working to change these outcomes and give all Arizonans greater economic mobility. In March 2024, the Decision Center launched The Arizona Education and Workforce Visualization, which integrates education, economic and labor data to inform strategic decision-making. Figure 2 shows these pathways, customized based on industry, ethnicity and county.
EDUCATION IS THE KEY TO ECONOMIC MOBILITY
The Decision Center’s Personalized Admissions Project also supports college access for underserved students such as Hispanics by sending Arizona public universities admission acceptance letters to qualified 12th graders across Arizona.
This ADMISSIONS project is a response to the legitimate concern that many low-income and first-generation students never get access to college, even if they meet all the entrance requirements. The first pilot program was done in partnership with the Phoenix Union High School District during the 2021—2022 school year and has been expanding ever since to help increase college enrollment rates among low-income and first-generation students. In 2023— 2024, high schools serving more than 50% of the senior students in the state participated and 43% of the letters were mailed to Hispanic students.
The numbers are crystal clear: Education can open the door to increased economic mobility and the ASU Helios Decision Center for Educational Excellence is working hard to do its part to give all Arizonans a pathway to success.
Dr. Cristi Guevara is a senior data science specialist at the ASU Helios Decision CenterforEducational Excellence,Tempe,AZ.
ASU Helios Decision Center for Educational Excellence ASU Fulton Center 300 E University Dr. Tempe, AZ 85281 decisioncenter@asu.edu
Helios Education Foundation 4747 N. 32nd St. Phoenix, AZ 85018 602.381.2260 helios.org
FromtheASUHeliosDecisionCenterforEducational Excellence The Arizona Education and Workforce Visualization decisioncenter.asu.edu/arizona-education-and-workforcevisualization
Personalized Admissions Project decisioncenter.asu.edu/projects/personalizedadmissions
Education after high school is key to a better living and a better life. Arizonans who’ve gone to college and completed a degree program can expect to earn more, enjoy better health, and benefit from greater access to opportunities. This individual prosperity translates to substantial economic returns. Increasing the number of Arizonans with a college education can yield gains that run into the billions.
Efforts and funding that support increased attainment represent an investment in the present and future of our state. Arizona must make getting to and through college a reality for more students, especially Hispanic/Latino students and students from low-income backgrounds.
Arizona Has Billions to Gain
Increasing college enrollment and completion would benefit Arizona immensely. Based on economic models for the high school class of 2022, the charts below highlight the substantial gains that come from enabling more students to participate and succeed in college.
Lifetime Earnings, by Highest Education Level
College education almost certainly causes higher earnings and labormarket trends show that collegeeducated workers are better positioned to prosper in all sectors and regions of the Arizona economy.
Arizonans with a bachelor’s degree contribute $982,680 more in lifetime social gains (i.e., gains related to earnings, health, welfare, and workforce productivity) than a high school graduate.
The fiscal gains—like higher tax revenues and decreased public spending—from increasing college enrollment by 20 percent would be more than double what Arizona allocated for its public universities in the 2022 General Fund budget.
What We Can Do
Increasing college participation and completion rates—and ensuring that Arizona achieves its 60% college attainment goal by 2030—will require bold action by educators, policymakers, and business and community leaders. Key areas of focus include:
• Strengthening the pipeline to college, such as by expanding investment in dual enrollment
• Tackling barriers to getting to and through college, through efforts like the EXCEL Program
• Making college more affordable, for example, by expanding Arizona Promise
Source: Helios Education Foundation and Education Forward Arizona, “Why College Attainment Matters for Arizona” educationforwardarizona.org/wp-content/uploads/2023/03/Helios_EdForwardAZ_Economic-Impact-Report-One-Pager-Digital.pdf
Read more in Helios Education Foundation and Education Forward Arizona’s full report, Billions to Gain


Source: U.S.
nces.ed.gov/pubs2024/2024144.pdf


In 2022, overall school enrollment of young children, as well as public elementary and secondary school enrollment, increased from the prior year but remained lower than before the coronavirus pandemic.
• Between 2012 and 2019, the overall school enrollment rate of 3- to 5-year-olds fuctuated between 59 and 61 percent, before falling to 53 percent in 2021—the data year which largely overlaps with the frst full school year of the coronavirus pandemic.1 In 2022, the rate had rebounded to 59 percent but was still lower than in 2019 (61 percent).
• Between fall 2012 and fall 2019, total public elementary and secondary school enrollment increased by 2 percent (from 49.8 million to 50.8 million students). Total enrollment dropped by 3 percent to 49.4 million students in fall 2020. Total enrollment remained at around 49.4 million students in fall 2021 before rising 0.4 percent to 49.6 million students in fall 2022.
The latest year for which private school enrollment data are available is fall 2021. Private school enrollment in kindergarten through grade 12 (K–12) was 5 percent higher in fall 2021 than in fall 2011 (4.7 million vs. 4.5 million). More recently, private K–12 enrollment was 4.7 million students in both fall 2019 and fall 2021.
At the postsecondary level in the United States, undergraduate enrollment decreased over the last decade, whereas postbaccalaureate enrollment generally increased.
• Between fall 2012 and fall 2022, total undergraduate enrollment in degree-granting postsecondary institutions decreased by 13 percent (from 17.7 million to 15.4 million students). This decrease was driven by an enrollment decrease at 2-year institutions.
• Total enrollment in postbaccalaureate programs increased overall between fall 2012 and fall 2022 (from 2.9 m illion to 3.2 million students), although enrollment was 1 percent lower in fall 2022 than in fall 2021.
The U.S. education system serves a diverse population of students across a variety of school settings. Of the 49.6 million students who were enrolled in public elementary and secondary schools (preK–12) in fall 2022,
• 22.1 million were White;
• 14.4 million were Hispanic;
• 7.4 million were Black;
• 2.7 million were Asian;
• 2.5 million were of Two or more races;
• 449,000 were American Indian/Alaska Native; and
• 182,000 were Pacifc Islander.
1 The 2020 American Community Survey (ACS) data are not available due to collection issues associated with the pandemic. While the 2020 ACS data are not available, data were collected throughout the 12 months of 2021. In the ACS, the school enrollment question asked about enrollment during the previous 3 months. Thus, respondents to the 2021 ACS could be reporting on school enrollment from late 2020 to fall 2021, throughout much of the 2020–21 school year. For additional information, see https://www.census.gov/programs-surveys/acs/about.html and the 2021 questionnaire at https://www.census.gov/programssurveys/acs/about/forms-and-instructions.2021.html#list-tab-9466845
Highlights
The percentage of public school students who attended public charter schools increased from 5 percent in fall 2012 (2.3 million students) to 8 percent in fall 2022 (3.7 million students). The percentage of public school students who were English learners (ELs) increased overall from 9.4 percent in fall 2011 (4.6 million students) to 10.6 percent in fall 2021 (5.3 million students).2 The number of students ages 3–21 served under the Individuals with Disabilities Education Act (IDEA) increased from 6.4 million in school year 2012–13 to 7.5 million in 2022–23.3 Taken as a percentage of total public school enrollment, this equates to an increase from 13 to 15 percent of students.4
The health of an education system is often assessed through indicators of achievement. At the elementary and secondary level in the United States, some measures of student outcomes have improved over time, whereas others have not.
• The average adjusted cohort graduation rate (ACGR) for public high school students increased overall from 80 percent in school year 2011–12 to 87 percent in 2021–22.5, 6
• The overall status dropout rate (i.e., the percentage of 16- to 24-year-olds who are not enrolled in school and have not earned a high school credential) decreased from 7.0 percent in 2012 to 5.3 percent in 2022.7 8
• According to results from the National Assessment of Educational Progress (NAEP) long-term trend (LTT) 2022–23 assessments, the average scores for 13-year-olds declined 4 points in reading and 9 points in mathematics compared with 2019–20. Compared with 2011–12, the average scores declined 7 points in reading and 14 points in mathematics.
In the 2022 Program for International Student Assessment (PISA), out of 81 participating education systems, 5 had higher average reading literacy scores for 15-year-olds than the United States, 25 had higher mathematics literacy scores, and 9 had higher science literacy scores.
In academic year 2021–22, U.S. postsecondary institutions conferred 5.1 million awards, ranging from certifcates below the bachelor’s level to doctor’s degrees. The number of bachelor’s, master’s, and doctor’s degrees conferred increased between 2011–12 and 2021–22, while the number of certifcates and associate’s degrees conferred was about 1.0 million each in both years. At the subbaccalaureate level, the percentage of awards conferred in a career and technical education (CTE) feld decreased from 2011–12 to 2021–22 (from 94 to 85 percent of certifcates, and from 59 to 50 percent of associate’s degrees).9
2 This report looks at the number and percentage of ELs in kindergarten and higher grades over time. Data on ELs include students with a current EL identifcation, but not students who were formerly identifed as ELs and no longer are.
3 Totals include imputations for states for which data were unavailable. See reference tables in the Digest of Education Statistics for more information.
4 The number of students served as a percentage of total enrollment is based on total public school enrollment in preK through grade 12. However, not all students served under IDEA receive education services in public school environments.
5 The ACGR is considered the most accurate measure available for reporting on-time graduation rates. For more information, see Seastrom, M., Chapman, C., Stillwell, R., McGrath, D., Peltola, P., Dinkes, R., and Xu, Z. (2006). User’s Guide to Computing High School Graduation Rates, Volume 2: Technical Evaluation of Proxy Graduation Indicators (NCES 2006-605). U.S. Department of Education. Washington, DC: National Center for Education Statistics. Retrieved February 28, 2023, from https://nces.ed.gov/pubsearch/pubsinfo.asp?pubid=2006605
6 The U.S. average ACGR includes imputed data for states when data are not available. For example, in 2021–22, New Mexico and Oklahoma data were unavailable.
7 A high school credential can be either a diploma or an equivalency credential such as a GED certifcate.
8 The 2020 ACS data are not available due to collection issues associated with the pandemic.
9 Postsecondary CTE felds include agriculture and natural resources; business and marketing; communication and communications technologies; computer and information sciences; consumer services; education; engineering, architecture, and science technologies; health sciences; protective services; public, legal, and social service; or manufacturing, construction, repair, and transportation. See https://nces.ed.gov/surveys/ctes/tables/postsec_tax.asp for the taxonomy used to defne postsecondary CTE categories.
The Condition of Education 2024 | 3
Highlights
The High School Longitudinal Study of 2009 follows a cohort of students over time and provides insights into students’ transition from secondary to postsecondary education. Among fall 2009 ninth-graders who graduated from public high schools by 2013 (hereafter referred to as “2013 public high school graduates”), 39 percent were CTE concentrators who earned 2 or more credits in the same CTE area during high school, and 61 percent were nonconcentrators.10 There were some diferences in the postsecondary outcomes between CTE concentrators and their peers who were nonconcentrators in terms of the type of postsecondary degree completed, whether the degree was in CTE, and the time it took to earn the degree, including the following:
• Among 2013 public high school graduates ever enrolled in postsecondary education by June 2021, a higher percentage of CTE concentrators than nonconcentrators had received an associate’s degree as their highest postsecondary degree (14 vs. 9 percent). Conversely, a lower percentage of CTE concentrators than nonconcentrators had received a bachelor’s or higher degree as their highest postsecondary degree (48 vs. 54 percent) by June 2021.11
• Among 2013 public high school graduates who earned a certifcate as their highest degree by June 2021, some 96 percent of CTE concentrators and 99 percent of nonconcentrators earned their certifcate in a CTE feld. CTE concentrators earned their certifcate in fewer months, on average, than nonconcentrators (28 vs. 40 months).
• Among 2013 public high school graduates who earned an associate’s degree as their highest degree by June 2021, a higher percentage of CTE concentrators than of nonconcentrators earned their degree in a CTE feld (58 vs. 45 percent). There were no measurable diferences between CTE concentrators and nonconcentrators in the average number of months it took to earn their degree.
Educational attainment12 is associated with many long-term life outcomes. For 25- to 34-year-olds in the United States who worked full time, year round (i.e., worked 35 or more hours per week for 50 or more weeks per year), those who had higher educational attainment also had higher median earnings in 2022. For example,
• the median earnings of master’s or higher degree completers ($80,200) were 20 percent higher than the median earnings of bachelor’s degree completers ($66,600); and
• the median earnings of bachelor’s degree completers were 35 percent higher than the median earnings of associate’s degree completers ($49,500).
10 CTE concentrators are defned as those who earned at least 2 credits in the same CTE area during high school, with the CTE areas being agriculture and natural resources; business, fnance, and marketing; communication and communications technologies; computer and information sciences; construction; consumer services; engineering, design, and production; health care; mechanical repair and operation; and public services. Students could concentrate in more than one CTE area if they earned 2 or more credits each in multiple subject areas. Nonconcentrators are those who did not earn at least 2 credits in the same CTE area during high school. Both concentrators and nonconcentrators are limited to students who graduated from high school and had complete transcripts by 2013.
11 Bachelor’s degree or higher includes bachelor’s degrees, master’s degrees, Ph.D.s, M.D.s, law degrees (i.e., J.D.s), and other higher level professional degrees. Under the Carl D. Perkins Career and Technical Education Act of 2006, as amended by the Strengthening Career and Technical Education for the 21st Century Act, bachelor’s degrees are generally not considered to be career and technical education.
12 Levels of educational attainment refer to the highest degree earned.
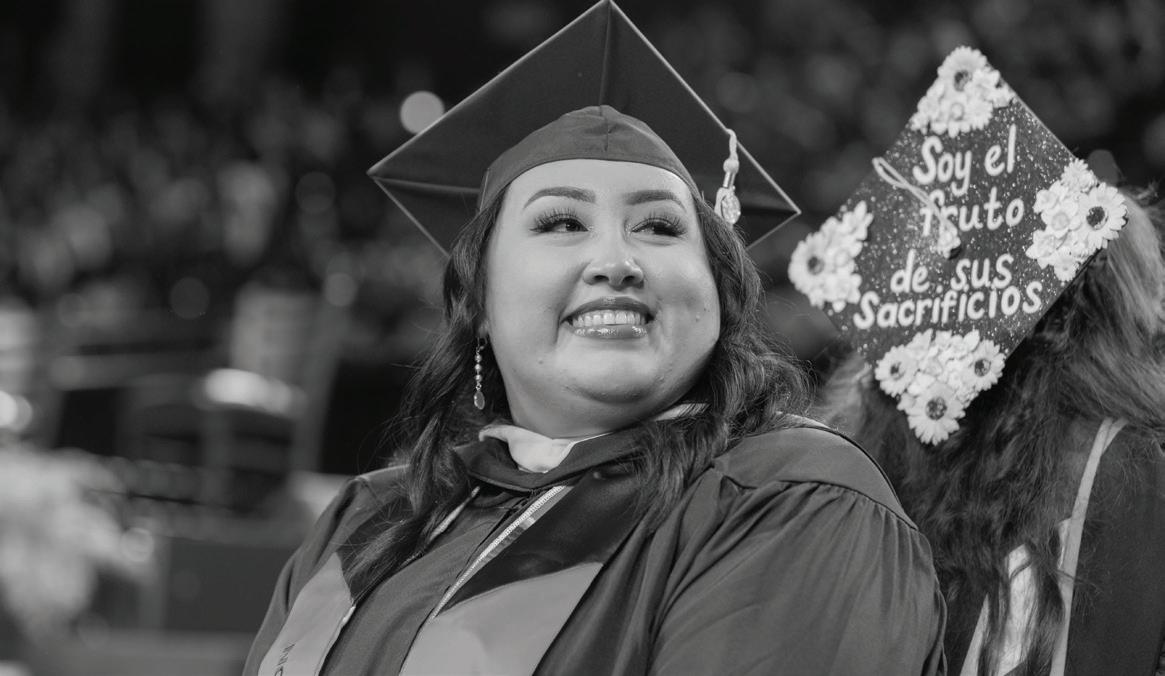
Total Hispanic/Latino student enrollment for Fall 2023
ASU NAU U of A 32,696 6,964 13,438
Degrees received by Hispanic/Latino students in AY 2022-23
ASU NAU U of A 7,330 1,869 2,826
Hispanic/Latino undergraduates who are first generation college students
ASU NAU U of A 50% 62% 53.3%
NAU is one of the top 10 producers in the country of bachelor’s degrees for Hispanic students in fields including public health and hospitality.
700%
The increase from ASU’s first Hispanic Convocation in 1984, which hosted 49 graduates, to the fall 2021 convocation that hosted nearly 400 graduates.
$3 Million
The grant funding the U of A received from the U.S. Department of Education for Project Adelante, the university’s unique program aimed at strengthening retention and degree completion for Hispanic first-generation and low income students.
The Arizona Board of Regents and our public universities –Arizona State University, Northern Arizona University and the University of Arizona – are operating on a simple premise: all Arizonans should benefit from our universities. What began over 150 years ago with a single university has grown to include three institutions with multiple campuses across the state and robust online options.
The board is committed to keeping public higher education within reach of every Arizona family. We continue to grow the Arizona Promise scholarship, which covers the cost of tuition and fees for every qualifying Arizona resident student, and our new tuition structure helps provide financial predictability for students and families.
Arizona’s public universities are all designated by the U.S. Department of Education as Hispanic serving institutions – a mark of distinction for Arizona that is indicative of the universities’ commitment to increasing college going among underrepresented populations in higher education. An HSI is defined as an institution of higher education that has an enrollment of Hispanic undergraduate full-time equivalent students that is at least 25 percent of the student body.
In addition, top research universities from across the U.S. – including Arizona State University and the University of Arizona – formed the Alliance of Hispanic Serving Research Universities, dedicated to increasing opportunities for Hispanics who are underrepresented in higher education. The alliance aims to double the number of Hispanic doctoral students enrolled at alliance universities and increase the number of Hispanic faculty members by 20 percent at alliance universities.
Arizona’s public universities are committed to meeting the needs of increasingly diverse students throughout the state. The universities’ enrollment reflects the diversity of the state’s population and also underscores the universities’ commitment to access.
The Arizona Board of Regents is the governing board for the state’s public universities: Arizona State University, Northern Arizona University, and the University of Arizona.

—The Board’s Promise to Arizona— Increase postsecondary access and attainment for Arizona students; to seek solutions to societal challenges; and to do both while increasing quality, affordability and efficiency.
Source: Arizona Board of Regents, “Enrollment and Degree Facts,” 2024

In the coming years, Latinos are set to become the largest demographic population in Arizona. Simultaneously, Latinos currently make up a large portion of the low-income population of Arizona (ALL In Education, 2023). Considering those two factors coupled together, we can begin to see the potential for a future that lacks economic prosperity and instead we will continue to create larger groups of individuals and families that are grappling with cycles of generational poverty.
This, however, does not have to be Arizona’s destiny, because the reality is that these individuals all have the qualities needed to succeed and lead - our communities hold all the talent and potential. What is missing for these individuals is the opportunity and support to access quality resources and educational environments, high paying jobs and the freedom to succeed.
Our Latino and BIPOC communities have long been denied the simple opportunities and access to be able to succeed at a large scale. From bad policy decisions, to failed and ego-driven leadership, to systemic barriers - our institutions are working the way they have been designed and intended to work. The moment we now have is not only to advocate for better policies, or vote for better leaders - we all can and should be the leaders our students need to improve the institutions meant to support them.
We must shift our thinking about leadership. We should no longer wait for others to step up and lead us, and instead we must recognize that we have the capacity to lead and create solutions with and for our communities. We are the leaders and heroes we need. There is no shortage of talent and potential across our communities, there is only a shortage of opportunity and support. Talent in our communities is equally distributed - opportunity is not.
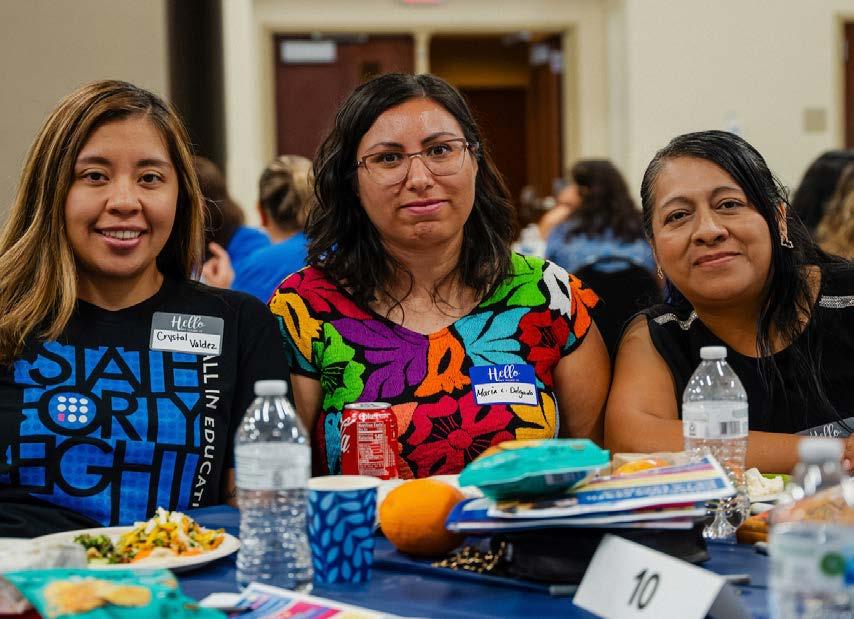
We firmly believe that those closest to the problem are the ones closest to the solution. We must hold this belief to be true as we think of future leaders –who we are hiring, who we are listening to and who we are inviting to the table to help think about solutions to the greatest challenges across our communities. As leaders we hold the responsibility to make decisions knowing that every child possesses untapped potential, waiting to be discovered and nurtured through quality education and bold leadership.

Page 5
In the last four years, ALL In Education has been afforded the privilege of working closely with communities in Arizona from Maricopa, Pima and Yuma counties. Our wildly successful programs in these four years have inspired our team to create spaces and opportunities for our alumni and program participants to further grow, develop and succeed. Graduates from our programs have gone on to obtain full-time roles at their child’s school, others are now serving on boards for both charter and district school systems, and boards of non-profit organizations and others have secured leadership positions in their organizations. The leaders are a catalyst for positive change within their family and community.
We view these accomplishments as more than wins for our programs or organization - this is our mission and theory of change in action - and a win for Arizona. Since the beginning of ALL In Education, we have advocated for an increase in representation across classrooms, boardrooms and positions of power and authority in public education. We believe that until we have leaders that are values-driven and representative of the communities they serve, making the decisions needed to improve student outcomes, then nothing will ever change.
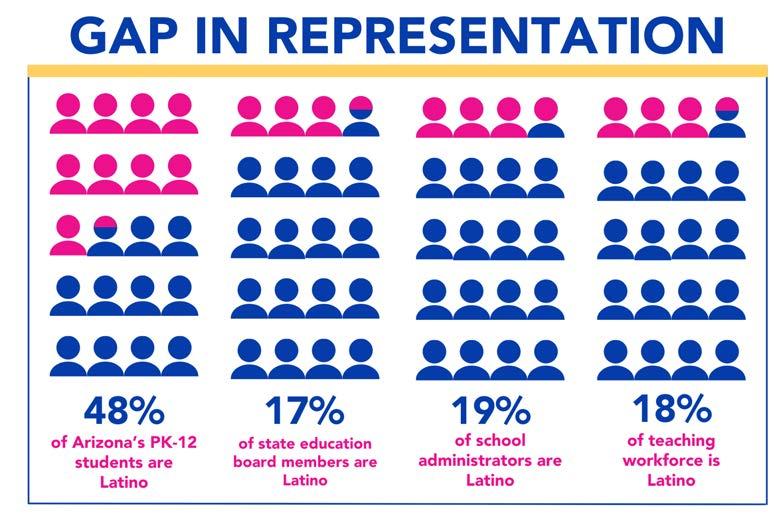
Currently in Arizona, 48% of PK12 students are Latino, but only 17% of state education board members are Latino, including the Arizona State Board of Education, the Arizona State Board for Charter Schools, and the Arizona Board of Regents. Similarly, only 18% of certified teachers and 19% of administrators, in Arizona’s public schools, are Latino. Our commitment is to ensure that we are working towards providing our program participants with the tools and skills to be the powerful, values-driven leaders that will help shift outcomes for students and be responsible for developing systems and institutions that will provide our communities with opportunity and justice.
When systems and institutions begin serving our communities, we will see thriving communities with increased economic mobility, improved civic engagement and greater social cohesion. Arizona should strive to lead in education and in every sector instead of continuously having to play catch up. It is our moment to take inspired action and deliver on the promise that we all have limitless talent and potential to succeed, thrive and live well.
Proud to Support the Arizona Hispanic C hamber of Commerce

BALANCE IT ALL
• BLACK AND HISPANIC HOMEOWNERSHIP RATES HAVE STAYED NEAR OR BELOW 50% FOR THE PAST 18 YEARS
• THE HOMEOWNERSHIP RATE OF HISPANICS WITH HOUSEHOLD INCOMES OF 50% TO 80% OF THE U.S. MEDIAN INCOME WAS STILL LOWER THAN WHITES WITH HOUSEHOLD INCOMES OF 30% OR LOWER OF THE U.S. MEDIAN INCOME
• BETWEEN 2012 AND 2022, THE U.S. HOMEOWNERSHIP RATE FOR INDIVIDUALS UNDER 35 INCREASED BY OVER 2 PERCENTAGE POINTS, THE LARGEST GROWTH THAN ANY OTHER AGE GROUP
• HISPANIC HOMEOWNERS PURCHASE HOMES AT A YOUNGER AGE THAN NONHISPANICS
• IN 2021, BLACKS AND HISPANICS WERE THE MOST BURDENED BY HOUSING COSTS
• MULTIGENERATIONAL HOMES ARE MORE POPULAR AMONG NON-WHITE HOMEBUYERS
• MORE THAN 25% OF HISPANICS BOUGHT MULTIGENERATIONAL HOMES FOR HEALTH AND CAREGIVING PURPOSES
• NATIVE HAWAIIAN OR PACIFIC ISLANDER AND BLACK HOUSEHOLDS ARE MUCH MORE LIKELY THAN WHITE HOUSEHOLDS TO BE RENTERS WITH EXTREMELY LOW INCOMES
• EXTREMELY LOW-INCOME (ELI) RENTERS ARE MORE LIKELY TO BE SENIORS, HOUSEHOLDERS WITH DISABILITIES, HOUSEHOLDERS IN SCHOOL OR SINGLE-ADULT CAREGIVERS
• THE PERCENTAGE OF HOUSEHOLDS WITH COST BURDENS IN ARIZONA IS SLIGHLTY LOWER THAN THE U.S. OVERALL
• THE PHOENIX–MESA–CHANDLER (AZ) AREA IS IN THE TOP FIVE FOR SEVERE SHORTAGES OF AFFORDABLE HOMES FOR EXTREMELY LOW-INCOME HOUSEHOLDS
• BETWEEN 2022 AND 2023, TUCSON HAD A LARGER PERCENTAGE CHANGE THAN PHOENIX–MESA–SCOTTSDALE IN THE MEDIAN PRICE OF A SINGLE-FAMILY HOME
• RESIDENTS IN PHOENIX AND TUCSON HAVE EXPERIENCED LESS AFFORDABLE HOUSING COMPARED TO OTHER RESIDENTS IN THE U.S. OVERALL
• HISPANIC AND BLACK RENTERS IN ARIZONA CAN ONLY AFFORD HOMES BELOW $200K, WELL UNDER THE AFFORDABILITY LEVELS FOR ASIAN AND WHITE RENTERS
142 SPECIAL FEATURE 147 IN FOCUS 151 EXCERPT 150 EXCERPT
This Special Feature courtesy of Univision Communications looks at Hispanics and real estate in Phoenix and Tucson and homeownership and home improvement, which include HVAC repairs and furniture/mattress purchases
If you haven’t owned a home in the past three years, you may quality for one of these programs BY
MARIO NORIEGA
According to UnidosUS, for the last 8 years, Latinos have been the only demographic to experience consistent growth in homeownership rates
In this March 2023 review by Rounds Consulting Group for the League of Arizona Cities and Towns, housing affordability in Arizona was a key issue
BELOW 50% FOR THE PAST 18 YEARS
Sources: U.S. Census Bureau, Homeownership Rate in the United States [RSAHORUSQ156S], retrieved from FRED, Federal Reserve Bank of St. Louis, Jan 30, 2024. fred.stlouisfed.org/series/RSAHORUSQ156S
U.S. Census Bureau, Homeownership Rates by Race and Ethnicity: Non-Hispanic White Alone in the United States [NHWAHORUSQ156N], retrieved from FRED, Federal Reserve Bank of St. Louis, Jan 30, 2024. fred.stlouisfed.org/series/NHWAHORUSQ156N
U.S. Census Bureau, Homeownership Rates by Race and Ethnicity: Hispanic (of Any Race) in the United States [HOLHORUSQ156N], retrieved from FRED, Federal Reserve Bank of St. Louis, Jan 30, 2024. fred.stlouisfed.org/series/HOLHORUSQ156N
U.S. Census Bureau, Homeownership Rates by Race and Ethnicity: Black Alone in the United States [BOAAAHORUSQ156N], retrieved from FRED, Federal Reserve Bank of St. Louis, Jan 30, 2024. fred.stlouisfed.org/series/BOAAAHORUSQ156N
U.S. Census Bureau, Homeownership Rates by Race and Ethnicity: All Other Races: Asian, Native Hawaiian and Pacific Islander Alone in the United States [ANHPIHORUSQ156N], retrieved from FRED, Federal Reserve Bank of St. Louis, Jan 30, 2024. fred.stlouisfed.org/series/ANHPIHORUSQ156N
U.S. Census Bureau, Homeownership Rates by Race and Ethnicity: All Other Races: Total in the United States [AORHORUSQ156N], retrieved from FRED, Federal Reserve Bank of St. Louis, Jan 30, 2024. fred.stlouisfed.org/series/AORHORUSQ156N
BETWEEN 2012 AND 2022, THE U.S. HOMEOWNERSHIP RATE FOR INDIVIDUALS UNDER 35 INCREASED BY
NOTE:
Source:
MORE THAN 25% OF HISPANICS BOUGHT MULTIGENERATIONAL HOMES FOR HEALTH AND CAREGIVING PURPOSES
REASONS HISPANICS PURCHASED MULTIGENERATIONAL U.S. HOMES (2023)
REASONS
HEALTH/CARETAKING OF AGING PARENTS/RELATIVES COST SAVINGS
CHILDREN/RELATIVES OVER 18 MOVING BACK INTO THE HOUSE TO SPEND MORE TIME WITH AGING PARENTS
CHILDREN/RELATIVES OVER 18 NEVER LEFT HOME WANTED A LARGER HOME THAT MULTIPLE INCOMES COULD AFFORD TOGETHER NONE OF THE ABOVE OTHER
Source: National Association of Realtors (NAR), “2024 Snapshot of Race and Home Buying in America,” by Lawrence Yun, Jessica Lautz, Brandi Snowden and Meredith Dunn, February 20, 2024 cdn.nar.realtor/sites/default/files/documents/2024-snapshot-of-race-and-home-buying-in-america-02-20-2024.pdf
NATIVE HAWAIIAN OR PACIFIC ISLANDER AND BLACK HOUSEHOLDS ARE MUCH MORE LIKELY THAN WHITE HOUSEHOLDS TO BE RENTERS WITH EXTREMELY LOW INCOMES
*NOTE: Extremely
THE U.S. (2022)
EXTREMELY LOW-INCOME (ELI*) RENTERS ARE MORE LIKELY TO BE SENIORS, HOUSEHOLDERS WITH DISABILITIES, HOUSEHOLDERS IN SCHOOL OR SINGLE-ADULT CAREGIVERS
THE PHOENIX–MESA–CHANDLER, AZ AREA IS IN THE TOP FIVE FOR SEVERE SHORTAGES OF AFFORDABLE HOMES FOR EXTREMELY LOW-INCOME*
LEAST AND MOST SEVERE SHORTAGES OF AVAILABLE AND AFFORDABLE HOMES
METROPOLITAN AREA
PITTSBURGH, PA
PROVIDENCE–WARWICK, RI–MA
BOSTON–CAMBRIDGE–NEWTON, MA–NH
CINCINNATI, OH–KY–IN CLEVELAND–ELYRIA, OH
RALEIGH–CARY, NC
BUFFALO–CHEEKTOWAGA, NY
NASHVILLE–DAVIDSON–MURFREESBORO–FRANKLIN, TN
MEMPHIS, TN–MS–AR KANSAS CITY, MO–KS
METROPOLITAN AREA
LAS VEGAS–HENDERSON–PARADISE, NV HOUSTON–THE WOODLANDS–SUGAR LAND, TX
DALLAS–FORT WORTH–ARLINGTON, TX ORLANDO–KISSIMMEE–SANFORD, FL
PHOENIX–MESA–CHANDLER, AZ SAN DIEGO–CHULA VISTA–CARLSBAD, CA
RIVERSIDE–SAN BERNARDINO–ONTARIO, CA TAMPA–ST. PETERSBURG–CLEARWATER, FL
LOS ANGELES–LONG BEACH–ANAHEIM, CA AUSTIN–ROUND ROCK–GEORGETOWN, TX
*NOTE: Extremely low-income (ELI): Households with incomes at or below either the federal poverty guideline or 30% of area median income (AMI), whichever is higher.
Source: National Low Income Housing Coalition, “The Gap: A Shortage of Affordable Homes,” March 2024 nlihc.org/gap#summary-table

COURTESY OF
• IN 2021, NEARLY 1/5 OF HISPANICS IN THE U.S. DID NOT HAVE HEALTH INSURANCE COVERAGE
• THE PERCENTAGE OF UNINSURED HISPANICS AGED 18–64 ROSE TO MORE THAN THREE TIMES THAT OF NON-HISPANICS BY 2021
• MEDICARE/CHIP IS THE LARGEST SOURCE OF COVERAGE FOR LATINO KIDS IN ARIZONA
• NUMBER & RATE OF UNINSURED LATINO CHILDREN BY ARIZONA COUNTY (2018)
• HISPANICS AGED 18–29 FIND THE PROCESS TO GET MEDICAL CARE HARDER TO UNDERSTAND THAN OTHER HISPANIC AGE GROUPS
• ABOUT A THIRD OF HISPANIC ADULTS SAY THEY WOULD PREFER A HEALTH CARE
• A GREATER PERCENTAGE OF HISPANIC ADULTS 18+ VS. NON-HISPANICS DID NOT GET
• A GREATER PERCENTAGE OF HISPANIC ADULTS 18+ VS. NON-HISPANICS DID NOT TAKE
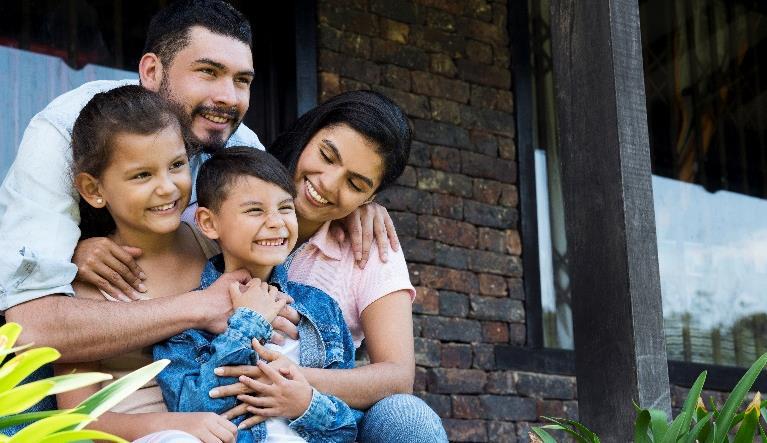
• MEDICATION AS PRESCRIBED TO SAVE MONEY
• A GREATER PERCENTAGE OF HISPANIC ADULTS 18+ VS. NON-HISPANICS WERE OBESE
• LATINO DIABETES RATES HAVE REMAINED CONSTANT OVER THE LAST DECADE IN ARIZONA (2011–2021)
• MENTAL HEALTH IN ARIZONA (FEBRUARY 2021)
• SINCE 2020, ALL RACIAL/ETHNIC GROUPS HAVE EXPERIENCED HIGHER RATES OF MENTAL DISTRESS
• 53% OF HISPANIC ADULTS SAY HEALTH RISKS IN JOBS ARE MAJOR REASON FOR GENERALLY WORSE HEALTH OUTCOMES


• IN 2021, NEARLY 1/5 OF HISPANICS IN THE U.S. DID NOT HAVE HEALTH INSURANCE COVERAGE
• THE PERCENTAGE OF UNINSURED HISPANICS AGED 18–64 ROSE TO MORE THAN THREE TIMES THAT OF NON-HISPANICS BY 2021
• MEDICARE/CHIP IS THE LARGEST SOURCE OF COVERAGE FOR LATINO KIDS IN ARIZONA
• NUMBER & RATE OF UNINSURED LATINO CHILDREN BY ARIZONA COUNTY (2018)
• HISPANICS AGED 18–29 FIND THE PROCESS TO GET MEDICAL CARE HARDER TO UNDERSTAND THAN OTHER HISPANIC AGE GROUPS

• ABOUT A THIRD OF HISPANIC ADULTS SAY THEY WOULD PREFER A HEALTH CARE PROVIDER WHO SPEAKS SPANISH
• A GREATER PERCENTAGE OF HISPANIC ADULTS 18+ VS. NON-HISPANICS DID NOT GET NEEDED MEDICAL CARE DUE TO COST
• A GREATER PERCENTAGE OF HISPANIC ADULTS 18+ VS. NON-HISPANICS DID NOT TAKE

• MEDICATION AS PRESCRIBED TO SAVE MONEY
• A GREATER PERCENTAGE OF HISPANIC ADULTS 18+ VS. NON-HISPANICS WERE OBESE
• LATINO DIABETES RATES HAVE REMAINED CONSTANT OVER THE LAST DECADE IN ARIZONA (2011–2021)
• MENTAL HEALTH IN ARIZONA (FEBRUARY 2021)
• SINCE 2020, ALL RACIAL/ETHNIC GROUPS HAVE EXPERIENCED HIGHER RATES OF MENTAL DISTRESS
• 53% OF HISPANIC ADULTS SAY HEALTH RISKS IN JOBS ARE MAJOR REASON FOR GENERALLY WORSE HEALTH OUTCOMES
• IN 2021, NEARLY 1/5 OF HISPANICS IN THE U.S. DID NOT HAVE HEALTH INSURANCE COVERAGE
THE PERCENTAGE OF UNINSURED HISPANICS AGED 18–64 ROSE TO MORE THAN THREE TIMES THAT OF NON-HISPANICS BY 2021


MEDICARE/CHIP IS THE LARGEST SOURCE OF COVERAGE FOR LATINO KIDS IN ARIZONA
NUMBER & RATE OF UNINSURED LATINO CHILDREN BY ARIZONA COUNTY (2018)
HISPANICS AGED 18–29 FIND THE PROCESS TO GET MEDICAL CARE HARDER TO UNDERSTAND THAN OTHER HISPANIC AGE GROUPS
ABOUT A THIRD OF HISPANIC ADULTS SAY THEY WOULD PREFER A HEALTH CARE PROVIDER WHO SPEAKS SPANISH
A GREATER PERCENTAGE OF HISPANIC ADULTS 18+ VS. NON-HISPANICS DID NOT GET NEEDED MEDICAL CARE DUE TO COST
• A GREATER PERCENTAGE OF HISPANIC ADULTS 18+ VS. NON-HISPANICS DID NOT TAKE
• MEDICATION AS PRESCRIBED TO SAVE MONEY
• A GREATER PERCENTAGE OF HISPANIC ADULTS 18+ VS. NON-HISPANICS WERE OBESE
• LATINO DIABETES RATES HAVE REMAINED CONSTANT OVER THE LAST DECADE IN ARIZONA (2011–2021)
• MENTAL HEALTH IN ARIZONA (FEBRUARY 2021)
SINCE 2020, ALL RACIAL/ETHNIC GROUPS HAVE EXPERIENCED HIGHER RATES OF MENTAL DISTRESS
53% OF HISPANIC ADULTS SAY HEALTH RISKS IN JOBS ARE MAJOR REASON FOR GENERALLY WORSE HEALTH OUTCOMES

113K
• IN 2021, NEARLY 1/5 OF HISPANICS IN THE U.S. DID NOT HAVE HEALTH INSURANCE COVERAGE
• THE PERCENTAGE OF UNINSURED HISPANICS AGED 18–64 ROSE TO MORE THAN THREE TIMES THAT OF NON-HISPANICS BY 2021
• MEDICARE/CHIP IS THE LARGEST SOURCE OF COVERAGE FOR LATINO KIDS IN ARIZONA
• NUMBER & RATE OF UNINSURED LATINO CHILDREN BY ARIZONA COUNTY (2018)
• HISPANICS AGED 18–29 FIND THE PROCESS TO GET MEDICAL CARE HARDER TO UNDERSTAND THAN OTHER HISPANIC AGE GROUPS

• ABOUT A THIRD OF HISPANIC ADULTS SAY THEY WOULD PREFER A HEALTH CARE PROVIDER WHO SPEAKS SPANISH
• A GREATER PERCENTAGE OF HISPANIC ADULTS 18+ VS. NON-HISPANICS DID NOT GET NEEDED MEDICAL CARE DUE TO COST
• A GREATER PERCENTAGE OF HISPANIC ADULTS 18+ VS. NON-HISPANICS DID NOT TAKE
• MEDICATION AS PRESCRIBED TO SAVE MONEY
• A GREATER PERCENTAGE OF HISPANIC ADULTS 18+ VS. NON-HISPANICS WERE OBESE
• LATINO DIABETES RATES HAVE REMAINED CONSTANT OVER THE LAST DECADE IN ARIZONA (2011–2021)
• MENTAL HEALTH IN ARIZONA (FEBRUARY 2021)
• SINCE 2020, ALL RACIAL/ETHNIC GROUPS HAVE EXPERIENCED HIGHER RATES OF MENTAL DISTRESS
• 53% OF HISPANIC ADULTS SAY HEALTH RISKS IN JOBS ARE MAJOR REASON FOR GENERALLY WORSE HEALTH OUTCOMES
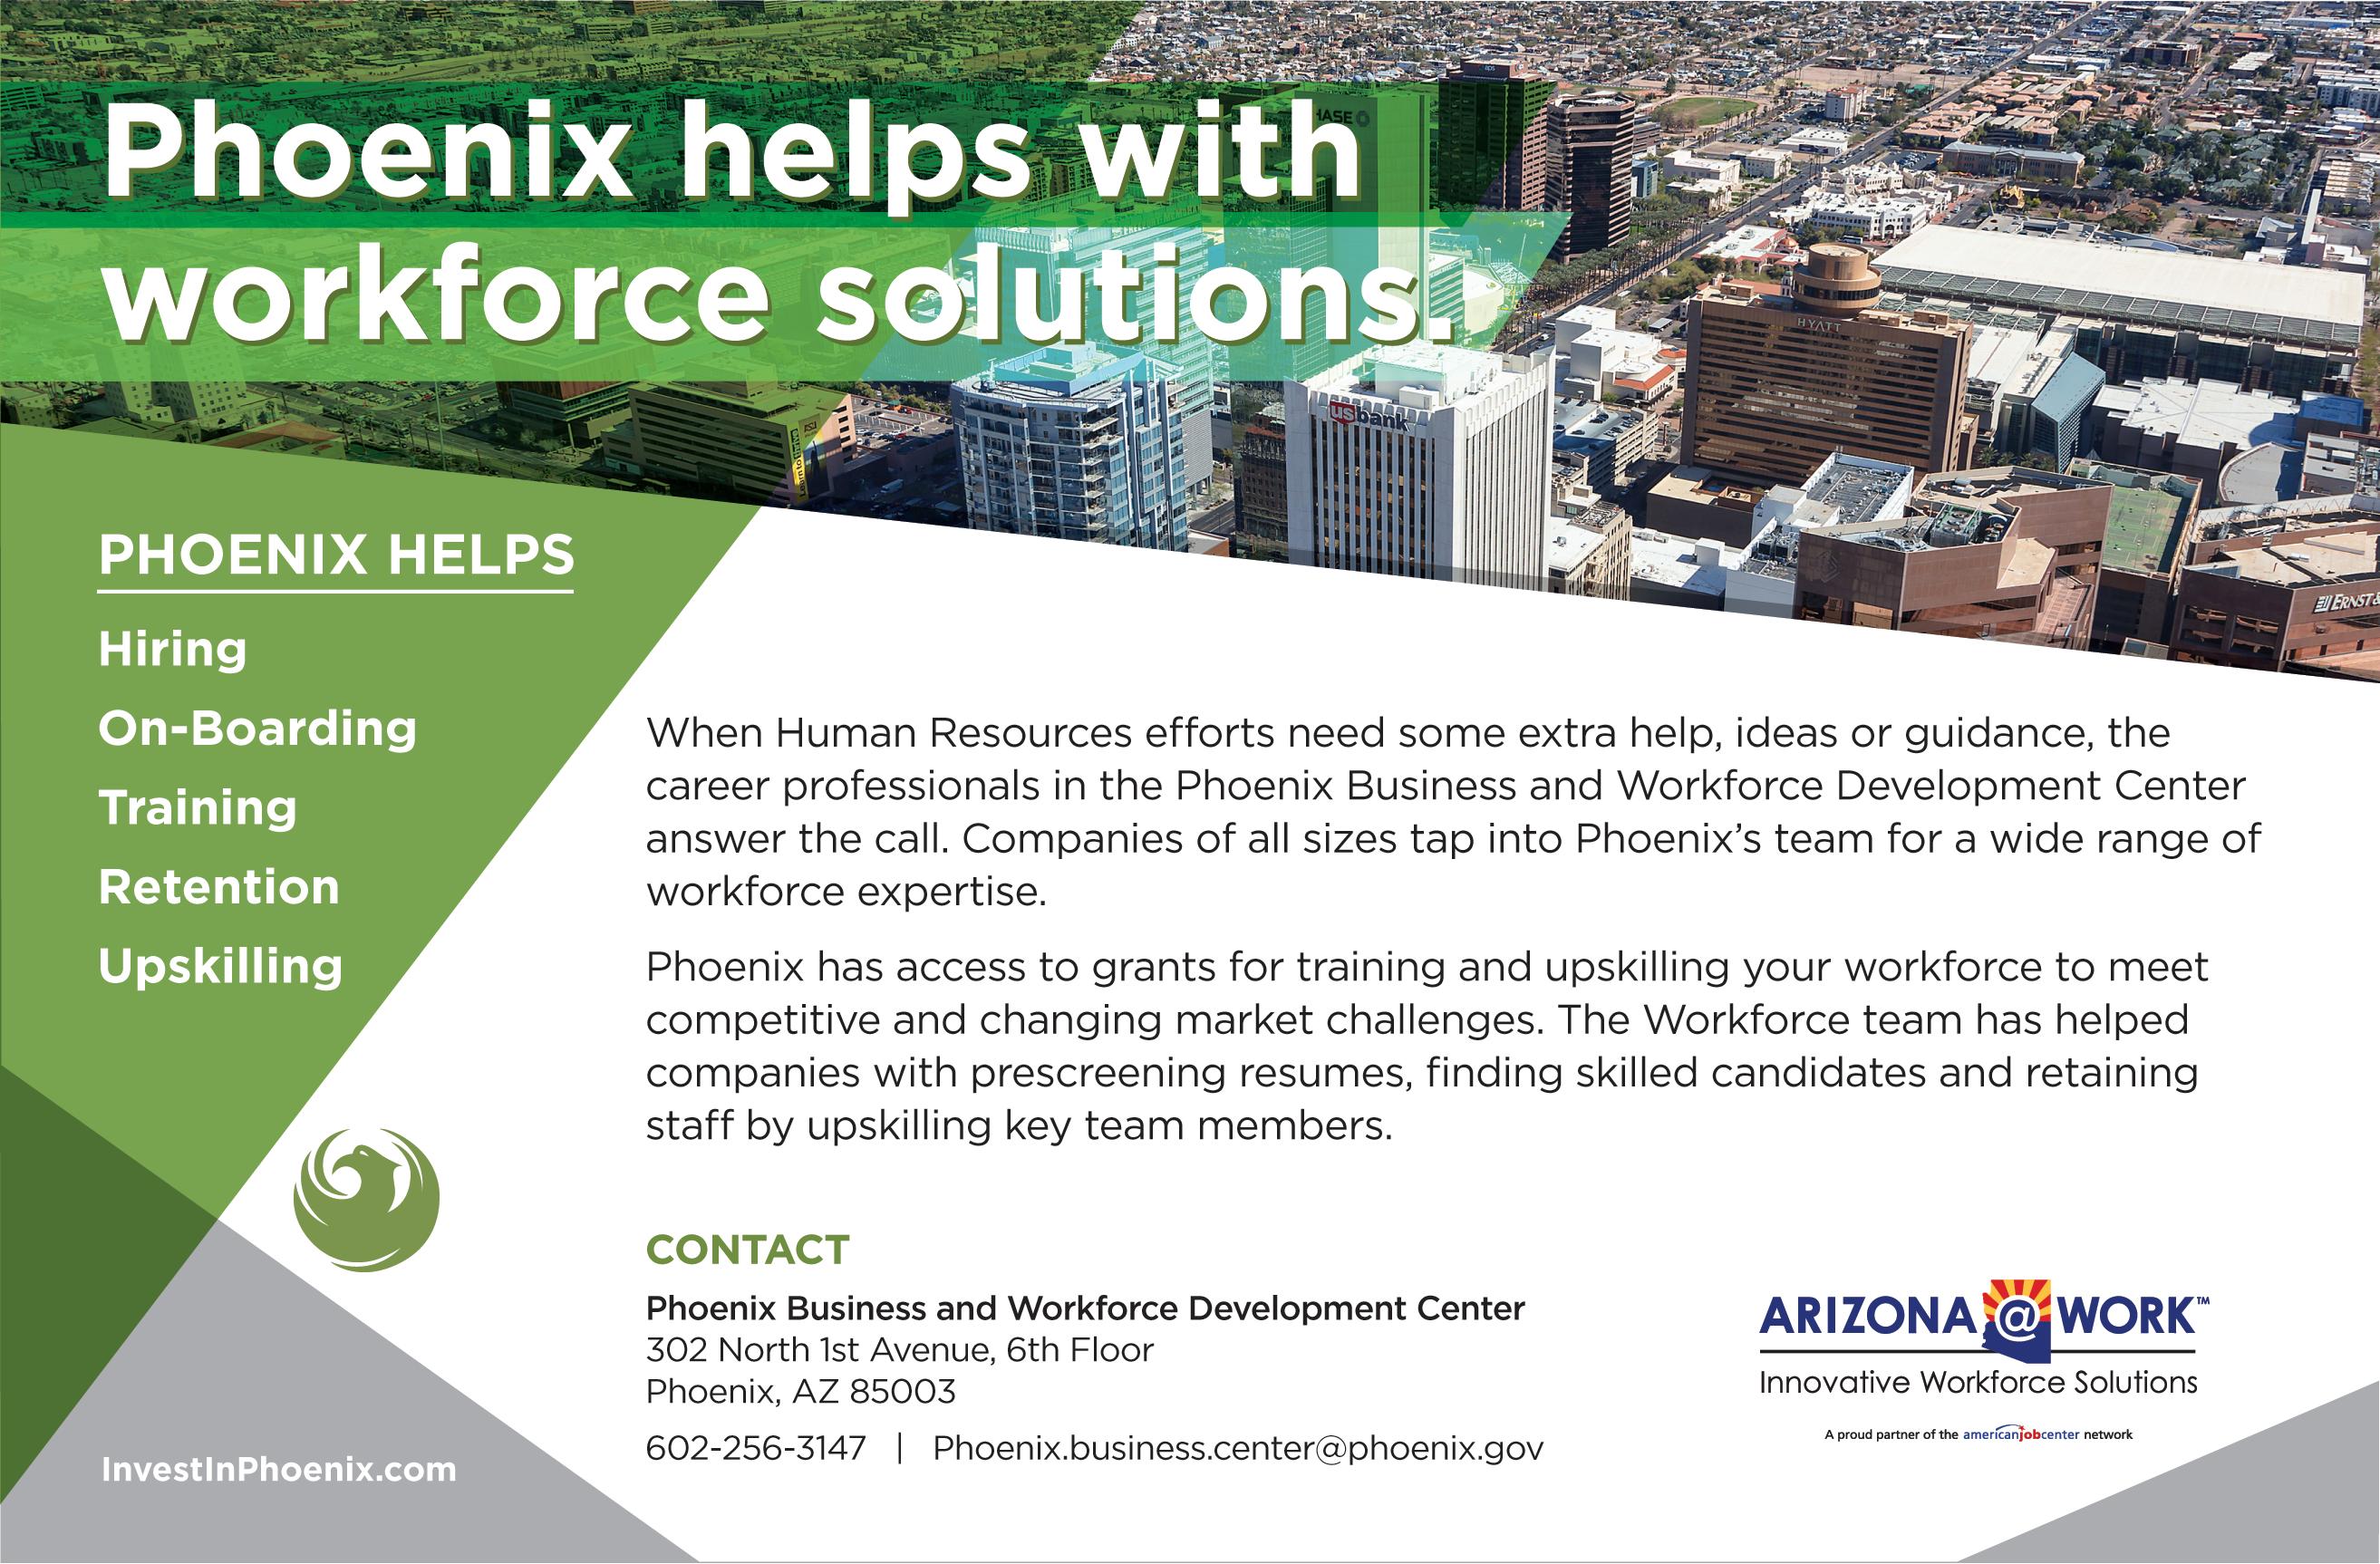

• IN 2021, NEARLY 1/5 OF HISPANICS IN THE U.S. DID NOT HAVE HEALTH INSURANCE COVERAGE
Ifyouhaven’townedahomeinthepastthreeyears, youmayqualifyforoneoftheseprograms
BY MARIO NORIEGA
• THE PERCENTAGE OF UNINSURED HISPANICS AGED 18–64 ROSE TO MORE THAN THREE TIMES THAT OF NON-HISPANICS BY 2021
• MEDICARE/CHIP IS THE LARGEST SOURCE OF COVERAGE FOR LATINO KIDS IN ARIZONA
• NUMBER & RATE OF UNINSURED LATINO CHILDREN BY ARIZONA COUNTY (2018)
• HISPANICS AGED 18–29 FIND THE PROCESS TO GET MEDICAL CARE HARDER TO UNDERSTAND THAN OTHER HISPANIC AGE GROUPS
Contrary to the common belief that buyers need a 20% down payment to purchase a home, the average down payment for firsttime buyers actually is around 6% to 7%, according to the National Association of Realtors.
• ABOUT A THIRD OF HISPANIC ADULTS SAY THEY WOULD PREFER A HEALTH CARE PROVIDER WHO SPEAKS SPANISH
In addition, conventional financing offers 3% down payment options without an income limit. However, this option does require that one person on the loan be a first-time homebuyer. Don’t consider yourself a first-time buyer? If you haven’t owned a home in the past three years, you might still qualify.
• A GREATER PERCENTAGE OF HISPANIC ADULTS 18+ VS. NON-HISPANICS DID NOT GET NEEDED MEDICAL CARE DUE TO COST

• A GREATER PERCENTAGE OF HISPANIC ADULTS 18+ VS. NON-HISPANICS DID NOT TAKE
• MEDICATION AS PRESCRIBED TO SAVE MONEY
• A GREATER PERCENTAGE OF HISPANIC ADULTS 18+ VS. NON-HISPANICS WERE OBESE
There also are programs that allow for lower down payments on mortgage products for certain borrowers. Down payment assistance programs, many focused on first-time homebuyers, can help lower the initial expense of the down payment and closing costs and help more families become homeowners.
• LATINO DIABETES RATES HAVE REMAINED CONSTANT OVER THE LAST DECADE IN ARIZONA (2011–2021)
• MENTAL HEALTH IN ARIZONA (FEBRUARY 2021)
• SINCE 2020, ALL RACIAL/ETHNIC GROUPS HAVE EXPERIENCED HIGHER RATES OF MENTAL DISTRESS
• 53% OF HISPANIC ADULTS SAY HEALTH RISKS IN JOBS ARE MAJOR REASON FOR GENERALLY WORSE HEALTH OUTCOMES
The Federal Housing Administration (FHA) offers governmentbacked loans with easier requirements for first-time buyers, those with less-than-perfect credit scores or limited funds. FHA loans typically require down payments as low as 3.5%, mitigating the risk for lenders and offering favorable terms for borrowers.
For veterans buying their first homes, the U.S. Department of Veterans Affairs (VA) offers a program to support them, active-duty service members and eligible surviving spouses with favorable terms, no down payment requirements, competitive interest rates

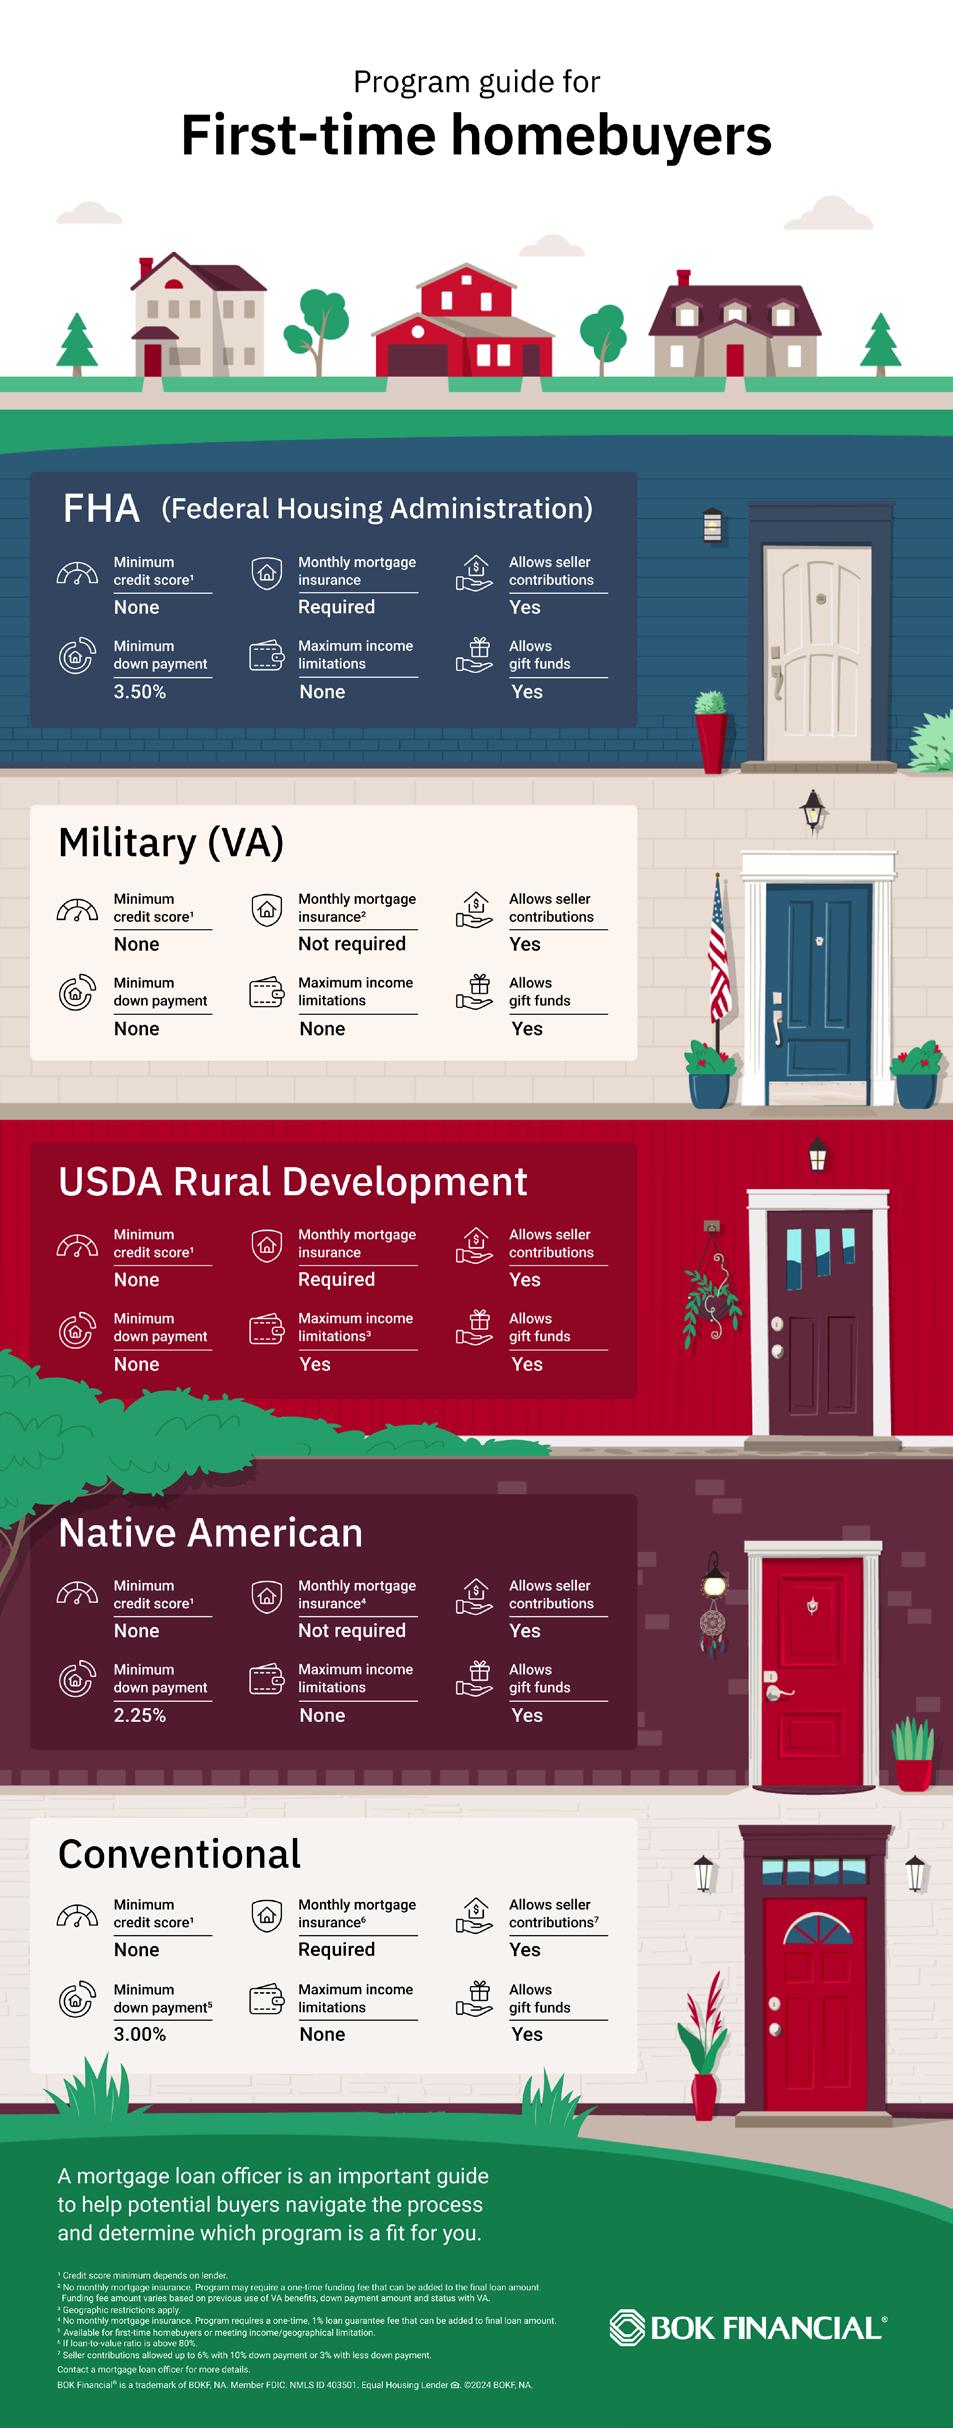
and limited closing costs. This program is designed to help eligible individuals purchase homes even with a limited credit history or a low credit score.
IN 2021, NEARLY 1/5 OF HISPANICS IN THE U.S. DID NOT HAVE HEALTH INSURANCE
The Native American Home Loan Guarantee Program assists Native Americans who may face barriers to traditional financing. Benefits include low down payments, competitive interest rates and flexible credit requirements for homes on or off tribal lands.
THE PERCENTAGE OF UNINSURED HISPANICS AGED 18–64 ROSE TO MORE THAN THREE TIMES THAT OF NON-HISPANICS BY 2021
MEDICARE/CHIP IS THE LARGEST SOURCE OF COVERAGE FOR LATINO KIDS IN ARIZONA
For homebuyers in rural areas, the U.S. Department of Agriculture’s Rural Development Division offers affordable financing options like
NUMBER & RATE OF UNINSURED LATINO CHILDREN BY ARIZONA COUNTY (2018)
HISPANICS AGED 18–29 FIND THE PROCESS TO GET MEDICAL CARE HARDER TO UNDERSTAND THAN OTHER HISPANIC AGE GROUPS
ABOUT A THIRD OF HISPANIC ADULTS SAY THEY WOULD PREFER A HEALTH CARE PROVIDER WHO SPEAKS SPANISH
A GREATER PERCENTAGE OF HISPANIC ADULTS 18+ VS. NON-HISPANICS DID NOT GET NEEDED MEDICAL CARE DUE TO COST
A GREATER PERCENTAGE OF HISPANIC ADULTS 18+ VS. NON-HISPANICS DID NOT TAKE
MEDICATION AS PRESCRIBED TO SAVE MONEY
A GREATER PERCENTAGE OF HISPANIC ADULTS 18+ VS. NON-HISPANICS WERE OBESE
LATINO DIABETES RATES HAVE REMAINED CONSTANT OVER THE LAST DECADE IN ARIZONA (2011–2021)
MENTAL HEALTH IN ARIZONA (FEBRUARY 2021)
SINCE 2020, ALL RACIAL/ETHNIC GROUPS HAVE EXPERIENCED HIGHER RATES OF
53% OF HISPANIC ADULTS SAY HEALTH RISKS IN JOBS ARE MAJOR REASON FOR GENERALLY WORSE HEALTH OUTCOMES
BOK Financial Mortgage has a limited-time offer of $3,000 off the closing costs for a home purchase through Dec. 31, 2024. This credit cannot be combined with other offers and the subject property must be an owneroccupied primary residence located within the county limits of Maricopa County (based off legal description; mailing addresses do not apply)/ multiunit, second home vacation home or investment properties are ineligible. All loans are subject to credit approval.
bokfinancial.com/personal/products-and-services/loansand-lines-of-credit/home-loans/mortgages
FIRST-TIME ARIZONA HOMEBUYERS CAN GET DOWN PAYMENT SUPPORT
the Single Family Housing Guaranteed Loan Program and the Direct Loan Program. These include competitive interest rates, zero down payment options and flexible credit requirements, to increase homeownership opportunities in underserved communities.
• IN 2021, NEARLY 1/5 OF HISPANICS IN THE U.S. DID NOT HAVE HEALTH INSURANCE COVERAGE
BOK Financial 901 N. Dobson Rd. Mesa, AZ 85201
• THE PERCENTAGE OF UNINSURED HISPANICS AGED 18–64 ROSE TO MORE THAN THREE TIMES THAT OF NON-HISPANICS BY 2021
More than 2,000 down payment assistance programs are available nationwide, most of which are city, county or state specific. These programs help eligible homebuyers fund their down payment or closing costs. Local, state and federal housing authorities offer bond programs for qualified single-family residential mortgage loans. These are typically available to lowand moderate-income borrowers at below-market interest rates and favorable terms.
480.835.3040 bokfinancial.com
• MEDICARE/CHIP IS THE LARGEST SOURCE OF COVERAGE FOR LATINO KIDS IN ARIZONA
• NUMBER & RATE OF UNINSURED LATINO CHILDREN BY ARIZONA COUNTY (2018)
FromtheArizonaDepartmentofHousing Governor Hobbs’ Arizona is Home housing.az.gov/general-public/programs-for-homebuyers
• HISPANICS AGED 18–29 FIND THE PROCESS TO GET MEDICAL CARE HARDER TO UNDERSTAND THAN OTHER HISPANIC AGE GROUPS
• ABOUT A THIRD OF HISPANIC ADULTS SAY THEY WOULD PREFER A HEALTH CARE PROVIDER WHO SPEAKS SPANISH
From TIME Stamped What is the Average Down Payment on a House in 2024? time.com/personal-finance/article/average-down-paymenton-a-house
• A GREATER PERCENTAGE OF HISPANIC ADULTS 18+ VS. NON-HISPANICS DID NOT GET NEEDED MEDICAL CARE DUE TO COST
Conventional mortgage loans, provided by banks or credit unions, are not backed by government programs. These loans are granted based on a borrower’s creditworthiness and ability to repay, typically requiring a credit score of 620 or higher and a steady income. Down payments range from 3% to 20% of a home’s purchase price, with fewer restrictions and more variety of terms than government-backed loans.
• A GREATER PERCENTAGE OF HISPANIC ADULTS 18+ VS. NON-HISPANICS DID NOT TAKE
FromBOKFinancial’sTheStatement Navigating today’s market as a first-time homebuyer
• MEDICATION AS PRESCRIBED TO SAVE MONEY
thestatement.bokf.com/articles/2023/04/navigatingtodays-market-as-a-first-time-homebuyer
• A GREATER PERCENTAGE OF HISPANIC ADULTS 18+ VS. NON-HISPANICS WERE OBESE
FromtheU.S.DepartmentofVeteranAffairs VA home loan types va.gov/housing-assistance/home-loans/loan-types
• LATINO DIABETES RATES HAVE REMAINED CONSTANT OVER THE LAST DECADE IN ARIZONA (2011–2021)
• MENTAL HEALTH IN ARIZONA (FEBRUARY 2021)
• SINCE 2020, ALL RACIAL/ETHNIC GROUPS HAVE EXPERIENCED HIGHER RATES OF MENTAL DISTRESS
Consult a local loan officer to explore your options. Many loans offer flexible funding for down payments and closing costs, which can come from multiple sources, including gifts, down payment assistance or bond programs, with no minimum personal funds required.
FromtheU.S.DepartmentofHousingandUrbanDevelopment Let FHA Loans Help You hud.gov/buying/loans
Section 184 Indian Housing Loan Guarantee Program hud.gov/section184
• 53% OF HISPANIC ADULTS SAY HEALTH RISKS IN JOBS ARE MAJOR REASON FOR GENERALLY WORSE HEALTH OUTCOMES
FromtheU.S.DepartmentofAgriculture
Single Family Housing Direct Home Loans
rd.usda.gov/programs-services/single-family-housingprograms/single-family-housing-direct-home-loans
Mario Noriega is a community mortgage banker based in Mesa, AZ with morethan 15years inthe lending industry, specializing in down payment assistance. BOK Financial Mortgage® is a trademark of BOKF,NA. MemberFDIC. EqualHousingLender.©2024BOKF,NA.
Single Family Housing Guaranteed Loan Program
rd.usda.gov/programs-services/single-family-housingprograms/single-family-housing-guaranteed-loan-program
UnidosUS is transforming the economic trajectory of Latino families by removing barriers and increasing opportunities to enable the creation of create 4 million new Latino homeowners by 2030.
LATINOS BELIEVE IN THE POWER OF HOMEOWNERSHIP
Latinos value homeownership because it provides stability for their families, improves access to opportunities, and builds inter-generational wealth.
• IN 2021, NEARLY 1/5 OF HISPANICS IN THE U.S. DID NOT HAVE HEALTH INSURANCE COVERAGE
• Homeownership remains the primary driver of household wealth.
• THE PERCENTAGE OF UNINSURED HISPANICS AGED 18–64 ROSE TO MORE THAN THREE TIMES THAT OF NON-HISPANICS BY 2021
o Latino households have one-fifth the wealth of white households according to the Federal Reserve Bank of St. Louis, but according to the Hispanic Wealth Project, Latino homeowners have 28x the wealth of Latino renters.
• MEDICARE/CHIP IS THE LARGEST SOURCE OF COVERAGE FOR LATINO KIDS IN ARIZONA
• For the last eight years, Latinos have consistently increased their homeownership rate (NAHREP).
• NUMBER & RATE OF UNINSURED LATINO CHILDREN BY ARIZONA COUNTY (2018)
• Over the next 20 years, the Urban Institute forecasts that Latinos will be 70% of net new homeowners and key to the future success of our nation’s housing market.
BARRIERS ARE PREVENTING GREATER PROGRESS
• HISPANICS AGED 18–29 FIND THE PROCESS TO GET MEDICAL CARE HARDER TO UNDERSTAND THAN OTHER HISPANIC AGE GROUPS
Systemic barriers deny Latinos full access to achieve their goals of homeownership.
• The Federal Reserve Bank of St. Louis reports that in 2022, the Latino homeownership rate was 48.7%, compared to 76.6% for white homeownership.
• ABOUT A THIRD OF HISPANIC ADULTS SAY THEY WOULD PREFER A HEALTH CARE PROVIDER WHO SPEAKS SPANISH
• A 2023 poll of Latino voters by UnidosUS revealed that most Latinos are concerned about the cost of living driven by the high cost of housing, with most saying they are considering relocation due to lack of affordable housing.
• A GREATER PERCENTAGE OF HISPANIC ADULTS 18+ VS. NON-HISPANICS DID NOT GET NEEDED MEDICAL CARE DUE TO COST
• In 2021, over one in three Latino renters reported not having enough savings for a down payment as their primary reason for not entering the market, according to the Hispanic Wealth Project.
• A GREATER PERCENTAGE OF HISPANIC ADULTS 18+ VS. NON-HISPANICS DID NOT TAKE
• Latinos have, on average, higher debt-to-income ratios than white mortgage applicants, due in part to a higher concentration of Latinos in lower-paid employment sectors and residence in high-cost markets.
• MEDICATION AS PRESCRIBED TO SAVE MONEY
• According to the FDIC, Hispanics experience higher loan denial rates and higher interest rates when approved, than whites, even when controlling for credit score, loan-to-value, and debt-to-income ratios.
• A GREATER PERCENTAGE OF HISPANIC ADULTS 18+ VS. NON-HISPANICS WERE OBESE
• LATINO DIABETES RATES HAVE REMAINED CONSTANT OVER THE LAST DECADE IN ARIZONA (2011–2021)
We’re leveraging our expertise in policy, communications, research and the UnidosUS Affiliate network to increase homebuyer readiness, expand access to credit, increase the supply of affordable homes, and protect inter-generational wealth by:
• MENTAL HEALTH IN ARIZONA (FEBRUARY 2021)
1. Investing in community-based organizations that are building affordable homes for first-time home buyers and educating consumers on their homeownership journey.
• SINCE 2020, ALL RACIAL/ETHNIC GROUPS HAVE EXPERIENCED HIGHER RATES OF MENTAL DISTRESS
2. Sponsoring research on Latino homeownership to inform better public policies and market practices.
4. Elevating the voice and perspective of Latino homebuyers and owners to inspire and influence action.
5. Advancing a federal and state policy agenda to increase opportunities and remove unnecessary barriers to homeownership for Latino families.
• 53% OF HISPANIC ADULTS SAY HEALTH RISKS IN JOBS ARE MAJOR REASON FOR GENERALLY WORSE HEALTH OUTCOMES
For additional information, visit unidosus.org/homeownership.
UnidosUS is a nonprofit, nonpartisan organization that serves as the nation’s largest Hispanic civil rights and advocacy organization. Since 1968, we have challenged the social, economic, and political barriers that affect Latinos through our unique combination of expert research, advocacy, programs, and an Affiliate Network of nearly 300 community-based organizations across the United States and Puerto Rico. We believe in an America where economic, political, and social progress is a reality for all Latinos, and we collaborate across communities to achieve it.
For more information on UnidosUS, visit www.unidosus.org or follow us on Facebook, Instagram, LinkedIn and X
As of 5.1.24
Source: UnidosUS, “Home Ownership Means Equity,” 2024 unidosus.org/homeownership/
THE PERCENTAGE OF UNINSURED HISPANICS AGED 18–64 ROSE TO MORE THAN THREE
MEDICARE/CHIP IS THE LARGEST SOURCE OF COVERAGE FOR LATINO KIDS IN ARIZONA
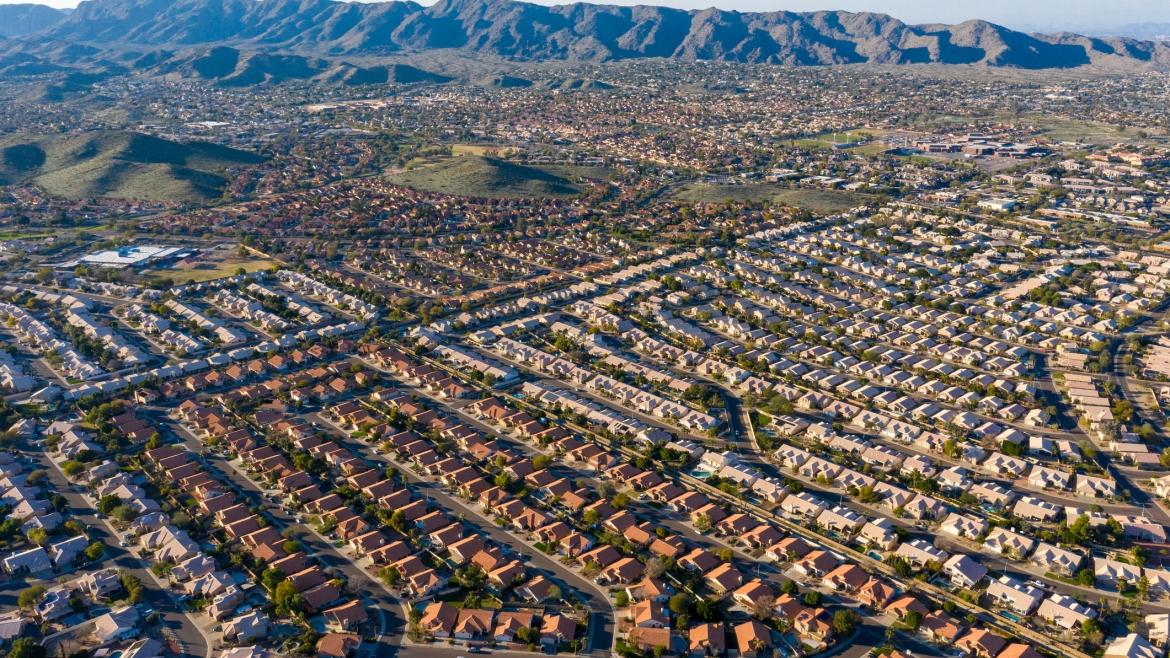
• NUMBER & RATE OF UNINSURED LATINO CHILDREN BY ARIZONA COUNTY (2018)
• HISPANICS AGED
• ABOUT A THIRD OF HISPANIC ADULTS SAY THEY WOULD PREFER A HEALTH CARE PROVIDER WHO SPEAKS SPANISH
• A GREATER PERCENTAGE OF HISPANIC ADULTS 18+ VS. NON-HISPANICS DID NOT GET NEEDED MEDICAL CARE DUE TO COST
• A GREATER PERCENTAGE OF HISPANIC ADULTS 18+ VS. NON-HISPANICS DID NOT TAKE
• MEDICATION AS PRESCRIBED TO SAVE MONEY
• A GREATER PERCENTAGE OF HISPANIC ADULTS 18+ VS. NON-HISPANICS WERE OBESE
• LATINO DIABETES RATES HAVE REMAINED CONSTANT OVER THE LAST DECADE IN ARIZONA (2011–2021)
Prepared for:
• MENTAL HEALTH IN ARIZONA (FEBRUARY 2021)
• SINCE 2020, ALL RACIAL/ETHNIC GROUPS HAVE EXPERIENCED HIGHER RATES OF MENTAL DISTRESS
Prepared by:
• 53% OF HISPANIC ADULTS SAY HEALTH RISKS IN JOBS ARE MAJOR REASON FOR GENERALLY WORSE HEALTH OUTCOMES


Synopsis: While the referenced reports were well written and identify issues that impact housing development in the state, the documents exclude references to the macroeconomic conditions that have been the primary influence of housing development constraints and price changes.
• IN 2021, NEARLY 1/5 OF HISPANICS IN THE U.S. DID NOT HAVE HEALTH INSURANCE COVERAGE
Thus, the reviewed research papers conclude that local policies have been the main driver behind the increases in home prices and that local restrictions have contributed to the housing shortage more than any other factor However, a review of macroeconomic conditions was beyond the scope of work in each paper.
• THE PERCENTAGE OF UNINSURED HISPANICS AGED 18–64 ROSE TO MORE THAN THREE TIMES THAT OF NON-HISPANICS BY 2021
• MEDICARE/CHIP IS THE LARGEST SOURCE OF COVERAGE FOR LATINO KIDS IN ARIZONA
For example, and most importantly, the reports exclude any analysis of the economic factors that resulted from COVID-19 disruptions and the federal government’s policy actions to mitigate the impact of the pandemic. These economic factors include widespread disruptions to the national and global supply chain, increases in the cost to transport materials, a lack of skilled and affordable labor, heightened federal government spending, and inefficient Federal Reserve Board actions. These influences continue to have an impact.
• NUMBER & RATE OF UNINSURED LATINO CHILDREN BY ARIZONA COUNTY (2018)
• HISPANICS AGED 18–29 FIND THE PROCESS TO GET MEDICAL CARE HARDER TO UNDERSTAND THAN OTHER HISPANIC AGE GROUPS
• ABOUT A THIRD OF HISPANIC ADULTS SAY THEY WOULD PREFER A HEALTH CARE PROVIDER WHO SPEAKS SPANISH
There was also limited reference in the reviewed reports regarding the degree to which each listed economic factor contributed to the current imbalances in the housing market. The impact of these individual factors needs to be studied so that recommendations can be analyzed for viability, receive a risk assessment for unintended consequences, and then be queued for staged implementation. Instead, the reports primarily list a set of selective concerns and recommendations with limited review.
• A GREATER PERCENTAGE OF HISPANIC ADULTS 18+ VS. NON-HISPANICS DID NOT GET NEEDED MEDICAL CARE DUE TO COST
• A GREATER PERCENTAGE OF HISPANIC ADULTS 18+ VS. NON-HISPANICS DID NOT TAKE
• MEDICATION AS PRESCRIBED TO SAVE MONEY
Several areas of concern are indeed properly documented. Th erefore, there appears to be some validity to the hypothesis that local level policies have impacted housing development volume. The outstanding question is, to what degree do local policies impact housing development.
• A GREATER PERCENTAGE OF HISPANIC ADULTS 18+ VS. NON-HISPANICS WERE OBESE
• LATINO DIABETES RATES HAVE REMAINED CONSTANT OVER THE LAST DECADE IN ARIZONA (2011–2021)
A number of major factors that were not considered in the reports that were reviewed relate to how macroeconomic issues have impacted housing development and affordability across the nation as a whole. It is assumed that this was beyond each of the report’s scope of work A summary of key issues is included in Figure 1.
• MENTAL HEALTH IN ARIZONA (FEBRUARY 2021)
• SINCE 2020, ALL RACIAL/ETHNIC GROUPS HAVE EXPERIENCED HIGHER RATES OF MENTAL DISTRESS
A primary factor that is excluded from consideration is the ongoing impact of COVID-19 policies and mitigation efforts as well as a change in socioeconomic patterns The COVID-19 disruptions created various supply chain problems, including labor and material shortages, transportation delays, shifts in production, and higher commodity costs. This also led to a rise in remote work and a shift in housing preferences.
• 53% OF HISPANIC ADULTS SAY HEALTH RISKS IN JOBS ARE MAJOR REASON FOR GENERALLY WORSE HEALTH OUTCOMES
The federal government also overreacted with excessive and imperfectly directed stimulus spending, maintained interest rates at near-zero percent for too long, and released excessive money into the economy through bond buying. For some context, M2 money supply (i.e., a measure of the money supply that includes cash in circulation, checking deposits, and other types of deposits that are readily convertible
to cash such as savings accounts and CDs) increased by more than 40% in just two years, an unprecedented increase.
• IN 2021, NEARLY 1/5 OF HISPANICS IN THE U.S. DID NOT HAVE HEALTH INSURANCE COVERAGE
• THE PERCENTAGE OF UNINSURED HISPANICS AGED 18–64 ROSE TO MORE THAN THREE TIMES THAT OF NON-HISPANICS BY 2021
• MEDICARE/CHIP IS THE LARGEST SOURCE OF COVERAGE FOR LATINO KIDS IN ARIZONA
• NUMBER & RATE OF UNINSURED LATINO CHILDREN BY ARIZONA COUNTY (2018)
• HISPANICS AGED 18–29 FIND THE PROCESS TO GET MEDICAL CARE HARDER TO UNDERSTAND THAN OTHER HISPANIC AGE GROUPS
• ABOUT A THIRD OF HISPANIC ADULTS SAY THEY WOULD PREFER A HEALTH CARE PROVIDER WHO SPEAKS SPANISH
• A GREATER PERCENTAGE OF HISPANIC ADULTS 18+ VS. NON-HISPANICS DID NOT GET NEEDED MEDICAL CARE DUE TO COST
• A GREATER PERCENTAGE OF HISPANIC ADULTS 18+ VS. NON-HISPANICS DID NOT TAKE
• MEDICATION AS PRESCRIBED TO SAVE MONEY
• A GREATER PERCENTAGE OF HISPANIC ADULTS 18+ VS. NON-HISPANICS WERE OBESE
• LATINO DIABETES RATES HAVE REMAINED CONSTANT OVER THE LAST DECADE IN ARIZONA (2011–2021)
• MENTAL HEALTH IN ARIZONA (FEBRUARY 2021)
• SINCE 2020, ALL RACIAL/ETHNIC GROUPS HAVE EXPERIENCED HIGHER RATES OF MENTAL DISTRESS
Historically, the state has been more cyclical than most states in regard to housing. This is partially due to residential property taxes being comparatively low and the rate of population and employment growth being robust and consistent.
• 53% OF HISPANIC ADULTS SAY HEALTH RISKS IN JOBS ARE MAJOR REASON FOR GENERALLY WORSE HEALTH OUTCOMES
Several community design standard documents for various municipalities going back as far as 2005 (preGreat Recession) were examined to assess whether or not significant changes have been made to impact housing development. This review did not identify any changes in the standards that were consequential enough to create housing price inflation to the degree it was realized.
Historically, housing affordability was not a major concern in the state, implying that municipalities did not excessively restrict new development. When the excess housing construction occurred prior to the
Great Recession of 2008, the local communities in Arizona were not accused of being overly efficient with their development standards.
It is estimated that macroeconomic influences represent between 85% to 90% of the current housing availability and affordability issues while state, county, and municipal policies may have contributed to the remainder.
• IN 2021, NEARLY 1/5 OF HISPANICS IN THE U.S. DID NOT HAVE HEALTH INSURANCE COVERAGE
• THE PERCENTAGE OF UNINSURED HISPANICS AGED 18–64 ROSE TO MORE THAN THREE TIMES THAT OF NON-HISPANICS BY 2021
• MEDICARE/CHIP IS THE LARGEST SOURCE OF COVERAGE FOR LATINO KIDS IN ARIZONA
Instead, it is universally acknowledged that broader macroeconomic forces combined with unusual lending standards caused the over-development that partially led to the 2008 recession and weak economic recovery that followed
• NUMBER & RATE OF UNINSURED LATINO CHILDREN BY ARIZONA COUNTY (2018)
• HISPANICS AGED 18–29 FIND THE PROCESS TO GET MEDICAL CARE HARDER TO UNDERSTAND THAN OTHER HISPANIC AGE GROUPS
This is not intended to diminish the fact that cities and towns have a responsibility to implement policies and strategies to help mitigate housing affordability issues throughout Arizona to the extent possible.
• ABOUT A THIRD OF HISPANIC ADULTS SAY THEY WOULD PREFER A HEALTH CARE PROVIDER WHO SPEAKS SPANISH
Several improvements can be made by local municipalities to allow for things like smaller lot sizes, additional housing units on the same lot, more efficient public reviews, more economical building design standards, and economic-based general plans and zoning designations.
• A GREATER PERCENTAGE OF HISPANIC ADULTS 18+ VS. NON-HISPANICS DID NOT GET NEEDED MEDICAL CARE DUE TO COST
• A GREATER PERCENTAGE OF HISPANIC ADULTS 18+ VS. NON-HISPANICS DID NOT TAKE
• MEDICATION AS PRESCRIBED TO SAVE MONEY
• A GREATER PERCENTAGE OF HISPANIC ADULTS 18+ VS. NON-HISPANICS WERE OBESE
RCG has been involved in the preparation of scores of analyses for developers in response to decisions by municipal governments to not move forward with proposed housing projects In most cases, the economic evaluation demonstrated that the rationale for the initial project rejection was based on incomplete information and approval was later provided. In other cases, the developer’s plans were poorly designed and overreached beyond what was reasonably planned by the municipality.
• LATINO DIABETES RATES HAVE REMAINED CONSTANT OVER THE LAST DECADE IN ARIZONA (2011–2021)
• MENTAL HEALTH IN ARIZONA (FEBRUARY 2021)
This process should become more efficient in the future , but the implication that city and town specific practices had more than a marginal impact on housing price inflation and development volume post COVID-19 is inaccurate
• SINCE 2020, ALL RACIAL/ETHNIC GROUPS HAVE EXPERIENCED HIGHER RATES OF MENTAL DISTRESS
• 53% OF HISPANIC ADULTS SAY HEALTH RISKS IN JOBS ARE MAJOR REASON FOR GENERALLY WORSE HEALTH OUTCOMES
Between 2010 and 2022, according to the U.S. Bureau of Labor Statistics (“BLS”), the average percentage of household income spent on housing only increased from 33.6% to 34.3%, respectively. This is a very modest increase and implies that little harm to households has occurred However, this does not tell the whole story. The percentage spent on housing varies significantly by income group.
The percentage of income spent on housing declines as income increases. In other words, higher income households spend a smaller portion of their total income on housing than lower income households.
• IN 2021, NEARLY 1/5 OF HISPANICS IN THE U.S. DID NOT HAVE HEALTH INSURANCE COVERAGE
Thus, housing affordability cannot be described using overall averages. Instead, housing supply and demand at each increment of household income must be calculated.
• THE PERCENTAGE OF UNINSURED HISPANICS AGED 18–64 ROSE TO MORE THAN THREE TIMES THAT OF NON-HISPANICS BY 2021
• MEDICARE/CHIP IS THE LARGEST SOURCE OF COVERAGE FOR LATINO KIDS IN ARIZONA
• NUMBER & RATE OF UNINSURED LATINO CHILDREN BY ARIZONA COUNTY (2018)
According to the BLS, households earning below $30,000 a year spent, on average, 41.2% of their income on housing. Those households earning between $30,000 and $49,999 spent 37.2% of their income on housing, while households earning between $50,000 and $99 ,999 spent 35.3% of their income on housing. The highest earning households, those earning over $100,000 a year, on average spent 30.8% of their income on housing. Thus, changes in housing costs disproportionality impact lower income individuals
• HISPANICS AGED 18–29 FIND THE PROCESS TO GET MEDICAL CARE HARDER TO UNDERSTAND THAN OTHER HISPANIC AGE GROUPS
• ABOUT A THIRD OF HISPANIC ADULTS SAY THEY WOULD PREFER A HEALTH CARE PROVIDER WHO SPEAKS SPANISH
A GREATER PERCENTAGE OF HISPANIC ADULTS 18+ VS. NON-HISPANICS DID NOT GET
A GREATER PERCENTAGE OF HISPANIC ADULTS 18+ VS. NON-HISPANICS DID NOT TAKE
A GREATER PERCENTAGE OF HISPANIC ADULTS 18+ VS. NON-HISPANICS WERE
Regardless, the reviewed reports do provide level policies that have contributed to home price escalation at the margin. barriers are removed, the development of housing in the state ent, but the changes will not result in major shifts in if not combined with changes in macroeconomic policies
HEALTH RISKS IN JOBS ARE MAJOR REASON FOR
Based on construction within Arizona municipal government practices er percentage relates to the recent price escalation. Most of the impacts are already imbedded in the historical baseline.


Fry’s intentionally pursues a diverse and inclusive workplace that reflects the communities we serve, which is why we’re honored to be named by Newsweek as one of "America's Greatest Workplaces for Diversity" for 2024.
• U.S. FOOD INSECURITY FACTS (2022)
• IN 2022, FOOD INSECURITY IN THE U.S. WAS THE HIGHEST SINCE 2014
• LATINO HUNGER FACTS (2022)
• NEARLY ONE-FOURTH OF FOOD INSECURE HOUSEHOLDS IN THE U.S. WERE HISPANIC IN 2022
• FROM 2021 TO 2022, U.S. HISPANIC HOUSEHOLDS FACED THE GREATEST PERCENTAGE INCREASE IN FOOD INSECURE HOUSEHOLDS
• THE SUPPLEMENTAL NUTRITION ASSISTANCE PROGRAM (SNAP) COMPRISED NEARLY TWO-THIRDS OF ALL U.S. FOOD AND NUTRITION ASSISTANCE SPENDING
• IN 2022, OVERALL SPENDING ON FOOD AND NUTRITION ASSISTANCE IN THE U.S. DECLINED, WHILE CHILD NUTRITION PROGRAM SPENDING INCREASED
• HISPANICS HAVE THE GREATEST DIFFICULTY OBTAINING INFANT FORMULA IN THE U.S.
• AMERICA’S FOOD MONOPOLY CRISIS (2021)
• IN 2020–2021, CORPORATE PROFITS WERE MAINLY RESPONSIBLE FOR PRICE INCREASES IN THE U.S.
• IN 2022, HOUSEHOLD EXPEDITURES ON FOOD SPIKED IN THE U.S.
• BETWEEN 2021 AND 2022, THE PRICE OF ESSENTIAL GROCERIES IN THE U.S. HAS INCREASED CONSIDERABLY
• ULTRA-PROCESSED FOODS INCREASINGLY CONTINUE TO COMPRISE A LARGE PORTION OF THE AMERICAN DIET
• NEARLY 40% OF THE TOTAL U.S. FOOD SUPPLY IS SURPLUS
• IN 2020–2022, ARIZONA HAD THE 23RD LOWEST FOOD INSECURITY RATE IN THE NATION
• WHAT HUNGER LOOKS LIKE IN ARIZONA
• THE LATINO FOOD INSECURITY RATE WAS HIGHER THAN THE OVERALL RATE IN EVERY ARIZONA COUNTY EXCEPT APACHE
• BETWEEN 2021 AND 2022, THE LATINO FOOD INSECURITY RATE IN ARIZONA INCREASED BY 5 PERCENTAGE POINTS
• MORE THAN HALF OF FOOD INSECURE PEOPLE IN ARIZONA ARE NOT ELIGIBLE FOR SNAP ASSISTANCE
• ONLY FARMS EARNING BETWEEN $25,000 AND $49,999 IN ARIZONA INCREASED BETWEEN 2017 AND 2022
• ARIZONA FARMS PRODUCED OVER $5.2 BILLION IN AGRICULTURAL PRODUCTS IN 2022
• A VERY SMALL PERCENTAGE OF FARMS HAVE PRODUCERS WHO ARE HISPANIC, LATINO OR SPANISH
SPECIAL FEATURE
IN FOCUS
IN FOCUS
Affordable Food
Univision Communications takes a deep dive into everything related to food in the Phoenix and Tucson markets, from grocery shopping to quick service and sit-down restaurants
Rising Food Costs are Real
Food prices are higher than they have been in more than 30 years, which has forced some families to depend on food banks BY PAUL PADILLA
EMPOWERING MIGRANT FARMWORKERS
Education Helped This Determined Latina When Tragedy Struck
A strong work ethic and sheer determination is what got Emma Torres where she is today, as founder and CEO of Campesinos Sin Fronteras, a nonprofit dedicated to addressing the needs of the migrant farmworker community in Yuma County BY PAUL PADILLA
IN FOCUS
EL NORTEÑO
A True Phoenix Treasure
Delicious homemade food and a welcoming community atmosphere is what keeps patrons coming back again and again BY PAUL PADILLA
IN FOCUS
A Taste of Puerto Rico:
Discover the Flavors of Phoenix Coqui in the Heart of Arizona
A vacation love story is what ultimately led to this Phoenix restaurant that combines the cultures of its owners BY DANIELA CHAVIRA
IN FOCUS
Cultivating Health and Hope: Giving Back Out of Gratitude
After raising her children in St. Vincent de Paul’s NextPhase Family Dining Room, this mom now volunteers to support the local community BY
SARAH FARRELL AND ANDREA ARIZA
189 IN FOCUS ONE DAY AT A TIME
Working to Address the Root Cause of Hunger
At the Community Food Bank of Southern Arizona CEO Malea Chavez is planning to launch a mentorship program to train others to continue her work BY NORMA CABLE
EXCERPT
192
EXCERPT
195
This report from the USDA’s Economic Research Service found that in 2022, 5.1 percent of U.S. households had very low food security, statistically significantly higher than the 3.8 percent in 2021
A report from Feeding America on County and Congressional District Food Insecurity and County Food Cost in the United States in 2022
EXCERPT 200
199
EXCERPT 202
A look at Arizona’s food desert crisis
The private nonprofit Food Research & Action Center says the data is clear: Healthy School Meals for All policies are an important strategy
FY2023 ANNUAL REPORT
The Food and Nutrition Assistance Landscape
This annual report found that total federal spending on the USDA’s food and nutrition assistance decreased substantially in FY2023
EXCERPT
EXCERPT 204
EXCERPT
206
Student Food and Housing Insecurity (FY2024)
In this report from the Arizona Board of Regents, Arizona’s three public universities offer their plans to address student food and housing insecurity
YWCA Metro Phoenix Aging Adult Programs
A graphic representation of the two meal programs currently offered for aging adults: Home-delivered meals and congregate meals
RATES OF FOOD INSECURITY IN 2022 WERE STATISTICALLY SIGNIFICANTLY HIGHER THAN THE NATIONAL AVERAGE (12.8 PERCENT) FOR THE FOLLOWING GROUPS: ALL HOUSEHOLDS WITH CHILDREN (17.3 PERCENT)
HOUSEHOLDS WITH CHILDREN UNDER AGE 6 (16.7 PERCENT)
www.ers.usda.gov/webdocs/publications/107703/err-325.pdf?v=2853.4
HOUSEHOLDS WITH CHILDREN HEADED BY A SINGLE FEMALE (33.1 PERCENT) OR A SINGLE MALE (21.2 PERCENT) WOMEN LIVING ALONE (15.1 PERCENT)
HOUSEHOLDS WITH BLACK, NON-HISPANIC (22.4 PERCENT) AND HISPANIC (20.8 PERCENT)
HOUSEHOLD REFERENCE PERSONS
PERCENTAGE OF FOOD INSECURE HOUSEHOLDS IN THE U.S. (2013—2022) Source:
IN 2022, 1 IN 5 LATINOS IN THE UNITED STATES EXPERIENCED FOOD INSECURITY
LATINOS ARE TWO TIMES MORE LIKELY TO EXPERIENCE FOOD INSECURITY LATINO CHILDREN ARE TWICE AS LIKELY TO FACE HUNGER
LATINOS ARE MORE LIKELY TO FACE HUNGER IN ALMOST EVERY COUNTY.
Source: Feeding America, “Food insecurity in Latino communities,” 2022 www.feedingamerica.org/hunger-in-america/latino-hunger-facts
Source:
www.ers.usda.gov/webdocs/publications/107703/err-325.pdf?v=2853.4
U.S. FOOD INSECURE HOUSEHOLDS BY RACE/ETHNICITY (2022)
FROM 2021 TO 2022, U.S. HISPANIC HOUSEHOLDS FACED THE GREATEST PERCENTAGE INCREASE IN FOOD INSECURE HOUSEHOLDS
USDA FOOD AND NUTRITION ASSISTANCE SPENDING BY PROGRAM (FY 2022)
NOTE: FY = fiscal year. SNAP = Supplemental Nutrition Assistance Program. WIC = Special Supplemental Nutrition Program for Women, Infants and Children. Child Nutrition Programs = National School Lunch Program, School Breakfast Program, Child and Adult Care Food Program, Summer Food Service Program, related state administrative expenses and other related child nutrition costs. P-EBT = Pandemic Electronic Benefit Transfer. FY 2022 considers the period of October 1, 2021 to September 30, 2022.
Source: U.S. Department of Agriculture, Economic Research Service, "The Food and Nutrition Assistance Landscape: Fiscal Year 2022 Annual Report," Saied Toossi and Jordan W. Jones, June 2023 www.ers.usda.gov/webdocs/publications/106763/eib-255.pdf?v=3163.1
2022 BILLIONS OF DOLLARS (USD)
*NOTE: Values as of July 19, 2024. Values are updated on a regular basis. FY = fiscal year. SNAP = Supplemental Nutrition Assistance Program. WIC = Special Supplemental Nutrition Program for Women, Infants and Children. Child Nutrition Programs = National School Lunch Program, School Breakfast Program, Child and Adult Care Food Program, Summer Food Service Program, related state administrative expenses and other related child nutrition costs. P-EBT = Pandemic Electronic Benefit Transfer.
Source: U.S. Department of Agriculture, Economic Research Service, "The Food and Nutrition Assistance Landscape: Fiscal Year 2022 Annual Report," by Saied Toossi and Jordan W. Jones, June 2023 www.ers.usda.gov/webdocs/publications/106763/eib-255.pdf?v=3163.1
NOTE: These estimates are based on the final user estimates for households. The Food Expenditure Series has been comprehensively revised, resulting in a break in the series beginning in 1997. Data from 1950 to 1996 are extrapolated using the percentage change in the previously established estimates to pull 1997 levels back to 1950.
Source: U.S. Department of Agriculture, Economic Research Service, "Food Price Outlook," Last Updated April 25, 2024 www.ers.usda.gov/data-products/food-price-outlook/
ULTRAPROCESSED FOODS INCREASINGLY CONTINUE TO COMPRISE A LARGE PORTION OF THE AMERICAN
U.S. TRENDS IN DIETARY INTAKES (PERCENTAGE OF TOTAL ENERGY) OF NOVA* FOOD GROUPS AMONG U.S. ADULTS 20 YEARS AND OLDER (2001—2018)
Source: The American Journal of Clinical Nutrition, “Ultra-processed food consumption among US adults from 2001 to 2018,” by Filippa Juul, Niyati Parekh, Euridice Martinez-Steele, Carlos Augusto Monteiro and Virginia W. Chang, 115(1), pp. 211–221 (2022) doi.org/10.1093/ajcn/nqab305
SURPLUS
*NOTE: The NOVA system of food classification is based on the nature, extent and purpose of food processing to identify ultra-processed food products. It grew out of the research of Carlos Augusto Monteiro. NEARLY 40% OF THE TOTAL U.S.
Source: ReFED, Food Waste Monitor, Last Updated November 2, 2023 insights-engine.refed.org/food-waste-monitor?view=overview&year=2022
IN 2020–2022, HAD THE 23RD LOWEST FOOD INSECURITY RATE IN
IN 2020–2022, ARIZONA HAD THE 23RD LOWEST FOOD INSECURITY RATE IN THE NATION
Source: U.S. Department of Agriculture, Economic Research Service, "Household Food Security in the United States in 2022," Matthew Rabbitt, Laura Hales, Michael Burke and Alisha Coleman-Jensen, October 2023 www.ers.usda.gov/webdocs/publications/107703/err-325.pdf?v=2853.4
HUNGER LOOKS LIKE IN ARIZONA
963,130 PEOPLE ARE FACING HUNGER— AND 293,950 ARE CHILDREN. • 1 IN 8 PEOPLE FACE HUNGER. • 1 IN 5 CHILDREN FACE HUNGER.
PEOPLE FACING HUNGER IN THE STATE ARE ESTIMATED TO REPORT NEEDING $666,169,000 MORE PER YEAR TO MEET THEIR FOOD NEEDS.
Source: Feeding America, Get the facts about hunger in Arizona www.feedingamerica.org/hunger-in-america/arizona
*NOTE: SNAP stands for Supplemental Nutrition Assistance Program. It is the government program that provides food benefits to low-income families to supplement their grocery budget. Feeding America’s analysis of the SNAP Threshold in Arizona is based on 185% of the federal poverty line.
NOTES:


BY PAUL PADILLA
We all feel it when we go to the grocery store or a restaurant, regardless of what the statistics say: Grocery prices and restaurant checks are sky-high. I have a personal sense of accomplishment when I am able to get out of a restaurant or leave a grocery checkout line without spending in the triple digits.
According to a national study conducted by Intuit Credit Karma, 80% of Americans say they have felt a noticeable increase in the cost of groceries within the last few years. However, because we have to eat, food is not something that can be eliminated from our personal budget.
Why are food costs so high right now? The answer to the question always seems to be “inflation.” Inflation now gets blamed for many of our nation’s current economic problems—and often rightly so. However, I doubt anyone who reads this article will be shocked when I say that the problem goes way deeper than that.
First, let’s tackle the obvious culprit. As the national media frequently mentions, it is true that inflation has been steadily
Food prices are hitting Americans’ wallets harder than we have seen in more than 30 years. It is a problem causing many Americans to resort to food banks to save some money.
dropping since the end of the pandemic. According to the U.S. Bureau of Labor Statistics, the highest rate of annual inflation for all items occurred during the period between April 2021 and June 2022, when inflation reached its peak at 9.1%.
Since then, the annual inflation rate has steadily dropped, reaching 3.3% in May 2024. Despite this encouraging sign, a national annual inflation rate of 3.3% is still relatively high. Before the pandemic, the U.S. hadn’t seen a rate higher than 3.3% since November 2011.
There is a similar trend for food-specific inflation. Since May 2024, the annual inflation rate for food items has been 2.1%. Pre-pandemic, the U.S. hadn’t faced a rate higher than 2.1% since March 2015. If we look at food-specific inflation on a deeper level, inflation is hitting “food away from home” harder than “food at home.” Since May 2024, “food at home” had an annual inflation rate of 1%, while “food away from home” had a rate of 4%. In other words, when you go out to eat, you are not hallucinating when you look at the bill: It is highly likely that your favorite dishes are costing you a lot more.
Why have food prices risen to unusually high levels? The most common answer is rising production-related costs. Food
corporations have said they need to pay higher wages to their workers and invest in better machinery to produce our food supply on a larger and more efficient scale.
There is no doubt that increased input costs have resulted in increased consumer costs. However, how corporations prioritize profits has also changed over time. According to the Economic Policy Institute, over the 40-year period from 1979 to 2019, the average corporate profit was only 11% of the nonfinancial corporate growth in the unit price. During the period between the second quarter of 2020 and the fourth quarter of 2021, the rate rose to a whopping 54%.
It is undeniable that corporations have increasingly prioritized profit generation. It is irresponsible to say corporate profiteering is the sole reason for rising costs, but it is equally wrong to say that it does not play a significant role. It is an issue that the White House also recognizes.
“…too many corporations raise prices to pad their profits, charging more and more for less and less,” President Joe Biden said during his 2024 State of the Union address.
Rising food costs now consume a larger percentage of the total amount of money we take home. As of 2022, according to the U.S. Department of Agriculture (USDA), household food expenditures (both “food at home” and “food away from home”) made up 11.3% of our total disposable income. The percentage is historically high; there has not been a percentage higher since 1991. Food prices are hitting Americans’ wallets harder than we have seen in more than 30 years. It is a problem that causes many Americans to resort to food banks to save money.
According to Feeding America, approximately 49 million people—or 1 in 6—received charitable food assistance in 2022. Unfortunately, at the same time, support from the federal government also has dropped. According to the USDA, federal food and nutrition assistance spending for all programs decreased by 2%, from $183.3 billion to $183 billion. Although some people think this change is not a drastic decrease, is this the appropriate time to reduce spending?
Increased food prices will have a long-lasting impact on health in America. Consumers must now make tough decisions at the grocery store. It is forcing many consumers to prioritize cost over more healthy choices and ask themselves this question: Should I pick the soy-free, free-range dozen eggs at a premium cost or the dozen factory-processed eggs that are on sale?
According to a national Cleveland Clinic survey, the most common barrier to a healthier diet was the view that eating healthy food is more expensive. Nearly half of Americans surveyed (46%) said that this is the greatest roadblock to a healthier diet. The U.S. Department of Health and Human Services reports that about half of all American adults have one or more preventable chronic diseases, many of which are related to poor eating habits and physical inactivity.
According to this same agency, higher food insecurity is associated with a higher probability of chronic disease. Consider this alarming fact: Nearly $173 billion a year is spent on health care for obesity alone. As a community, we must find ways to address this specific
health epidemic. Reducing the cost of food could be one way to start.
Paul Padilla is the director of market intelligence for the Arizona Hispanic ChamberofCommerce in Phoenix.
FromIntuitCreditKarma
More than a quarter of Americans are skipping meals due to the rise in grocery costs
creditkarma.com/about/commentary/more-than-aquarter-of-americans-are-skipping-meals-due-to-therise-in-grocery-costs
FromtheUSDAEconomicResearchService Food Insecurity, Chronic Disease and Health Among Working-Age Adults ers.usda.gov/Webdocs/Publications
Food Prices and Spending ers.usda.gov/data-products/ag-and-food-statisticscharting-the-essentials/food-prices-and-spending
FromtheU.S.BureauofLaborStatistics Consumer Price Index bls.gov/cpi
From Food and Wine magazine
Here’s What’s Really Going on With Skyrocketing Food Prices foodandwine.com/usa-inflation-food-costs
From USA Today (June27,2024)
Even as inflation cools, Americans report sticker shock at grocery store register usatoday.com/story/money/food/2024/06/27/groceryprices-inflation-still-too-high
FromtheClevelandClinic 12 Inexpensive Healthy Food Choices health.clevelandclinic.org/cheap-healthy-food
BY PAUL PADILLA
Emma Torres is one of the most practical and determined people you will ever meet. Her whole life has been centered around a simple philosophy: When she sees a real problem, she identifies a common-sense solution. It is what has led her from being a struggling farmworker in southern Arizona to being an accomplished community leader and advocate.
Torres’ journey in advocacy began with a tragedy: When she was only 24 years old, her husband died from leukemia after many labor-intensive years as a farmworker, leaving her to care for their two kids—a three-week-old baby and a four-year-old toddler— on her own. Because Torres has always addressed problems by looking for realistic solutions, she knew that formal education was the answer that would give her the skills she needed to provide a better life for her children. It was a difficult journey because neither one of her parents had a formal education so she initially did not even know where to start.
“My parents only went to first and second grade in Guanajuato [in central Mexico], where we come from,” Torres says. “So I didn’t have any understanding of how you go about acquiring an education.”
Despite this immense hurdle, Torres navigated the formal education system in the U.S. with sheer determination and the strong work ethic her migrant farm worker parents instilled in her. The first step for Torres was to get a GED; then she obtained a bachelor’s degree by participating in the inaugural social worker program offered at Northern Arizona University’s Yuma campus and ultimately also earned a master’s degree.
Torres’ early life experiences led her to start Campesinos Sin Fronteras in 1999 with some of her friends and family members.
EMPOWERING MIGRANT FARMWORKERS: EDUCATION HELPED THIS DETERMINED LATINA WHEN TRAGEDY STRUCK
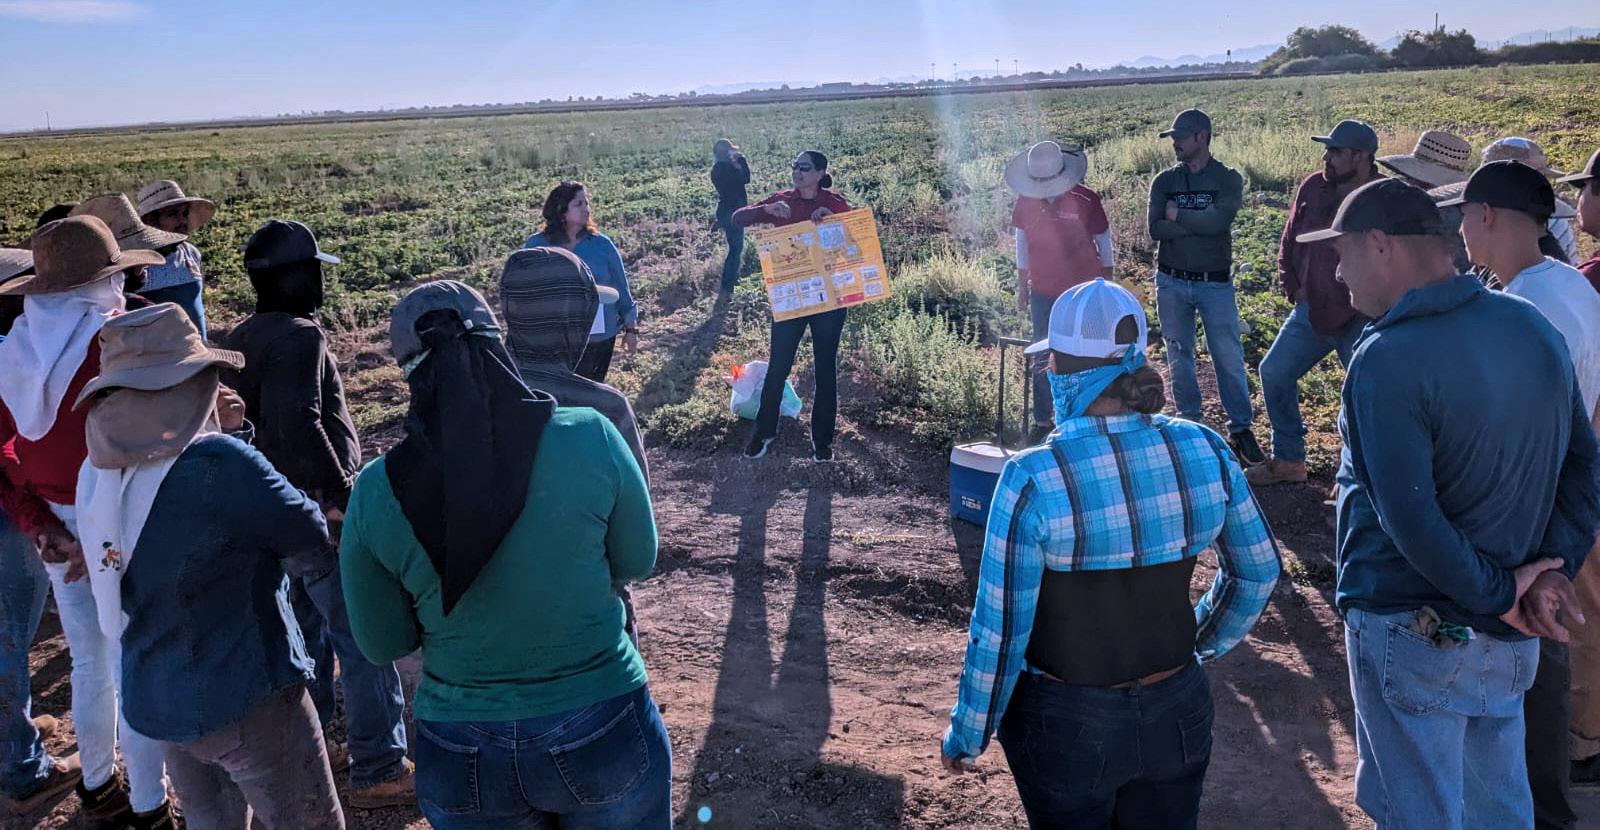
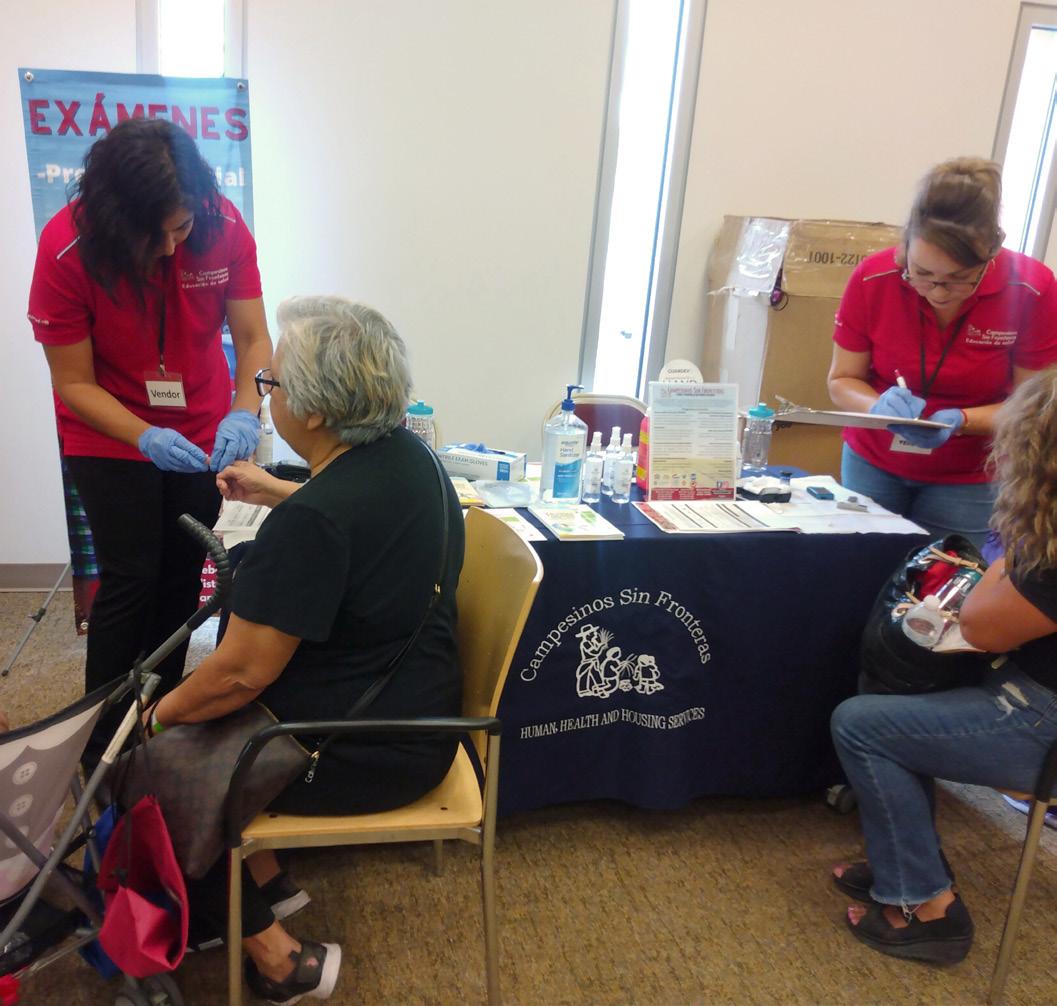
The nonprofit organization is dedicated to educating members of the migrant farmworker community in Yuma County to prevent many of the chronic illnesses and injuries associated with farm work. It currently has three offices in Yuma County: Somerton, San Luis and Gadsden.
Campesinos Sin Fronteras offers many programs and services that holistically address the needs of the migrant farmworker community. The programs and services include topics such as:
• housing,
• immigration,
• substance abuse prevention,
• domestic violence,
• environmental health,
• community health and
• youth programs.
…Torres navigated the formal education system in the U.S. with sheer determination and the strong work ethic her migrant farmworker parents instilled in her.
One of the organization’s most successful initiatives is the Promotores or community health workers program. A promotora is a trusted member of the farming community who has deep knowledge and understanding of their community. They serve as liaisons in the health and social services sector between the farmworkers and the health providers to facilitate access to health services and to improve the overall quality of the experience.
“I realized that in Yuma at that time, there were no social workers who were Latinos, who spoke the language and who also understood our community,” Torres says about the critical need for representation and advocacy for the local migrant farming community.
This program has had a transformative effect on the health care system for migrant farmworkers. The farmers are realizing their true power, especially how they play an integral role as the foundation of our nation’s food supply. Realizing their importance through interaction with the Promotores program has given workers the confidence to advocate for their own health and wellness. This important program helps farmworkers with all aspects of health care.
“We ensure that they have ways to buy their medication, that they know how to take it, that they have transportation,” says Torres, who serves as the executive director for Campesinos Sin Fronteras.
“We [provide a complete] spectrum of care.”
Anybody who interacts with the health care system in the United States knows how incredibly difficult it can be to get adequate care. It is especially true for the non-English-speaking Latino community and even more challenging for migrant families. According to Pew Research, 49% of U.S. Hispanic adults describe the process of getting medical care at hospitals and medical centers as generally hard to understand.
In addition, 58% of U.S. Hispanic immigrant adults say they prefer to see a Spanish-speaking health care provider. Migrant families need somebody they can confide in when it comes to their health care and the Promotores program provides that somebody.
The program has become so successful that it is recognized and supported by the Arizona state government. All Promotoresreceive special licensing through the Arizona Department of Health Services (ADHS). Because of its success in Arizona, the model has expanded to other areas, including the states of Texas and California, the city of Chicago and the unincorporated U.S. territory of Puerto Rico.
The youth services provided by Campesinos Sin Fronteras are another major success for the nonprofit. Torres strongly believes that investing in a community’s youth will lead to positive community outcomes in the future.
“We realize that [when] you don’t feel connected to your community, then you don’t care. You drop things on the street. You don’t care if it looks clean or not. You don’t have a sense of ownership,” Torres says. “This program is about that, about [teaching youth to connect to] their communities. If they want change, [they must] advocate for their own.”
Campesinos Sin Frontera’s youth program provides the opportunity for young people to learn how to create change in their families and their communities. It has a summer institute where young people learn to advocate for themselves and others, many of whom belong to migrant farmworker families.
The summer institute invites professionals of various disciplines to come and speak to the young participants, which leads them to get motivated about attending school and starting their own businesses. Youth in this program are required to provide at least 20 hours of volunteer time within their community. With more than 1,000 kids participating in this program, more than 20,000 community service hours have been provided to the community.
Campesinos Sin Fronteras en.campesinossinfronteras.com
Somerton Office
663 E. Main St., Suite A
Somerton, AZ 85350
928.627.5995
San Luis Office
720 Main St., Suite B
San Luis, AZ 85349
928.627.1060
Gadsden Office
10730 W. County 19th St.
Gadsden, AZ
928.236.3247
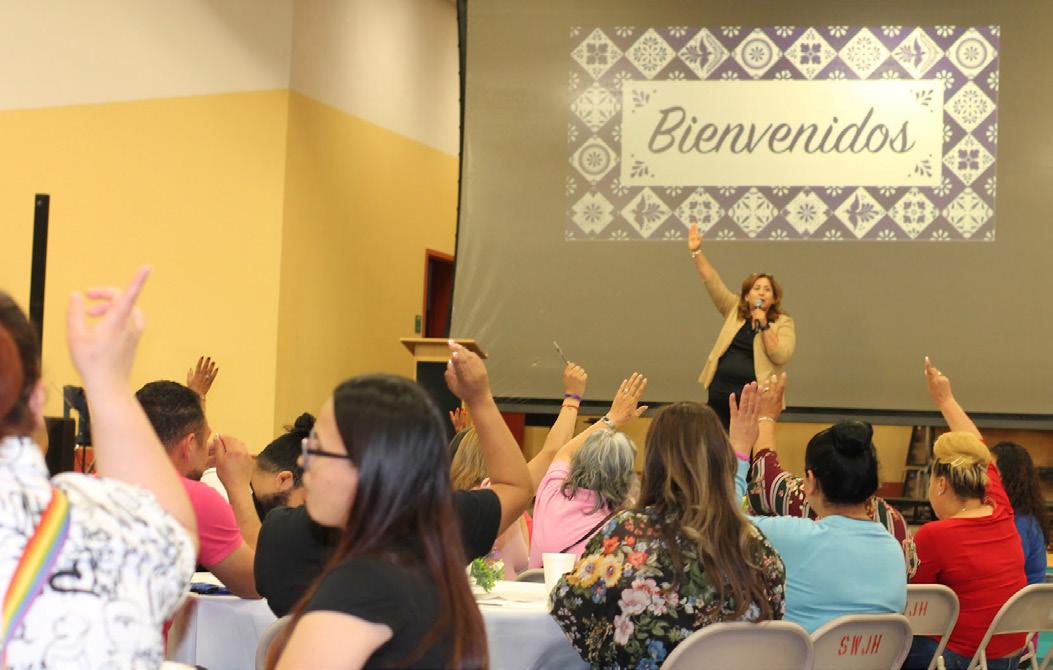
Participants are also given a stipend to help alleviate the financial stress that many of them face. Efforts by youth in this program have resulted in positive community changes, such as a recycling and arts program.
Torres only wants to be seen as an advocate without being an adversary. Her nonprofit works closely with local growers in the areas they serve to find practical solutions that ultimately benefit the local growers and the migrant workers in the fields. Torres and her team want to create a self-sufficient ecosystem that helps growers produce the best quality agricultural products while also ensuring healthy and prosperous lives for migrant farmworkers.
“They [producers] want a healthy workforce and we want them to have a healthy workforce,” Torres says. “That’s where we find common ground. We’re not here to put them [farmworkers] against [the local growers]. We want [the farmworkers] to be healthy and have opportunities.”
Campesinos Sin Fronteras has built relationships with the farm supervisors over time because many of the supervisors grew up working in the field and have interacted with the nonprofit in the past. Torres and her team always look for commonalities as opposed to differences to forge relationships that improve the lives of everyone involved. It is a lesson in how true change is made.
BY PAUL PADILLA
If you have driven around what is now known as the Roosevelt Historic District in Phoenix, you have probably noticed the striking Virgen De Guadalupe mural on the El Norteño building at the corner of 7th Ave. and Roosevelt St. Although the neighborhood has gentrified around it, the restaurant has not changed much since it was first opened in 1981 by Mercedes Gamez, the current ownership’s mother.
Mercedes had always wanted to open a restaurant in the Phoenix area so she could share her family recipes from her hometown of Hermosillo, Sonora, Mexico. When she finally saved enough money to open the doors, El Norteño became a reality—and it has been a family affair ever since. The ownership of the restaurant has now been passed down to Gamez’s children: Karina Hernandez, Elisa Palomino and Jose Palomino.
You will earn your badge as a true Phoenician once you’ve been to El Norteño. As a loyal customer, I can confidently say that your first visit will not be your last. In fact, it’s nearly impossible to go only once since the delicious homemade food and the welcoming sense of community will draw you back again and again and again.
… it’s nearly impossible to only go once [to El Norteño] since the delicious homemade food and the welcoming sense of community will draw you back again and again and again.
El Norteño has an authenticity that makes it feel very different from all the other restaurants in the Valley. Every time I stop by to pick up food, I see familiar faces and a few new ones. With more than 40 years in business, El Norteño isn’t just another restaurant in downtown Phoenix. It is an institution that people of all ages and backgrounds enjoy—from local construction workers and the businessmen and women who work in downtown Phoenix to the homeless who are down on their luck.
When I asked co-owner Elisa Palomino what the secret is behind their delicious meals, she answered with three simple words: consistency, love and family.
“We stick with the family,” Elisa says. “The recipes are my mom’s, so we just stick to whatever my mom taught us and just keep giving it love.”
In 2020, PepsiCo committed $172 million over five years to address issues of inequality and create opportunities for Hispanic Americans within its workforce, business partnerships and the communities it serves. As part of that effort, PepsiCo dedicated $50 million to support Hispanic-owned businesses and, as a result, launched Juntos Crecemos, a multifaceted platform to accelerate business recovery for Hispanic small businesses, specifically restaurants, bodegas and carnicerías disproportionately affected by the pandemic.
This eight-week personalized business building program offers expert consultation on delivery logistics, technology, marketing and search engine optimization (SEO), all designed to help businesses create a viable digital presence. Participants get one-on-one consultations to find solutions for their unique business challenges.
APPLY NOW
pepsicojuntoscrecemos.com/jefaowned pepsicojuntoscrecemos.com
Whether you first visited El Norteño back in 1981 or you just discovered it yesterday, the quality is the same, likely because family is a huge part of the business. In fact, everyone who works at El Norteño is a family member.
Affordability is another big selling point in these times where, because of inflation, it is hard to find a meal for less than $10— even at fast food restaurants. Monday through Friday, El Norteño offers daily specials for breakfast, lunch and dinner—and they all cost less than $10.
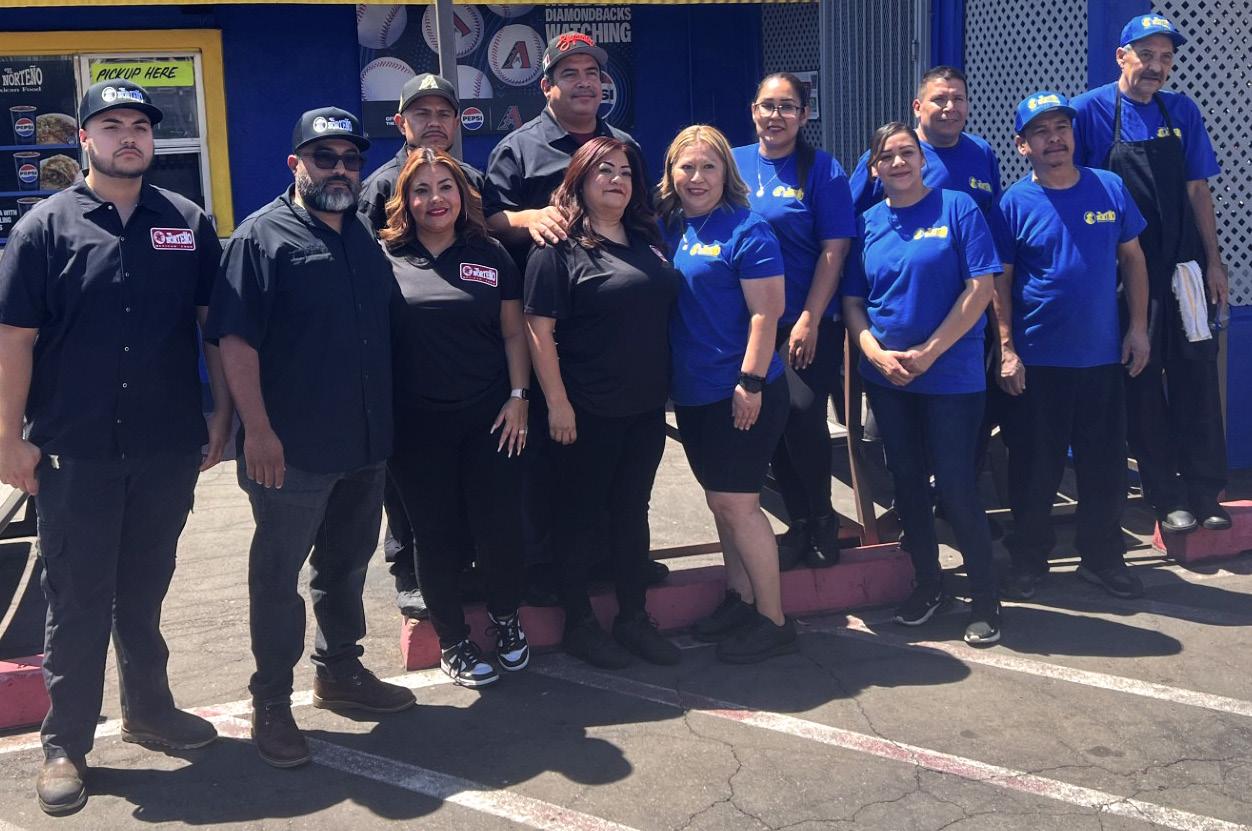
EL NORTEÑO: A TRUE PHOENIX TREASURE
When I asked Elisa how they are still able to provide such inexpensive daily specials despite the sharp increases in food prices, she said that the last time they raised their prices was two years ago.
“We’re busy because our customers know our prices and they keep coming back,” she says.
The El Norteño family has always supported the surrounding community. Elisa credits her mother for the restaurant’s charitable approach. Mercedes Gamez often provided struggling families with food and accepted payment later whenever a family was unable to pay. Because of this empathetic approach to business, she was highly respected by her customers and the entire community.
“My mom helped a lot of people, so a lot of people love my mom,” Elisa says.
“Everybody asks me what we put in the food. It’s love—the love I have for our customers. Thank God for [them].”
El Norteño’s reputation extends far beyond the Phoenix metro area. In fact, Elisa says people from all over the state have approached her to try to convince her to sell the business.
“[People] try to buy the building, try to buy our recipes, try to buy everything,” she says.
Elisa continues to reject offers to sell and has continued to embrace the importance of operating the business as a family. Instead of selling, she had some exciting news to share about the building just north of the restaurant where they currently store supplies.
The family plans to turn the storage building into an indoor seating area for its customers; currently, El Norteño only has outdoor seating. She also mentioned that earlier this year, the restaurant was honored by the Arizona Diamondbacks and PepsiCo, who presented a check to the family through PepsiCo’s Juntos Crecemos program, which supports Hispanic small businesses nationwide.
It was one mother’s dream that created El Norteño 43 years ago. Now, her family follows her example and continues to serve customers with love and purpose. This successful business model should help El Norteño thrive for another 40+ years.
Paul Padilla is the director of market intelligence for the Arizona Hispanic ChamberofCommerce in Phoenix.
El Norteño 1002 N. 7th Ave. Phoenix, AZ 85007
602.254.4629 elnortenoaz.com
HOURS
MON–THURS | 730am–9pm
Cash only; Dine in or take out
FRI–SAT | 730am–10pm
Closed on Sundays
Roosevelt Row Arts District rooseveltrow.org
Established in 2017, Phoenix Coqui is an extension of the vibrant island of Puerto Rico, providing many guests with the familiar taste of home here in Phoenix, Arizona. Despite being established officially in 2017, Phoenix Coqui began as a love story in 2013, three thousand miles away.
After traveling on vacation to Puerto Rico for the first time, Alexis Carbajal, co-founder of Phoenix Coqui, fell in love with the island. It was then that the Phoenix native took a leap of faith, put in his two weeks' notice, sold his car and bought a one-way ticket to San Juan. There, he met his partner Juan Ayala, co-founder and head cook at Phoenix Coqui. Their love story started Phoenix Coqui and although they were unsure what their business would be, it has flourished into the thriving business we see today.
Phoenix Coqui, a name deeply rooted in cultural fusion, blends Alexis’ Phoenix roots and Juan’s Puerto Rican culture, a unique combination that sets it apart. This is deeply reflected in the name and logo of the restaurant, as Phoenix represents Alexis’ hometown but also the mythical creature that rises from the ashes. Coqui comes from the coquí (ko-kee) frog, a beloved symbol of Puerto Rican culture and identity. Its distinctive “co-quí, co-quí” call fills the air at night, a comforting sound that lets many know they are home. Despite its small size, the coquí is loud and makes its presence known. Similarly, Phoenix Coqui resembles its nature
BY DANIELA CHAVIRA

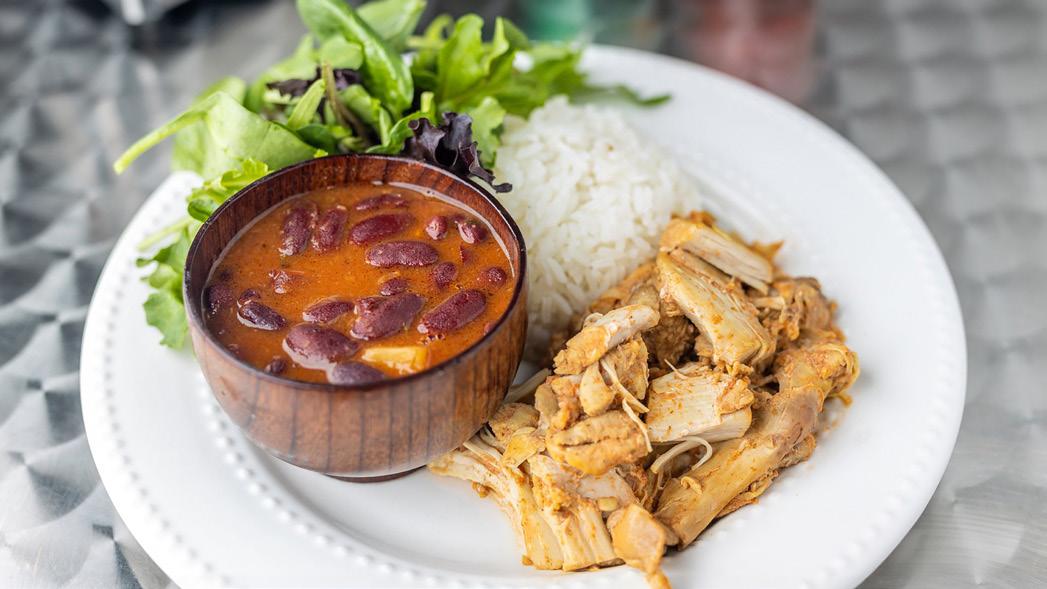
The restaurant was named Phoenix Coqui to blend Carbajal’s Phoenix roots and Ayala’s Puerto Rican culture.
and embodies its spirit, evoking memories of home, community and resiliency.
Aiming to bring the taste of authentic Puerto Rican food to Phoenix, Arizona, Alexis and Juan have dedicated themselves to ensuring that the food they serve is not only affordable but also feels like home. They offer traditional Puerto Rican dishes such as arroz con gandules (seasoned rice with pigeon peas), mofongo (fried mashed plantains) and pastelón (ground beef, sweet plantain with melted cheese).
They started their business at home, with Juan calling his grandmother and father to get the recipes many hold dear to their hearts that have been passed down through generations. From there, they began their business through word of mouth. Eventually, in 2017, they saved enough money to build their food truck in Houston, Texas and bring it back to Phoenix, Arizona. Within a week, they had their first event and have continued growing ever since. Now, they put down roots at 15th Ave. and Indian School Road, where the contagiously vibrant golden-yellow walls are filled

with mouthwatering aromas and the echoes of laughter-filled conversations in Spanish and English.
Although they draw customers from different backgrounds, their restaurant has become meaningful to Puerto Rican customers looking to be transported back to the familiar taste of home. Every bite and sip of their food and drinks tells a story of Puerto Rican flavor and flair, with customers saying, “I felt I was eating my mother’s food…”. These expressions by customers reflect the passion and dedication Alexis and Juan put into their business. Alexis says that, although cliché, love is the secret to the rich flavors of home found in their food. Despite rising costs, Alexis emphasizes their commitment to people. They vow to never compromise on the quality of their food, striving to keep prices as low as possible while delivering meals that feel like home.
DanielaChaviraisthewriter/journalistinternwiththeArizonaHispanic ChamberofCommerce (AZHCC) in Phoenix.
HOURS
TUES–THURS 11 am–6:45 pm
FRI–SAT 11 am–8:45 pm
CLOSED SUNDAYS AND MONDAYS

AfterraisingherchildreninSt.VincentdePaul’s NextPhaseFamilyDiningRoom,thismom nowvolunteerstosupportthelocalcommunity
BY SARAH FARRELL AND ANDREA ARIZA
Inside St. Vincent de Paul’s central kitchen, long-time volunteer Guillermina Coria is meticulously assembling nutritious food items inside food boxes, paying close attention to balance and variety. She is about to distribute them to families coming to enjoy a meal at St. Vincent de Paul’s NextPhase Family Dining Room. Days like this are not rare for Coria, who serves at St. Vincent de Paul during the week. This is her special way of giving back to her community and to St. Vincent de Paul after the nonprofit helped her family.
Coria and her family started coming to the Family Dining Room almost 19 years ago when she was pregnant with her daughter. Money was tight because her husband was the only one working at the time and they had two other kids. A friend advised her that the family could help stretch their budget by getting free food and diapers at St. Vincent de Paul.
Over the years, she has seen the dining room and services grow tremendously, adding important services and activities for families, including the opening of the educational Dream Center in 2010. She especially enjoys the weekly distribution of fruits and vegetables from El Mercado, produce sourced from St. Vincent de Paul’s Rob and Melani Walton Urban Farm, which has been providing produce to the organization’s central kitchen since 2014.
The farm holds special memories for Coria. She recalls taking part in the family community garden activity, which provided a space at the farm for families in the Family Dining Room to grow their own food for a season. Coria and her family chose to plant cilantro,
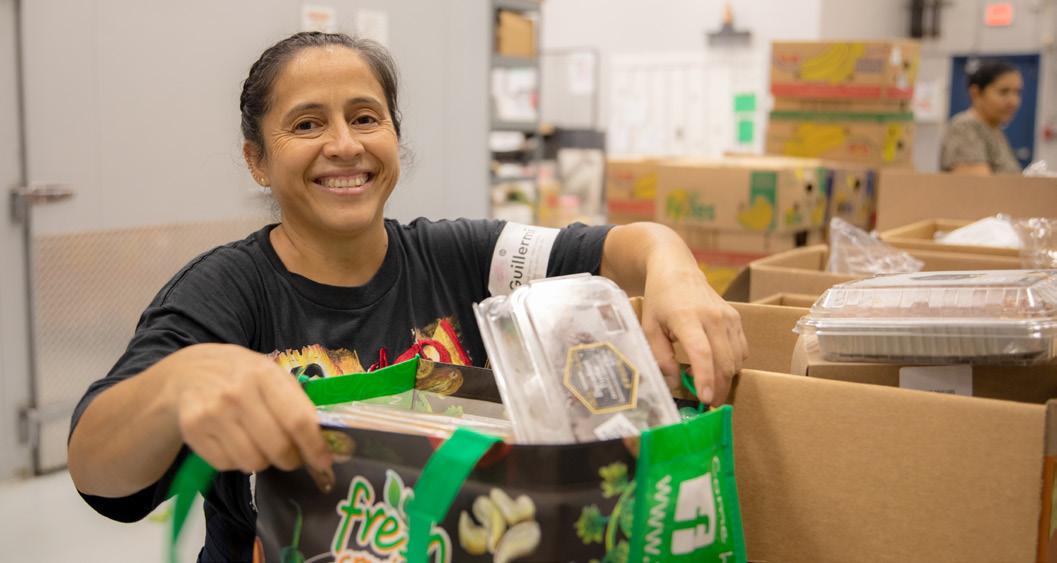
• 168,000 food box deliveries were completed by local volunteers in communities across central and northern Arizona.
• 3.17 million meals were served through five charity dining rooms and across the community with 36 partner agencies.
• 21,800 pounds of fresh produce were harvested from St. Vincent de Paul’s Urban Farms to complement meals and food boxes.
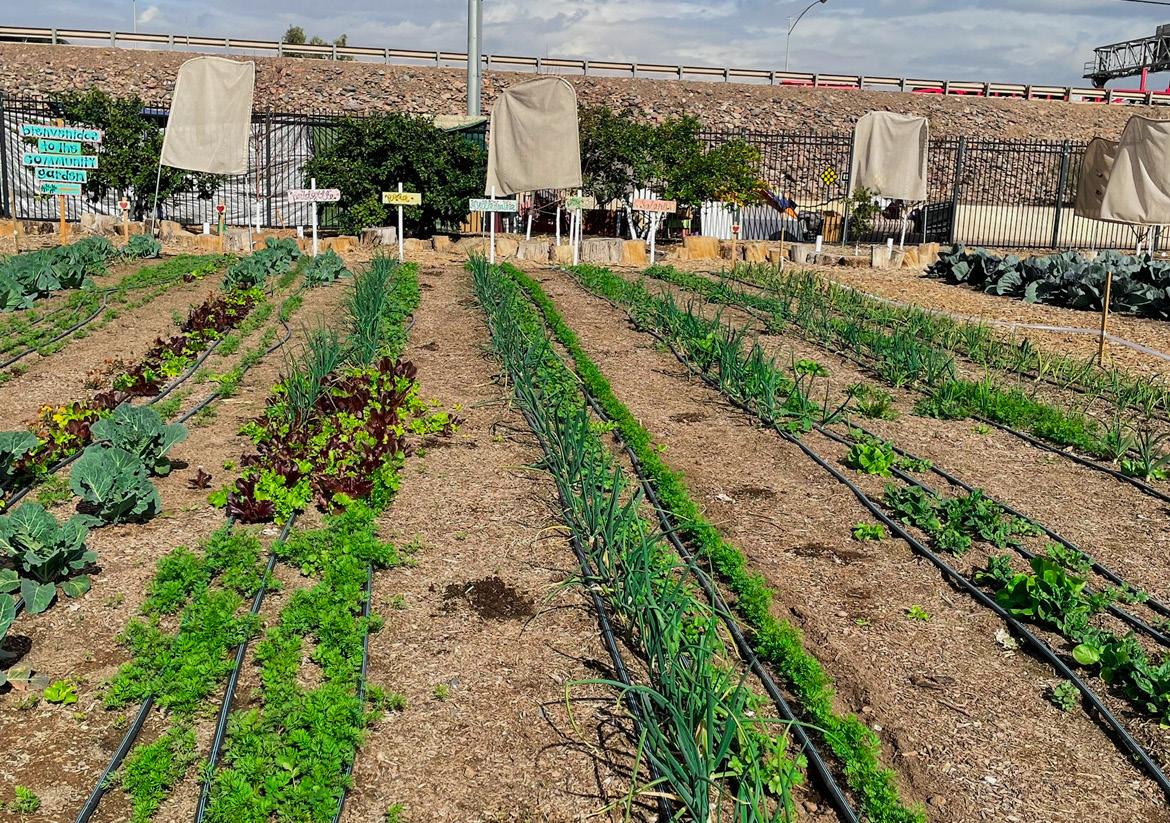
“We come from a very humble family. I think that’s what made me want to help people because my parents are the same way.”
—GuillerminaCoria
carrots, broccoli and bell peppers. Each week, she watered her crops, nurturing them to grow strong and healthy. Months later, she and her family reaped the rewards of their work, enjoying the vegetables they had grown together.
“I’ve always had a passion for growing and harvesting my own food,” Coria says. “When my family and I had the opportunity to harvest our own food at the farm, I made sure I came to water my plants every single day and give them love. Our vegetables grew very big.”
Now, the family’s needs are different. Money isn’t so tight and the Family Dining Room has become more than just a place to come for food and diapers; it has given Coria the opportunity to give back.
CULTIVATING HEALTH AND HOPE: GIVING BACK OUT OF GRATITUDE
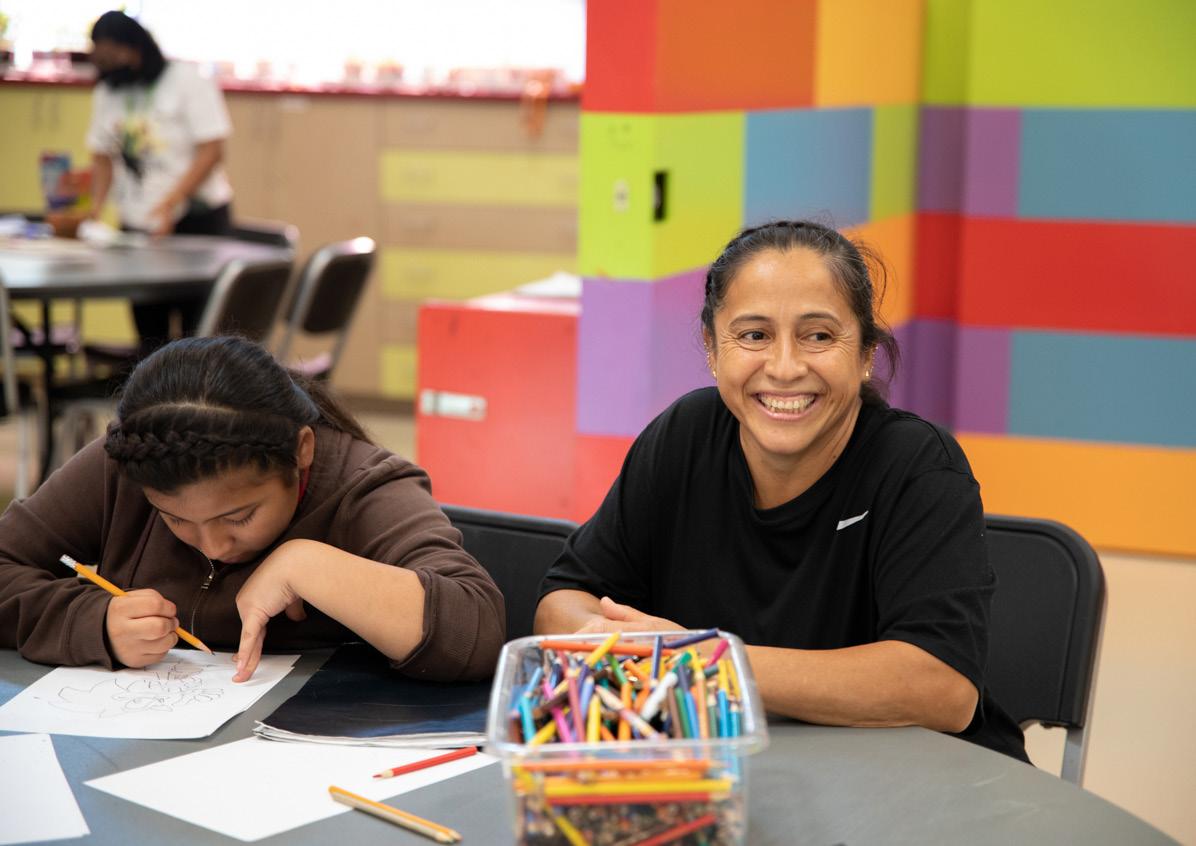
The Community Food Bank of Southern Arizona
3003 S. Country Club Rd. Tucson, AZ 85713
520.622.0525 www.communityfoodbank.org
The Society of St. Vincent de Paul 420 W Watkins St., Phoenix, AZ 85003
602.254.3338
stvincentdepaul.net
NextPhase Family Dining Room
HOURS: 4–6pm MON-FRI
stvincentdepaul.net/locations/nextphase-family-dining-room
The NextPhaseFamilyDiningRoomservesrestaurant-style mealstofamilieswithchildrenunder18.
The Dream Center
stvincentdepaul.net/our-work/youth-education
Rob and Melani Walton Urban Farm
stvincentdepaul.net/locations/rob-and-melani-walton-urban-farm
VOLUNTEER OPPORTUNITIES
stvincentdepaul.net/volunteer/volunteer-opportunities
“Now that my other kids are older and money is more stable, we come here because they offer my younger kids help with homework and other activities that help them,” she says. “I help because they help my kids. It’s a way to show that I am thankful.”
Volunteering and giving back are virtues that her parents instilled in her from a young age. When Coria was growing up in Michoacán, Mexico, her parents always helped others in need, even when they knew nothing about the people they were helping.
“We come from a very humble family,” Coria says. “I think that’s what made me want to help people because my parents are the same way.”
Because of her parents’ example, Coria has always felt drawn to give back to her community. Her family still comes to the Family Dining Room to eat every night, but Coria comes in early each day to volunteer as soon as she picks up her kids and grandson from school. The kids work in the Dream Center while she starts prepping for the day’s meal.
Coria does a little bit of everything: She helps set up the dining room, organizes the food boxes with fresh vegetables, distributes diapers to the families, serves the food and helps clean up at the end of the night. She stays long after most volunteers leave—until 7 or 730 pm some nights, helping the staff mop up and return supplies to the warehouse.
Coria cherishes the opportunity to give back. If she doesn’t come to volunteer in the Family Dining Room each night, she feels like something is missing. There’s a Spanish saying she recalls, “Da tu tiempo sin esperar nada a cambio,” which means, “Give your time without expecting anything in return,”—and that’s exactly what Guillermina does every day.
Sarah Farrell, who was born inAustin,Texas, is the Marketing Manager for The Society of St. Vincent de Paul. She graduated with a Master of Arts in Sports Journalism from Arizona State University’s Walter Cronkite School of Journalism. Andrea Ariza, who was born in Mexico City, is a Public Relations Specialist at The Society of St. Vincent de Paul. She holds a BachelorofArts in CommunicationfromArizona State University.
BY NORMA CABLE
When Malea Chavez became the CEO of the Community Food Bank of Southern Arizona in Tucson, it was both a beginning and a welcome home. Chavez grew up in Tucson, graduated from Cholla High School and still holds a deep love for the Sonoran Desert.
Now, almost two years into her time leading the Community Food Bank, she maintains a focus on working collaboratively and supporting her whole team. It’s a big job: The food bank serves people in five southern Arizona counties, covering more than 23,000 square miles and has about 170 employees.
Chavez brings a unique background to the job. She has a law degree from UC Law San Francisco (formerly the University of California, Hastings College of the Law) and years of experience working as an attorney and in the nonprofit arena. She is also the first woman of color to head the Community Food Bank of Southern Arizona.
The Community Food Bank of Southern Arizona was founded in 1976 and named Food Bank Member of the Year by Feeding America, a network of more than 200 food banks across the U.S.
“I have always been motivated by innovation and creative new ways of problem-solving,” Chavez says.
As a managing attorney, she created new legal clinics to meet people in their own communities in welcoming environments that were not as intimidating as a courthouse. She says this was when she first made the clear connection between food insecurity and policy work.
“All of my legal clinics coincided with a food pantry or food bank distribution,” she says. “I found that people made very different decisions when they came in right after picking up their groceries. I had a higher level of paperwork completion and court filings as well as a higher rate of follow-up appointments from clients.”
She has firsthand experience with food insecurity herself. Her first experience with the Community Food Bank of Southern Arizona came when she was growing up. Her mother, a social worker in Tucson for several decades, would pick up emergency food boxes for her clients' families. Chavez would ride along with her mom, helping to pick up and deliver the food. Later, when her mother and stepfather divorced, the visits to the Community Food Bank provided much-needed food for her own family. Knowing firsthand what a huge difference the food bank can make in people's lives is what fuels her passion for this work.
The Community Food Bank also operates:
• a community kitchen with a culinary training program,
• a six-acre farm where people can learn to grow their own fruits and vegetables,
• a Farmers’ Market to help local growers get fresh, local food into the community and
• provides about 20 rural distributions each month throughout Southern Arizona.
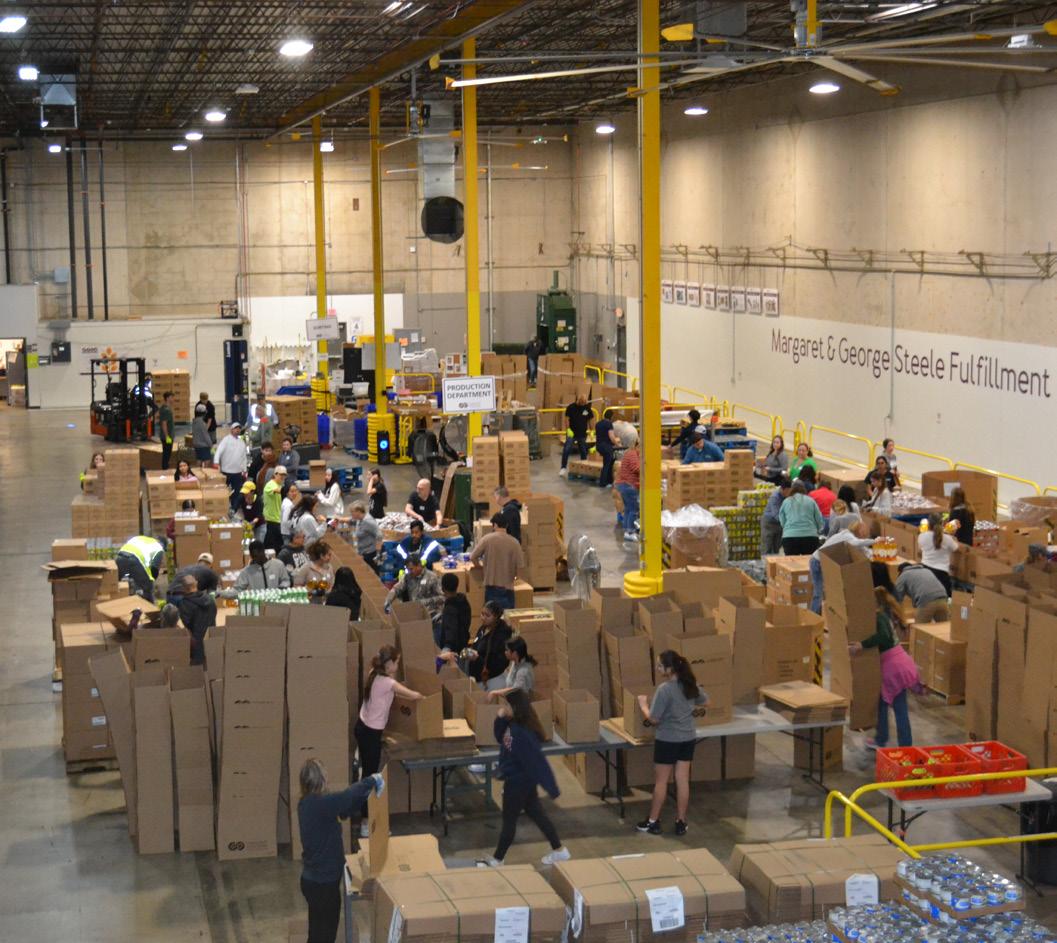
As the Community Food Bank deals with rising demand, Chavez has increased the budget for buying food and worked to make proteins more available in all distributions. She’s also made it a priority to talk with employees, volunteers and people picking up food not only in Tucson but in the Food Bank’s three other Resource Centers in Nogales, Green Valley and Amado, in addition to the rural distributions that take place monthly in areas from Ajo to Safford.
The Community Food Bank of Southern Arizona was founded in 1976 and named Food Bank Member of the Year in 2018 by Feeding America, a network of more than 200 food banks across the U.S. Beyond distributing food, the Community Food Bank also operates a community kitchen, which has prepared more than 2 million meals for seniors and offered more than 1 million free community meals. The kitchen team and volunteers also serve grab-and-go meals five afternoons a week to people who live outside.
There also is a six-acre farm operated by the Community Food Bank where people learn to grow their own fruits and vegetables and can attend garden workshops. There are also school pantries and a Farmers’ Market, in addition to an increased amount of work with local area growers to help get fresh, healthy produce into the
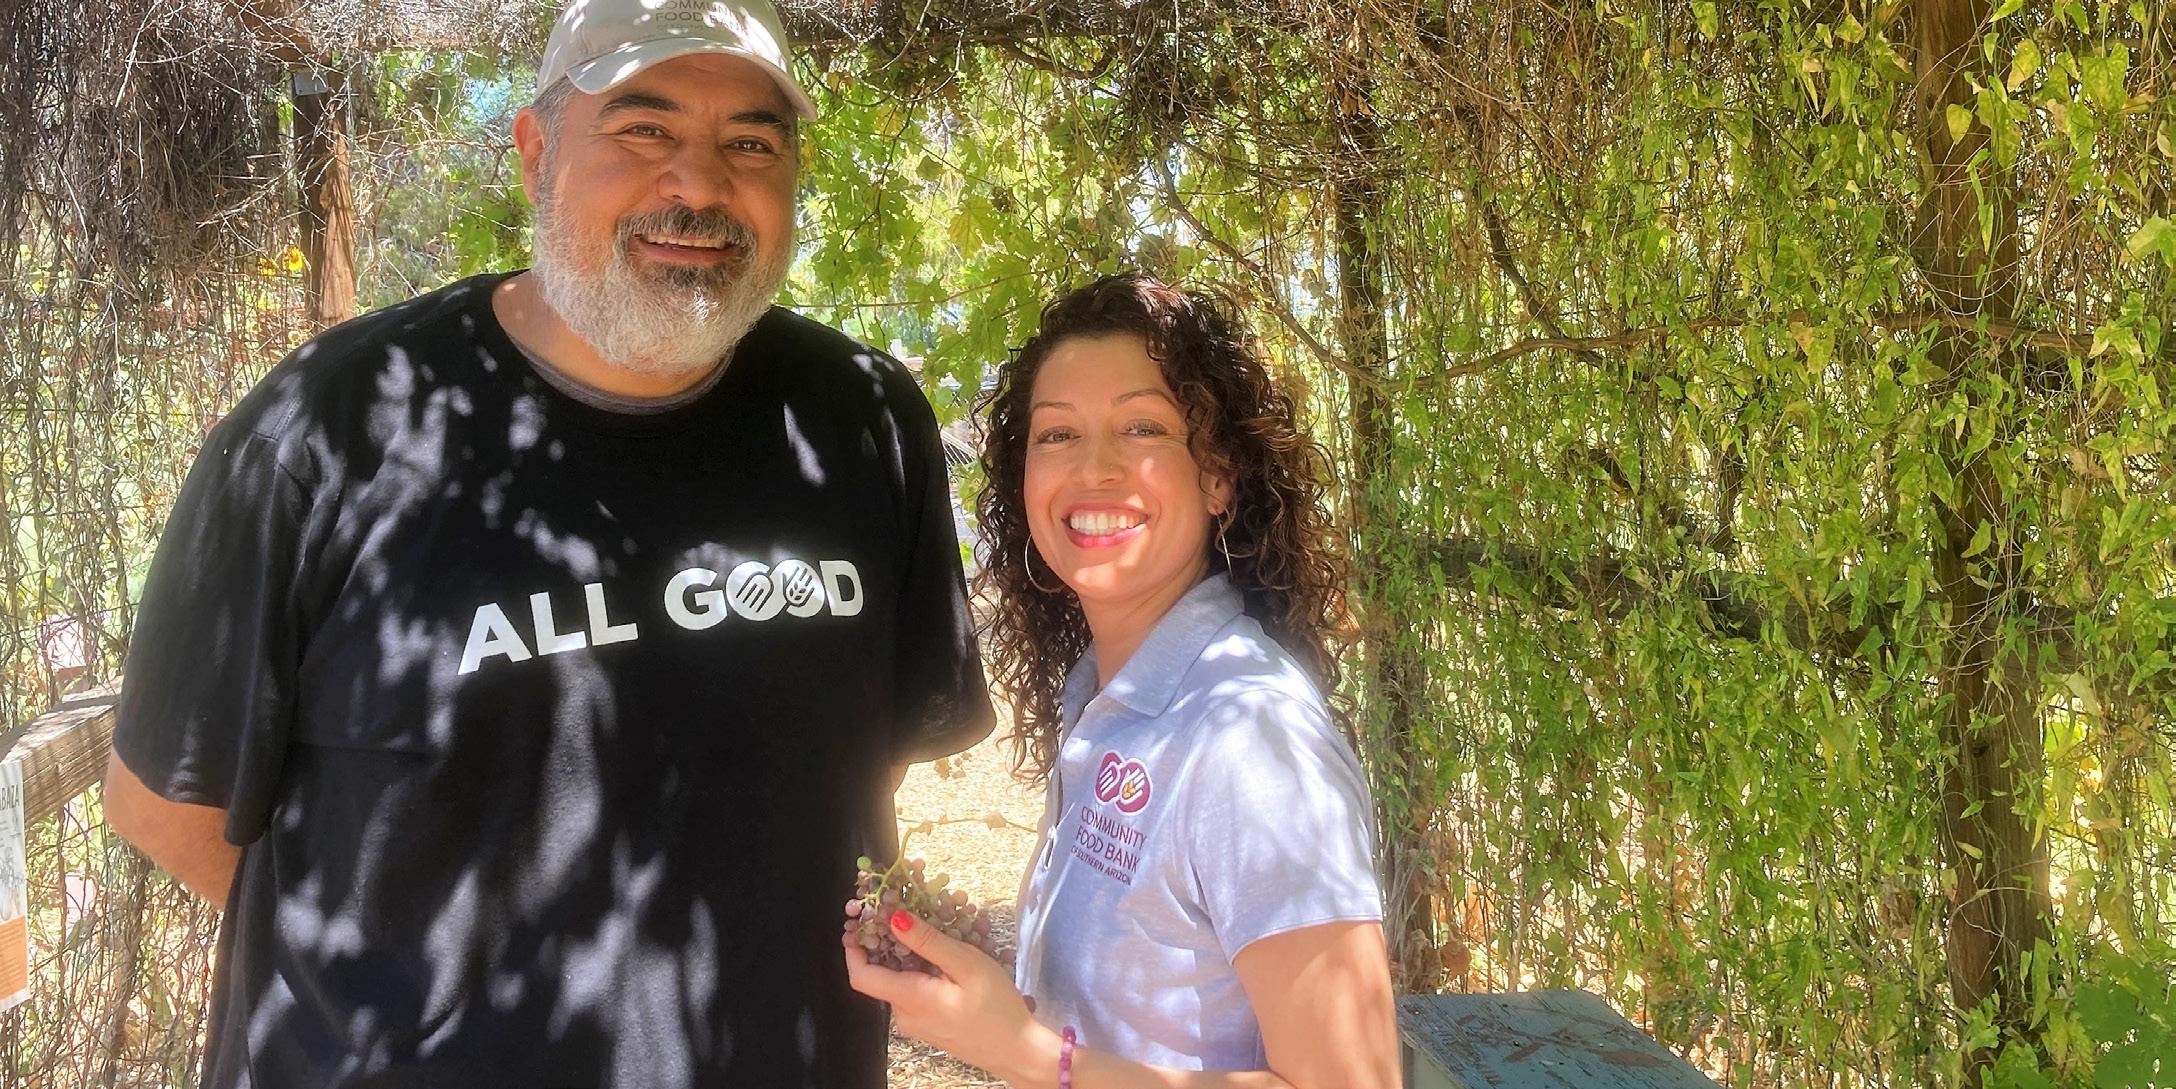
community. Chavez is committed not only to addressing the evergrowing need for food security but also to working on long-term system changes to address the root cause of hunger.
She also prioritizes encouraging her employees to grow.
“I am a strengths-based leader, believing that everyone brings unique skills and their own lived experience into the workplace,” Chavez says. “I aspire to support our team by encouraging others to share their ideas and to pursue their interests.”
To support her team, she has put learning plans for her staff in place and hopes to launch a mentorship and pipeline leadership program in the future.
“I joke that I am always trying to work my way out of a job,” she says. “By this, I mean that I am hoping to mentor and train others to take over the role I occupy. If people are interested in growing and learning, I want to support them.”
Norma Cable is the Public Relations Manager for the Community Food Bank ofSouthernArizona,Tucson.
The Community Food Bank of Southern Arizona
3003 S. Country Club Rd. Tucson, AZ 85713
520.622.052522.0525
ctus@communityfoodbank.org
volunteer@communityfoodbank.org
Supplemental Pantry Directory (July 2024, .pdf) communityfoodbank.org/wp-content/uploads/2024/06/ Supplemental-Pantry-Directory-July-2024.pdf
The Emergency Feeding Assistance Program Directory (.pdf) communityfoodbank.org/wp-content/uploads/2024/06/EmergencyFeeding-Directory-July-2024.pdf

Economic Research Service
Economic Research Report Number 325 October 2023
Matthew P. Rabbitt
Laura J. Hales
Michael P. Burke
Alisha Coleman-Jensen
Source: U.S. Department of Agriculture, Economic Research Service, "Household Food Security in the United States in 2022," Matthew Rabbitt, Laura Hales, Michael Burke and Alisha Coleman-Jensen, October 2023 www.ers.usda.gov/webdocs/publications/107703/err-325.pdf?v=2853.4
A report summary from the Economic Research Service October 2023
Matthew P. Rabbitt, Laura J. Hales, Michael P. Burke, and Alisha Coleman-Jensen
Most U.S. households have consistent, dependable access to enough food for active, healthy living—they are food secure. However, some households experience food insecurity at times during the year, meaning their ability to acquire adequate food is limited by a lack of money and other resources. The U.S. Department of Agriculture’s (USDA) food and nutrition assistance programs aim to increase food security by providing low-income households access to food for a healthful diet, as well as nutrition education. USDA monitors the extent and severity of food insecurity in U.S. households through an annual, nationally representative survey sponsored and analyzed by USDA’s Economic Research Service (ERS). This report presents statistics from the survey that cover household food security, food expenditures, and the use of Federal food and nutrition assistance programs in 2022. The prevalence of food insecurity is determined by many factors, including household circumstances, the economy, and Federal, State, and local policies. This report does not provide an analysis of the factors that determine the prevalence or trends in food insecurity.
• In 2022, 87.2 percent of U.S. households were food secure. The remaining 12.8 percent (17.0 million households) were food insecure. Food-insecure households (those with low and very low food security) had difficulty at some time during the year providing enough food for all their members because of a lack of resources. The 2022 prevalence of food insecurity was statistically significantly higher than the 10.2 percent recorded in 2021 (13.5 million households) and the 10.5 percent in 2020 (13.8 million households).
• In 2022, 5.1 percent of U.S. households (6.8 million households) had very low food security, statistically significantly higher than the 3.8 percent (5.1 million households) in 2021 and the 3.9 percent (5.1 million households) in 2020. In this more severe range of food insecurity, the food intake of some household members was reduced, and normal eating patterns were disrupted at times during the year because of limited resources.
Findings for households with children:
• Children were food insecure at times during 2022 in 8.8 percent of U.S. households with children (3.3 million households), up from both 6.2 percent (2.3 million households) in 2021 and 7.6 percent (2.9 million households) in 2020. These households with food insecurity among children were unable at times to provide adequate, nutritious food for their children.
• Children are usually shielded from the disrupted eating patterns and reduced food intake that characterize very low food security. However, in 2022, children, along with adults, suffered instances of very low food security in 1.0 percent of households with children (381,000 households), statistically significantly higher than the 0.7 percent (274,000 households) in 2021. These households with very low food security among children reported that children were hungry, skipped a meal, or did not eat for a whole day because there was not enough money for food.
Findings for population subgroups that experienced significant changes in food insecurity:
• The prevalence of both food insecurity and very low food security increased from 2021 to 2022 for nearly all subgroups of households described in this report.
Findings for food spending and Federal nutrition assistance participation:
• The typical (median) food-secure household spent 15 percent more on food than the typical food-insecure household of the same size and composition. These estimates include food purchases made with Supplemental Nutrition Assistance Program (SNAP) benefits.
• About 55 percent of food-insecure households in the survey reported that in the previous month, they participated in one or more of the three largest Federal nutrition assistance programs: SNAP; the Special Supplemental Nutrition Program for Women, Infants, and Children (WIC); and the National School Lunch Program.
Data for the USDA, ERS food security reports come from an annual survey conducted by the U.S. Department of Commerce, Bureau of the Census as the December supplement to the monthly Current Population Survey. USDA, ERS sponsors the annual Food Security Supplement and compiles and analyzes the responses. The 2022 Food Security Supplement survey included 31,948 households, which comprise a representative sample of the U.S. civilian population of about 133 million households. The food security survey asked one adult respondent per household about experiences and behaviors that indicate food insecurity during calendar year 2022, such as being unable to afford balanced meals, cutting the size of meals, or being hungry because of too little money for food. The food security status of the household was assigned based on the number of food-insecure conditions reported.
A Report on County and Congressional District Food Insecurity and County Food Cost in the United States in 2022
Food insecurity is defined by the United States Department of Agriculture (USDA) as the lack of access to enough food for an active, healthy life due to limited financial resources The USDA reported that in 2022, the most recent year of data available, the overall food insecurity rate increased sharply, rising from 10.4% in 2021 to 13.5% in 2022 The change reflects the largest one-year increase since 2008, and the rate, which amounts to over 44 million people, or 1 in every 7, is the highest it has been since 2014. i
Recent trends in food insecurity levels and the strengthening and subsequent weakening of safety net programs tell a story about how policies and programs can help people weather the storm during times of crisis. In response to the economic downturn that began at the outset of the COVID-19 pandemic, federal and local support programs expanded, and for a period of two years food insecurity levels were stable or declined As pandemic programs ended and prices for household expenses (including food) rose, food insecurity levels have also risen. Figure 1 shows trends in food insecurity levels among all individuals and children from 2006 through 2022
Food insecurity is a symptom of historical and structural oppression, not individual weakness. It does not exist in a vacuum: people who face challenges accessing enough food also face challenges affording adequate housing, healthcare, transportation, and other basic needs. Food insecurity is a complex issue that will not be solved with a one-size-fits-all solution. Rather, effective solutions to food insecurity should be informed by a deep understanding of individuals and families experiencing food insecurity and where they live.
While national data can help tell a broad story about food insecurity in the United States, experiences differ by population and place. Since 2011, Feeding America has conducted Map the Meal Gap to continue to improve our understanding of how food insecurity and food costs can vary at the local level. We estimate the number of people
Source: Feeding America, "Map the Meal Gap 2024: A Report on County and Congressional District Food Insecurity and County Food Cost in the United States in 2022," M. Hake, A. Dewey, E. Engelhard, S. Dawes, May 2024 www.feedingamerica.org/research/map-the-meal-gap/overall-executive-summary
and children experiencing food insecurity in every county and congressional district in the country. Beginning in 2022, we now include estimates of food insecurity for several racial and ethnic identities, which can serve as additional input into understanding the repercussions of racism and structural oppression in the U.S. We also estimate the percentage of people who are food insecure and unlikely to qualify for federal nutrition assistance programs based on their incomes. Finally, we provide data on how much additional money the food insecure population reports needing to buy just enough food, and how food prices vary at the state and county level. By better understanding variations in local need, communities can develop more targeted strategies to reach people experiencing food insecurity
To accurately estimate local food insecurity in every county and congressional district in the United States, we use publicly available local data that research has shown to be associated with food insecurity, including unemployment, poverty, homeownership, disability status, and median income. Together, these factors provide a more complete picture of a community’s potential need for food assistance than any one variable can alone. For example, prior to Map the Meal Gap, local poverty rates were often used as a proxy for local food insecurity. However, national USDA data reveals that 66% of food-insecure people earn more than the federal poverty level, and 38% of people living in poverty are food secure.
Map the Meal Gap is made possible by funding from the Conagra Brands Foundation and by in-kind support in the form of local food price data from NielsenIQ To access complete information about Map the Meal Gap, including the interactive map, methodological details available in a technical report, project acknowledgements, and more, visit map.feedingamerica.org
As it has every year, Map the Meal Gap shows that 100% of counties and congressional districts are home to people facing hunger (see Figure 2) On average, food insecurity is approximately 13% across all counties and districts, consistent with the 13.5% of all individuals in food-insecure households as of 2022 reported by the USDA. Yet, levels of food insecurity vary by population and place. Nationally, the percentage of the overall population estimated to be food insecure ranges from a low of 6% in Renville County, North Dakota, to 29% in Oglala Lakota County, South Dakota. These variations reflect differences in factors such as unemployment and poverty and often reflect systems and policies that prevent certain households and communities from accessing the food they need.
Child food insecurity also exists in every community, and rates reach nearly 50% in some counties (see Figure 3). While the USDA reports that 18.5% (1 in 5) of children in the U.S. may experience food insecurity, estimated rates reach as high as 48% (1 in 2) in East Carroll Parish, Louisiana. Food insecurity is also estimated to be more prevalent among children than it is among the total population in every state and in more than 9 out of 10 counties (2,988 out of 3,144). Research demonstrates links between food insecurity and poor child health and behavioral outcomes at every age, underscoring the economic and social imperative to address this issue.
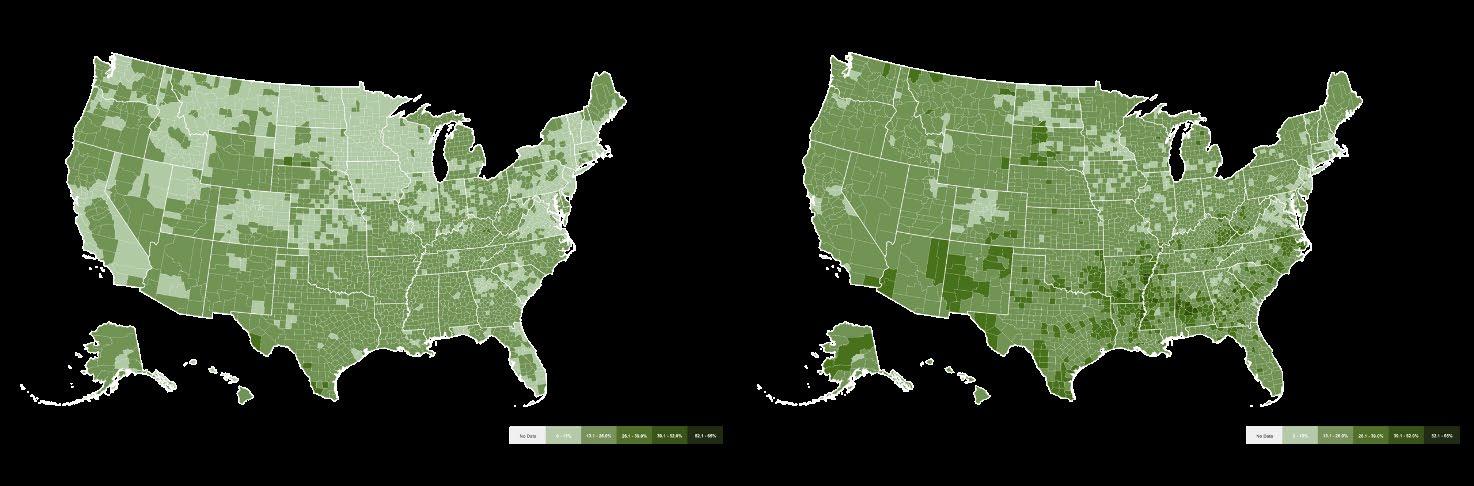
the Meal Gap 2024 | 2
Food insecurity in the South
8 out of 10 high food insecurity counties are in the South. The South contains 45% of all counties but is home to an estimated 84% of counties with foodinsecurity rates in the top 10% (274 of 327). (See Figure 4) When looking across regions, 1 in 5 (19.3%) counties in the South are estimated to have high food insecurity, compared to 1 in 22 (4.5%) in the West and 1 in 33 (3.0%) in the Midwest. Bronx County, New York, is the only county in the Northeast that appears in the top 10%. These regional disparities are consistent with national data from the USDA, which also show that individual food insecurity rates are highest in the South (15.6% as compared to 13.0% in the Midwest, 11.7% in the West, and 11.7% in the Northeast).
Food insecurity in rural communities
9 out of 10 high food insecurity counties are rural. While the majority (87%) of people in the U.S. live inside metropolitan (urban) areas and most people experiencing food insecurity live in urban areas (85%, or 37.4 million out of 44.2 million), the counties with the highest rates of food insecurity are disproportionately rural. Rural counties (those outside of major metropolitan areas) make up 62% of all counties but represent 87% of counties with food insecurity rates in the top 10% (285 out of 327). (See Figure 4).
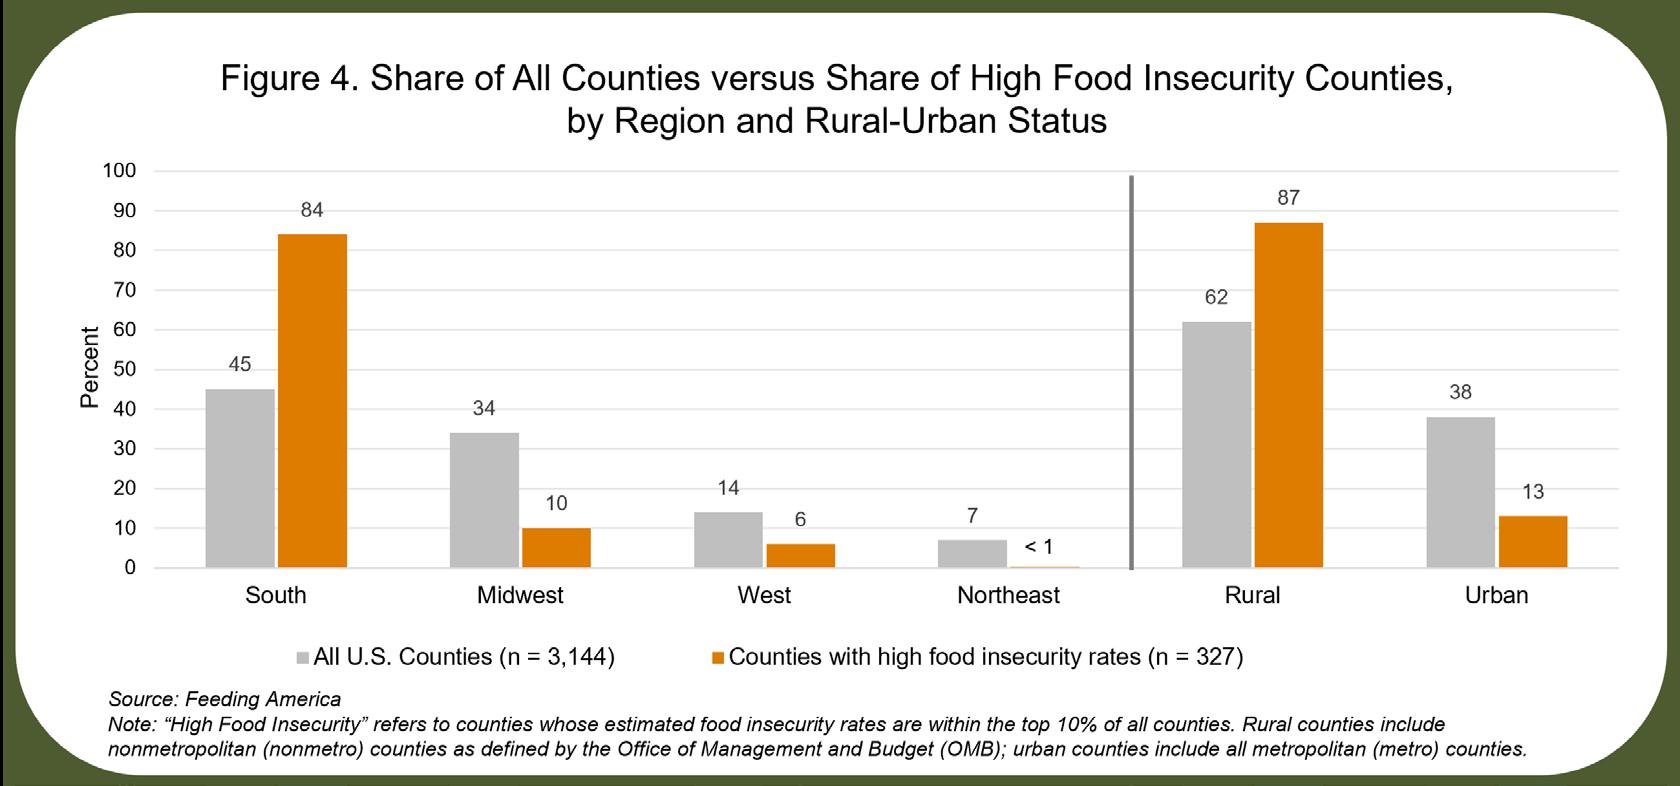
Nearly 50% of people facing hunger are unlikely to qualify for SNAP. Federal programs like the Supplemental Nutrition Assistance Program (SNAP), the nation’s largest food assistance program, are the first line of defense against hunger, yet many people who are food insecure have incomes or assets that are too high to qualify for these critical benefits. Income eligibility thresholds for SNAP range from 130% to 200% of the federal poverty line, which is only $40,560 to $62,400 for a family of four as of January 2024. Estimates produced through Map the Meal Gap suggest that 21 million or 47% of individuals experiencing food insecurity may not be eligible for SNAP. These estimates account for state-specific gross income limits (not asset requirements), and vary by state, from 38% in Kentucky to 75% in Utah. While there are some counties where the full food insecure population likely qualifies for SNAP (0% ineligible), the share of people experiencing food insecurity who are likely ineligible for the program is estimated to be as high as 89% in Morgan County, Utah. The quantity of households that experience food insecurity and do not qualify for SNAP further underscores the importance of charitable food assistance. While these findings only reflect SNAP income eligibility, not everyone who qualifies for SNAP is enrolled, highlighting the need to both protect and strengthen federal nutrition programs, and increase enrollment.
Map the Meal Gap 2024 | 3
The prevalence of food insecurity can vary widely for different racial and ethnic populations. A long history of structural racism and oppression has been perpetuated through policies that have caused many communities of color to experience economic disparities that, in turn, increase the risk of food insecurity. The figure to the right displays food insecurity levels for select racial and ethnic groups from 2006 through 2022, based on data published each year by the USDA.
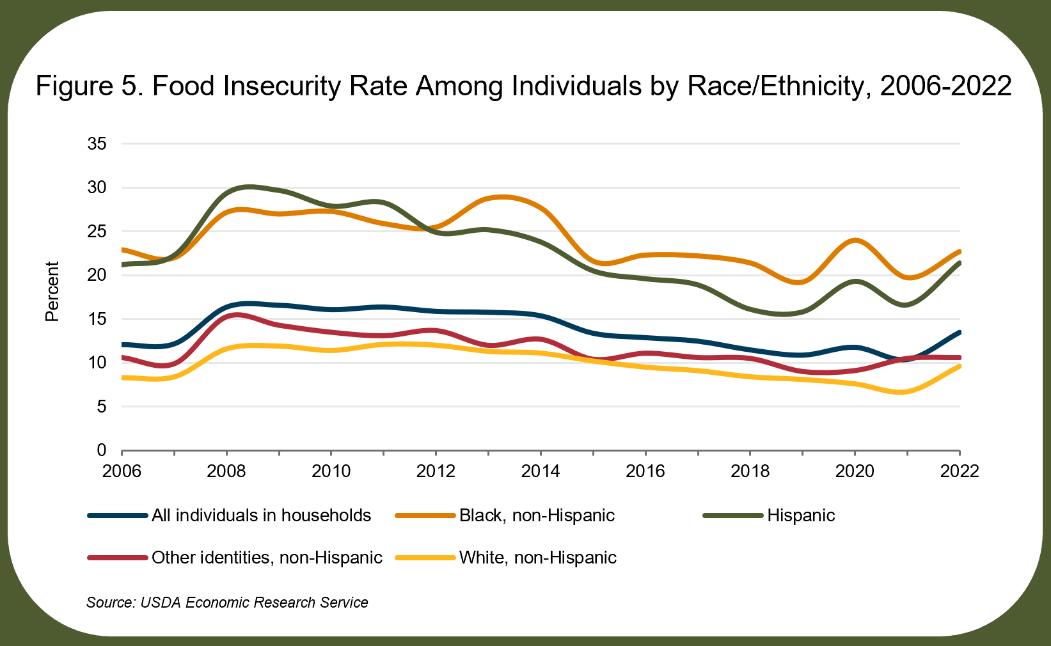
For the third consecutive year, Map the Meal Gap includes estimates of local food insecurity for Black individuals, Latino individuals, and white, non-Hispanic individuals. The inclusion of these estimates serves as an additional input to our understanding of disparities in food insecurity within and across communities.
Disparities
Food insecurity among Black or Latino individuals is higher than white individuals in more than 9 out of 10 counties with comparable data. Among Latinos, the disparity compared to white individuals reaches as high as 40 percentage points in Newton County, Texas (53% vs. 13%). For Black individuals, this discrepancy can be especially stark – for instance, in Cumberland County, Tennessee, the gap is as wide as 51 percentage points (65% vs. 13%). Moreover, in three of four counties (846 out of 1,107), estimated food insecurity among Black individuals exceeds that of Latinos, with disparities as high as 38 percentage points in Cumberland County, Tennessee (65% vs. 27%). The disparities noted above are an example of how historical, social, economic, and environmental factors have disadvantaged many communities of color, creating barriers to food security. Such findings highlight the urgent need for targeted interventions to address persistent and significant racial disparities in food security across the United States.
Variation across counties
County food insecurity varies by as much as 59 percentage points for some racial/ethnic groups. According to national data from the USDA, the average food insecurity rate among Black, non-Hispanic individuals and Latino individuals is nearly 23% and more than 21%, respectively, while the rate among white, non-Hispanic individuals is nearly 10%. Map the Meal Gap helps to show how the risk of hunger varies by race and place. Estimated food insecurity rates among Black individuals range from 6% in Broomfield County, Colorado to 65% in Cumberland County, Tennessee. Food insecurity rates among Latino individuals range from approximately 7% in Calvert County, Maryland to 53% in Newton County, Texas. Food insecurity rates among white, non-Hispanic individuals range from 2% in the District of Columbia to 29% in Wolfe County, Kentucky.
Map the Meal Gap 2024 | 4
Arizona's food desert crisis highlights significant gaps in access to healthy, affordable food, particularly in low-income and rural areas. The USDA defines food deserts as low-income neighborhoods more than 1 mile from a supermarket in urban areas or 10 miles away in rural ones. This issue disproportionately impacts urban neighborhoods in Phoenix and Tucson, as well as rural and tribal communities. Identifying areas most in need is crucial for informing policies and resource allocation to address these disparities.
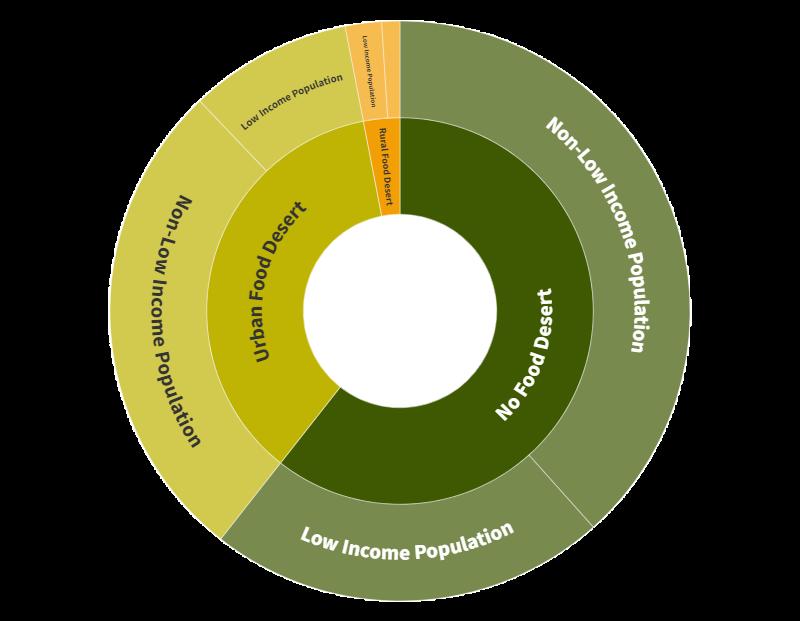

Source:
Breakfast and Lunch Participation 2022–2023
14.3 million JUST OVER
children participated in school breakfast in the 2022–2023 school year on an average school day, with 11.3 million receiving a free or reduced-price breakfast.
JUST OVER
28.1 million
children participated in school lunch in the 2022–2023 school year on an average school day, with 19.7 million receiving a free or reduced-price lunch.
School breakfast DECREASED by 1.2 million children, and school lunch DECREASED by 1.8 million children, with the end of the pandemic-era waivers that allowed schools to offer meals to all students at no charge.
42 states and the District of Columbia experienced a DECREASE in breakfast participation, and 42 states and the District of Columbia experienced a DECREASE in lunch participation compared to the 2021–2022 school year.
The states that had increases in school meal participation in the 2022–2023 school year continued to offer meals to all students at no charge in all or a significant number of their schools.
For the first time since the start of the COVID-19 pandemic, school breakfast and lunch returned to normal operations for the 2022–2023 school year. While the healthy breakfasts and lunches served at school remained an important support for millions of families, the expiration of key nationwide waivers also meant that many of the same challenges that children, families, and school nutrition departments faced prior to the pandemic began to reemerge.
The nationwide waivers that allowed schools to offer meals to all students at no charge were a game changer during the pandemic, ensuring that all students had access to the nutrition they needed to learn and thrive at school. In addition to increasing access, offering meals at no charge also reduced the administrative burden on school nutrition departments; eliminated school meal debt; reduced stigma; and streamlined the implementation of breakfast in the classroom and other alternative service models.
Many districts had to return to the tiered eligibility system in the 2022–2023 school year that required them to collect, process, and verify school meal applications, and millions of children lost access to the free school meals that were available beginning in the spring of 2020 through the 2021–2022 school year. Although it will take years to understand the full impact of the pandemic on children and their
families, the end of the pandemic-era waivers that allowed schools to offer meals to all children at no charge had an immediate impact on school meal participation during the 2022–2023 school year.
` Just over 14.3 million children participated in school breakfast in the 2022–2023 school year on an average school day, with 11.3 million receiving a free or reducedprice breakfast.
` Total school breakfast participation decreased by nearly 1.2 million children (7.7 percent) compared to the 2021–2022 school year.
` Just over 28.1 million children participated in school lunch in the 2022–2023 school year on an average school day, with 19.7 million receiving a free or reduced-price lunch.
` Total school lunch participation decreased by nearly 1.8 million children (6 percent) compared to the 2021–2022 school year.
` The gap between school breakfast and lunch participation grew in the 2022–2023 school year compared to the previous year. Only 50.9 children received a school breakfast for every 100 children who received a school lunch, a decrease from 51.9 per 100 in the 2021–2022 school year.
` During the 2022–2023 school year, 42 states and the District of Columbia experienced a decrease in breakfast participation, and 42 states and the District of Columbia experienced a decrease in lunch participation compared to the 2021–2022 school year, with the end of the pandemic-era waivers that allowed schools to offer meals to all students at no charge.
` The states that had increases in school meal participation in the 2022–2023 school year continued to offer meals to all students at no charge in all or a significant number of their schools.
» Four states — California, Maine, Massachusetts, and Vermont1 — implemented a statewide Healthy School Meals for All policy and increased school breakfast and lunch participation.
» Pennsylvania implemented a statewide Healthy School Breakfast for All policy and increased breakfast participation.
» The other states that had increases in school breakfast, school lunch, or both, benefited from a high rate of Community Eligibility Provision (CEP) participation — Kentucky and Louisiana — or from a significant increase in the number of schools participating in CEP — Connecticut, North Carolina, and Texas.
Jordan W. Jones and Saied Toossi
Te U.S. Department of Agriculture (USDA) administers 16 domestic food and nutrition assistance programs that afect the lives of millions of people and account for roughly two-thirds of USDA’s annual budget. Over a typical year, about one in four people in the United States participates in at least one of these programs. In response to the Coronavirus (COVID-19) pandemic beginning in fscal year (FY) 2020, USDA implemented additional temporary programs and numerous policy changes that expanded the scope and coverage of existing programs. As a result, participation in and spending on these programs changed substantially. Tis report examined trends in USDA’s largest domestic food and nutrition assistance programs through FY 2023 (October 1, 2022–September 30, 2023). Te report also documented policy changes in FY 2023 and trends in economic and social indicators afecting participation in and spending on food and nutrition assistance programs. In addition, it summarized two 2023 USDA, Economic Research Service (ERS) reports including one that examined the prevalence of household food insecurity in the United States in 2022 and another that documented the share of households with school-aged children reporting that paying for school meals made it difcult to pay for other expenses after pandemic waivers allowing schools to serve free meals expired in 2022.
Total Federal spending on USDA’s food and nutrition assistance decreased substantially in FY 2023.
• Spending amounted to $166.4 billion, 9.7 percent lower than the total of $184.2 billion in FY 2022. Adjusted for infation, spending was 13.0 percent lower than in FY 2022 and 54.5 percent higher than in FY 2019, the last full fscal year before the pandemic.
• Te decrease was driven by lower spending on the Supplemental Nutrition Assistance Program (SNAP), child nutrition programs, and the Pandemic Electronic Beneft Transfer (P-EBT) program.
SNAP spending decreased in FY 2023, even as participation levels rose.
•On average, 42.1 million people participated in SNAP each month, 2.3 percent more than in FY 2022. Overall reductions in beneft levels driven by the expiration of emergency allotments contributed to lower SNAP spending of $112.8 billion, 5.6 percent less than in FY 2022.
Source: U.S. Department of Agriculture, Economic Research Service, “The Food and Nutrition Assistance Landscape: Fiscal year 2023 Annual Report,” Jordan W. Jones and Saied Toossi, June 2024 www.ers.usda.gov/publications/pub-details/?pubid=109313 ERS is a primary source of economic research and analysis from the U.S. Department of Agriculture, providing timely information on economic and policy issues related to agriculture, food, the environment, and rural America.
www.ers.usda.gov
Participation in the Special Supplemental Nutrition Program for Women, Infants, and Children (WIC) increased in FY 2023 among women, infants, and children. Fiscal year 2023 was the first year since 2009 that the number of infants participating in WIC increased.
• On average, 6.6 million people participated in the Special Supplemental Nutrition Program for Women, Infants, and Children (WIC) each month, 5.0 percent more than in FY 2022. Total WIC spending was $6.6 billion, 14.9 percent more than in FY 2022, reflecting an increase in participation and food costs.
Total spending on the largest child nutrition programs declined in FY 2023, as did the number of meals served through these programs.
• A total of 8.8 billion meals were served across the National School Lunch Program (NSLP), School Breakfast Program (SBP), Child and Adult Care Food Program (CACFP), and Summer Food Service Program (SFSP).
• Total spending on these programs was $26.9 billion, 20.9 percent less than in FY 2022.
USDA continued to operate P-EBT through the end of FY 2023. P-EBT benefits were issued to eligible families at a cost of $13.7 billion, 23.9 percent less than the amount issued in FY 2022.
USDA food and nutrition assistance spending by program, FY 2023 SNAP accounted for about two-thirds of spending
FY = Fiscal year. SNAP = Supplemental Nutrition Assistance Program. WIC = Special Supplemental Nutrition Program for Women, Infants, and Children. Child nutrition programs = National School Lunch Program; School Breakfast Program; Child and Adult Care Food Program; Summer Food Service Program; related State administrative expenses; and other related child nutrition costs. P-EBT = Pandemic Electronic Benefit Transfer. All other programs = Nutrition family assistance grants to Puerto Rico, the Northern Marianas, and American Samoa; Commodity Supplemental Food Program; the Food Distribution Program on Indian Reservations; the Nutrition Services Incentive Program; the Special Milk Program; Disaster Feeding; The Emergency Food Assistance Program; and nutrition programs administration.
Note: The figure is based on preliminary data from the September 2023 Program Information Report (Keydata) released by USDA, Food and Nutrition Service (FNS) in December 2023.
Source: USDA, Economic Research Service using USDA, FNS data.
This report used preliminary data from USDA, Food and Nutrition Service to examine program trends through FY 2023. It compared FY 2023 program metrics to those from previous fiscal years. This report compared nominal dollar values over time in some instances and adjusted past dollar values for inflation in other instances to make more accurate historical comparisons. Data for FY 2023 came from the September 2023 Program Information Report (Keydata) released in December 2023. This report also used supplementary data to examine economic and social indicators.
www.ers.usda.gov

College students nationwide are increasingly facing food and housing insecurity, issues that are often hidden and not immediately apparent. The Hope Center’s research surveys provide the largest assessment of basic needs security among college students in the United States, revealing that students in Arizona are also experiencing these challenges.
The U.S. Department of Health and Human Services describes housing insecurity or instability as the lack of secure shelter due to factors like “having trouble paying rent, overcrowding, moving frequently or spending the bulk of household income on housing.” The The U.S. Department of Agriculture defines food insecurity as “a lack of consistent access to enough food for every person in a household to live an active, healthy life.”
According to a study of college students in the U.S. published by the National Institutes of Health National Library of Medicine, food insecurity is inversely associated with degree completion and educational attainment. Study results show that among food-insecure college students, 43.8 percent completed their college degree compared with 68.1 percent of food-secure college students.
Arizona’s educational attainment – the percentage of adults who earn a twoor four-year degree – is below the national average. Increasing educational attainment is a priority for the board, as individuals with degrees not only earn higher salaries but significantly enhance the state’s economic prosperity. To address this, surveys were conducted at Arizona State University, Northern Arizona University and the University of Arizona to assess student experiences related to basic needs, particularly food and housing insecurity.
In response, student regents and the Arizona Board of Regents initiated a tri-university work group in the 2020-21 academic year. This group was tasked with assessing student food insecurity and housing needs, and providing guidance on evidence-based policies and practices to address these issues. A key recommendation, approved by the board in June 2021, requires each university to submit an annual report detailing efforts to assess and alleviate student food and housing needs on campus. Additional recommendations include establishing a Basic Needs Committee at each university, and developing a communications plan and portal to highlight and explain the universities’ initiatives.


• 30% OF U.S. ADULTS AGED 18–29 BELIEVE THEY WILL HAVE TO MAKE MAJOR SACRIFICES DUE TO GLOBAL CLIMATE CHANGE
• IN 2022, MORE THAN 60% OF U.S. HISPANICS BELIEVED WE SHOULD BE TAKING ACTION NOW TO ADDRESS CLIMATE CHANGE 210–216
• 50% OF U.S. ADULTS LIVING IN THE WEST BELIEVE CLIMATE CHANGE WILL MAKE THEIR COMMUNITIES A WORSE PLACE TO LIVE
• IN 2023, OVER HALF OF U.S. ADULTS BELIEVED THAT LARGE BUSINESSES, CORPORATIONS AND THE ENERGY INDUSTRY COULD HELP A LOT TO REDUCE THE EFFECTS OF CLIMATE CHANGE
• THE HIGHEST PERCENTAGE OF U.S. ADULTS WHO BELIEVE HUMAN ACTIVITY CONTRIBUTES TO CLIMATE CHANGE WERE AGES 18—29
• BY PERCENTAGE, MORE U.S. LATINOS VIEW HAZARDOUS FACILITIES IN THEIR COMMUNITY AS A SERIOUS PROBLEM
• MORE THAN HALF OF ARIZONANS PERCEIVE CLIMATE CHANGE AS A SERIOUS PROBLEM AND HAVE NOTICED ITS EFFECTS OVER THE PAST DECADE
• IN 2023, NATURAL GAS WAS THE LARGEST SOURCE OF ELECTRICITY NET GENERATION IN ARIZONA
• PER CAPITA ENERGY-RELATED CARBON DIOXIDE EMISSIONS HAVE MOSTLY TRENDED DOWNWARD IN ARIZONA SINCE 2013
• MUNICIPAL AREAS AND AGRICULTURE IN ARIZONA USE THE MOST WATER
• ARIZONA CONSISTENTLY PUMPS OUT MORE WATER THAN IT REPLACES
• MORE THAN 75% OF ARIZONANS BELIEVE THE STATE HAS A SERIOUS WATER SUPPLY ISSUE
• AN OVERWHELMING MAJORITY OF U.S. HISPANICS PERCEIVE CLIMATE CHANGE AS A CRITICAL THREAT IN THE NEXT DECADE
IN FOCUS
ADVOCACY AND RESTORATION Going Beyond Green Cleaning
This Hispanic-owned, eco-friendly facilities service company has a big goal: to set a new standard in the commercial cleaning industry to use green products to protect its workers and the environment BY
AARON GILBREATH
EXCERPT 221
Record-breaking temperatures poses serious health risks, particularly for unsheltered populations
EXCERPT
This May 2023 report from the Chicago Council on Global Affairs and the New America Foundation found that 56% of Americans—and 70% of Hispanic Americans—consider climate change a critical threat to the U.S.
OF U.S. ADULTS AGED 18–29
Source:
50% OF U.S. ADULTS LIVING IN THE WEST BELIEVE CLIMATE CHANGE WILL MAKE THEIR COMMUNITIES A WORSE PLACE TO LIVE
AMOUNT OF SACRIFICE U.S. ADULTS THINK THEY WILL HAVE TO MAKE IN THEIR DAILY LIVES BECAUSE OF GLOBAL CLIMATE CHANGE (2023) BY PERCENTAGE AND AGE GROUP
IN 2023, OVER HALF OF U.S. ADULTS BELIEVED THAT LARGE BUSINESSES, CORPORATIONS AND THE ENERGY INDUSTRY COULD HELP A LOT TO REDUCE THE EFFECTS OF CLIMATE CHANGE
HIGHEST PERCENTAGE OF U.S. ADULTS WHO
HOW MUCH U.S. ADULTS BELIEVE THAT CERTAIN GROUPS CAN HELP REDUCE THE EFFECTS OF CLIMATE CHANGE (2023) BY PERCENTAGE AND GROUP
PERCENTAGE OF U.S. ADULTS WHO SAY THAT THESE FACTORS AFFECT CLIMATE CHANGE (2023)
HUMAN ACTIVITY NATURAL PATTERNS IN EARTH'S ENVIRONMENT
Source: Pew Research Center, "How Americans View Future Harms From Climate Change in Their Community and Around the U.S.," Alec Tyson and Brian Kennedy, October 25, 2023 www.pewresearch.org/science/2023/10/25/how-americans-view-future-harms-from-climate-change-in-their-community-and-around-the-u-s/
BY PERCENTAGE, MORE U.S. LATINOS VIEW HAZARDOUS FACILITIES IN THEIR COMMUNITY AS A SERIOUS PROBLEM
HAZARDOUS FACILITIES SUCH AS LANDFILLS, WASTE SITES OR INDUSTRIES THAT RELEASE WATER OR AIR POLLUTION IN MY COMMUNITY IS A SERIOUS PROBLEM (2024)
TOTAL WHITE LATINO BLACK NATIVE AMERICAN
NOTE: METHODOLOGY: 3,376 telephone and online interviews with registered voters in eight states: Arizona (N=458), Colorado (N=436), Idaho (N=402), Montana (N=429), Nevada (N=428), New Mexico (N=416), Utah (N=405) and Wyoming (N=402). Two oversamples were also conducted to have greater ability to report distinctions among racial/ethnic sub-groups. We conducted additional interviews to reach a total of N=210 Black voters and a total of N=206 Native American voters, which were then weighted back to reflect their true proportions within the electorate in this region. Interviews were conducted January 4–21, 2024, in Spanish and English. The effective margin of error is ± 2.4% at the 95% confidence interval for the total sample; and at most ± 4.9% for each state. The total numbers have been statistically weighted to reflect the true geographic distribution of voters throughout the region. Interviews within each state were distributed proportionally by region. Comparisons are made to similarly conducted surveys each year from 2011 to 2023. Bipartisan research team of New Bridge Strategy (R) and Fairbank, Maslin, Maullin, Metz & Associates (D).
Source: Colorado College, “State of the Rockies Project: 2024 Conservation in the West Poll,” January 2024 www.coloradocollege.edu/other/stateoftherockies/conservationinthewest/2024.html
MORE THAN HALF OF ARIZONANS PERCEIVE CLIMATE CHANGE AS A SERIOUS PROBLEM AND HAVE NOTICED ITS EFFECTS OVER THE PAST DECADE
CLIMATE CHANGE IS AN EXTREMELY OR VERY SERIOUS PROBLEM
CLIMATE CHANGE IS NOT AN EXTREMELY OR VERY SERIOUS PROBLEM
HAVE NOTICED SIGNIFICANT EFFECTS FROM CLIMATE CHANGE OVER THE PAST TEN YEARS
HAVE NOT NOTICED SIGNIFICANT EFFECTS FROM CLIMATE CHANGE OVER THE PAST TEN YEARS
NOTE: METHODOLOGY: 3,376 telephone and online interviews with registered voters in eight states: Arizona (N=458), Colorado (N=436), Idaho (N=402), Montana (N=429), Nevada (N=428), New Mexico (N=416), Utah (N=405) and Wyoming (N=402). Two oversamples were also conducted to have greater ability to report distinctions among racial/ethnic sub-groups. We conducted additional interviews to reach a total of N=210 Black voters and a total of N=206 Native American voters, which were then weighted back to reflect their true proportions within the electorate in this region. Interviews were conducted January 4–21, 2024, in Spanish and English. The effective margin of error is ± 2.4% at the 95% confidence interval for the total sample; and at most ± 4.9% for each state. The total numbers have been statistically weighted to reflect the true geographic distribution of voters throughout the region. Interviews within each state were distributed proportionally by region. Comparisons are made to similarly conducted surveys each year from 2011 to 2023. Bipartisan research team of New Bridge Strategy (R) and Fairbank, Maslin, Maullin, Metz & Associates (D).
Source: Colorado College, “State of the Rockies Project: 2024 Conservation in the West Poll–Arizona,” January 2024 www.coloradocollege.edu/other/stateoftherockies/_documents/2024-poll-data/2024%20State%20Fact%20Sheets%20AZ.pdf
Arizona's Palo Verde Nuclear Generating Station is the largest nuclear power plant, the largest net generator of electricity and, with a net summer capacity of 3,937 megawatts, the second-largest power plant of any kind in the nation. In 2022, it accounted for 4% of the nation's nuclear generation.
Arizona ranks second in the nation in solar energy potential after Nevada and in 2022, it was fifth in solar-powered net generation from the state's utility- and small-scale photovoltaic and solar thermal power plants together. Solar energy provided the state with more power than all of Arizona's other renewable energy sources combined.
In part because of its large population and mild winter climate, Arizona consumed less total energy per capita than almost four-fifths of the states in 2020.
In 2022, Arizona hydroelectric power plants supplied their smallest amount of electricity in more than 30 years. They accounted for about 5% of Arizona's total in-state electricity generation.
NOTE: The "other" category includes biomass, hydroelectric pumped storage and petroleum.
*NOTE: Values as of July 22, 2024. Values are updated on a regular basis.
(IN MILLIONS, 2000—2019)
*NOTE: Values as of July 22, 2024. Values are updated on a regular basis.
THE LOW LEVEL OF WATER IN RIVERS IS A SERIOUS PROBLEM
THINK THAT THE LOW LEVEL OF WATER IN RIVERS IS NOT A SERIOUS PROBLEM
NOTE: METHODOLOGY: 3,376 telephone and online interviews with registered voters in eight states: Arizona (N=458), Colorado (N=436), Idaho (N=402), Montana (N=429), Nevada (N=428), New Mexico (N=416), Utah (N=405) and Wyoming (N=402). Two oversamples were also conducted to have greater ability to report distinctions among racial/ethnic sub-groups. We conducted additional interviews to reach a total of N=210 Black voters and a total of N=206 Native American voters, which were then weighted back to reflect their true proportions within the electorate in this region. Interviews were conducted January 4–21, 2024, in Spanish and English. The effective margin of error is ± 2.4% at the 95% confidence interval for the total sample; and at most ± 4.9% for each state. The total numbers have been statistically weighted to reflect the true geographic distribution of voters throughout the region. Interviews within each state were distributed proportionally by region. Comparisons are made to similarly conducted surveys each year from 2011 to 2023. Bipartisan research team of New Bridge Strategy (R) and Fairbank, Maslin, Maullin, Metz & Associates (D).
AN OVERWHELMING MAJORITY OF U.S. HISPANICS PERCEIVE CLIMATE CHANGE AS A CRITICAL THREAT IN THE NEXT DECADE
HOW AMERICANS SEE CLIMATE CHANGE OVER THE NEXT 10 YEARS (2022) BY PERCENTAGE AND RACE/ETHNICITY
NOTE: The survey, conducted between July 15 and August 1, 2022, with a sample size of 3,106 respondents, displays participants’ ratings of climate change as a threat to the vital interests of the United States over the next 10 years. They could choose climate as a critical threat, important but not critical threat or not an important threat.
Source: The Chicago Council on Global Affairs, "Race, Ethnicity and American Views of Climate Change," Dina Smeltz, Craig Kafura, Candace Rondeaux, Heela Rasool-Ayub and Deborah Avant, May 2023 globalaffairs.org/sites/default/files/2023-05/FINAL%20-%20Climate%20Brief%20PDF.pdf IN 2022, MORE THAN 60% OF U.S. HISPANICS BELIEVED WE SHOULD BE TAKING ACTION NOW TO ADDRESS CLIMATE CHANGE
UNTIL WE ARE SURE THAT CLIMATE CHANGE IS REALLY A PROBLEM WE SHOULD NOT TAKE ANY STEPS THAT WOULD HAVE ECONOMIC COSTS.
THE PROBLEM OF CLIMATE CHANGE SHOULD BE ADDRESSED BUT ITS EFFECTS WILL BE GRADUAL SO WE CAN DEAL WITH THE PROBLEM GRADUALLY BY TAKING STEPS THAT ARE LOW IN COST.
CLIMATE CHANGE IS A SERIOUS AND PRESSING PROBLEM AND WE SHOULD TRY TAKING STEPS NOW EVEN IF THIS INVOLVES SIGNIFICANT COSTS.
NON-HISPANIC BLACK, NON-HISPANIC ASIAN, NATIVE HAWAIIAN/PACIFIC ISLANDER AMERICAN INDIAN OR ALASKA NATIVE HISPANIC
NOTE: The survey, conducted between July 15 and August 1, 2022, with a sample size of 3,106 respondents, displays responses regarding the issue of climate change. Respondents were presented with the three statements above and asked to indicate the one that comes closest to their point of view.
Source: The Chicago Council on Global Affairs, "Race, Ethnicity and American Views of Climate Change," Dina Smeltz, Craig Kafura, Candace Rondeaux, Heela Rasool-Ayub and Deborah Avant, May 2023 globalaffairs.org/sites/default/files/2023-05/FINAL%20-%20Climate%20Brief%20PDF.pdf
BY AARON GILBREATH
Verde Clean believes the future is bright—and green.
The company is a Hispanic-owned, eco-friendly facilities service company founded in Phoenix. The staff has decades of experience in the facilities services industry. The company is a certified Minority Business Enterprise (MBE) and most of our employees—from frontline staff to managers and executives—belong to minority groups. As a result, we understand the impact that commercial cleaning has on both human and ecological health. We are always brainstorming new ways to strengthen our environmental impact, increase our social contributions and lessen our carbon footprint. We currently have two key environmental initiatives that we are proud of:
• Verde Earth, a 100% green cleaning program; and
• our partnership with Veritree.
Green Seal, a global nonprofit committed to sustainability, recently certified our cleaning program, Verde Earth, which utilizes products, equipment and techniques approved and tested by trusted third-party environmental groups such as the
The ultimate goal is to give general consumers and other commercial cleaners access to an even wider variety of affordable, eco-friendly products that have been tested by a trusted, third party.
Environmental Protection Agency (EPA). Verde Earth works to emit fewer harmful compounds, improve indoor air quality for building occupants and reduce the levels of chemical, biological and particulate contaminants that can compromise air quality, human health, building finishes and building systems while also conserving energy, water and chemicals during cleaning. For Verde Earth, our green cleaning is always about the people involved.
It’s simple: When we clean green, we protect the minority groups who do the bulk of our country’s commercial cleaning, we protect the people who work in those clean spaces and we reduce our impact on the Earth’s interconnected ecosystems. Regardless of where you live or your background, everyone needs clean air, water and soil. And every janitorial worker deserves an employer who protects their health by using eco-friendly, nontoxic products and processes. Every day, we are all exposed to unhealthy chemicals in commercial and household cleaning products—but we do not have to be.
The other important initiative is our partnership with Veritree, an international organization that enables businesses to plant trees to restore ecosystems, enhance biodiversity and mitigate climate change. We always welcome ideas from all of our employees; in this case, it was our National Sales Manager Cameron Bell who came up with the idea of planting a tree whenever a potential customer booked a meeting with us.
We instantly loved Bell’s idea because it fits our mission and our larger vision. Our mission is to provide clean and healthy spaces to work, learn and play. Bell’s restoration idea fits our larger vision, which extends beyond green cleaning to help create a greener world.
Reforestation is usually the process of repairing wooded landscapes that deforestation or clearcut logging have damaged. Restoration happens on wildland, working timberland and farmland. It also happens underwater in kelp forests.
As a result, we focus our efforts in four areas:
• Kenya’s mangroves,
• Canada’s kelp forests and
• Oregon's burn zones.
When we revegetate, it benefits both humans and habitats and it strengthens the ecological systems that provide the clean air and water we all need. Verde is committed to planting 150,000 trees by 2030. We’re also committed to achieving a 30% green spend increase by 2027. For us, there’s what we can do as a company and there’s what we can do on a policy level. Lately, we’ve started investing more time in national advocacy.
To help ensure cleaner, healthier spaces, Amber Reyna, our chief revenue officer, sits on the government affairs board for the
International Sanitary Supply Assn. (ISSA), a trade association for the cleaning, hygiene and facilities management industry. She recently attended the ISSA Clean Advocacy Summit, held April 10–11 in Washington D.C., to advocate for legislation that impacts healthy and safe disinfecting products, labor shortage solutions and career development for essential workers.
As part of the summit, Reyna also met with the EPA to discuss their Safer Choice Program. The EPA does the necessary due diligence testing to then be able to approve new green cleaning products. When we met with legislators this spring, we advocated for increased EPA funding to help increase the amount of innovative eco-friendly products on the market. Although there are many general green cleaning products already available, a surprising number of gaps exist.
Some green products, for example, are just too expensive. Certain products could use improvements in their performance or design and others don’t even exist yet, such as durable eco-friendly floor wax. The ultimate goal is to give general consumers and other commercial cleaners access to an even wider variety of affordable,
ADVOCACY AND RESTORATION: GOING BEYOND GREEN CLEANING
Verde Clean
2323 W. Mescal St. #205 Phoenix, AZ 85029
888.249.8668 verde@verdeclean.com verdeclean.com
Verde Earth verdeclean.com/verdeearth
Green Seal
601 13th St. NW, 12th Floor Washington, DC 20005
202.872.6400 greenseal.org
Veritree
230 - 1275 Venables St. Vancouver, B.C., Canada, V6A 2E
1.604.255.1009 hello@veritree.com veritree.com
eco-friendly products that have been tested by a trusted third party. Access, quality green products and trust are critically important.
Over time, Verde intends to help set a new standard in the commercial cleaning industry, leading the way forward in a profession that has relied on harmful cleaning agents for far too long.
“It’s exciting to see, outside of what we do as cleaners, the imaginative ways we can make an impact on the industry,” says Reyna.
Aaron Gilbreath is Verde’s Proposal & Communications Writer. He has also written for Harper’s Magazine, The Atlantic and Sierra.
The International Sanitary Supply Assn. (ISSA) 10275 W. Higgins Rd., Suite 280 Rosemont, IL 60018
1.800.225.4772 (North America) 1.847.982.0800
FromtheNationalMinoritySupplierDevelopmentCouncil
Definition of an MBE nmsdc.org/certifications/definition-of-an-mbe
Certification Process nmsdc.org/certifications/certification-process
FromtheEnvironmentalProtectionAgency
Identifying Greener Cleaning Products epa.gov/greenerproducts/identifying-greener-cleaning-products
FromThe National Forest Foundation How We Restore Forests nationalforests.org/tree-planting-programs/how-we-restore-forests
Southwest Program nationalforests.org/regional-programs/southwest

Phoenix, Arizona is in an urban heat crisis, experiencing record-breaking temperatures and a high duration of extreme heat days. The rising temperatures pose serious health risks, particularly for unsheltered populations and has become increasingly fatal. Utilizing a heat risk index allows mitigation efforts to focus on high-risk areas. These efforts include increasing green spaces and enhancing community awareness and preparedness.


Extreme heat has become increasingly deadly in Phoenix, Arizona. In Maricopa County, approximately 61% of the heat-related deaths in 2023 occurred in Phoenix.
Maryvale, an urban village in Phoenix, has one of the top five highest heat-related death counts and also has the highest heat risk index. To reduce the continuously growing annual death toll from heat-related causes, extreme heat mitigation efforts are needed in regions with a high heat risk index.


Source: The Chicago Council on Global Affairs, "Race, Ethnicity and American Views of Climate Change," Dina Smeltz, Craig Kafura, Candace Rondeaux, Heela Rasool-Ayub and Deborah Avant, May 2023 globalaffairs.org/sites/default/files/2023-05/FINAL%20-%20Climate%20Brief%20PDF.pdf

From cultural celebrations and community gatherings to new opportunities and honored traditions, join us in keeping our communities vibrant and Arizona’s future bright.
• LIFE EXPECTANCY DECREASED FOR ALL MAJOR RACES/ETHNICITIES IN THE U.S. BETWEEN 2019 AND 2022
• IN 2021, HIGHER INCOME LED TO GREATER HEALTH CARE ACCESS FOR U.S. HISPANIC ADULTS
• IN 2022, MORE THAN ONE-THIRD OF NONELDERY U.S. HISPANIC ADULTS LACKED A PERSONAL HEALTH CARE PROVIDER
• A HIGHER PERCENTAGE OF U.S. HISPANIC CHILDREN WERE WITHOUT A REGULAR HEALTH CARE PROVIDER COMPARED TO OTHER GROUPS
• ASIAN TEENS HAVE SIGNIFICANTLY LOWER BIRTH RATES COMPARED TO OTHER RACES AND ETHNICITIES IN THE U.S.
• THE PERCENTAGE OF REPORTED ABORTIONS IN THE U.S. BY WOMEN AGES 30—39 INCREASED 21% FROM 2012 TO 2021
• U.S. NON-HISPANIC BLACKS HAVE THE HIGHEST ABORTION RATIO COMPARED TO OTHER RACES/ETHNICITIES
• IN 2022, THE MORTALITY RATE FOR BLACK INFANTS IN THE U.S. WAS THE HIGHEST COMPARED TO OTHER RACES/ ETHNICITIES
• AMERICAN INDIANS/ALASKA NATIVES HAD THE MOST DRAMATIC INCREASE IN SUICIDE RATES BETWEEN 2011 AND 2021
• IN 2022, ARIZONA WAS AMONG THE TOP FIVE STATES WITH THE HIGHEST DIABETES RATES FOR HISPANICS
• IN ARIZONA, HEART DISEASE WAS THE PRIMARY CAUSE OF DEATH IN 2021
• OVER HALF OF ARIZONANS DEPENDED ON THEIR EMPLOYER FOR HEALTH INSURANCE
• IN BOTH 2021 AND 2022, ONE IN TEN ARIZONANS LACKED HEALTH INSURANCE
• IN 2022, ALMOST ONE IN SIX HISPANICS IN ARIZONA HAD DIABETES
• IN 2022, HISPANICS AND WHITES SHOWED NEARLY THE SAME FREQUENT MENTAL DISTRESS TRENDS
• OPIOID DEATHS IN ARIZONA INCREASED A SHOCKING 259% FROM 2011 TO 2021
• ABORTIONS IN ARIZONA DISPROPORTIONATELY AFFECT COMMUNITIES OF COLOR
• IN 2021, MOST ABORTIONS IN ARIZONA WERE PERFORMED BETWEEN 7–9 WEEKS OF GESTATION
Univision Communications presents the facts on health care of all types for Hispanics in Phoenix and Tucson
IN FOCUS
Hospice of the Valley provides the care families need when their loved ones are facing the end of life BY LIN SUE FLOOD
IN FOCUS
IN FOCUS
Don’t Be Afraid to Get the Help You Need
Neurological diseases and disorders that affect the nervous system are scary, but many issues can be managed effectively with proper care BY NANCY
MARIE VARGAS
THE ABORTION DEBATE
Women’s Reproductive Rights Are Back in the Spotlight
With its unpopular Dobbs decision in 2022, SCOTUS abandoned 50 years of precedent and took away a fundamental right BY KAREN MURPHY
EXCERPT
DIFFERENTIAL RIGHTS
A study by the UCLA Latino Policy & Politics Institute has concluded that Latinas will be disproportionately impacted by the Supreme Court’s Dobbs decision because 46% of Latinas (over 5 million) live in states that restrict the reproductive rights of women
EXCERPT
According to a report from The Commonwealth Fund, compared to other states in the Southwest region, Arizona has more severe racial and ethnic health disparities
LIFE EXPECTANCY DECREASED FOR ALL MAJOR RACES/ ETHNICITIES IN THE U.S. BETWEEN 2019 AND 2022
Source: KFF, "Key Data on Health and Health Care by Race and Ethnicity," Nambi Ndugga, Hill and Samantha Artiga, June 11, 2024 www.kff.org/key-data-on-health-and-health-care-by-race-and-ethnicity/?entry=executive-summary-introduction
NOTE: Survey conducted Nov. 30—Dec 12, 2021.
Source: Pew Research Center, "5 Facts About Hispanic Americans and Health Care," Alec Tyson and Mark Hugo Lopez, October 30, 2023 www.pewresearch.org/short-reads/2023/10/30/5-facts-about-hispanic-americans-and-health-care/
IN 2022, MORE THAN ONE-THIRD OF NONELDERLY U.S. HISPANIC ADULTS LACKED A PERSONAL HEALTH CARE PROVIDER
Source: KFF, "Key Data on Health and Health Care by Race and Ethnicity," Nambi Ndugga, Latoya Hill and Samantha Artiga, June 11, 2024 www.kff.org/key-data-on-health-and-health-care-by-race-and-ethnicity/?entry=executive-summary-introduction A HIGHER PERCENT OF U.S. HISPANIC CHILDREN WERE WITHOUT A REGULAR HEALTH CARE PROVIDER COMPARED TO OTHER GROUPS
ASIAN TEENS HAVE SIGNIFICANTLY LOWER BIRTH RATES COMPARED TO OTHER RACES AND ETHNICITIES IN THE U.S.
*NOTE: Data from 43 reporting areas; excludes nine reporting areas (California, District of Columbia, Florida, Maine, Maryland, New Hampshire, New Jersey, Tennessee and Wyoming) that did not report, did not report by age or did not meet reporting standards for ≥1 year.
Source: U.S. Department of Health & Human Services, U.S. Centers for Disease Control and Protection (CDC), "Abortion Surveillance — United States, 2021" Katherine Kortsmit etal.,November 24, 2023 www.cdc.gov/mmwr/volumes/72/ss/ss7209a1.htm
U.S. NON-HISPANIC BLACKS HAVE THE HIGHEST ABORTION RATIO COMPARED TO OTHER RACES/ ETHNICITIES
U.S. REPORTED ABORTION RATIO IN 2021 PER 1,000 LIVE BIRTHS* BY RACE/ ETHNICITY (SELECTED REPORTING AREAS)**
NOTES:
*Number of abortions obtained by women in a specific racial and ethnic group per 1,000 live births to women in that same racial and ethnic group. For the total abortion ratio only, abortions for women of unknown race and ethnicity were distributed according to the distribution of abortions among women of known race and ethnicity.
**Data from 33 reporting areas; excludes 19 reporting areas (California, Colorado, Hawaii, Illinois, Iowa, Louisiana, Maryland, Massachusetts, Nebraska, New Hampshire, New Jersey, New York State, North Dakota, Ohio, Oklahoma, Pennsylvania, Rhode Island, Washington and Wisconsin) that did not report, did not report by race and ethnicity or did not meet reporting standards.
***Including Alaska Native, American Indian, Asian (Indian, Chinese, Filipino, Japanese, Korean, Vietnamese or other Asian), Native Hawaiian and other Pacific Islander (Native Hawaiian, Guamanian or Chamorro, Samoan or other Pacific Islander), other races and multiple races.
Source: U.S. Department of Health & Human Services, U.S. Centers for Disease Control and Protection (CDC), "Abortion Surveillance — United States, 2021" Katherine Kortsmit etal.,November 24, 2023 www.cdc.gov/mmwr/volumes/72/ss/ss7209a1.htm IN 2022, THE MORTALITY RATE FOR BLACK INFANTS IN THE U.S. WAS THE
U.S. INFANT MORTALITY RATES (PER 1,000 LIVE BIRTHS) BY RACE/ETHNICITY (2022)
Source: KFF, "Key Data on Health and Health Care by Race and Ethnicity," Nambi Ndugga, Latoya Hill and Samantha Artiga, June 11, 2024 www.kff.org/key-data-on-health-and-health-care-by-race-and-ethnicity/?entry=executive-summary-introduction
THE TOP 5 CAUSES OF DEATH IN ARIZONA (2021)
Source: Arizona Department of Health Services, “Arizona State Health Assessment, 2022 Annual Update” www.azdhs.gov/documents/operations/strategic-initiatives/arizona-state-health-assessment-2022.pdf
IN BOTH 2021 AND 2022, ONE IN TEN ARIZONANS LACKED HEALTH INSURANCE
Source: U.S. Census Bureau, "Percentage of Population Without Health Insurance Coverage by State: 2021 and 2022," September 14, 2023 www.census.gov/library/visualizations/interactive/percentage-without-health-insurance-coverage-by-state-2021-2022.html IN 2022, ALMOST ONE IN SIX HISPANICS IN ARIZONA HAD DIABETES
NUMBER AND PERCENTAGE OF REPORTED ABORTIONS IN SELECTED REPORTING AREAS IN THE U.S.* & ARIZONA BY KNOWN RACE/ETHNICITY (2021)
13,374
NOTES: *Data from 33 reporting areas; excludes 19 reporting areas (California, Colorado, Hawaii, Illinois, Iowa, Louisiana, Maryland, Massachusetts, Nebraska, New Hampshire, New Jersey, New York State, North Dakota, Ohio, Oklahoma, Pennsylvania, Rhode Island, Washington and Wisconsin) that did not report, did not report by race and ethnicity or did not meet reporting standards.
** Including Alaska Native, American Indian, Asian (Indian, Chinese, Filipino, Japanese, Korean, Vietnamese or other Asian), Native Hawaiian and other Pacific Islander (Native Hawaiian, Guamanian or Chamorro, Samoan or other Pacific Islander), other races and multiple races.
NUMBER AND PERCENTAGE OF REPORTED ABORTIONS IN SELECTED REPORTING AREAS IN THE U.S.* & ARIZONA BY KNOWN WEEKS OF GESTATION** (2021)
476,937
13,997
NOTES: *Data from 41 reporting areas; excludes 11 reporting areas (California, Connecticut, District of Columbia, Illinois, Maryland, Massachusetts, New Hampshire, New Jersey, New York State, Pennsylvania and Wisconsin) that did not report, did not report by gestational age or did not meet reporting standards.
**Gestational age based on clinician’s estimate (Alaska, Arizona, Colorado, Delaware, Florida, Georgia, Hawaii, Idaho, Indiana, Iowa, Kansas, Kentucky, Louisiana, Maine, Michigan, Minnesota, Mississippi, Missouri, Montana, Nebraska, Nevada, New Mexico, New York City, North Carolina, North Dakota, Ohio oregon, Rhode Island, South Dakota, Tennessee, Vermont, Washington, West Virginia and Wyoming); gestational age calculated from the last normal menstrual period (Oklahoma and Utah); clinician’s estimate of gestation based on estimated date of conception (Virginia); and probable postfertilization age (Alabama, Arkansas, South Carolina and Texas).
Source: U.S. Department of Health & human Services, U.S. Centers for Disease Control and Protection (CDC), "Abortion Surveillance — United States, 2021" Katherine Kortsmit et al., November 24, 2023 www.cdc.gov/mmwr/volumes/72/ss/ss7209a1.htm
SERVICES
CONSUMER PROFILE (received dental care in the past 12 months)
HISPANICS ARE YOUNG *

491K
Or 43% of Hispanics in Phoenix Visited a Dentist in the Past Year
59% of Hispanics are between 25-54 years; whereas 59% of Non-Hispanics are over the age of 50
HISPANICS HAVE MORE CHILDREN **
45% of Hispanic households have children compared to 23% of Non-Hispanics
HISPANICS ARE PROJECTED TO SPEND $2.4 BILLION ON HEALTHCARE2
47K Or 4% Used an Orthodontist in the Past Year
56K Or 5% Received Dental Implants in the Past 3 Years
468K Or 41% Have Dental Insurance 3

12K
Or 42% of Hispanics in Tucson Visited a Dentist in the Past Year
13K Or 4% Received Dental Implants in the Past 3 Years


233K


721K


6 5

1 in 4


At Blue Cross® Blue Shield® of Arizona, we believe in investing in the health of Arizona. Our tradition of philanthropy has resulted in millions invested to support the health and vibrancy of every Arizonan. Our corporate giving program funds a select number of event sponsorships and corporate memberships every year. Grant opportunities for programmatic impact and applied research are available through the Blue Cross Blue Shield of Arizona Foundation for Community & Health Advancement. We’re based in Arizona, and we love it here. And we wake up every day looking forward to helping you be your healthiest.
BY LIN SUE FLOOD
When Isidora Dominguez’s doctor suggested it was time for hospice, her daughter Gladis wasn’t sure what to expect. She had no idea that a bilingual care team would come to their home to provide comfort, dignity and compassionate care for her 82-yearold mother—and three generations of their family.
“Hospice is help, trust and hope,” Gladis discovered. “It’s important that we share that message with other Hispanic families.”
Unfortunately, many families in the Hispanic community do not seek this support, often due to cultural misconceptions about hospice care.
• There is a significant decline in physical and/or cognitive status despite medical treatment. This may include increased pain or other symptoms, substantial weight loss, extreme fatigue, shortness of breath or weakness.
• The goal is to live more comfortably and forego the often physically debilitating treatments that have been unsuccessful in curing or halting a life-threatening illness.
• Life expectancy is six months or less, according to physicians.
• The person is in the end stage of Alzheimer’s or dementia.
—Hospice Foundation of America

Hospice of the Valley social worker Suzanne Sanchez co-hosts a radio program on La Onda (1190 AM) to help dispel myths about hospice care.
“In Spanish, the term hospice translates to hospicio, which is primarily an institution for the mentally ill,” Sanchez says. “In this country, hospice helps families care for a loved one with a terminal illness in the comfort of home, so they’re not alone.”
Studies show hospice care greatly enhances quality of life.
“Correcting cultural perceptions is difficult,” says Hospice of the Valley volunteer coordinator Elizabeth Avina, who grew up in Guadalajara, “especially since Latinos traditionally do not like to talk about death and are afraid it might upset the person who is ill.”
Hospice of the Valley, which has been serving the local community for 47 years, is the only nonprofit hospice in Maricopa County— caring for all in need, regardless of financial resources. It recognized early on that bilingual care teams were needed to ensure that Spanish-speaking families have access to hospice services.
“We work together to break down cultural and language barriers about hospice,” says nurse Connie Phillips Mendoza, a Mexican
native who leads Hospice of the Valley’s after-hours department. “We want to make sure people are aware of all that is available to them, especially those without consistent health care .”
Dedicated teams of bilingual doctors, nurses, nursing assistants, social workers and chaplains provide culturally sensitive patient care wherever patients live—in Maricopa County, as well as northern Pinal County and Tucson. Hispanic volunteers are matched with Spanish-speaking patients to offer companionship and give family members a break from caregiving.
“Everybody wants the best care, love and respect. That’s universal. That’s why it’s so important to be able to communicate with my patients in Spanish,” says Giancarlo Fratiglioni, a Venezuelan-born nurse for Hospice of the Valley.
urgent needs. Hispanic families served by Hospice of the Valley can receive grief support from Spanish-speaking bereavement counselors. In addition, free grief support groups such as Luz del Corazón (tailored specifically for Spanish and bilingual speakers) are open to anyone in the community mourning a death.
Hospice of the Valley continues to expand supportive care programs to serve families long before hospice services are needed— managing chronic illnesses like cancer and heart disease, as well as improving the quality of life for those living with Alzheimer’s and other types of dementia.
A Spanish Help Line is available 24/7 so families can reach a Spanish speaker any time of the day or night with questions or
This comprehensive in-home support prevents hospitalization and helps family members nurture their own well-being while caring for their loved ones. Hospice care is fully covered as a Medicare benefit. Even those without Medicare or insurance can be assured they will receive exceptional care.
SERVING THE PHOENIX COMMUNITY WITH CULTURALLY SENSITIVE CARE
“It is our goal, each and every day, to educate the Hispanic community that this beautiful care exists to support and keep families together,” says Hospice of the Valley nurse Erica Coronado, who was part of the team that cared for Isidora Dominguez.
Her daughter Gladis just hopes more people get to experience the same “legado para el cuidado”—legacy of caring—that her family did.
LinSueFloodisthecommunityengagementdirectorforHospiceofthe Valley. She was a news anchor (Lin Sue Cooney) in Phoenix at KPNX12 for 31 years and was inspired to join Hospice of the Valley by the excellent care afamilymemberreceived.

Hospice of the Valley 1510 E. Flower St. Phoenix, AZ 85014 602.539.6000 | 602.287.3998 (Spanish) hov.org
Supportive and Hospice Programs hov.org/our-care dementiacampus.org/care-at-home
Click the Google translate button on the bottom left of the page to view in Spanish.
La Onda Radio laonda1190am.com
HISPANIC VOLUNTEER PROGRAM
Spanish-speaking community volunteers give their time and talents to provide companionship and respite to our Hispanic patients and families. More Info Elizabeth Avina eavina@hov.org
Hospice Foundation of America MON–FRI, 9am–5pm ET 202.457.5811 | 800.854.3402 hospicefoundation.org/Hospice-Care/Hospice-Services
From the National Institute on Aging End of Life nia.nih.gov/health/end-life
From BMC Palliat Care (May 17, 2021) Why is hospice care important? An exploration of its benefits for patients with terminal cancer bmcpalliatcare.biomedcentral.com/articles
FromtheJournalofFamilyMedicineandPrimaryCare (August2022)
Hospice vs Palliative care: A comprehensive review for primary care physician journals.lww.com/jfmpc/fulltext/2022/08000/hospice_ vs_palliative_care__a_comprehensive_review.11.aspx


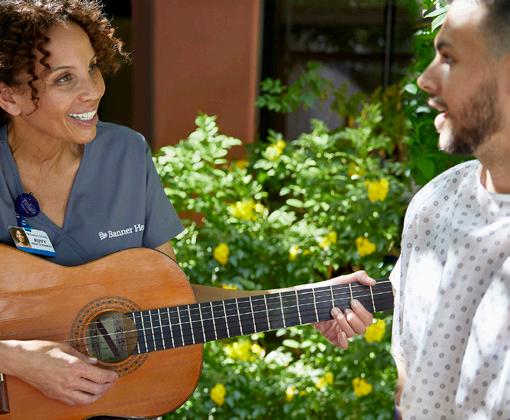
Neurologicaldiseasesanddisordersthataffectthenervoussystem arescary,butmanyissuescanbemanagedeffectivelywithpropercare
BY NANCY MARIE VARGAS
No race or ethnicity is immune to brain diseases—but there are alarming differences in the diagnosis of the diseases and their outcomes based on race and ethnicity. According to the American Brain Foundation, which was founded by the American Academy of Neurology, studies have shown that people of color and those in lower socioeconomic groups and underserved areas in the United States are disproportionately affected.
In fact, the foundation says, Black and Latino individuals “are consistently underdiagnosed and have less access to early, effective care, resulting in poorer outcomes compared to their white counterparts. These differences in diagnosis and care are referred to as neurodisparities and are a major challenge to achieving equity in brain health.”
Why is this happening? In a study conducted by the Alzheimer’s Association, 36% of Hispanic Americans said they believed “that
“ [Blacks and Latinos] are consistently underdiagnosed and have less access to early, effective care [for neurological issues], resulting in poorer outcomes compared to their white counterparts. These differences...are a major challenge to achieving equity in brain health.”
medical research is biased against people of color, which limits their willingness to participate in studies.”
A critical medical issue for the Hispanic community in recent years is the disproportionate increase in the incidence of stroke and epilepsy. According to the American Stroke Association, stroke is the fifth-leading cause of death in the U.S. and Hispanics face an even higher risk: It is the fourth cause of death for Hispanic men and the third cause of death for women. Uncontrolled high blood pressure, diabetes and obesity are three major risk factors that contribute to a stroke.
According to the Epilepsy Foundation, of the 3.4 million people in the United States who have epilepsy, 710,000 are Latino. In other words, more than 20% of people with epilepsy in the U.S. are Latino. Since 19% of U.S. residents identify as Hispanic/Latino, it means that compared to other groups, a slightly higher proportion of Latinos have epilepsy.
While several controllable risk factors can cause strokes, the causes of epilepsy, a brain disease that causes seizures, are less clear, according to the Epilepsy Foundation. In fact, the foundation says about 50% of people with epilepsy have an unknown cause. Although there currently is no cure for epilepsy, there are many treatment options available and the condition can often be managed effectively with medication.

The Cleveland Clinic defines a neurosurgeon as “a medical doctor who diagnoses and treats conditions that affect the nervous system, including the brain, spinal cord and nerves.” Strokes and epilepsy are just two of the conditions that fall into this category.
With proper care, many of these neurological issues can be managed effectively. In the Phoenix metro area, help can be found at Banner Brain and Spine, a unit of Banner – University Medical Center Phoenix. There are two convenient Phoenix locations, where brain and spine specialists provide compassionate, expert care using state-of-the-art technology and the latest treatment options.
The Banner Brain & Spine Phoenix campus has a bilingual multicultural team to better serve the local Hispanic community’s neurosurgical care needs. To eliminate some of the barriers the Hispanic community often faces when dealing with the U.S. health care system, materials are offered in Spanish and English to ensure patients receive vital information in their preferred language.
The Banner multidisciplinary neuroscience team is led by Dr. Peter Nakaji, a world-renowned neurosurgical pioneer. To enhance the care it provides, the team works in concert with multiple subspecialties, including neurology, neuro-oncology, radiation
The Banner Neuroscience Institute Appointments, insurance, referrals, medical needs and more 602.521.3300
Central Phoenix
Banner – University Medical Center Phoenix campus
Banner – University Medicine Neurosurgery Clinic
755 E. McDowell Rd., 2nd Floor Phoenix, AZ 85006
602.521.3550
Phoenix/Arcadia
Banner Health Center Plus 4200 E. Camelback Rd. Phoenix, AZ 85016 602.229.2200
Banner Children’s Specialists Neurology and Neurosurgery Clinic
1432 S. Dobson Rd., Ste 403 Mesa, AZ 85202 480.412.7473
Banner Children’s Specialists
Neurology Clinic 5310 W. Thunderbird Rd., Ste 301 Glendale, AZ 85306 602.865.4442
bannerhealth.com
From iMotionsA/S A Beginner’s Guide to Neuroscience imotions.com/blog/learning/ research-fundamentals/ beginners-guide-neuroscience
From ABC Owned Television StationsinpartnershipwithABC News
OUR AMERICA: UNFORGETTABLE Alzheimer’s Through Hispanic Lens ouramericaabc.com/ unforgettable This hour-long special looks at the alarming data of Alzheimer's disease through a Hispanic/
Latino lens. It follows two families whose lives have been devastated by the disease.
From the American Stroke Association
Let’s Talk About Hispanic and Latino Americans and Stroke stroke.org/en/help-and-support/ resource-library/lets-talk-aboutstroke/hispanic-and-latinoamericans
Fromthe EpilepsyFoundation Epilepsy and Seizures in the Hispanic Community epilepsy.com/stories/ epilepsy-and-seizures-hispaniccommunity
Facts & Statistics About Epilepsy epilepsy.com/what-is-epilepsy/ statistics
Toll-free Helpline en Español 1.866.748.8008
The Hispanic Medical Association nhmamd.org HispanicHealth.info hispanichealth.info
The HispanicHealth.info website was created in 2002 by the National Hispanic Medical Association in coordination with NHMA’s Council of Medical Societies, Latino Health Advocacy Organizations and the Hispanic Health Professionals Leadership Network to share resources with and improve the health of patients, providers and community members.
BrainFacts.org brainfacts.org
An editorially independent source of brain and nervous system information presented by the Society for Neuroscience
DON’T BE AFRAID TO GET THE HELP YOU NEED
oncology, interventional radiology, psychiatry, neuropsychology and rehabilitation.
“Banner Health is dedicated to improving the neurosurgical health of all patients,” says Dr. Peter Nakaji, Physician Executive of Neurosciences at Banner Health and Chair of Neurosurgery at the University of Arizona College of Medicine and Banner University Medical Center Phoenix. “We recognize that different communities have their own needs. Our customized program approach is intended to improve outreach and access, which will overcome barriers so we can achieve the kinds of excellent outcomes that everyone deserves.”
Nancy Marie Vargas is the senior outreach program manager for Banner University Medicine–Neurosurgery in Phoenix. She serves as the program/physician liaison and is responsible for the development of community outreach, operational and strategic planning and the creationofprogramsanddeliverysystemsthatmeetcommunityneeds.
• Brain tumors
• Cerebrovascular diseases/disorders
• Cervical and lumbar radicular pain
• Chiari malformations
• Chronic regional pain syndrome (CRPS)
• Complex spine and spinal cord surgery
• Deep brain stimulation
• Degenerative, traumatic and neoplastic spinal conditions
• Epilepsy
• Functional neurosurgery
• Lower back pain
• Movement disorders
• Neurosurgical management of chronic pain disorders
• Obsessive compulsive disorder (OCD)
• Parkinson’s disease
• Pituitary disease and tumors
• Skull base disorders and tumors
• Tremor
• Vascular neurosurgery
WithitsunpopularDobbsdecisionin2022,SCOTUSabandoned 50yearsofprecedentandtookawayafundamentalright
BY KAREN MURPHY
Here we are again. Almost 50 years after the U.S. Supreme Court’s Roe v. Wade decision recognized a woman’s right to have an abortion, the current U.S. Supreme Court (SCOTUS) overturned that 1973 landmark ruling.
In Dobbs v. Jackson Women’s Health Organization, SCOTUS reviewed the constitutionality of Mississippi’s Gestational Age Act, which banned most abortions after 15 weeks of pregnancy with exceptions for medical emergencies and fetal abnormalities. In a divided opinion, on June 24, 2024, SCOTUS upheld the Mississippi law, reversing a 2018 injunction by the Court of Appeals for the Fifth Circuit and overturned Roev.Wade(1973) and Planned Parenthood v.Casey (1992)—concluding that the Constitution does not protect the right to an abortion.
From 1972 to 1974, the mortality rate due to illegal abortion for nonwhite women was 12 times that for white women.
—Centers for Disease Control and Prevention
After an Arizona Supreme Court ruled in April that the 160-year-old total abortion ban still on the books was enforceable, both the Arizona House and Senate voted quickly to repeal the law. The 1864-era ban is unlikely to take effect since, at press time, H.B. 2677 was supposed to become law on Sept. 14—and court orders have stayed the 1864-era ban until at least Sept. 27. The antiquated law made it a felony punishable by two to five years in prison for anyone who performs an abortion or helps a woman get one.
On July 3, abortion rights activists sprang into action, submitting 823,000+ signatures—more than twice as many as required—to put Proposition 139, an abortion access measure, before voters in November.
"There [currently] are no protections for victims of rape or incest. There are very limited protections for medical emergencies and we just don’t feel that that’s enough," Chris Love, a spokesperson with Arizona for Abortion Access, said in a story on the Fox10 website.
If Prop. 139 is approved by voters, the state would not be able to ban abortion until a fetus is viable, with later abortions allowed to protect a woman’s physical or mental health. The concept of viability addresses whether a fetus would survive outside of the uterus—and, according to KFF, that is generally presumed to occur around 24 weeks. In Arizona, abortion is currently legal only for the first 15 weeks of pregnancy.
As a result, the Court’s decision returned the issue of abortion regulation to the states. In a joint dissent, Justices Stephen G. Breyer (who retired on June 30, 2022 and was replaced by Justice Ketanji Brown Jackson), Elena Kagan and Sonia Sotomayor criticized the Court “for unsettling nearly five decades of precedent and undermining the Constitution’s promise of freedom and equality for women.”
According to the Center for Reproductive Rights, the recent Supreme Court ruling “…marked the first time in history that the Supreme Court has taken away a fundamental right.”
While the pro-choice vs. pro-life debate rages on, according to the Pew Research Center, most Americans do believe that abortion should be legal in some cases but illegal in others.
According to the CDC’s Abortion Surveillance Data for 2021, prior to the Dobbs decision:
• 96%
• 3%
• just 1% of abortions occurred at or before 15 weeks of gestation, occurred between 16 to 20 weeks of gestation of abortions were performed at or after 21 weeks.
FromtheArizona Department ofHealth Services Abortions in Arizona: 2022 Abortion Report (.pdf) azdhs.gov
FromArizonaAttorneyGeneral Kris Mayes Arizona Abortion Laws (.pdf) azag.gov
The Supreme Court’s ruling, which is unpopular among U.S. voters, is also out of step with global trends in abortion law, according to the Council on Foreign Relations. In Latin America, for example, Colombia made abortion legal on demand up to 24 weeks of pregnancy and Mexico decriminalized the procedure, removing its ban from the federal penal code.
“The global trend in abortion law has been toward liberalization,” the Council says on its website. “In the last 30 years, more than 60 countries have changed their abortion laws and all but four—the United States, El Salvador, Nicaragua and Poland—expanded the legal grounds on which women can access abortion services.”
Abortion has been a divisive issue for so long in the United States that it is almost hard to believe that when America was born, it was almost a nonissue. Then, in 1857, Horatio Robinson Storer, a Harvard-educated surgeon and anti-abortion rights activist, convinced the members of American Medical Assn., which had just been formed 10 years earlier, to join his crusade against abortion.
According to The Embryo Project, administered by Arizona State University’s Center for Biology and Society in the School of Life Sciences, Storer was appointed to chair the AMA’s Committee on Criminal Abortion and authored the committee’s position paper that was adopted by the AMA in 1859 as its official stance. In 1860, the report was published as a book titled On Criminal Abortion in America—and it remained the official AMA policy for more than 100 years—until 1967. According to a 1970 article in The New York Times, the AMA finally softened its position “to allow abortions if the mental health of the mother was in danger, if the child would be born deformed, if the conception took place through rape or incest.”
The AMA’s website now includes this strongly worded statement: “The AMA strongly opposes government interference in health care. The AMA also supports patient access to the full spectrum of reproductive health care options, including abortion and contraception, as a right.”
According to a November 2022 article on the AMA’s website, thenAMA President Jack Resneck Jr. had this to say at a 2022 AMA Interim Meeting:
“Since the Dobbs decision, health care in the United States has been thrown into chaos, with life-or-death decisions deferred to hospital lawyers, patients needing care driven across state lines and uncertainty over the future of access to reproductive health care,” Resneck said. “Patients and physicians need assurances that they won’t be accused of crimes for medically necessary treatment.
Unfortunately, this is the post-Dobbs world we now face. The fact that medically necessary treatment can be criminalized speaks volumes about these misguided abortion laws.”
Both Planned Parenthood and the late Supreme Court Justice Ruth Bader Ginsburg—two supporters of the Supreme Court’s 1973 Roe v. Wade decision—have said that it was always flawed.
Abortion was legal in the U.S. until quickening, defined as when the mother could feel fetal motion.
The American Medical Assn. (AMA) was created.
Harvard Medical Graduate Horatio Robinson Storer led a successful crusade to end abortion.
At least 40 anti-abortion statutes were enacted.
The Comstock Act
The act banned mailing obscene materials and made it illegal to sell or mail contraceptives or substances and instruments that could produce an abortion. It has never been repealed.
Abortion was illegal at every stage in pregnancy in every state, except to save a patient’s life.
Unsafe, illegal abortions were the cause of death for nearly 2,700 women—almost one out of every five (18%) of recorded maternal deaths that year, according to the Guttmacher Institute.
The National Association for the Repeal of Abortion Laws (NARAL) was established at the First National Conference on Abortion Laws in Chicago after public support for abortion law reform increased when a pregnant TV host who ingested thalidomide could not obtain a legal abortion in the U.S. in 1962 and had to go to Sweden to get care.
Four states—Alaska, Hawaii, New York and Washington repealed their abortion bans and 13 other states enacted reforms that expanded exceptions.
Abortion became legal in New York state.
Roe v. Wade
The U.S. Supreme Court’s landmark decision protected the right to abortion in all 50 states.
Dobbsv.JacksonWomen’sHealthOrganization
On June 24, 2022, the U.S. Supreme Court reversed a 2018 Mississippi court injunction, found there was no constitutional right to abortion and overruled Roe v. Wade (1973) and Planned Parenthood of Southeastern Pa. v. Casey (1992).
“It did say people had the right to abortion,” Planned Parenthood says, “but it never protected people's access to abortion. Lots of states passed laws that made getting an abortion nearly impossible.”
The Hyde Amendment, named for its chief sponsor, Rep. Henry Hyde (R-IL), was one of those laws. The original amendment, passed Sept. 30, 1976, blocked federal Medicaid funding for abortion services, which hit women of color the hardest. Since 1994, thanks to an act signed by then-President Bill Clinton, the amendment was at least expanded to allow funding for cases of rape and incest. According to KFF (formerly the Kaiser Family
Foundation), of the 36 states that do not ban abortion, 17 use state funds to pay for abortions for women with low incomes insured by Medicaid and 19 states and DC follow the Hyde Amendment.
Making abortion illegal, however, has never stopped women from having abortions; it only made the procedures more unsafe. In 1930, according to the Guttmacher Institute, nearly 2700 women died because of illegal abortions—and, according to the Institute, estimates of the number of illegal abortions in the 1950s and 1960s ranged from 200,000 to 1.2 million per year.
“One analysis, extrapolating from data from North Carolina, concluded that an estimated 829,000 illegal or self-induced
THE ABORTION DEBATE: WOMEN’S REPRODUCTIVE RIGHTS ARE BACK IN THE SPOTLIGHT
abortions occurred in 1967,” Rachel Benson Gold wrote in a March 2003 article in the Guttmacher Policy Review.
Between 1967 and 1973, four states—Alaska, Hawaii, New York and Washington—repealed their abortion bans entirely, while 13 others enacted reforms that expanded exceptions, according to Planned Parenthood. In its Roe decision, the Supreme Court ruled 7–2 that “the decision whether to continue or end a pregnancy belongs to the individual, not the government.”
The landmark ruling made state abortion bans unconstitutional and abortion care legal, more accessible to many and safer. However, the Centers for Disease Control and Prevention has statistics to confirm that “accessible” does not always apply to everyone. According to the CDC, minority women have always suffered the most in terms of getting the care they need. Consider this chilling fact: From 1972 to 1974, the mortality rate due to illegal abortion for nonwhite women was 12 times that for white women.
Abortion has once again become a hot-button issue, with fervent activists on both sides. In a July 30, 2024, article, Forbes reported these notable facts:
• Gallup polls show that 85% of Americans believe abortion should be legal.
• A Pew Research poll says that since the Dobbs ruling, support for abortion went up from 61% to 63%. It also found that a majority of every race supported abortion being legal in all or most cases—Blacks and Asians (73%), Hispanics (62%) and Whites (59%).
• The Public Religion Research Institute (PRRI) poll found that majorities of residents in all but five states support abortion being at least mostly legal—with the exceptions being Arkansas (46% support it being legal), Idaho (45%), North Dakota (47%), South Dakota (47%) and Utah (45%).
• Polling done in June by The Associated Press-NORC Center for
From the U.S. Supreme Court Dobbsv.JacksonWomen’s Health Organization
Full text of the 2022 Supreme Court ruling (.pdf) supreme.justia.com
From the National Constitution Center Dobbs v. Jackson Women’s Health Organization (2022) constitutioncenter.org
From The NewYork Times
Tracking Abortion Bans Across the Country nytimes.com/interactive/2024
From the Pew Research Center
What the data says about abortion in the U.S. pewresearch.org/short-reads/2024
From Forbes How Americans Really Feel about Abortion: The Sometimes Surprising Poll Results As DNC Gets Underway (Aug. 20, 2024) forbes.com/sites/alisondurkee/2024
From PBS News
Which states could have abortion rights on the ballot in November? www.pbs.org/newshour
FromtheGuttmacherPolicyReview(March1,2003)
Lessons from Before Roe: Will Past be Prologue? guttmacher.org/gpr/2003
From Ballotpedia
Abortion regulations by state ballotpedia.org/Abortion_regulations_by_state
FromtheCenterforReproductiveRights Roe v. Wade reproductiverights.org/roe-v-wade
FromtheCouncilonForeignRelations Abortion Law: Global Comparisons cfr.org
Public Affairs Research at the University of Chicago found that 79% of voters oppose a federal law that would ban abortion nationwide—including 64% of Republicans—and a majority would also oppose federal bans on abortion after six weeks (73% opposed) and 15 weeks (60% opposed).
In the November 2024 presidential election, several states, including Arizona, will have ballot measures for voters to consider. If you wonder how the current battle over women’s right to choose might turn out, consider this fact from PBS News: Since 2022, voters in California, Kansas, Kentucky, Michigan, Montana, Ohio
and Vermont all have had abortion questions put before them—and the majority of voters sided with abortion rights supporters.
After the Dobbs decision, some pro-choice activists still worry that the fictional dystopian horror of Margaret Atwood’s novel, The Handmaid’s Tale, might become our reality. If you consider voters’ reactions so far to ballot initiatives about abortion, it seems clear that voters are sending politicians a strong message: We will not let that happen here.

DIFFERENTIAL RIGHTS HOW ABORTION BANS IMPACT LATINAS IN THEIR CHILDBEARING YEARS

Josefina Flores Morales, PhD in sociology, UCLA, Julia Hernandez Nierenberg, MSW-MPP candidate, UCLA
Source: UCLA Latino Policy & Politics Institute, “Differential Rights: How Abortion Bans Impact Latinas in Their Childbearing Years,” Josefina Flores Morales and Julia Hernandez Nierenberg, December 13, 2022 latino.ucla.edu/research/abortion-bans-latinas/
On June 24, 2022, in its ruling on Dobbs v. Jackson Women’s Health Organization, the Supreme Court overturned Roe v. Wade and the constitutional right to obtain an abortion, threatening the reproductive rights and autonomy of women and childbearing persons in the United States. As a young and growing demographic in the United States, Latinas will be disproportionately impacted by this court ruling and its forthcoming consequences. Compared to non-Hispanic white women, a larger share of Latinas are of childbearing age (defined as ages 18 to 44). The Dobbs ruling has reopened the conversation surrounding reproductive health equity within the United States.1 Latinas need to be at the forefront of policy discussions about reproductive rights and justice.
Using data from the U.S. Census Bureau’s American Community Survey, this data brief assesses how many cisgender Latinas in the United States will be impacted by the Dobbs decision. It also examines the share and growth of Latinas of childbearing age in states with restrictive abortion laws.
The key findings from this study are:
1. In 2019, more than half (about 58%) of adult Latinas in the United States were of childbearing age.
2 About 46% of Latinas and 60% of non-Hispanic white women of childbearing age live in states that restrict the reproductive rights of women. This amounts to over 5 million Latinas at risk of being impacted by restrictions.
3. In abortion-restrictive states, a greater share of Latina women are of childbearing age compared to non-Hispanic white women.
4 In abortion-restrictive states, the number of Latina women of childbearing age grew substantially from 2010 to 2019.

"Today, the Court … says that from the very moment of fertilization, a woman has no rights to speak of. A State can force her to bring a pregnancy to term, even at the steepest personal and familial costs."2
"Whatever the exact scope of the coming laws, one result of today’s decision is certain: the curtailment of women’s rights, and of their status as free and equal citizens."3
-Justices Breyer, Sotomayor, and Kagan, dissenting opinion
On June 24, 2022, in its ruling on Dobbs v. Jackson Women’s Health Organization, the Supreme Court overturned Roe v. Wade and the constitutional right to obtain an abortion. This decision threatens the reproductive rights and autonomy of women and childbearing persons in the United States. As a young and growing demographic, Latinas will be disproportionately impacted by this court ruling and its forthcoming consequences.
Previous research indicates that women of color and younger women obtain abortions at higher rates than other women.4 Compared to non-Hispanic white women, Latinas are younger, have a lower socioeconomic status, have lower rates of health insurance coverage, and are less represented at policy decision-making tables.5 Before the Dobbs decision, Latinas already faced numerous barriers to accessing health care, and in the new reality of a post-Roe nation, protecting reproductive rights for Latinas will be an even greater challenge. Approximately 6.5 million Latinas ages 15 to 49 live in states with abortion restrictions and slightly less than half of those Latinas are economically insecure.6
The health and lives of women of color are at stake and under threat in many states across the nation. Reproductive rights issues post-Roe will be disproportionately harmful to Latinas given the younger age of Latinas, their growth, and dispersion in the United States7 compared with non-Hispanic white women.
In some states, the Supreme Court decision to overturn Roe activated or reinstated abortion bans and other abortion restrictions.8 These state-level restrictions include limitations on medical procedures, the criminalization of abortion, limitations for health care professionals and institutions to deliver reproductive care, restrictions on insurance coverage for reproductive care, and restrictions on funding as well as reimbursement related to abortion.
The Dobbs decision has already shown to have harmful consequences on women of childbearing age, and these effects will likely continue to grow. These effects include increases in self-induced abortions, travel to other states to seek abortions, maternal mortality risk, and unwanted pregnancies.9 These effects are likely to have both short- and long-term, disproportionate and devastating impacts on people of color and low-income persons.10 For instance, having to travel to other states for care can have steep, negative economic shocks on low-income women and their families due to missed work and travel expenses. One study estimated the number of pregnancy-related deaths among different groups under a hypothetical abortion ban. It found that non-Hispanic Black persons would experience the highest rate of pregnancy-related deaths, followed by Latino persons.11 In addition, travel to neighboring states for care further strains health systems already struggling to serve patients in their own states. Indeed, women are already traveling to states, such as New Mexico, that have been identified as safer places for women to receive reproductive care.12
health system experienced the lowest AIAN people groups nationally.
state, scoring in the
In Arizona, White people highest health system 4th percentile. How well does the health care system in work for people of different racial and ethnic groups? Arizona among all population in the 73rd percentile performance, scoring performance in the
Compared to other states in the Southwest region, Arizona has more severe racial and ethnic health disparities.
Population by race/ethnicity (2022)
Health System Performance by Race/Ethnicity
Black Hispanic White AANHPI AIAN
Source: The Commonwealth Fund, “Advancing Racial Equity in U.S. Health Care,” David C. Radley, Arnav Shah, Sara R. Collins, Neil R. Powe and Laurie C. Zephyrin, April 18, 2024 www.commonwealthfund.org/publications/fund-reports/2024/apr/advancing-racial-equity-us-health-care experienced the
All group median 1st percentile
Each column is a racial/ethnic group, and each point represents a state. Performance represented as percentiles (1–100). Arizona performance percentile highlighted. No highlighted dot indicates overall performance data not available for that group.
Notes: AANHPI = Asian American, Native Hawaiian, and Pacific Islander. AIAN = American Indian and Alaska Native. “—” means data not available. Southwest states include AZ, NM, OK, TX. Source: David C. Radley et al., Advancing Racial Equity in U.S. Health Care: The Commonwealth Fund 2024 State Health Disparities Report (Commonwealth Fund, Apr. 2024).
How well does the health system in Arizona work for people from different racial and ethnic groups, and across different dimensions of care?
Arizona ranks 20th of 31 states where calculation was possible, indicating health system performance for AANHPI people in the state was worse than average compared to other states. Specifically:
Health outcomes ranking: 23 (of 33) is worse than average
Health care access ranking: 24 (of 34) is worse than average
Health care quality ranking: 27 (of 41) is worse than average
Arizona ranks 6th of 10 states where calculation was possible, indicating health system performance for AIAN people in the state was among the worst compared to other states. Specifically:
Health outcomes ranking: 2 (of 10) is among the best
Health care access ranking: 9 (of 11) is among the worst
Health care quality ranking: 9 (of 11) is among the worst
Arizona ranks 28th of 39 states where calculation was possible, indicating health system performance for Black people in the state was worse than average compared to other states. Specifically:
Health outcomes ranking: 16 (of 40) is better than average
Health care access ranking: 39 (of 40) is among the worst
Health care quality ranking: 9 (of 41) is better than average
Arizona ranks 35th of 47 states where calculation was possible, indicating health system performance for Hispanic people in the state was worse than average compared to other states. Specifically:
Health outcomes ranking: 38 (of 49) is worse than average
Health care access ranking: 31 (of 48) is worse than average
Health care quality ranking: 38 (of 48) is worse than average
Arizona ranks 31st of 51 states where calculation was possible, indicating health system performance for white people in the state was worse than average compared to other states. Specifically:
Health outcomes ranking: 23 (of 51) is better than average
Health care access ranking: 36 (of 51) is worse than average
Health care quality ranking: 34 (of 51) is worse than average
Deaths
Source: David C. Radley et al., Advancing Racial Equity in U.S. Health Care: The Commonwealth Fund 2024 State Health Disparities Report (Commonwealth Fund, Apr. 2024).
We’re here to focus health care where it belongs: on you.
You deserve the kind of care that goes beyond a chart or a prescription. It’s the kind of care that covers everything you need to live your healthiest life, including support from a whole team of doctors, nurses, and specialists to keep you feeling good. And it’s care that gives you all the benefits of a nationally recognized health care company — including the latest science and technology — with a hometown, personal touch.
Count on all of us to care for all of you, in all the ways you need.
optum.com/AZ


Any person depicted in the stock image is a model. The company does not discriminate on the basis of race, color, national origin, sex, age or disability in health programs and activities. We provide free services to help you communicate with us. Such as letters in other languages or large print. For assistance with interpreting services, please contact your health plan. You may also ask your Optum provider’s office or call our 24-Hour Patient Support Center at 1-800-403-4160 TTY 711. Si requiere servicios de interpretación comuníquese con su plan médico. También puede llamar al consultorio de su proveedor de Optum o a nuestro Centro de Apoyo al Paciente de 24 horas al 1-800-403-4160 TTY 711. 要獲得口頭翻譯服務的幫助,請聯絡您的健康計劃。您也可以向您的Optum服務提供者提出請求或者致電24小時患者支援 中心(Patient Support Center),電話號碼:1-800-403-4160 TTY 711. Optum is a registered trademark of Optum, Inc. in the U.S. and other jurisdictions. All other brand or product names are the property of their respective owners. Because we are continuously improving our products and services, Optum reserves the right to change specifications without prior notice. Optum is an equal opportunity employer. ©️2024 Optum, Inc. All rights reserved.
• IN 2023, NEARLY TWO-THIRDS OF AMERICANS VIEWED THE OVERALL CRIME SITUATION IN THE UNITED STATES AS EXTREMELY OR VERY SERIOUS
• THE NUMBER OF POLICE OFFICERS IN THE U.S. IS ON THE DECLINE
• FROM 2019—2022, U.S. POLICE RESIGNATIONS INCREASED 47% AND RETIREMENTS INCREASED BY 19%
• HISPANICS ARE UNDERREPRESENTED IN THE U.S. POLICE FORCE
• BETWEEN 2021 AND 2023, THE TOTAL DRUGS SEIZED BY U.S. CUSTOMS AND BORDER PROTECTION AT THE SOUTHERN BORDER DECREASED BY 43%, WHILE FENTANYL SEIZED INCREASED BY 151%.
• OVER THE YEARS, ILLEGAL ENTRY CONSISTENTLY MAKES UP THE MAJORITY OF U.S. NONCITIZEN CONVICTIONS
• DISTRESS ACCOUNTS FOR THE MAJORITY OF U.S. CUSTOMS AND BORDER PATROL RELATED DEATHS
• TOP 5 SAFEST CITIES IN ARIZONA IN 2024
• TWO ARIZONA CITIES ARE IN THE TOP 10 SAFEST CITIES IN THE UNITED STATES
• OVERALL CRIME IN ARIZONA HAS DECREASED BETWEEN 2022 AND 2023
• GROUP B ARRESTS CONTINUE TO MAKE UP THE MAJORITY OF ARRESTS IN ARIZONA
• OPIOID-RELATED HOSPITALIZATIONS AND VISITS IN ARIZONA HAVE REMAINED CONSISTENTLY HIGH
• BLACK OR AFRICAN AMERICANS HAD A SIGNIFICANTLY HIGHER RATE OF OPIOID-RELATED HOSPITALIZATIONS AND VISITS COMPARED TO ANY OTHER RACE OR ETHNICITY
• GILA COUNTY HAD THE HIGHEST RATE OF OPIOID-RELATED HOSPITALIZATIONS AND VISITS
IN FOCUS
The city created a 2024 Heat Response Plan that enhanced initiatives from previous years and developed a few new strategies BY
KEYERA WILLIAMS
IN FOCUS 278 EXCERPT
ELENA REID STEINBEISS AND SOMMER KNIGHT
Given the right tools, young adults aging out of the foster care system can thrive BY
According to the U.S. Sentencing Commission, non-U.S. citizens accounted for 33.7% of all individuals sentenced in FY23—and 72.3% of the sentences involved immigration-related issues
IN 2023, NEARLY TWO-THIRDS OF AMERICANS VIEWED THE OVERALL CRIME SITUATION IN THE UNITED STATES AS EXTREMELY OR VERY SERIOUS
AMERICANS' ASSESSMENTS OF THE CRIME IN THE U.S. AND THEIR LOCAL AREAS (2000—2022)
QUESTION: Overall, how would you describe the problem of crime [in the United States/area where you live]? Extremely serious? Very Serious? Moderately serious? Not too serious? Not serious at all? % OF ANSWERS THAT SAID EXTREMELY/VERY SERIOUS
IN THE UNITED STATES IN THE AREA WHERE YOU LIVE
NOTE: Recent changes in how the FBI measures crime have made it difficult to assess the real-world trends and the Bureau of Justice Statistics National Crime Victimization Survey doesn’t always align with the FBI data. Meanwhile, Gallup trends indicate there has been an increase in crime victimization since 2020, according to Americans’ reports of their own experiences in the past year.
Crime Problem as Serious," Jeffrey M. Jones, November 16, 2023 news.gallup.com/poll/544442/americans-crime-problem-serious.aspx
NOTE: The 2023 PERF Membership Survey was sent in early February 2023 to all PERF members who are chief executives of their agencies (chiefs, sheriffs, commissioners, etc.). The 182 responses came from agencies serving 38 states and the District of Columbia: 163 local law enforcement agencies, 12 college or university law enforcement agencies, four transportation law enforcement agencies and a federal law enforcement agency, a housing law enforcement agency and a tribal law enforcement agency.
Source:
TOTAL SWORN POLICE OFFICERS IN THE UNITED STATES (JANUARY 2020–JANUARY 2023)
83,497 82,442
80,183 79,464
FROM 2019—2022
NOTE: The 2023 PERF Membership Survey was sent in early February 2023 to all PERF members who are chief executives of their agencies (chiefs, sheriffs, commissioners, etc.). The 182 responses came from agencies serving 38 states and the District of Columbia: 163 local law enforcement agencies, 12 college or university law enforcement agencies, four transportation law enforcement agencies and a federal law enforcement agency, a housing law enforcement agency and a tribal law enforcement agency.
Source: Police Executive Research Forum, "New
www.policeforum.org/staffing2023
Values as of May 28, 2024. Values are updated on a regular basis.
BETWEEN 2021 AND 2023, TOTAL DRUGS SEIZED BY U.S. CUSTOMS AND BORDER PROTECTION AT THE SOUTHERN BORDER DECREASED BY 43%, WHILE FENTANYL SEIZED INCREASED BY 151%
U.S. CUSTOMS AND BORDER PROTECTION DRUG
AT THE SOUTHERN BORDER BY WEIGHT (LBS, FY2021—FY2023)
NOTES:
1. Drug seizure statistics were combined from the following three groups: U.S. Border Patrol (USBP), Office of Field Operations (OFO) and Air and Marine Operations (AMO). Drug seizure statistics for USBP and OFO were last updated on May 3, 2024. Drug seizure statistics for AMO were last updated on May 6, 2024.
2. Drug seizure statistics are updated on a regular basis.
3. Fiscal Year 2023 runs October 1, 2022–September 30, 2023.
4. Other drugs category for Office of Field Operations (OFO) includes but is not limited to: Amphetamine, Ephedrine, Hashish, Marijuana Plants, Opium, Oxycodone (Oxycontin), Precursor Chemicals, Prescription, Chemical and other uncategorized drugs. Other drugs category for U.S. Customs and Border Patrol (USBP) includes all drugs seized by USBP except Cocaine, Fentanyl, Heroin, Marijuana, Methamphetamine and Ecstasy.
5. These figures only cover drug seizures captured by U.S. Customs and Border Protection and potentially does not consider drugs seized by other legal authorities/agencies.
Source: U.S. Customs and Border Protection, Drug Seizure Statistics, May 3, 2024 www.cbp.gov/newsroom/stats/drug-seizure-statistics U.S.
U.S. CUSTOMS AND BORDER PATROL CONVICTIONS OF U.S. NONCITIZENS BY TYPE (FY2021—FY2023)
NOTES:
1. Fiscal Year 2023 runs October 1, 2022–September 30, 2023.
2. These figures only cover criminal noncitizen arrests by U.S. Customs and Border Protection and may not consider criminal noncitizen arrests by other legal authorities/agencies.
3. Other includes any conviction not included in the categories above.
NOTE: Fiscal Year 2022 runs October 01, 2021–September 30, 2022.
Source: U.S. Customs and Border Protection, “CBP-Related Deaths, Fiscal Year 2022,” March 2024 www.cbp.gov/sites/default/files/assets/documents/2024-Mar/fy2022-cbp-opr-related-deaths-report.pdf
NOTE: SafeWise uses the most up-to-date FBI crime data as the backbone of their reports. This means SafeWise relies on voluntary, self-reported information that cities and jurisdictions across the country report through the FBI Summary Reporting System (SRS) and National Incident-Based Reporting System (NIBRS). If you don’t see your city listed, it could be due to incomplete data or the failure to submit a report. For Safewise’s 2024 reporting year, the most recent FBI data was released in October 2023 and accounts for crimes reported in calendar year 2022.
Source: SafeWise, "Arizona's Safest Cities of 2024," Cathy Habas, March 18, 2024 www.safewise.com/blog/safest-cities-arizona/
NOTE: In order to determine the safest cities in which to live, WalletHub compared 182 cities — including the 150 most populated U.S. cities, plus at least two of the most populated cities in each state — across three key dimensions: 1) Home & Community Safety, 2) Natural-Disaster Risk and 3) Financial Safety.
GROUP B ARRESTS CONTINUE TO MAKE UP THE MAJORITY OF ARRESTS IN ARIZONA
NOTES: *Values as of May 9, 2024. Values are updated on a regular basis.
**Group B arrests include offenses such as, for example, driving under the influence, disorderly conduct, trespass of real property and liquor law violations.
***Crimes against society are typically victimless crimes in which persons or property are not the object. These crimes can include, for example, drug equipment violations, pornography, sports tampering, prostitution, weapon law violations and animal cruelty.
****Crimes against person are those where the victims are always individuals. Examples include forcible rape, aggravated assault, criminal homicide and human trafficking.
*****Crimes against property occur to obtain money, property or another benefit. Examples include robbery, burglary, larceny theft, motor vehicle theft and arson.
Source: Arizona Department of Public Safety, Arizona Crime Statistics, Crime Overview azcrimestatistics.azdps.gov/tops/report/crime-overview/arizona/2019 | azcrimestatistics.azdps.gov/tops/report/crime-overview/arizona/2020 | azcrimestatistics.azdps.gov/tops/report/crime-overview/arizona/2021 | azcrimestatistics.azdps. gov/tops/report/crime-overview/arizona/2022 | azcrimestatistics.azdps.gov/tops/report/crime-overview/arizona/2023
OPIOID-RELATED HOSPITALIZATIONS AND VISITS IN ARIZONA HAVE REMAINED CONSISTENTLY HIGH
Source: Arizona Department of Health Services, “Opioid Overdoses Surveillance Report, Arizona, 2022,” prepared by Lubaba Tasnim, 2023 www.azdhs.gov/opioid/documents/opioid-overdoses-surveillance-report-2022.pdf?v=20240112
BLACK OR AFRICAN AMERICANS HAD A SIGNIFICANTLY HIGHER RATE OF OPIOID-RELATED HOSPITALIZATIONS AND VISITS COMPARED TO ANY OTHER RACE OR ETHNICITY


At PNC, Diversity & Inclusion is a core value and business imperative. We believe that driving diversity removes barriers to opportunity while inclusion creates space for all our employees and customers to feel welcomed, valued, and respected—where every teammate can contribute their unique talents and perspectives to our success as we deliver value for all of our stakeholders.
Visit pnc.com/diversity to learn more.
BY KEYERA WILLIAMS
Hot weather is no stranger to the Valley of the Sun. Because excessive summer heat can be life-threatening, the City of Phoenix is taking a proactive approach and leading efforts to keep people safe.
"Phoenix has long been grappling with the challenge of extreme heat and we are working continuously to deliver new solutions as our summers become more intense," says Phoenix Mayor Kate Gallego. "We plan for this challenge year-round and are stepping up with an unprecedented level of resources, including the Valley's first overnight cooling centers."
Ahead of the summer, several City of Phoenix departments participated in creating the 2024 Heat Response Plan, which enhanced initiatives from previous years and developed new strategies to help save lives.
“The city is doing more for heat response than ever before, enabled by new investments from the mayor and city council and a tremendous cross-departmental collaboration. We are guided by data and input from many partners to make our response as effective as possible,” says David Hondula, director of the Office of Heat Response and Mitigation.

After evaluating the data surrounding heat risks, Phoenix has prioritized offering heat relief resources and cool indoor spaces for residents outside regular business hours.
Through Sept. 30, Phoenix is offering various new heat relief options this year, including overnight and extended hours for all residents needing a cool space. In addition to the 100+ locations throughout Phoenix, Burton Barr Central Library operates a 24hour respite center and Senior Opportunities West offers overnight respite from 6pm—5am. The Cholla, Yucca and Harmon libraries are open as cooling centers Monday–Saturday until 10pm; on Sundays, these locations operate from noon to 10pm. Additionally, as they have in previous years, all other Phoenix public libraries also serve as cooling centers during regular business hours.
Through Sept. 30, Phoenix is offering a variety of new heat relief options this year that include overnight and extended hours for all residents in need of a cool space.
“The city is currently the only organization in the region offering a 24-hour respite center. We have seen the value in offering extended hours at several of our facilities this year,” says Rachel Milne, director of the Office of Homeless Solutions. “We are grateful to have our partner Community Bridges onsite to help connect residents with much-needed resources.”
Since the cooling and respite centers opened on May 1, the city has assisted thousands of residents at its five extended-hour and overnight locations. City and Community Bridges staff have connected many guests with resources to meet their needs—from getting help with utility assistance to connecting unhoused people with shelter.
Phoenix is also taking the necessary steps to keep people safe while hiking in the heat. On days when the National Weather Service issues an excessive heat warning, Camelback Mountain’s Echo and Cholla trails, as well as all trails associated with the Piestewa Peak trailhead in the Phoenix Mountains Preserve, will close between 9am and 5pm. On weekends, a community emergency response team, volunteers and park stewards are onsite to provide water and hiking education to hikers.
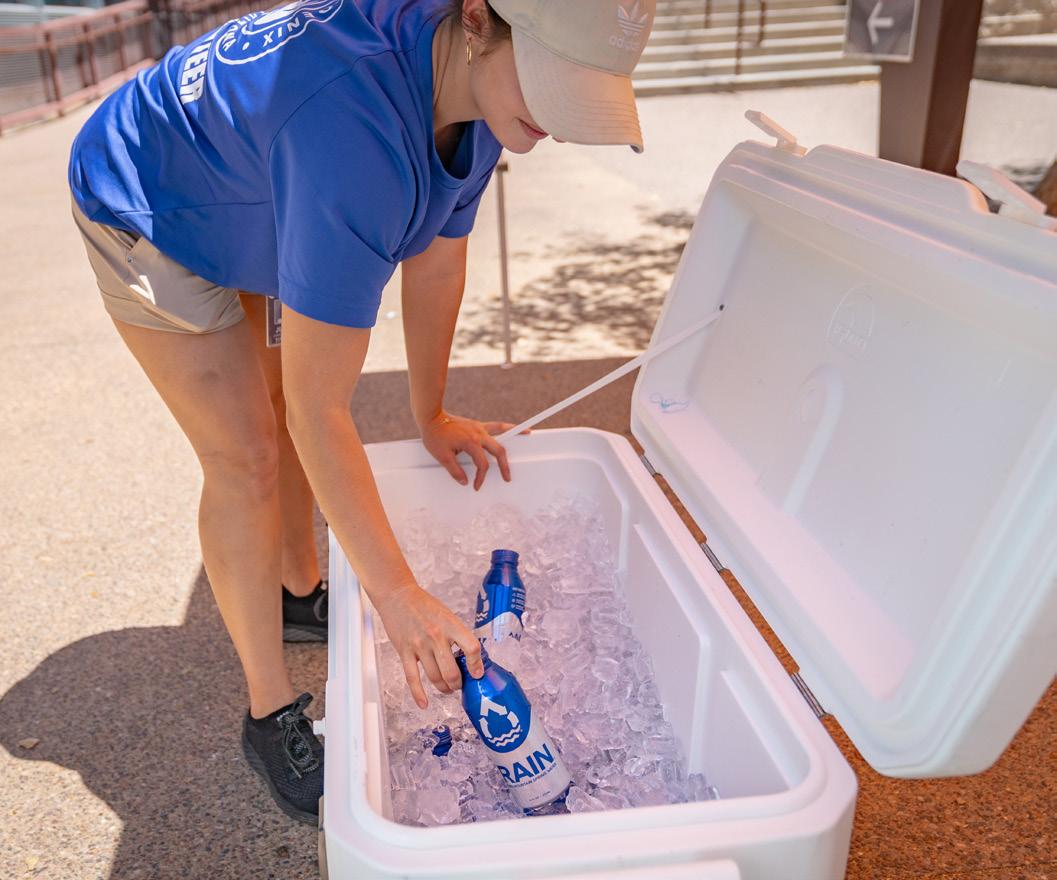
Steps are also being taken to protect city-contracted outdoor workers. On March 26, the City Council adopted a new ordinance protecting all city-contracted workers, requiring all contractors to have a written heat safety plan that addresses criteria such as drinking water, breaks and access to shaded areas or air conditioning.
“Whether you are a resident or visitor, we want to do everything we can to help you stay safe throughout the summer months,” says Yanitza Soto, interim advisor to the Office of Public Health.
“Listen to your body, familiarize yourself with heat stroke and heat exhaustion symptoms and make sure to drink water throughout the day.”
Keyera Williams is a public information officerforthe City of Phoenix’s Office ofHeat Response and Mitigation.
Find Local Heat Safety and Relief Options phoenix.gov/pio/summer
Office of Heat Response and Mitigation phoenix.gov/heat
Phoenix Senior Centers phoenix.gov/humanservices/programs/older/senior-centers
Community Bridges Inc. (CBI)
1855 W. Baseline Rd., #101 Mesa, AZ 85202 24/7 Access to Care line 877.931.9142
Fromthe MaricopaAssn. ofGovernments Heat Relief Network includes the Heat Relief Network map plus resources and downloads azmag.gov/Programs/Heat-Relief-Network
FromTheMunicipalResearchandServicesCenter(May15,2024) Adapting to Extreme Heat: Can Cities Prepare for a Hotter Future? mrsc.org/stay-informed/mrsc-insight/may-2024/
From Fast Company(June 27, 2022)
America’s hottest city keeps getting hotter: How Phoenix is battling extreme heat www.fastcompany.com/90763919/in-phoenix-wheretemperatures-continue-to-rise-a-race-against-time-toweatherproof-the-city
BY ELENA REID STEINBEISS AND SOMMER KNIGHT
Each year in Arizona, 900 children age out of the foster care system when they turn 18. Within two years, 50% of those young adults will become homeless, 30% will be sex trafficked, 25% will experience PTSD, less than 3% will earn a higher education degree and 20% will be a part of the criminal justice system by age 19.
These terrible statistics do not even include the trauma that follows these children emotionally, the brain injuries they endure due to domestic violence or the sense of abandonment and loss of identity. When we talk about homelessness, we must talk about how 65% of our chronically homeless population in Arizona once were part of the foster care system. Sadly, these numbers don’t change: They are the same year after year, with little or no change in the system or the outcomes.
The term “foster care” often stimulates skewed opinions and definitions. It is easy to think that in foster care, every child is removed from a bad situation and then given a better home and a brighter future. We really wish that was the story; unfortunately for most, there are harder, darker days ahead.
These young adults often experience failed placements or find that there are not enough safe homes available. Group homes then become the only option and slowly but surely, each person becomes a number and a part of a collective story and their uniqueness and individuality start to slip away.
It's unbearable to think about the often cruel realities of the life of a child who enters foster care. Many people don’t think about it. Instead, they make themselves believe that there is a community that takes care of these kids, which allows them to move on and not worry about it. There are so many stories, but many times, as a society, we don’t slow down to hear beyond the collective story.

We tend to lump everyone together and legislative decisions are made based on one story and mostly by people who have never been directly affected.
Consider these questions. What if we took the time to learn the stories, see that each topic that affects our community is more intertwined than we know and lean into the human experience that these individuals must endure? What if the labels were gone and we could see hurting people who once were vulnerable children who never really got the resources they deserved? Would this change what we do? Would it change how we vote? Would this change how we care for one another?
One story often left out of the foster care narrative is that of the young children who came to America with or without their parents. We hear about immigration, asylum seekers and refugees—and the dialog often is fueled with opinions and political rhetoric:
• “We can’t let criminals into our country.”
• “They just want to use our resources and not help themselves.”
The statements go on and on and on. Too often, we refuse to hear the stories of the vulnerable and what led them to America. As people who work in the world of foster care and homelessness day in and day out, we can tell you another story not being shared: Too often, families come to America not because they want to leave their homelands but because they must flee the most horrible of the horrible, scenarios we hope never to know. Sadly, for many people, this kind of nightmare is their reality. They can’t wake up from it; their only option is to flee.
This article, however, is not about the adults who have fled their homelands. It tells the stories of the children brought with them. There is a small percentage of those families who are not able to care for their children once they are here—and it is those kids who end up in foster care.
We encounter children who were brought over as refugees, asylum seekers or immigrants by their families. While they were still under the age of 18, they faced situations no child should have to endure, which is what led these children to be placed in foster care. For those who are not adopted or reunited, it isn’t an option; they eventually age out of the system. Then what?
America is the only home these children know and America also is the only security they have. As soon as they turn 18, though, if they
are not citizens, they are faced with additional barriers that often lead to homelessness.
Many people falsely assume that these young adults receive all the benefits from the U.S. government. When they turn 18, many of these young adults only have emergent care insurance. It is insurance that cannot be used unless they are about to die—so going to the doctor will cost them money they don’t have.
Then, if they don’t have the right documents to work, they will not be able to get a job and cannot attend higher education. They must wait for the courts and the government to say, “Yes, you can be here and here are your documents.” It is a long and slow process and, in some cases, a young adult could be told to return to a country they don’t even know. How can a person thrive when they aren’t allowed to work, go to school, can’t pay for anything and, if they get sick, cannot afford to see a doctor?
Given the right opportunity and support, however, these young adults can thrive and become some of the best members of our society. We know this is true because we have experienced this type of outcome with the young adults we serve at Foster360.
Foster360 offers holistic wraparound services that empower young adults ages 18—24 who have experienced foster care with the necessary tools, education and mindset to succeed in life. We provide trauma coaching, life skills, brain injury support, and work and education support. Foster360 also has affordable housing that relieves young adults of the stress of increased housing costs and provides individualized plans that empower each young adult to have sustainable, long-term success in their lives so they never experience homelessness again.
Foster360 and organizations like it can provide the right resources for these young adults, giving them hope and the future they deserve. Our mission is to once and for all break the cycle of homelessness and adversity for young adults who age out of foster care and don’t know where to turn.
Elena Reid Steinbeiss and Sommer Knight are the co-executive directors of Foster360, an Azura Solutions initiative that currently has two locations for youth to heal and work toward never becoming homeless again.
Foster360
AnAzura Solutions initiative/Mesa UnitedWay
137 E. University Dr. Mesa, AZ 852010.969.8601 elena@foster360az.org sommer@foster360az.org
foster360.org
INSTAGRAM: @azfoster360
FACEBOOK: Foster360
Azura
137 East University Drive Mesa, AZ 85201 480.834.2108 info@AzuraCares.org
The Children’s Action Alliance 3030 N. 3rd St., Suite 650 Phoenix, AZ 85012 fosteringadvocatesarizona.org
FromtheArizona Department ofChild Safety Young Adult Program dcs.az.gov/yap
From the Juvenile Law Center
Extended Foster Care in Arizona jlc.org/issues/extended-foster-care/arizona
Fromthe InstituteforResearch on Poverty (Feb. 28, 2023)
Deyanira Nevarez Martinez On The Latinx Paradox And Homelessness
irp.wisc.edu/resource/deyanira-nevarezmartinez-on-the-latinx-paradox-andhomelessness/

64,124 cases were reported in FY23; 21,504 of these involved non-U.S. citizens.
https://www.ussc.gov/research/quick-facts
Individual and Offense Characteristics1
94.1% of non-U.S. citizens sentenced in the federal system were men.
93.2% were Hispanic, 2.4% were Black, 2.3% were White, and 2.0% were Other races.
Their average age was 38 years.
88.4% were illegal aliens, 8.8% were legal aliens, 1.1% were extradited aliens, and 1.7% were unknown status.
67.1% were from Mexico, 7.4% from Honduras, 5.4% from Guatemala, 3.8% from the Dominican Republic, 3.7% from El Salvador, and 12.6% originated from other countries.
The most common guidelines under which non-U.S. citizens were sentenced include: Immigration (72.3%); Drug Trafficking (16.7%); Fraud (3.3%); Money Laundering (1.9%); and Firearms (1.6%).2
48.7% had little or no prior criminal history (Criminal History Category I);
• 20.8% were CHC II;
• 17.9% were CHC III;
• 7.5% were CHC IV;
• 3.2% were CHC V;
• 1.9% were CHC VI.
The top five districts for sentenced non-U.S. citizens were:
• Western District of Texas (5,136);
• Southern District of Texas (3,909);
• District of Arizona (2,927);
Most Common Sentencing Guidelines
Source: United States Sentencing Commission, “Federally Sentenced Non-U.S. Citizens,” July 2024 www.ussc.gov/research/quick-facts/federally-sentenced-non-us-citizens
• District of New Mexico (1,175);
• Southern District of California (978).
The top five districts where sentenced non-U.S. citizens comprised the highest proportion of the overall caseloads were:
• District of Northern Mariana Islands (91.7%);
• Western District of Texas (69.7%);
• Southern District of Texas (65.7%);
• District of Arizona (63.0%);
• District of New Mexico (59.2%).
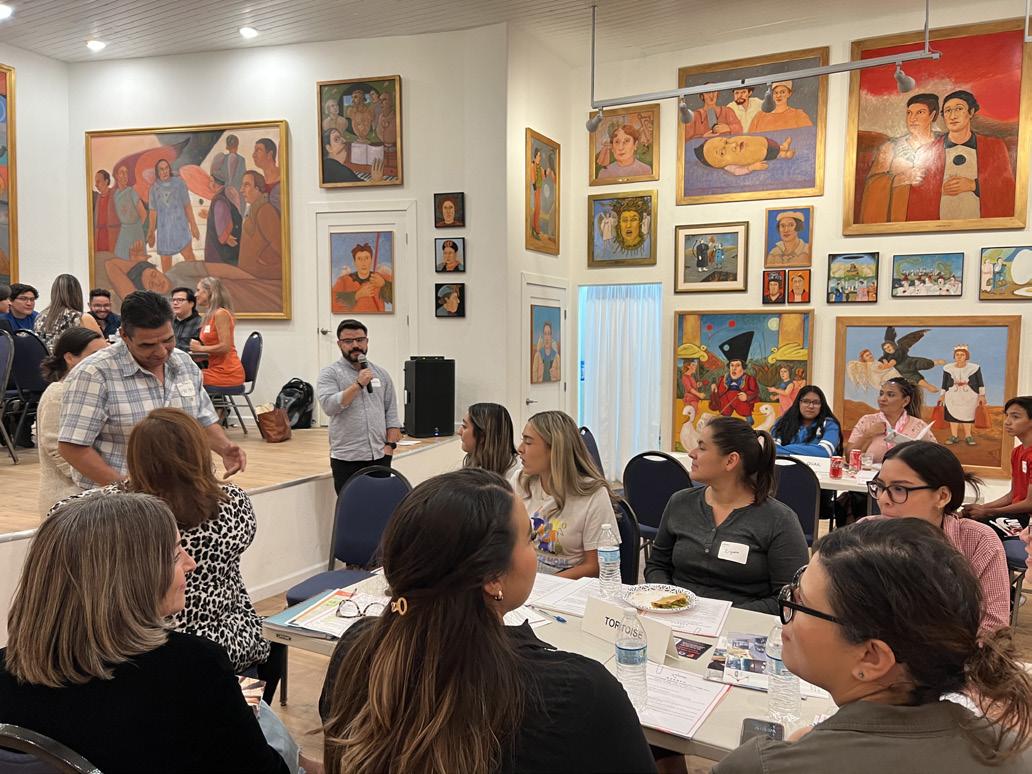
Arizona

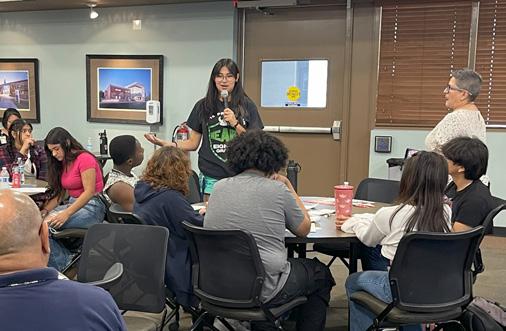
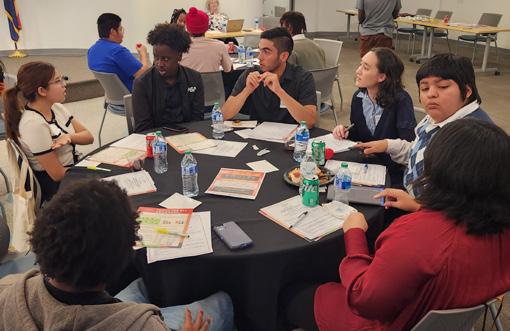

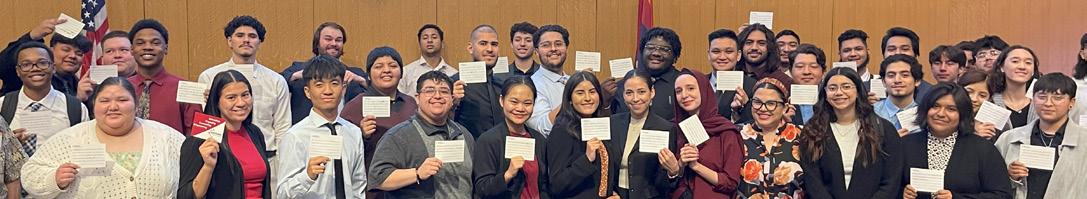
• BETWEEN 2018 AND 2022, U.S. HOUSEHOLDS WITH 3 OR MORE VEHICLES AVAILABLE INCREASED BY 10%
• WHITES AND ASIANS IN THE U.S. HAD THE MOST RELIABLE TRANSPORTATION IN 2022
• AMERICAN HOUSEHOLDS TRAVELED LESS IN 2022 THAN IN THE PREVIOUS 40 YEARS
• U.S. DOMESTIC AIRFARE HAS INCREASED BY 15% SINCE 2017
• ARIZONA WAS AMONG THE BOTTOM 5 STATES WITH THE LOWEST NUMBER OF REGISTERED VEHICLES IN 2022
• ARIZONA IS 9TH AMONG STATES IN TERMS OF ELECTRIC VEHICLE OWNERSHIP IN 2022
• ARIZONA RANKED 13TH AS A DESTINATION FOR PASSENGER TRIPS IN 2022
• ARIZONA RANKED 23RD AMONG U.S. STATES IN OVERALL TRANSPORTATION
• IN 2021, TOTAL HIGHWAY FATALITIES IN ARIZONA WERE AT THEIR HIGHEST LEVEL SINCE 2006
• ARIZONA’S ROAD CONDITIONS HAVE WORSENED OVER TIME
287 SPECIAL FEATURE
289 IN FOCUS
292 IN FOCUS
EXCERPTS
295
EXCERPTS
296
Transportation
Univision Communications takes a close look at auto insurance and auto repair & service in the Phoenix and Tucson markets
This nonprofit provides free flight services to and from Arizona for patients to get the medical care they need
BY JESSICA HAYES
Phoenix Sky Harbor Airport Adds a Food Waste Collection Program to Its Sustainability Practices
The airport’s successful food waste collection program that began in 2023 is helping the airport achieve its goal of zero waste by 2050 BY KAYSEY
ENGLAND
TRIP, a National Transportation Research nonprofit, collects data about Arizona’s roads and bridges and presents the key facts here
This National Center for Health Statistics (NCHS) report says that in 2022, the percentage of adults who lacked reliable transportation for daily living was higher in the West North Central region (7.5%) compared to the national average (5.7%)
PERCENTAGE OF ADULTS WHO LACKED RELIABLE TRANSPORTATION FOR DAILY LIVING IN THE PAST, BY RACE/ETHNICITY (2022)
NON-HISPANIC HISPANIC WHITE, NON-HISPANIC ASIAN, NON-HISPANIC
NOTE: Adults of Hispanic origin may be of any race. Adults categorized as American Indian and Alaska Native non-Hispanic, Asian non-Hispanic, Black non-Hispanic and White non-Hispanic indicated one race only. Analyses were limited to the race and Hispanic origin groups for which data were reliable and sufficiently powered for group comparisons based on National Center for Health Statistics presentation standards. Estimates are based on household interviews of a sample of the U.S. civilian noninstitutionalized population.
Source: Centers for Disease Control and Prevention, "Lack of Reliable Transportation for Daily Living Among Adults: United States, 2022," Amanda E. Ng, Dzifa Adjaye-Gbewonyo and James Dahlhamer, January 2024 www.cdc.gov/nchs/products/databriefs/db490.htm#section_2
TOP 15 DESTINATION STATES IN THE U.S. BY PASSENGER TRIPS (2022)
Source: U.S.
nhts.ornl.gov/od/
IN
49,650,145,449 30,001,830,483 21,751,758,651 20,129,733,212 14,217,860,682 13,436,155,269 12,602,184,249 12,442,119,917 11,003,304,986 10,603,983,351 9,921,354,237 9,118,224,333 8,575,246,336 7,933,610,224 7,861,403,754
IN 2021, TOTAL HIGHWAY FATALITIES IN ARIZONA WERE AT THEIR HIGHEST LEVEL SINCE
FATALITIES IN ARIZONA BY VEHICLE OCCUPIED (2000—2021)


BY JESSICA HAYES
Many people throughout the United States live hundreds of miles away from the essential medical treatments they need. Finding affordable, safe and reliable transportation to out-of-state medical appointments can be incredibly difficult for individuals and families trying to navigate unimaginable health care challenges.
Enter Angel Flight West (AFW). The organization, which is a registered 501(c) nonprofit, serves 12 Western states: Alaska, Arizona, California, Colorado, Hawaii, Idaho, Montana, Nevada Oregon, Utah, Washington and Wyoming. Its volunteer pilots and earth angel drivers work tirelessly to provide free transportation services for individuals and families in need. Although the company is best known for linking passengers to valuable medical

resources, it also provides transportation for other humanitarian purposes, including individuals and families escaping domestic violence, disaster relief, therapeutic programs for veterans and specialty camps.
Each day, AFW’s volunteer pilots deliver health and hope by flying people to their medical appointments. In addition to donating flights for Arizona residents to reach out-of-state specialty care, volunteer pilots also fly patients to Arizona to access treatment at numerous medical facilities, including the Mayo Clinic, Phoenix Children’s Hospital and Banner MD Anderson Cancer Center.
During the summer months, AFW’s volunteer pilots fly missions nearly every week to ensure children have access to specialty camps throughout the nonprofit’s service region. Angel Flight West has partnered with the Arizona Burn Foundation for years to help young burn survivors reach Camp Courage, an annual therapeutic camp for burn survivors.
THESE REAL-WORLD ANGELS PROVIDE FREE TRANSPORTATION FOR MEDICAL CARE
In 2023, 58 volunteer pilots in Arizona flew at least one mission to help patients access care, serving 48 unique Arizona residents through 231 total missions. Additionally, 70 total ground trips were provided by volunteer Earth Angels, who drive patients between medical facilities and local airports.
“One of my most rewarding endeavors has been my involvement with Angel Flight West,” says Alan Underwood, Arizona wing leader and volunteer pilot. “As a command pilot and Arizona wing Leader, I have had the opportunity to use my love of flying to provide
camp passengers Diego
Rodolfo (back
Madison
have been flying to Camp Courage since 2017. They are shown here with Command Pilot Stephen Bobko-Hillenaar and his Mission Assistant and wife Joanne Bobko-Hillenaar. Camp Courage, operated by the Arizona Burn Foundation, offers burn survivors ages 6–20 a week in Prescott, AZ, to build courage as they connect with other survivors. Activities include horseback riding, swimming, arts and crafts, tie-dying, high ropes and rappelling.
2024 STATS TO DATE
834 2,555 372 1,600 + Passengers served Flights flown Earth Angel trips
Total volunteer pilots ARIZONA
979 2926
Most missions flown: Dennis Phelan
Most hours flown: Dennis Phelan
THESE REAL-WORLD ANGELS PROVIDE FREE TRANSPORTATION FOR MEDICAL CARE
free air transportation to patients and their families who require specialized medical treatment far from home.”
One of Alan’s passengers was six-year-old AJ from Yuma, AZ. He has frequent medical appointments in Phoenix, which is a threehour drive from AJ’s home. Last year, AJ was gifted with five angel flights to reach his medical treatment in Phoenix and make it back home quickly and safely.
“This incredible service allows us to spend so much less time on the road,” says AJ’s mom Alexis. “For us, that means more time to be together as a family.”
Jessica Hayes is the communications manager for Angel Flight West, Santa Monica, CA.

Angel Flight West 3161 Donald Douglas Loop South Santa Monica, CA 90405 www.angelflightwest.org 310.390.2958 Toll-Free 888.4AN.ANGEL (888.326.2643) (888) 426-2643
General Info info@angelflightwest.org Volunteer and Pilot Info volunteerinfo@angelflightwest.org
Flight Requests/Inquiries coordination@angelflightwest.org
Become an Earth Angel
Drivers are needed in Phoenix; Denver; the Los Angeles Basin; Portland, OR Salt Lake City; San Diego; San Francisco Bay Area; Seattle; and Spokane, WA. APPLY ONLINE angelflightwest.org/earth-angels
Request a Flight (for patients and health care workers) angelflightwest.org/need-a-flight
Give
There are a number of ways to help, including monetary donations, hosting a fundraiser or donating your Alaska Airline miles. Contributions are tax-deductible to the extent permitted by law. Federal tax identification number: 95-3956297. angelflightwest.org/give
The Arizona Burn Foundation 1432 N. 7th St. Phoenix, AZ 85006 602.230.2041 azburn.org
This foundation has provided support programs for burn survivors and their families since 1967. Among other services, it offers five camps for different age groups.

BY KAYSEY ENGLAND
The City of Phoenix Aviation Department has made it a priority to take swift action to incorporate key sustainable practices into its solid waste management strategy. Highlighted within the department’s Sustainability Management Plan and citywide Climate Action Plan, the city has committed to achieving zero waste by 2050. Traditional solid waste recycling has helped the city increase its recovery and diversion efforts from the landfill. The opportunity, however, arose to focus on a previously untapped resource: food waste.
In 2017, the city unveiled a new state-of-the-art commercial composting facility that can process up to 55,000 tons of organic materials, such as yard waste, into valuable compost that can be applied as a soil amendment that delivers essential nutrients to plants around Phoenix and beyond. Recent process improvements at the facility have given the city the opportunity to incorporate the gradual addition of food waste into composting efforts. The slow degradation of food in landfills emits methane, a potent greenhouse gas, into the atmosphere, contributing to climate
change. The ability to compost food waste on a large scale opens the pathway to reduce these emissions while restoring critical nutrients to the soil.
The city’s Aviation Department pursued an opportunity to integrate a zero-waste circular economy within Phoenix Sky Harbor International Airport by incorporating a food waste collection pilot project at the beginning of 2021. The six-month pilot program was developed with the collaboration of various stakeholders to create a community that could support long-term zero-waste practices through food waste collection by the airport’s business partners. Participants quickly grasped the program's vision and committed to food waste minimization and collection efforts.

Following improvements at the city's compost facility, allowing acceptance of bagged materials, the Aviation Department revised and launched the current successful food waste collection program on Oct. 30, 2023. The program quickly took off with airport restaurants, retail and convenience stores and lounges adopting new food waste collection practices to capture food waste and other compostable materials like soiled paper products. Signage and training were provided to ensure a clean stream of compostable waste could be captured and processed at the city’s compost facility. Since the inception of the airport-wide launch in October 2023, approximately 80 tons of food waste and other compostable materials from the airport’s business partners have been diverted away from the landfill and transformed into nutrient-rich compost.
The airport business partners and the Aviation Department's sustainability team continue collaborating on Phoenix Sky Harbor's food waste collection program.
“We don’t go through a lot of traditional black trash bags anymore,” says Alyssa Gleaton of San Tan Brewing Co. “Most of the products we use are compostable. It was really exciting to teach the staff about the program.”
The program has succeeded thanks to the future-focused support of the airport's business partners and employees. Businesses representing different sectors of the airport economy have showcased the collaborative spirit of the Phoenix Sky Harbor
community in its commitment to reaching sustainability goals that will impact generations to come.
Kaysey England is the sustainability program manager for the City of PhoenixAviation Department.
City of Phoenix Aviation Department 2485 E. Buckeye Rd. Phoenix, AZ 85034
602.273.3300 (24/7 switchboard) skyharbor.com
Sustainability Initiatives
skyharbor.com/about-phx/sustainability
Sustainability Management Plan (.pdf) skyharbor.com/media/kqrphnkr/sustainabilitymanagementplan.pdf
City of Phoenix Climate Action Plan www.phoenix.gov/oepsite/Documents/2021ClimateActionPlanEnglish.pdf
From WatchWire
Sustainability Management Explained: What It Is and Why It’s Important watchwire.ai/sustainability-management-explained
At Amazon we’re not content with the status quo. We understand that an effective recall involves empowering each customer with the necessary information to protect themselves and their family. This is why we reach out to customers during a recall, providing them with a convenient, one-stop shop to access recall information associated with their account. Open your Amazon app now and search ‘recalls’ to view your recalls and product safety alerts page today.
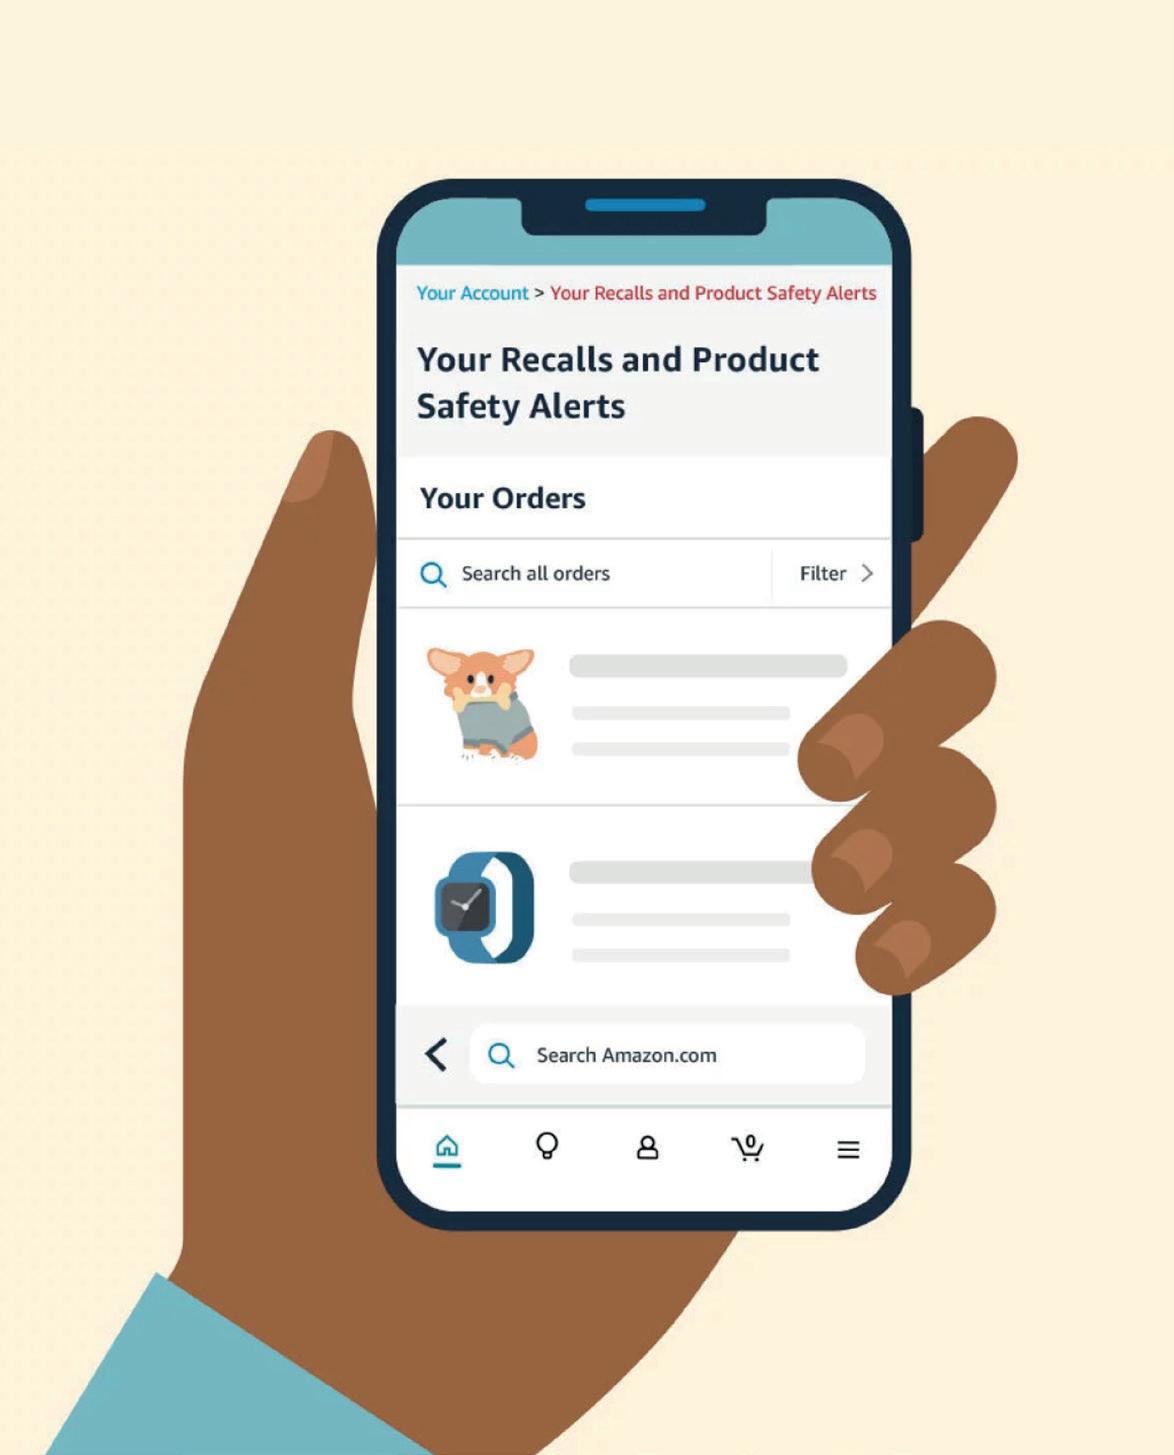
Thank you to our partners whose contributions play an important role in keeping our store safe and ensuring our consumers are well-informed about product safety and usage.


Scan the QR code to see expert tips, articles, and videos from our partners, ensuring a safer shopping experience.
Key facts about Arizona’s surface transportation system
May 2024
Investing in Arizona’s surface transportation system improves road and bridge conditions and reduces driver costs
• A total of 52% of Arizona’s major roads are in poor or mediocre condition. Driving on deteriorated roads costs Arizona motorists $4.9 billion a year – $839 per driver – in the form of additional repairs, accelerated vehicle depreciation, and increased fuel consumption and tire wear.
• A total of 1% of Arizona’s bridges are rated in poor/structurally deficient condition, meaning there is significant deterioration to the major components of the bridge. A total of 43% of the state’s bridges are at least 50 years old, an age when many bridges require significant rehabilitation or replacement.
• Vehicle travel in Arizona dropped by 33% in April 2020 due to the Covid-19 pandemic (as compared to the same month the previous year), but rebounded to 10% above pre-pandemic levels by 2023. Since 2000, vehicle travel on Arizona’s roads increased 57% and the state’s population increased 45%.
• The Infrastructure Investment and Jobs Act (IIJA), signed into law in November 2021, will provide $5.4 billion in state funds for highway and bridge investments in Arizona over five years, including a 32% funding increase over the first three years of the program from FY 2022 to FY 2024 Federal funds currently support 59% of the state’s transportation department spending on highway and bridge improvements.
• Construction cost inflation, the erosion of motor fuel taxes due to inflation, improved fuel efficiency, and the adoption of hybrid and electric vehicles threaten the state’s ability to keep pace with growing transportation needs. The Federal Highway Administration’s national highway construction cost index, which measures the rate of inflation in labor and materials cost, increased 36% between 2022 and the first half of 2023 and has increased 59% since the start of 2021. Roadway improvements can reduce traffic crashes and save lives
• From 2019 through 2023, 5,784 people died on Arizona’s highways, an average of 1,157 annual fatalities. Arizona’s traffic fatality rate of 1.69 fatalities per 100 million vehicle miles of travel is higher than the national average of 1.26.
• A total of 891 people were killed in traffic crashes in work zones in the U.S. in 2022, an 18% increase since 2018. There were 110 Work zone fatalities in Arizona from 2018 to 2022. Work zone safety can be improved through the use of safety countermeasures including improved work zone design, improved driver messaging, high-visibility markings and speed enforcement.
• Traffic crashes in Arizona imposed a total of $9.2 billion in economic costs in 2023. TRIP estimates that a lack of adequate roadway safety features, while not the primary factor, was likely a contributing factor in approximately onethird of all fatal traffic crashes, resulting in $3.1 billion in economic costs in the state in 2023. These costs include work and household productivity losses, property damage, medical costs, rehabilitation costs, legal and court costs, congestion costs, and emergency services.
Investing in our transportation system generates jobs, fosters economic recovery and growth, and improves safety
• Investments in the surface transportation system will boost Arizona’s economy in the short-term by creating jobs and in the long-term will enhance economic competitiveness, stimulate sustained job growth, improve access and mobility, improve traffic safety, reduce travel delays, and improve road and bridge conditions.
• Roads and highways are the backbone of our economy, allowing Arizona motorists to travel 77.4 billion miles annually and moving a significant portion of the $365 billion worth of commodities shipped to and from the state each year. But, conditions on the system are deteriorating, as the need for transportation improvements far outpaces the amount of state and federal funding available.
• The design, construction and maintenance of transportation infrastructure in Arizona supports approximately 65,000 full-time jobs across all sectors of the state economy. Approximately 1.1 million full-time jobs in Arizona in key industries like tourism, retail sales, agriculture and manufacturing are completely dependent on the state’s transportation network.
Latest data from the U.S. Census Bureau, USDOT, FHWA, BTS, ARTBA, NHTSA, and AAA compiled and analyzed by TRIP.
Amanda E. Ng, Ph.D., M.P.H., Dzifa Adjaye-Gbewonyo, Ph.D., and James Dahlhamer, Ph.D.
Key findings
Data from the National Health Interview Survey
● In 2022, 5.7% of adults lacked reliable transportation for daily living in the past 12 months. Women (6.1%) were more likely than men (5.3%) to lack reliable transportation.
● The percentage of adults who lacked reliable transportation was lowest among Asian non-Hispanic adults (3.6%) compared with other race and Hispanicorigin groups.
● Lack of reliable transportation decreased with increasing education level and family income.
● Adults living in the West North Central region of the United States (7.5%) were more likely to lack reliable transportation than the national average (5.7%), while adults in New England (4.1%) were less likely.
Access to transportation may be required for many daily tasks, including going to work, health care visits, and obtaining groceries. Previous research suggests that a lack of transportation, especially among adults who are older, uninsured, and have lower incomes, leads to reduced access to health care, which may then lead to adverse health outcomes (1,2). Using data from the 2022 National Health Interview Survey, this report describes the percentage of adults who lacked reliable transportation for daily living in the past 12 months by selected sociodemographic and geographic characteristics.
The percentage of adults who lacked reliable transportation for daily living in the past 12 months was higher among women compared with men and decreased with age.
In 2022, about 5.7% of adults lacked reliable transportation for daily living in the past 12 months (Figure 1). The percentage of adults who lacked reliable
nchs/products/databriefs/db490.htm#section_2
NOTES: Estimates are based on household interviews of a sample of the U.S. civilian noninstitutionalized population. Access data table for Figure 1 at: https://www.cdc.gov/nchs/data/databriefs/db490-tables.pdf#1 SOURCE: National Center for Health Statistics, National Health Interview Survey, 2022.
NCHS reports can be downloaded from: https://www.cdc.gov/nchs/products/index.htm
transportation was lower among men (5.3%) compared with women (6.1%). As age increased, the percentage of adults who lacked reliable transportation decreased, from 7.0% among adults ages 18–34 to 4.5% among adults ages 65 and older.
American Indian and Alaska Native non-Hispanic adults were more likely to lack reliable transportation for daily living compared with Asian non-Hispanic, White non-Hispanic, Hispanic, and Other or multiple-race non-Hispanic adults.
In 2022, American Indian and Alaska Native non-Hispanic (subsequently, American Indian and Alaska Native) adults were more likely to lack reliable transportation for daily living in the past 12 months (17.1%) compared with Asian non-Hispanic (subsequently, Asian) (3.6%), White non-Hispanic (subsequently, White) (4.8%), Hispanic (6.9%), and Other or multiple-race nonHispanic (7.6%) adults (Figure 2). Asian adults were least likely to lack reliable transportation. Black non-Hispanic (subsequently, Black) (9.2%) adults were more likely than White and Hispanic adults to lack reliable transportation, and White adults were less likely to lack reliable transportation than Hispanic adults. While American Indian and Alaska Native adults were more likely to lack reliable transportation than Black adults, this difference was not significant.
Figure 2. Percentage of adults who lacked reliable transportation for daily living in the past 12 months, by race and Hispanic origin: United States, 2022
Indian and Alaska
1Significantly different from Asian non-Hispanic adults (p < 0.05).
2Significantly different from Hispanic adults (p < 0.05).
3Significantly different from White non-Hispanic adults (p < 0.05).
4Significantly different from Other or multiple-race non-Hispanic adults (p < 0.05).
5Significantly different from Black non-Hispanic adults (p < 0.05).
NOTES: Adults of Hispanic origin may be of any race. Adults categorized as American Indian and Alaska
Black non-Hispanic, and White non-Hispanic indicated one race only. Analyses were limited to the race and Hispanic origin groups for which data were reliable and sufficiently powered for group comparisons based on National Center for Health Statistics presentation standards. Estimates are based on household interviews of a sample of the U.S. civilian noninstitutionalized population. Access data table for Figure 2 at: https://www.cdc.gov/nchs/data/databriefs/db490-tables.pdf#2
SOURCE: National Center for Health Statistics, National Health Interview Survey, 2022.


• NEARLY 80% OF U.S. HISPANIC ADULTS SAID GETTING/STAYING PHYSICALLY ACTIVE IS THEIR TOP GOAL IN 2024
• BETWEEN 2019 AND 2022, SPORTS PARTICIPATION AMONG U.S. BLACK AND HISPANIC CHILDREN DECREASED
• ARIZONA RANKED 17TH FOR TOTAL OUTDOOR RECREATION VALUE ADDED TO THE U.S. GDP
• RECREATIONAL EXPENDITURES IN ARIZONA CLOSELY MIRROR U.S. RECREATIONAL EXPENDITURES
• GROWTH OF NATIONAL PARKS IN ARIZONA SLIGHTLY OUTPACED NATIONAL PARKS IN THE U.S.
• 88% OF RESIDENTS LIVING IN THE WESTERN U.S. HAVE VISITED NATIONAL PUBLIC LANDS IN THE PAST YEAR
• A MAJORITY OF RESIDENTS IN EVERY WESTERN U.S. STATE OPPOSE THE REMOVAL OF PROTECTIONS ON SOME AREAS OF EXISTING NATIONAL PUBLIC LANDS
• ARIZONA RANKED SECOND TO LAST FOR YOUTH SPORTS PARTICIPATION IN THE U.S.
• SCOTTSDALE RANKED AS THE BEST ARIZONA CITY FOR PARKS, BUT PARKS IN THE STATE’S MAJOR CITIES RANK LOW IN THE U.S. OVERALL
• SINCE 2021, HISPANIC ADULTS IN ARIZONA HAVE HAD THE LOWEST PHYSICAL ACTIVITY PARTICIPATION COMPARED TO OTHER RACES AND ETHNICITIES
Parks and Recreation
This Special Feature courtesy of Univision Communications explores theme parks & entertainment, lottery ticket consumers and casinos & gambling
IN FOCUS
IN FOCUS
CESAR CHAVEZ COMMUNITY CENTER
A Welcoming Gathering Space with Something for Everyone
This community center in Laveen Village has activities for community residents of all ages BY PAUL PADILLA
TEMPE PARK RANGERS
Fostering Community Connections One Park at a Time
Tempe’s Park Ranger Program is part of a larger citywide effort to enhance community health and safety BY SAVANNAH DRISKILL
EXCERPT
EXCERPT
Statewide Comprehensive Outdoor Recreation Plan 2023
Every five years, Arizona State Parks and Trails (ASPT) leads the development of a Statewide Comprehensive Outdoor Recreation Plan to maintain eligibility for funding through the Land and Water Conservation Fund (LWCF)
In its latest report, The Bureau of Economic Analysis at the U.S. Department of Commerce reported that across all 50 states and the District of Columbia, outdoor recreation employment increased in 2022. In Arizona, the increase was 5.8%
GETTING/STAYING PHYSICALLY ACTIVE WORKING ON MENTAL HEALTH AND SELF-CARE BEING IN NATURE
GETTING/STAYING PHYSICALLY ACTIVE LEARNING A NEW SKILL (COOKING, LANGUAGE, COMPUTER PROGRAM) WORKING ON MENTAL HEALTH AND SELF-CARE
GETTING/STAYING PHYSICALLY ACTIVE WORKING ON MENTAL HEALTH AND SELF-CARE
LEARNING A NEW SKILL (COOKING, LANGUAGE, COMPUTER PROGRAM)
GETTING/STAYING PHYSICALLY ACTIVE WORKING ON MENTAL HEALTH AND SELF-CARE
NOTE: The NRPA September Survey was conducted by Wakefield Research (www.wakefieldresearch.com) to 1,008 general population US adults age 18+, between September 20th and September 26th, 2023, using an email invitation and an online survey. This Park Pulse survey asked specifically about the goals people are making at parks and around recreation activities. Data has been weighted to ensure an accurate representation of US adults ages 18+.
Source: National Recreation and Park Association (NRPA), "Parks and Recreation in the New Year," 2024 www.nrpa.org/publications-research/park-pulse/parks-and-recreation-in-the-new-year/
PERCENTAGE OF U.S. CHILDREN AGES 6–17 WHO PLAYED A SPORT ON A REGULAR BASIS BY RACE/ETHNICITY (2019 & 2022)
BETWEEN 2019 AND 2022, SPORTS PARTICIPATION
Source: Aspen Institute, "Youth Sports Facts: Participation Rates," 2023 projectplay.org/youth-sports/facts/participation-rates
PERCENT OF TOTAL OUTDOOR RECREATION VALUE ADDED BY STATE (2022)
$563,704,657
$73,827,997
$52,357,522
$47,632,419
$31,187,570
$21,887,358
$20,009,099
$17,173,254
$16,863,190
$16,026,854
$15,746,093
Source: Bureau of Economic Analysis (BEA), U.S. Department of Commerce, "Outdoor Recreation Satellite Account, U.S. and States, 2022," Table 1, November 17, 2023 www.bea.gov/sites/default/files/2023-11/orsa1123.pdf
$14,598,689
$13,859,200
$12,636,284
$12,358,949
$11,886,104
$11,765,249
$11,703,617
$11,687,145
$11,349,154
$9,752,298
UNITED STATES & ARIZONA (THOUSANDS OF DOLLARS, 2022)
$111,650,213 (19.8%) $2,063,966 (17.6%) $236,010,362 (41.9%) $5,604,789 (47.9%) $23,359,881 (4.1%) $309,871 (2.6%)
$192,684,201 (34.2%) $3,724,990 (31.8%)
GOVERNMENT EXPENDITURES**** ALL OTHER SUPPORTING OUTDOOR RECREATION*** OTHER OUTDOOR RECREATION ACTIVITIES** CONVENTIONAL OUTDOOR RECREATION ACTIVITIES*
NOTES:
*Conventional outdoor recreation activities include boating/fishing, RVing, snow-based recreation and other activities.
**Other outdoor recreation activities include amusement parks/water parks, festivals/sporting events/concerts and games (including golf and tennis), among other activities.
***All other supporting outdoor recreation consists of construction and trips and travel.
****Government expenditures include federal, state and local government expenditures.
Source: Bureau of Economic Analysis (BEA), U.S. Department of Commerce, "Outdoor Recreation Satellite Account, U.S. and States, 2022," Table 2, November 17, 2023 www.bea.gov/sites/default/files/2023-11/orsa1123.pdf
OF RESIDENTS LIVING IN THE WESTERN U.S.* HAVE VISITED NATIONAL PUBLIC LANDS IN THE PAST YEAR
OVER THE PAST YEAR, HOW MANY TIMES DO YOU THINK YOU HAVE VISITED NATIONAL PUBLIC LANDS SUCH AS NATIONAL PARKS, NATIONAL FORESTS, NATIONAL MONUMENTS, NATIONAL WILDLIFE REFUGES OR OTHER NATIONAL PUBLIC LANDS? (JANUARY 2024)
*NOTE: METHODOLOGY: 3,376 telephone and online interviews with registered voters in eight states: Arizona (N=458), Colorado (N=436), Idaho (N=402), Montana (N=429), Nevada (N=428), New Mexico (N=416), Utah (N=405) and Wyoming (N=402). Two oversamples were also conducted to have greater ability to report distinctions among racial/ethnic sub-groups. We conducted additional interviews to reach a total of N=210 Black voters and a total of N=206 Native American voters, which were then weighted back to reflect their true proportions within the electorate in this region. Interviews were conducted January 4-21, 2024, in Spanish and English. The effective margin of error is ± 2.4% at the 95% confidence interval for the total sample; and at most ± 4.9% for each state. The total numbers have been statistically weighted to reflect the true geographic distribution of voters throughout the region. Interviews within each state were distributed proportionally by region. Comparisons are made to similarly conducted surveys each year from 2011 to 2023. Bipartisan research team of New Bridge Strategy (R) and Fairbank, Maslin, Maullin, Metz & Associates (D).
Source: Colorado College, “State of the Rockies Project, 2024 Conservation in the West Poll,” January 2024 www.coloradocollege.edu/other/stateoftherockies/conservationinthewest/2024.html
OF
IN EVERY
PERCENT OF RESIDENTS WHO STRONGLY OR TOTALLY OPPOSE REMOVAL OF PROTECTIONS ON EXISTING NATIONAL PUBLIC LANDS, PARTICULARLY NATIONAL MONUMENTS, FOR DRILLING, MINING OR OTHER DEVELOPMENT
*NOTE: METHODOLOGY: 3,376 telephone and online interviews with registered voters in eight states: Arizona (N=458), Colorado (N=436), Idaho (N=402), Montana (N=429), Nevada (N=428), New Mexico (N=416), Utah (N=405) and Wyoming (N=402). Two oversamples were also conducted to have greater ability to report distinctions among racial/ethnic sub-groups. We conducted additional interviews to reach a total of N=210 Black voters and a total of N=206 Native American voters, which were then weighted back to reflect their true proportions within the electorate in this region. Interviews were conducted January 4-21, 2024, in Spanish and English. The effective margin of error is ± 2.4% at the 95% confidence interval for the total sample; and at most ± 4.9% for each state. The total numbers have been statistically weighted to reflect the true geographic distribution of voters throughout the region. Interviews within each state were distributed proportionally by region. Comparisons are made to similarly conducted surveys each year from 2011 to 2023. Bipartisan research team of New Bridge Strategy (R) and Fairbank, Maslin, Maullin, Metz & Associates (D).
Source: Colorado College, “State of the Rockies Project, 2024 Conservation in the West Poll,” January 2024 www.coloradocollege.edu/other/stateoftherockies/conservationinthewest/2024.html
METHODOLOGY: To determine a city’s ParkScore rating, Trust for Public Land assigned points for 14 measures across five categories: acreage, investment, amenities, access and equity. For each of the 14 measures, points are awarded on a relative basis, based on how a city compares to the 100 largest U.S. cities. Points are assigned by breaking the data range established by our national sample into brackets, with the lowest bracket receiving the least points and the highest bracket receiving the most points. Each city’s total points—out of a maximum of 500—are
a ParkScore rating of up to 100. Data collected September 2023 – March 2024.
Source: Trust for Public Land, "Scoring Metrics," March 2024 www.tpl.org/parkscore/rankings


370K
1
48K
Hispanics


We’re proud to support the Arizona Hispanic Chamber of Commerce and its invaluable work for our community.
Here for it. Are you?

BY PAUL PADILLA
To everyone who lives in the Phoenix metro area, the growth of the South Phoenix community has been impressive. The numbers tell this story well: During the 10-year period between 2013–2022, population growth in South Phoenix outpaced the state overall. According to the U.S. Census Bureau, South Phoenix grew by 14% during this period while the entire state of Arizona grew by 11%.
With such tremendous growth in the area, particularly in the Laveen community, it was well overdue that the area finally got a community center that they could proudly call their own. The Cesar Chavez Community Center, located just south of Baseline Road between 35th Avenue and 43rd Avenue, first opened its doors to the public on March 30, 2023. More than a year later, the demand for this community center is as strong as ever.
The center is named after the legendary farmworker organizer, civil rights leader and man of the community who co-founded the National Farm Workers Assn. (now the United Farm Workers) in 1962 with Dolores Huerta. Within the Cesar Chavez Community Center, visitors will find vast displays where they will learn more about Chavez and get a better understanding of the sacrifices he and other leaders of his generation made to secure a better life for
Unlike many other local community centers, it also offers cooking classes for people of various age groups and has meeting rooms and space available for remote work.
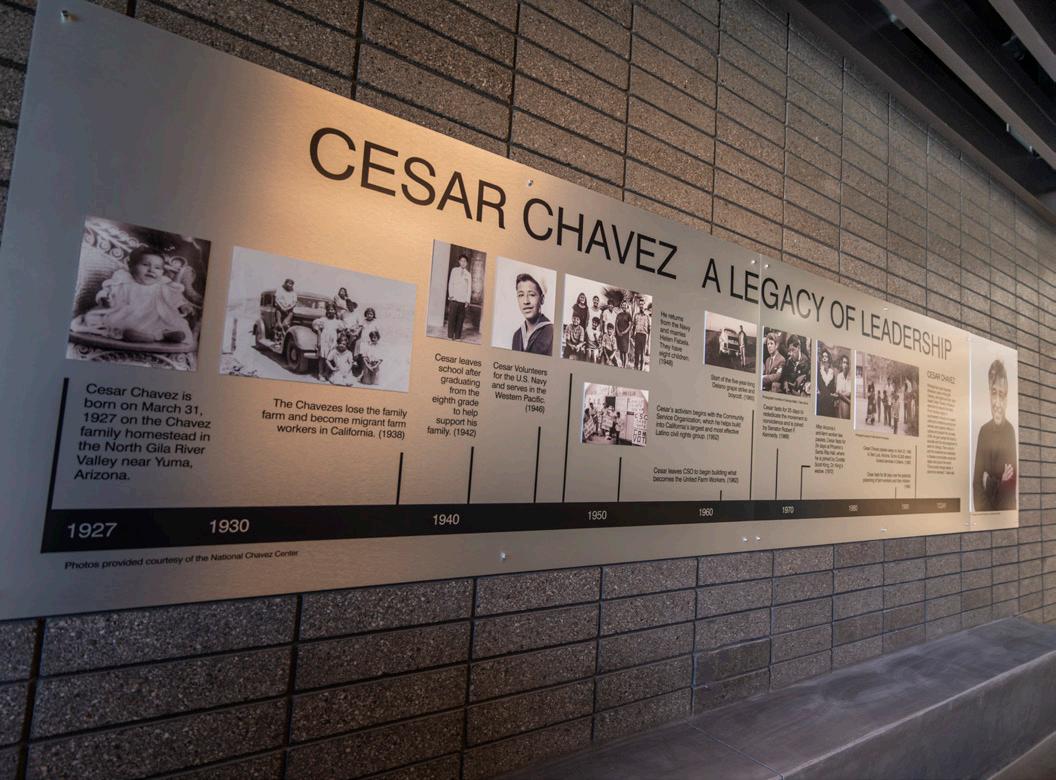
future generations. Joe Diaz, parks and recreation deputy director for the City of Phoenix, proudly proclaims the center as a “safe space for everyone to enjoy.”
Considering the wide spectrum of activities offered at this center, it is hard to debate Diaz’s claim. Whether you are a parent with a newborn, a senior citizen or anyone in between, you are bound to find an activity that interests you. For example, the center offers a summer camp for kids, senior gatherings and sports and gaming leagues.
It also collaborates with external partners to offer other popular activities, including teaming up with the Phoenix Suns to host the Jr. Suns league for kids under the age of 18 who are interested in learning the sport of basketball. Another popular collaboration is with FitPHX, which helps to facilitate yoga classes throughout the
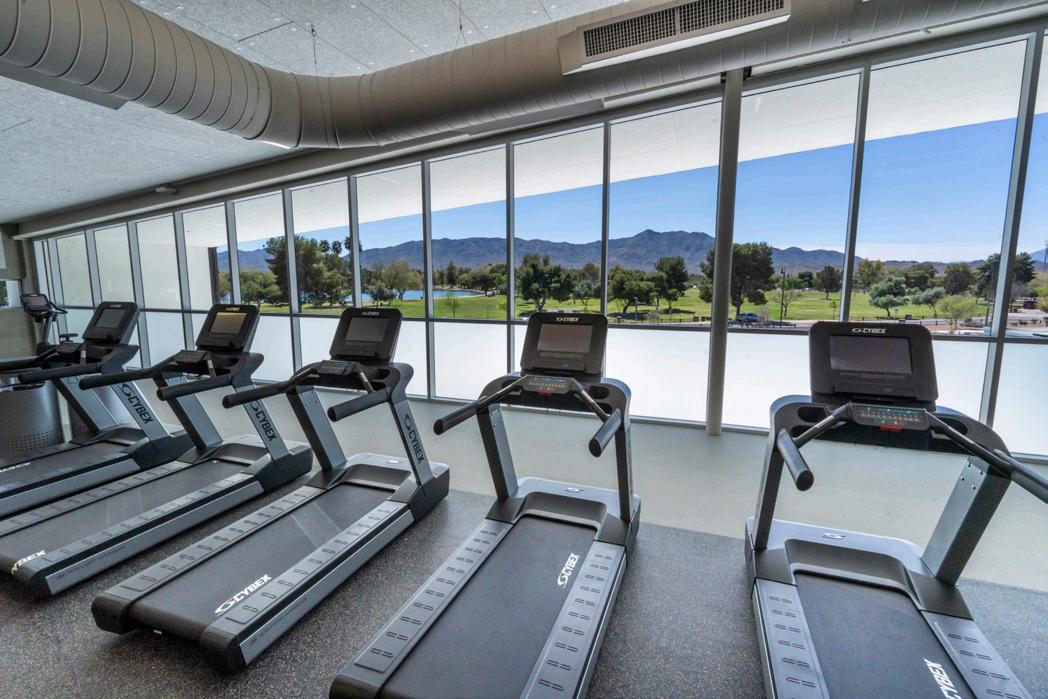
year. The center also collaborates with Molina Healthcare to offer unique “mother and child” courses.
Unlike many other local community centers, it also offers cooking classes for people of various age groups and has meeting rooms and space available for remote work. The Cesar Chavez Community Center really lives up to its name: It is much more than just a place for community members to participate in recreational activities; it is a shared space that provides local residents with opportunities to both gain and share knowledge.
The future of the center is bright. Diaz says that most rooms in the
building are booked as much as six months in advance. There also are many ideas on the table for future enhancements to the center, but all future enhancements will depend on available funding.
Here are just two ideas being considered:
• badminton classes, because the sport has recently surged in popularity and
• the addition of a senior center next to the Cesar Chavez Community Center.
Diaz says that if the City of Phoenix and the other external stakeholders increase the funding, the center will be able to address the dynamic needs of the local community on a much grander scale. Keep your fingers crossed.
Paul Padilla is the director of market intelligence for the Arizona Hispanic ChamberofCommerce in Phoenix.
Cesar Chavez Community Center
7858 S. 35th Ave.
Laveen Village, AZ 85339
602.534.2828
phoenix.gov/parks/recreation-and-community-centers/ centers-c/cesar-chavez-community-center
HOURS
Monday–Thursday: 9am–9pm Friday–Saturday: 9am–5pm Closed Sundays and Holidays
WATCH THE VIDEO youtube.com/watch
From the United Farm Workers
The Story of Cesar Chavez ufw.org/research/history/story-cesar-chavez/
BY SAVANNAH DRISKILL
From helping the community and saving wild animals to educating the next generation of nature enthusiasts, Tempe park rangers are dedicated to serving the community.
Last November, the City of Tempe relaunched the Tempe park ranger program, bringing 16 full-time rangers to parks and nature preserves throughout the city. These rangers work seven days a week providing ambassadorship, building community connections and increasing the feeling of safety in the parks.
The program is held within Tempe’s Parks and Recreation Division of the Community Services Department. Rangers work alongside other city departments to dispatch resources as needed, such as the city’s CARE 7 and HOPE team, Tempe Fire Medical Rescue and Tempe Police Department.
The city operated a previous iteration of the park ranger program many years ago before the program was discontinued amid deep budget cuts due to the Great Recession (2007–2009). Thankfully,
this important resource has finally been reinstated, with rangers covering the city’s more than local 52 parks and two nature preserves.
With a lot of ground to cover, the park rangers are already making a huge difference. The park rangers have already logged more than 11,500 park visits and assisted with 759 dispatched calls for service, which range from helping park visitors, removing hazardous materials and responding to reports of park rule violations. Rangers visit many of the city’s parks throughout their shifts, including neighborhood, community and regional parks, the parks surrounding Tempe Town Lake and the city’s two nature preserves.
In addition to assisting human park visitors, the rangers have already also rescued several animals. Rangers have aided a duck with a fishing hook stuck in its beak, a fledging Cooper’s Hawk in need of respite, lost baby birds (including a starling, a swallow and a grackle), a dove stuck in chicken wire and a red-eared slider turtle who meandered a little too close to a bike path. Rangers have also responded to lost or loose cats and dogs in the parks.
The rangers regularly offer free guided community hikes in the city’s two nature preserves: Papago Park (625 N. Galvin Pkwy, Phoenix), a 1496-acre park that is part of the cities of Phoenix and Tempe; and Hayden Butte, a 25-acre park on the southeast corner of Mill Ave. and Rio Salado Parkway in Tempe. These hikes provide education about the local desert and its wild inhabitants.
In addition, the rangers engage with the community through events and visits to classrooms, which often include using live animals and plants to educate attendees of all ages. The rangers
The park rangers have already logged more than 11,500 park visits and assisted with 759 dispatched calls for service….
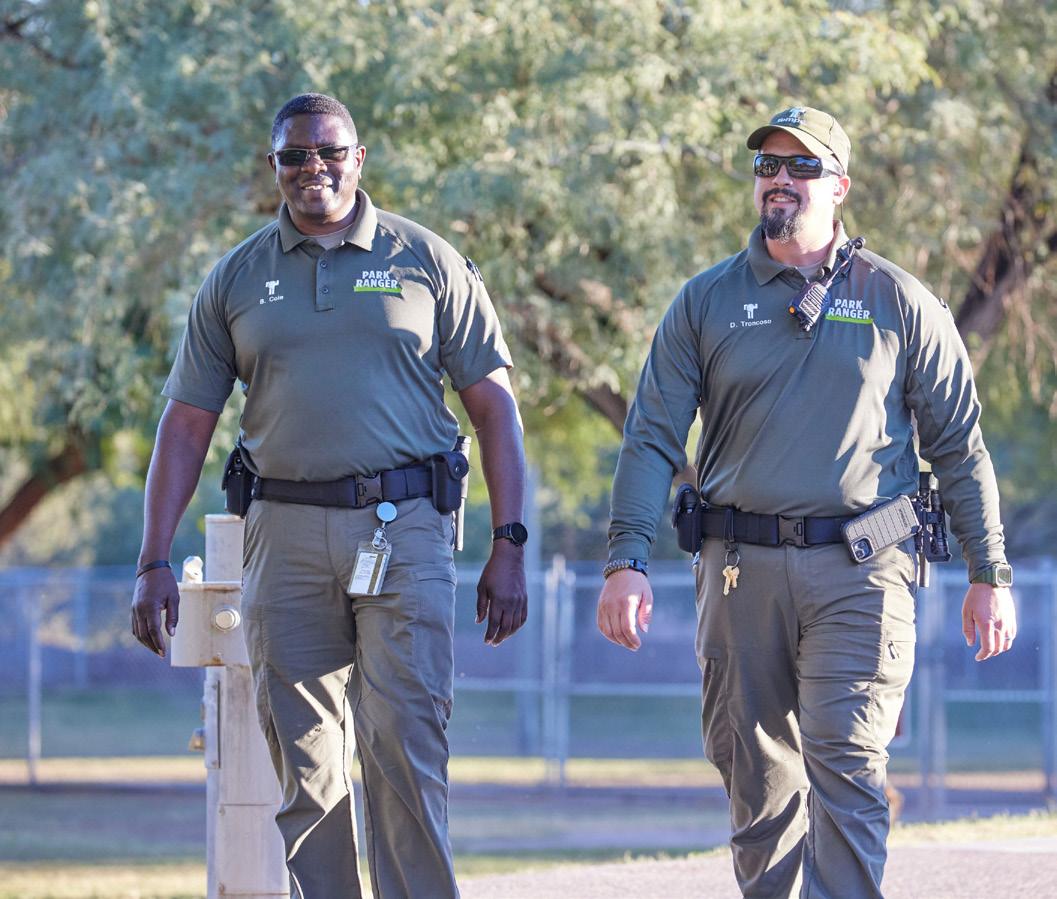
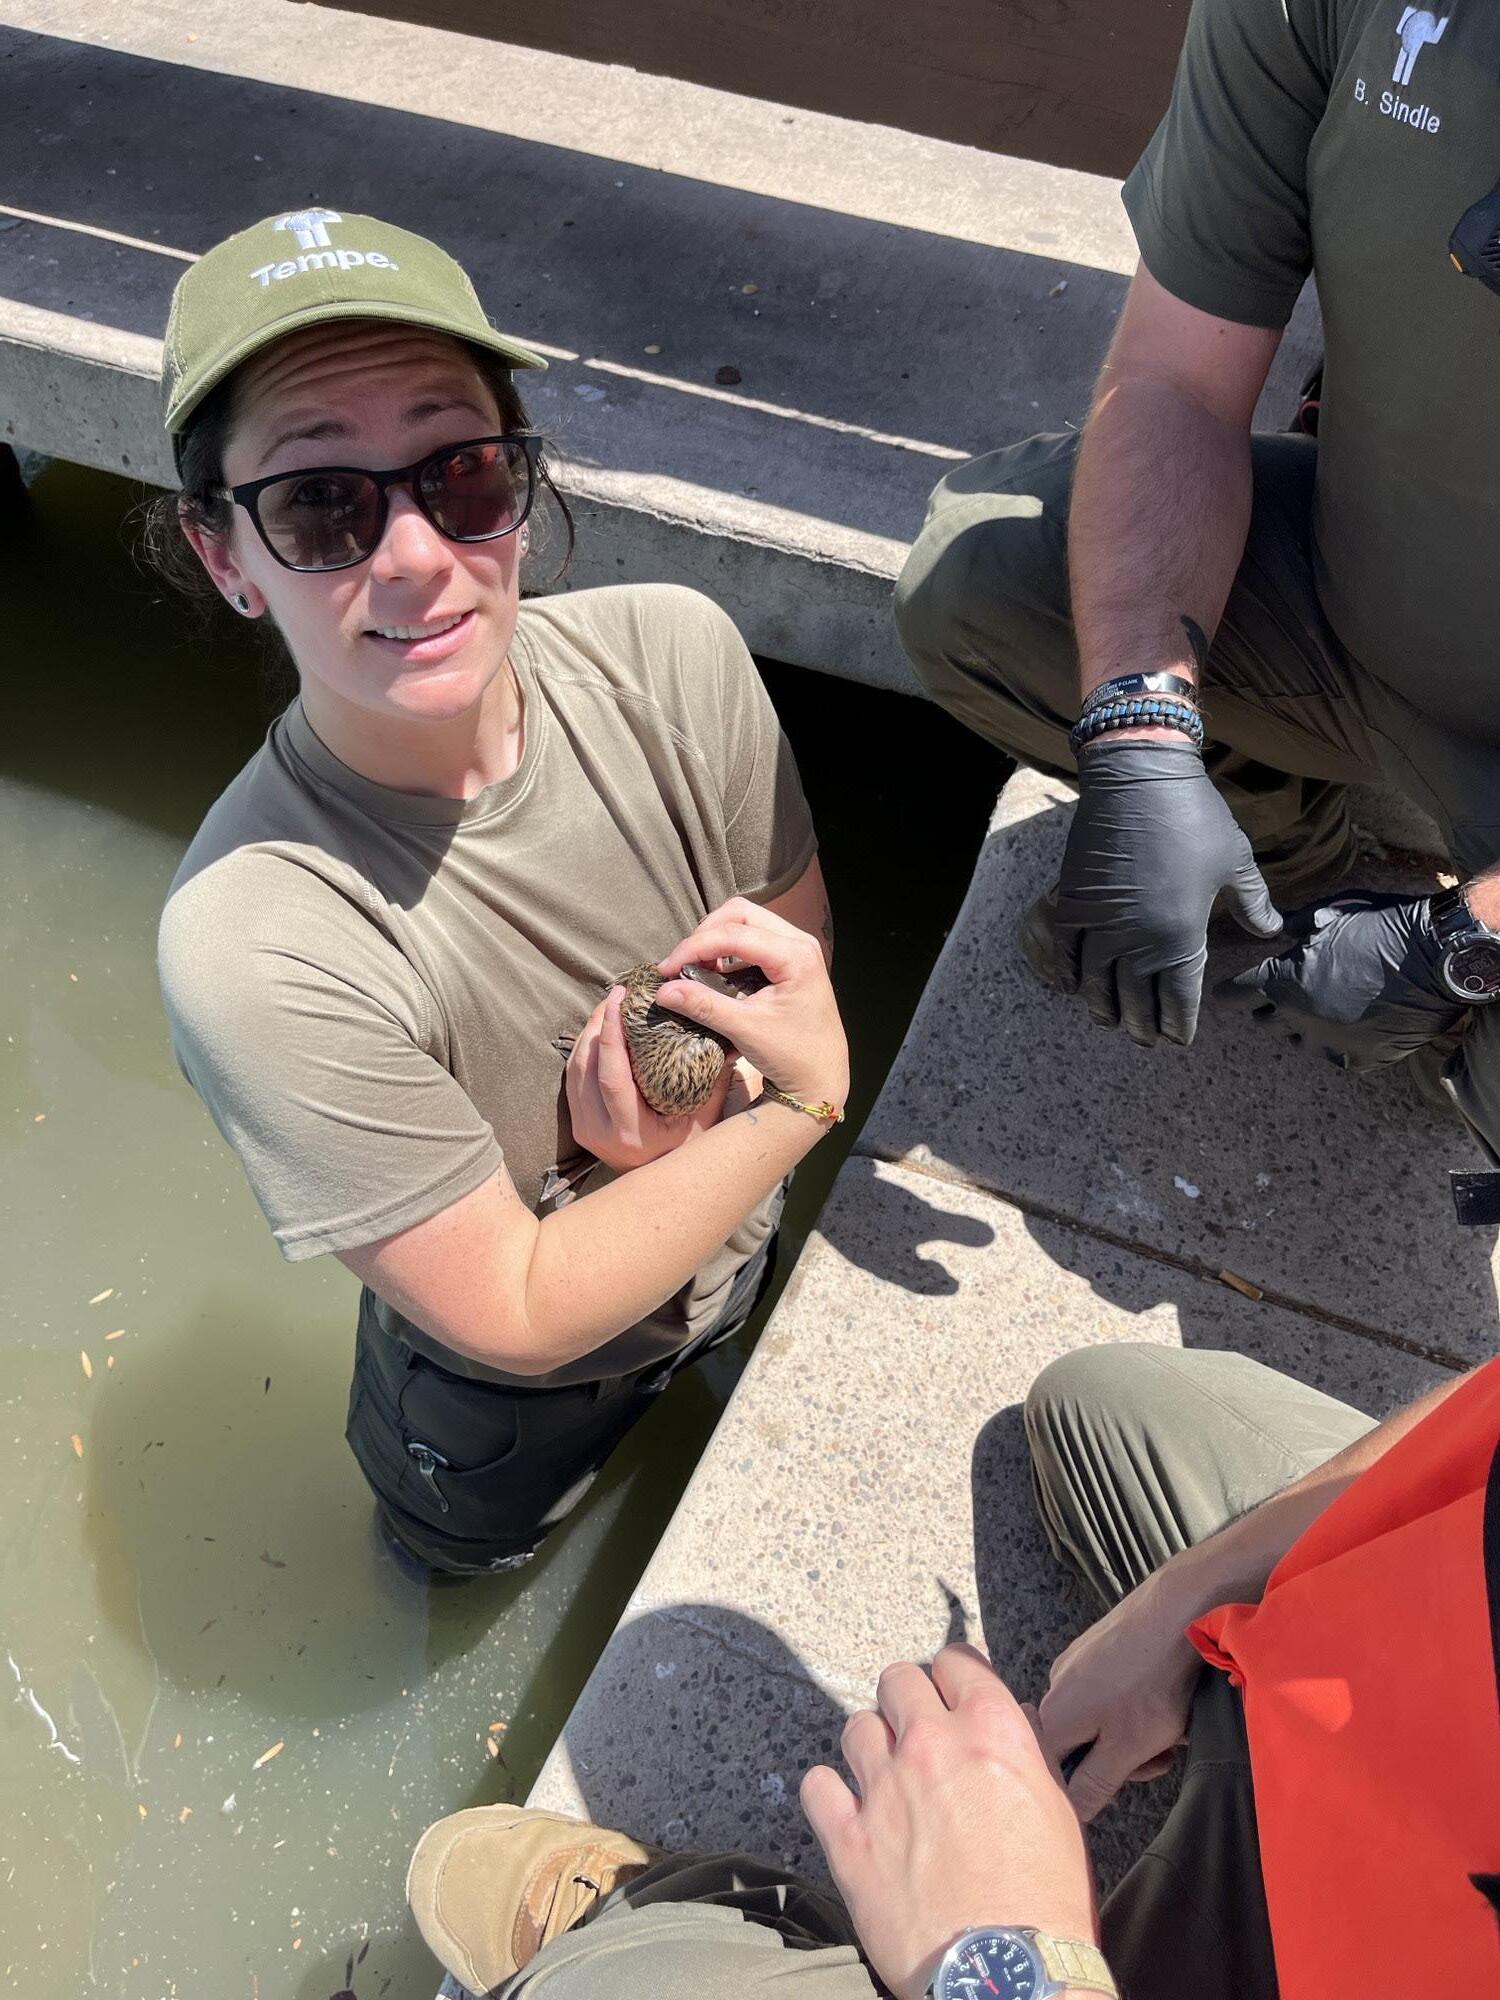
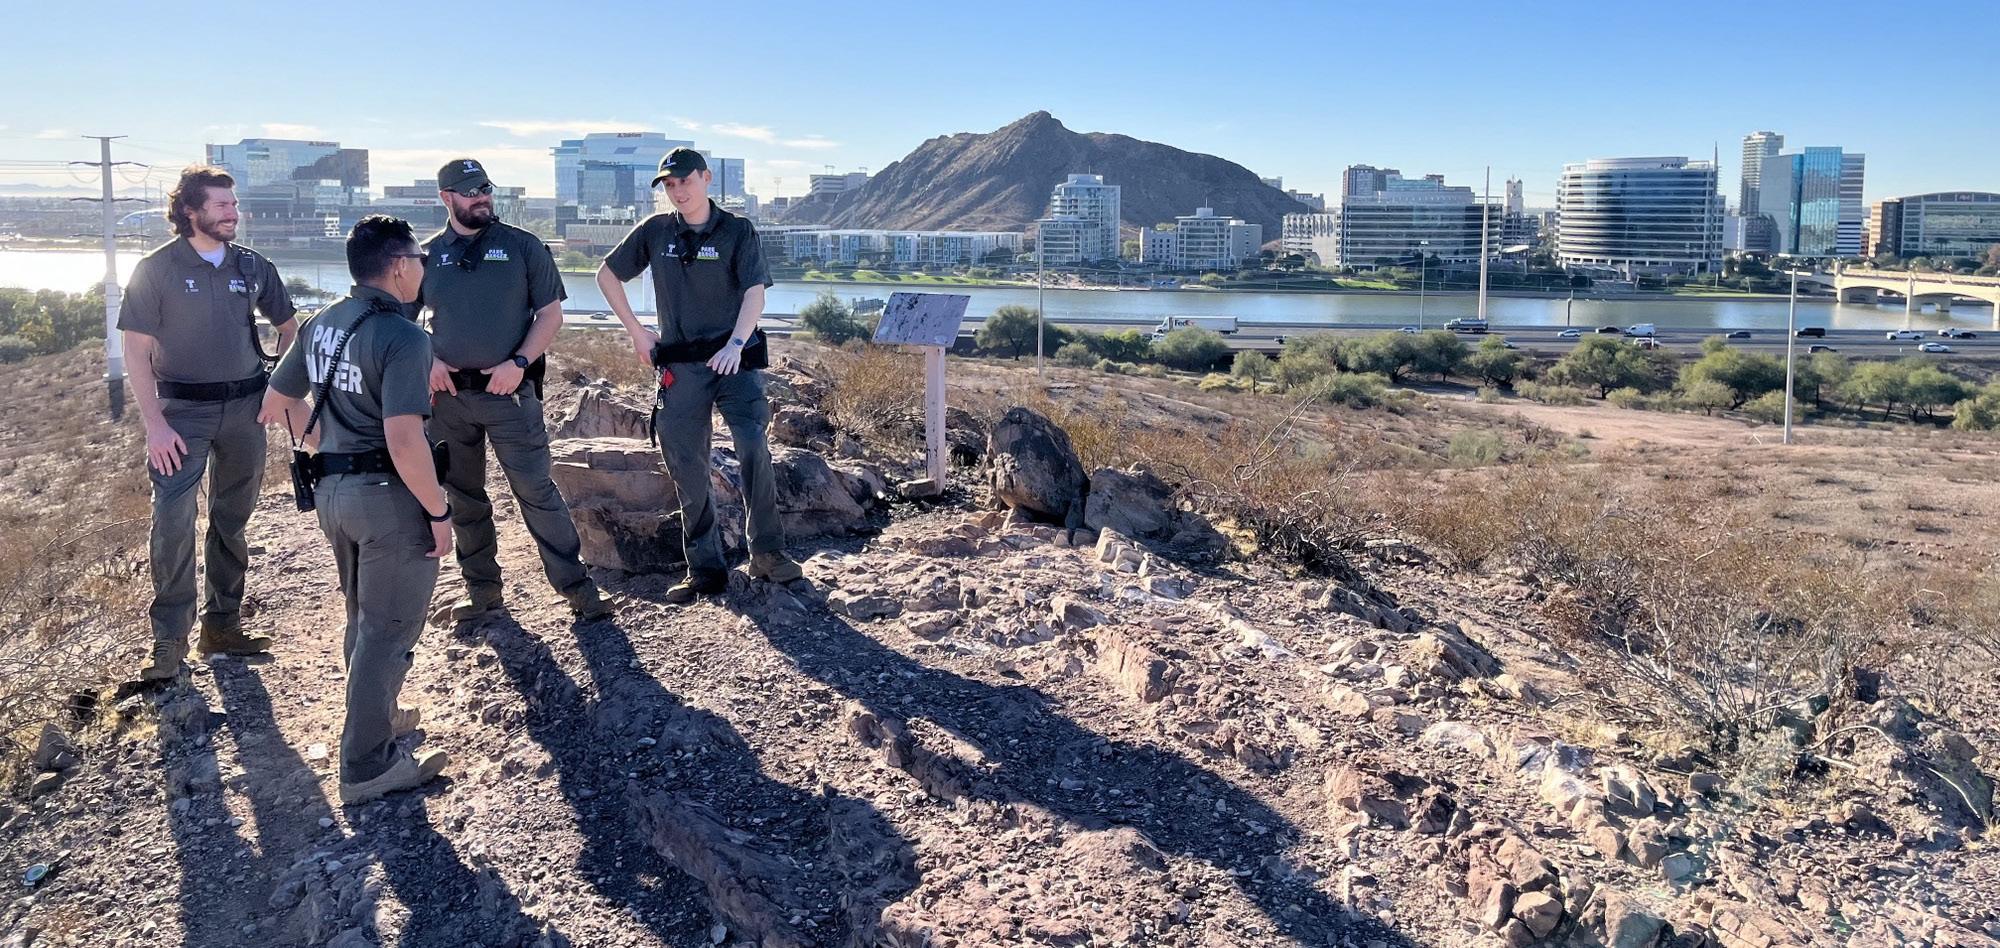
are also often the source of media interviews about topics ranging from water safety to recreational fishing. They also maintain a garden box in Clark Park (19th St. and Roosevelt St.) and educate visitors about sustainability and conservation.
Tempe Park Rangers
3500 S. Rural Rd. Tempe, AZ 85282
480.350.4311
tempe.gov/park-rangers
FACEBOOK: @TempeRecreation
INSTAGRAM: @TempeParksandRec
Download the Tempe311 app
PARK LOCATIONS IN TEMPE
tempe.gov/government/community-services/parks/park-locations
This new class of Tempe park rangers comes from a diverse range of backgrounds and experiences. Current rangers on staff include outdoor enthusiasts, former park monitors and law enforcement, conservationists, emergency medical technicians and rangers who came to Tempe from other agencies. They bring a wealth of knowledge in various outdoor, recreation and first responder topics.
Each ranger has undergone five weeks of training on topics that include first aid, watercraft operations, throw bags, customer service, de-escalation of potentially violent situations, playground inspections and desert flora and fauna. Ongoing training ensures that rangers are up to date on best practices for engaging with the community.
This reinvestment in the park ranger program is part of a larger citywide focus on enhanced community health and safety, which encompasses the city’s homeless outreach initiatives, public safety and capital improvements. Next time you see a park ranger in your city park, make sure you stop and say, “Hi!”
SavannahDriskillisaPublicInformationOfficerwiththeCityofTempe.

At Bank of America, we are committed to improving financial lives. We focus on issues that fundamentally connect to economic mobility — like workforce training, affordable housing and addressing basic needs. By partnering with organizations that drive local solutions, we can help people build better lives and create strong, sustainable local communities. Visit us at bankofamerica.com/phoenix
©2023 Bank of America Corporation | ENT-218-AD

Proceeds from ticket sales support vital programs and services, contributing over $5.5 billion to Arizona communities. ArizonaLottery.com/GivesBack
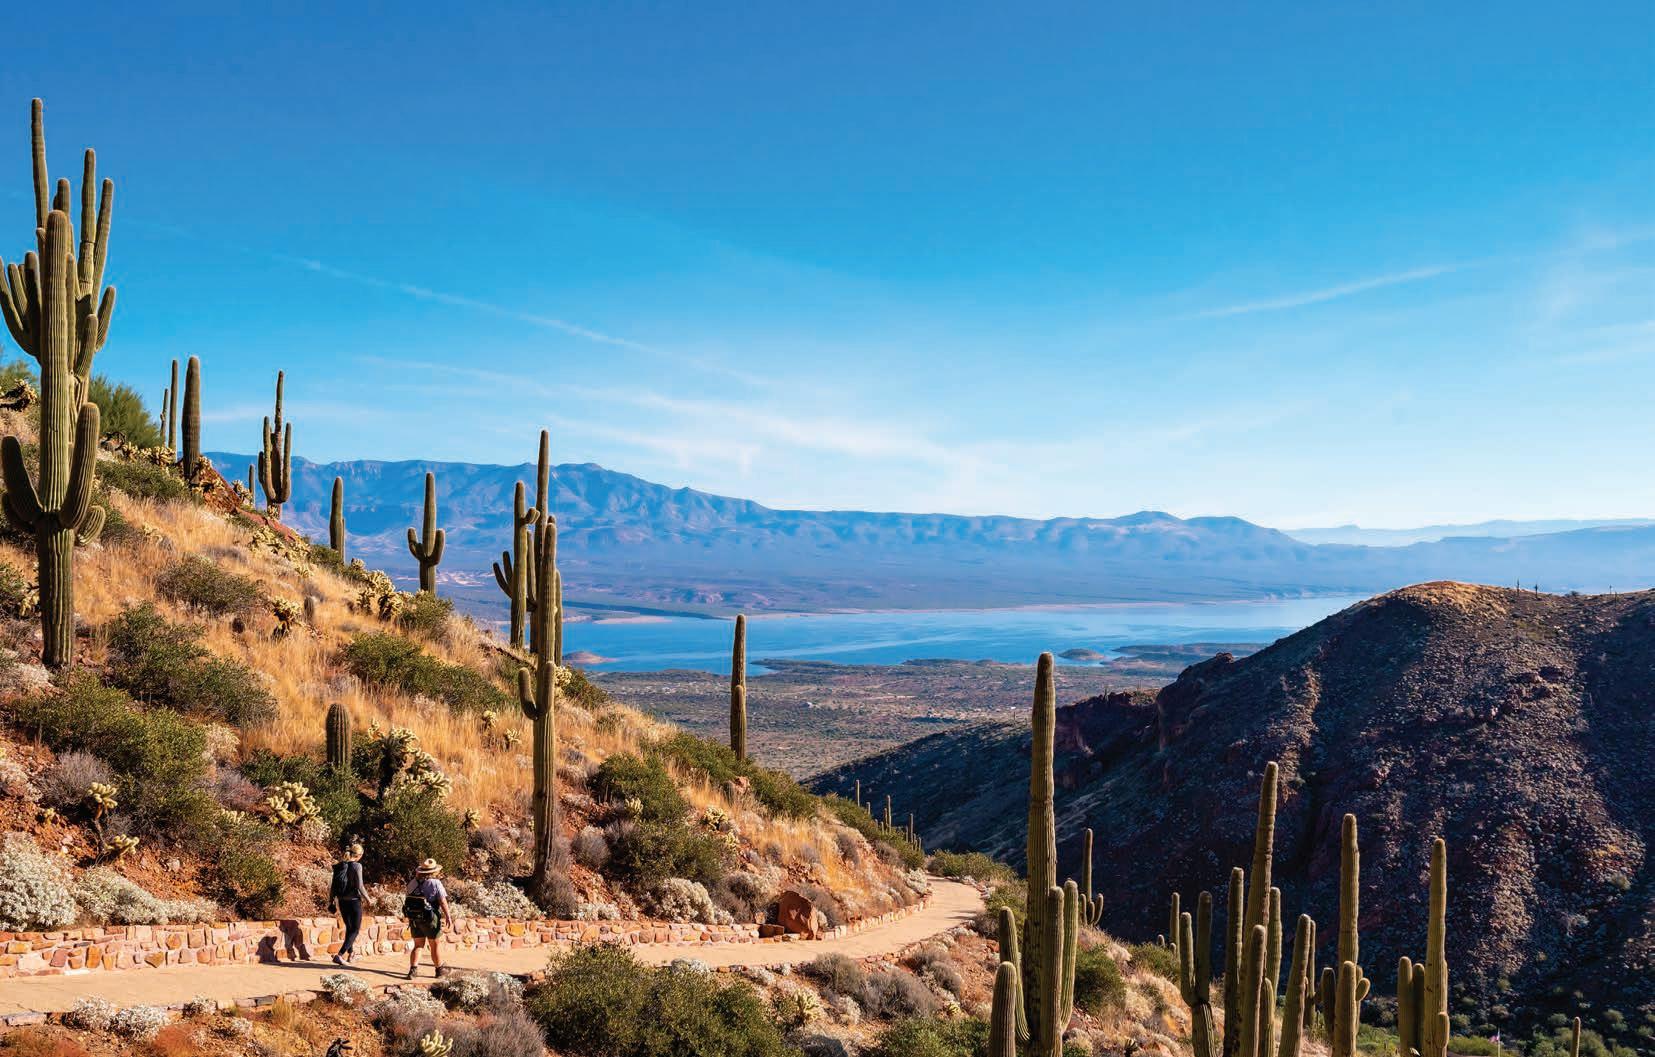
azstateparks.com/publications
ARIZONA SCORP 2023
PLANNING AND COORDINATION FOR SUSTAINABLE AND INCLUSIVE GROWTH
Arizona has the second fastest growing population in the country, with a current population of 7.3 million projected to jump to 10 million people by 2050. Between now and 2030, the projected population growth rate is 1.4% per year over the next decade (twice the national average). More residents and a growing number of tourists means public recreation areas will be facing crowding and maintenance backlogs, while balancing traditional and emerging outdoor recreation pursuits. Increased use and year-round activity can affect natural landscapes and native wildlife. These are challenges that can be best addressed with thoughtful planning, collaboration, and coordination with a wide range of stakeholders throughout the state.
To assure voices of the public, invested outdoor recreationists, and providers were represented in the SCORP, surveys and interviews were conducted across Arizona. One of the largest public studies ever conducted for the state’s SCORP was completed. For this demographically-representative study of Arizona residents, a total of 5,444 surveys and interviews in Spanish and English were completed online, by phone, and on mobile devices. An additional 1,324 online surveys were completed by invested outdoor recreationists through Arizona State Parks and Trails and other partners’ communication channels.
INCREASED PARTICIPATION IN OUTDOOR RECREATION
While 72% of Arizona residents participated in outdoor recreation within the last year, when asked if they are planning to participate in at least one outdoor recreation activity in the next 12 months, 97% responded yes. It is essential to understand the needs of these outdoor recreation users, as well as the providers of outdoor recreational experiences, to successfully plan for the future of conservation and recreation in Arizona. As part of the 2023 SCORP development process, stakeholders participated in focus groups and listening sessions. These stakeholders along with working group members were essential in sharing experiences and challenges of outdoor recreation users and providers. The statewide surveys involving Arizona residents and invested users answered a series of questions that looked at why Arizona residents are motivated to take part in outdoor recreation, what barriers stand in their way, and their perspectives on outdoor recreation, funding priorities, and the relationship between outdoor recreation and conservation.
Those who recreate outdoors had a variety of motivations, the most popular being to promote a healthy lifestyle through physical activity, followed closely by improving mental health, and opportunities for family interaction. The most common recreational activity statewide and regionally is visiting a local park; walking, jogging, or running on trails or at a park; followed closely by day hiking
Rank Top 10 Activities
1 Visiting a local park
2 Walking, jogging, running on trails or at park
3 Day hiking
4 Picnicking / gathering outdoors
5 Visiting a natural/wilderness area
6 Attending outdoor events
7 Visiting a historical site
8 Swimming outdoors
9 Bird / wildlife watching 10 Fishing
Barriers to Outdoor Recreation — Need for Increased Access, Equity, and Facilitating Connections
The top five barriers to Arizonans’ recreation participation were COVID/pandemic, too busy, do not have the equipment, fees are too high, and do not have companions or people to go with. These responses are very telling, including how one defines outdoor recreation and some misconceptions. These barriers were considered in developing strategies to support access and equity and to facilitate further connections with others, existing groups, and the outdoors.
Also, when looking at outdoor recreation characteristics over the last five years, the public perceived that they had all stayed the same, including recreation opportunities, and services related to use of parks and recreation facilities. However, according to providers these two categories of outdoor reaction in Arizona had increased. This may show a need for more targeted communication strategies to keep the public informed about the available opportunities.
The public’s recreation priorities focus on providing more walking trails and pathways; increasing easy/convenient access points to trails, pathways, waterways, and facilities; and protecting and encouraging more natural settings at outdoor recreation areas and facilities. Having the ability to recreate close to home remains popular in terms of current activity participation (e.g., walking or jogging outdoors) and preferences for future opportunities (e.g., walking trails and paths, playgrounds, etc.) among Arizona residents.
A total of 112 surveys were completed by agencies and organizations involved in providing outdoor recreation, including representatives from federal, state, county, town/city, tribal, and non-government organizations. When surveyed, outdoor recreation providers named the activities/conditions that often negatively affect recreation users, including littering / vandalism, noise, and mixed–use areas or trails causing conflicts among users, followed by crowding
According to providers, the programs that are offered most often are for adults, older adults, and families. While providers are looking to offer expanded and specialized programming, most noted the challenges in making that happen are due to staffing shortages and lack of financial support
When asked to rate their level of concern about issues that can affect their outdoor recreation experience, the public and providers agree—the top three issues are drought, wildfires that threaten outdoor recreation areas, and water levels in lakes and rivers
These concerns are also affecting a shift in funding priorities, while maintaining existing trails and outdoor recreation and cultural facilities is still the top response, a close second and third are protecting natural and cultural resources and providing habitat, preservation, and restoration
Arizona’s future focus should be in the use of public lands, the public and providers agree that the focus should be divided about equally between conserving natural resources with providing outdoor recreation opportunities. A combined 43% of the public believes the focus should be somewhat more or almost entirely on conserving natural resources.
Arizona’s Future Focus in Use of Public Lands Among those planning to recreate outdoors in next 12 months
Future
Future
Did You Know?
Approximately 82 percent of Arizona’s land comprises national forests, national parks, recreation and wilderness areas, wildlife preserves and Indian reservations.
ARIZONA SCORP 2023
Goal: Engage in responsible stewardship of Arizona’s unique and finite natural and cultural resources, open spaces, parks, lakes, and rivers, while continuing to address environmental factors to achieve a balance between conservation and recreation.
Foster sustainable outdoor recreation through conservation and stewardship.
Strategy 1: Provide consistent messaging and educational materials around environmental stewardship and associated actions for agencies, organizations, and the public.
Strategy 2: Advocate for public-private partnerships to enhance education on stewardship, including promoting Appreciate AZ and Leave No Trace principles.
Strategy 3: Identify and seek to address gaps in communication (between agencies, from agencies to groups and individuals, individuals and groups to agencies, and individuals and groups to each other) to help mitigate potential negative environmental impacts.
Strategy 4: Leverage Arizonans’ interest in conservation and stewardship by engaging the public to support and participate in the implementation of statewide, regional, and local strategies.
Optimize resources (financial, human, and other) through partnerships to fund and execute activities that address the balance between conservation and recreation.
Strategy 1: Leverage individual and organization resources to address environmental, social, and individual factors that affect the balance between conservation and recreation.
Strategy 2: Optimize current funding and seek new funding opportunities through publicprivate and cross-sector partnerships.
Advance regional and statewide alliances that address the balance between conservation and outdoor recreation.
Strategy 1: Coordinate with public agencies and private organizations to identify and act to protect critical habitat and at-risk resources (e.g., lakes and rivers) across jurisdictions, plans, etc.
Strategy 2: Engage in collaborative multi-agency and individual resource and visitation planning to reduce negative impacts.
Strategy 3: Amplify tribal voices in outdoor recreation planning efforts. Develop a collaborative strategy with tribal members for planning, managing, interpreting, and educating the public on their traditional cultural properties and resources.
Goal: Create and expand upon a sustainable outdoor recreation network that ensures Arizonans and visitors feel invited, welcome, and safe, and have access to these resources.
Develop multi-organization, sustainable outdoor recreation plans that may include conservation, restoration, maintenance, and visitor use management efforts to support outdoor recreation spaces.
Strategy 1: Update and review outdoor recreation facilities and site asset information from federal, state, county, local, and tribal outdoor recreation providers.
Strategy 2: Identify gaps between the supply and demand in outdoor recreation in Arizona. Assess and monitor outdoor recreation spaces for proactive management.
Strategy 3: Develop short-, medium- and long-term goals, objectives, and strategies for multi-organization, regional, and statewide plans.
Pursue sustainable funding to support the operation, programs, and maintenance of existing outdoor recreation spaces, as well as the acquisition and development of new outdoor recreation spaces to ensure that Arizona’s growing population continues to have access to high-quality outdoor experiences.
Strategy 1: Identify grants and other funding strategies available to support multiorganization, regional or statewide goals related to outdoor recreation and protecting natural and cultural resources.
Strategy 2: Propose sustainable funding mechanisms that provide support outside of grants and current agency budgets.
Strategy 3: Evaluate funding sources to close the current gap that limits underrepresented populations from taking part in outdoor recreation in the state.
Maintain, manage, and improve existing infrastructure to meet the needs of Arizonans.
Strategy 1: Maintain existing trails, outdoor recreation, and cultural facilities.
Strategy 2: Improve access for visitors of all abilities (physical and cognitive).
Strategy 3: Provide an integrated network of outdoor recreation opportunities that supplies different options where Arizonans and visitors feel invited, welcome, and safe.
Goal: Provide high-quality recreation experiences that help to connect individuals and families with their communities and to each other, while supporting outdoor recreation as an important economic driver in communities across Arizona.
Broaden outreach, education, and information available.
Strategy 1: Connect individuals of all ages and families to the land and the natural and cultural resources of Arizona through existing relationships with organizations, clubs, and educational institutions.
Strategy 2: Create communication channels and education opportunities for people of all ages—from children to older adults—to further expand their knowledge and experiences with outdoor recreation.
Strategy 3: Increase the use of technology, online resources, and mobile devices (e.g., apps, GPS, websites, and social media) to promote and connect people to the outdoors.
Strategy 4: Assure communication materials and signage are easy to understand, and use language and images that are inclusive and representative of the population.
Encourage outdoor recreation providers to build new and strengthen existing partnerships with other organizations and individuals to provide a network that addresses community connection and recreation opportunities.
Strategy 1: Improve community-to-community outdoor recreation connectivity using multi-scale planning and multi-modal transportation infrastructure.
Strategy 2: Use universal design to ensure that outdoor recreation spaces are accessible to the widest possible range of visitors.
Strategy 3: Partner to address community concerns, such as emergency response, litter, and misuse of outdoor recreation spaces to ensure that these spaces are inviting, welcoming, and safe for visitors.
Cultivate community vibrancy and economic vitality through healthy lands, lakes, and rivers that support sustainable outdoor recreation.
Strategy 1: Collaborate with communities to identify local and regional outdoor recreation opportunities that provide community and economic benefit.
Strategy 2: Coordinate community and regional efforts to address identified outdoor recreation needs.
Strategy 3: Identify opportunities for multiple funding streams.
Improve access and entry points to outdoor recreation for its health and wellness benefits.
Strategy 1: Identify and aid in the development, expansion, and maintenance of recreational facilities within easy access to population centers and economically disadvantaged and underrepresented areas.
Strategy 2: Improve connectivity and access to recreation facilities.
Strategy 3: Provide tools to help connect individuals and groups to outdoor recreation opportunities, programs, and sites (e.g., an integrated resource for visitors to find recreation opportunities to fit their needs and capabilities).
Create a safe and welcoming environment that will enhance participation in and enjoyment of the health and wellness benefits of outdoor recreation.
Strategy 1: Build relationships with organizations and individuals to better understand and address barriers and access issues for diverse populations.
Strategy 2: Develop or aid in the development of initiatives, programs, and projects that help to mitigate conflicts between people using the same trails, parks, etc.
Strategy 3: Engage directly with diverse populations with health and wellness benefits of outdoor recreation messaging.
Advance collaborative efforts among community groups, schools, and health and recreation providers to increase nature-based education, recreation, and other policies and practices that promote outdoor recreation for improving public health and wellness.
Strategy 1: Leverage investment in outdoor recreation projects that advance the health and wellness benefits of outdoor recreation.
Strategy 2: Identify and pursue cross-sector funding opportunities.
Strategy 3: Foster public-private partnerships. Partner with businesses to support workplace health promotion programs and connect them with outdoor recreation opportunities.
ARIZONA STATEWIDE COMPREHENSIVE OUTDOOR RECREATION PLAN (SCORP) 2023 | 13

EMBARGOED UNTIL RELEASE AT 1:00 p.m. EST, Friday, November 17, 2023 BEA 23–54
Technical: Stanislaw Rzeznik (Regional) Connor Franks (National)
Media: Connie O’Connell
301‐278‐9458
301‐278‐9710
301‐278‐9003
OutdoorRecreation@bea.gov
Connie.OConnell@bea.gov
New Statistics for 2022; Updates for 2017–2021
The U.S. Bureau of Economic Analysis (BEA) released statistics today measuring the outdoor recreation economy for the nation, all 50 states, and the District of Columbia. The new U.S. data show that the value added of the outdoor recreation economy accounted for 2.2 percent ($563.7 billion) of current‐dollar gross domestic product (GDP) for the nation in 2022 (national table 1). At the state level, value added for outdoor recreation as a share of state GDP ranged from 5.6 percent in Hawaii to 1.4 percent in Connecticut. The share was 0.9 percent in the District of Columbia (state table 1).
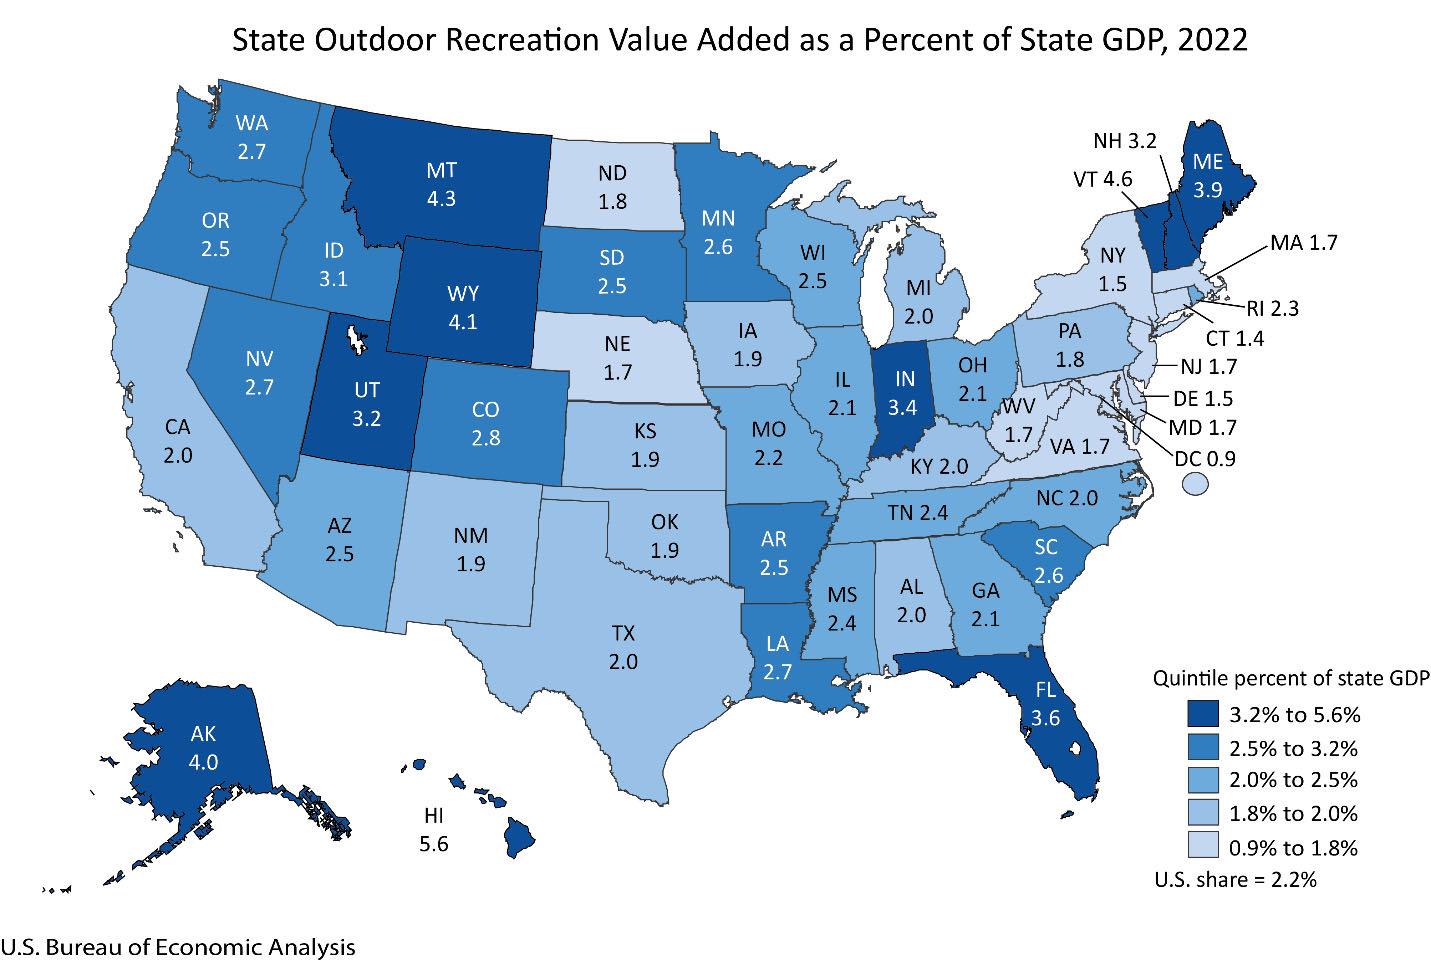
Source: U.S. Department of Commerce, Bureau of Economic Analysis, “Outdoor Recreation Satellite Account, U.S. and States, 2022,” November 17, 2023 www.bea.gov/data/special-topics/outdoor-recreation. Page 1 of 8
Inflation‐adjusted (“real”) GDP for the outdoor recreation economy increased 4.8 percent in 2022, compared with a 1.9 percent increase for the overall U.S. economy, reflecting a deceleration from the increase in outdoor recreation of 22.7 percent in 2021. Real gross output for the outdoor recreation economy increased 7.5 percent, while outdoor recreation compensation increased 9.1 percent, and employment increased 7.4 percent (national table 9).
Page 2 of 8
Across all 50 states and the District of Columbia, outdoor recreation employment increased in 2022, ranging from 18.5 percent in Hawaii to 1.1 percent in Kansas. The percentage change was 18.5 percent in the District of Columbia (BEA interactive tables).
Outdoor recreation activities fall into three general categories: (1) conventional activities such as bicycling, boating, hiking, and hunting, (2) other activities such as gardening and outdoor concerts, and (3) supporting activities such as construction, travel and tourism, local trips, and government expenditures.
In 2022, conventional outdoor recreation accounted for 34.2 percent of U.S. outdoor recreation value added, compared with 37.4 percent in 2021 (chart 2). Other outdoor recreation accounted for 19.8 percent of value added in 2022, compared with 19.0 percent in 2021. Supporting activities accounted for the remaining 46.0 percent of value added in 2022, compared with 43.6 percent in 2021. Growth in supporting activities was led by travel and tourism, reflecting growth in spending on transportation, hotels, and restaurants (national table 4).
Page 3 of 8


• AMERICANS ARE LESS SATISFIED NOW THAN THEY WERE IN 2019 REGARDING MOST PERSONAL ISSUES
• U.S. RESIDENTS CONSIDER PARKS AND RECREATION SERVICES AS IMPORTANT AS OTHER GOVERNMENT SERVICES
• U.S. RESIDENTS THAT ARE MILLENNIALS, VERY PHYSICALLY ACTIVE AND PARENTS PREFER MORE THAN OTHERS TO LIVE IN COMMUNITIES WITH ACCESS TO HIGH QUALITY PARKS AND RECREATION
• MOST PEOPLE IN THE U.S. WOULD TRADE A LARGE YARD FOR A WALKABLE COMMUNITY
• GEN Z AND MILLENNIALS IN THE U.S. ARE MORE WILLING TO PAY MORE FOR WALKABLE COMMUNITIES COMPARED TO OTHER GENERATIONS
• THE MAJORITY OF PEOPLE WHO LIVE IN WALKABLE COMMUNITIES IN THE U.S. ARE SATISFIED WITH THEIR QUALITY OF LIFE
• BETWEEN 2022 AND 2023, PEOPLE EXPERIENCING HOMELESSNESS IN THE U.S. INCREASED BY 12%
• SLIGHTLY MORE THAN A QUARTER OF PEOPLE EXPERIENCING HOMELESSNESS IN THE U.S. WERE HISPANIC/LATINO
• BLACK AND HISPANIC ADULTS IN THE U.S. ARE MORE WORRIED THAN WHITES ABOUT POLLUTED DRINKING WATER
• MORE PARKS AND RECREATIONAL ACTIVITIES ARE AVAILABLE TO RESIDENTS IN THE NORTHEAST AND WEST
• ARIZONA RANKED 5TH AMONG STATES WITH THE LARGEST INCREASE IN PEOPLE EXPERIENCING HOMELESSNESS DURING THE PANDEMIC
• IN 2023, ARIZONA RANKED 4TH AMONG STATES WITH THE HIGHEST PRECENTAGES OF PEOPLE EXPERIENCING UNSHELTERED HOMELESSNESS
• SCOTTSDALE AND GILBERT ARE CLOSEST TO ACHIEVING TREE EQUITY
IN FOCUS
CULDESAC TEMPE
A Community Where People and Businesses Thrive
This community is the first car-free neighborhood built from scratch in the U.S.
BY ERIN BOYD
IN FOCUS
BUILD IT AND THEY WILL COME
Peoria’s Ambitious Downtown Revitalization
The city of Peoria is investing in its downtown infrastructure to fulfill its vision of creating a vibrant, accessible community for all of its citizens
BY PAUL PADILLA
EXCERPT
EXCERPT
The 2023 Annual Homelessness Assessment Report (AHAR) to Congress
In Part 1 of this report, the U.S. Department of Housing and Urban Development found that its 2023 point-in-time count of homelessness was the highest number of people reported as experiencing homelessness on a single night since reporting began in 2007
National Community and Transportation Preferences Survey
In this 2023 survey from the National Assn. of Realtors, residents in the top 50 metropolitan areas remained split on what they look for in a neighborhood, but there was a modest uptick in measures of the importance of walkability
*NOTE: Based on employed adults
PERCENT OF U.S. ADULTS WHO ARE VERY SATISFIED WITH VARIOUS ASPECTS OF THEIR LIFE (2019 VS 2023) Source: Gallup, "Americans Largely Satisfied With Their Personal Life," Megan Brenan, February
PERCENTAGE OF U.S. RESIDENTS THAT RATE EACH OF THE FOLLOWING LOCAL GOVERNMENT SERVICES AS SOMEWHAT, VERY OR EXTREMELY IMPORTANT (2023)
NOTE: On behalf of NRPA, Wakefield Research surveyed 1,000 U.S. adults ages 18 and older between May 16 and May 28, 2023. The firm used quotas to ensure the respondents were a reliable and representative reflection of the U.S. adult population. The margin of error for data contained in this report is +/-3.1 percent at the 95 percent confidence level.
Source: National Recreation and Park Association (NRPA), “2023 Engagement with Parks Report” www.nrpa.org/contentassets/257fe28053c6420786927fcffc2f9996/2023-engagement-report.pdf
U.S. RESIDENTS THAT ARE MILLENNIALS, VERY PHYSICALLY ACTIVE AND PARENTS PREFER MORE THAN OTHERS TO LIVE IN COMMUNITIES WITH ACCESS TO HIGH QUALITY PARKS AND RECREATION
PERCENTAGE OF U.S. RESIDENTS BY VARIOUS CATEGORIES THAT SAY ACCESS TO HIGH QUALITY PARK AND RECREATION OPPORTUNITIES IS SOMEWHAT, VERY OR EXTREMELY IMPORTANT WHEN CHOOSING WHERE TO LIVE (2023)
NOTE: Baby Boomers were born 1946–1964. Generation X (aka Baby Buster generation) was born 1965–1980. Millennials (also called Generation Y) were born 1981–1996. Generation Z (iGen) was born 1997–2012.
On behalf of NRPA, Wakefield Research surveyed 1,000 U.S. adults ages 18 and older between May 16 and May 28, 2023. The firm used quotas to ensure the respondents were a reliable and representative reflection of the U.S. adult population. The margin of error for data contained in this report is +/-3.1 percent at the 95 percent confidence level.
Source: National Recreation and Park Association (NRPA), “2023 Engagement with Parks Report” www.nrpa.org/contentassets/257fe28053c6420786927fcffc2f9996/2023-engagement-report.pdf MOST PEOPLE IN THE U.S. WOULD TRADE A LARGE
PREFERRED COMMUNITY IN THE U.S. WALKABLE COMMUNITY VS. LARGE YARD (2015—2023)
NOTE: American Strategies designed this Internet survey of the top 50 metropolitan statistical areas in the United States. The survey reached 2,000 adults, 18 years or older. The survey was conducted by YouGov on March 20-April 3, 2023.
Source: National Association of Realtors, "National Community and Transportation Preferences Survey," June 20, 2023 cdn.nar.realtor/sites/default/files/documents/2023-community-and-transportation-preferences-survey-slides-06-20-2023.pdf
GEN Z AND MILLENNIALS IN THE U.S. ARE MORE WILLING TO PAY MORE FOR WALKABLE COMMUNITIES COMPARED TO OTHER GENERATIONS
NOTE: The Greatest Generation was born 1901–1924. Silent Generation was born 1925–1945. Baby Boomers were born 1946–1964. Generation X (aka Baby Buster generation) was born 1965–1980. Millennials (also called Generation Y) were born 1981–1996. Generation Z (iGen) was born 1997–2012.
American Strategies designed this Internet survey of the top 50 metropolitan statistical areas in the United States. The survey reached 2,000 adults, 18 years or older. The survey was conducted by YouGov on March 20-April 3, 2023.
Source: National Association of Realtors, "National Community and Transportation Preferences Survey," June 20, 2023 cdn.nar.realtor/sites/default/files/documents/2023-community-and-transportation-preferences-survey-slides-06-20-2023.pdf
QUALITY OF LIFE BY AGREEMENT THAT NEIGHBORHOOD IS WALKABLE IN THE U.S. (2023)
NOTE: American Strategies designed this Internet survey of the top 50 metropolitan statistical areas in the United States. The survey reached 2,000 adults, 18 years or older. The survey was conducted by YouGov on March 20-April 3, 2023.
Source: National Association of Realtors, "National Community and Transportation Preferences Survey," June 20, 2023 cdn.nar.realtor/sites/default/files/documents/2023-community-and-transportation-preferences-survey-slides-06-20-2023.pdf
BETWEEN 2022 AND 2023, PEOPLE EXPERIENCING HOMELESSNESS IN THE U.S. INCREASED BY 12%
NOTES:
*The data for 2021 does not display the total count of people experiencing homelessness or the count of all people experiencing unsheltered homelessness because of pandemic-related disruptions to counts. Also, estimates of the number of people experiencing sheltered homelessness at a point in time in 2021 should be viewed with caution, as the number could be artificially reduced compared with non-pandemic times, reflecting reduced capacity in some communities or safety concerns regarding staying in shelters.
**Sheltered Homelessness refers to people who are staying in emergency shelters, transitional housing programs or safe havens.
***Unsheltered Homelessness refers to people whose primary nighttime location is a public or private place not designated for or ordinarily used as, a regular sleeping accommodation for people (for example, the streets, vehicles or parks).
Source: The U.S. Department of Housing and Urban Development, “The 2023 Annual Homelessness Assessment Report (AHAR) to Congress, Part 1: Point-in-Time Estimates of Homelessness,” Tanya de Sousa, Alyssa Andrichik, Ed Prestera, Katherine Rush, Colette Tano and Micaiah Wheeler, December 2023 www.huduser.gov/portal/sites/default/files/pdf/2023-AHAR-Part-1.pdf
DEMOGRAPHIC CHARACTERISTICS OF PEOPLE EXPERIENCING HOMELESSNESS IN THE U.S. (2023)
Source: The U.S. Department of Housing and Urban Development, “The 2023 Annual Homelessness Assessment Report (AHAR) to Congress, Part 1: Point-in-time Estimates of Homelessness,” Tanya de Sousa, Alyssa Andrichik, Ed Prestera, Katherine Rush, Colette Tano and Micaiah Wheeler, December 2023 www.huduser.gov/portal/sites/default/files/pdf/2023-AHAR-Part-1.pdf
AND HISPANIC ADULTS IN THE U.S. ARE MORE WORRIED THAN WHITES ABOUT POLLUTED DRINKING WATER
PERCENTAGE OF U.S. RESIDENTS BY REGION THAT SAY THEY LIVE WITHIN A WALKABLE DISTANCE OF [MULTIPLE, ONE OR NONE] PARKS OR RECREATION ACTIVITIES (2023)
LARGEST CHANGES IN EXPERIENCES OF HOMELESSNESS BY
Source: The U.S. Department of Housing and Urban Development, “The 2023 Annual Homelessness Assessment Report (AHAR) to Congress, Part 1: Point-in-Time Estimates of Homelessness,” Tanya de Sousa, Alyssa Andrichik, Ed Prestera, Katherine Rush, Colette Tano and Micaiah Wheeler, December 2023 www.huduser.gov/portal/sites/default/files/pdf/2023-AHAR-Part-1.pdf
*NOTE: A Tree Equity Score is a metric that helps cities assess how well they are delivering equitable tree canopy cover to all residents. The score combines measures of tree canopy cover need and priority for trees in urban neighborhoods (defined as Census Block Groups). It is derived from tree canopy cover, climate, demographic and socioeconomic data. The score is calculated at the neighborhood (block group) level and aggregated to the municipal level. A score of 100 means that a neighborhood has achieved Tree Equity.
Source: American Forests, Tree Equity Score www.treeequityscore.org/

BY ERIN BOYD
Arizona wasn’t known for walkability—until now. A group of developers challenged the car dependent sprawl of the Western U.S. by committing to people-first design. When the COVID pandemic hit, it intensified challenges like isolation-induced loneliness and a housing crisis, as people lost jobs and homes. Business owners struggled and our reliance on cars only drove us further apart.
Hope lies in a community where residents prioritize biking, walking and transit over car ownership. This shift fosters genuine connections among neighbors and increases activity at local businesses as people transition from their cars to the streets. In the Phoenix metro area, that community is Culdesac Tempe, an example of how neighborhoods can be reimagined to help people and businesses thrive.
Culdesac Tempe, a 17-acre development just two miles east of Arizona State University, welcomed its first residents in May 2023. The initial phases include 288 apartment homes, with plans to expand to 760 units and eventually house 1,000 residents.
Tempe has a walk score of 54, a transit score of 45 and a bike score of 75.
With over 10 local businesses—including a corner market, an award-winning restaurant, a bicycle shop and a coffee shop—the community is designed to be inclusive and welcoming, fostering a diverse and vibrant culture. The walkability of Culdesac Tempe strengthens connections between residents and local businesses, enhancing community ties.
Friends, employees and visitors travel to Culdesac Tempe by light rail, rideshare, bikes or by parking in the guest lot to enjoy pedestrian-friendly shopping and events. Residents embrace a range of transportation options, allowing more space to be dedicated to paseos for local businesses and a plaza for outdoor markets instead of residential parking.
Culdesac residents travel—and therefore shop and socialize, predominantly locally. Over 80% of resident light rail trips are within 16 minutes of Culdesac Tempe. The community’s transportation options make it easy for residents to connect with the surrounding city for work, shopping and entertainment. These options include:
CULDESAC TEMPE A COMMUNITY WHERE PEOPLE AND BUSINESSES THRIVE
FOOD
Cocina Chiwas
Busan Mart
Aruma Café
RETAIL AND SERVICES
Sew Used
Kinkan Gifts
Archer’s Bikes
Brite Candle Co.
Dose of Youth
Ito Brand
Social Spin Laundry
Malisay Designs
Maricopa Botanicals
ART
Culdesac Tempe’s Public Art Program
A look inside the art at Culdesac www.colabstudio.com/master-plan-art-culdesac/
• Complimentary Valley Metro Light Rail rides (with a stop at Culdesac Tempe)
• Free Lectric ebikes
• Discounts on Bird scooter rentals
• Discounted rides on Lyft and Waymo AV services
• Electric vehicle rentals starting at $5/hour
Culdesac’s tagline, “life where everything connects,” reflects its close-knit community, easy access to essentials, shopping surprises, special events and strong links to the rest of the city.
Culdesac’s design promotes walkability, driving local retail sales and improving public health outcomes. The diverse cultural
CULDESAC TEMPE A COMMUNITY WHERE PEOPLE AND BUSINESSES THRIVE
Culdesac Tempe
2025 E. Apache Blvd. Tempe, AZ 85281
480.210.6004
culdesac.com
WATCH A VIDEO
youtube.com/watch/car-free-neighborhood
CNBC’s look at Culdesac youtube.com/watch/first-carless-community
Lectric Bikes
2311 W. Utopia Rd. Phoenix, AZ 85027
602.715.0907
CALL CENTER
9am–4pm MST, M–F lectricebikes.com
Valley Metro Light Rail valleymetro.org
From Scientific American (April 16, 2024)
We Need to Make Cities Less Car-Dependent scientificamerican.com/article/we-need-to-make-cities-lesscar-dependent/.
From the Yale Center for Environmental Communications
American society wasn’t always so carcentric. Our future doesn’t have to be, either. yaleclimateconnections.org/2023/10/american-societywasnt-always-so-car-centric-our-future-doesnt-have-to-beeither/
FromtheYale School ofthe Environment (July9, 2022)
Wrong Turn: America’s Car Culture and the Road Not Taken
e360.yale.edu/features/wrong-turn-americas-car-cultureand-the-road-not-taken
influences of the Phoenix metro area make Culdesac a hub for vibrant local businesses, art and health care. Two businesses owned by Armando Hernandez and Nadia Holguin have thrived at Culdesac: Cocina Chiwas, a family-run restaurant offering authentic Chihuahuan cuisine and Aruma Café, serving coffee, drinks and Mexican bakery items in a welcoming space decorated in pink and white.
Culdesac also features art installations by local artists from Phoenix, Mesa and Tempe, including two works celebrating Mexican cultural heritage: the mural Good Morning Aztlan by Frank Gonzales and a metal sculpture by Sam Frésquez based on the Mariachi Pant Button. Frésquez wants "people who live in Culdesac to feel that their history is deeply seen and valued by their community."
Culdesac Tempe has also partnered with Dr. Sarah Bahsas to provide direct primary care in English and Spanish, offering comprehensive and convenient medical services without traditional insurance barriers. Services include family medicine, urgent care, blood work and prescriptions.
The local business program supports entrepreneurs and fosters economic growth. Many vendors start by participating in the weekly night market, featuring food and live music. Some mobile vendors have since graduated to storefronts at Culdesac Tempe, including ITO Brand, a Puerto Rican-inspired sustainable clothing brand that also organizes the “Small Things” market, promoting diversity and cultural exchange in the community.
By embracing inclusivity, supporting local businesses and artists, providing accessible health care and fostering economic opportunities, Culdesac Tempe has become a thriving community that celebrates diversity and enriches the lives of its residents and the surrounding area.
Erin Boyd is the government and external affairs lead for Culdesac Tempe. After joining Culdesac in 2020, Boyd spearheaded the community and retail activation and was awarded the Bike Hero of Tempe award in 2022 for building cross-sector coalitions for a better bicycle and pedestrian infrastructure.
Whether you’ re b u i l d ing a n ew $2 B
s em i conduc to r fa c il ity or j ust
s t ar ting yo u r own b u s ine s s , Pe or ia
ha s the se r vice and s u pp o rt to
he l p yo u r c o mp a ny g row.

ww w.p eoriaed .c om /az re
BY PAUL PADILLA
As someone who proudly grew up in the West Valley, I am excited to hear that communities I am very familiar with are investing in their future. The city of Peoria is one of those future-focused cities that is making wise investments to revitalize its downtown and to create a vibrant community accessible to all its citizens.
The city’s mission is to “provide excellent municipal services by anticipating community needs, creating partnerships, promoting sustainability and embracing diversity.” The city’s current project to revitalize its downtown is a key example of how they are successfully executing their mission.
Revitalizing the downtown area has been discussed since 1996. Nearly 30 years later, a few incremental improvements have been made such as an expansion of the Peoria Center for the Performing Arts, the construction of a park-and-ride facility and a community center, street enhancements, the renovation of Johnny E. Osuna Memorial Park and housing projects in collaboration with Habitat
for Humanity. Now the city is making significant strides with its ambitious revitalization plan.
Peoria currently offers a variety of community events that include:
• Somos Peoria
• Peoria Arts & Cultural Festival
• Peoria’s 2nd Saturdays
• Annual Halloween Monster Bash
• Old Town Holiday Festival.
The additional investment Peoria is making in its downtown infrastructure will take these already popular events to the next level. The city is focusing its investments in five key areas:
1. Peoria Central School
10304 N. 83rd Ave.
This school was constructed in 1906 as a two-room schoolhouse. It was the first educational facility in the city of Peoria and is currently listed on the National Register of Historic Places. The vision is to have Peoria Central School serve as a community resource.
2. Peoria Landmarks
The city plans to add iconic landmarks at two key intersections: 83rd Ave. and Grand Ave. and 83rd Ave. and Cotton Crossing.
3. A Marketplace
The city plans to turn the old NAPA buildings located at 83rd Ave. and Jefferson St. into retail spaces. Earlier plans to renovate the buildings, which were built in 1949, were scrapped when the buildings were deemed unusable and demolished in late 2023.
Somos Peoria
4. Caldwell County BBQ
The City of Peoria will now have an outpost of an East Valley favorite: Caldwell County BBQ, which is owned by the one of the former owners of Waldo’s BBQ in Mesa. Where Waldo’s was pork, this restaurant is Texas style, which uses beef. The new location will have 6600 sq. ft. of space and will be on Washington St. between 83rd Ave. and 83rd Dr.
5. Jefferson House
Through a partnership between the owners of The Churchill in downtown Phoenix and the owners of Driftwood Coffee in downtown Peoria, a new venue located on 83rd Ave. and Jefferson St. is being built. The Jefferson house will host several food venues in addition to being a gathering spot for community events.
To fulfill its vision of creating a vibrant, accessible community for all its citizens, the city’s revitalization plan includes new housing in the downtown area. According to Deputy City Manager Mike Faust, there are multiple housing projects in the area that will provide housing ranging from apartments to single homes. One of the biggest projects is Greystar’s 88-acre Peoria Place, a mixeduse master plan development that will include luxury apartments, built-to-rent single homes, residential over retail and a threebuilding Caliber light industrial park.
In addition to Greystar’s Peoria Place, says Faust, there also are “the Streamliner project and the Overland project and all [three are] within walking distance of downtown, which provides a great activation of the area.”
Saturday, Sept. 28, 2024 | 4–10:30pm
Peoria City Hall Campus at Centennial Plaza 9875 N. 85th Ave.
This multicultural festival during Hispanic Heritage Month. There will be a variety of traditional foods, beer and margaritas, plus arts and crafts, Ballet Folklorico, lucha libre, strolling mariachis and more. Entertainment this year will include the reggae fusion band Fayuca, the Grammywinning group Pacific Mambo Orchestra and the headliner Latin Breed.
peoriaaz.gov/government/departments/arts-culture/ special-events/somos-peoria
2nd Saturdays
Held monthly October–April | 5–9pm
Jefferson St. and 83rd Ave.
A monthly music and art festival featuring artisan vendors, art installations, food trucks, live music and a variety of local talent
Vendor and entertainment info
On Facebook and Instagram @Peorias2ndSaturdays
Halloween Monster Bash
Saturday, Oct. 26, 2024 | 5–9pm
Peoria Sports Complex 16101 N. 83rd Ave.
Entrance at 83rd Ave. and Mariners Way
Peoria's Old Town Holiday Festival and Street Market
Saturday, Dec. 14, 2024| 5–9pm
Johnny E. Osuna Memorial Park 10510 N 83rd Ave, Peoria, AZ 85345
Peoria Arts & Cultural Festival
Saturday, March 1, 2025 | 9am–3pm City Hall campus, Old Town Peoria
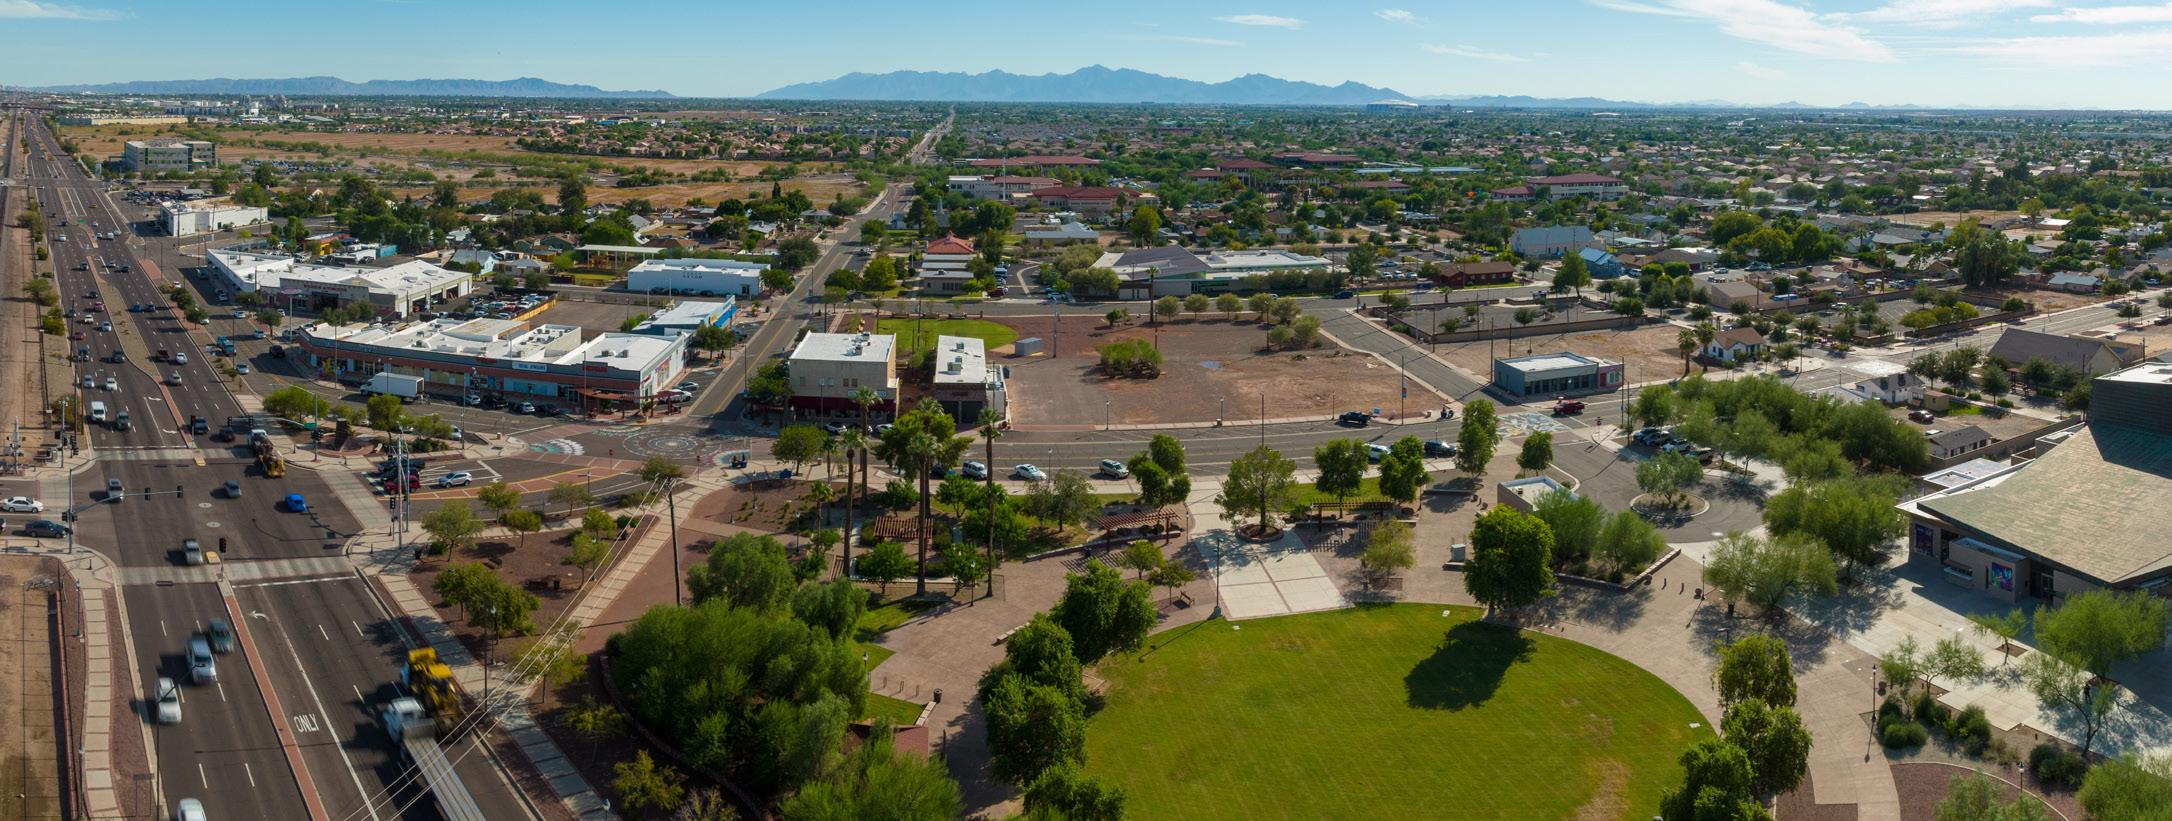
Growing Economic Development opportunities in the city’s Historic Downtown has been a decades-long priority for the City Council. The city budgeted nearly $15 million since 2022 to support this initiative.
Approximately 26 families lived in the town, which was largely undeveloped and lacked essential amenities
Peoria Central School opened
Arizona became the 48th U.S. state
Peoria Hotel opened
The Peoria High School building opened to students
Jail/police station built by the Works Progress Administration (WPA)
Arizona’s first home air-conditioning units are installed.
Peoria incorporated
Peoria named “Rose Capital of the World”
Peoria Post Office received its first telephone
Peoria gained city status with a population of 4,792
Citywide mail delivery started
Peoria unveils first official city flag
SOURCE: City of Peoria, peoriaaz.gov
These ambitious initiatives demonstrate that Peoria is putting its money where its mouth is. The city listened to its constituents and is acting upon their requests.
“This was our strategy going in,” Faust says. “We had a lot of good plans, but now let’s put up some money, let’s build some buildings and get it started.”
Clearly, Peoria has a “build it and they will come” bullish attitude toward its economic development. By investing in tangible resources upfront, city leaders are confident that the local community will enthusiastically embrace the changes. Without a doubt, the City of Peoria is ready to win—and win big.
Paul Padilla is the director of market intelligence for the Arizona Hispanic ChamberofCommerce.
FromtheCityofPeoria
Downtown Revitalization
Project Description
peoriaaz.gov/government/mayorand-city-council/priorities/economicdevelopment/downtown-peoria
U.S. Department of


Source: The U.S. Department of Housing and Urban Development, “The 2023 Annual Homelessness Assessment Report (AHAR) to Congress, Part 1: Point-in-time Estimates of Homelessness,”
Ed Prestera, Katherine Rush, Colette Tano and Micaiah Wheeler, December 2023 www.huduser.gov/portal/sites/default/files/pdf/2023-AHAR-Part-1.pdf
de
Alyssa
On a single night in 2023, roughly 653,100 people – or about 20 of every 10,000 people in the United States – were experiencing homelessness. Six in ten people were experiencing sheltered homelessness—that is, in an emergency shelter (ES), transitional housing (TH), or safe haven (SH) program—while the remaining four in ten were experiencing unsheltered homelessness in places not meant for human habitation.
Experiences of homelessness increased nationwide across all household types. Between 2022 and 2023, the number of people experiencing homelessness increased by 12 percent, or roughly 70,650 more people. The 2023 Point-in-Time (PIT) count is the highest number of people reported as experiencing homelessness on a single night since reporting began in 2007. The overall increase refects the increases in all homeless populations. Homelessness among persons in families with children experiencing homelessness rose by 16 percent. Similarly, the rise in individuals experiencing homelessness was 11 percent.
People who identify as Black, African American, or African, as well as indigenous people (including Native Americans and Pacifc Islanders), continue to be overrepresented among the population experiencing homelessness. People who identify as Black made up just 13 percent of the total U.S. population and 21 percent of the U.S. population living in poverty but comprised 37 percent of all people experiencing homelessness and 50 percent of people experiencing homelessness as members of families with children.
People who identify as Asian or Asian American experienced the greatest percentage increase among all people experiencing homelessness. Between 2022 and 2023, there was a 40 percent increase in the number of people experiencing homelessness who identify as Asian and Asian American (3,313 more people). This increase was greatest among all racial and ethnic groups experiencing unsheltered homelessness, where the number of people identifying as Asian or Asian American increased by 64 percent between 2022 and 2023 (2,774 more people).
The largest numerical increase in people experiencing homelessness was among people who
identify as Hispanic or Latin(a)(o)(x), increasing by 28 percent or 39,106 people between 2022 and 2023. People who identify as Hispanic or Latin(a)(o) (x) made up 55 percent of the total increase in people experiencing homelessness between 2023 and 2023. Most of this increase (33,772 people) was for people experiencing sheltered homelessness.
Six of every 10 people experiencing homelessness did so in an urban area (59%), with more than half of all people counted in the Continuums of Care (CoCs) that encompass the nation’s 50 largest cities (53%). The remaining four of every ten people who experienced homelessness were located in largely suburban areas (23%) and largely rural areas (18%). These patterns hold across people experiencing both sheltered and unsheltered homelessness.
Seven in ten people experiencing homelessness (72%) did so in households without children present. The number of individuals experiencing sheltered and unsheltered homelessness is the highest it has ever been since data reporting began in 2007. Compared with 2007, 13 percent more individuals were experiencing homelessness in 2023. Increases were highest for unsheltered individuals, which increased by 20 percent (39,598 more people). Experiences of sheltered homelessness also increased, by seven percent or about 15,000 more individuals.
Nearly three of every 10 people experiencing homelessness (28% or roughly 186,100 people) did so as part of a family with children. The number of people in families with children who were experiencing homelessness increased by more than 25,000 people (or 16%) between 2022 and 2023, ending a downward trend in families experiencing homelessness that began in 2012. This overall increase in the number of families with children experiencing homelessness between 2022 and 2023 refects a 17 percent increase in the number of families with children experiencing sheltered homelessness (24,966 more people).
On a single night in 2023, more than 34,700 people under the age of 25 experienced homelessness on their own as “unaccompanied youth.” These unaccompanied youth made up 22 percent of all people under the age of 25 who were experiencing
homelessness. Between 2022 and 2023, the number of unaccompanied youth increased by 15 percent (4,613 more youth). The number in 2023 is similar to the number of unaccompanied youth observed in 2020, just before the onset of the pandemic.
More than one in fve people experiencing homelessness on a single night in 2023 was age 55 or older. More than 98,000 people experiencing homelessness were aged 55 to 64, and almost 39,700 people were over age 64. Nearly half of adults age 55 or older (46%) were experiencing unsheltered homelessness in places not meant for human habitation.
In 2023, 35,574 veterans were experiencing homelessness—22 of every 10,000 veterans in the United States. The number of veterans experiencing homelessness increased by seven percent (2,445 more veterans) between 2022 and 2023. The increase included a 14 percent rise in the number of unsheltered veterans (1,943 more veterans) and a three percent increase in veterans experiencing sheltered homelessness (502 more veterans). Despite increases in experiences of veteran homelessness between 2022 and 2023, the number of veterans experiencing homelessness is 52 percent lower than it was in 2009, the baseline year for reporting veterans experiencing homelessness in the AHAR.
About one-third (31%) of all individuals experiencing homelessness reported having experienced chronic patterns of homelessness, or 143,105 people. This is the highest number of individuals experiencing chronic patterns of homelessness counted in the PIT count since these data were frst reported in 2007. Twothirds of individuals experiencing chronic patterns of homelessness, or almost 93,000 people, were counted in unsheltered locations. This is also the highest number recorded.
The national inventory of beds for people currently experiencing homelessness increased by seven percent between 2022 and 2023. The largest increase in year-round inventory for people currently experiencing homelessness occurred in emergency shelters (28,760 more beds). Within emergency shelter programs, the largest increase in inventory was for facility-based beds (which are often in congregate
settings), which increased by 14 percent between 2022 and 2023. This increase in facility-based beds refects a reduction in both the non-congregate beds that became available during the COVID-19 public health emergency and the phasing out of social distancing and shelter decompression efforts that were in place during the 2021 and 2022 Housing Inventory Count (HIC) reporting periods.
The national inventory of beds for people formerly experiencing homelessness increased by six percent between 2022 and 2023. Total inventory increased by 35,709 beds across all rapid rehousing, permanent supportive housing, and other permanent housing programs reported in the HIC. The largest increase in year-round inventory for people transitioning out of homelessness was among other permanent housing programs (32,129 more beds).


In general, people in the largest 50 MSA’s are satisfied with the quality of life in their communities –

Source: National Association of Realtors, "National Community and Transportation Preferences Survey," June 20, 2023 cdn.nar.realtor/sites/default/files/documents/2023-community-and-transportation-preferences-survey-slides-06-20-2023.pdf
• MOST SAY SPEAKING A COUNTRY’S MOST PREVALENT LANGUAGE IS IMPORTANT TO NATIONAL IDENTITY
• MOST U.S. LATINOS SAY IT IS NOT NECESSARY TO SPEAK SPANISH TO BE CONSIDERED LATINO
• NEARLY HALF OF U.S. LATINOS AGES 18—29 SPEAK “SPANGLISH” OFTEN
• HALF OF U.S. LATINOS AGES 18–29 SAY THEY HAVE OFTEN HEARD A FAMILY MEMBER OR FRIEND MAKE COMMENTS OR JOKES ABOUT OTHER LATINOS WHO DO NOT SPEAK SPANISH VERY WELL
• SPANISH-DOMINANT U.S. HISPANICS CONSUME BROADCAST TV AT A HIGHER RATE THAN THE GENERAL U.S. AUDIENCE
• U.S. HISPANICS RELY ON FAMILY AND FRIENDS FOR PROGRAMMING RECOMMENDATIONS
• U.S. LATINO FILMGOERS
• U.S. LATINOS AND BLACKS ARE UNDERREPRESENTED IN MAJOR FILM ROLES—ONAND OFF-SCREEN
• THE NUMBER OF U.S. ELIGIBLE LATINO VOTERS HAS RISEN STEADILY SINCE 2008
• AMONG U.S. HISPANIC REGISTERED VOTERS, FAVORABILITY OF HARRIS HAS INCREASED BY 8% SINCE BIDEN DROPPED OUT OF THE PRESIDENTIAL RACE
• OVERALL, HISPANICS IN ARIZONA PREFER HARRIS OVER TRUMP AS U.S. PRESIDENT
• AMONG HISPANICS IN ARIZONA, HARRIS HAS THE STRONGEST SUPPORT FROM WOMEN AND TRUMP HAS THE STRONGEST SUPPORT FROM MEN
• 35 PERCENT OF HISPANICS IN ARIZONA ARE NOT COMPLETELY CERTAIN ABOUT THEIR CHOICE FOR U.S. PRESIDENT
• INFLATION, THE ECONOMY AND HOUSING ARE THE TOP CONCERNS FOR ARIZONA LATINO VOTERS
• IN ARIZONA, CONSERVATIVE LATINO VOTERS ARE MORE OPEN TO SUPPORTING THE OPPOSITE PARTY THAN LIBERAL LATINO VOTERS
• 68 PERCENT OF ARIZONA LATINO VOTERS AGES 40+ SAY THAT MAKING ABORTION ILLEGAL IS WRONG
SPECIAL FEATURE
Social/Cultural Cohesion
Univision Communications takes a look at cell phone usage, beauty services, movie attendance and pet ownership among Hispanics in the Phoenix and Tucson metro areas
366 IN FOCUS
EXCERPT
SPECIAL FEATURE 369
EXCERPT
373
DECISION TIME
We Are Electing the Next U.S. President in November. Let Your Voice Be Heard
As an American citizen, it is your right and your responsibility to vote. This special feature on the 2024 U.S. presidential election will give you the resources and important information to make an informed choice
BY KAREN MURPHY
HARMONY AND LEGACY
The Remarkable Journey of Efrain Casillas
This Tolleson Elementary School District music teacher has spent the last 24 years dedicated to the education and enrichment of his students BY GISELLE HERRERA
NATIONAL AND STATE PROJECTIONS
The Latino Vote in Election 2024
The NALEO Educational Fund projects that at least 17.5 million Latinos will cast ballots nationally in November
SURVEY OF LATINO VOTERS IN ARIZONA
UnidosUS partnered with BSP Research and found that Latino voters see Democrats as being more aligned with their values and views, but the majority don’t feel that either party truly cares about Latino voters
NEARLY HALF OF U.S.LATINOS AGES 18–29 SPEAK “SPANGLISH” OFTEN
"Latinos’
HALF OF U.S. LATINOS AGES 18–29 SAY THEY HAVE OFTEN HEARD A FAMILY MEMBER OR FRIEND MAKE COMMENTS OR JOKES ABOUT OTHER LATINOS WHO DO NOT SPEAK SPANISH VERY WELL
U.S. LATINOS WHO USE SPANGLISH IN CONVERSATIONS WITH FRIENDS AND FAMILY BY PERCENTAGE (2022)
U.S. LATINOS WHO HAVE HEARD FRIENDS OR FAMILY MEMBERS COMMENT OR JOKE ABOUT LATINOS WHO DO NOT SPEAK SPANISH VERY WELL BY PERCENTAGE (2022)
ALL U.S. LATINOS
AGES 18–29 AGES 30–49 AGES 50–64 AGES 65+ RARELY/NEVER SOMETIMES EXTREMELY OFTEN/OFTEN
Source: Pew Research Center, "Latinos’ Views of and Experiences With the Spanish Language," Lauren Mora and Mark Hugo Lopez, September 20, 2023 www.pewresearch.org/race-and-ethnicity/2023/09/20/latinos-views-of-and-experiences-with-the-spanish-language/
LATINOS ARE JUST 19 PERCENT OF THE U.S. POPULATION BUT ARE THE MOST AVID FILMGOERS PER CAPITA. THEY ACCOUNT FOR:
24 PERCENT OF FILM TICKET SALES
29 PERCENT OF DAILY MOBILE TV VIEWERS 24 PERCENT OF STREAMING SUBSCRIBERS
MOREOVER, LATINO VIEWERSHIP DOUBLES WHEN LATINOS ARE REPRESENTED ON- OR OFF-SCREEN. —McKinsey&Companyarticle,“LatinosinHollywood:Amplifyingvoices,expandinghorizons”(March7,2024)
NOTES:
SHARE OF ABOVE-THE-LINE* FILM ROLES BY RACE/ETHNICITY (2013–2022)
*Above-the-line talent includes main producers (top 3 for film, top 2 for TV), director for film, top 2 showrunners for TV, main writers (top writer for film and top 3 for TV), lead and co-lead for film and top 10 actors for TV. These roles typically have higher influence on the creative direction of content.
** On-screen refers to actors 1–10 as per Variety.
***Refers to directors as per Variety.
****Refers to producers 1–2 as per Variety.
*****Refers to writers 1–3 as per Variety.
****** Other includes multiracial audiences and other races and ethnicities. McKinsey & Company used the general "other" categorization due to limited data. Efforts to promote diversity in the industry could be enhanced by more detail about the diverse populations in the industry, including but not limited to, Native peoples and people with a disability.
Source: McKinsey & Company, “Latinos in Hollywood: Amplifying voices, expanding horizons,” Camilo Becdach, Tomás Lajous, Sheldon Lyn, Lucy Pérez and Tony Toussaint, March 7, 2024 www.mckinsey.com/industries/technology-media-and-telecommunications/our-insights/latinos-in-hollywood-amplifying-voices-expanding-horizons
WHO ARE LATINO (2008—2024)
Source: Pew Research Center, "Key facts about Hispanic eligible voters in 2024," Jens Manuel Krogstad, Jeffrey S. Passel, Abby Budiman and Anusha Natarajan, January 10, 2024 www.pewresearch.org/short-reads/2024/01/10/key-facts-about-hispanic-eligible-voters-in-2024/
OF [KAMALA HARRIS, DONALD TRUMP] AMONG
AMONG U.S. HISPANIC REGISTERED VOTERS, FAVORABILITY OF HARRIS HAS INCREASED BY 8% SINCE BIDEN DROPPED OUT OF THE PRESIDENTIAL RACE
*NOTES: Values as of August 29, 2024. Values are updated on a regular basis. On July 21, 2024, President of the United States, Joe Biden, announced his withdrawal from the 2024 United States presidential election. The data displayed in the chart comes from weekly tracking surveys conducted by YouGov. For each survey, a representative sample of respondents — typically at least 1,500 — is selected from YouGov’s U.S. research panel. Panelists are invited to each survey based upon their age, gender, race and education, in proportion to their frequency to the frequency of adult citizens in the most recent American Community Survey.
AMONG HISPANICS IN ARIZONA, HARRIS HAS THE STRONGEST SUPPORT FROM WOMEN AND TRUMP HAS THE STRONGEST SUPPORT FROM MEN
CANDIDATE PREFERENCES FOR U.S. PRESIDENT AMONG ADULTS IN ARIZONA BY ETHNICITY (AUGUST 2024)
DEFINITELY TRUMP SOMEONE ELSE UNSURE
CANDIDATE PREFERENCES FOR U.S. PRESIDENT AMONG HISPANIC ADULTS IN ARIZONA BY VARIOUS DEMOGRAPHICS/CHARACTERISTICS (AUGUST 2024)
Source: Televisa Univision and Media Predict, "2024 Presidential Tracker: Arizona," August 2024 hispanicvote.univision.com/states/arizona
NOTE: The survey's sample population of U.S. Latino eligible voters was 3,037 (N=2,707 registered and N=330 eligible, not registered). 300 of the 3,037 U.S. Latino eligible voters were in Arizona. Field dates Nov. 2—13, 2023.
Source: UnidosUS, "National Survey of Latino Voters," November 2023 unidosus.org/wp-content/uploads/2023/11/unidosus_national_surveyoflatinovoters.pdf UnidosUS, "Survey of Latino Voters in Arizona," November 2023 unidosus.org/wp-content/uploads/2023/11/unidosus_arizona_surveyoflatinovoters.pdf
HOW ARIZONA LATINO VOTERS FEEL ABOUT SUPPORTING THE OPPOSITE PARTY BY PERCENTAGE (2023)
ARIZONA LATINO VOTERS (N=300)
NOTE: The survey's sample population of U.S. Latino eligible voters was 3,037 (N=2,707 registered and N=330 eligible, not registered). 300 of the 3,037 U.S. Latino eligible voters were in Arizona. Field dates Nov. 2—13, 2023.
Source: UnidosUS, "Survey of Latino Voters in Arizona," November 2023 unidosus.org/wp-content/uploads/2023/11/unidosus_arizona_surveyoflatinovoters.pdf
PERCENT OF ARIZONA LATINO VOTERS
HOW ARIZONA LATINO VOTERS FEEL WITH THE FOLLOWING STATEMENT: IT IS WRONG TO MAKE ABORTION ILLEGAL AND TAKE THAT CHOICE AWAY FROM EVERYONE ELSE (2023)
LATINO VOTERS (N=300)
NOTE: The survey's sample population of U.S. Latino eligible voters was 3,037 (N=2,707 registered and N=330 eligible, not registered). 300 of the 3,037 U.S. Latino eligible voters were in Arizona. Field dates were conducted between November 2nd–13th, 2023.
Source: UnidosUS, "Survey of Latino Voters in Arizona," November 2023 unidosus.org/wp-content/uploads/2023/11/unidosus_arizona_surveyoflatinovoters.pdf


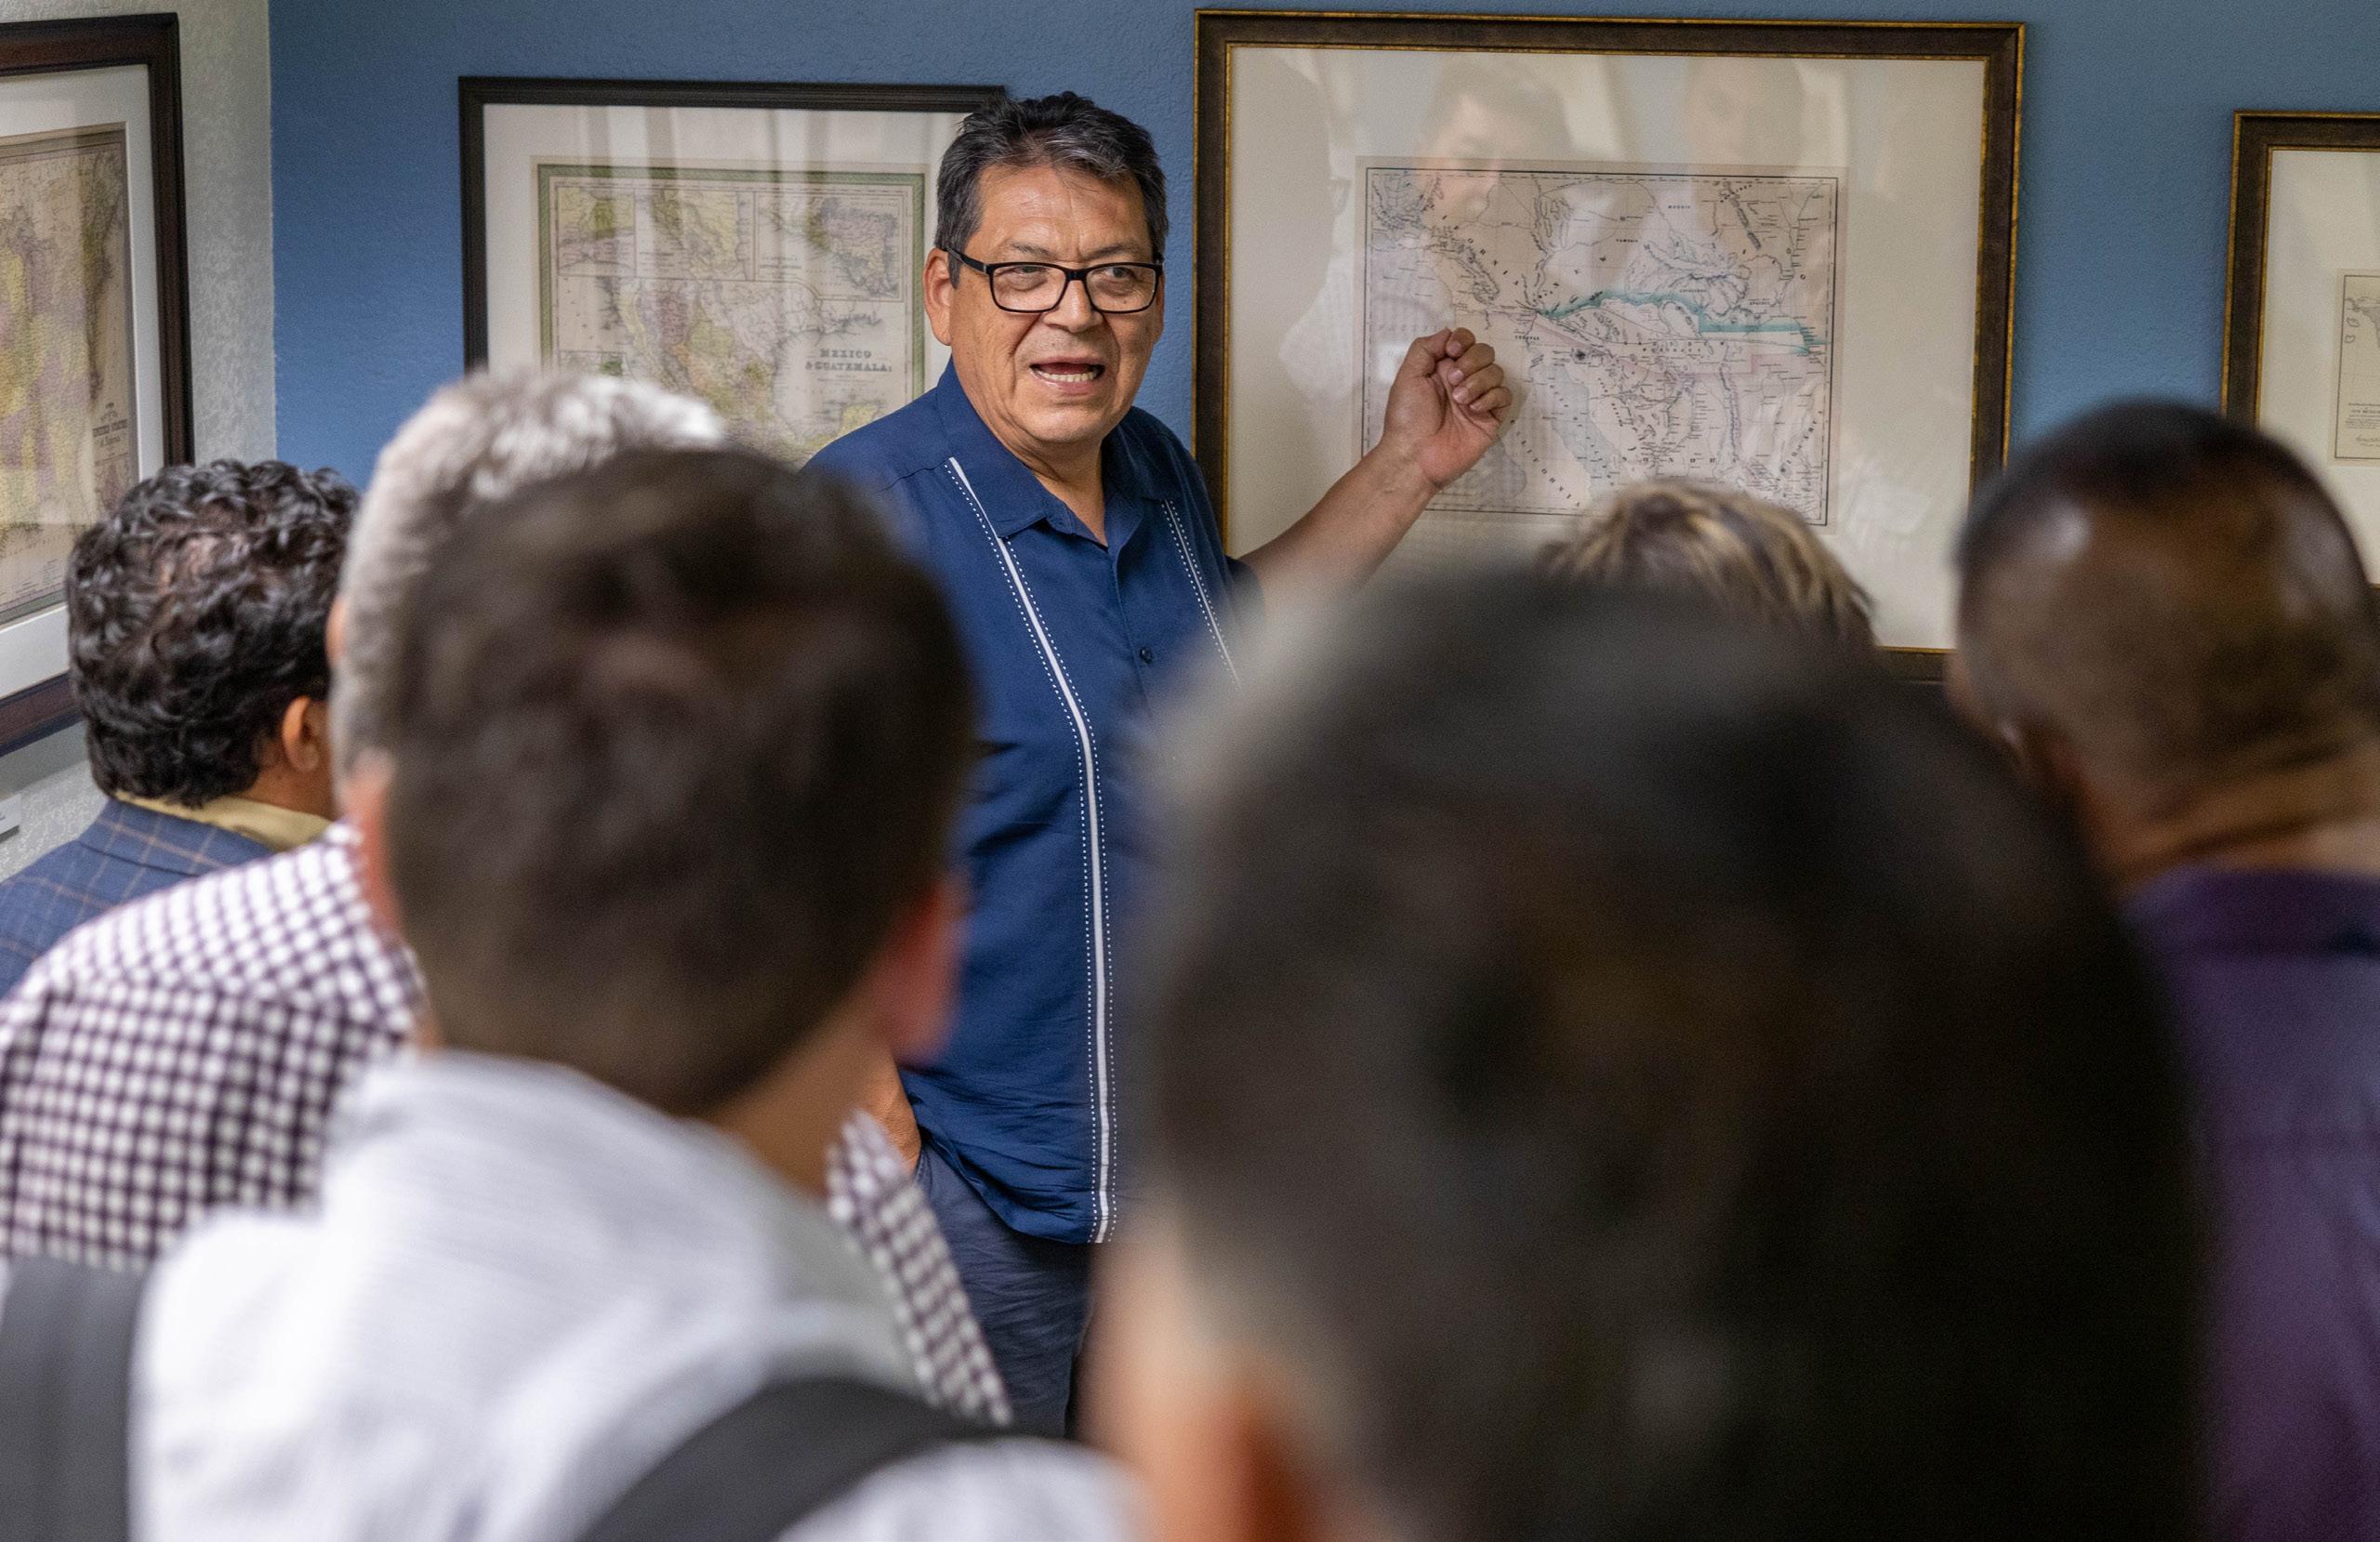

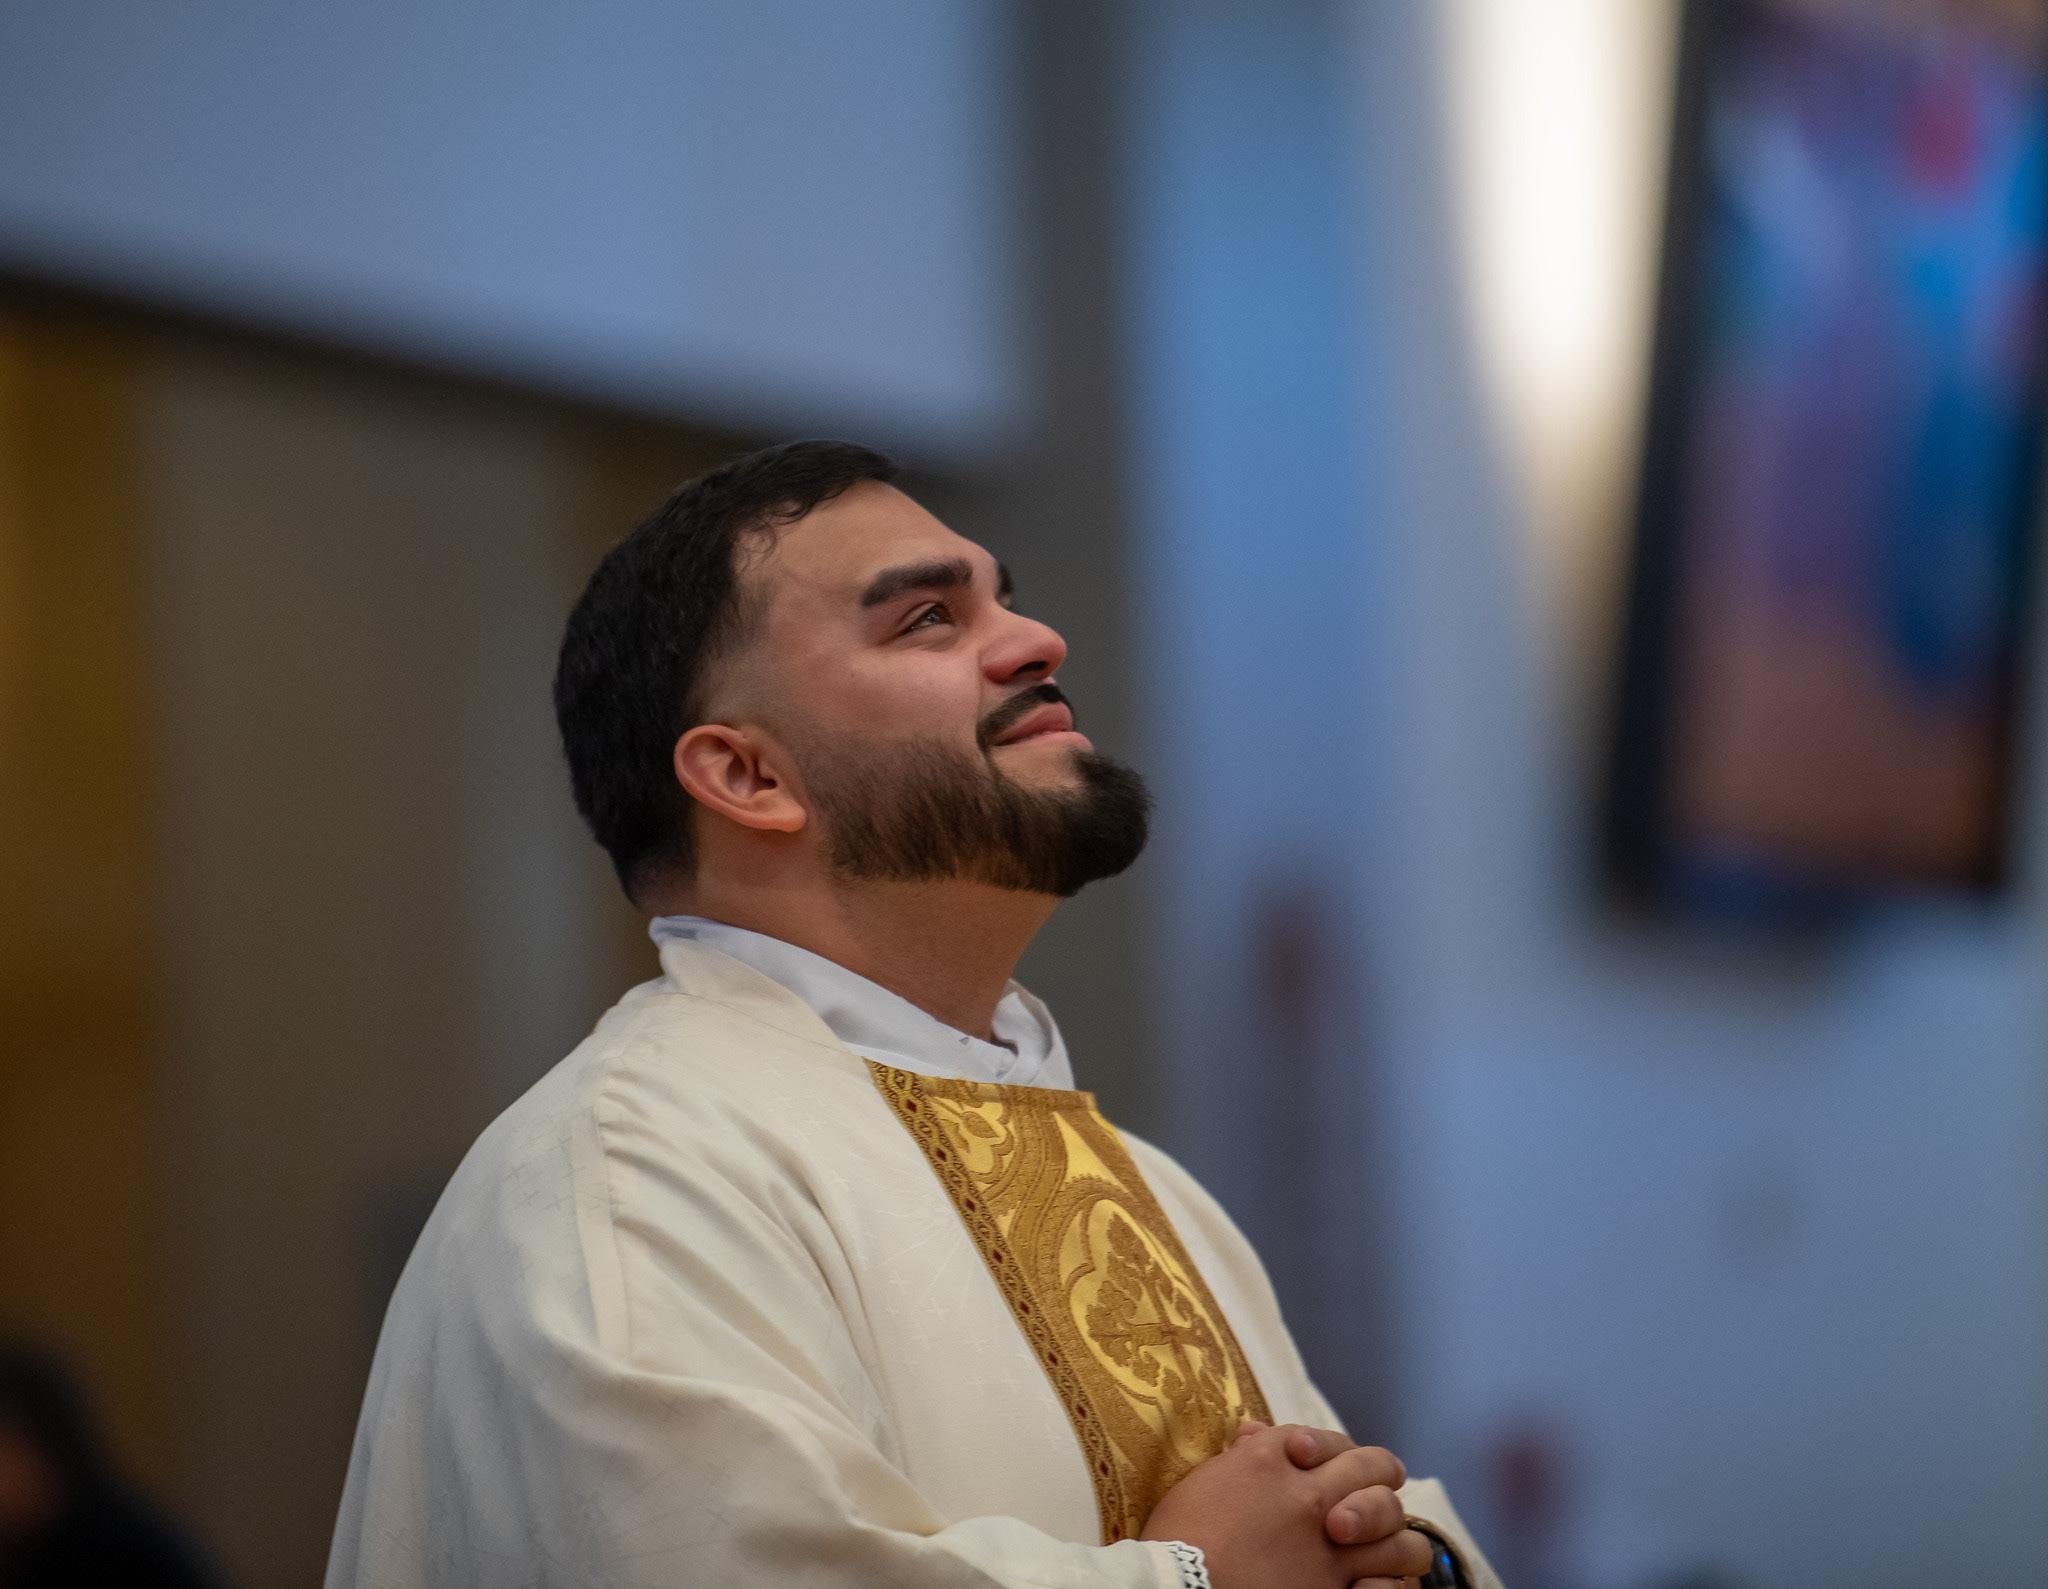


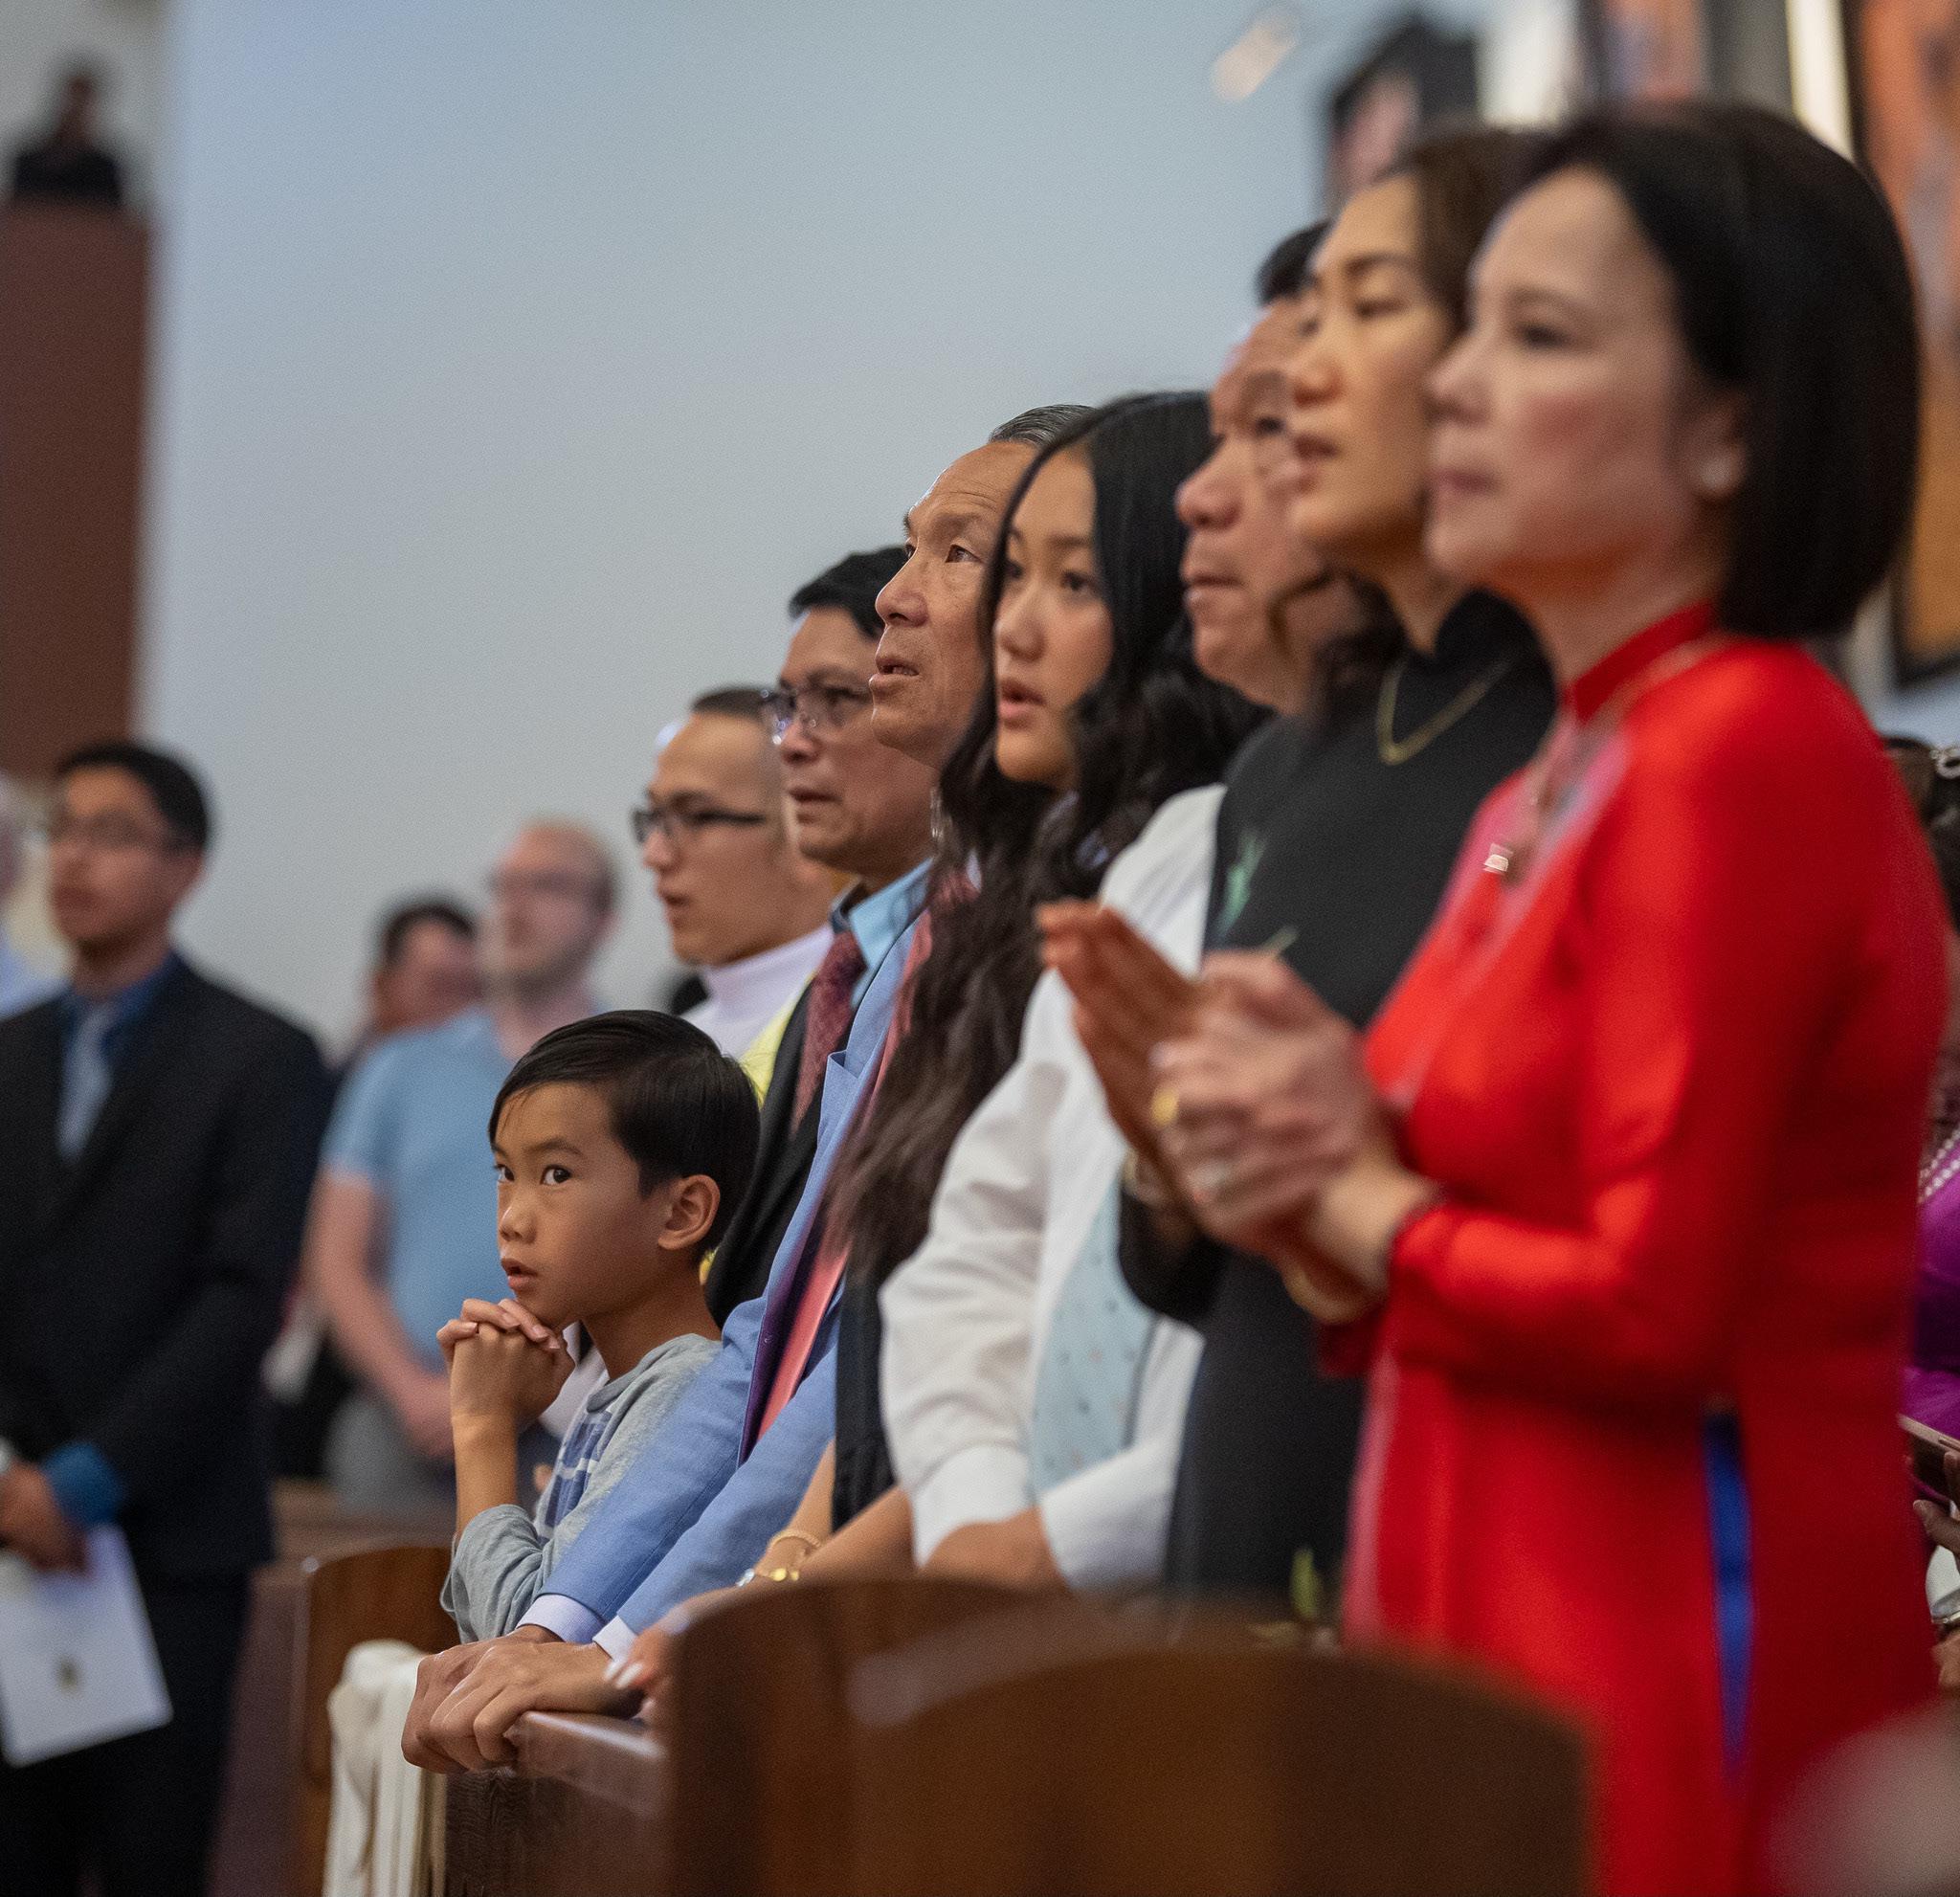
AsanAmericancitizen,itisyourrightandyour responsibilitytovote.
Thisspecialfeatureonthe2024U.S.presidential electionwillgiveyoutheresourcesandimportant information to make an informed choice
BY KAREN MURPHY
The American public has been on a wild ride ever since former Vice President Joe Biden and junior U.S. Senator Kamala Harris (D-CA) defeated the incumbent Republican President Donald J. Trump and Vice President Mike Pence in the 2020 presidential election. Biden received 306 electoral votes vs. the 232 votes Trump received, making Trump the first president to lose re-election since George H.W. Bush
If the events of the last four years had been submitted as the plot for a TV miniseries, the script would likely have been rejected as just too hard to believe. In case you forgot, here are just a few key events that have occurred since the last election:`
Former President Donald Trump and his allies filed 62 lawsuits in
Source: www2.claritas.com/Knowmore
state and federal courts to overturn the results of the 2020 election. A total of 61 of those lawsuits failed, with decisions coming from both Democratic-appointed and Republican-appointed judges, including federal judges appointed by Trump. Despite these failures, Trump has continued to say that the election was stolen. A broad coalition of top government and industry officials repudiated Trump’s claim and declared that the Nov. 3, 2020, presidential election was “the most secure in American history.”
• On Jan. 6, 2021, a pro-Trump mob attacked the U.S. Capitol and called for Vice President Mike Pence to be hung because Pence accepted the electoral votes that verified that Joe
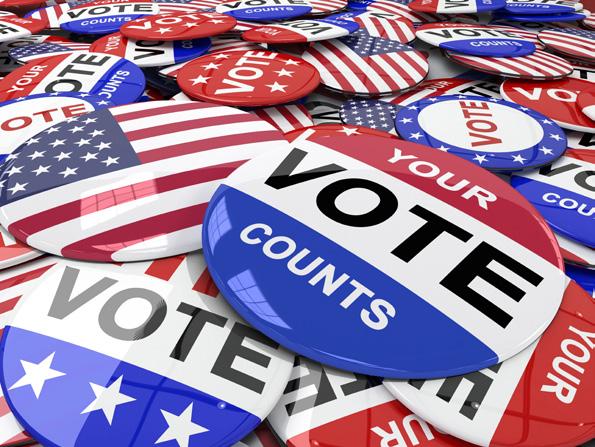
MARK YOUR CALENDAR
TUES, NOV 5 2024
The U.S. Presidential Election
ARIZONA
The last day to register to vote ONLINE/IN-PERSON Monday, Oct. 7 BY MAIL
Postmarked by Monday, Oct. 7
2024 ELECTION INFO FROM ADRIAN FONTES AZ SECRETARY OF STATE arizona.vote
AZ BALLOT MEASURES azsos.gov/elections/ballotmeasures
DECISION TIME: WE ARE ELECTING THE NEXT U.S. PRESIDENT IN NOVEMBER. LET YOUR VOICE BE HEARD
Biden had won the election. Since that day, more than 1424 (as of May 6, 2024) defendants have been charged in nearly all 50 states and the District of Columbia. learn more: www.justice.gov
• The League of United Latin American Citizens(LULAC), the nation’s oldest Latino civil rights group in the U.S., has endorsed Kamala Harris in the 2024 presidential election, the first time in its 95-year history that it endorsed a U.S. presidential candidate. lulac.org
• List of Republicans who oppose Donald Trump’s 2024 presidential campaign en.wikipedia.org
• More than 200 former Republican presidential staffers signed an open letter endorsing Harris over Trump abcnews.go.com
• JD Vance, Trump’s pick for vice president, once called him a “moral disaster” and possibly “America’s Hitler.” cnn.com
Source: www2.claritas.com/Knowmore
• During the first 234 years of the nation’s history, no president or former president was ever indicted. In 2023, former President Donald Trump was charged in four criminal cases: The Federal Election Interference Case, The Georgia Election Interference Case, The Classified Documents Case and the Hush Money Case. On March 30, 2023, a Manhattan grand jury voted to indict Trump on 34 felony counts of falsifying business records. On May 30, 2024, Trump became the first U.S. president to become a convicted felon. In the Hush Money case, he was found guilty of falsifying business records in a payoff to porn star Stormy Daniels. learn more: politico.com/ interactives/2023
• We began 2024 with two former presidents as candidates: Donald J. Trump (Republican) and Joseph R. Biden (Democrat). Trump picked Ohio Sen. JD Vance as his running mate and Biden was running for a second
term with his vice president, Kamala Harris.
• After a disastrous June 27 debate between Trump and Biden on CNN, pressure was put on Biden to resign and pass the torch to the next generation.
• On July 13, at a campaign rally near Butler, PA, there was an assassination attempt on Trump’s life that caused the death of a father of two sitting behind Trump in the stands and seriously injured two other spectators. Trump was not seriously hurt in the attack and the shooter was killed by a Secret Service sniper.
learn more: apnews.com
• On July 21, just weeks before the Democratic Convention in Chicago, Biden ended his campaign for reelection and endorsed Vice President Kamala Harris for president. The Democrats quickly lined up behind Harris, who went on to raise a record-setting $540 million
“We are proud to endorse Kamala Harris and Tim Walz because of the real issues facing Latino communities and all Americans across the nation; we can trust them to do what is right for our community and the country.”
—DomingoGarcia,chairmanofLULACAdelantePACandLULAC’simmediatepastpresident
DECISION TIME: WE ARE ELECTING THE NEXT U.S. PRESIDENT IN NOVEMBER. LET YOUR VOICE BE HEARD
in little more than a month. Harris announced Minnesota Gov. Tim Walz as her choice for Vice President on Aug. 6, energizing the Democrats as they headed into their convention.
• On Aug. 23, Robert F. Kennedy Jr., who had been running for president as an Independent, suspended his campaign and threw his support to Trump. Trump has since named Kennedy and Tulsi Gabbard, both former Democrats, as honorary cochairs of his presidential transition team.
• On Sunday, Sept. 15, there was a second assassination attempt on Donald Trump’s life at Trump International Golf Club in West Palm Beach, FL. Trump was not hurt in the attempt, which occurred nine weeks after the first attempt on his life and authorities have the suspected gunman, 58-year-old Ryan Wesley Routh, in custody. According to a CBS News story, Routh appeared in federal court Sept. 16 “on two charges, possession of a firearm by a convicted felon and possession of a firearm with an obliterated serial number. If convicted of both charges, he would face a maximum of 20 years in prison.”
The platforms for each party are presented on the next pages: Democrat (p.364) and Republican (p.365).
Karen Murphy is a staff writer and copy editor/proofreader for the Arizona Hispanic Chamber ofCommerce (AZHCC)
Source: www2.claritas.com/Knowmore
VOTING INFO– ALL 50 STATES vote.gov
BALLOTPEDIA THE 2024 ELECTION ballotpedia.org
RELIABLE NEWS
SOURCES
PBS pbs.org/newshour
REUTERS reuters.com
ASSOCIATED PRESS apnews.com
NPR npr.org
BBC bbc.com
PEW RESEARCH CENTER pewresearch.org
PRO PUBLICA propublica.org
ROBERT E. KENNEDY LIBRARY AT CAL POLY
Nonpartisan News Sources guides.lib.calpoly.edu
PRESIDENTIAL CANDIDATES ON THE ISSUES
ballotpedia.org/Presidential_ candidates_on_the_issues,_2024
FROM POLITICO
Where Harris and Walz stand on 2024’s biggest policy issues politico.com/interactives/2024/ kamala-harris-tim-walz-policy2024-election
From the ACLU
Project 2025, Explained Project 2025 is a Heritage Foundation initiative. In 2022, the conservativeleaning think tank and 140 former Trump staffers put together this roadmap for how to replace the rule of law with right-wing ideals. aclu.org/project-2025-explained
The largest Project 25 publication: Mandate for Leadership
A 900-page manual for reorganizing the federal government agency by agency to serve a conservative agenda static.project2025.org/2025_ MandateForLeadership_FULL.pdf
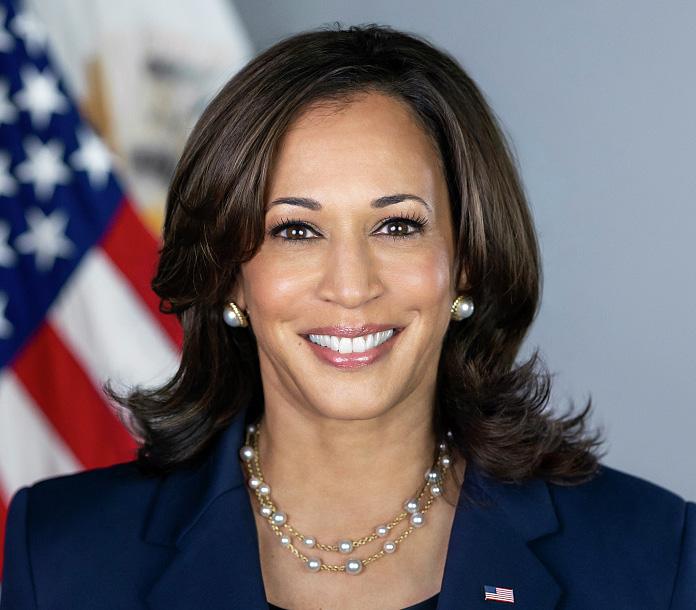
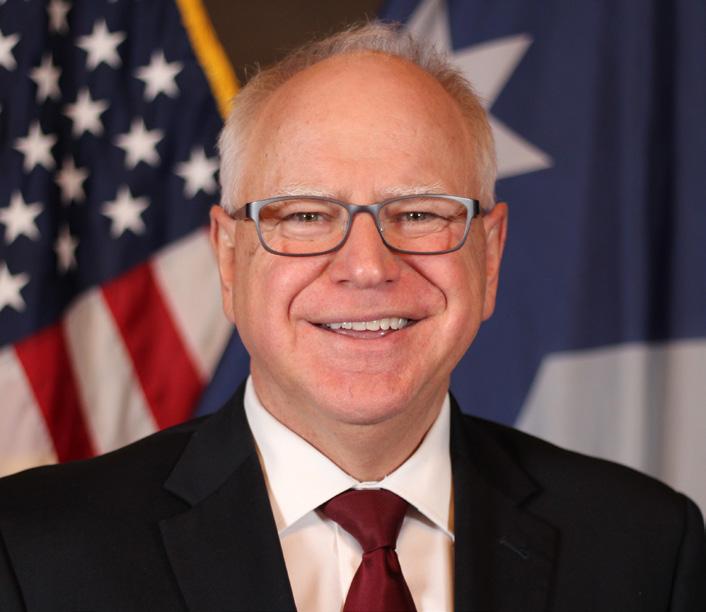

Vice President Kamala Harris and Minnesota Gov. Tim Walz are fighting for a New Way Forward that protects our fundamental freedoms, strengthens our democracy and ensures every person has the opportunity to not just get by, but to get ahead. As a prosecutor, Attorney General, Senator and now Vice President of the United States, Kamala Harris always stood up for the people against predators, scammers and powerful interests. She promises to be a president for all Americans, a president who unites us around our highest aspirations and a president who always fights for the American people. From the courthouse to the White House, that has been her life’s work.
BUILD AN OPPORTUNITY ECONOMY AND LOWER COSTS FOR FAMILIES Cut Taxes for Middle Class Families
• Make Rent More Affordable and Home Ownership More Attainable
• Grow Small Businesses and Invest in Entrepreneurs
• Take on Bad Actors and Bring Down Costs
• Strengthen and Bring Down the Cost of Health Care
• Protect and Strengthen Social Security and Medicare
• Support American Innovation and Workers
• Provide a Pathway to the Middle Class Through Quality, Affordable Education
• Invest in Affordable Child Care and Long Term Care
• Lower Energy Costs and Tackle the Climate Crisis SAFEGUARD OUR FUNDAMENTAL FREEDOMS
• Restore and Protect Reproductive Freedoms
• Protect Civil Rights and Freedoms
ENSURE SAFETY AND JUSTICE FOR ALL
• Make Our Communities Safer from Gun Violence and Crime
• Secure Our Borders and Fix Our Broken Immigration System
• Tackle the Opioid and Fentanyl Crisis
• Ensure No One Is Above the Law KEEP AMERICA SAFE, SECURE AND PROSPEROUS
• Stand With Our Allies, Stand Up to Dictators and Lead on the World Stage
• Invest in America’s Sources of Strength
• Support Service Members, Veterans, Their Families, Caregivers and Survivors

prod-static.gop.com/media/RNC2024-Platform.pdf

America needs determined Republican Leadership at every level of Government to address the core threats to our very survival: Our disastrously open border, our weakened economy, crippling restrictions on American energy production, our depleted military, attacks on the American system of justice and much more.
To make clear our commitment, we offer to the American people the 2024 GOP Platform to Make America Great Again! It is a forward-looking agenda that begins with the following twenty promises that we will accomplish very quickly when we win the White House and Republican majorities in the House and Senate.
1. Seal the border and stop the migrant invasion
2. Carry out the largest deportation operation in American history
3. End inflation and make America affordable again
4. Make American the dominant energy producer in the world, by far!
5. Stop outsourcing and turn the United States into a manufacturing superpower
6. Large tax cuts for workers and no tax on tips!
7. Defend our constitution, our bill of rights and our fundamental freedoms, including freedom of speech, freedom of religion and the right to keep and bear arms
8. Prevent World War Three, restore peace in Europe and in the Middle East and build a great iron dome missile defense shield over our entire country—all made in America
9. End the weaponization of government against the American people
10. Stop the migrant crime epidemic, demolish the foreign drug cartels, crush gang violence and lock up violent offenders
11. Rebuild our cities, including Washington, D.C., making them safe, clean and beautiful again
12. Strengthen and modernize our military, making it, without question, the strongest and most powerful in the world
13. Keep the U.S. dollar as the world’s reserve currency
14. Fight for and protect Social Security and Medicare with no cuts, including no changes to the retirement age
15. Cancel the electric vehicle mandate and cut costly and burdensome regulations
16. Cut federal funding for any school pushing critical race theory, radical gender ideology and other inappropriate racial, sexual or political content on our children
17. Keep men out of women’s sports
18. Deport pro-Hamas radicals and make our college campuses safe and patriotic again
19. Secure our elections, including same-day voting, voter identification, paper ballots and proof of citizenship
20. Unite our country by bringing it to new and record levels of success
BY GISSELLE HERRERA
On a performance stage within a school gymnasium, the echoes of vibrant melodies tell the story of a man whose life is a testament to the transformative power of music. Efrain Casillas, the music teacher at Porfirio H. Gonzales Elementary and Desert Oasis Elementary, coordinates the music programs districtwide for the Tolleson Elementary School District in Tolleson, AZ. Casillas has spent the past 24 years dedicated to the education and enrichment of his students, serving as a public school music teacher and sharing his passion with countless young musicians. His journey
exemplifies breaking through barriers to achieve success through dedication and commitment and with the impressive recognition as the Arizona Teacher of the Year in 2024 by the Arizona Educational Foundation. Casillas embodies the cultural framework of the district, firmly believing that all children are capable of success, no exceptions.
Casillas' profound impact on his students is evident in the innovative music programs he has pioneered. From the district’s first mariachi band to the jazz, marching, concert and Latin jazz
Source: www2.claritas.com/Knowmore
bands, his influence has been far-reaching. As a native of Puerto Rico, mariachi music was not part of Casillas' cultural heritage; however, recognizing its importance to many of his students, Casillas made it a priority to learn and teach this vibrant genre. Under his guidance, the mariachi band has not only flourished but has also secured multiple awards, including the prestigious Tucson Mariachi International Conference Choice Awards for three consecutive years. The band’s crowning achievement came in 2024 when they performed at the Annual White House Easter Egg Roll event, a testament to their excellence and Casillas' dedication.
The accolades Casillas has received are numerous and welldeserved. His journey from being named the Tolleson Elementary School District Teacher of the Year in 2015 to receiving the Life Changer of the Year Award nomination in 2017 showcases his unwavering commitment to his craft. His efforts were further recognized with the Esperanza Award from Chicanos Por La Causa and the Arizona Esperanza Latino Teacher Award in 2018, followed by the Music Teacher of Excellence Foundation Award by the Country Music Association in 2019. His influence even reached the national stage when he was featured on The Kelly Clarkson Show in 2020 after receiving the Music Teachers of Excellence Award from the Country Music Foundation.
Beyond the classroom, Casillas' dedication to music education and public advocacy has earned him the Phoenix Arts Hero Award in 2022. He is an active member of numerous impactful organizations and has shared his expertise as a presenter at the National Symposium of Multicultural Music at the University of Tennessee in Knoxville in 2004. His role as a clinician for
Source: www2.claritas.com/Knowmore

the 2024 Tolleson High School Honors Mariachi Music Festival further highlights his commitment to fostering musical talent and education. In recognition of his extraordinary contributions, Casillas was awarded an honorary doctoral degree from Northern Arizona University, a testament to his remarkable body of work thus far.
The highest honor for Casillas, however, lies in the legacy he has built through his students. Many of his former pupils have returned to assist in the music program as teachers or instructors, extending his influence on future generations. This enduring impact is a true measure of his success and dedication. Parents fully support him and relish in the knowledge that their children have an outstanding teacher and mentor who fully believes in them. It is not unusual for any of his students to be proficient in multiple instruments.
Efrain Casillas is a beacon of inspiration for his students because of his passion, talent and leadership. His dedication to music education and public education advocacy serves as a powerful reminder of the profound difference one person can make. As we celebrate his achievements and contributions, we look forward to the continued success and inspiration he will undoubtedly bring to the world of music education.
GisselleHerreraistheassistantsuperintendentofeducationalservices at Tolleson Elementary School District. With 28 years of experience in education, she leads and supports numerous academic, socialemotionalandgrantprogramsalignedwiththedistrict'sstrategicplan to ensure all students have a successful academic journey.
Tolleson Elementary School District 9261 W. Van Buren St. Tolleson, AZ 85353 www.tollesonschools.com www.tollesonschools.com/Music-and-Arts
From The Arizona Republic (3.27.24)
This metro Phoenix mariachi band is playing the White House for Easter. What to know
ELECTION 2024
NALEO Educational Fund projects that at least 17.5 million Latinos will cast ballots nationally in November.
An increase of 6.5 percent from Election 2020.
More than 17.5 million Latino voters are expected to cast ballots this November nationwide, representing a 6.5 percent increase from Election 2020 Latino turnout and an increase of 38.3 percent from Election 2016.
More than 855,000 Latinos are expected to cast ballots this November in Arizona, which mirrors the 2020 Latino turnout and is an increase of 57.5 percent from 2016. Nearly one of every four Arizona voters is expected to be Latino (23.5 percent), which mirrors the Latino share in 2020 and is a 19.8 percent increase from 2016.
Source: NALEO Educational Fund, “The Latino Vote in Election 2024: National and State Projections,” 2024 naleo.org/COMMS/PRA/2024/NEF_Election_2024_Latino-Vote_Projections_FINAL.pdf
Source: www2.claritas.com/Knowmore
More than one of every 10 voters is expected to be Latino (11.1 percent), which mirrors the Latino share in 2020 and is a 20.5 percent increase from 2016.
More than 4.8 million Latino voters in California will make their voices heard at the ballot box in 2024, an increase of 6.1 percent from 2020 Latino turnout and 44.0 percent from Election 2016. More than one of every four California voters is expected to be Latino (28.4 percent), which mirrors the Latino share in 2020 and is a 22.4 percent increase from 2016.
More than two million Latino voters in Florida will make their voices heard at the ballot box in 2024, an increase of 13.8 percent from 2020 Latino turnout and 31.2 percent from Election 2016. One of every five Florida voters is expected to be Latino (20.0 percent), which mirrors the Latino share in 2020 and 2016.
Nearly 195,000 Latinos are expected to cast ballots this November in Georgia, which mirrors the 2020 Latino turnout and is an increase of 20.8 percent from Election 2016. The Latino share of all Georgia voters in 2024 is expected to be 4.0 percent, which mirrors the Latino share in 2020 and 2016.
Nearly 280,000 Latino voters in Nevada will make their voices heard at the ballot box in 2024, an increase of 15.5 percent from Election 2020 and 40.8 percent from Election 2016. Nearly one of every five Nevada voters is expected to be Latino (18.7 percent), which mirrors the Latino share in 2020 and is a 14.0 percent increase from 2016.
Nearly 710,000 Latino voters in New Jersey will make their voices heard at the ballot box in 2024, which mirrors the 2020 Latino turnout and is an increase of 79.0 percent from Election 2016. Slightly less than one of every six New Jersey voters is expected to be Latino (15.9 percent), which mirrors the Latino share in 2020 and is a 47.9 percent increase from 2016.
Nearly one million Latino voters in New York will make their voices heard at the ballot box in 2024, an increase of 12.4 percent from 2020 Latino turnout and 13.1 percent from Election 2016. Nearly one of every eight New York voters is expected to be Latino (11.7 percent), which mirrors the Latino share in both 2020 and 2016.
More than 2.8 million Latino voters in Texas will make their voices heard at the ballot box in 2024, which mirrors the 2020 Latino turnout and is an increase of 47.8 percent from Election 2016. Nearly one of every four Texas voters is expected to be Latino (24.1 percent), which mirrors the Latino share in 2020 and is a 19.8 percent increase from 2016.
The Latino vote will play a decisive role throughout the nation in the outcome of what will be a competitive presidential race and congressional, state, and local elections in November 2024. NALEO Educational Fund projects that at least 17.5 million Latinos will cast ballots nationally in November, an increase of 6.5 percent from 2020 Latino turnout and 38.3 percent from Election 2016. We also present estimates of the Latino vote in November 2024 for several states with relatively large Latino populations. These estimates are merely a floor, generally based on trends in Latino voter turnout in the past six presidential election cycles (for further information, see “Methodology” below).
Election 2024 is taking place in an unprecedented economic, social, and information environment for any presidential election in our nation’s history. Thus, there are several factors that our projections cannot fully capture that will affect Latino turnout in November 2024. While the COVID-19 pandemic has abated, some Latino voters may take health concerns into consideration when making decisions about electoral participation. Other factors that our projections cannot fully capture include naturalization trends, the scope of efforts by candidates and political parties to engage Latino voters, the impact of misinformation and disinformation, the extent to which competitive races in individual states mobilize Latino voters, and changes in voter registration and voting laws and practices.
NALEO Educational Fund derived its projection of the Latino vote in Election 2024 by using a statistical modeling approach that considers trends in Latino voter turnout in the past six presidential election cycles. We determined Latino voter turnout in those cycles from Census Bureau data in its Current Population Survey biennial November supplements, Voting and Registration in the Elections of November 2000–2020 (because of data limitations, for Georgia, we only used
Finally, our projections suggest that the largest increases in Election 2024 turnout from November 2020 will mostly occur in battleground states — where sustained efforts have historically been made to engage and mobilize Latino voters. The expected increases in voter turnout among Latinos could play a decisive role in determining the outcome of the 2024 presidential election.
As the eligible Latino electorate continues to grow, it is imperative that the actual number of Latinos exercising their right to vote experiences commensurate growth. This increase is crucial for the Latino community to realize its full political potential in Election 2024 and beyond. Sustained investment in mobilizing Latino voters by candidates and both political parties is critical to achieving this important goal.
data from the 2008–2020 election cycles and for Arizona, New Jersey, and New York we only used data from the 2004–2020 election cycles). Because the projections are based on past voting trends, they do not take into account the potential increases or decreases in Latino turnout that could result from more robust voter engagement efforts, naturalization trends, the impact of misinformation and disinformation, changes in voter registration, voting laws and practices, or other factors.
For more information about these projections or other NALEO Educational Fund policy and research activities, please contact Dorian Caal, Director of Civic Engagement Research, at dcaal@naleo.org
To provide additional context for understanding our projections, the following tables set forth additional data about our Latino vote projections for the nation and selected states; the projected change between our projections and the Latino vote in the last two election cycles; the projected turnout of Latinos as well as the share they will comprise of all voters; and the projected change in the non-Hispanic vote from the 2020 elections.
In Table 1, we project there will generally be a large increase in the number of Latino voters between 2016 and 2024, with a much smaller increase or statistically insignificant change between 2020 and 2024.
TABLE 1
*Not statistically significant


Source: UnidosUS, "Survey of Latino Voters in Arizona," November 2023 unidosus.org/wp-content/uploads/2023/11/unidosus_arizona_surveyoflatinovoters.pdf
Source: www2.claritas.com/Knowmore
1. Top issue priorities among Latinos in Arizona are consistent with Latino voters across the country: inflation, jobs/economy, affordable housing, health care, and crime/gun violence.
• Food and basic necessities, housing/rent, gas and health insurance costs are the big issues driving concern about inflation
• Jobs/economy concerns are largely focused on the need for better pay, with some worry about benefits
• Affordable housing concerns are two-fold: the lack of affordable apartments or homes, and worry about the rise in homelessness in their communities.
2. Immigration remains a priority issue (tied in the top-5 issues with gun violence) in Arizona.
• Providing a path to citizenship for Dreamers and other immigrants with long-standing ties in the country are the two big policies Latino voters want to see advanced on this issue.
• There little support for mass deportation or wall-building along the U.S.-Mexico border.
3. Voters are most interested in candidates who have realistic policy ideas, will fight for their priorities, and bring people together.
3
4. Latino voters see Democrats as more aligned with their values and views, on a host of issues including treating people with dignity/respect, democracy and elections, health care, and elections. Yet the majority don't feel that either party truly cares about Latino voters.
5. Looking forward to the 2024 election, Rep. Gallego and President Biden hold substantial polling leads among Arizona's Latino electorate at this very early stage.
• Rep. Gallego leads Republican and Independent candidates by more than 20 points
• President Biden out-performs his approval rating (48% approve) in potential 2024 match-ups, where he holds a 21-point over former President Trump, and a 25-point lead over Florida Governor Ron DeSantis.
6. In 2024, 19% of Latinos in Arizona will be voting in their first presidential election
• 14% for the first time in ANY federal election
• Another 14% voted for the first time in 2020
• 33% of Arizona's Latino electorate is new since Hillary Clinton and Donald Trump faced off in 2016.

• NEARLY HALF OF U.S. SENTENCED FEDERAL OFFENDERS ARE HISPANIC
• ARIZONA WAS ONE OF EIGHT STATES THAT EXPERIENCED A DECREASE IN THEIR PRISONER POPULATION BETWEEN 2021 AND 2022 378–382
• THE MAJORITY OF U.S. FEDERAL CRIMES SENTENCED TO HISPANICS ARE IMMIGRATION RELATED
• THE PERCENTAGE OF U.S. SENTENCED FEDERAL OFFENDERS THAT ARE NON-CITIZENS HAS DECLINED SINCE 2020
• THE MAJORITY OF U.S. FEDERAL CRIMES SENTENCED TO NON-CITIZENS ARE IMMIGRATION RELATED
• TOTAL PRISONERS HELD IN STATE OR FEDERAL PRISONS ACROSS THE U.S. DECLINED BY 22% BETWEEN 2012 AND 2022
• IMPRISONMENT RATES OF U.S. HISPANIC ADULTS DECREASED BY 2.6% BETWEEN 2021 AND 2022
• U.S. SOUTHWEST LAND BORDER ENCOUNTERS PEAKED IN DECEMBER 2023
• 30% OF ENCOUNTERS AT THE U.S. SOUTHWEST LAND BORDER IN 2023 WERE WITH MEXICAN CITIZENS
• THE NUMBER OF CHINESE CITIZENS ENCOUNTERED AT THE U.S. SOUTHWEST LAND BORDER INCREASED BY OVER 1000% BETWEEN 2022 AND 2023
SPECIAL FEATURE
IN FOCUS
Social Justice
Univision Communications presents data on the legal services available in the Phoenix and Tucson DMAs
EMPOWERING CHANGE
Inside Two of Arizona’s Social Justice Nonprofits: ScholarshipsA–Z and Aliento BY DANIELA CHAVIRA
BSR’s Center for Business & Social Justice makes this resource freely available to the private sector and civil society EXCERPT
The Social Justice Guide for Business: Moving Beyond Crisis to Action
NEARLY HALF OF U.S. SENTENCED FEDERAL OFFENDERS ARE HISPANIC
*NOTE: Values as of August 1, 2024. Values are updated on a regular basis. The U.S. Sentencing Commission operates in fiscal years (FYs). For example, FY
PERCENTAGE OF U.S. SENTENCED FEDERAL OFFENDERS THAT ARE NON-CITIZENS HAS DECLINED SINCE 2020
NOTES:
NOTE:
*Jurisdiction refers to the legal authority of state or federal correctional officials over a prisoner, regardless of where the prisoner is held. Imprisonment rate is the number of sentenced prisoners age 18 or older under state or federal jurisdiction per 100,000 U.S. residents age 18 or older or per 100,000 U.S. residents age 18 or older in a given category.
**Includes persons of two or more races and other races that are not broken out.
***Excludes persons of Hispanic origin (e.g., “white” refers to non-Hispanic white persons and “black” refers to non-Hispanic black persons).
**** Excludes persons of Hispanic origin (e.g., “white” refers to non-Hispanic white persons and “black” refers to non-Hispanic black persons). Includes Asians, Native Hawaiians and Other Pacific Islanders. TOTAL PRISONERS HELD IN STATE OR FEDERAL PRISONS ACROSS THE U.S. DECLINED BY 22%
Source: U.S. Department of Justice, Bureau of Justice Statistics (BJS), "Prisoners in 2022 – Statistical Tables," E. Ann Carson and Rich Kluckow, November 2023 bjs.ojp.gov/document/p22st.pdf
BORDER ENCOUNTERS PEAKED IN DECEMBER 2023
*NOTE: Border encounter statistics were combined from the following two groups: U.S. Border Patrol (USBP) and Office of Field Operations (OFO). Values as of June 10, 2024. Values are updated on a regular basis. The U.S. Customs and Border Protection operates in fiscal years (FYs). For example, FY 2021 runs from October 2020 to September 2021.
*NOTE: Border encounter statistics were combined from the following two groups: U.S. Border Patrol (USBP) and Office of Field Operations (OFO). Border encounter statistics were last updated on April 12, 2024. The U.S. Customs and Border Protection operates in fiscal years (FYs). For example, FY 2023 runs from October 2022 to September 2023.
**The original data includes Canada, Myanmar, the Philippines, Romania, Turkey and Ukraine as separate categories. However, because their values are less than 1%, they were included in the “Other” category.
U.S. CUSTOMS AND BORDER PROTECTION (CBP) SOUTHWEST LAND BORDER ENCOUNTERS BY MONTH (FY 2021—FY 2024*)
CUSTOMS AND BORDER PROTECTION (CBP) SOUTHWEST LAND BORDER ENCOUNTERS BY CITIZENSHIP GROUP (FY 2023*)
THE NUMBER OF CHINESE CITIZENS ENCOUNTERED AT THE U.S. SOUTHWEST LAND BORDER INCREASED BY OVER 1000% BETWEEN 2022 AND 2023
*NOTE: Border encounter statistics were combined from the following two groups: U.S. Border Patrol (USBP) and Office of Field Operations (OFO). Border encounter statistics were last updated on April 12, 2024. The U.S. Customs and Border Protection operates in fiscal years (FYs). For example, FY 2023 runs from October 2022 to September 2023.
Source: U.S. Customs and Border Protection, “Nationwide Encounters," Last Updated April 12, 2024 www.cbp.gov/newsroom/stats/nationwide-encounters ARIZONA WAS ONE OF EIGHT STATES THAT EXPERIENCED A DECREASE IN THEIR PRISONER POPULATION
U.S. CUSTOMS AND BORDER PROTECTION (CBP) SOUTHWEST LAND BORDER ENCOUNTERS BY TOP 4 CITIZENSHIP GROUPS (FY 2022— FY 2023*)
EIGHT STATES WITH THE LARGEST NEGATIVE PERCENT CHANGE IN THE NUMBER OF PRISONERS UNDER THE JURISDICTION OF STATE OR FEDERAL CORRECTIONAL AUTHORITIES (2021—2022*)
*NOTE: Jurisdiction refers to the legal authority of state or federal correctional officials over a prisoner, regardless of where the prisoner is held.


BY DANIELA CHAVIRA
Every year, approximately 2000 undocumented students graduate from Arizona high schools. Many lack the institutional support, guidance and resources needed to succeed. Two nonprofit organizations—one in Tucson and one in Phoenix—have offered lifelines to these communities.

What started as a scholarship list to provide access to higher education for all students regardless of immigration status turned into ScholarshipsA-Z, a nonprofit organization based in Tucson, AZ, that provides resources and community to students, families and educators to help support undocumented youth in their pathways after high school.
One of the nonprofit’s key initiatives is its Immigrant Scholarship Hustle (ISH), a five-day series of workshops that encourages students to share their stories and use their experiences to expand their education and employment options. Every year, a cohort in Tucson hosts approximately 30 undocumented students. ISH has served 15 cohorts with more than 300 students.
EMPOWERING
To expand their programming to further support students beyond ISH, the organization started the Undocumented Youth Empowerment Initiative (UYEI), which helps undocumented youth across Arizona find pathways beyond high school with year-round programming and support. Every year, through these programs, the UYEI supports approximately 150 students. The students who participate in UYEI have access to ScholarshipsA-Z’s student support team and workshops in the following areas:
• scholarship writing and college success,
• leadership growth and social awareness,
• navigating employment possibilities and
• strategies for self-care and well-being.
Karina Dominguez, program manager for ScholarshipsA-Z, says that one of the most impactful outcomes that have resulted from their work is the growth of the community and the students. Students who once received help from them are now staff/team members within ScholarshipsA-Z, paying it forward and helping
NOV. 16, 2024 | 6pm
Quinceañera
In honorofScholarshipsA-Z LOCATION
Las Casitas De Los Moya 5655 S. White Rock Ave. Tucson, AZ 85706
*Formal attire encouraged. The eventwill include dinner, entertainment, activities and speakers.
RSVP
bit.ly/SAZ-QUINCE
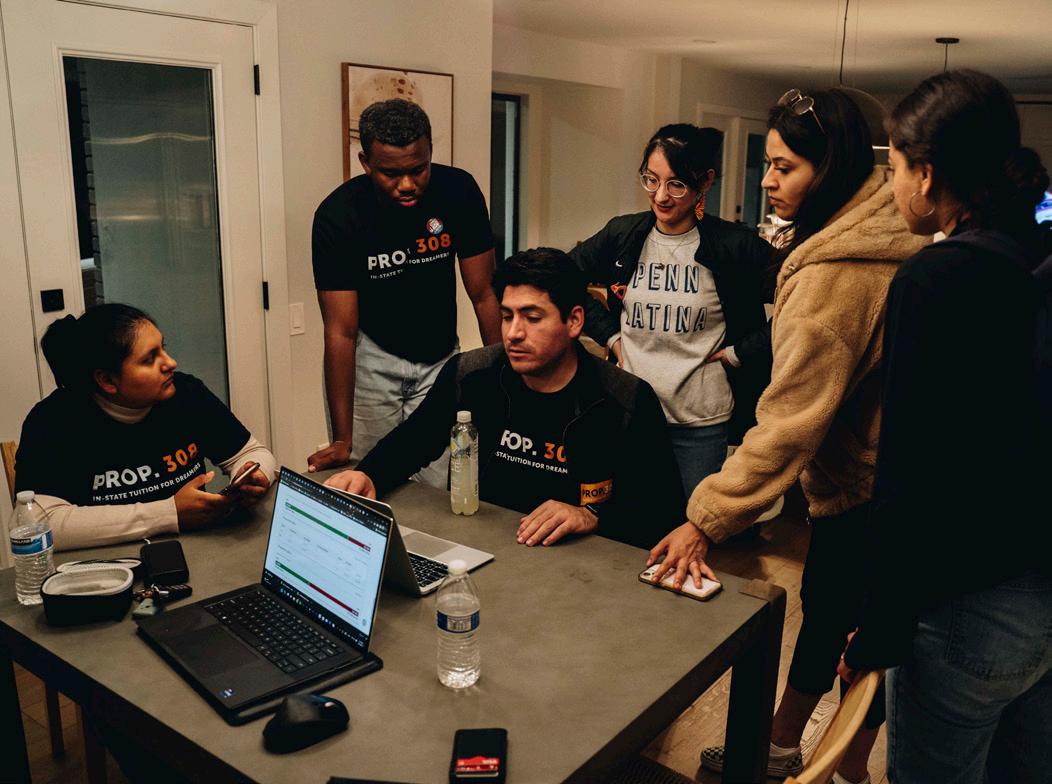
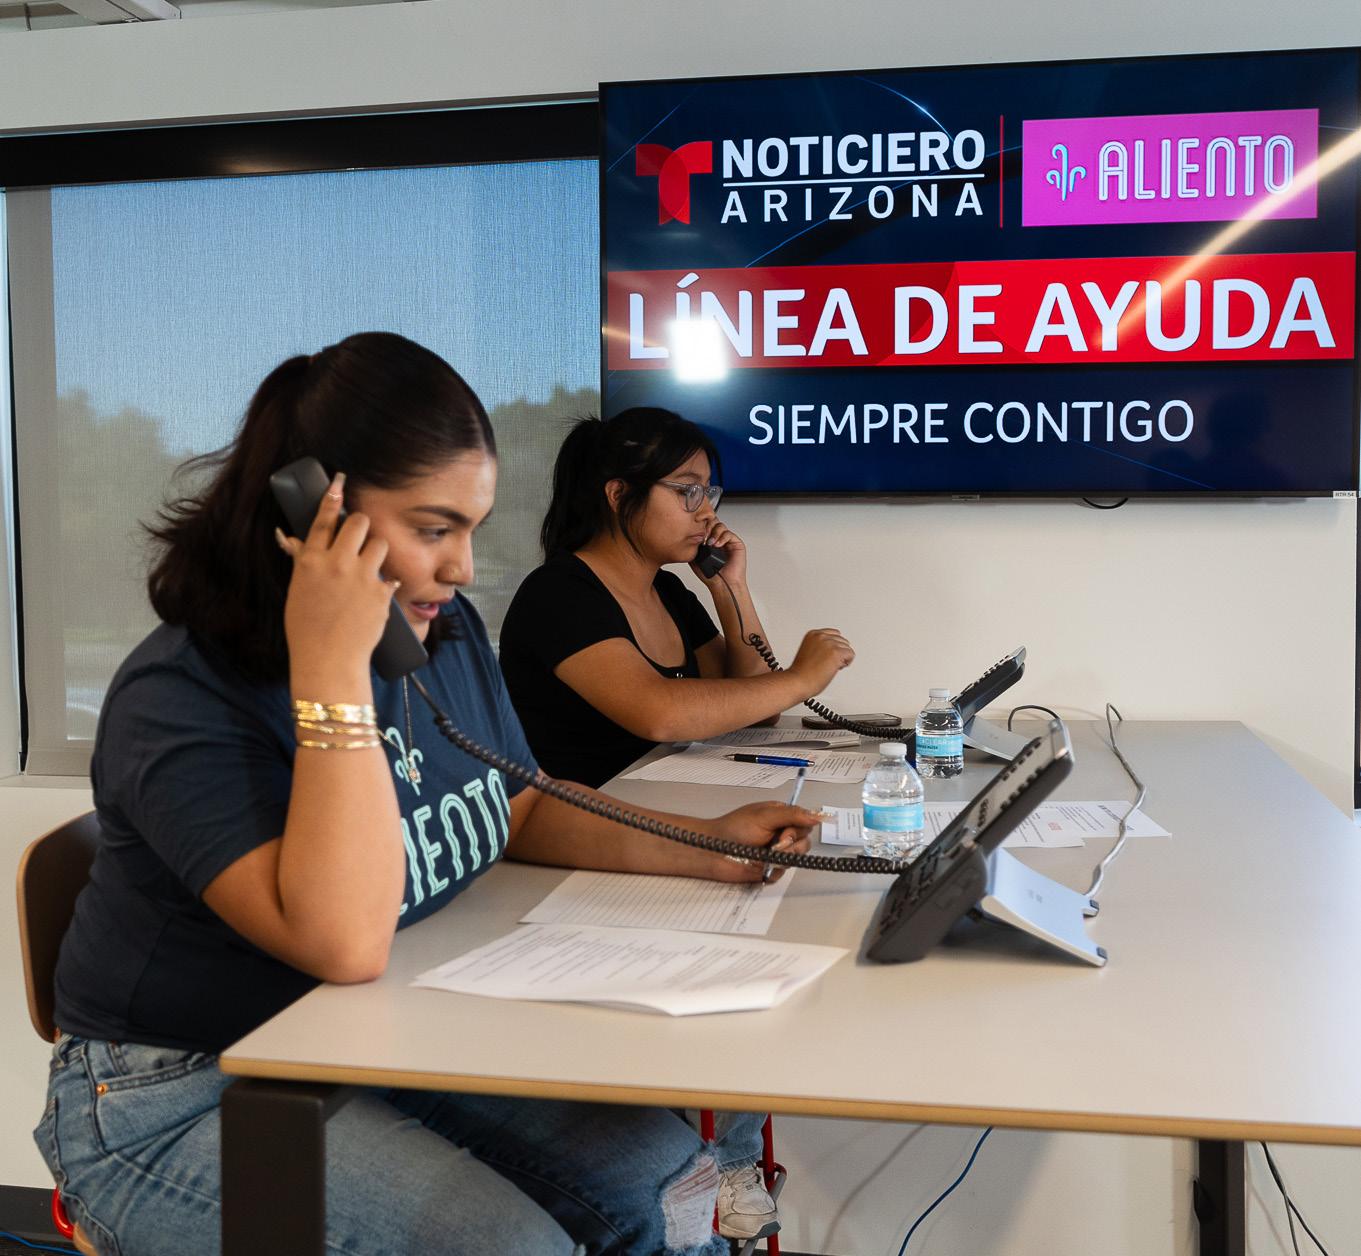
the next generation of students. To acknowledge the community support that helped plant the seeds, ScholarshipsA-Z will hold a quinceañera on November 16 to celebrate 15 years of resiliency, community and growth.
EMPOWERING CHANGE INSIDE TWO OF ARIZONA’S SOCIAL JUSTICE NONPROFITS

Recognizing the importance of nurturing human potential, Aliento is a nonprofit organization that works with undocumented, DACA and mixed immigration status families to transform their traumas into hope and action. Working at the intersections of mental health, education, immigration and the arts, Aliento has been responding to the community’s needs, focusing on human connection and storytelling.
Aliento is a Spanish word that translates to breath; when you give aliento to someone, you are providing words of encouragement. For many in the immigrant community, Aliento has done just that: The group is a beacon of hope that provides a space, a voice and a future for many. Through their programs, including Cultiva, Nurture and Transform, they are invested in the well-being, emotional healing and leadership development of individuals affected by the inequalities that result from lacking legal immigration status.
José Patiño, Aliento’s vice president of education and external affairs, is a DACA recipient who experienced these inequalities firsthand. His personal experience has given him a unique perspective and a deep understanding of the challenges faced by these students and the community. He knows the current systems were not designed with these students in mind and highlights the need to create welcoming, safe spaces for these students to learn—and thrive. He notes that student achievement and safety are directly correlated and are critical for students to succeed.
At the heart and soul of Aliento, Patiño says, is the nonprofit’s arts and healing programming, which offers workshops, open
ScholarshipsA-Z
225 E. 26th St., Suite 6 Tucson, AZ 85713 520.305.9342 info@scholarshipsaz.org scholarshipsaz.org
FACEBOOK: @ScholarshipsAZ
Aliento 4747 N. 32nd St. Phoenix, AZ 85018 602.888.1066 alientoaz.org
From Aliento In-state Tuition For Dreamers! — Aliento (alientoaz.org)
From Cornell LawSchool, Path2Papers Path2Papers – Bridging Opportunities for DACA Workers and Employers (cornell.edu)
Fromthe President’sAlliance on HigherEducation and Immigration New Executive Actions to Streamline D-3 Waivers and Employment Visas for College Grads, Including Dreamers: What You Need To Know - Presidents' Alliance (presidentsalliance.org)
FromtheU.S.CitizenshipandImmigrationService Consideration of Deferred Action for Childhood Arrivals (DACA) uscis.gov/DACA
FromtheImmigrationLegalResourceCenter DACA ilrc.org/daca
FromtheNationalImmigrationLawCenter DACA nilc.org/issues/daca
From KFF
Key Facts on Deferred Action for Childhood Arrivals (DACA) kff.org/racial-equity-and-health-policy/fact-sheet/key-factson-deferred-action-for-childhood-arrivals-daca
From the ACLU
KNOW YOUR RIGHTS: Dreamers (DACA) aclu.org/know-your-rights/know-your-rights-about-daca
Aliento is a Spanish word that translates to breath; when you give aliento to someone, you are providing words of encouragement.
mics and support groups within the community, at local schools and even virtually. Understanding this dynamic is key and is what drives Aliento’s work. Patiño hopes that the current systems will be adjusted to encourage students rather than inhibit their potential.
Patiño believes that all people, regardless of their immigration status, must be seen as human beings and hopes that one day Aliento’s work will no longer be needed because the problems Aliento was created to address have been solved. Until then, the nonprofit will continue to foster change through community building and organizing campaigns such as Education for All, Get Out the Vote, Arizona’s Future Fellowship and the ECFI Fellowship.
Most recently, Aliento’s efforts cultivated the historical passing of Proposition 308, which went into effect in December 2022. Proposition 308 allows all students, including Arizona DREAMers, to receive in-state college tuition when a student: (1) attended a
high school in Arizona or equivalent for a minimum of two years and (2) graduated from a public school, private school or homeschool in Arizona or obtained a GED.
Although their years of community organizing proved fruitful in passing this proposition, there is still a need to spread awareness of its impact. To address this, Aliento has a dedicated team that answers any questions regarding Prop. 308 and holds training sessions across Arizona for educators, counselors and students who want to learn more about implementing in-state tuition for all students.
For this community, policy changes constantly affect their eligibility for many things, such as education, employment opportunities and pathways to citizenship. The Department of State recently released the guidelines on the Biden-Harris Administration’s new executive action to streamline D-3 waivers and access to employment-based visas for eligible college graduates, including DACA recipients, undocumented individuals and others who are sponsored by their employers. A list of resources about Prop. 308 and for students to learn more about applying for a visa under the D-3 waiver is on p.386.
Chavira is a writer/journalist intern with the Arizona Hispanic ChamberofCommerce (AZHCC) in Phoenix.
Future Proofing Business Requires a Social Justice Approach

A New Normal – consumers, workers and investors demand urgent, meaningful action on social issues. This new, shifting landscape requires companies to reflect and develop meaningful strategies for addressing these challenges.
More than 8 in 10 employees


report being satisfied with their job at companies where their leaders speak up about critical events and issues.


Executive Summary 3
Moving Beyond Crisis to Action: A Social Justice Guide for Business
The CBSJ has developed a foundational guide that:
● Explains how companies currently engage on social issues,
● What a corporate social justice approach entails
● What companies can do to advance social justice.
● This free, public roadmap empowers corporate leaders to incorporate a proactive, enduring approach to social justice into their business strategies.
I.
Section I: Overview – How do companies currently engage on social issues?

● Corporate engagement on social issues has evolved significantly, with efforts now formalized through frameworks like CSR, ESG, DEI, and Business and Human Rights, each with unique processes and objectives.
● Six forms of corporate engagement, which can yield negative, neutral, or positive social impacts, are outlined with examples of what each looks like in practice.
● Many companies still approach social issues voluntarily and inconsistently, often viewing equitable social outcomes as optional rather than essential.
How to Use This Section:
● By understanding the landscape of corporate social justice engagement, leaders can identify where their company currently stands, where they would like to go and the established steps to help achieve those goals.
Section II: Overview - What is a corporate social justice approach?
● Positive and equitable social outcomes as a primary objective of a strategy, decision, or action define a social justice approach.
● Companies should build on existing efforts when taking this approach to mitigate negative social impact and risks, while raising the bar on process and objectives.
● Core business activities should be integrated with a social justice approach – it is a lens that can be applied directly to strategy development and implementation.
● Corporate approaches don’t have to be all or nothing . Companies can apply a social justice approach organization-wide or test in specific instances.
How to Use This Section:
• By understanding the corporate social justice framework based on human rights, participation, access, and equity, companies can compare and integrate traditional business practices with a social justice approach.
● Historical choices have embedded social injustices into prevailing systems , making companies inherently unequipped to advance social justice. As a result, businesses lack the necessary incentives and encouragement to address these issues fully.
● Companies must make informed choices impacting stakeholders internally and externally, challenging existing business models and operations as social institutions. The win-win paradigm is outdated.
● Corporate leaders can level the playing field by applying appropriate urgency, focusing on aligned issues, establishing sustained commitments, and supporting systemic approaches to address the factors creating a challenging landscape.
How to Use This Section:
• By learning the differences between traditional business practices and a social justice approach, leaders can recognize common barriers their companies face and apply high-impact tactics to overcome them to make meaningful, sustained changes that challenge existing models and promote equity.

PRESENTED BY
SPONSORS
BRONZE SPONSORS
FOOD SPONSORS
VIDEO SPONSOR

MEDIA PARTNERS
PHOTO BOOTH SPONSOR
COBRE SPONSOR
STUDENT SPONSOR
BEVERAGE SPONSOR