26 minute read
Grey matter matters: An investigation into the role of helmets in preventing force on the brain


Claire Kitching
Barker College
Purpose: This paper aims to determine the effect of increased magnitude of force applied externally to a helmet, when struck on the temple by an ice-hockey puck, on the force and acceleration experienced by the brain(modelled by ballistic testing gel). It compares the effectiveness of three icehockey helmets across various price ranges and increasing puck velocities. Design/methodology/approach: This experiment used a 3D printed head-form filled with ballistic testing gel and mounted to a fixed mount to model the human head and brain. Helmets were fitted to the head-form to test them, and a 3-axis accelerometer was embedded in the ballistic testing gel. A modified slingshot was used to fire the puck at the head at speeds from 9.2-49.2 m/s, using a system of 3D printed wheels and elastic chord to build tension. Findings: The research found that the force on the brain increases at an increasing rate as the external force increases. This is true to different degrees across all tested helmets, however the most effective helmet at low puck velocities was the most expensive of the three helmets, and the most effective at high puck velocities was the least expensive helmet. Research limitations/implications: The research sample size was three different helmets, with 33 tests across the forces and helmets. In future testing, more trials can be conducted, as well as tests on goaltender helmets and designs for new helmets. Practical implications: The results showed what materials were more effective in preventing severe concussion and provided further data on how various helmet materials behave under the forces specific to ice hockey. Social implications: The results of this paper can be used to inform ice-hockey players and parents on what helmet to buy, as well as preface further testing and helmet design. Originality/value: To the researcher's knowledge, ice-hockey helmets remain untested in this way, nor has the force been measured internally to this point. This testing also tested a range of forces not previously done. Keywords: Concussion, Pterion, Ice-hockey, Prevention Paper Type: Research paper
Literature Review
Dangers of concussions
Cerebral concussions are sports-associated injuries most often identified with contact sports, including ice hockey (Powell, 2001). They have been a primary issue for discussion amongst athletes and sports medicine professionals since the 1990s (Musumeci et al., 2019). There is no standardised concussion treatment at this stage (Schneider et al., 2017; Haider et al., 2017). Powell emphasises that there is no consensus on a concussion grading system or management because a variety of signs and symptoms may or may not be present (Albicini and McKinlay, 2018; Lovell et al., 2006; Iverson et al., 2004; Ryan and Warden 2003). Finally, Powell notes that emphasis on concussion prevention is essential and must be done through up-to-date techniques for preventative player performance being taught to coaches and players and continued investigation of protective product improvements (Quick et al., 2021). Goodman (2022) furthers these ideas, focussing on the specific causes of concussions in ice hockey and current treatment and prevention strategies. Goodman found that concussions occurred primarily during games and emphasised that a player who has had more than one concussion in their lifetime is more likely to lose consciousness after head trauma, emphasising the specific mechanisms of head injuries in ice hockey. He shows that striking the head on the boards accounted for the most concussions within the study; however other mechanisms of injury that involve force to the side of the head (including shoulder check) account for a large portion of concussions experienced as a result of the sport. Hence, the effectiveness of helmets is of great importance in the health and wellbeing of those who play the sport, as the difficulty in identifying concussions, as well as their potential severe and long-term effects and the
lack of effective treatment for them, makes preventing concussions of utmost importance.
Anatomy of the human head and impact trauma
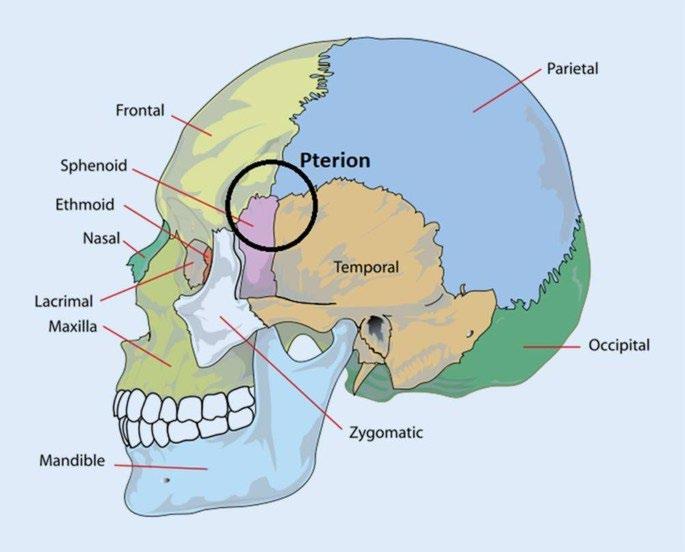
The Pterion is the point on the skull commonly referred to as the temple (Figure 1). It is a dangerous place to experience trauma for two reasons, including minimal protection from the bone structure and the proximity of the meningeal artery (Natali et al., 2021). At the Pterion, the coronal, lambdoid and squamosal sutures join, creating a weak point in the skull’s bone structure where the bone is thinner (Lloyd-Jones, 2019). Therefore, forces going through this point increase the skull fracture risk. The bone’s thinner nature also allows greater force to be transferred to the brain, increasing concussion risk and severity. The second danger is the meningeal artery, most commonly ruptured at the Pterion. A rupture in this artery results in a hematoma, which must be surgically treated in most cases (Natali et al., 2021). The Pterion is the skull’s weakest point resulting from these factors. Therefore, testing should focus on large forces received through this point.
Figure 1: An image depicting the Pterion as the ossification of the frontal, parietal, occipital, ethmoid, sphenoid and temporal bones, also shwoing the coronal, saggital, lambdoid, squasmosal and metopic sutures. (Source: Ventimiglia. 2013)
Helmet testing
Daneshvar et al. (2011) review research into the effectiveness of helmets and helmet testing, discussing that helmets are often tested in high impact situations, leaving the question as to helmet performance in lower impact situations and any correlation to the severity of a traumatic brain injury. Additionally, they note that most studies place sensors within the helmet lining, therefore measuring the acceleration of the helmet. They suggest sensors would be better placed within the head or in contact with an athlete’s head to measure the anatomy’s acceleration rather than equipment, as these values can be significantly different (Daneshvar et al. 2011). Helmets are predominantly tested using drop tests, where the helmet is fitted to a head form and dropped from a height, with forces measured throughout the impact ((Clark et al., 2016)). This model does not address the more common and dangerous impacts through the Pterion from rotational and sideways falls and those from a puck (Champoux et al., 2021). Drop tests also often test at a single impact level or through a limited range, meaning that whilst a helmet may meet standards, it will not necessarily be protective across a realistic range of forces nor the realistic mechanisms of injury. These factors were considered in the experimental design as helmets are being tested across various impact magnitudes with sensors within ballistic gel to model the brain’s movement, measuring the brain’s acceleration rather than the skull or helmet (Mo et al., 2022). Finally, the force that causes a concussion is primarily the inertial acceleration, which leaves the brain in one spot causing the skull to move into and collide. This acceleration occurs in all three plains of movement (x, y and z). Therefore, it is essential to consider all three plains of motion throughout any testing experiment (Tierney, 2021).
Identification of a research gap
There is also limited research on the effectiveness of a helmet across various forces (especially lowmedium forces). Hence, a research gap has been identified. That is, the testing of helmets does not test for the forces through the Pterion, where it is arguably most crucial for the helmet to function well. The purpose of the experiment is to collect data on the acceleration in the centre of the model brain when various helmets are impacted by a wide range of forces aligned with the Pterion, allowing comparisons to be drawn between each helmet across a variety of forces, and thus the helmets to be compared.
Scientific Research Question
What is the effect of increasing the force of an ice hockey puck hitting an ice hockey helmet on the acceleration of the brain?
Scientific Hypotheses
Primary Hypothesis: As the force on the head increases, the acceleration of the ballistic gel modelling a brain will increase at an increasing rate.
Secondary Hypothesis: The shape of the curve will be different for different helmets, potentially crossing over as they increase at different rates.
Methodology
Apparatus
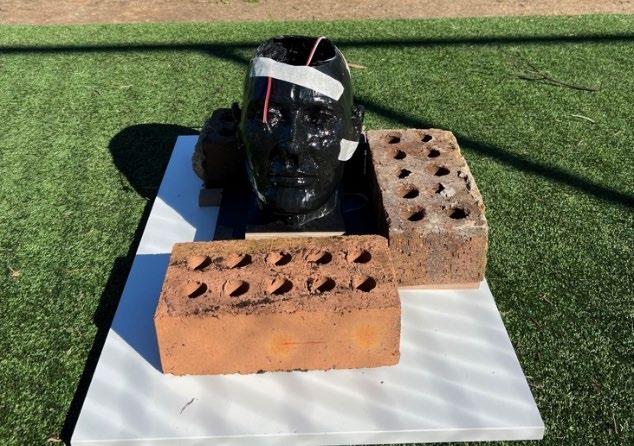
Figure 2 shows one of the heads, filled with ballistic testing gel with the ADXL377 sensor placed inside, mounted on a sheet of plywood and stabilised by three bricks.
A testing apparatus and model were constructed using a variety of wood, leather, elastic chord and a 3D head model (see figure 2 and figure 3). The head model was made using a hollow 3D printed structure, coated internally and externally in epoxy resin and filled with ballistic testing gel, simulating the brain's movement inside the skull. Tests were conducted between 9.2m/s and 49.2m/s. A device called a Puck Chucker (Undefined - PUCK CHUCKER 3000 (Hand-Held Rubber-Powered Hockey Puck Cannon), 2017) was constructed, utilising elastic, as seen in Figure 4 and Figure 5. This launched in the same direction with the puck landing in the same place for each test, provided the device was fixed to a piece of plywood with bolts held to the ground by bricks, preventing movement. Using multiple wheels (seen in figure 5), the device could be loaded to various tensions, thus allowing the puck to be fired at different velocities (the specific velocities were measured using frame-by-frame video analysis).
The head model and puck chucker were mounted and fixed 1 metre apart. The Arduino ADXL377 +-200g three-axis accelerometers were used to measure all forces, displacements, and accelerations inside the middle of the modelled brain. This was dictated by Daneshvar et al. (2011) who discussed the importance of measurements being taken within the brain itself rather than external measurements
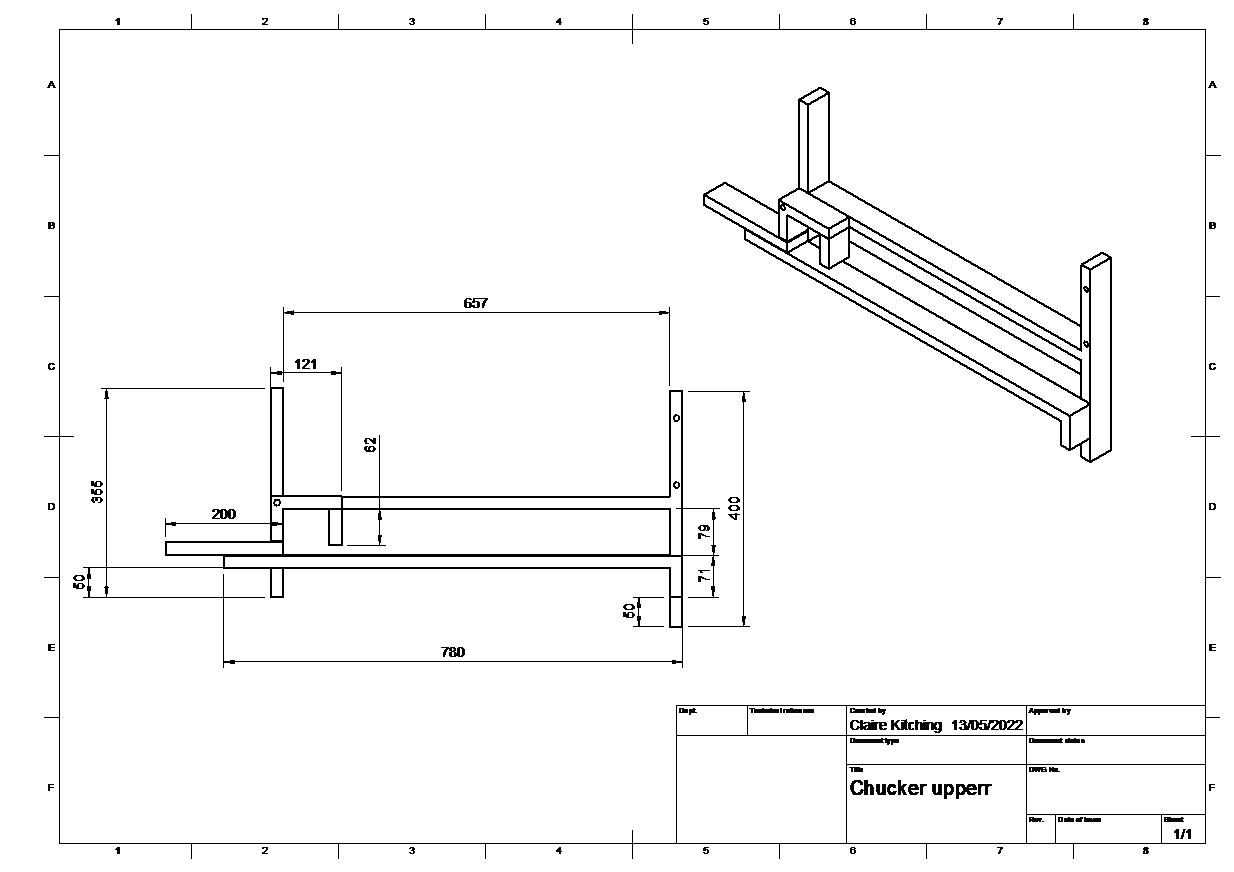
Figure 4 shows the metal frame that was constructed to make the Puck Chucker.
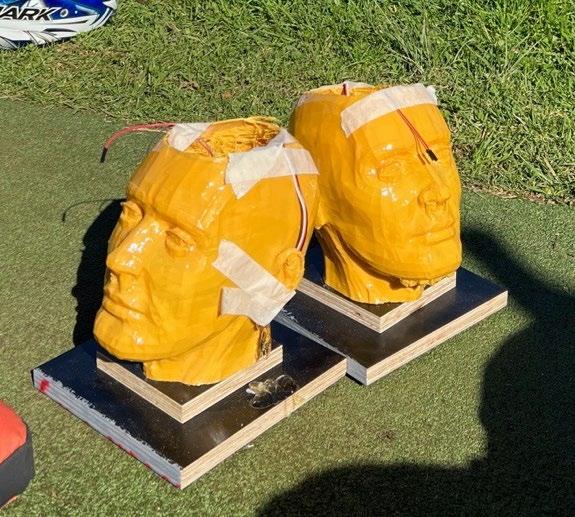
Figure 3 shows another two head models, with the sensors inserted and wires taped across the top as they were when the gel was set. This helped to ensure the sensors all set flat and made the sensor calibration a shorter process after the gel had set. This allowed the sensors to be accurately calibrated immediately to position (0,0,0) in 4 steps rather than 21.
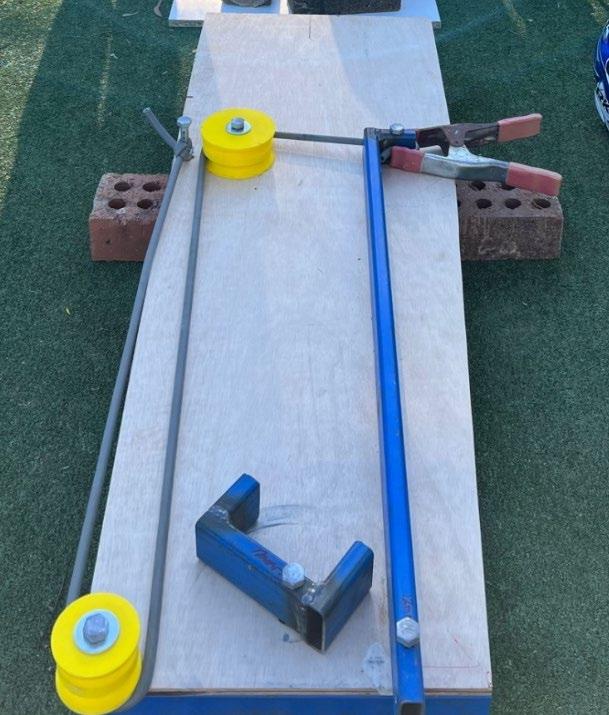
Figure 5 shows the built Puck Chucker, with the sanded wooden plane to guide the puck, as well as the release mechanism (the U-bracket on top of the wood) and the elastic chord run around the rotation pulley.
Experimentation
The helmet being tested was fitted to the mounted head model and adjusted until worn according to the manufacturer’s instructions. The puck shooter apparatus was then aimed such that the puck would strike the Pterion. The elastic slingshot style of this device allows varying amounts of tension to be created, enabling the puck to reach a variety of velocities, allowing the hypothesis to be tested. Before the puck was fired, there was a five-second hands-off period, where there was no movement around the experiment, so a five-second period of zero acceleration could be registered. After this period, the puck was released, and contact was made with the helmet. The trial was considered complete when the readings returned to zero in all directions. At this point, trials were repeated with the puck travelling at different velocities to allow a trend to be observed. Each trial was videoed from behind and the side. There was not a process of testing each velocity a set number of times, as the apparatus did not allow identical velocities to be replicated reliably. Hence, there were a number of trials conducted for each helmet, with clusters around a low, medium and high velocity and all results were recorded. Outliers became evident once the data had been graphed. Tracker was then used to calculate the velocity of each puck and confirm the correct location of the point of impact. The head form was checked after each trial for evidence of material degradation, and if any was found, it was swapped for a new head form. These tests were conducted on the helmets seen in Table 1.
Table 1: Details each helmet tested throughout the experiment, including the model name of each helmet and the helmet's designated number for ease of identification throughout testing.
Helmet Name Helmet Price Point US Patent No. Production date - lot
Bauer BHH2100 Low 5 978 973 03 2011 002
Bauer REAKT95 High 6 202 223 8 832 870 9 345 282 6 996 075 8 739 318 27 12 2017 - 001
Bauer IMS5.0S Medium 6 966 075 09 09 2020 – 002
Data Analysis
The impact considered in analysis was the initial peak, as this is what determines the severity of the cerebral concussion, regardless of second-impact syndrome or post-concussion syndrome. The number of gs as a resultant vector of all three planes of impact was graphed against the impact velocity of the puck, allowing a relationship between the variables and the hypotheses to be assessed. This data was then compiled and reported, and shared with members of the ice-hockey community to spread about helmet use and effectiveness, in addition to use as the basis for further experimentation
Results
For each of the 33 tests, the puck velocity was measured and recorded, along with the acceleration of the brain. The summary results are presented in table 2.
Table 2 shows the data for each axis, and the resultant vector, for each velocity on each helmet.
Brain acceleration (gs) Helmet Puck Velocity (m/s) x impact y impact z impact resultant vector
None 30.6 >200 >200 >200 >346.41 None 37.2 >200 >200 >200 >346.41
Low 49.2 >200 >200 >200 >346.41
Low 39.3 >200 >200 >200 >346.41
High 33.6 187.81 179.59 190.98 322.49
High 31.2 193.04 176.28 112.33 284.53
Mid 36.3 >200 >200 >200 >346.41
Mid 33.3 >200 >200 >200 >346.41
High 18.9 100.28 31.27 102.23 146.58
High 21.2 109.22 33.19 114.01 161.22
High 15.8 88.01 26.79 91.91 130.04
High 16.4 81.50 59.79 89.45 134.98
High 22.8 121.34 36.22 127.84 179.94
Mid 24.6 120.56 29.63 124.93 176.13
Mid 27.9 154.22 67.46 156.39 229.77
Mid 19.8 84.14 31.99 82.11 121.84
Low 19.2 116.47 52.86 98.62 161.51
Low 28.3 133.96 59.54 102.95 179.13
Low 32.1 141.72 66.73 133.94 206.10
Low 10.4 101.74 36.87 102.00 148.71
Low 11.2 103.85 33.50 102.66 149.82
Low 13.6 104.51 44.42 101.86 152.55
Low 12.8 102.89 40.59 105.13 152.60
High 14.1 75.42 60.03 77.22 123.51
High 15.2 76.45 66.42 78.77 128.30
High 9.2 62.98 53.10 68.47 107.12
High 10.6 63.66 56.13 66.69 107.94
Mid 11.5 46.45 32.61 48.87 74.89
Mid 14.9 57.84 41.92 60.84 93.83
Mid 15.1 55.88 49.95 60.24 96.16
Mid 13.7 54.11 38.18 57.86 87.94
Mid 12.3 46.01 37.54 51.85 78.83
Mid 14.5 54.98 49.47 54.07 91.62
To compare the effectiveness of each helmet at various external forces a graph was produced of internal brain acceleration vs puck velocity for each helmet (Figure 6)
Force Experienced by the Brain (arbitrary units)
1000
900
800
700
600
500
400
300
200
100
0
The Effect of Increased Force on the External of a Helmet on the Force Experienced by a Brain Model
y = 35.509e0.0652x
y = 63.587e0.047x
y = 109.78e0.0235x
0 10 20 30 40
External Puck Velocity (m/s)
50 60
Low Price Helmet Mid-range Helmet High Priced Helmet
Expon. (Low Price Helmet) Expon. (Mid-range Helmet) Expon. (High Priced Helmet)
Figure 6: Shows the impact of the external force of the puck, measured in its velocity (m/s) on the force experienced by the ballistic gel model of the brain, measured in gs.
The lowest priced helmet has the least effective protection at lower velocities, resulting in the highest force on the brain between 10-20m/s. The highest priced helmet falls in the middle in this velocity range, and the mid-range helmet appears to be most effective in this low velocity range. In the medium velocity range of 20-30m/s, all trendlines cross as they begin to mimic asymptotic behaviour. At the upper limit of this range, the lowest priced helmet appears to be the most effective, followed by the mid-range helmet and the highest priced helmet. In the highest velocity range of 30-40m/s, each graph increases at an increasing rate more obviously, however the lowest priced helmet still seems to be most protective, letting a limited amount of force through the helmet, followed by the highest priced helmet and then the mid-range helmet. In further testing, more tests should be conducted in a higher velocity range to continue the trend, however the clustering of results below 30m/s indicates this trend is reliable as it is based on many data points.
Discussion
The results show a clear positive relationship between the force applied externally to the helmet (related to the puck velocity) and the magnitude and direction of the impact in the centre of the ballistic gel, by an ADXL377 sensor. The higher the resultant acceleration vector (calculated by the vector sum of acceleration in the x, y and z direction), the more force experienced by the gel, as seen clearly in Table 2 and Figure 6. There is acceleration three dimensionally because of the angle of impact. Despite all impacts not being in identical places on the side of the head form, the slight variation only influenced the direction of the forces rather than the magnitude. Because a resultant vector was calculated, the direction of the force was not of utmost importance, and the resultant vector had the same magnitude regardless of the combination of impact directions, meaning the slight variation in the point of impact did not affect results.
The positive curvature indicates that at higher external velocities, a slight increase in velocity may greatly increase the internal force. Therefore these results confirm the primary hypothesis that as the force on the external of the helmet increases, the acceleration of the ballistic gel modelling the brain will increase at an increasing rate.
Concerning the secondary and tertiary hypothesis, one helmet is not conclusively ‘more protective’ than another. However, as seen in the trendlines of Figure 6, each provides a different level of protection at
different impact forces. As evident in the crossovers between the trendlines, each helmet has a different level of effectiveness at a different level of impact.
It’s important to note that average puck speeds vary between amateur and professional games. Under 18 games range, on average, between 8-40m/s and amateur adult leagues generally experience velocities of 21-46m/s. Professional leagues can see velocities of up to 52m/s (Coakley & Pike, 2022; Danny Gallivan, 2021). While there could be more data points across the range, but particularly above 42m/s, this experimentation did test across the range from youth to amateur to professional leagues, meaning the results can be applied across the range of leagues.
Theoretical and Practical Implications and applications
It is well known throughout the concussion research and sports communities that a concussion occurs at any impact with greater than 95gs of force (Gorgens, 2022). However, as seen in the data above (Table 2 and Figure 6), almost all impacts resulted in accelerations above this threshold value, the exception being from external puck velocities less than 15 m/s on Helmet 10. For the other two helmets, this testing indicates that even a puck moving at a relatively slow velocity of 10 m/s is likely to cause a concussion (which is a concern as even amateur ice-hockey shots reach speeds of 9-12m/s (Springer Verlag, 2003)). The threshold for a potentially fatal brain acceleration is 120-122gs in a singular plane of movement, or 190gs in all impact directions combined (Florida, 2020). The results indicate that this acceleration occurs for external puck velocities ranging from 27.9 to 49.2m/s across the helmets. This is of great concern as the results suggest potentially life-threatening collisions are common. Thankfully not all collisions resulting in over 190gs of force result in serious injury or death, however the risk is worrying.
According to the literature, the concussion frequency for players is 4.2-6.6 concussions/1000 play hours (Marchie & Cusimano, 2003). Again, if the data from this experiment is correct, and accelerations over 95gs (resulting in a likely concussion) are resulting even from low speeds, it seems surprising that only 4.2-6.6 concussions occur for every 1000 hours of play. A potential explanation is due to the lack of definitive concussion symptoms and the unwillingness of players to be adequately assessed if they recognise these signs, resulting in up to 72.4% of concussions in some leagues not being diagnosed or reported (Dessy et al., 2017). As a result, concussions may be a more common injury in ice hockey than expected, as seen in the data in Table 2, which shows every impact on the head had a force in all three planes, increasing the magnitude of the impact and increasing the risk of an MTBI. Another reason for the discrepancy is there are very few occurrences in each game where a puck directly strikes the temple, however many parents of ice-hockey playing youth may not feel this sufficiently mitigates the risk.
These results are of significant concern and raise the question – what can be done about this? Changing the game’s rules to prevent these injury-causing impacts changes the nature of the sport itself. Therefore this experiment guides further research into the forces experienced by the brain in various types of impact, as well as more extreme speeds on the higher and lower ends of the spectrum. Ultimately, however, this research and future research should be used to design a helmet to more effectively protect the wearer from severe traumatic brain injuries.
How do results agree or disagree with previously published works?
In most previous research, helmets were tested using the drop test method with sensors placed on the outside of the head form rather than within a brain model, despite it being the brain that helmets need to protect most. This form of testing gives results that pass various safety tests (which vary from country to country). It allows helmet manufacturers and companies to advertise their helmets as adequate protection against various impacts, including lateral and rotational. However, this level of safety is not the case, supporting previous studies which state sensors must be within a brain model during helmet testing to represent how effective a helmet is accurately. This data also supports further research into what materials are most effective in preventing those threshold forces on the brain after an impact because it is evident across all tested price points that the current materials and technologies being utilised are not nearly as effective as needed for the helmet to fulfil its purpose successfully.
Future Research
More testing should be done into the effectiveness of a greater variety of helmets and helmet technologies at a greater variety of external velocities and using more accurate sensors within the brain model that have a greater range, allowing a greater range of velocities to be investigated. The experiment can also be attempted with goaltender helmets, as the design is different and may show a greater level of protection
that could then be implemented into the player helmets. Ultimately, this testing and further testing should culminate in designing a helmet for ice hockey players and goaltenders that effectively and reliably protects against the effects of concussion and head traumas within the sport, thus reducing this injury throughout all leagues and divisions. Ideally, this new design could be translated to other sports where head protection is necessary, such as cricket or equestrian sports.
Conclusion
The results of the study supported the primary, secondary and tertiary hypotheses. The primary hypothesis stated that as the force on the external of the helmet increases, the acceleration of the ballistic gel modelling the brain would increase at an increasing rate. This is seen clearly throughout the results across all helmets tested. The secondary hypothesis stated that the shape of the curve would be different for different helmets. Again, this is clear throughout the results as, whilst each helmet did show the increasing at an increasing rate shape discussed in the primary hypothesis, the gradient for each helmet changed at a different rate. The tertiary hypothesis stated that some of the trendlines on the graph would cross over, as they all increase at differing rates as the force increases. This is seen throughout the medium external velocity range (20-30m/s), as the trendlines of all helmets intersected. At low external velocities the most expensive helmet produced minimal ‘brain’ acceleration, at high external velocities it was the least expensive helmet that best prevented concussion.
The study’s results also showed limited protection against concussion throughout the experimentation, as 85% of the tests had an impact on the brain above the threshold for concussion, and a further percentage showed impacts above the threshold for causing potentially fatal neurological hematomas.
Acknowledgements
I would like to acknowledge Dr Matthew Hill for providing consistent guidance about the scientific processes required to complete the project, Mr Phil Barden for his suggestions, advice and help in designing and building the Puck Chucker and printing the heads, Mr Tim Milkins for assisting in 3D printing and Mr D. Ward for his assistance in the process of building the Puck Chucker. I would also like to thank Mr T. Kitching and Mrs J. Kitching for their financial contributions to the project, along with regular encouragement and advice.
References
Albicini, Michelle, and Audrey McKinlay. “A Review of Sideline Assessment Measures for Identifying SportsRelated Concussion.” Journal of Concussion, vol. 2, no. 11, Jan. 2018, p. 205970021878482, journals.sagepub.com/doi/pdf/10.1177/2059700218784826 , 10.1177/2059700218784826. Accessed 19 Nov. 2021.
“Bicycle Helmet Liners: Foam and Much More.” Helmets.org, 15 June 2021, helmets.org/liners.htm. Accessed 23 Feb. 2022.
Champoux, Luc, et al. “A Comparison of Three Rotational Ice Hockey Helmet Test Protocols.” UOttawa, 2021, ruor.uottawa.ca/handle/10393/42043. Accessed 21 May 2022.
Clark, J. Michio, et al. “Comparison of Ice Hockey Goaltender Helmets for Concussion Type Impacts.” Annals of Biomedical Engineering, vol. 46, no. 7, 29 Mar. 2018, pp. 986–1000, 10.1007/s10439-018-2017-7.
“Protective Capacity of Ice Hockey Helmets against Different Impact Events.” Annals of Biomedical Engineering, vol. 44, no. 12, 6 July 2016, pp. 3693–3704, www.ircobi.org/wordpress/downloads/irc14/pdf_files/17.p df, 10.1007/s10439-016-1686-3. Accessed 15 Mar. 2019.
Coelho, R.M, et al. “New Composite Liners for Energy Absorption Purposes.” Materials and Design, vol. 33, no. January 2012, 2021. Science Direct, www.sciencedirect.com/science/article/abs/pii/S02613069 12004724. Accessed 23 Apr. 2022.
Daneshvar, Daniel H., et al. “Helmets and Mouth Guards: The Role of Personal Equipment in Preventing SportRelated Concussions.” Clinics in Sports Medicine, vol. 30, no. 1, Jan. 2011, pp. 145–163, www.ncbi.nlm.nih.gov/pmc/articles/PMC2987604/, 10.1016/j.csm.2010.09.006. Accessed 1 Feb. 2022.
Dessy, Alexa M, et al. “Review of Assessment Scales for Diagnosing and Monitoring Sports-Related Concussion.” Cureus, 7 Dec. 2017, www.cureus.com/articles/9375review-of-assessment-scales-for-diagnosing-andmonitoring-sports-related-concussion, 10.7759/cureus.1922. Accessed 19 June 2022.
“EPS Foam Helmet Liner Performance with Age.” Helmets.org, 6 Oct. 2020, www.helmets.org/helmetlineraging.htm. Accessed 23 Feb. 2022.
Florida, Lori. “Brain Concussion: How Easily Does It Occur?” Critical Analysis RN Consulting, 17 Jan. 2020, criticalanalysisrn.com/what-does-ear-wax-have-to-do-withdrug-testing-2/. Accessed 19 June 2022.
Goodman, David, et al. “Concussions in Hockey: There Is Cause for Concern.” Medicine & Science in Sports & Exercise, vol. 33, no. 12, 1 Dec. 2001, pp. 2004–2009.
Medicine and Science in Sports and Exercise, journals.lww.com/acsmmsse/Fulltext/2001/12000/Concussions_in_hockey__there _is_cause_for_concern.5.aspx. Accessed 18 Jan. 2022.
Gorgens, Kim. “Most Concussions Deliver 95 G’s, Neuropsychologist Says.” ScienceDaily, 2022, www.sciencedaily.com/releases/2010/06/100624092526.ht m. Accessed 14 June 2022.
Haider, Mohammad Nadir, et al. “A Systematic Review of Criteria Used to Define Recovery from Sport-Related Concussion in Youth Athletes.” British Journal of Sports Medicine, vol. 52, no. 18, 22 July 2017, pp. 1179–1190, www.ncbi.nlm.nih.gov/pmc/articles/PMC5818323/, 10.1136/bjsports-2016-096551. Accessed 21 May 2022.
Iverson, Grant L., et al. “Cumulative Effects of Concussion in Amateur Athletes.” Brain Injury, vol. 18, no. 5, Jan. 2004, pp. 433–443, 10.1080/02699050310001617352.
Jellinghaus, K., et al. “Study of the K-S Distance on Skulls from Different Modern Populations for Sex and Ancestry Determination.” Rechtsmedizin, vol. 30, no. 6, 25 Sept. 2020, pp. 451–457, 10.1007/s00194-020-00426-9. Accessed 21 May 2022.
Kratz, Susan Vaughan, and Daniel J. Kratz. “Effects of CranioSacral Therapy upon Symptoms of Post-Acute Concussion and Post-Concussion Syndrome: A Pilot Study.” Journal of Bodywork and Movement Therapies, vol. 27, July 2021, pp. 667–675, www.iahe.com/docs/articles/Effect-of-CST-on-postconcussion-syndrome-Susan-Vaughn-Kratz-May-102021.pdf, 10.1016/j.jbmt.2021.05.010. Accessed 21 May 2022.
Liu, Yuzhe, et al. Theoretical and Numerical Analysis for Angular Acceleration Being Determinant of Brain Strain in MTBI. 2012.
Lloyd-Jones, Graham. “CT Brain Anatomy - Skull Bones and Sutures.” Www.radiologymasterclass.co.uk, July 2019, www.radiologymasterclass.co.uk/tutorials/ct/ct_brain_anat omy/ct_brain_anatomy_skull. Accessed 18 Jan. 2022.
Lovell, Mark R., et al. “Measurement of Symptoms Following Sports-Related Concussion: Reliability and Normative Data for the Post-Concussion Scale.” Applied Neuropsychology, vol. 13, no. 3, Sept. 2006, pp. 166–174, www.researchgate.net/profile/DustinPardini/publication/6444881_Measurement_of_Symptoms _Following_SportsRelated_Concussion_Reliability_and_Normative_Data_for _the_PostConcussion_Scale/links/57043ad808ae13eb88b68abf/Meas urement-of-Symptoms-Following-Sports-RelatedConcussion-Reliability-and-Normative-Data-for-the-PostConcussion-Scale.pdf, 10.1207/s15324826an1303_4. Accessed 21 Apr. 2022.
Marchie, Anthony, and Michael D Cusimano. “Bodychecking and Concussions in Ice Hockey: Should Our Youth Pay the Price?” CMAJ, vol. 169, no. 2, 22 July 2003, pp. 124–128, www.cmaj.ca/content/169/2/124.short. Accessed 18 Jan. 2022.
---. “Bodychecking and Concussions in Ice Hockey: Should Our Youth Pay the Price?” CMAJ, vol. 169, no. 2, 22 July 2003, pp. 124–128, www.cmaj.ca/content/169/2/124.short. Accessed 19 June 2022.
Mo, Gen-Lin, et al. “Influence of Impact Velocity and Impact Attack Angle of Bullets on Damage of Human Tissue Surrogate —— Ballistic Gelatin.” Chinese Journal of Traumatology, Mar. 2022, www.sciencedirect.com/science/article/pii/S100812752200 0256, 10.1016/j.cjtee.2022.03.004. Accessed 21 May 2022.
Musumeci, Giuseppe, et al. “Concussion in Sports.” Journal of Functional Morphology and Kinesiology, vol. 4, no. 2, 19 June 2019, www.mdpi.com/2411-5142/4/2/37/htm, 10.3390/jfmk4020037. Accessed 21 May 2022.
Natali, Adriana L., et al. “Neuroanatomy, Middle Meningeal Arteries.” PubMed, StatPearls Publishing, 30 Oct. 2021, www.ncbi.nlm.nih.gov/books/NBK519545/. Accessed 4 Apr. 2022.
Ouckama, Ryan, and David Pearsall. Projectile Impact Testing of Ice Hockey Helmets: Headform Kinematics and Dynamic Measurement of Localized Pressure Distribution. 2014, www.ircobi.org/wordpress/downloads/irc14/pdf_files/16.p df. Accessed 5 Spring 2022.
Powell, JohnW. “Cerebral Concussion: Causes, Effects, and Risks in Sports.” Journal of Athletic Training, vol. 36, no. 3, July 2001, pp. 307–311. National Library of Medicine, www.ncbi.nlm.nih.gov/pmc/articles/PMC155423/. Accessed 14 Nov. 2021.
Quick, Brian L., et al. “Raising Concussion Awareness among Amateur Athletes: An Examination of the Centers for Disease Control and Prevention’s (CDC) Heads Up Campaign.” Health Communication, 21 July 2021, pp. 1–12, www.researchgate.net/profile/ElizabethGlowacki/publication/353413705_Raising_Concussion_A wareness_among_Amateur_Athletes_An_Examination_of _the_Centers_for_Disease_Control_and_Prevention%27s_ CDC_Heads_Up_Campaign/links/61b26d9c590a0b7ed634 5be4/Raising-Concussion-Awareness-among-AmateurAthletes-An-Examination-of-the-Centers-for-DiseaseControl-and-Preventions-CDC-Heads-Up-Campaign.pdf, 10.1080/10410236.2021.1950295. Accessed 21 May 2022.
Ryan, Laurie M., and Deborah L. Warden. “Post Concussion Syndrome.” International Review of Psychiatry, vol. 15, no. 4, Nov. 2003, pp. 310–316, 10.1080/09540260310001606692.
Schneider, Kathryn J, et al. “Rest and Treatment/Rehabilitation Following Sport-Related Concussion: A Systematic Review.” British Journal of Sports Medicine, vol. 51, no. 12, 24 Mar. 2017, pp. 930–934, 10.1136/bjsports-2016-097475. Accessed 21 Mar. 2022.
Springer Verlag. “Table 3 Average Peak Shot Velocity for Each Type of Sticks in Each Group.” ResearchGate,
ResearchGate, 3 Jan. 2003, www.researchgate.net/figure/Average-peak-shot-velocityfor-each-type-of-sticks-in-each-group_tbl1_225360916. Accessed 17 June 2022.
Tierney, Gregory. “Concussion Biomechanics, Head Acceleration Exposure and Brain Injury Criteria in Sport: A Review.” Sports Biomechanics, 23 Dec. 2021, pp. 1–29, www.tandfonline.com/doi/pdf/10.1080/14763141.2021.20 16929, 10.1080/14763141.2021.2016929. Accessed 21 May 2022.
Trzaskalska, M, and R Chwastek. “Damping Properties and Density of Helmet Liners Made of Expanded Polystyrene.” Archives of Metallurgy and Materials, vol. 66, no. 1, 2021, pp. 2–6. BazTech, yadda.icm.edu.pl/baztech/element/bwmeta1.element.baztec h-f2fadc00-9602-4414-a482-3ea710533213. Accessed 12 Jan. 2022. “Undefined - PUCK CHUCKER 3000 (Hand-Held Rubber-Powered Hockey Puck Cannon).” The Slingshot Community Forum, 2017, www.slingshotcommunity.com/threads/puck-chucker3000-hand-held-rubber-powered-hockey-puckcannon.21145/. Accessed 15 May 2022.
“What Is a G? Acceleration?” Helmets.org, 25 Oct. 2020, helmets.org/g.htm. Accessed 22 Apr. 2022.
Wilcox, Bethany J., et al. “Head-Impact Mechanisms in Men’s and Women’s Collegiate Ice Hockey.” Journal of Athletic Training, vol. 49, no. 4, Aug. 2014, pp. 514–520, 10.4085/1062-6050-49.3.19. Accessed 20 Dec. 2019.


