Finding Alpha in the Next Level


Q1 2023 Commentary
The recent rise and persistent inflation have created a new environment for market participants. Cracks in the stalwart traditional asset allocation process have appeared, producing losses many investors find intolerable.
The trusted inverse relationship between stock and bond prices may have returned, but the damage has already been done. Its consistency is not reliable - stocks and bonds can go down in tandem when diversification is needed the most. The challenge – whatever was liquid and could be sold was sold. A clear delineation between the risk of public markets versus private markets has been made.
A RiskFirst ® process proved valuable. A quantitative research-based approach centered around managing drawdown risk helped investors stay focused on longer-term goals. Adapting to new markets is a never-ending process of constant growth and improvement. It requires the rejection of complacency, a willingness to embrace the unknown, the desire to challenge assumptions, and the ability to let go of the familiar.
A Speculation Vehicle
The first quarter of the year saw markets close on a positive note, providing some relief following a difficult 2022. However, the issues that led to market volatility last year did not disappear but transformed into other concerns. The Federal Reserve’s aggressive interest rate hikes have begun to impact the economy. Inflation calmed, but corporate earnings weakened, regional banks failed, and an otherwise strong labor market slowed.
The headline market gauge, the S&P 500 Index, rose 7.58% in the first quarter. Some strength in the markets came in
response to Fed actions closely mirroring expectations. However, the path was not easy. The S&P 500 came close to undoing its strong start due to another countertrend that resembled the choppiness of the previous year.
Taking a broader view, the markets seemed to be experiencing a period of consolidation rather than any clear directional movement. Even a small suggestion that rate expectations should change could lead to a significant move in the opposite direction.
Sideways
bayntree.com Bayntree Wealth Advisors | 3
2021 2022 2023 3200 3400 3600 3800 4000 4200 4400 4600 4800 5000
Source: Bloomberg, Redwood. Chart Data Range 03/12/2021 - 04/26/2023. Data as of 04/26/23. Please see additional disclosures at the end of this commentary for more information.
Even a small suggestion that rate expectations should change could lead to a significant move in the opposite direction.
S&P 500 Index
A Summary (and Lesson) of Past Returns
Most other asset classes also saw some relief. The Bloomberg U.S. Aggregate Bond Index returned 2.96%.
When investors face portfolio losses, they often reassess their investment strategy. However, it’s important to have a disciplined process and not chase returns by only investing in assets that have performed well.
In 2022, commodities were one of the only asset classes with positive returns. However, relying solely on this metric would have resulted in missing out on the positive returns of other asset classes in the first quarter of 2023. Therefore,
it’s crucial to consider a variety of factors such as market conditions, diversification, and risk management to make informed investment decisions.
It’s natural for investors to want to change their investment strategy after a market downturn, but it’s important to approach these changes with discipline and not chase returns. By considering multiple factors and focusing on long-term goals, investors can build a well-diversified and resilient portfolio that can withstand market volatility and uncertainty.
Turning Tables
bayntree.com Bayntree Wealth Advisors | 4
-29% -20% -20% -18% -16% -16% -15% -13% -13% -12% -11% -9% 14% 6% 3% 4% 7% 4% 7% 2% 3% 3% 3% 4% 3% -6% -35% -30% -25% -20% -15% -10% -5% 0% 5% 10% 15% 20% L o n g U S T r e a s u r y S m a ll C a p U S E q u i t y E m e r g i n g M a r k e t E q u i t y L a r g e C a p U S E q u i t y I n v e s t m e n tG r a d e C o r p o r a t e s I n t e r n a t i o n a l E q u i t i e s E m e r g i n g M a r k e t D e b t H i g hY i e l d M un i c i p a l B o n d s U S A gg r e g a t e B o n d s U S T re a s u r y H i g hY i e l d C o r p o r a t e B o n d s I n v e s t m e n tG r a d e M un i c i p a l B o n d s C o m m o d i t i e s YTD 2022
2022 Calander Year Returns 2023 YTD
Source: Bloomberg, Redwood. Data as of 04/26/2023. Please see additional disclosures at the end of this commentary for more information.
Days of Pain: 993 (and Counting)
Short-term positive performance is far different from a recovery of prices. The damage inflicted on investmentgrade bonds and treasuries remains fresh and has wounded investors’ portfolios and confidence in these traditional safehavens. While these assets have been the common tool to dampen portfolio volatility, the pressures of public, liquid markets drove the worst sell-off in the Bloomberg U.S. Aggregate Bond Index (“AGG”) since its inception
The AGG had a drawdown that exceeded 18% from its peak to trough, despite experiencing virtually no defaults.
Adding to the pain, the AGG has been in its drawdown for 993 days, its longest drawdown duration ever. Despite gaining 3% this quarter, the AGG is still approximately 14% away from its previous highs. At this rate, it’s impossible to determine when these bonds will fully recover. This poses a real problem for retirees and pre-retirees who do not have the luxury to wait and see for a recovery.
Long Lasting Lesson
bayntree.com Bayntree Wealth Advisors | 5
1% 2% 3% 6% 33% 8% 15% 22% 15% 3% 8% 15% 9% 16% 7% 10% -3% 18% 4% 10% 9% -1% 12% 8% 10% 4% 4% 2% 4% 7% 5% 6% 7% 8% 4% 6% 1% 3% 4% 0% 9% 8% -13% -2% -2% 3% -1% -7% -8% -4% -2% -4%-4% -2% -2% -5% -2% -2%-3% -1%-2%-2% -7% -2% -4% -2%-3%-4% -3%-4% -2% -5%-5% -2%-2%-2% -5% -2% -3% -2%-1% -5% -1% -3% -4% -2%-3%-2% -6% -4% -16% -20% -10% 0% 10% 20% 30% 40% 1978 1983 1988 1993 1998 2003 2008 2013 2018 YTD Number of Days In Drawdown: 988 2023 Bloomberg U.S. Aggregate Bond Index Annual Return Bloomberg U.S. Aggregate Bond Index Intra-Year Drawdown
Source: Bloomberg, Redwood. Date Range from 1978-2023. Data as of 04/26/2023.
Bloomberg U.S. Aggregate Bond Index Annual Return Bloomberg U.S. Aggregate Bond Index Intra-Year Drawdown 993
The AGG has been in its drawdown for 993 days, its longest drawdown duration ever.
Policy Success?
After hiking rates the most aggressively since the 1980’s, some evidence of tempering inflation has finally appeared. The Fed Funds Rate finally converged with the PCE Core Price Index, the Fed’s preferred measure of inflation. Popular measures for inflation, such as the CPI, PPI, and PCE Deflator, have declined in Q1 2023.
Furthermore, the Fed Funds rate has also surpassed the U.S. 10-Year Yield, which is where historically it peaks. This also suggest that inflation has peaked and is now heading towards the target rate of 2%, a positive sign for future inflation expectations.
However, this aggressive policy has come at a cost. The labor market is appearing less strong, and many banking institutions, such as Silicon Valley Bank, which held large amounts of the same aggregate bonds that incurred massive losses in 2022, are struggling with their balance sheets.
Moreover, there are questions about how long the Fed will maintain rates at this level before cutting. Policymakers are keen to avoid repeating the mistake of the Volcker inflation period, where the central bank raised rates aggressively and then quickly cut them, only to see inflation pick up again. It remains to be seen how the Fed will navigate these challenges in the coming months and years.
bayntree.com Bayntree Wealth Advisors | 6
1974 1978 1982 1986 1990 1994 1998 2002 2006 2010 2014 2018 2022 0 2 4 6 8 10 12 14 16 18 20 U.S. 10-Year Yield Fed Funds Lending Rate U.S. Personal Consumption Expenditure Core Price Index U.S. Recessions 1970
Source: Bloomberg, Redwood. Date Range from 05/31/1970 - 04/26/2023. Data as of 04/26/2023 Please see additional disclosures at the end of this commentary for more information.
Final Frontier
U.S. 10-Year Yield Fed Funds Lending Rate U.S. Recessions U.S. Personal Consumption Expenditure Core Price Index
Policymakers are keen to avoid repeating the mistake of the Volcker inflation period, where the central bank raised rates aggressively and then quickly cut them, only to see inflation pick up again.
Complacency or Progress?
Ever since the Federal Reserve started raising interest rates on March 16, 2022, the market has seen heightened levels of volatility. Volatility is often proxied by the CBOE Volatility Index (VIX), which represents the expected volatility of the S&P 500 Index over the next 30 days. In the past quarter, the VIX reached its lowest levels in the past year, even as financial cracks, such as the banking crisis, started to appear.
With many pundits calling for a recession in the near future, this is a remarkable amount of calmness for an index that often is referred to as the investor’s “fear” gauge.
Are investors being too complacent? Or does the low level of VIX reflect central banks’ progress in battling inflation and confidence that a financial crisis has been averted? Given that the VIX has tended to bounce off these levels in the past year, it is possible that the market will enter another period of turmoil in the coming months.
Unfazed by Uncertainty
bayntree.com Bayntree Wealth Advisors | 7
0 5 10 15 20 25 30 35 40 3/2022 4/2022 5/2022 6/2022 7/2022 8/2022 9/2022 10/2022 11/2022 12/2022 1/2023 2/2023 3/2023 4/2023 VIX Index Source: Bloomberg, Redwood. Date
03/1/2022 - 04/14/2023. Data as of 04/14/2023 Please see additional disclosures at the end of this
for more information.
Range from
commentary
VIX Index
Despite Silicon Valley Bank (SVB) being one of the biggest banking failures since 2008, the S&P 500 Index only dropped 3.4%.
Not Systemic Yet
It is not a surprise that the various bear markets of the past have followed vastly different paths with varying lengths and drawdowns. After all, we are repeatedly told in finance not to expect past performance to repeat itself. While Q1 has seen some positive news, such as decreasing inflation and giving some hope for a recovery, recession fears have also increased.
Compared to historical bear markets, the duration and depth of the recent equity bear market are more akin to a cyclical sell-off – different than bigger systemic sell-offs
experienced, such as in the 1973 stock market crash, the 2001 technology bubble burst, and the 2007 credit crisis. Some claim the stock market is often a leading indicator for recessions. Hence, it’s important for investors not to be complacent, even if market measures for volatility suggest a general level of calm in the market. It is recommended that investors continue to stick to a disciplined investment process that will allow them to achieve their long-term financial goals.
Bear Markets Of The Past
bayntree.com Bayntree Wealth Advisors | 8
30 40 50 60 70 80 90 100 0 30 60 90 120 150 180 210 240 270 300 330 360 390 420 450 480 510 540 570 600 630 660 690 720 750 1929 1931 1937-38 2007-08 1973-74 2000-02 1946-49 Growth of $100 Trading Days From Peak 2022-2023 S&P 500 Index Bear Market (Previous) S&P 500 Index Bear Market (2022-2023)
S&P 500 Index Bear Market (Previous) S&P 500 Index Bear Market (2022-2023)
Source: Bloomberg, Redwood. Date Range from 1926-2023. Data as of 04/26/2023. Please see additional disclosures at the end of this commentary for more information.
It’s important for investors not to be complacent, even if market measures for volatility suggest a general level of calm in the market.
A Better Portfolio: Seeking Diversification
Achieving long-term financial success heavily relies on the ability to limit losses, making drawdown one of the most crucial metrics for investors. Recognizing this, the RiskFirst ® process aims to build investment strategies that prioritize limiting peak to trough losses, utilizing all available risk mitigation tools to achieve this goal, including traditional asset allocation.
Examining previous bear markets, it is evident that investment-grade bonds were an efficient tool for mitigating risk as they experienced minimal drawdowns and performed inversely to equities during market crashes. Bonds became a prominent feature in portfolio construction due to their negative correlation
to equities and ability to dampen portfolio volatility. However, as underlined extensively, during the 2022 rising rate environment, fixed-income proved ineffective in diversifying risk and actually exacerbated portfolio losses, creating a significant conundrum for asset managers. That is, because of positive correlation, the once dependable defensive component of modern portfolios now seems impotent for reducing volatility for investors.
In search of a solution, we have approached a new frontier to explore opportunities in the alternative assets space, specifically private debt.
New Frontier, Familiar Approach
bayntree.com Bayntree Wealth Advisors | 9
Source: Redwood, September 2022. Please see additional disclosures at the end for more information.
Correlations of Different Asset Classes to Public Investment Grade Debt
0.90 0.88 0.85 0.45 0.40 0.23 0.19 0.11 0.03 0.03 - 0.05 - 0.07 - 0.11 - 0.14 -0 20 0 00 0 20 0 40 0 60 0 80 1 00
LeveragedLoans REITs DevelopedMarketEquityEmergingMarketEquity LargeCapEquity SmallCapEquity CommoditiesPrivateLending(CDLI)
U.S.Treasury InvestmentGradeCorporates LongU.S.Treasury High-YieldMunicipalBondsEmergingMarketDebtHigh-YieldCorporateBonds
During the 2022 rising rate environment, fixedincome proved ineffective in diversifying risk and actually exacerbated portfolio losses, creating a significant conundrum.
Next Level Paradigm on Liquidity
Public markets and liquidity are synonymous given that public markets are more readily available to everyone and therefore are more widely traded. As a result, correlations tend to rise during periods of distress – during a panic, what could be sold was sold.
Stocks, mutual funds, ETFs, and bonds are all traded through public exchanges or over-the-counter (OTC) and are all liquid, independent of their underlying asset classes. The Financial Accounting Standard categorizes
these assets as “Level 1” assets. Assets can range from Level 1 – highly liquid to Level 3 – assets with no observable market and rarely traded.
As assets are traded less and have fewer observable prices, they tend to have lower overall volatility. Level 3 assets, such as private debt investments, benefit as they are infrequently traded, leading to lower volatility. This feature can make private debt an important part of a diversified asset allocation going forward.
Less Liquid, Less Volatility
bayntree.com Bayntree Wealth Advisors | 10
16.5% 7.9% 5.5% 0% 2% 4% 6% 8% 10% 12% 14% 16% 18% Fund s with >50% in L eve l 1 Assets >50% in Le ve l 2 A sse ts >50% in Le vel 3 A sse ts More Liquid/Traded Less Liquid/Traded More Volatility Less Volatility Average Volatility
Source: Bloomberg, Redwood. Date Range From 1/1/2020 - 3/31/2023. Data as of 3/31/2023. Please see additional disclosures at the end of this commentary for more information.
Average Volalitility
Breaking Down Barriers
Private debt markets have demonstrated an ability to offer lower volatility than public debt markets, presenting a new world of opportunities suitable for inclusion in asset allocation portfolios. Despite this, it is widely recognized that individual investors are significantly underexposed to alternative investments compared to institutions due to the high barriers to entry in the alternative investment space. Accreditation requirements and limited access channels have made it impossible for the average investor to participate.
Advancements in new investment vehicles may enable individual investors to access opportunities that were once exclusively available to large institutions. This development represents one of the most significant areas of growth for individual investors. In this context, generating alpha is not solely about the asset but also the ability to access the investment.
With greater access to a broader range of investment opportunities, individual investors have more tools to generate alpha and achieve their investment goals.
Alpha = Undiscovered Beta?
Institutional vs. Individual Allocations to Alternatives
bayntree.com Bayntree Wealth Advisors | 11 27% Pensions 29% Endowments <5% Individual Investors Average Allocations To Alternatives
Source: For investable assets, 2018 CapGemini World Wealth Report. For allocations: 2016 Willis Towers Watson Global Pension Assets Study; 2016 National Association of College and University Business Officers; Money Management Institute, “Distribution of A lternative Investments through Wirehouses.” Allocations shown are for U.S. Pensions and U.S. University Endowments.
Average Allocation To Alternatives Investments
Portfolio Recap
To achieve investment success, it is essential to have a disciplined process that can adapt to all market environments. While the market disruption of last year may have challenged the traditional 60/40 portfolio, few have offered viable solutions. Instead of accepting this status quo and waiting for a return to normalcy, we actively seek ways to execute its investment objectives through its RiskFirst ® approach, which prioritizes keeping clients within their drawdown tolerance.
In the past, a traditional way to minimize volatility was through safe-haven assets such as investment-grade
bonds and treasuries. However, recent events have demonstrated that even these assets may experience significant declines.
To address this, our RiskFirst ® approach incorporates strategic long-only investments and active tactical risk management to seek to limit client drawdowns within their risk-budgets. Furthermore, we continuously search for innovative solutions outside of traditional asset management, including possibly allocating private debt. We believe managing downside risk, such as drawdowns, is paramount to achieving long-term success.
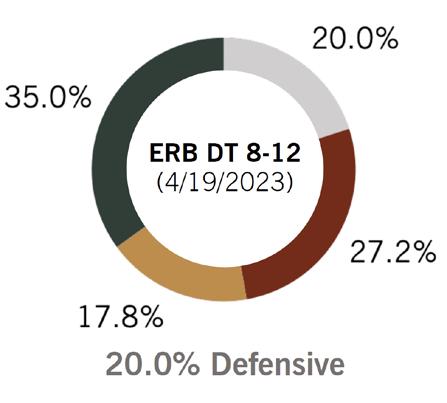
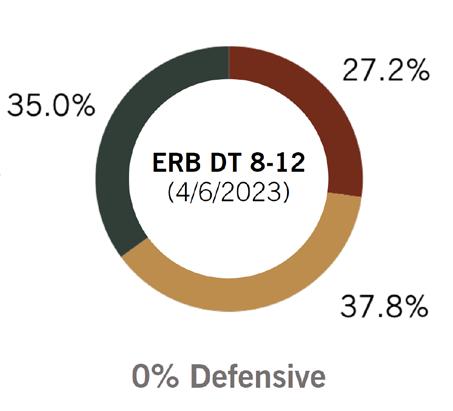
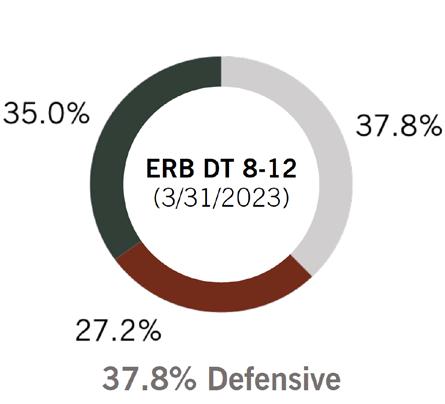
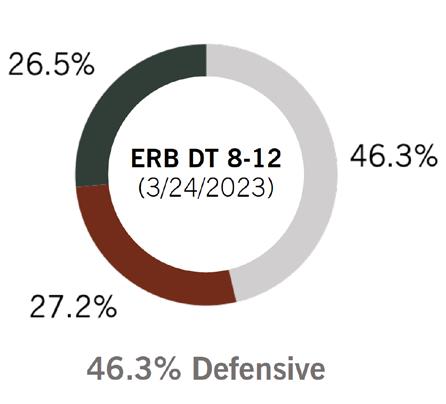
Dynamic Shifts in DRB
bayntree.com Bayntree Wealth Advisors | 12
Tactical Risk-Off Long IG Fixed-Income Long HY Fixed-Income Long Equity
Mulholland 200 Mulholland 200 Mulholland 200 Mulholland 200
Source: Bloomberg, Redwood. Data as of 4/19/2023. Please see additional disclosures at the end of this commentary for more information.
Retail investors typically do not have access to the same tools and timeline as institutions such as pensions and endowments. Investors have been accustomed to trying and piece together a sufficient asset allocation solution using the tools available to them, namely public markets. In 2022, investors learned that relying solely on widely traded and liquid assets during a down-trending market can leave them vulnerable to mass selling. The traditional 60/40 portfolio is overdue for enhancement.
Investors need to reconsider how they construct their asset allocation portfolios, especially when seeking to minimize drawdowns. While the advantage of public securities is the ease of access and liquidity, they have their pitfalls. They are subject to selling pressure, including speculative trading, that results in unnecessary losses.
At Bayntree, our priority is building drawdown-based portfolios and exploring non-traditional solutions to achieve our objectives and bring value to our clients. We believe the future of portfolio construction may need to consider the allocation of “liquidity” and the tradeoff between liquidity risk and market volatility. This opens a large window of opportunities for portfolios to incorporate private debt investing.
Adapting to new markets is a never-ending process of constant growth and improvement. It requires the rejection of complacency, a willingness to embrace the unknown, the desire to challenge assumptions, and the ability to let go of the familiar.
Finding Alpha In Private Debt
Source: PIMCO, September 2020. “Across the Spectrum: Understanding Pubic and Private debt” For Illustration purposes only.
bayntree.com Bayntree Wealth Advisors | 13
Conclusion
General Disclosures
The market commentary is for informational purposes only and should not be deemed as a solicitation to invest or increase investments in Bayntree Wealth Advisors (‘Bayntree’) products or affiliated products. The information contained herein is not intended to provide any investment advice or provide the basis for any investment decisions. Please consult a qualified professional before making decisions about your financial situation. Information and commentary provided by Bayntree are opinions and should not be construed as facts. There can be no guarantee that any of the described objectives can be achieved. Past performance is not a guarantee of future results. Information provided herein from third parties is obtained from sources believed to be reliable, but no reservation or warranty is made as to its accuracy or completeness.
Diversification of asset class or investment style does not guarantee against loss or outperformance. Different types of investments involve varying degrees of risk and there can be no assurance that any specific investment will be profitable. Any individual securities shown are not a recommendation to buy or sell. Any funds shown will have different investment objectives and strategies and are for illustration purposes only and is not a statement of equal comparisons. The price of any investment may rise or fall due to changes in the broad markets or changes in a company’s financial condition and may do so unpredictably. Bayntree does not make representations that any strategy will or is likely to achieve returns similar to those shown in this presentation. Please speak to an advisor before investing any strategy shown within. Indices are shown for informational purposes only; it is important to note that Bayntree’s strategies differ from the indices displayed and should not be used as a benchmark for comparison to account performance. While the indices chosen to represent broad market performance of each asset class, there are report limitations as to available indices and blends, which index can be selected, and how they are presented. Portfolios are sub-advised by Mulholland Wealth Advisors, LLC, (“Mulholland”) an unaffiliated investment advisor registered with the SEC. Such registration does not imply a certain level of skill or training and no inference to the contrary should be made. Please refer to Mulholland’s Form ADV Part 2A (“Brochure”) for more information. RiskFirst® is a registered trademark of Redwood Investment Management, LLC. (“Redwood”), which is an affiliate of Mulholland. Dynamic Risk Budgeted (DRB) and Engineered Risk Budgeted (ERB) portfolios are proprietary to Redwood.
Definitions and Indices
Inflation is a decrease in the purchasing power of money, reflected in a general increase in the prices of goods and services in an economy. Drawdown is a measure of peak to trough loss in a given period; a maximum drawdown is a measure of the maximum peak to trough percentage loss in a given period. S&P 500 Index is a stock market index based on the market capitalization of 500 leading companies publicly traded in the U.S. Stock market, as determined by Standard & Poor’s. Bloomberg U.S. Aggregate Bond Index consists of investment-grade U.S. Government bonds, investment grade corporate bonds, mortgage pass-through securities, and asset-backed securities. It is often considered representative of the U.S. investment-grade fixed rate bond market. Federal Reserve (Fed) is the central bank of the United States that raises or lowers interest rates. 2008 Great Financial Crisis was a severe worldwide economic crisis that occurred in the early 21st century and is widely regarded as the most serious financial crisis since the Great Depression. Tactical Risk-Off is allocation to cash or cash equivalents. Long IG Fixed-Income refers to risk position on investment graded fixed-income bonds. Long HY Fixed-Income refers to risk position on high-yield fixed-income bonds. Long Equity refers to risk position on equities. The Bloomberg U.S. Treasury Index measures U.S. dollar-denominated, fixed-rate, nominal debt issued by the U.S. Treasury. U.S. Federal Funds Effective Rate is the interest rate at which depository institutions lend reserve balances to other depository institutions overnight on an uncollateralized basis. U.S. 10-Year Real Yield is the difference between the U.S. 10-Year Treasury yield and the U.S. 10-Year breakeven rate, which is used as an estimate of the true yield of a bond after adjusting for inflation. Consumer Price Index (CPI) is used to measure the change in prices that consumers pay for goods and services over time. This data is aggregated by the U.S. Bureau of Labor Statistics. Consumer Price Index is used to measure the change in prices that consumers pay for goods and services over time. This data is aggregated by the U.S. Bureau of Labor Statistics. U.S. IG Corporate Bond Index measures the investment grade, fixed-rate, taxable corporate bond market. It includes USD denominated securities publicly issued by U.S. and non-U.S. industrial, utility, and financial issuers. Value refers to a security that appears to trade at a lower price relative to its fundamentals, such as dividends, earnings, or sales, making it appealing to investors. U.S. High Yield Corporate Bond Index measures the USD-denominated, high yield, fixed-rate corporate bond market. Securities are classified as high yield if the middle rating of Moody’s, Fitch, and S&P is Ba1/BB+/BB+ or below. Investment-Grade Bond is a bond with a credit rating of BBB- or higher by Standard & Poor’s or Baa3 or higher by Moody’s. It is judged by the rating agency as likely enough to meet payment obligations that banks are allowed to invest in it. Modern Portfolio Theory, known as mean-variance analysis, is a mathematical framework for assembling portfolio assets such that the expected return is maximized for a given level or risk. This is accomplished by utilizing diversification in investing. Long U.S. Treasury is represented by the Bloomberg U.S. Treasury: Long Index. Small Cap Equity is represented by the Russell 2000 Index. Emerging Market Equity is represented by the MSCI Emerging Markets Index. Large Cap Equity is represented by the S&P 500 Index. Investment Grade Corporates is represented by the Bloomberg U.S. Corporate Bond Index. International Equities is represented by the MSCI ACWI Ex US Index. Emerging Market Debt is represented by the Bloomberg Emerging Markets Hard Currency Aggregate Index. High Yield Municipal Bonds are represented by the Bloomberg Muni High Yield Total Return Index. U.S. Treasury is represented by the Bloomberg U.S. Treasury Index. High Yield Corporate Bonds is represented by the Bloomberg U.S. Corporate High Yield Bond Index. Investment-Grade Municipal Bondsis represented by the Bloomberg Municipal Bond Index Total Return Index. Commodities is represented by the S&P GSCI Total Return Index. Leveraged Loans is represented by the Morningstar LSTA U.S. Leveraged Loan Index. REITs is represented by the Dow Jones Equity REIT Total Return Index. Developed Market Equity is represented by the MSCI All Country World ex USA Index. Private Lending is represented by the Cliffwater Direct Lending Index. An investor cannot invest directly in an index. Unless otherwise noted, index returns reflect the reinvestment of income dividends and capital gains, if any, but do not reflect fees, brokerage commissions or other expenses of investing. investors cannot make direct investments into any index. Level 1 assets are financial instruments that have a value that can be easily determined based on observable market prices. These assets are highly liquid and can be readily bought or sold in a public market. Examples of Level 1 assets include common stocks, bonds, and currencies that are actively traded on public exchanges. Level 2 assets and liabilities are financial instruments that do not have regular market pricing, but their value can still be determined based on observable inputs. This includes quoted prices in inactive markets or using models that incorporate factors like interest rates, default rates, and yield curves. Level 2 assets and liabilities may require more judgment to determine their fair value compared to Level 1 assets. Examples of Level 2 assets include certain types of bonds, mortgage-backed securities, and derivative instruments. Level 3 assets are financial instruments that have the least amount of market pricing information available, and their value is determined primarily through models and unobservable inputs. Market participants’ assumptions are used to price these assets or liabilities because there is no readily available market information on them. Level 3 assets are the most difficult to value and are subject to a higher level of judgment and estimation. Examples of Level 3 assets include complex derivatives, structured products, and private investments.Private debt refers to loans that are usually provided by non-bank investors to borrowers. Private debt is an alternative form of financing that companies can use to raise capital for various purposes such as funding growth, expanding working capital, or financing real estate development. Alternative assets are financial assets that do not fit into traditional investment categories such as stocks, bonds, and cash. Alternative investments can include private equity or venture capital, hedge funds, managed futures, art and antiques, commodities, and derivative contracts. Real estate is also commonly classified as an alternative investment.
Bayntree Wealth Advisors, LLC (‘Bayntree’) is an SEC Registered Investment Advisor. Such registration does not imply a certain level of skill or training and no inference to the contrary should be made. Bayntree’s advisory fees and risks are fully detailed in its Form ADV Part 2A (Brochure”), which is available upon request. This material may not be published, broadcast, rewritten or redistributed in whole or part without express written permission. Bayntree and Redwood are not affiliated.

Contact Us Bayntree Wealth Advisors 7001 N. Scottsdale Rd., #2055, Scottsdale, AZ 85253 480.494.2750 | bayntree.com
