
EXISTING CONDITIONS


POPUlAtIOn
Population is the first of ten elements required by the state’s Comprehensive Plan Enabling Act of 1994. The purpose of this element is to provide a baseline analysis of the ways in which the county’s population has changed over time and how any such trends and projections may affect future planning needs. This chapter provides an overview of historic population growth trends and future projections, general demographics (i.e., sex, age, race, education), as well as general household and income characteristics. The majority of this data is sourced from the 2010 and 2020 American Community Survey’s (“ACS”) 5-year estimates, in addition to historical decennial Census datasets. Careful consideration of the background information in this chapter helps to ensure that the ever-changing population dynamics of the county will be adequately addressed in future community planning decisions.
GROWTH TRENDS
Population growth in the tri-county region has been rapid since 1980. However, since 2000, Berkeley and Dorchester counties have experienced the greatest growth by 65% and 69% respectively while Charleston County only grew by about 33%. Both land availability and historically lower prices in both counties were traditionally influenced by the more rural nature and distance from downtown Charleston and the coastal communities. However, both Berkeley and Dorchester counties are equally now challenged by housing demands and infrastructure to serve development of that same land as Charleston County.


The growth trend for all three counties was relatively flat in the nineties, which can likely be attributed to the ongoing recovery from Hurricane Hugo in September 1989 and the closing of the Charleston Naval Base in 1996. These two major shocks cost the area lives, property and jobs. The region responded
by coming together to rebuild what was lost, diversify the economy to become more resilient, and market itself to the world. By the time the new millennium began, the stage was set for explosive growth that has continued through international conflict, the Great Recession and COVID-19.
The S.C. Revenue and Fiscal Affairs Office projects the region will continue its upward climb in population. Berkeley County has been growing at an average rate of 3.7% per year since 1980. The population projection in Figure 2 depicts projections by SCRFA with an average growth rate of 2.5% per year, which may be conservative. Over the past several decades, growth has consistently exceeded those projections. For example, the state projection for 2035 a decade ago was lower than the actual population reported in the 2020 census. Thus for the purposes of this plan, the population in 2040 has been estimated to be closer to 399,000, even as high as 450,000. In either case, Berkeley County’s population will constitute about onethird of the region’s population in 2040.

DEMOGRAPHICS
SEX
According to the ACS 5-Year estimates, the distribution of males and females from 2010 to 2020 remained consistent in Berkeley County, with 50% male and 50% female in 2010, changing slightly to 49.7% male and 50.3% female in 2020.
AGE
From 2010 to 2020 (Figure 3), the median age of residents in Berkeley County rose from 34.3 years to 36.5 years. Though the tri-county region and state as a whole also experienced an overall increase in median age over this time period, Berkeley County continues to have a comparatively slightly younger population.

To illustrate the increase in median age in Berkeley County, Figure 4 shows a breakdown of all residents by various age brackets as a percentage of the total population. The increase in the county’s median age can be attributed to the increase of residents in the upper age brackets, particularly in the 65+ age bracket as well as the decrease in the lower age brackets (under 25 years old). This is likely due to a combination of aging of residents, the increase in retirees through in-migration, and younger adults waiting to have kids.
The first members of the baby boomer generation, defined as being born between 1946-1964, began turning 65 in 2011. The 65+ age cohort will likely continue growing

as that generation ages. If this trend persisits over the next ten to twenty years, Berkeley County will need to accommodate an aging and elderly population. This will involve a number of initiatives including improved access to health care, expanding assisted living facilities, ensuring reliable transportation, and improving other essential social services.
RACE AND ETHNICITY
The racial and ethnic composition of Berkeley County (Figure 5) remained relatively unchanged from 2010 to 2020, with the majority of residents identifying as white (67% in 2020), and about 23% of residents identifying as Black or African American. There was a slight increase in the Hispanic or Latino population, which increased from 5.4% in 2010 to 6.8% in 2020.
LANGUAGE SPOKEN AT HOME
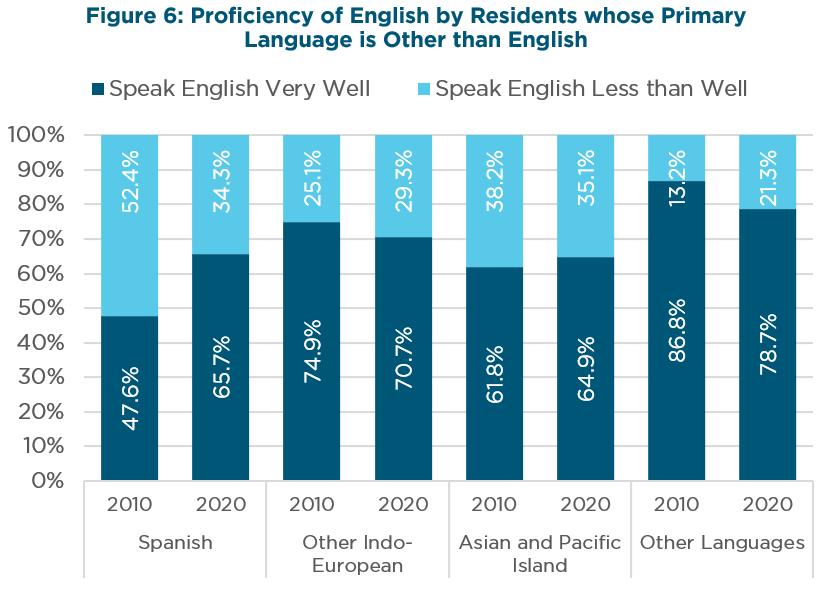
As Berkeley County continues to diversify, the language gap between English and nonEnglish speaking residents will only widen as the Hispanic or Latino population increases. In 2020, of Berkeley County residents ages five and over, 97% either speak only English or speak English very well. Spanish remains the second most common language used in Berkeley County households behind English. As seen in Figure 6, the number of Spanish speaking residents who are able to speak English very well increased by nearly 20 points between 2010 and 2020. While this is an encouraging trend, continuing to provide translation and education for residents to be bi-lingual would help overcome these language barriers.


Photo/File
HOUSEHOLD SIZE AND CHARACTERISTICS
In 2020, the average household size in Berkeley County was estimated at 2.75 persons. As seen in Figure 7, this was higher than Charleston County at 2.42 persons and South Carolina at 2.53 persons, but slightly lower than Dorchester County at 2.80 persons per household. Despite the growth Berkeley County has experienced since 2000, the average household size has remained relatively consistent.
HOUSEHOLD TYPES
The U.S. Census categorizes households as either family- or non-family-type households based on the relationship between occupants. Family-type households can then be categorized by the householder type which include: married couple family (Married); male
householder, no wife present (Male Only), or female householder, no husband present (Female Only).
Between 2000 and 2020, the total number of households in Berkeley County increased by about 60% or 30,000. Figure 8 shows that Married and Non-Family households accounted for a majority of this increase. Surprisingly, non-family households increased by a similar number as married households, which is more than double the rate. This trend will have long-term implications as it affects median household income, number of children, and tenure trends.
Berkeley County had a family to non-family ratio of about 71:29 in 2020 with married households consisting of approximately 52% of the county’s overall total households. This ratio is quite different from South Carolina which had a ratio of about 65:35 in 2020. With

South Carolina being a popular destination for retirees, this is not surprising as households with individuals living alone are classified as non-families.
HOUSEHOLDS WITH CHILDREN
Despite the continuous increase in total households, the percent of households with children has experienced a noticeable decline since 2000. Figure 9 shows an increase in all household types between 2000 and 2020. Because of the rapid growth in Female Householder Types as a percent of total households in Berkeley County, the percent of households with children declined by approximately ten points since 2000. . The number of married households with children declined between 2000 and 2010 by nearly a thousand households. As a result, married households with children increased by only 10% between 2000 and 2020 while the total number of married households (with and

without children) increased by over 40% during the same time period (Figure 8). This indicates that people are moving to Berkeley County, but less are families with children or possibly seniors
HOUSEHOLDS WITH SENIORS
The percent of households with one or more occupants over the age of 60 increased from 28% in 2010 to 38% in 2020. Despite this increase, the county’s percentage of households with seniors was still less than the state (43%) in 2020. As seen in Figure 10, nearly all household types with seniors, aside from male only households, increased by around 10-points between 2010 and 2020. This supports the notion that many areas in South Carolina, including Berkeley County, are retirement destinations although about 9% of householders living alone in Berkeley County in 2020 were over the age of 65 as opposed to 12% in South Carolina.


Photo/File
LIVING ARRANGEMENTS
The living arrangements of Berkeley County residents (18 years and older) can provide important insight on the future stability of the households within the County. As seen in Figure 11, about half of all households in Berkeley and Dorchester Counties in 2020 were married couples. About 10% of Charleston County households were other non-relative households which is nearly double that of Berkeley County. Overall, the composition of living arrangements in Berkeley County were in line with state trends.
EDUCATIONAL ATTAINMENT
One of the most significant indicators of a person’s likelihood for financial success and well-being is educational attainment. Higher degree attainment leads to higher incomes and dramatically decreases the chances of an individual living in poverty. All ACS Educational Attainment estimates are for population 25+ years old.
Figure 12 shows a significant increase in educational attainment for Berkeley residents. The percent of residents with an Associate’s degree or higher rose from 27.2% in 2010 to 35.6% in 2020. The on-time graduation rate improved from 2010 when only 67.9% graduated in four-years. In 2022, 84.3% of students graduated on-time. That growth means more residents are prepared for the high-wage, high-growth jobs that require additional education beyond a high school degree.


The impact of degree attainment on earnings is depicted in Figure 13. The earnings of a resident with a bachelor’s degree are 54% higher than those of a high school graduate. Over the course of a career that variance will equate to hundreds of thousands of dollars in additional earnings.
When looking at degree attainment by race and Hispanic or Latino origin in Figure 14, certain disparities emerge. For example, only 75.8% of Hispanic or Latino students graduate from high school. Also, the only groups who

have more than a quarter of their population earning a bachelor’s degree or higher are Asians and Whites.
Figure 15, shows the percentage of the population, 25 years and over, in poverty by degree attainment. Someone who has not graduated high school is seven times more likely to be in poverty than someone with a bachelor’s degree or higher. It also shows that graduating from high school cuts one’s chances of being in poverty in half, compared to those that do not graduate high school.

Though the connection between degree attainment and earnings is strong, some students do not have the grades, desire, or resources to pursue advanced degrees. In these cases, every effort must be made to ensure the students that are graduating from high school are career-ready. According to the 2021-2022 S.C. School Report Card, only 45.3% of Berkeley County’s graduating students are career-ready, compared to 62.8% in the state. Its imperative non-college bound students graduate with the skills to enter the workforce.

One way the Berkeley County School District has worked to improve these outcomes is through Career and Technical Education (CTE). CTE offers studies in a wide variety of subjects including health science, hospitality and tourism, manufacturing and STEM subjects. Students enrolled in CTE classes have opportunities to earn certifications, gain a better understanding of what careers in their chosen fields require and acquire the skills to begin their journey. These programs can better equip students for a career directly from high school, as well as prepare them for success in college. Keeping the curriculum of the CTE courses aligned with the needs of the regional business community will be key to ensure their continued effectiveness. Also, students and parents must be made aware of the CTE tracks of study and the opportunities they are intended to open up for graduates.
EDUCATION
A student’s educational journey begins well-before they enter the Berkeley County School District system. A child entering kindergarten prepared to learn is key, not only to a successful beginning of their scholastic career, but as a strong indicator of their future success as well. According to the 2021-2022 SC School Report Card, 34.7% of Berkeley students demonstrated readiness to learn based on the Kindergarten Readiness Assessment (Figure 16). When broken out by domains, only 20.7% of students are ready for mathematics and 28.6% are ready for language and literacy learning. Increasing access to high-quality, affordable, preschool education for three and four-year-old would be beneficial in ensuring more of the county’s children are ready to learn as they enter kindergarten.


Photo/File
Another important indicator of a child’s future success is whether or not they are reading at grade level by the end of thirdgrade. According to a landmark report by The Annie E. Casey Foundation in 2010, students are “learning to read” through third grade, after that point they are “reading to learn.” Half of the printed curriculum in the fourthgrade classroom is incomprehensible to a student not reading at grade level. Alarmingly, students who are not proficient in reading by third grade are four times more likely to drop out of high school than their proficient counterparts.
The SC School Report Card tracks second grade students who are on track for success in the English Language Arts (ELA) by the third grade. In the 2021-22 school year, 52.8% of second graders were on track for success in ELA (compared to 51.9% statewide) and only
39.3% on track in mathematics (compared to 54.7% statewide). Those children who are not on track should be identified and given additional attention to get them on grade level before the end of third grade. This would better their chances for future academic success.
BERKELEY COUNTY SCHOOL DISTRICT
The Berkeley County School District (BCSD) has had to accommodate the rapidly growing population outlined earlier in this section. The majority of students that reside in Berkeley County attend public schools. According to the S.C. Department of Education, enrollment has grown by about 20% from 2012 to 2022 (Figure 17). When compared to the overall County population increase of approximately 32% between 2010 and 2021, this increase seems a bit low.

In 2022, Berkeley County voters approved a one-percent sales tax to fund school construction projects to accommodate that 20% growth in enrollment. The tax will be in place for seven-years and will pay for three new schools, additions to four-existing schools and improvements to each high schools’ athletic facilities.
INCOMES
Berkeley County experienced a 28.9% growth in Median Household Income (MHI) from 2010 to 2020. It is now slightly higher than the U.S. median household income and, as seen in Figure 18, trails only Charleston County in the region. Having a higher MHI than the U.S. is good news for residents and can support recruiting employees to the area.

Incomes by household and family type can provide valuable insight on the economics of specific households. Figure 19 compares the county’s overall MHI ($65,433) with the different household types, highlighting the discrepancies in income between married- and singleincome households. Male only, female only, and non-family type households all had a considerably lower MHI ranging from $15-30,000 less than the county overall. Most notably, female only households earned nearly $20,000 less than their male counterparts and less than half of the county’s median household income in 2020.
Households with children appear to have mixed impacts on the income levels of each household type. Also seen in Figure 19, married-type households with children had a slightly higher median household income than the overall average for married households. In contrast, female only households with children earned about $5,000 less than the overall average for female only households.
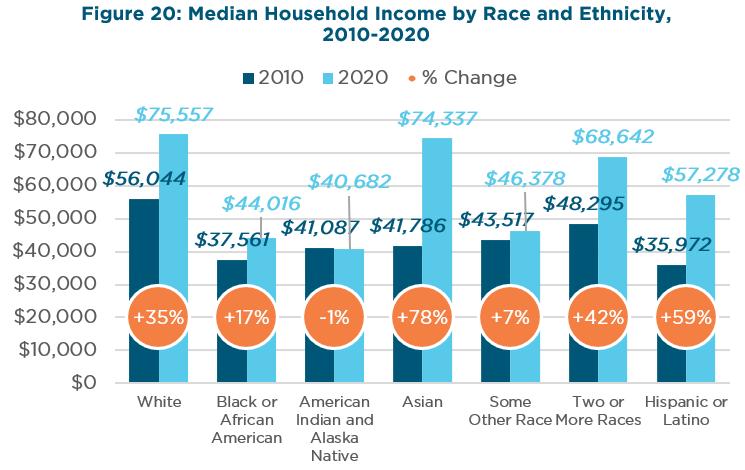
When looking at MHI by Race and Hispanic/Latino origin in Figure 20, a large disparity emerges in the gains experienced. American Indian and Alaska Native households have actually seen their MHI decrease by 1% from 2010 to 2020. The largest income gains were seen by Asian households, whose MHI grew 78% and Hispanic/Latino households who saw their MHI grow by 59%. Black or African American households saw their MHI grow by 17% to $44,016. This still lags the overall MHI in Berkely County in 2020 by $31,000.
The region recognizes efforts are needed to ensure all groups are benefitting from the growth and prosperity the county has seen in recent years. As discussed earlier in this chapter, ensuring students are ready to learn as they enter kindergarten and reading on-level by third grade are important indicators of a successful life journey. Both increasing educational attainment and having a school system that produces career-ready graduates will help the MHI increase for all groups.

HOUSInG
This element provides an analysis of current and historical housing data for Berkeley County, including housing unit counts, age, types, condition and occupancy. Additionally, it analyzes the overall affordability of housing within Berkeley County compared to residents’ income levels. Data provided is primarily based on the 2000 Decennial Census, 2010 and 2020 5-year American Community Survey (ACS) estimates, and supplemented by other sources, such as the Charleston Trident Association of Realtors (CTAR) and Berkeley County.
HOUSING TRENDS
Just as Berkeley County’s population has boomed over the past two decades, so has its housing market. In 2000, there were approximately 54,700 housing units in Berkeley County. This number increased to 70,000 by 2010 and 86,000 by 2020; a 57% increase (or about 3% growth per year). However, the impacts that the Great Recession had on the local housing market can be seen in Figure 21 as the annual increase in housing units was slower between 2008-2010 and by 2012 halted with 0% growth. It was not until 2016 when the housing market regained its momentum again, adding over nine thousand units in just four years.
AGE OF HOUSING
Similar to Berkeley County, Charleston and Dorchester Counties experienced an expansion in the local housing market as well. Figure 22 shows the percentage of housing constructed by decade in each county or simply, the age of housing, further illustrating the significance that the recent housing boom has had on the region’s housing stock trying to keep up with population growth. Despite a slow start in the early 2010’s, over one fourth of existing housing units were constructed between 2010-2019, due in part to the development of large, master-planned communities such as Nexton and Cane Bay. Approximately 48% of all homes in Berkeley County have been built since the year 2000, compared to 51% in Dorchester County and 38% in Charleston County.


Figure 22: Diversity of Housing Age by Construction Decade in the Tri-County Region
HOUSING TYPES
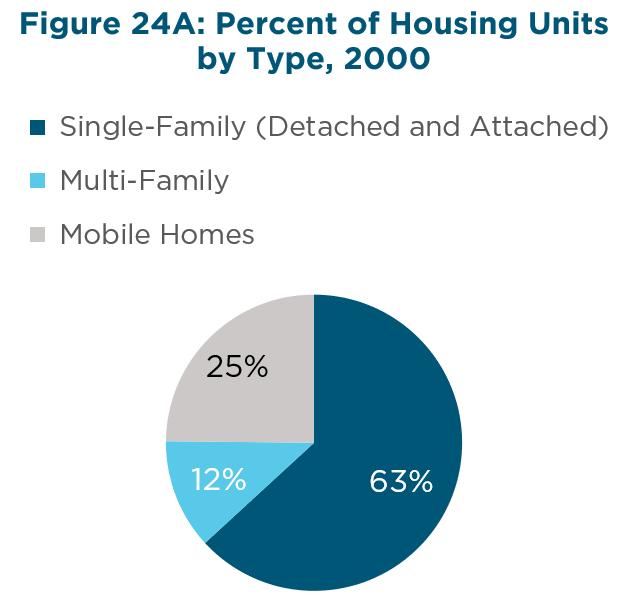
Comparing proportions of housing types between 2000 and 2020 provides a more detailed look at exactly which types of housing units have been constructed since 2000. As seen in Figure 23, single-family detached units were responsible for the largest numerical increase in housing units between 2000 and 2020 (+24,000 units) while structures with 10 or More Units (multifamily) had the largest percent increase (+202%) during the same time period. Although the sheer number of single-family (detached) housing units dwarf most other housing unit types, mobile homes remain a significant portion of Berkeley County’s housing stock with nearly 15,000 units (or 17% of total) in 2020, as seen in Figures 24A-C
The predominance of single-family units in Berkeley County can present a challenge to current and prospective residents, as these unit types may not meet the needs of all individuals and families. Young professionals, beginner families, single-income households, elderly, and disabled individuals are often priced out of this type of real estate and/or may not want the maintenance responsibilities that come with a single-family home. For that reason, maintaining a diverse mix of housing types ensures that households of various ages and incomes can find housing within Berkeley County.
Note: Many of the multi-family unit types, such as 2 units, 3 or 4 units, and 5 to 9 units fluctuated between 2000, 2010, and 2020, potentially due to the demolition of older units or the reclassification/definition change by the US Census over the years.


This aerial photo captures Berkeley County’s diverse neighborhoods with varying densities and housing types. (Photo/BCED)
CHARACTERISTICS
As of 2020, the vast majority of occupied housing units in the county have plumbing and kitchen facilities as well as telephone service. As shown in Figure 25, less than one percent of Berkeley County housing units do not offer complete plumbing and kitchen facilities. Furthermore, telephone service has become increasingly available in homes throughout the county, likely due to the transition away from land-lines, with less than 2% of units still lacking this service in 2020.
However, another critical service for homes is broadband internet accessibility. This need was heightened during COVID-19 when many employees and students suddenly had to start working and learning from home. Homes without a broadband connection were isolated like never before and at a higher risk for unemployment and falling behind at school. This event highlighted the disproportionate access to a broadband service, particularly in rural areas.
Figure 26 shows that access to Broadband has increased significantly from 2015 to 2021, however, over 1-in-10 residents of Berkeley County still do not have an internet subscription. Figure 27 shows the disparity that exists with internet subscriptions based on income levels. The percentage of households making less than $20,000 with a broadband subscription almost doubled from 2015 to 2021 yet still lags behind those households making over $75,000 by 32 points.


HOUSING OCCUPANCY AND TENURE
OCCUPANCY AND VACANCY
As seen in Figure 28, the percentage of Berkeley County’s housing units that are occupied increased 6-points between 2010 to 2020. This increase is especially impressive as the total housing units increased from 70,129 to 86,274 (as seen previously in Figure 21) during this same time period. This shows that the demand for housing is strong and able to absorb the new units that come to market.
TENURE TYPE
In the past several years, Berkeley County has been slowly trending toward a community with more homeowners and fewer renters. Owner-occupied units constituted 72.3% of the housing in 2020. This was a 2-point increase from 2010. Figure 29 shows that both Berkeley and Dorchester Counties have a

higher ownership percentage than Charleston County by more than 10 points. This is likely influenced by lower home prices found away from the coast and the larger inventory of multi-family housing found in Charleston County. In 2020, 29% of housing units available in Charleston County were multifamily units compared to only 13% in Berkeley County (as seen previously in Figure 24C).
There are several factors that can impact the tenancy of an area, most notably, the location and affordability of a community. Urban areas, such as much of Charleston County, typically have higher renter occupancy due to limited land area, proximity to employment, amenities, and services, land value, and zoning regulations. Closely related to the
predominance of single-family units, young professionals, beginner families, single-income households, elderly, and disabled individuals often either prefer to rent (possibly due to low maintenance, access to community amenities, proximity to activity centers, or proximity to workplace) or cannot afford or maintain a home. With the cost of rent, student loans, and other monthly expenses, coupled with the increased competition from institutional investors, it is becoming increasingly difficult for renters and first-time homebuyers to actually enter the market for homeownership. This is a particular challenge for young professionals and beginner families. Despite being a national challenge, the decreasing affordability of the Tri-County region has been a growing concern.
Owner-Occupied Renter-Occupied
Figure 29: Tenure of Housing Units by County, 2020
HOUSING VALUE AND COSTS
MEDIAN HOME VALUE
According to the U.S. Census, the median home value (MHV) of owner-occupied housing units provides estimates for the median value of owner-occupied properties only, excluding mobile homes, houses with businesses or offices, houses on 10 or more acres , and housing units in multi-unit structures. In 2020, the MHV in Berkeley County was $197,300. This was slightly lower than Dorchester County at $213,000 and much lower than Charleston County at $334,600. As seen in Figure 30, the MHV increased by over 100% between 2000 and 2020, however, Berkeley and Dorchester County have not grown at quite the same pace as Charleston County.
Median home values provided by the US Census however are not quite as telling as actual market conditions. Comparing the US Census median home value in 2020 with the median sales price (reported by CTAR) in 2020 reveals whether homes sold in Berkeley County in 2020 were being sold at or near the reported MHV. Based on this comparison, there was about a 33% difference between the “on paper” median home value and the “in reality” of reported median sales prices. This is compared to Charleston County (11% difference) and Dorchester County (21% difference).
MEDIAN SALES PRICE
Continuous increases in the sale prices of homes in the Tri-County region have compromised the attractive affordability of the Charleston area. As reported by the Charleston Trident Area Realtors (CTAR) 2021 Annual Report, the median sales price in Berkeley County rose 49% between 2017 and 2021 while Charleston and Dorchester Counties experienced smaller increases of 35% and 38%, respectively, as seen in Figure 31. Between 2020 and 2021, the annual percent increase doubled across all three counties. These substantial increases are being attributed to the impacts of COVID-19 on the regional market as historic low interest rates and the flexibility of working remotely caused a migration from expensive cities and states to the Charleston region.


Note: CTAR released the 2022 Annual Report in early January 2023, however, the 2021 Annual Report was used due to the 2022 report still subject to change as data continues to be reported.
The CTAR 2021 Annual Report also discloses median sales prices of individual market areas throughout the county. Figure 32 shows the median sales price and percent change between 2017 and 2021 of the five market areas within Berkeley County which include: Daniel Island, Goose Creek/Moncks Corner, Hanahan, Rural Berkeley County, and Wando/Cainhoy. It is important to note that the doubling of sales prices in Rural Berkeley County was the greatest change in median sales prices between 2017 and 2021 for the entire CTAR region, which encompasses all of Berkeley, Charleston, Colleton, and Dorchester Counties.
With the ongoing development of masterplanned communities, like Nexton and Cane Bay, Berkeley County was well-positioned to benefit from a booming housing market. 31.7%
of homes sold in 2021 were new construction, slightly down from 33.1% in the previous year and compared to Charleston County (12.6%) and Dorchester County (21.6%). The large supply of newly constructed homes has allowed for Berkeley County to meet the demand of the region’s rapidly growing population. With the increase in supply of housing, Berkeley County will continue to experience growth in the population and potential labor force which will expand the local economy by attracting nonresidential development and industries that can increase in the local tax base.
RENT
The high demand for housing in the Tri-County region is an important factor that has also caused a continuous rise in rents. Figure 33

highlights the significant increases in median rents from 2010 to 2020 in Berkeley, Charleston, and Dorchester Counties. Between 2010 and 2020, rents in Berkeley County increased by about 38%, second to Charleston County which increased by 41%.
Residents rent for a number of reasons, including being new to the area, not being able to afford the downpayment on a home, or quality for a mortgage. Unlike a homeowner who is able to see their personal wealth grow through the appreciation of their property, a renter does not benefit from increases in rent. In fact, rising rent puts increased financial pressure on the renter, shrinking the pool of available housing they can afford and pushing people further from their jobs in search for more affordable options.

AFFORDABILITY
Affordability in the context of housing is an often-misunderstood term. There is no standardized dollar amount that would be “affordable” to all individuals or all households. Housing affordability is directly related to annual household income; and just as incomes can vary greatly from household to household, so does what is considered affordable housing.
As a result, the U.S. Department of Housing and Urban Development (HUD) defines affordability based on a percentage of a homeowner or renters’ income. A housing unit is considered ‘affordable’ for a given individual or family if housing expenses (i.e., rent, mortgage, taxes, insurance, utilities) do not exceed 30% of the household’s combined monthly income. Conversely, individuals and/ or families are considered “cost-burdened” when housing costs exceed 30% of household earned income.
Cost-burdened households can experience serious challenges due to the need for the same financial resources to cover other basic

necessities such as food, transportation, and medical care. Thus, ‘affordable housing’ represents housing that an individual, family, or household can comfortably afford based on their total household income, which may be less than the 30% measure used by HUD. Figure 34 reveals that in 2020, Berkeley
County had a lower percentage of total costburdened households than Dorchester and Charleston counties, as well as South Carolina. It also reveals that between 2010 and 2020, the percent of cost-burdened households has declined statewide. Despite this decline, which could be a result of increasing wages in the region, more than a quarter of Berkeley’s households are cost-burdened.
In the past, it has been thought that affordability was an issue in the more urbanized areas of the region, primarily Charleston County. However, in 2020, affordability issues were a concern across Charleston, Berkeley, and Dorchester Counties, particularly for renters, as shown in Figure 35. Roughly half of all renters in the Tri-County region were cost-burdened in 2020 compared to only about a fourth of homeowners with a mortgage and only about an eighth of all homeowners without a mortgage.
It is important to note though, that just as the U.S. Census standard for Median Home Values is not an accurate reflection of actual sales prices, the measure used for a household

being “cost-burdened” does not account for other debts that affect the cost of living such as car payments, school loans and insurances.
As discussed throughout this section, the affordability of housing is contingent on the cost to income ratio. Figure 36 compares the percent change between median household incomes by tenure with the increases in median homes values and median rents from 2010 to 2020. These comparisons reveal that the median home value (MHV) and median monthly rent (MMR), or housing costs, have increased more than median household incomes (MHI). Although the proportion of cost-burdened households in Berkeley County has declined from 2010 to 2020 , these gaps between the rising costs and rising incomes are not encouraging trends. If these trends continue, a larger percentage of households in Berkeley County may be at risk of becoming cost-burdened in the future.


Photo/File
HOUSING AND TRANSPORTATION COSTS
Another relevant, yet often overlooked, factor regarding the cost-ofliving is the added cost of transportation, which varies considerably by location and can consume a large portion of a household’s financial resources. Transportation can be significantly more expensive for rural households where individuals must own and maintain a personal vehicle and travel long distances for basic goods and services. Alternatively, more urbanized areas with access to public transit frequently offer more affordable transportation options.
The Center for Neighborhood Technology (CNT) Housing + Transportation (H+T) Affordability Index® captures the location-based variability of transportation costs and illustrates a more comprehensive view of the cost of living by capturing both of these measures. In Berkeley County, there are 1.99 automobiles per household with annual transportation costs of $15,188. In Figure 37, the H+T Index reveals that an average of 49% of household incomes in Berkeley County are expended on housing and transportation. The H+T Affordability Index has determined a standard measure of ‘affordability,’ stating that a combined H+T cost exceeding 45% of household income is not affordable. According to this measure as well, the cost of living in Berkeley County is generally not affordable.
RENTER TO HOMEOWNER
Throughout this section, the focus has been on owner-occupied and renter-occupied costs and incomes. However, it is important to discuss the affordability and challenges of the transition from renter to homeowner. As mentioned in the Housing Tenure section, it has become increasingly difficult for renters and/or first-time homebuyers to qualify or afford the initial investment to purchase a home. Common obstacles include: inability to quality for a mortgage (i.e., poor credit score, too high of a debt-to-income ratio, etc.), difficulty saving for a down payment due to already high monthly housing costs, and the ability to compete with institutional investors or cash only offers.
As seen in Figure 38, the number of homeowners between the ages of 15 and 24 in Berkeley County decreased by 35% from 2000 to 2020. Although the number of homeowners between 25 and 34 increased between 2000 and 2020, the percentage of all homeowners decreased from 14% in 2000 to 12% in 2020. While these changes could be the result of numerous factors, the decreased ability to purchase a home due to rising prices is likely a top cause.


LOCAL REGULATIONS HINDERING THE DEVELOPMENT
OF AFFORDABLE HOUSING
While a free market is generally assumed to respond appropriately to the demand for products and services, this response mechanism can be hindered and affected by external influences and factors. In the case of housing, many factors beyond demand impact the supply and cost of housing, including land use controls, funding availability and finance, as well as permitting, availability and cost of materials, construction, land conditions and related regulatory factors.
State and local governments can be most effective in promoting positive change toward housing affordability in the realms of land use, permitting, construction and similar regulatory factors. At the local level, some of the County’s current land development regulations may be inadvertently and detrimentally impacting the development of affordable housing for current and prospective residents.
One of the most common obstacles to the development of affordable housing is self-inflicted ‘exclusionary zoning,’ which is often the unintended consequence of typical suburban residential zoning standards. Bulk and area requirements such as minimum lot sizes, minimum setbacks, parking requirements and open space set asides result in large and increasingly expensive residential lots and homes. Few, if any, low–to-moderate income residents may enter this type of housing market as homeowners. Additionally, few if any real estate developers can successfully develop affordable rental housing under these restrictions. Typically, they are unable to develop the necessary quantity or density of housing required to make the investment financially feasible without substantial governmental subsidies to offset costs.

Illustration/Union Studio
MARKET-BASED INCENTIVES TO ENCOURAGE DEVELOPMENT OF AFFORDABLE HOUSING
SIX AFFORDABILITY PRINCIPLES
In 2019, the American Planning Association’s Housing Initiative identified six principles that can be considered at the state or local level to increase availability of affordable housing, including:
1. Modernize State Planning Laws: Update state laws to promote local planning efforts and provide housing resources to solve our most pressing affordability challenges.
2. Reform Local Codes: Modernize codes and rules to respond to the growing need for more housing, no matter the type or cost.
3. Promote Inclusionary Growth: Provide everyone with a fair opportunity to access affordable housing and economic prosperity, while addressing the effects of gentrification.
4. Remove Barriers to Multifamily Housing: Adopt local plans that not only expand family housing choices but also make them easier and more affordable to access.
5. Turn ‘NIMBY’ into ‘YIMBY’: Transform community engagement and involve everyone in the planning process from the start.
6. Rethink Finance: Promote innovative thinking about how to fund affordable housing in the future.
FUTURE HOUSING NEEDS
This section covers housing unit supply and demand projections for years 2025, 2030, 2035 and 2040. Total Housing Units Projections were calculated by determining the annual percent change in total housing units from 2000 to 2020, which when averaged equaled a 2.24% yearly increase. This multiplier was then used to determine housing projections in 5-year increments beginning in 2025 and ending in 2040. These housing unit projections assume that recent housing trends will remain constant over the next 20 years.
Housing Unit Demand Projections were calculated by dividing the SCFAO and BCDCOG population projections by the average household size (2.77 persons) from 2010 to 2020. These projections similarly assume that housing unit increases and average persons per household will remain relatively constant through 2040.

Based on these calculations, housing unit demand may eventually increase at a faster rate than housing unit supply, as shown in Figure 39. These calculations indicate that from 2025 thru 2035, there may be a housing unit surplus, meaning some portion of units would be vacant. However, the projections indicate that around 2040, the demand for housing may outpace supply, creating a shortage of units. Photo/File

ECOnOmIC DEVElOPmEnt
A county’s economic stability is exemplified by the well-being of the individual residents, businesses and industries located there. A strong, diversified economy significantly contributes to increased economic resilience among local residents, and businesses, in the event of unforeseen circumstances, such as the relocation of a major employer or the recent global pandemic. This section takes an in-depth look at the economy in Berkeley County.
Note: This Chapter will reference several different data sources, therefore, numbers across these sources may not match up with one another likely due to different methodologies, parameters and/or definitions.
BERKELEY’S STATE OF THE ECONOMY - AT A GLANCE
According to the Charleston Regional Data Center:
• The number of Berkeley County residents employed in 2020 was about 98,500 while about 5,600 were actively seeking employment.
• The unemployment rate in 2020 was about 5.4%, compared to 2.5% in 2019.
• Employers and businesses in Berkeley County employed about 55,000 people in 2020.
• Berkeley County’s Gross Regional Product (GRP) was nearly $8.65 million.
• Entertainment, Construction and Retail were the top employment industries in Berkeley County in 2022.
LABOR FORCE CHARACTERISTICS
The labor force is one of the most important factors when looking at the local economy. In 2020, it was estimated that 64.9% of the County’s total population ages 16+ were participating in the labor force (a.k.a. the participation rate). The participation rate of an area includes residents who are actively employed, actively seeking employment, or who are actively serving in the armed forces (military). Figure 40 compares the participation between Berkeley, Charleston, and Dorchester Counties as well as South Carolina. All three counties have a much higher participation rate than the state as a whole.
The decline in participation rate, albeit a nationwide trend, does raise concerns over
the future productivity of the local economy. Maintaining a stable participating labor force is crucial for the sustainability and resiliency of a local economy as low participation can create worker shortages, supply chain issues, and low revenues.
In the aftermath of the COVID-19 pandemic and the “great retirement” it influenced, encouraging people to return to the labor force is key for employers to continue to grow their businesses. For those who were able to work, but choose not to participate in the labor force prior to the pandemic, the most common causes keeping them from working are a lack of transportation, insufficient wages or salaries to offset childcare, schedule flexibility, insufficient training, and/ or underemployment (wanting full-time but settling for part-time).

EMPLOYMENT BY AGE AND SEX
Figure 41 shows the 2020 employment status of Berkeley County residents ages 16+ by age brackets and sex. Naturally, the age brackets with the highest participation rates were between the ages 20 and 54. However, the discrepancies in participation rates between male and female of these age groups is noteworthy. The average participation rate for males ages 20 to 64 was about 84% while females was only 73%
The most notable observation when looking at the employment status by age was the unusually high number of people ages 60 to 64 that were unemployed. As this age group is on the precipice of retirement, this could cause hesitation by an employer who may want to hire someone long-term or by the
employee who may consider retiring early. In the wake of the COVID-19 pandemic, older workers may have chosen to retire early rather than risk their health and wellbeing.
UNEMPLOYMENT RATE
The unemployment rate of an area is the percent of people unemployed out of the civilian labor force (which excludes Armed Forces). A healthy unemployment rate of an area is generally accepted to be between 3-5%. An unemployment rate in this range is indicative of a strong labor market. Figure 42 shows the 2022 unemployment rates in Berkeley, Charleston, and Dorchester Counties were lower than both the state and the nation.
Between 2010 and 2020, the number of county residents employed was consistent

Note: The percent Unemployed in Figure 41 is NOT the Unemployment Rate but rather the percent of all people ages 16+ unemployed.
at about 60% of the total population ages 16+. Therefore, the approximate 3-point difference in the County’s participation rate between 2010 and 2020, as seen previously in Figure 40, was due to the decrease in the percentage of unemployed persons. This trend is likely to be further exacerbated following the COVID-19 pandemic as many workers have chosen to leave the workforce entirely. As discussed previously, residents ages 60 to 64 would be most susceptible to this partially due to ageism, them nearing retirement age, health-related issues, financial stability, and/or career burnout.
To better understand resiliency of the local labor force, data is used between 2007 and 2022 to capture and compare unemployment rates in pre- and post-recession and pre-

and post-pandemic. As shown in Figure 43, the unemployment rate in Berkeley County increased from around 5% in June 2007 to 11% by June 2009 in response to the great recession. It was 2015 before the unemployment rate returned to the prerecession levels. Several years later, the unemployment rate spiked from 3% in March 2020 to nearly 10% in April 2020 due to the initial shock of the COVID-19 pandemic. Unlike the aftermath of the recession, the unemployment rate returned to pre-pandemic levels by September 2021. Between June 2007 and June 2022, Berkeley County had an unemployment rate between 3-5% about a third of this 15-year time period.


Photo/File
INCOME
MEDIAN HOUSEHOLD INCOME
As discussed in the Population Chapter, the median household income (MHI) in Berkeley County increased by about 29% between 2010 and 2020. This measurement, along with per capita income, can help determine the economic vitality and gauge the potential spending power of residents and households in an area. The MHI in Berkeley County in 2020 was estimated at $65,443.
Figure 44 compares the recent income trends of Berkeley County households in 2010 and 2020. About half of all households in 2010 earned less than $50,000 in the previous year. By 2020, this decreased by about 10 points to 38%. Typically, shifts like this would be offset by small increases in the upper income brackets, however that was not the case in Berkeley County. The most notable shift between 2010 and 2020 was the doubling of households
earning over $100,000. This shift accounted for nearly all of the decreases in the percent of households earning less than $75,000. As of 2020, over one fourth of households earned over $100,000 in the past year.
PER CAPITA INCOME
Similar to the Median Household Income discussed in the Population Chapter, per capita income (PI) is another metric used to gauge the health of the local economy. Per capita income is the total income of an area divided by the total population. The CPI of Berkeley County in 2020 was about $45,454. This was much lower than the 2020 median household income of $65,544 since the CPI looks at individual earnings and does not account for having more than one wage earner in a household. Figure 45 compares the change in CPI by County between 2010 and 2020. Charleston County consistently had a consistently higher CPI than Berkeley and Dorchester Counties which remained very similar to one another.


POVERTY RATE
The Federal Poverty Levels (FPL) are set annually by the Department of Health and Human Services and are based on the number of persons in family or household. The FPL is then used to determine a households’ eligibility for certain programs and benefits. If the household’s total income is less than the established threshold for the applicable size, then every individual in that household is considered to be in poverty. The poverty rate for any given area is the percent of people considered to be in poverty out of the total population.
The US Census uses the Small Area Income and Poverty Estimates (SAIPE) to track the income and poverty levels of different geographies throughout the nation. Figure 46 shows the poverty rate from 2000 to 2020 for Charleston, Berkeley, and Dorchester Counties as well as South Carolina. It appears that the effects of the great recession impacted each county at different times. Whereas the poverty rate in


Berkeley County increased immediately in 2008, Dorchester and Charleston Counties did not see a rise in poverty until 2009 and 2010. Despite a few fluctuations, the poverty rate in Berkeley County remained lower than Charleston County and the state throughout this time period.
Figure 47 shows the number of Berkeley County families with and without children living below poverty level in 2020. Based on the FPL definition, the householder and each child within the family are all considered to be living in poverty. As shown in Figure 9 in the Population Element, there are over three times as many female households with children than there is male. With that being said, the discrepancies shown in Figure 47 between male and female headed families is not surprising.
Figure 48 breaks down the poverty rate by a number of attributes. The most likely age group to be in poverty are those under 18

years old. Growing up in poverty jeopardizes a child’s chances for a successful academic outcome as their homelife puts added pressure on their day-to-day existence and school becomes less of a priority. If a child in poverty is unable to have a successful academic career the chances of them remaining in poverty as an adult increase, creating a cycle that can last generations.
Also concerning is the poverty rate among females which is about 4-points higher than that of males. While this is not a surprising statistic due to the higher number of femaleonly families living in poverty, this continues to be a growing concern in the Tri-County region as a whole.
When broken down by race and ethnicity, the highest poverty rate was among Black or African Americans with American Indian and Alaska Native in a close second. These rates were almost twice that of Whites and three times of Asians.


EDUCATIONAL ATTAINMENT
The educational attainment of residents can be very influential in attracting businesses and industries to Berkeley County. A more educated workforce can provide knowledge and skillsets that manufacturing, research, and tech industries find appealing. As seen in Figure 49, over half of residents ages 25 and older had at least some college experience in 2020 with about one fourth of residents having earned a Bachelor’s Degree or higher. This was an increase of about 7 points from 2010 which is an encouraging trend. However, experience and trade skills are not reflected in these numbers and can be just as valuable as higher education degrees.
Educational attainment can also influence the economic situation of individuals, families, and households. Figure 50 shows that the unemployment rate among residents with less than a GED was much higher than residents with a GED or greater. While the number of residents with less than a GED has declined (Figure 49), there are still about 16,000, or one in every ten Berkeley County residents ages 25 and older, that have not obtained this certificate. This is an area of opportunity for Berkeley County.
Furthermore, residents with a higher educational attainment typically have higher annual earnings, as evident in Figure 51 The earnings of individuals directly impact the poverty rate as illustrated in Figure 52. These measurements show how educational attainment impacts the individual and household economy.


EMPLOYMENT
Berkeley County experienced tremendous growth in employment from 2000 to 2020. It is important to note that there are two measurements of employment growth: change in residents that are employed (Residents Employed) and the change in workers employed within or by Berkeley County employers (Workers Employed). These measurements are also related to commuter inflow and outflow trends.
COMMUTER TRENDS
Typically, communities would aim to have a net positive inflow of workers, where the number of workers employed is greater than the number of residents employed rather than vice versa, for a number of reasons including:
• A net positive number is an indicator of a strong local economy. It is a quantitative measure of the area’s ability to generate employment industries and jobs.
• Many workers spend money near their work location buying groceries, gas, and other basic items. This results in sales generation and tax revenue for the surrounding area.
• Residents’ ability to find employment close to home reduces commutes and demand on the region’s transportation infrastructure.
As seen in Figure 53, Berkeley County had just under 100,000 residents employed in 2020, compared to 55,000 workers employed by Berkeley County companies. While a sizeable portion of people live and work in Berkeley County, more commuters leave the County for work than jobs available within the County. Figure 53 also shows the change in

total employment of both residents employed and workers employed between 2000 and 2020. The small shifts around the recession and the pandemic suggest that the number of residents employed is fairly susceptible to national economic recessionary and expansionary periods. The number of workers employed however, does experience similar shifts, just not as drastically as residents employed.
Overall, the number of residents employed within and outside the county combined increased by 53% and the number of workers employed by companies within the county increased by 70% between 2000 and 2020. Both of these employment numbers are greatly influenced by population change. However, they typically do not follow the same year-over-year change, but rather grow
or recede in response to population trends, ideally over a longer span of time.
A resilient economy is able sustain employment despite national recessionary trends and have incremental, rather than drastic, declines The lack of drastic declines in Berkeley County’s employment is a strength and an indicator of a strong, healthy, and resilient economy.
In response to the drop in employment between 2019 and 2020, Berkeley County continues to recover from the pandemic and expand the economy. According to SC Dept. of Workforce and Employment, Berkeley County had an average of about 2,700 job openings a month in 2022. This highlights the willingness of the local economy to not only recover but exceed beyond pre-pandemic employment levels.
OCCUPATION OF RESIDENTS
Every job is classified into an occupation that reflects the type of job or work that the employee does. The US Census uses the Standard Occupational Classification (SOC) Manual to categorize similar occupations for easier comparison across different geographies. Analyzing these occupations can provide insight on the skillset of the local labor force and help tailor workforce development programs, activities, and/or recruitment events towards the needs of the market.
Figure 54 compares the percent of Berkeley County residents employed across the five main occupation classes between 2000 and 2020. Management, Business, Science, & Arts experienced the largest increase over this time period, with most other occupational classes decreasing in overall percent. Despite
these changes, Berkeley County continues to have a fairly diverse labor force as no one class has an overwhelming majority over the others. It is important to note that all occupational classes increased in the number of residents within that class, however, some classes experienced more growth than others.
Earnings by Occupational Class
Various occupations are naturally compensated differently based on a number of factors such as education, experience, labor intensity, job demand, benefits, etc.
Table 1 compares the 2020 average annual earnings of each occupational class and subclass in Berkeley County and South Carolina. Architecture & Engineering had the highest average annual earnings of all occupations in 2020, averaging just shy of $80,000 annually. In contrast, Farming, Fishing, & Forestry had the lowest average

annual earnings in 2020, averaging about $12,000 annually. This was about half of the state average for this occupation. Despite this discrepancy, most occupations in Berkeley County had average earnings of about +/- $2,500 to the state’s average.
CLASS OF WORKER
As seen in Figure 55, about three-fourths of residents employed in Berkeley County are private wage & salary employees. This was slightly lower than Charleston County and South Carolina, however, is offset by a higher percent of residents working in the government.
Note: Unpaid Family Workers account for less than 1% in each geography, and are therefore excluded from Figure 55.

EMPLOYERS
Figure 56 shows the change in the number of private businesses located in Berkeley County between 2000 and 2020 by business size (number of employees). The number of total businesses nearly doubled (+95%) between 2000 and 2020 whereas the total number of microbusinesses increased by 92%. Microbusinesses, which are businesses with 1 to 9 employees, make up about 70% of all private businesses in Berkeley County and are therefore essential to the stability of the local economy.
Berkeley County experienced large increases in the number of microbusinesses in 2002, 2007, and 2017. Each of these years had a net increase of over 100 new microbusinesses. Unsurprisingly, 2008 to 2011 were the only years that witnessed a net decline in the number of total businesses in Berkeley County, most of which was a decline in
microbusinesses. However, the demand for local services and amenities that microbusinesses and entrepreneurs often provide increased quite significantly in the post-recession years. As Berkeley County climbed out of the recession, the local economy not only recovered but expanded, having about 800 more private businesses in 2020 than in pre-recession 2007.
Employer Industries
There are hundreds of different types of industries that are used to classify employers within an area as large as Berkeley County. To better track the changes in employment across those employers, they are broadly categorized into industry clusters. These clusters reflect the business activity of the employer, not the type of job or work of the individual employee. The definition of each industry can be found on the Charleston Regional Data Center website.

TOP EMPLOYERS
Top employers in Berkeley County range from manufacturing to retail sales and utilities to governmental industries. These employers provide thousands of jobs to people cross the region.
According to a report from the SC Dept. of Employment & Workforce, the top 20 employers in Berkeley County in 2022 were (listed alphabetically):
• Benefitfocus.com Inc.
• Berkeley County Government
• Berkeley County Schools
• Berkeley Electric Cooperative Inc.
• Blackbaud Inc.
• Century Aluminum of South Carolina
• Hire Quest LLC
• Leidos, Inc.
• Lowcountry Grocers, LLC
• Lowes Home Centers, LLC
• Nucor Corporation
• Oak Tree, LLC
• Public Super Markets Inc.
• Santee Cooper SC Pubic Service Authority
• South Carolina Public Service Authority
• Thorne Research, Inc.
• United Parcel Service
• Volvo Car USA LLC
• W International SC LLC
• Wal-Mart Associates Inc.
As larger, national or international employers continue to locate in Berkeley County, this will further increase the desirability of Berkeley County and help solidify the Charleston metro area’s position in the international market.
Figure 57 shows the change in employment by the different industry clusters within Berkeley County that are used to simplify these analyses. The Construction, Education, Entertainment, and Retail industries have remained the top employment industries in Berkeley County. Each of these industries account for about 10-12% of the total workers employed by Berkeley County employers. However, some of the largest increases in employment were not necessarily in those industries. Between 2010 and 2020, the Construction, Entertainment, Software/Info. Tech., and Transportation & Logistics industries experienced the largest increase in employment, each expanding by over 1,600 employees.
The industries that experienced the largest percent increase between 2010 and 2020 were the Shipbuilding (+355%), Research (+300%), Furniture (+194%), Software/Info. Tech. (+144%), Back Office (+142%), and Transportation & Logistics (122%) industries.
Emerging Industries
In recent years, Berkeley County Economic Development (BCED) has helped set the stage for attracting new industries to Berkeley County. Their focus has been on five targeted industries: 1.
Recruitment and expansion throughout these industries has continually driven growth over the past decade. However, creating a competitive, supportive, and desirable environment for new and up-and-coming industries relies heavily on the talent, experience, and skillsets of the local labor force. Therefore, recruiting and retaining people with knowledge and higher education or skills is an important task for Berkeley County to pursue. Having a diverse network of companies, both large and small, is also crucial in establishing Berkeley County as an economic and industrial hub. The concentration of unique industries, like Aerospace, IT, and Biotech provides workers who consider moving to the region job security and reassurance that they have other options in the area to grow their career. Furthermore, the concentration of similarly skilled people provides an opportunity for professionals to meet and collaborate with one another, launch new companies, have new and innovative ideas, and make future investments in the community.

According to BCED, there has been $9.2 billion invested in Berkeley County and about 12,300 jobs created since the beginning of 2015. The following are recent examples of major investments that have occurred in Berkeley County.

GOOGLE & IT
Berkeley County boasts some of the region’s largest tech companies like Google, BenefitFocus and Blackbaud which fuel the region’s IT sector. Google has invested $2.9 billion since the original data center opened in 2007, the most recent of which was $1.1 billion in 2021. The success Berkeley County has experienced in this sector can be clearly seen in Figure 58, which shows that from 2010-2020, the Software/ Info. Tech. sector increased by 144% (or +2,000 jobs).
VOLVO
In 2015, Volvo announced a $500 million investment to build their first U.S. manufacturing plant along I-26. Their cumulative investment has now reached $1.2 billion, including the recent $118 million to produce the Polestar 3 electric vehicle.
BIOTECH AND MEDICAL MANUFACTURING
Med-Ally, a medical device manufacturer, announced a $2.4 million investment in 2018 for a new operating location in Berkeley
County, which is expected to create 90 new jobs. As mentioned before, companies like Med-Ally are attracted to areas with high concentrations in specific industries. Therefore, Berkeley County should continue to target the biotech and medical manufacturing industries to strengthen this concentration of businesses and industries.
ADVANCED MATERIALS
Berkeley County has long been a leader in Advanced Materials. In Fall 2022, Nucor Steel made two announcements that they would be investing a total of $625 million to expand their operations in Berkeley County, creating 50 new jobs. Furthermore, in June 2021, Century Aluminum, announced a $60 million investment to expand their operations and create 100 new jobs. The Advanced Materials industry is extremely capital intensive making
it rather challenging to start and difficult to maintain. However, recent announcements show the sector remains strong and builds confidence that this industry will continue to thrive and expand.
REDWOOD MATERIALS
In December 2020, Redwood Materials announced a $3.5 billion in investment which will bring 1,500 new jobs to Berkeley County. According to the S.C. Department of Commerce this was the largest single economic development announcement in South Carolina history. They will recycle, refine and remanufacture anode and cathode battery components for electric vehicles at their 600-acre campus located at Camp Hall Commerce Park near the County’s western border along I-26.

Photo/Google
INDUSTRY ANALYSIS
There are several different analyses that can track trends and patterns across the different industries. These analyses are then used to track if a particular industry is expanding or receding, determine the competitiveness of the region, and can even be used to predict emerging industries. Employment data was gathered from the Charleston Regional Data Center at the county, state, and national level to conduct these analyses.
SHIFT SHARE ANALYSIS
A shift share analysis helps local communities determine their economic competitiveness by breaking down the national, industry, and local shifts in employment. Industries with high regional growth or the ‘local share’ are the competitive industries in Berkeley County. As seen in Table 2, those industries appear to be the Back Office, Construction, Entertainment, Software/Info. Tech., Transportation & Logistics, and Retail industries.
The following formulas were used to conduct this analysis:
Table 2: Berkeley County Industry Shift Share Analysis,
LOCATION QUOTIENT
A location quotient (LQ) is an analysis that compares Berkeley County’s percent of employment by industry clusters with its larger parent geographies, South Carolina and the United States, to identify any specialized or concentrated industry clusters in the local economy. The results of this analysis are one of the measurements used in the Industry Cluster Analysis.
LQ is commonly shown as a ratio and is relative based on the employment in the different geographies. A ratio of 1.00 indicates that the industry clusters in Berkeley County have a similar concentration of employment in comparison to the larger geography in that particular industry whereas a ratio above or below 1.00 indicates a higher or lower concentration of employment.
Table 3 shows the LQ ratio of industry clusters in 2020. Out of the 29 industry clusters identified in Table 3, 12 of them had a LQ ratio less than .95 when compared to the United States. Some industry clusters in Berkeley County, like Materials and Mining & Logging had a similar concentration as South Carolina, however, were more concentrated in Berkeley County than in the United States.
Industry clusters that had a high LQ ratio (1.25 and over) when compared to both South Carolina and the United States include the Aerospace, Biomedical, Energy, Software/ Info. Tech., Metalworking, Retail, and Shipbuilding industries.
Table 3: Berkeley County 2020 Location Quotient Analysis
INDUSTRY CLUSTER ANALYSIS
An Industry Cluster Analysis combines several individual analyses into a single graph. By doing so, this analysis can identify the strong economic and industrial sectors of the local economy and can help predict emerging or receding industries within an area. Figure 58 shows a bubble chart of the industry clusters within Berkeley County, using three metrics to identify their economic state: growth rate (x-axis), US location quotient (y-axis), and the number of employees (relative size of the bubble).
The breakout industry between 2010 to 2020 was the Shipbuilding industry, growing by over 350% and having a LQ of over 5.00 when compared to the United States. Other industry clusters that stood out in Figure 59 were the Research, Software/
Info.Tech., and Metalworking industries. Berkeley County Economic Development identified five emerging industries that their agency was focusing on and investing in. These industries include the Information Technologies (Software/Info.Tech.), Aerospace, Biotechnologies & Life Sciences, Automotive, and Advanced Materials. All of these industries fall within the strong and advancing quadrant (top-right).
As mentioned in the Location Quotient Section, there were 12 industries in 2020 that had a LQ ratio less than .95 when compared to the United States. When combined with the growth rate, this indicates that these industry clusters were either weak and declining (bottom-left) such as the Agribusiness & Food or weak and emerging (bottom-right) such as the Furniture and Back Office industries.
The four quadrants of the graph are defined as:
TOP-LEFT: STRONG BUT DECLINING
Contains clusters that are more concentrated in the region but are declining in employment.
BOTTOM-LEFT: WEAK AND DECLINING
Contains clusters that are underrepresented in the region (low concentration) and are also losing jobs. In general, they show a lack of competitiveness.
TOP-RIGHT: STRONG AND ADVANCING
Contains clusters that are more concentrated in the region and are growing. These clusters are strengths that help a community stand out from the competition. Small, high growth clusters can be expected to become more dominant over time.
BOTTOM-RIGHT: WEAK BUT EMERGING
Contains clusters that are underrepresented in the region but are growing. If growth trends continue, these clusters will eventually move into the top-right quadrant. Clusters in this quadrant are considered “emerging” strengths for the region.

INITALS INDUSTRY
AER Aerospace
AGF......... Agribusiness & Food
APT Apparel & Textiles
AUT Automotive
BIO .......... Biomedical
BO Back Office
CON Construction
CRE Creative Content
EDU Education
ELE.......... Electronics
ENE Energy
ENT Entertainment
FIN .......... Finance
FUR Furniture
GOO Consumer Goods Mftg
GOV Government
HEA Healthcare
IND .......... Industrial Machinery
IT Software / Info. Tech.
LOG Transportation & Logistics
MAT......... Materials
MET Metalworking
MIN Mining & Logging
NON Non-Profits
PRO Professional Services
RES ......... Research
RET Retail
SHI Shipbuilding
TEL .......... Telecom Services
2030 INDUSTRY FORECASTS
Using the forecasted growth of the different industry clusters in Berkeley County, planners, developers, and residents will get a better understanding of how the local economy may change over the next several years. Unlike the Industry Cluster Analysis, which only depicts the general state of each industry cluster, employment forecasts provide actual numerical predictions. Between 2020 and 2030, it is forecasted that Berkeley County will have a net increase in employment of about 12,300 jobs. The industry clusters with the most significant changes during this tenyear timeframe are illustrated in Figure 59.
Service-based industries, such as Entertainment, Healthcare, and Retail, will lead the way in employment over the next several years. Growth in these industries is driven by a growing population as a larger population will need increased health services while also being able to support more restaurants, retail store, and entertainment-based businesses. Announcements from MUSC and Roper St. Francis Berkeley Hospital are recent examples of the healthcare industry expanding to meet this increasing demand.
Furthermore, the demand for services-based industries creates an ideal environment for proprietors and entrepreneurs. Masterplanned communities, like Daniel Island, Nexton, and Foxbank are built on the premise of providing a place where one can live, work, and play. To bring that lifestyle to fruition, commercial spaces are built in close proximity to residents, providing a built-in clientele for businesses, entertainment options for residents, mixed housing options, access to daily services, and additional job openings for residents.
Figure 59: Forcasted Change in Employment of Berkeley County’s Top 5 and Bottom 5 Industry Clusters, 2020-2030

Transportation & Logistics is also expected to continue growing in Berkeley County. Close proximity to the Port of Charleston, Interstate 26, and large tracts of land available for development are advantageous for growth to continue in this sector. Additionally, the State Ports Authority’s development of an inland facility at the Ridgeville Industrial Park near the western edge of Berkeley County will further enhance the desirability of Berkeley County for the Transportation & Logistics industry.
As discussed in the Emerging Industries section, Berkeley County has recently been the site of several major investment projects. Therefore, it should be noted that these forecasts were produced prior to the announcement of these major economic development investments which will have significant impact on employment. According to reports from the South

Carolina Department of Commerce, Berkeley County had nearly $5 billion in announced investments between January 2019 and December 2022, creating 2,100 jobs. This includes the record-breaking investment from Redwood Materials which is planned to create 1,500 jobs alone. Since most of these projects are still in the planning or development phase, the benefits of these investments have not yet been fully realized and will likely take several years to do so.
Photo/SC Ports, Walter Lagarenne
GROSS DOMESTIC PRODUCT
Real Gross Domestic Product (GDP) has risen significantly across the Tri-County region. According to the Bureau of Economic Analysis (BEA), the Charleston Region (TriCounty Region) had a GDP of about $36.7 billion in 2020. Berkeley County accounted for about $7.67 billion of that total. As seen in Figure 60, Charleston County continues to account for a majority of the Real GDP of the region, however, Berkeley County has grown from accounting for about 16% in 2001 to accounting for about 20% in 2020. Dorchester County has consistently accounted for about 9-10 percent of the regions total real GDP.

As seen in Figure 61, Berkeley County’s real GDP grew from $3.49 billion in 2001 to $7.67 billion in 2020. Despite a slight decrease in 2009, overall, this was a 120% increase across this twenty-year time period. This is compared to Charleston and Dorchester Counties which each grew by about 70% during the same span of time. Berkeley County’s growth was fueled by major economic announcements such as Volvo, maturing tech companies like Google, BenefitFocus and Blackbaud, and the continual growth of small businesses. Though the large economic announcements tend to capture the headlines, small businesses continue to account for the vast majority of businesses in the county, as shown previously in Figure 57. Ensuring the business climate remains positive for startups, entrepreneurs and small businesses will be key for economic growth to continue.
The COVID-19 pandemic caused a slight decrease in the County’s real GDP. When compared to other geographies, Berkeley County’s real GDP was impacted the least by the pandemic, as seen in Table 4. However, Berkeley County also experienced the lowest recovery. The lack of drastic changes shows how resilient the local economy is and how adapt Berkeley County businesses and residents are to change.
Table 4: Change in Real GDP, 2019-2021

REGIONAL VALUE OF TRADE
Importing and exporting goods and services is a staple in any economy. The abundance of natural resources, navigable waterways and low, flat land in the region has led to the Port of Charleston being one of the top ports on the east coast. According to the Brookings Institute, the Charleston Region had a total trade value of $37.8 billion in 2015. The region’s top domestic and international trade partners are listed in Table 5 along with the estimated value of trade.


The top commodities traded in 2015 were chemicals & plastics ($6.85 billion), metals ($4.86 billion), machinery ($3.95 billion), and transport equipment ($3.71 billion). These commodities, whether imported or exported, and either domestically or internationally, contribute to the region’s total trade value.
Naturally, domestic trade accounts for the majority (about 85%) of the regions total trade value. Figure 62 compares the total trade value of other nearby trade partners in and adjacent to South Carolina. Despite the volume of trade at the Port of Charleston, the region’s total trade value is much less than regions with comparable populations, such as Columbia and Greenville.
The change in international exports between 2007 and 2017 is noteworthy. According to the Charleston Regional Data Center, the
Charleston Region exported $4.2 billion in goods and services internationally in 2017. This was an 81%, or $1.9 billion increase in trade value since 2007. As seen in Figure 63, the percent of the total regional trade value that Berkeley County contributed decreased by about 10-points between 2007 and 2017.
This is likely due to the significant increase in Charleston County’s manufacturing exports, which accounted for about $1.35 billion of the $1.89 billion total regional change in exports between 2007 and 2017.
Table 5: List of Region’s Top Domestic & International Trade Partners in 2015
EXPORTS BY INDUSTRY
The international export of goods has accounted for the majority of Berkeley County’s total international exports. As seen in Figure 64, Berkeley County exported $661.3 million in goods and $94.2 million in services in 2007. By 2017, the value of goods exported increased by only 2% to $672.4 million while the value of services exported more than doubled (+106%) to $194.1 million. When combined, this equates to $866.6 million in total goods and services exported in 2017, a 15% increase in international exports since 2007.
The steady increase in the value of exported services suggests that industries exporting services, such as Information & Technology and General Business Services, are more resilient and were relatively unshaken during the national recession. However, industries that export goods, such as Manufacturing, did not seem to have the same sense of stability as the value of exported goods fluctuated quite a bit during this ten-year period. This variation in value ranges from the low in 2009 at just above $600 million to the high in 2012 at around $800 million, as depicted in Figure 64.
Manufacturing remains the top exporting industry in Berkeley County, accounting for $655.1 million of the County’s total $866.6 million value of exports. The Chemical Manufacturing and Primary Metal Manufacturing industries were the two primary sub-industries of Manufacturing in Berkeley County, exporting $226.1 million and $272.6 million respectively. Other top exporting industries include Information & Technology ($97.5 million) and Engineering & Heavy Industry ($46.1 million). These top three industries alone exported over 90% of the County’s total value of exports.
It is also important to note that between 2007 and 2017, exports from General Business Services increased by over 400% from $3.4 million in 2007 to $17.1 million in 2017. The only other industries that doubled the value of exports during that same time period were the Finance & Insurance (+127%) and Information & Technology (+122%) industries.
Figure 64: Change in Berkeley County’s Value of Exported Goods and Services, 2007-2017


Photo/SC Ports, English Purcell
tRAnSPORtAtIOn
Berkeley County’s transportation network facilitates the movement of people, goods, and services throughout the County and contributes to the overall efficiency and reliability of the regional transportation network as a whole. This network of roads, rails, pedestrian and bicycle, and intermodal facilities connect the more urban communities to the more rural communities, subsequently attracting industries, providing services, and distributing economic opportunities to all parts of Berkeley County.
Regardless of the destination, route coverage, or mode of transportation, residents need safe and reliable ways to move about the County. Mobility, which is one of the main focuses of this chapter, typically refers to the ability and level of ease of moving people and/or goods from one place to another. This can be measured in terms of the volume of people or goods moved, travel mileage, and time and speed maintained on the transportation network. However, these measurements of mobility tend to be more auto-centric and gives limited consideration to non-motorized travel modes and land use factors that affect the users demand for and access to basic needs such as hospital, schools, grocery stores, and jobs. Thus, mobility can also be assessed by the functionality, choice of modes and quality of travel options available.
Communities rely upon the functionality of the network for their everyday responsibilities such as commuting for work, going to school, business or leisurely travels, and running errands. Furthermore, this network provides a critical lifeline for emergency management, helping first responders travel to people in distress to provide aid, while also supporting evacuation operations, when necessary.
The right-of-way reserved for roads and railways are often shared with community facilities such as sidewalks, bikeways, and/or public utility infrastructure such as powerlines and stormwater infrastructure, with the potential to also provide vegetated buffers and screening. The relationship between transportation, economic development, housing, natural resources, resiliency, community facilities, and land use requires consistent overview to ensure that as the County’s priorities evolve over time, the supporting infrastructure can accommodate those changes.
This chapter will take inventory of the existing transportation network, assessing its function, performance, and connectivity.

CURRENT REGIONAL TRANSPORTATION PLANS
Berkeley County’s transportation network is represented in various regional and state transportation planning documents. These plans touch upon the condition of the current transportation inventory, committed or future, multi-modal projects, and travel demand management strategies for Berkeley County and beyond.
WALK BIKE BCD MASTER PLAN (2017)
The Walk Bike BCD Master Plan envisions the integration of walking and bicycling into everyday life by establishing long-term regional goals and recommendations that once implemented, can create a regional active transportation network.
BCDCOG REGIONAL TRANSIT FRAMEWORK PLAN (2018)
The Regional Transit Framework Plan provides the foundation for transit investment in the Tri-County region as part of the overall multimodal transportation network. The Plan identified the US 52 Corridor as a priority High-Capacity Transit (HCT) Corridor, which when implemented will foster several local and regional benefits including enhancing the quality of life, encouraging economic opportunity, and directing development along an established transportation corridor.
Photo/File
CHATS 2040 LONG-RANGE PLAN (2019)
The Charleston Area Transportation Study (CHATS) 2040 Long-Range Transportation Plan (LRTP) or CHATS 2040 LTRP, is a comprehensive transportation planning document that is intended to act as a guide for municipalities, counties, and regional agencies on implementing an efficient and connected multi-modal transportation system. This plan analyzes the current and future needs of the CHATS transportation network and identifies areas for improvement or expansion. Berkeley County communities within the CHATS study area include Goose Creek, Hanahan, Moncks Corner, Daniel Island (City of Charleston), and Ladson.

THE TRANSPORTATIONLONG-RANGE PLAN
executive summary

BCDCOG RURAL LONG-RANGE TRANSPORTATION PLAN
(2020)
The BCDCOG Rural LRTP focuses on future transportation efforts in the rural parts of Berkeley, Charleston, and Dorchester Counties. Similar to the CHATS Plan, this is a comprehensive transportation planning document that is intended to guide investments in rural transportation infrastructure and establish goals and recommendations to enhance the quality, range, and level of service. Communities covered in this plan include St Stephen, Jamestown, Bonneau, Huger, Pineville, and Cross.
US 52 CORRIDOR STUDY
The US 52 Corridor Study establishes a vision for the US-52 corridor between Moncks Corner and North Charleston. The study identifies relationships between the roadway and adjacent land uses and proposes plans for the corridor’s overall future growth. The study also provides overviews of previous plans for the area, examines land use trends, and provides an inventory of the environmental and transportation elements within the corridor.
COMMUTER TRENDS
Although Berkeley County experienced an increase in total population coupled with a large increase in people employed in Berkeley County between 2010 and 2020, most commuter patterns remained relatively unchanged. Analyzing the commuter characteristics and trends can provide insight to0 any significant patterns that could impact the travel demands placed on the local network.
COMMUTE MODE SPLIT
The modes of travel to work for Berkeley County commuters has remained relatively consistent between 2010 and 2020. In an autocentric society, the vast majority of workers, or commuters, ages 16 and older living in Berkeley County drove alone to work in 2020. As shown in Figure 65, lesser utilized modes of transportation, like carpooling, walking/biking, and public transportation, decreased over the ten-year period.
Overall, the percent of people working from home experienced the largest change between 2010 and 2020, increasing by roughly 1.5 points. in 2010, about 3% of workers reported that they worked from home compared to 5% reported in 2020, and this estimate had increased to 7.5% as of 2021. In a post-pandemic society, it is likely that the percent of people working from home may remain higher than historical levels, which may result in minute relief to the transportation network, however, this may cause a growing pressure in providing Broadband to all areas of the County.

VEHICLE AVAILABILITY
The number of motor vehicles available per household remained relatively unchanged in Berkeley County, with 98% of households having access to at least one motor vehicle in both 2010 and 2020. Figure 66 breaks down the number of vehicles available per household between 2010 and 2020. While households with two vehicles availavle remain the largest sub-group, overall, households with three or more vehicles available recorded 15% growth between 2010 and 2020 compared to all other categories which shows a decline in their proportional share.
TIME LEAVING HOME FOR WORK
Similar to the other commuter trends, between 2010 and 2020, the time that Berkeley County workers left home to go to work remained relatively stable. As shown in Figure 67, in 2010, over half (52%) of Berkeley County residents began their commute between 6 AM and 8 AM. This number dropped to about 50% in 2020. Commuters leaving between midnight (12 AM) and 5 AM experienced the largest increase (+17%) while commuters leaving between 7 AM and 8 AM experienced the largest decrease (-11%). Based on this information, it would suggest that Berkeley County’s peak travel period is extending beyond the typical 6am to 8am window.


TRAVEL TIME TO WORK
The mean travel time to work increased from 26.3 minutes in 2010 to 28.3 minutes in 2020. Figure 68 compares the travel time to work for Berkeley County residents between 2010 and 2020. The decrease in the number of commuters traveling less than 20 minutes to work is not an encouraging trend, although not surprising either. This is common among American cities that fall subject to suburbanization and urban sprawl. While an increase of about 2 minutes does not seem like much, this can cause a ripple effect, impacting emergency response time, increasing the number of accidents, decrease commuter and pedestrian safety, disrupt transit services, and increase costs for road maintenance.

DISTANCE TRAVELED TO WORK
In addition to the travel time to work, analyzing the distance travel to work can provide similar revelations in commuter trends. As seen in Figure 69, according to the US Census Bureau’s Longitudinal EmployerHousehold Dynamics (LEHD), a majority of Berkeley County residents travel less than 25 miles for work in 2019. Map 1 illustrates a 25mile driving radius from the Berkeley County Administrative Building in Moncks Corner, which is about the center of Berkeley County.

MAP 1: DISTANCE TRAVELED

COMMUTER INFLOW & OUTFLOW TRENDS
The US Census’ LEHD program produces annual local employment and economic data. This program provides local governments access to detailed information about their local economies, including demographic characteristics and commute patterns of workers. Analyzing the flow of commuters throughout Berkeley County helps in understanding the interconnectedness of communities and how people move between home and work. This information is also very useful when planning for and making capital investment decisions for infrastructure such as roadways and public transportation.
Figure 70 compares the inflow and outflow trends of Berkeley County commuters between 2010 and 2019. The commuter inflow increasing at a faster rate than commuter outflow is an encouraging trend for Berkeley County.


Note: Inflow refers to the number of people employed in Berkeley County but live out-of-county (Origin). Outflow refers to the number of people who live in Berkeley County but work out-of-county (destination).
COMMUTER ORIGIN AND DESTINATION
The inflow and outflow numbers show the net movement of commuters in Berkeley County. Figure 71 details the commuter origins and destinations of people who work and/or live in Berkeley County in 2019. It is encouraging that about 80% of people who worked and/or lived in Berkeley County circulate within the Tri-County region.
In 2019, there were about 57,000 total commuters who worked in Berkeley County and 87,000 total commuters who lived in Berkeley County. Of these, there were about 23,500 people who lived and worked in Berkeley County, as shown in Figures 70 & 71. These numbers indicate that more people leave Berkeley County for work than the County draws in for employment. Unsurprisingly, Charleston County was the top out-of-county destination for Berkeley
County residents drawing nearly half of all commuters who lived in Berkeley County. The most common destination outside of Berkeley County were:
1. North Charleston (27.1%)
2. City of Charleston (15.5%)
3. Mount Pleasant (6%)
4. Summerville (4.3%)
5. Columbia (1.8%)
For people employed in Berkeley County, the most common out-of-county origins were:
1. City of Charleston (8.6%)
2. North Charleston (7.9%)
3. Mount Pleasant (6.4%)
4. Summerville (5%).

EXISTING TRANSPORTATION NETWORK
Transportation planning is a combined effort carried out by Berkeley County Department of Roads and Bridges (and other departments), municipalities within Berkeley County, adjacent counties and municipalities, private developers and property owners, the Berkeley-Charleston-Dorchester Council of Governments (BCDCOG), local public transportation providers, the South Carolina Department of Transportation (SCDOT), the federal government (USDOT), and the U.S. Forest Service (in Francis Marion National Forest).
Map 2 shows some of the major means of transportation in the Tri-County region as well as the location of important transportation hubs such as Charleston International Airport, Port of Charleston, and the TriCounty Link Headquarters.
Berkeley County’s transportation network in particular includes interstates, roadways, bridges, public transit facilities, railways, port terminals, airports, trails, bikeways, and pathways. This section will take inventory of the different means of transportation and help identify any trends.
MAP 2: BCD REGION’S MAJOR MEANS OF TRANSPORTATION

ROADS
Roadways are the primary method of transportation in Berkeley County for connecting residents in rural and urban communities. The roadway network is made up of a variety of different class types. The Federal Highway Administration (FHWA) groups roads into specific classifications based on their function. The classifications are as follows:
LOCAL STREETS
Provide access to abutting properties, typically in residential areas with lower relative traffic volumes and connects to collectors.
COLLECTORS
Provide for movement within a community, including connecting neighborhoods with arterials or smaller commercial centers. Property access is generally a high priority for collectors, with a lower priority place on through traffic.
ARTERIALS
Serve predominantly through-traffic with minimum direct access to abutting land uses.
INTERSTATES
Provide inter-regional connectivity to major commercial and employment centers and access is typically limited to interchanges designed for higher-speed merging/diverging traffic.
Map 3 shows the functional classification of roads in Berkeley County, a majority of which are local streets.
MAP 3: ROADWAY FUNCTIONAL CLASSIFICATION


The two interstates that traverse Berkeley County, I-26 and I-526, are located on the periphery of the County. I-26 is the primary connector between Summerville, North Charleston, and Downtown Charleston; however, it also provides connections to other urban areas in the State like Columbia and Spartanburg. I-526 serves as the bypass around the greater Charleston metropolitan region, extending from US 17 in West Ashley to US 17 in Mount Pleasant, as seen previously in Map 2. The proximity to I-26 has led to major economic development investments in rural Berkeley County, most notably being Volvo and the Camp Hall Industrial Park.
The other principal arterials in Berkeley County, which include US 17A, US 52, Remount Road and Red Bank Road, are utilized for a variety of different purposes. US 17A and US 52 connect the more rural communities like St. Stephen and Moncks Corner, with the more urban communities like Goose Creek, Hanahan, Summerville, and North Charleston. Remount Road and Red Bank Road, however, have a more targeted userbase serving higher freight traffic and movements generated by the defense community.
Figure 72: FHWA Functional Classification

Most minor arterial roadways like US 17A, US 176, Clements Ferry Road, SC 6, SC 41, Crowfield Boulevard, and Tanner Plantation Boulevard, balances regional mobility needs with access to local communities.
In a county as large as Berkeley, it is expected to have a vast network of collector roads. These roadways are the middle ground between accessibility and mobility, as illustrated in Figure 72. Although many of these roadways are state routes, one of the main intentions of this classification is to connect neighborhood streets with higher intensity roads, like principal or minor arterials. It is more telling that these facilities are more susceptible to operational challenges because they are providing more access (i.e., driveway conflicts and land use impacts).
Diagram of Accessibility & Mobility
Roundabout in Daniel Island constructed by TST. (Photo/BCED)
LEVEL OF SERVICE
Level of service is a qualitative measure which describes the operating conditions of a roadway. Measured using a scale of A to F, these classifications help illustrate the areas that experience traffic and congestion related issues. Map 4 shows the level of services for people driving on regionally significant roadways in Berkeley County in 2019. The service levels A to F can be described as:
Level A – Free-flow operation
Level B – Reasonably free-flow operation but some restrictions to maneuvering
Level C – Speeds at or near free-flow operation with noticeable restrictions to maneuvering
Level D – Speeds decline slightly with increasing flows and freedom to maneuver is more noticeably limited
Level E – Operation at or near capacity with no usable gaps in the traffic stream
Level F – Demand is greater than capacity and there is a breakdown in the traffic flow
Corridors that experienced service level F during peak periods in 2019 include I-526 and Clements Ferry Rd (Daniel Island), N. Rhett Ave and Yeamans Hall Rd (Hanahan), Rivers Avenue (North Charleston), and College Park Road (Ladson).
MAP 4: 2019 LEVEL OF SERVICE

Map 5 shows the forecasted level of service in 2045 if no changes are made to the transportation network outside of financiallyconstrained roadway projects in the regional long-range transportation plans. The following corridors (or portions of) are forecasted to experience a F service level by 2045:
• I-26
• I-526
• US 52
• US 176
• US 17A
• Black Tom Road
• Clements Ferry Road
• College Park Road
• Crowfield Boulevard
• Cypress Gardens Road
• East & West Main St (Moncks Corner)
• Jedburg Road
• North Rhett Avenue
• Red Bank Road
• Royle Road
• Yeamans Hall Road
The areas in and between Moncks Corner and Goose Creek appear to experience the largest change in LOS between 2019 and 2045. As plans and developments are submitted to the County and municipalities, it will be essential for planners and policy makers to ensure infrastructure is able to keep up with development.
MAP 5: 2045 LEVEL OF SERVICE

TRANSIT
TriCounty Link (TCL) operates as the transit service provider in the rural areas of Berkeley, Charleston, and Dorchester counties, and offers both commuter and local bus route service to residents. As a ‘flag-stop service,’ passengers can catch a TCL bus by boarding at one of the designated timed stop locations or standing anywhere along the bus route and flagging the bus to stop. Table 6 lists the eight TCL routes and their designated timed stop locations in Berkeley County. Map 6 shows the planned travel route, along with select timed stop locations and the connections between TCL and the regions urban transit provider, CARTA (Charleston Area Regional Transportation Authority). Transferring between TCL and CARTA is free. Routes B102, CS1 and CS2 connect to CARTA Express XP1, and Route B105 connects to CARTA Express XP2.
All TriCounty Link buses are ADA-compliant and equipped with lifts and spaces for wheelchairs. Special accommodations, including deviations to the regular route in some cases, can be requested by phone. Oneway fares can be paid in cash on-board the buses, or weekly, monthly, and 10-pack oneway and ADA bus passes can be purchased online and at the TriCounty Link office at 305 Heatley Street in Moncks Corner.
Route CS8 (Link 2 Lunch) differs from the other seven routes, as it is free to all riders and operates as a demand response service in a fixed zone around the Moncks Corner Medical Center area instead of along a fixed route. All trips on CS8 can be pre-scheduled by phone from any origin and destination pair within the fixed zone.
MAP 6: TRICOUNTY LINK & CARTA ROUTES

There are five existing Park-n-Ride locations in Berkeley County that provide parking for TCL passengers while they use the transit service. They are as follows:
• Berkeley County Administrative Building Park-n-Ride at 1003 N. Hwy 52 in Moncks Corner
• Goose Creek Park-n-Ride at 303 N. Goose Creek Boulevard in Goose Creek
• Santee Cooper Park-n-Ride at One Riverwood Drive in Moncks Corner
• Bonneau Town Hall Park-n-Ride at 422 Municipal Lane in Bonneau
• St. Stephen IGA Store Park-n-Ride at 331 Byrnes Drive in St. Stephen

Table 6: TriCounty Link Routes, Destinations, and Stop Locations
Route Name Destination Timed Stop Locations
CS1 Moncks Corner - North Charleston
• Santee Cooper Headquarters at One Riverwood Drive in Moncks Corner
• Berkeley County Admin. Building at 1003 N. US 52 in Moncks Corner
• Family Dollar at 303 N. Goose Creek Blvd in Goose Creek
• Rivers Ave Park-n-Ride at Melnick Dr and S. Antler Dr in North Charleston
CS2 Summerville - North Charleston
• Rivers Ave Park-n-Ride at Melnick Dr and S. Antler Dr in N. Charleston
• Trident Medical Center at 9330 Medical Plaza Dr in N. Charleston
• BI-LO at 9616 US-78 in Ladson
• Berlin G. Meyers Park-n-Ride at Berlin G. Myers Parkway and E. 6th St. in Summerville
• Crossroads Plaza at W. 5th N. St and Jedburg Rd/ Mallard Rd
CS3 Summerville - Moncks Corner
• Berlin G. Meyers Park-n-Ride at Berlin G. Myers Parkway and E. 6th St. in Summerville
• Moncks Corner Vocational Rehabilitation at 2954 S. Live Oak Dr in Moncks Corner
• Santee Cooper Headquarters at One Riverwood Dr in Moncks Corner
• Berkeley County Admin. Building at 1003 N. US-52 in Moncks Corner
CS4 Moncks Corner - St. StephenCross
CS8 Moncks Corner (Link 2 Lunch)
• Santee Cooper Park-n-Ride at 1 Riverwood Dr in Moncks Corner
• Bonneau Town Hall Park-n-Ride at 422 Municipal Ln in Bonneau
• St. Stephen IGA Store Park-n-Ride at 331 Byrnes Dr in St. Stephen
• Cross Generating Station at 553 Cross Station Rd in Pineville
• N/A
Photo/TriCounty Link
Table 6 Continued: TriCounty Link Routes, Destinations, and Stop Locations
Route
B101 Moncks Corner - Cross - St. Stephen - Jamestown
• TriCounty Link Terminal at 305 Heatley St in Moncks Corner
• 1487 Ranger Dr in Cross
• Spires Landing Rd at Spring Plain Rd in Nelson Hill
• 3789 SC-45 in Pineville
• Colonel Mahan Dr at SC-45 in Pineville
• 3862 US-52 in St. Stephen
• SC-45 at Betaw Rd in St. Stephen
• 2190 Santee River Rd in St. Stephen
• US-17 Alt. at SC-41 in Jamestown
• SC-45 at Clubhouse Circle near Shulerville
• 2069 N. US-17 Alt. in Moncks Corner
• 375 N. US-52 in Moncks Corner
• Berkeley Industries at 132 Citizens Ln in Moncks Corner
• Moncks Corner Vocational Rehabilitation at 2954 S. Live Oak Dr in Moncks Corner
• TriCounty Link Terminal at 305 Heatley St in Moncks Corner
B102 Moncks Corner - Hanahan - Goose Creek
• TriCounty Link Terminal at 305 Heatley St in Moncks Corner
• 799 Jedburg Rd in Summerville
• Alexander Circle (State Road S-8-449) at Gants Rd near Cane Bay High School
• Carnes Crossroad (US-17 Alt at Us-176) near Goose Creek
• Publix at 208 St. James Ave in Goose Creek
• Rivers Ave Park-n-Ride at Melnick Dr and S. Antler Dr in N. Charleston
• Yeaman Hall Plaza Shopping Center at 1276 Yeamans Hall Rd in Hanahan
• Goose Creek High School at 1137 Red Bank Rd in N. Charleston
• Family Dollar at 303 N. Goose Creek Blvd in Goose Creek
• Berkeley Industries at 132 Citizens Ln in Moncks Corner
B104 Moncks Corner - St. Stephen (Formerly CS5)
• St. Stephen IGA Store Park-n-Ride at 331 Byrnes Dr in St. Stephen
• BP Gas Station at 3862 US-52 in St. Stephen
• Bonneau Town Hall Park-n-Ride at 422 Municipal Ln in Bonneau
• Santee Cooper Park-n-Ride at One Riverwood Drive in Moncks Corner
• Berkeley County Administration Building at 1003 N. US-52 in Moncks Corner
• Moncks Corner Vocational Rehabilitation at 2954 S. Live Oak Dr in Moncks Corner
• Berkeley Industries at 132 Citizens Ln in Moncks Corner
• TriCounty Link Terminal at 305 Heatley St in Moncks Corner
FREIGHT
Providing a safe, efficient and reliable network for the movement of freight and goods is extremely important to maintain the quality of life of residents and also support the economic vitality of our local communities and greater region. The regions freight network is comprised of a mix of port, air, roadway, rail and intermodal facilities. However, major freight and goods movement in the County is accommodated primarily by road and rail traffic.
HIGHWAY FREIGHT NETWORK
Map 7 provides an overview of the major freight network within Berkeley County. This network includes the designated National Highway Freight Network (NHFN) and South Carolina Statewide Freight Network (SFN). These strategic highway freight corridors have been identified as critical infrastructure for the movement of goods. Maintaining the efficiencies of these corridors supports and advances local, regional, and national economic goals.
The NHFN includes segments of I-26 and I-526, about 24 miles of which are in Berkeley County. These corridors accommodate the majority of the region’s truck freight traffic, especially that generated by Charleston Port activities, and provides an important link between domestic and international trade markets. The I-26 corridor on the western edge of the County also supports agglomerated industrial uses. The most noted comes with the establishment of the Camp Hall Commerce Park mega industrial site and development of the Volvo Cars campus therein. Roughly 40 miles of US-52 is designated as part of the Statewide Freight Network which facilitates increased access to
MAP 7: NATIONAL AND STATE FREIGHT NETWORK CORRIDORS

freight dependent industries and land uses in central and eastern Berkeley County and provides critical connectivity to the NFHN. Through these designations, both Federal and State resources and policies are strategically directed toward their improved condition and system performance.
In addition to these national and state designated corridors, freight generators (manufacturing, industrial, warehouse/ distribution) as well as heavy vehicle trips generated by mining, agricultural, and timber operations located throughout the County depend on and utilize a number of local roadway connections, including: SC-27, SC-45, SC-41, Clements Ferry Road, Red Bank Road, Cypress Gardens Road, Bushy Park Road, N. Rhett Avenue, Jedburg Road, and Volvo Car Drive, for access to primary freight corridors.
RAIL
Railroads play an essential role in the region’s transportation system and are an integral part of Berkeley County’s transportation network. In the mid-19th century, the railway was constructed from Charleston to Moncks Corner, St. Stephen, and Florence, making it easier and quicker to transport goods across the state. Today, there are two major rail lines running through the County, the western line and eastern line. Both of these rail lines, along with the various spur lines, are owned and operated by CSX Transportation. CSX rail is one of two Class I long-haul railroads operating in the region. It is the largest railroad in South Carolina, representing 56% of the State’s rail system.
The western rail line directly serves the CSX intermodal facility (Bennett Yard - Ashley Junction Intermodal Yard) in Charleston

County and parallels much of the US-52 corridor through Goose Creek, Moncks Corner, Bonneau, and St. Stephen. This line provides rail access to many major industrial and manufacturing uses such as Century Aluminum, Santee Cooper’s Jeffries Hydroelectric Station, and the West Branch Commerce Park. To the north of Lake Moultrie, CSX also operates a 17-mile spur line which serves Santee Cooper’s Cross Power Station.
Amtrak also operates passenger rail services on the western rail line through an agreement between CSX and Amtrak. The Amtrak Palmetto service runs from New York to Washington to Savannah and the Silver Meteor service runs from New York to Washington to Miami. Passenger trips are scheduled to avoid any conflicts between trains.
The eastern CSX line is an exclusive freight corridor which currently serves the Port’s North Charleston Terminal. Through the SC Ports planned Navy Base Intermodal Container Transfer Facility (ICTF), it is also expected to support the future intermodal
rail needs of the Hugh Leatherman Terminal as well as any surplus intermodal container movements that cannot be managed by the Ashley Junction Yard, which is nearing capacity.
A CSX spur line also provides direct connection to rail dependent industries located in the Bushy Park Industrial Complex. Other spur connections to the eastern rail corridor include a 17-mile East Cooper & Berkeley Rail (ECBR) branch line which runs from the Cordesville area to Charity Church, SC as well as a U.S. Government owned and operated line which serves the Naval Weapons Station in Goose Creek.
Palmetto Railways, is currently working to build an industrial rail connection between the Camp Hall Commerce Park and CSX Class I rail line located near the Santee Cooper Cross Generating Station. This new rail connection is intended to better support the transportation, distribution and logistics needs of current Camp Hall tenants, including Volvo Cars, and any future tenants that might co-locate to support the large auto manufacturer.
Photo/File
PORT
The South Carolina Ports Authority (SCPA) owns and operates a group of coastal and inland port facilities which include the Port of Charleston, Port of Georgetown, Inland Port Greer, and Inland Port Dillion. In 2020, the South Carolina Ports were the nation’s ninth busiest container ports, handling approximately 2.31 million TEUs (twenty-foot equivalent unit) of container traffic. According to SCPA’s 2019 Economic Impact Study, the port system generated an annual economic impact of $63.4 billion and supported about 1 in 10 jobs statewide.
The Port of Charleston in particular, which operates at six locations along the Wando and Cooper Rivers (listed below), serves as a major freight gateway to international trade and an economic engine for the region. Of the $63.4 billion in economic activity generated in 2019, the Lowcountry region accounted for about $7.8 billion or roughly 12% of the ports contribution to the state;s economy and employed nearly 28,000 people. The Port’s newest container terminal, the Hugh Leatherman Terminal (HLT), began its first phase of operations in 2021 and when fully built, this 284-acre container facility will boost capacity at the Port of Charleston by approximately 50% to 5.3 million TEUs by 2033. The increase in port capacity will better position the Port of Charleston to meet the future growth anticipated for this trade gateway.


The six terminal locations are:
1. Wando Welch Terminal (WWT), Mount Pleasant
2. Hugh K. Leatherman Terminal (HLT), North Charleston
3. North Charleston Terminal (NCT), North Charleston
4. Veterans Terminal (VT), North Charleston
5. Columbus Street Terminal, Downtown Charleston
6. Union Pier Terminal, Downtown Charleston
Wando Welch Terminal. (Photos/BCDCOG)
SCPA, the State of South Carolina and other partner agencies have committed to invest in port and port-related infrastructure that will not only increase port capacity, but also enhance the operational performance and transportation infrastructure related to the movement of cargo at the Port of Charleston and throughout the State. Major investments include deepening the Charleston harbor channel from 45 feet to 52 feet to accommodate the growing number of large and new post-Panamax vessels that call on the Port, continued development of phase 2 and 3 of the HLT, construction of the Navy Base Intermodal Container Transfer Facility (ICFT) to allow near-dock rail service to HLT operations, and the development of SC Ports’ inner-harbor barge operation which will support the Navy Base Intermodal Facility by moving containers between the Wando Welch Terminal and the Leatherman Terminal via a designated marine highway. Additional investment in information technology enhancements include a new terminal operating system, equipment upgrades, and paving and infrastructure enhancements at various port and inland port terminals will further improve the port’s operational performance.
At present, freight movement to and from these facilities are primarily supported by truck and rail and these improvements which are aimed to increase the Port’s capacity but will undoubtedly impact freight container traffic on both the highway and rail networks throughout the region. As such, the County will need to plan for increased intermodal rail traffic along the rail lines, potential impacts to the quality of life of local communities and residents, and traffic operations and safety of the highways and local roadways.
AIRPORT
The Berkeley County Airport is the only public airport located within Berkeley County and is owned and operated by the County government. This Class III airport is located off US-17 Alt. in Moncks Corner (616 Whitesville Road) and was built in the 1950s. In the late 1960s and into the early 1970s, the runway was paved and the first terminal was constructed. The airport is primarily used as a base for individual private flights, but provides other services such as fueling, hangar rental, aircraft tie down, aircraft maintenance, pilots lounge, and flight planning. The primary purpose of this airport is to ensure and support the basic aviation needs of the community. As of the most recently published operations information in 2019, the Berkeley County Airport had 33 aircrafts based at the facility and logged 8,100 total aircraft operations which include combined takeoff and landing activity.
The Berkeley County Airport Layout Plan was created in 1991, and served as a strategic plan for phased development of the airport. After Berkeley County took over the Fixed Base Operation in 1999, the County commissioned an updated plan which was submitted to the Federal Aviation Administration in 2001 .
Since completion of the updated 20-year plan, the following projects have been implemented at the airport:
• 2001 – West apron rehabilitation and expansion
• 2001 – Parallel taxiway rehabilitation and extension
• 2019 – Runway 23 avigation easement acquisition and tree obstruction removal
• 2019 – Runway 5 extension
Two smaller private airports are also located in Berkeley County: Crosswinds-Wilson airport and Mount Holly airport, located in Cross and Goose Creek respectively.
The region’s primary commercial service airport, Charleston International Airport (CHS), is located in Charleston County near Hanahan and Goose Creek. CHS utilizes the runways through a joint-use agreement with Joint Base Charleston. According to the 2022 Operations Summary, CHS had 2.665 million passengers depart from CHS and 2.657 million passengers arrivals. In terms of freight traffic, over 6 million pounds of cargo departed from the airport while over 20 million pounds arrived. With over 123,000 aircraft operations in 2022, CHS remains South Carolina’s largest and busiest airport.


Photo/ Berkeley County Airport
MICROMOBILITY
Micromobility refers to walking, bicycling, and other relatively low speeds of travel such as human-powered scooters, golf carts, and electric-assist bicycles. According to the 2017 National Household Travel Survey, walking, bicycling, and riding low speed electric vehicles (LSEVs) accounted for approximately 11.6% of total trips taken by people in the United States. These modes are generally used for short-distance trips, with walk trips for any purpose averaging 0.9 miles, and bicycle and LSEV both averaging 2.4 miles in communities across the country. With most of Berkeley County residents being dependent on automobiles for work, errands, and leisure, these national survey results would likely not align with local residents’ nonauto modal shares. However, through negotiation and collaboration with local developers, Berkeley County is facilitating the expansion of its infrastructure to compliment the Live-Work-Play lifestyle through Planned Developments and master-planned communities. These projects will provide facilities that accommodate a more diverse range of travel modes.
While micromobility infrastructure is more typically found in urbanized areas such as Hanahan, Daniel Island, and Goose Creek, rural Berkeley County boasts some of the region’s most prominent hiking and biking trails.
Safety is often a common concern surrounding micromobility infrastructure, however, there are mitigation strategies that can enhance the safety of the driver and micromobolist. Some examples include dedicating space on roadways, providing the physical separation between people driving and micromobolists, and increase signage and crosswalk safety infrastructure.

Photo/File

Palmetto Trail
The Palmetto Trail is a planned 500-mile-long (380 miles currently constructed) trail system that traverses through over a dozen different counties in the state of South Carolina. The Town of Awendaw in Charleston County, serves as one terminus of this statewide trail system that runs from the coast to the Blue Ridge Mountains in the Upstate Region. A large portion of the Palmetto Trail in Berkeley County is within the Francis National Forest which allows users to experience the natural scenery while participating in exercise or recreational activities. The trail then wraps around Lakes Marion and Moultrie before continuing in Orangeburg County. The full length of the trail is open to hikers and backpackers, with some segments allowing mountain biking, horseback riding, and camping.
Statewide Bicycle Routes
In addition to the Palmetto Trail, there are two statewide bicycle touring routes that cross through Berkeley County. The Coastal Route connects Dorchester County to Moncks Corner, Jamestown, and Williamsburg County through a series of on-road and off-road bicycle paths. The Walter Ezell Route connects Orangeburg County to St. Stephen, Jamestown, and Charleston County primarily along SC 45.
Lake Moultrie Passage of Palmetto Trail. (Photo/BCED)
Micromobility Planning

In 2017, the BCDCOG developed a longrange regional active transportation master plan, WalkBike BCD, in partnership with BCD counties, towns, cities, local advocacy groups, non-profits, and residents. The WalkBike BCD Plan establishes a vision and implementation plan for infrastructure investments to support the region’s goals of expanding active transportation options, including walking and biking, as well as improving the health, safety, economic development, and quality of life of its residents. The Plan seeks to expand upon and improve the region’s network of infrastructure for active transportation, connecting communities of all sizes across the tri-county region, which includes Berkeley County and its municipalities.
WalkBike BCD is framed around the “6 E’s” of pedestrian and bicycling planning: Engineering, Education, Encouragement, Enforcement, Evaluation and Equity. As such, opportunities and recommendations identified in the plan include a mix of policies, programs and projects that address all six of these concepts to create and sustain walkable and bikefriendly places. Recommended projects are not necessarily prescriptive in terms of the type of improvement needed, but instead provide general treatments and facility types that may be appropriate given the project context and best practices. Map 8 illustrates the existing regional trails and bikeways as well as the WalkBike BCD proposed facilities and paths within Berkeley County.
MAP 8: MICROMOBILITY INFRASTRUCTURE

CURRENT AND PROPOSED TRANSPORTATION PROJECTS
Table 7 identifies the transportation improvement projects currently in development within Berkeley County. These projects are being developed primarily by Berkeley County and/or SCDOT, and include a mix of major roadway widening projects, bridge replacement projects, intersection and segment/corridor improvement projects, and bicycle and pedestrian improvement projects. Map 9A shows the location of these projects as well as some of the project types.
The Berkeley-Charleston-Dorchester Council of Governments (BCDCOG) serves as the Metropolitan Planning Organization (MPO) for the Charleston Area Transportation Study (CHATS) urbanized area. All federal funds in the urban area of the tri-county region are administered through the CHATS Policy Committee. The Committee is a policy-making body of elected officials from all three counties who make decisions concerning transportation policies and prioritize and allocate federal
dollars to transportation projects in the entire Census-defined urbanized area, as well as those areas expected to be urbanized over the next 20 years. Approximately 24% of Berkeley County falls within the CHATS planning area. The BCDCOG also facilitates the transportation planning process for the region’s rural area, outside the CHATS boundary, through an agreement with the state.
Table 7: Current Transportation Improvement Projects
1 Clements Ferry Road (Phase II)
2 Henry Brown Blvd Phase II
3 I-26 Widening and SC27 Interchange
4 I-526 (East)
Widening from Jack Primus Rd to SC 41. Widening from 2-lane to 4-lane and 10-ft wide multi-use path.
from Liberty Hall Rd to US-52. Widening 2-lane to 3-lane w/raised planted median and multi-use path.
of interstate from Jedburg Rd to near SC-27 from 4-lanes to 6-lanes. Includes SC-27 interchange upgrade improvement and 2 twin bridge replacement over Cypress Swamp.
of
from 4-lanes to 8-lanes between Virginia Ave to US-17 in Mount
MAP 9A: CURRENT TRANSPORTATION PROJECTS

LONG-RANGE TRANSPORTATION PLANNING
In 2019 and 2020 respectively, the CHATS Policy Committee adopted the 2040 LongRange Transportation Plan (LRTP) and BCDCOG Board of Directors adopted the 2040 Rural Long-Range Transportation Plan (RLRTP). Through the transportation planning process, which includes input from the region’s member jurisdictions, state and federal partners, local public transportation providers, transportation related or interested stakeholders such as members of the freight, aviation, emergency services, school districts, port and shipping communities, and the general public, both plans accomplished the following:
• Identified the transportation needs of the region,
• Developed a comprehensive list of regionally significant candidate transportation projects,
• Evaluated and prioritized projects based on the region’s goals and preferences, and
• Allocated federal funds to the highest ranked projects identified as most critical to the development of the region’s transportation system.
All candidate projects were evaluated and ranked in accordance with the South Carolina Legislature’s Act 114 using objective transportation criteria. The highest ranked projects that could be implemented using committed, available, or reasonably available federal surface transportation grant revenue allocated to the MPO or COG through the planning horizon 2040

were identified as “fiscally constrained”. All other ranked candidate projects for which funding was not identified are maintained within the transportation plan as “visionary” projects. Table 8 identifies both the ‘fiscally constrained’ and ‘visionary’ LRTP/RLRTP transportation projects located within the county that were identified through the longrange planning processes. Map 9B shows the proposed location of these projects.
Between both urban and rural long-range transportation planning efforts, approximately $578 million in transportation improvements were identified within Berkeley County through the 2040 planning horizon. Projects totaling approximately $146 million were identified to be fiscally constrained.
LOWCOUNTRY RAPID TRANSIT (LCRT)
The Berkeley-Charleston-Dorchester Council of Governments (BCDCOG) is working on the development of the Lowcountry Rapid Transit (LCRT) project. Originally identified in the 2016 I-26ALT Study as the locally preferred transit alternative aimed at
reducing traffic congestion and improving regional mobility, this study included a threetiered screening process which looked at a universe of thirteen potential premium transit modes including bus rapid transit, light, heavy and commuter rail, monorail, personal rapid transit, waterborne transit, etc. and an array of potential alignments including roadways, rail corridors, utility alignments, and waterways, in an effort to identify the best or preferred alternative. Under the final level of screening, two alternative modesbus rapid transit (BRT) and light rail transit (LRT) along six roadway corridor alignments, were evaluated based on the FTA’s Capital Improvement Grant (GIG) Project Justification and Financial Commitment criteria which included the project’s cost effectiveness, mobility improvements, and impacts to congestion relief, environmental benefits, land use and economic development. The highest ranked alternative identified as the locally preferred alternative and recommended for further development was bus rapid transit service along the US-78/US-52 corridor from Summerville to downtown Charleston.
Rendering/Lowcountry Rapid Transit
MAP 9B: PROPOSED TRANSPORTATION PROJECTS

Current Proposed Alignment of the Lowcountry Rapid Transit. (Map/LCRT)

In general, BRT alternatives were estimated at roughly 1/5 the cost of LRT alternatives, making it the more cost-effective option.
The LCRT will be a bus rapid transit (BRT) system that operates in its own dedicated guideway or in mixed traffic. The line will connect commuters in the Summerville/Ladson area to North Charleston and downtown Charleston and will operate primarily along the US 78 and US 52/Rivers Avenue corridors, with an estimated 60-minute one-way travel time. The LCRT entered into the FTA Capital Investment Grant (CIG) Program in 2019 and is currently in project development with an anticipated 2026 opening for transit users.
Primarily located in Charleston County, the LCRT corridor is seen as the first phase of a
larger regional high-capacity transit network. In 2018, the BCDCOG completed the BCD Regional Transit Framework Plan (RTFP) which sets the stage for how the region establishes a true multimodal transit-rich network. The RTFP took a comprehensive look at identifying and prioritizing corridors that showed promise for high-capacity transit (HCT) in the BCD region to serve a wide range of trip needs, connect the region, enhance the quality of life, and support economic growth and development through a context-appropriate transit system. The study advanced five corridors for further detailed analysis which includes the US 52-Charleston Corridor located in Berkeley County, connecting Moncks Corner to downtown Charleston along US 52 and Rivers Avenue.
BCDCOG also completed a Regional Park and Ride Study in 2018 to evaluate and recommend critical improvements needed to existing park-n-ride facilities as well as identify future lot locations that will better support both existing and future regional transit service. The study’s short- to mid-term recommendations include continued maintenance and investment in wayfinding signage at the existing parkn-ride lot located at the Berkeley County Administrative Building in Moncks Corner as well as development of a new park-n-ride lot in the fast-growing Carnes Crossroads area around the US-176 and US-17Alt intersection. Map 10 provides the recommended future high-capacity transit network and proposed park-n-ride facilities identified in both the BCD Regional Transit Framework Plan and Regional Park and Ride Study respectively.
MAP 10: REGIONAL HIGH CAPACITY TRANSIT CORRIDORS AND PARK-&-RIDE LOCATIONS

TRANSPORTATION FUNDING
Major transportation infrastructure improvements and maintenance are funded primarily with federal funds and state revenues generated from motor fuel user fees and other vehicle-related fees. However, these traditional funding sources alone do not sufficiently fund all transportation needs at the state and local levels. Fortunately, South Carolina has the additional support of county-level transportation construction and maintenance functions which provide the ability of local sources, such as local option transportation sales taxes and impact fees, to cover some of the funding gap not met by federal and state revenues. The following highlights the major funding sources available for transportation investments within Berkeley County.
FEDERAL FUNDING SOURCES
The majority of transportation funding is generated by the Federal motor fuel tax of 18.4 cents-per-gallon on gasoline and 24.4 cents-per-gallon on diesel fuel. Once collected, annual apportionments are approved by Congress and funding for roadways/highways and mass transit are made by FHWA and FTA respectively. Funds are typically divided among a number of individual programs each with their own formula for distribution between states, MPOs or individual projects. Federal apportionments are made to programs such as the National Highway Performance Program (NHPP), Surface Transportation Program Block Grant (STPBG), Highway Safety Improvement Program (HSIP), Congestion Mitigation & Air Quality (CMAQ) Program, Transportation Alternatives (TA) set-aside Program, National Highway freight Program (NHFP), etc. The funding from these federal programs is then distributed to state-defined system priorities, such as bridge replacement, pavement
and reconstruction, and system upgrades, based on eligibility.
STATE FUNDING SOURCES
The primary source of state transportation revenue is the state motor fuel user fee and other vehicle-related fees. In 2017, the South Carolina State Legislature passed a highway bill (Act 40) that increased the State gasoline tax by 12 cents by phasing in the increase at 2 cents per year for six years and imposed fee increases on taxpayers when they lease, buy, register, obtain license tags for, and pay property taxes on, items that were not previously taxed. These funds are deposited into a new trust fund called the Infrastructure Maintenance Trust Fund (IMTF), which is mandated under Act 40, to be used exclusively for repairing, maintaining, and improving South Carolina’s existing roadways and bridges. At full implementation, the state’s gasoline tax equals 28 cents per gallon and is projected to provide roughly $800 million in additional annual revenue.


deadliest rural roads under the Rural Road Safety Program;
• Replace 465 bridges that are insufficient or load-restricted under the Bridge Replacement Program;
These new revenues coupled with other State and Federal funds form the financial foundation of SCDOT’s 10-year Transportation Asset Management Plan (TAMP) which seeks to systematically improve the transportation system’s safety and performance, and maintain highway infrastructure and assets in a state of good repair. The agency’s 10-year program (through 2027) focuses investment in the following priorities, programs and projects:
• Identify and implement safety improvements on 1,000 miles of the state’s
• Improve approximately 140-miles of existing interstate highways under the Interstate Widening Program; and
• Improve pavement conditions on interstates and major roadways under the state’s Road Resurfacing Program.
Committed funds from Act 40 as of April 30, 2021 within Berkeley County total $39.17 million ($37.26 million in pavement improvements and $1.94 million in rural road safety improvements).
“C” FUND PROGRAM: COUNTY TRANSPORTATION COMMITTEE (CTC)
The “C” Fund program is a partnership between the South Carolina Department of Transportation (SCDOT) and the counties in the state to fund improvements of state roads, local, county and city roadways which are not on the state highway system, and other local transportation projects provided for under South Carolina Code of Laws, Section 12-28-2740. Funding for the program is derived from a portion of the state gasoline tax, and distributed to each of South Carolina’s 46 counties based on population, land area, and rural mileage. Act 40 of 2017 includes authorization of additional funding for the “C” program, which increases the portion of the State gasoline fee dedicated to the program from 2.66 cents-per-gallon to 3.99 cents-per-gallon by 2021. Beginning fiscal year 2021-2022, each county is required to dedicate 33.3% of its“C” funds to improvement of the State highway system. State law further requires that the additional funds derived from Act 40 are used exclusively for repairs, maintenance, and alterations to the State’s highway system. Beyond these restrictions, CTCs can use funds for local road improvements including paving or improvements to county roads or streets, traffic sign improvements, and other road and bridge projects, as wells carry forward uncommitted funds from one year to the next, as long as the carryover amount does not exceed 300% of the county’s “C” fund apportionment for the most recent year.
Berkeley County’s “C” Fund Program is administered by the Berkeley County Transportation Committee (BCTC), which is comprised of eight members appointed by the Berkeley County Legislative Delegation. The BCTC includes representation of

municipalities and unincorporated areas within the county. The county’s BCTC Transportation Plan further defines the use of “C” funds for local funding categories to include:
• State paving and resurfacing projects,
• Local paving and resurfacing projects,
• Enhancement projects consisting of construction, repairs, or replacement of sidewalks, bikeways, or trails within a dedicated right-of-way easement,
• Other projects that do not clearly fit within a prescribed category or fit within multiple categories, and
• Public road projects that promote economic development and job growth in Berkeley County.
Approximately $3.83 million in “C” funds were apportioned to Berkeley County to plan and develop projects for fiscal year (FY) 2021.
BERKELEY COUNTY TRANSPORTATION SALES TAX
Berkeley County residents initially voted for a one-percent transportation sales and use tax increase in 2008 to fund a priority list of locally approved transportation infrastructure improvements. The approved tax levy was not to exceed a period of 7 years at a maximum cost not to exceed $206 million. At the sunset of the 2008 referendum, county residents approved a similar measure in 2014 for another 7-year period, or until a total of $230 million in revenue was collected. In 2022, Berkeley County residents voted to extend the one-cent transportation sales and use tax to fund a mix of locally approved transportation improvement projects, including highway capacity, intersection, bridge, pedestrian, facility, and drainage improvements, major roadway resurfacing and local road projects, as well as greenbelt preservation projects. The approved tax levy is not to exceed a period of 7-years at a maximum cost of $587 million of which no more than 10% (or $58.7 million) can be used to finance greenbelt initiatives.
Photo/File
COmmUnItY FACIlItIES
The community facilities element addresses the various services that are provided to the public, including public utilities, civic centers, schools, parks and recreational programs, healthcare, police, fire, and emergency medical services. These facilities and services are intended to protect health and safety and contribute to the overall welfare of Berkeley County residents. This chapter provides an inventory of public services currently provided in the County and identifies current capital improvement projects among service providers to meet future needs.
GOVERNMENT FACILITIES
Berkeley County is home to multiple federal, state, and county governmental agencies and facilities. As of 2019…
• The federal government owns and operates approximately 75 structures, including US Postal Service, US Forest Service, and US Department of the Navy.
• The state government owns and operates about 40 structures, including SC Commission of Forestry, SC Department of Motor Vehicle, SC Department of Natural Resources, SC Public Railways Commission, and SC Department of Corrections.
• The County owns and operates approximately 60 structures, including administrative, public works, court, animal control, detention centers, permitting, abatement, tax collector, and treasurer’s offices.
Moncks Corner is the County seat of Berkeley County; therefore, many county agencies and departments are located within the greater Moncks Corner area. The County is governed by an 8-member council, serving
four-year terms, and a chair and vice-chair, serving two-year terms. The County has approximately 1,200 full-time employees and is the 8th largest public sector employer in the Tri-County Area region as of the latest data available (2021) from Charleston Regional Development Alliance.
PUBLIC UTILITIES
There are several different agencies that provide public utilities and services to the residents of Berkeley County, most notably being Santee Cooper. Common public utilities and services provide include electricity, water, sewer, trash removal, stormwater, and not until recently, broadband. This section will outline the current public utility infrastructure serving Berkeley County residents.
SANTEE COOPER PUBLIC UTILITY PROVIDER
Santee Cooper is one of the largest utility service providers in South Carolina. Headquartered in Moncks Corner, Santee Cooper employed nearly 1,600 employees in 2020 and remains one of Berkeley County’s top employers. This public utility provider generates electricity, treats and sells potable water, and invests in environmental stewardship.

According to the 2021 Santee Cooper Fingertip Facts, Santee Cooper provides…
“a source of electricity for approximately 2 million people across South Carolina. At the end of 2021, we served more than 198,000 residential and commercial customers directly in Berkeley, Georgetown, and Horry Counties. We sell electricity to Central Electric Power Cooperative, our largest wholesale customer, which in turn provides power to the state’s 20 electric cooperatives. We also supply power to the cities of Bamberg and Georgetown, 27 large industrial customers including Joint Base Charleston, the Alabama Municipal Electric Authority, and the 10 member cities that form the Piedmont Municipal Power Agency.”
In addition to electricity, Santee Cooper also provides wholesale water to more than 210,000 people through the Santee Cooper Regional Water System (SCRWS) and Lake Marion Regional Water System (LWRWS). The water from both systems consistently receives high quality ratings from consumers. Furthermore, the South Carolina Rural Water Association has given the ”Best Tasting Water” award to both the SCRWS and the LWRWS multiple times in recent years.
Photo/Shipyard Park
WATER AND SEWER SERVICES
Berkeley County is serviced by five public water and sewer utilities which include:
• Berkeley County Water & Sanitation (BCWS)
• Summerville Commissioners of Public Works
• Goose Creek Public Works (water only)
• Moncks Corner Water Works (MCWW)
• Charleston Water System (CWS)
BCWS is the largest water and sewer provider in the County. This system consists of approximately 768 miles of water distribution lines, about 793 miles of sewer lines, 169 pump stations, nearly 4,390 fire hydrants, two metered connections to CWS, and seven metered connections to the Santee Cooper System. Map 11 illustrates the approximate location of BCWS water and sewer mains.
Charleston, Moncks Corner, Summerville and Jamestown each have their own municipal system for public sewer services. According to data from these providers, there are approximately 1,316 miles of water lines and 951 miles of municipal sewer lines servicing the County, beyond that of BCWS.
Water Supply
Most of the water used in Berkeley County is initially sourced and treated by Santee Cooper. With the capacity to treat and sell 40 million gallons per day (mgd), Santee Cooper Regional Water System utilizes its 20 miles of transmission pipeline to deliver drinking water to the aforementioned local services providers. In 2020, BCWS, the largest distributor of water in Berkeley County, purchased and delivered XX mgd of drinking water to residents of Berkeley County.
MAP 11: PUBLIC WATER AND SEWER INFRASTRUCTURE

Public Sewer and Wastewater Treatment
In addition to rural and unincorporated Berkeley County, BCWS also provides sewer services for Moncks Corner, Goose Creek and Hanahan. The County’s largest wastewater treatment plant, the Lower Berkeley Wastewater System, has capacity to treat 22.5 million gallons of sewage per day (gpd). The second-largest wastewater treatment plant, the Central Berkeley Wastewater Treatment Plant has capacity to treat three (3) million gpd, and in 2019 announced plans to expand its capacity to six (6) million gpd. A third smaller wastewater treatment plant is located in the upper part of the County in St. Stephen.
STORMWATER INFRASTRUCTURE
Adequate stormwater infrastructure is critical for directing and draining stormwater away from development and towards bodies of water. Gravity mains and storm channels direct the flow of water to help reduce and control flood waters. Berkeley County is currently conducting a stormwater infrastructure inventory to meet the requirements for the National Pollutant Discharge Elimination System (NPDES) permit. This inventory will include data related to the County’s stormwater management system, including grey infrastructure, such as manholes, inlets, pipes, culverts, ponds, channels, and outfalls and green infrastructure, such as creeks, streams, and bioswales. The importance of stormwater infrastructure is further described in the Natural Resources Chapter.
Plan Review and the Post-Construction Stormwater Management Program
Large-scale developments are required to provide stormwater management plans when submitting plans. These plans are reviewed by planners and engineers to ensure adequate stormwater infrastructure is in place to
mitigate the impacts of the development. During construction, certain requirements are to be met to reduce siltation, turbidity, and other pollutants associated with construction activities.
The Post-Construction Stormwater Management Program allows for the County to hold owners responsible for the operation and maintenance of on-site stormwater infrastructure. This program is intended to give the County the authority to require structural and non-structural stormwater best management practices on construction sites. It also provides Berkeley County the authority to conduct post-construction site inspections with the added ability to punish violators, if necessary.
SOLID WASTE COLLECTION AND DISPOSAL SERVICE
BCWS’ Solid Waste Department is responsible for ensuring all solid waste in Berkeley County is disposed of in a manner that protects the environment while insuring the health of its citizens and visitors. This responsibility is carried out by several professional staff members.
Berkeley County Landfill, located at 555 Oakley Road, Moncks Corner, is the only active municipal solid waste facility located in Berkeley County. Several different waste types are accepted by the Berkeley County Landfill facility, including: yard debris, construction & demolition (C&D), MSW, tires, sludge, nonfriable asbestos, and friable asbestos.
Currently, curb-side waste pick-up is limited to Summerville, Hanahan, Moncks Corner, and Goose Creek municipal limits due to the expense of the service.
RECYCLING
BCWS also operates a recycling program at the Berkeley County Landfill. There are 10 recycling convenience centers and 5 drop-off sites located throughout the County. Staffed by BCWS employees, Convenience Centers will only accept residential waste and are for Berkeley County residents only. Upon arrival, a valid ID is required at all facilities before utilization.
According to the Solid Waste and Recycling Brochure, materials accepted include: mixed paper, corrugated cardboard, aluminum and steel cans, household garbage, E-scraps or used electronics (i.e., TVs, printers, monitors & computers only), yard waste, construction and demolition debris, used motor oil and filters, antifreeze, large appliances and scrap metal, furniture and miscellaneous items, tires (up to 5 passenger tires per month), lead acid batteries, textiles/clothing, carpet padding, and dried out paint. Not all convenience centers accept the same materials. To ensure proper recycling and disposal of materials, please check the Berkeley County Water & Sanitation website for location details: bcws.berkeleycountysc.gov/recycling/

BROADBAND, INTERNET ACCESS & SERVICES
In 2015, the Federal Communications Commission (FCC) established the official definition of broadband which was a minimum of 25 mbps download and 3 mbps upload. In post-pandemic times with working from home and common household online activities such as gaming, shopping, and streaming services, households use more mbps than ever before.
Using data from BroadbandNow, Figure 73 compares the internet availability between Charleston, Berkeley, and Dorchester Counties. BroadbandNow is a tech organization that specializes in researching, compiling, and aggregating nationwide broadband internet access data. Based on these statistics, an overwhelming majority of Berkeley County has access to at least 25 mbps internet or broadband, however, there is still room for improvement. Unsurprisingly, Charleston County leads the region in accessibility in all internet speeds.
For the municipalities in Berkeley County, Hanahan has the best broadband coverage rate at 99.6%, followed by Moncks Corner at 98.4%, St. Stephen at 98.2%, and Goose Creek at 97.1%. Some of the major internet providers in Berkeley County include AT&T, Xfinity, EarthLink, Viasat, HughesNet, HomeTelecom, WOW!, and Spectrum.
Additionally, all Berkeley County public libraries offer free wireless internet access. Other public facilities, such as Trident Technical College’s Berkeley Campus and numerous private businesses, such as Starbucks and Walmart, located throughout the County also offer free wireless internet. Furthermore, BCLS offers customers the opportunity to “take the internet home.” Three options are available at all branches for customers to check out a Google Chromebook, a Wi-Fi Unit, or a kit with the Chromebook and Wi-Fi Unit. This service is free for two weeks for library card holders.


PARKS & RECREATIONAL FACILITIES
EXISTING PARK RESOURCES
The natural and cultural resources throughout Berkeley County provide numerous active and passive recreational opportunities to residents and visitors. There are over 100 parks totaling over 800 acres of land throughout Berkeley County. Most of the park facilities are managed by municipal governments and funded by special tax districts. These facilities, no matter the size or scale, provide an essential amenity to residents. Map 12 illustrates the various facilities located throughout the County and municipalities.


Interpretive Center at Old Santee Canal Park.
(Photo/Old Santee Canal Park)
MAP 12: PARKS AND RECREATION FACILITIES
REGIONAL FACILITIES
Every park or recreation facility has an intended scale or range of service. Just as it is important for municipalities to provide a wide range of facilities, as is for Berkeley County as well. The following parks and recreation facilities stand out among the 100+ facilities as major or regional facilities. These facilities may have the capacity to serve large portions of the County, have a specialized or unique amenity that draws regional or state visitors, provide a wide range of services (i.e., active and/or passive recreation), and/or have regional or statewide historic, cultural, natural, or educational significance.
FRANCIS MARION NATIONAL FOREST
The Francis Marion National Forest is one of several nationally protected forested lands in South Carolina. Spanning nearly 259,000 acres, this area is home to dozens of plants and wildlife. The 130-mph winds from Hurricane Hugo in 1989 leveled more than a third of the forest. Recovery efforts have been slow but promising. The National Forest Office is located at 2967 Steed Creek Road in Huger. In addition to conservation purposes, the National Forest also offers a wide range of passive and active recreational opportunities such as hiking, biking, canoe trails, shooting sports, and several boat launches, as seen on Map 11.
CYPRESS GARDENS
Cypress Gardens, a 170-acre preserve located on the west side of the Cooper River, is the only County-owned and operated park facility in Berkeley County. The purpose of Cypress Gardens is to provide an opportunity for people to experience nature. The major programs and facilities include a butterfly house, aquarium, four miles of nature trails, boating, and facility rental services .

OLD SANTEE CANAL PARK & FORT FAIR LAWN
Old Santee Canal Park has been another important park facility in Berkeley County since its establishment in 1989. Located at 900 Stony Landing Road in Moncks Corner, the 195-acre park preserves the historical and natural resources along the Old Santee Canal and Biggin Creek. Other facilities located onsite include the Stony Landing House, four miles of trails and boardwalks, a playground, the Berkeley County Museum and Heritage
Center, a learning center, an interpretive center, and a riverfront dock.
Adjacent to the Old Santee Canal Park is the recently opened Fort FairLawn Park. This 80-acre park is the site of a British fort used during the American Revolution. Recent plans for the development of this public park would include a trail network, interpretive kiosks, an outdoor classroom/ amphitheater, and connections to Old Santee Canal Park.
Cypress Gardens. (Photo/BCED)
DANIEL ISLAND
Daniel Island has become a destination for recreation and music-based events. Governors Park and the Family Circle Tennis Center are adjacent facilities that provide a wide range of services to locals and visitors. Governors Park, being more geared towards locals, has a trail system, multi-use fields, baseball/ softball fields, dog park, and the Daniel Island Recreation Center located on-site. The Family Circle Tennis Center and Credit One Stadium is a 32-acre state of the art facility that host several tennis tournaments and concerts throughout the year. There are currently 20 championship tennis courts located on-site. Credit One Stadium, formerly Family Circle Stadium, is an outdoor event center/stadium with a seat capacity of over 10,000.
HAWKS NEST PARK
Located within Hanahan, this 53-acre park is expected to open in Spring 2023. Hawks Nest Park will offer a range of facilities including a multi-use synthetic turf field. The construction of this facility stems from a 2020 parks and recreation referendum which 76% of voters approved $13.9 million for new parks and improvements to existing parks. The BCSD contributed one million dollars towards the construction of the turf field with the intention for that to be the Hanahan High School home field .
SHIPYARD PARK
Located on a point along the Wando River, Shipyard Park is a 20-acre waterfront baseball complex within the City of Charleston. The complex has three youth-sized fields and two collegiate sized fields. Since its opening in 20XX , this facility has hosted teams from
EXISTING RECREATIONAL PROGRAMS
Recreational programs are primarily offered through the various local municipalities’ recreation departments or non-profit groups. Table 9 lists some of the athletics, programs, and classes offered through the local municipalities.
Smaller, more rural communities are sometimes served by volunteer community organizations such as the Alvin Community Recreation Center in St Stephen, which is providing safe and healthy recreational, educational, and culturally-enriching activities for at-risk youth, seniors, and families.
Municipality
Goose Creek
Moncks Corner
Hanahan
Charleston (Daniel Island)
over 20 different states. Additional facilities and amenities include an on-site restaurant, 17,500 sf indoor training facility, sports equipment store, riverfront trail/walking path network, playground, and concession stand.
MONCKS CORNER REGIONAL RECREATION CENTER
The Moncks Corner Regional Recreation Complex is located at 418 E Main Street in downtown Moncks Corner. This facility focuses on more active type activities such as baseball/softball football, and soccer, there are also walking paths and picnicking areas throughout the complex. The recent addition of the Miracle League field in 2022 has led to Moncks Corner establishing itself as a recreation destination, particularly for inclusive recreation. This facility holds several baseball and softball tournaments throughout the year.
Programs Offered
Baseball/Softball, Basketball, Cheerleading, Football, Soccer, Tennis, Volleyball, Dance, Pickleball, Martial Arts/Karate, Senior Programs
Baseball/Softball, Flag & Tackle Football, Soccer, Cheerleading, Basketball, Kickball, Tennis, Pickleball
Baseball/Softball, Basketball, Cheerleading, Flag & Tackle Football, Soccer, Volleyball, Tennis, Dance, Karate, Lego Robotics, Yoga, Table Tennis
Baseball/Softball, Basketball, Soccer, Flag Football
Note: Not all athletics and/or programs are listed. Please visit the municipalities website for more detailed information on what is offered.
Table 9: List of Athletic/Recreation Programs by Municipality
EDUCATIONAL FACILITIES
Berkeley County School District (BCSD) is the fourth largest school district in South Carolina. BCSD operates 46 schools throughout the County offering Pre-K through 12th grade services. These schools served over 37,000 students at the beginning of the 2021-22 school year and employed about 2,200 teachers. However, the school district overall employed over 6,000 full time employees making BCSD consistently one of the top employers in the County.
Map 13 shows the location of all BCSD schools as well as the 2022-23 school year High School Attendance Zones.
As of 2021, the BCSD system is comprised of nine school districts , and each is represented by a School District Board Member. Board members serve four-year terms and are directly elected by registered voters in the County to represent their constituents interested in matters such as setting policy, providing sufficient funding and monitoring of all instructional programs to ensure quality educational opportunities for all public-school attendees.

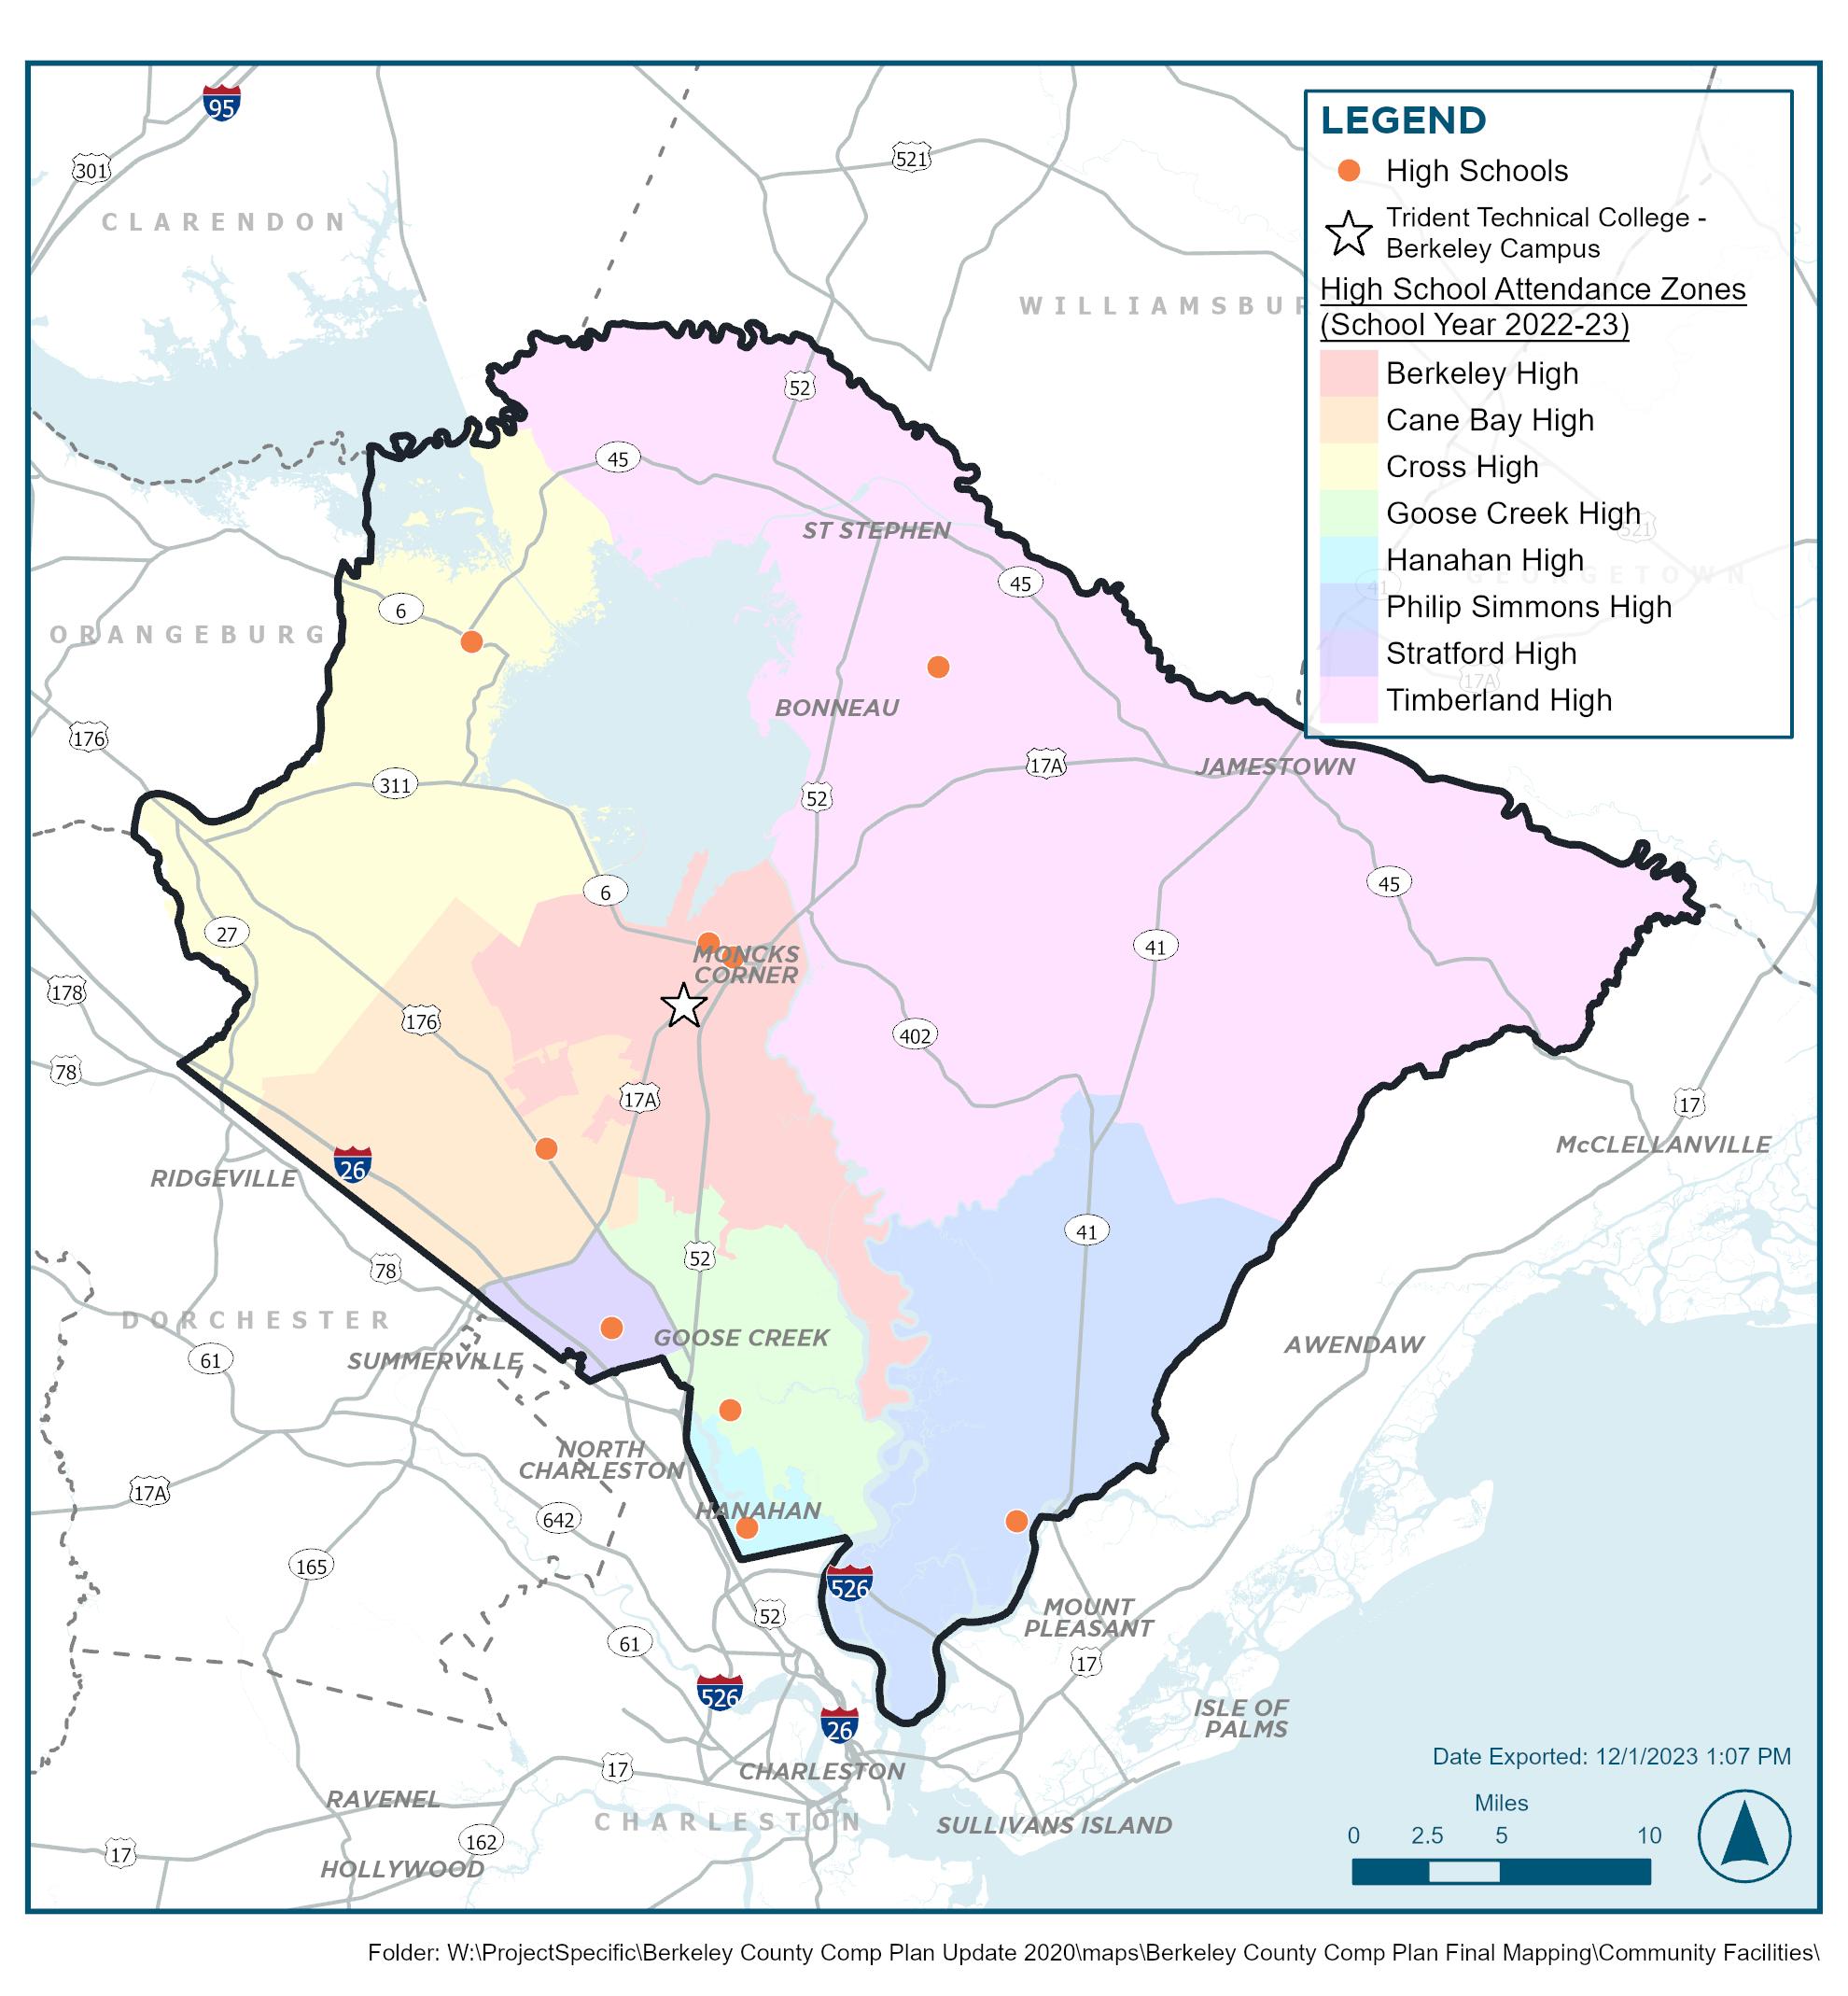
Cane Bay High School. (Photo/Berkeley County School District)
MAP 13: PUBLIC EDUCATION FACILITIES
SCHOOL ENROLLMENT
Student enrollment at BCSD has been increasing over the last ten years alongside the rapid growth of the region. In the 2012-13 school year, the County had about 31,000 students attending public school. Enrollment increased to about 37,000 by the 2021-22 school year, which was about a 20% increase. Figure 74 shows the change in enrollment at day 45 of each school year. With the exception of the 2020-21 school year, the enrollment has consistently increased year-over-year. The impact that the COVID-19 pandemic had on classrooms is likely the cause of the decline in 2020-21. Based on reports from the SC Dept. of Education, private school enrollment in Berkeley County was about 530 during the 2019-20 school year then increased by 200% to nearly 1600 students in 2020-21. However, the following school year (2021-22), public school enrollment returned to pre-pandemic levels despite private school enrollment continuing to increase.
Not all schools in BCSD follow the traditional grade level structure, such as Cross Elementary and High, the Daniel Island School, and once open in 2023, Carolyn Lewis Elementary. Similar to the Daniel Island School, Carolyn Lewis will offer grades K5-8th and is located in the Carnes Crossroads area.

There are a few unique schools in the BCSD that offer additional educational opportunities that other schools do not such as Howe Hall AIMS Elementary, Marrington Middle School of the Arts and Berkeley County Middle College. These schools offer magnet, artistic, and/or advanced courses for students. Enrollment in Howe Hall AIMS is done through a lottery system whereas the Berkeley County Middle College requires an application prior to a lottery system. Only students who reside in Berkeley County or whose parents are BCSD employees may qualify/apply.
SCHOOL ENROLLMENT CAPACITY & FUTURE
Projections
Table 10 lists all of the public schools in the BCSD by area along with the associated grade levels offered, school enrollment capacity, the 2021-22-day 135 headcount, and the ten-year projected headcount per school. These calculations are crucial in local and regional planning as schools over or under capacity can often lead to financial or performance concerns. Based on recent growth and development, schools in the Cane Bay, Hanahan, Nexton, Carnes Crossroads, Cainhoy Plantation, and greater Moncks Corner areas are expected to see dramatic increases in attendance. The addition of the Carolyn Lewis School will help alleviate capacity issues in the Cane Bay area, however, the high school will continue to increase in enrollment. Based on these projections, Cane Bay High School will be about 700 students (+130%) over capacity by the 2031-32 school year. Other schools projected to be well over capacity (100-110% or > 110%) by 2031 include Stratford High, Foxbank Elementary, Whitesville Elementary, Berkeley Middle, Hanahan Elementary, Cainhoy Elementary, Philip Simmons Elementary, and Philip Simmons Middle.
Private Institutions
There are about 14 private schools in Berkeley County, including independent, parochial, religious, and non-religious affiliated charter schools, boarding schools, Christian schools, preparatory schools, and accredited private elementary, middle and high schools. As mentioned previously, enrollment in private schools increased by 200% between the 2019-20 and 2020-21 school years. This increase in private school enrollment has continued over the following years, although not as sharply, with just over 1800 students reportedly enrolled in private school in the 2021-22 school year (a 15% increase) and nearly 1900 students in the 2022-23 school year (a 3% increase).
Table 10: List of Schools in Berkeley County School District (Pages 1 of 3)
Table 10: List of Schools in Berkeley County School District ( Pages 2 of 3)
Table 10: List of Schools in Berkeley County School District (Pages 3 of 3)
Higher Education
Berkeley County is home to two different higher education facilities which include Trident Technical College - Berkeley Campus and Clemson University Cooperative Extension Service. Other nearby higher education facilities include Charleston Southern University, Trident Technical College – Thornley, Palmer, Mount Pleasant, and Dorchester Campuses, College of Charleston, the Citadel, and Medical University of South Carolina (MUSC).
Trident Technical College (TTC) offers more than 150 programs of study to help prepare students for the future, whether that be continuing to a four-year college or directly into the workforce. Tuition at TTC is currently based on a pay-by-credit hour system. With that being said, for students residing in Charleston, Berkeley, or Dorchester Counties, tuition is about $189 per credit hour for the Fall 2022 and Spring 2023 semesters. TTC offers five college-level degree programs including: Associates in Sciences, Arts, Pre-Health Sciences, Pre-Nursing, Cosmetology, Nail Technology, Health Information Management, and Veterinary Technology.
TTC also offers 3-week (62 hour) training courses to help workers accelerate into manufacturing careers in general manufacturing and safety skills with an OSHA-10 certificate. The latter helps ensure workers are more knowledgeable about workplace hazards and can safely contribute to our nation’s productivity. Scholarships may be available through Berkeley County Economic Development.
Based on the TTC Factbook, there were a total of 16,834 students enrolled in the 2021-22 school year. It was also reported that there were 588 faculty and staff employed by TTC in 2021. As mentioned previously, TTC has five campuses throughout the Tri-County region, Figure 75 shows the Fall enrollment across all five campuses.
While the decline in enrollment in 2020 is not surprising, the lack of recovery, particularly at the Thornley Campus, is notable. One of the byproducts of the pandemic was a nationwide shift from in-person classes to online or remote learning. It is unclear whether higher education will return to pre-pandemic in-person classrooms or if remote learning will become a new norm for community colleges.


Above: TTC Berkeley County Campus. Left: S.C. Aeronautical Training Center at TTC. (Photos/TTC)
All campus facilities include a full-service library, computer lab, tutoring programs, training workshops, and additional support services for students such as an online course management system, time management, and leadership programs. TTC’s Berkeley Campus is a 35-acre site near Moncks Corner and has served as the area’s community college since 1982.
Clemson University has a Cooperative Extension office located in Berkeley County Health Department complex. Extension Agents work closely with state extension specialists and researchers on campus and at the various research and educational centers throughout the state. Extension Agents provide expertise in Agribusiness, Agronomy, Food Safety & Nutrition, Horticulture, Livestock & Forages, Forestry and Wildlife Resources, Water Resources, and 4-H and Youth Development, which is a program to help youth gain the knowledge and skills to be responsible, productive and contributing members of society.
Two facilities in the County provide adult and community education for residents seeking to obtain a GED (Graduate Equivalency Degree for high school), enhance academic or career skills, or to learn English language skills. The Center for Academics and Innovation is located in Moncks Corner and the Fishburne Educational Center is in Hanahan. These community education institutions offer day and evening programs for County residents 17 years of age and above who would like to gain professional workplace skills, including reading, professional writing, and math, digital literacy, resumé writing, and mock interview practice, in addition to English language classes, family literacy classes, a GED diploma, and other professional certifications.

Right: BCLS Mobile Library System (Photos/BCLS)
LIBRARIES
There are seven public libraries in the Berkeley County Library System (BCLS). The library headquarters are in Moncks Corner and additional branches are located in Cane Bay, Goose Creek, Hanahan, St. Stephen, Daniel Island and Sangaree. In addition to the physical library branches, BCLS now offers a mobile library system, known as “M.O.R.E.,” which provides access to library services in the rural areas of the County and to residents lacking adequate resources at home.

BCLS offers a vast collection of hard-copy books and other related media as well as 300,000+ e-books, e-audiobooks, and other digital media to all County residents. Additionally, BCLS offers a variety of free services and programs to Berkeley County residents, including book discussions, digital media access, facilities rental, computer classes, and other remote reading programs. All BCLS branch libraries offer wireless internet to patrons free of charge.
Above: Hanahan Library
JUDICIAL, CORRECTIONAL, & PUBLIC SAFETY
FACILITIES
There are eight municipal police departments and one County Sheriff’s Office serving Berkeley County residents. The Berkeley County Sheriff’s Office headquarters is located at 223 N. Live Oak Drive in Moncks Corner. Additionally, there are six substations located throughout the County:
1. South District Substation: 301 Red Bank Rd, Goose Creek
2. Cainhoy Substation: 1501 Recreation Rd, Huger
3. Cross/Pineville Substation: 1659 Old Highway 6, Cross
4. Cane Bay Substation: 1903 Cane Bay Blvd, Summerville
5. Sangaree Substation: 347 Sangaree Pkwy, Summerville
6. North District Substation: 2184 Santee River Rd, St Stephen
Note: The Summerville Police Department and Charleston Police Departments are headquartered in Charleston County, but also hold jurisdiction in Berkeley County.
The Berkeley County Sheriff’s Office provides 24-hour coverage, seven days a week through its Uniform Patrol Division. Other divisions within the Sheriff’s Office include Criminal Investigations, Judicial Services, Special Operations, and as of August 2020, Technical & Support Services.
The Federal Bureau of Investigations (FBI) collects and reports nationwide crime and law enforcement data from local law enforcement offices, such as the Berkeley County Sheriff’s Office and the Goose Creek, Hanahan, and


Photo/Berkeley County


Note: Crimes that occured within municipalities are not reflected in Figures 77A and 77B.
Moncks Corner Police Departments. This site is available for public consumption and can be used to monitor the number and types of crime reported locally as well as provide support and resources for the health and wellbeing of local law enforcement officers.
As of 2020, the Berkeley County Sheriff’s Office had 203 sworn officers, 33 civilians, and five part-time employees. Figure 76 compares the police-to-population ratio between the different larger law enforcement offices within Berkeley County as well as the state. Berkeley County Sheriff’s Office has maintained a ratio of about 1-1.5 officers per 1,000 people. This is consistently below the state’s ratio.
Crime data reported is broken down into all violent crimes (homicide, rape, robbery, and assault) and all property crimes (arson, burglary, and larceny). As illustrated in Figures
77A and 77B, the number of violent crimes reported by the Berkeley County Sheriff’s Office has fluctuated over the years whereas the number of property crimes reported has steadily declined.
The Berkeley County Courthouse is located at 300-B California Avenue in Moncks Corner. This location is home to the Clerk of Court, the Probate Court and Solicitors Office. The Magistrate’s Court is located at 223 N. Live Oak Drive in Moncks Corner. Adjacent to the courthouse at 300 California Avenue is the Hill-Finklea Detention Center. The Berkeley County Sheriff’s Office operates this facility. The Operations Division at the Detention Center includes the direct supervision of inmates, a Special Operations Response Team (SORT), Transport Team, and the Litter Pickup Program.
FIRE & EMERGENCY MANAGEMENT
FIRE PROTECTION
There are 62 fire stations operated by six municipal departments and 26 rural departments in Berkeley County, as illustrated on Map 14. The County coordinates fire services through its Emergency Management Department (EMD), which is responsible for managing and coordinating various emergency services, developing emergency preparedness plans, and providing employee training. The County’s EMD also serves as the primary liaison to the rural volunteer districts, providing coordination, budgetary and administrative support services.
The municipal fire departments employ mostly full time, professional firefighters. All five municipal departments represent less than 10% of the geographical area of the County but serve about 37% of the County’s population. Mutual aid agreements and coordinated dispatch help assure that adequate resources are quickly delivered to an incident site.
Across all municipal departments in the County, the average rate of service is about two (2) firefighters per 1,000 people. According to the National Fire Protection Association’s (NFPA) 2018 report, the rate of firefighters in similarly sized communities was about 0.87 to 1.32 per 1,000 people, meaning these municipal departments are comparatively better staffed.
Rural fire departments are contracted annually with the County. The County Supervisor and County Council develop and implement policies related to fire and emergency services, determine the distribution of taxes levied for each fire district, and oversee the rural fire districts’ annual contracts. Emergency communications (911) and dispatch services for the rural districts are also provided by the County.
The rural fire departments are primarily staffed by unpaid, volunteer firefighters; however, there is considerable variation in staffing and operations of the rural departments throughout the County. Some rural fire departments have one or two fulltime or part-time firefighters and a fire chief, as is the case at the Pineville-Russellville rural station. Other rural departments previously staffed by volunteers have recently begun moving toward more part-time, professional (paid) staff, as in Whitesville, Caromi, and Pine Ridge. This transition toward more professional firefighters (paid staff), opposed to volunteers, is likely to improve response times and fire department class ratings, which are closely tied to home owners’ insurance premiums. The rural fire departments have as few as five to as many as 60 part-time firefighters.
In areas served by rural fire departments, the level of service is an average of 1.35 firefighters per 1000 residents. This increases to 3.9 firefighters per 1000 residents if volunteer firefighters are included. The National Fire Protection Association’s (NFPA) 2018 US Fire Department Profile reported that the average rate of volunteer firefighters for similarly sized communities varied between 2.45 and 5.86 per 1,000 people.
MAP 14: FIRE DISTRICTS AND LOCATION OF LOCAL FIRE STATIONS

EMERGENCY MEDICAL SERVICES
Berkeley County has two types of emergency medical service (EMS) providers: stand-alone EMS units, which exist in most of the rural areas, and fire department-based EMS units, located in the more populated municipalities, such as Hanahan and Goose Creek. The County’s central EMS station is headquartered at 223 N. Live Oak Drive in Moncks Corner. Twelve additional medic sub-stations are dispersed throughout the County, as shown on Map 14.
There are nearly 70 trained EMS and support staff providing 24-hour emergency response services in Berkeley County, and responding to about 20,000 calls per year.
Residents in some areas of the County, primarily those in the more rural areas served by stand-alone EMS units, have expressed concern about EMS response times. Moncks Corner has lobbied for providing emergency services through its fire department rather than, or in addition to, Medic 3, due to limited resources for the medic station. In 2018, the Medic 6 crew was forced to relocate 21 miles away, raising additional concerns about response times for the area. In April of 2020, a new Whitesville Rural Fire Department with EMS services opened to serve residents of the surrounding area, including Cane Bay.
EMERGENCY PREPAREDNESS
The Berkeley County EMD is responsible for initiating and maintaining the emergency management plan that prepares for public recovery and relieves and reduces human suffering following events of natural or manmade disasters in Berkeley County.
Berkeley County recently completed its 5-year update of its Hazard Mitigation Plan (HMP) as required by FEMA. The 2020 HMP update addresses how the County and its municipalities will continue activities to mitigate the impacts of multiple natural hazards including flood, wind, fire, earthquake, thunderstorms, winter/ice storms and hazardous materials. The 2020 HMP Plan also includes descriptions and assessments of these hazards, the risk of each of the natural hazards, and prioritized activities to be undertaken to minimize impacts to Berkeley County residents and properties.

Some facility types are critical for emergency preparedness because of how important they are in the response and recovery efforts from emergency events. The Resiliency chapter of this plan provides in-depth details on emergency preparedness, hazard mitigation, and resiliency efforts.
HEALTH CARE
Access to quality health care is essential for the survival and growth of Berkeley County’s existing and future population. South Carolina Department of Health and Environmental Control (SCDHEC) has two Public Health Clinics, located in Goose Greek and Moncks Corner, for promoting and protecting the health of the public in Berkeley County . Specifically, the public clinic in Moncks Corner offers immunizations and WIC services, which is a special Supplemental Nutrition Program for Women, Infants, and Children. The public clinic in Goose Greek offers immunizations, WIC Services, Family Planning, and other testing services. Furthermore, five different healthcare systems have been providing a variety of medical services and care for Berkeley County, as detailed below.
ROPER ST. FRANCIS HEALTHCARE
Roper St. Francis Healthcare has four flagship hospitals: Roper Hospital, Bon Secours St. Francis Hospital, Roper St. Francis Mount Pleasant Hospital and Roper St. Francis Berkeley Hospital. In an emergency, they have six strategically placed ERs. They are the Lowcountry’s second-largest private employer, with 1,000 doctors representing almost every medical specialty, 657-bed system consists of 117+ facilities and services across in the TriCounty Area.
TRIDENT HEALTH
Trident Health is a 445-bed Healthcare hospital system comprised of two acute care hospitals— Trident Medical Center and Summerville Medical Center—and three freestanding emergency departments—Brighton Park Emergency, Moncks Corner Medical Center and Centre Pointe Emergency. Trident Health has more than 2,600 employees, more than 500 physicians and more than 130 volunteers.


Photo/Roper St. Francis
Photo/Trident Medical Center
MEDICAL UNIVERSITY OF SOUTH CAROLINA
The Medical University of South Carolina is located on the MUSC campus. The Medical University of South Carolina’s 58-acre campus houses six colleges including ones in the fields of nursing, dentistry, and pharmacy. The 596-bed hospital’s reputation far exceeds the borders of the state, and the hospital’s physicians have performed life-saving surgery on patients from all around the world.
However, these facilities are not easily accessed by some of Berkeley County’s more rural areas and disadvantaged population. Many of residents, are living in poverty and/ or are elderly, or mobility-impaired, relying on public transportation to access healthcare, which often does not serve the rural areas due to low demand.
CHARLESTON MEMORIAL HOSPITAL
Located in the “medical district “of downtown Charleston, Charleston Memorial Hospital is operated by the Medical University of South Carolina and owned by Charleston County. The hospital was the first in the area to offer a full-service emergency room. Recently remodeled, the 200-plus bed facility provides health care to Tri-County residents.
SC DEPARTMENT OF MENTAL HEALTH
South Carolina Department of Mental Health (SCDMH) has a health center in each county for mental health services. The Berkeley Community Health Center at Moncks Corner provides emergency services, case management, outpatient counseling and psychiatric treatment for children, adolescents, adults, and families in Berkeley County.
EAST COOPER COMMUNITY HOSPITAL
East Cooper Community Hospital is located at 1200 Johnnie Dodds Blvd. This 100-bed medical facility provides exceptional health care to residents of Mount Pleasant. 24-hour emergency service and physician’s offices make the East Cooper Medical Center a complete health care system.
SOCIAL SERVICES
The South Carolina Department of Social Services (SCDSS) is headquartered in Moncks Corner. The Department provides children and vulnerable adults support, adoption, and foster care services. It provides federal Title IV-B Child Welfare Services, Title IV-E Foster Care, Adoption Assistance programs, Adult Protective Services, and Safe Haven for Abandoned Newborns.
The Department also administers the state’s child support program under federal Title IV-D and provides other child support services, including paternity establishment and fatherhood initiatives.
Additionally, the office has many economic assistance programs, including:
• The federal Temporary Assistance for Needy Families (TANF) program, which provides employment and training for people receiving cash assistance;
• The Supplemental Nutrition Assistance Program (SNAP), which assists low-income citizens in the purchase of food;
• A commodities program, which distributes supplemental food through a network of food banks; and
• A summer food service program, which
provides financial assistance for children and adult care providers, homeless shelters and summer service sites for children.
Goose Greek Police Department offers a Victim/Witness Services program, which provides help to victims of violent and domestic crimes, including compensation or restitution, referrals, crisis counseling, assistance in obtaining restraining orders, help in finding shelter, help in understanding the court system, and emotional support services. Victim advocates also provide training to groups such as school children, civic groups and businesses.
According to the Hands-on Health South Carolina, there are 16 different non-profit institutions and businesses providing social services covering Berkeley County. All these facilities and/or programs help to create a safe environment for children and vulnerable adults and families in Berkeley County.
FOOD ACCESS AND FOOD DESERTS
Food deserts are geographic areas where access to healthy food options, especially fresh fruits and vegetables, are limited or non-existent due to an absence of healthy food retailers, such as a farmers’ market or a grocery store. Defining the geographic areas lacking healthy food resources and the population impacted by it can help communities to focus on the high-need areas to effect positive change.
The South Carolina Department of Health and Environmental Control (SCDHEC) created the ‘SC Food Desert Map ’ based on data
from the US Department of Agriculture’s (USDA) Economic Research Service’s Food Access Research Atlas of 2015. The SC Food Desert Map identifies food desert locations throughout different counties in South Carolina based on the proximity to fresh, healthy food retailers. Figure 78 shows a screenshot of the BCD Region on the SC Food Desert Map site.
SCDHEC defines a Food Desert area by measuring social vulnerability, income, access/ distance to the nearest healthy food sources, and vehicle availability. Social vulnerability is defined by age (children and seniors), ethnic minority, and SNAP housing units (a person living alone or a group of people living together). There are six different potential food sources from which community members could obtain healthy food, including farmers’ markets, roadside markets, DHEC permitted grocery stores, DHEC permitted restaurants, food banks, and food pantries participating in the SC Farm to Food Bank program. A defined “food desert” will have high - social vulnerability, low – income, low – access to healthy food sources, and low –vehicle availability.
According to the SCDHEC Food Desert map and data, the 2015 County population was approximately 59,000 residents, 30% of which lived in food desert areas. In 2015, about 45% of the County’s land area was categorized as a food desert. By 2019, the County’s population increased to approximately 68,000 residents, 32% of which lived in food desert areas. In 2019, about 61% of the County’s land area was categorized as a food desert.

Figure 78: 2015 Map of Low Income and Low Access at 1 and 10 miles of the BCD Region
Source: Screenshot from the SC Food Desert Map site
CUltURAl RESOURCES
Cultural resources within Berkeley County contribute greatly to its unique sense of place and the quality of life experienced by residents and visitors. These resources may have historical, natural, recreational, educational, spiritual, or societal significance. It is important to recognize the significance of each resource as they often contribute to a larger story. Other elements, such as housing, economic development, community facilities, and land use work in tangent with cultural resources in the hopes of mutually benefiting from one another. Cultural resources can foster economic development for the County by creating uniquely themed business opportunities, attracting tourists, enhancing quality of life, and increasing land value. Therefore, it is important that these resources be protected and/or restored for future generations.
HISTORIC RESOURCES
Historic resources are one of many different contributors to the overall cultural output of Berkeley County. These resources provide a link between past and present generations. The history of Berkeley County dates back to pre-colonial times, however, most of the remaining historic resources were from the colonial era. This section will take an inventory of all historically significant resources in Berkeley County. Historic resources are often characterized into five different categories based on the resource: building, structure, site, object, or district. The South Carolina Department of Archives and History (SCDAH) and State Historic Preservation Office (SHPO) are the lead agents for identifying and recording properties with historic significance

through the survey program. Those properties can then be nominated for further designation (if not already listed), such as inclusion on the National Register for Historic Places and/or National Historic Landmarks.
NATIONAL REGISTER OF HISTORIC PLACES
The National Register of Historic Places (NR) was established in 1966 and is the Nation’s official list of properties deemed worthy of preservation. Properties identified in the NR either have historic significance to a local community, residents of a specific state, or to the nation. The National Park Service maintains the NR in conjunction with various federal, state, and tribal offices. A number of historic resource surveys were conducted

in Berkeley County, beginning with two inventories by the BCDCOG in the 1970s and an updated survey conducted later in 1989, right before Hurricane Hugo.
Biggins Church Ruins.
Gippy Plantation.
There are 16 historic resources listed on the NR in Berkeley County. Map 15 shows the location of these resources. 1. Biggin Church Ruins
Gippy Plantation
Lawsons Pond Plantation
Lewisfield Plantation
Loch Dhu
Medway
Otranto Plantation 8. Otranto Plantation Indigo Vats
9. Quinby Plantation House – Halidon Hill Plantation
MAP 15: CULTURAL RESOURCES
Note: This list excludes Historic Districts and the National Historic Landmarks, both of which will be listed separately.

10. Richmond Plantation 11. Santee Canal (North) 12. Santee Canal (South) 13. Strawberry Chapel & Childsbury Town Site 14. Taveau Church
15. White Church (St. Thomas Episcopal Church)
16. William Robertson House
NATIONAL REGISTER HISTORIC DISTRICTS
What distinguishes a historic district from the other listed resources is the concentration or continuity of resources that contribute to the overall history of the area. There are currently five historic districts listed on the NR in Berkeley County, as shown on Map 15
COOPER RIVER HISTORIC DISTRICT
This 30,020-acre district is comprised of a group of well-maintained historic properties in rural Berkeley County that centers around both branches of the Cooper River. Many of the historic buildings, structures, and objects are from the 18th, 19th, and 20th centuries and remain intact. Unique landscape features such as rice fields, banks, canals, dams, reservoirs, causeways, roads, fence lines, and cemeteries are also well preserved throughout the district. Listed on the NR in 2003.

PINEVILLE HISTORIC DISTRICT
This district represents the transformation of a 19th century densely populated town,
with as many as 100 buildings, to a rural agricultural community primarily caused by town-wide destruction by Union troops during the Civil War. Instead of reconstructing, most of the land was converted to farmland. The Pineville Historic District is composed of four remaining buildings: three residential and one church. Listed on the NR in 1992.
CAINHOY HISTORIC DISTRICT
Composed of a collection of nine buildings, this district serves as an illustration of the cultural and architectural development of the village from a ferry landing to a small river port town. Was the site of the “Cainhoy Massacre” in 1876. Listed on the NR in 1982.

PINOPOLIS HISTORIC DISTRICT NORTH
One of two historic districts in the Pinopolis area, this district consists of four contributing and three non-contributing properties. The area has retained its quiet community atmosphere by blocking several proposals in the past that would have attracted development. List on the NR in 1982.
PINOPOLIS HISTORIC DISTRICT SOUTH
One of two historic districts in the Pinopolis area, this district was the historic core of a
resort village and contains numerous 19th century summer homes and the Pinopolis Methodist Church. The area has retained its quiet community atmosphere by blocking several proposals in the past that would have attracted development. List on the NR in 1982.
NATIONAL HISTORIC LANDMARKS
The National Historic Landmarks (NHL) program is the sister program to the NR. Also maintained by the National Park Service, this program is much more selective about the properties designated as a National Historic Landmark. With only 2,600 designations nationwide, these properties must possess a high degree of historic integrity and must be of national significance. All NHL properties are automatically listed on the NR, if not already. Five historic resources in Berkeley County are designated National Historic Landmarks.The locations of these landmarks are also shown on Map 15.
ARCHEOLOGICAL SITES
Archeological resources in the Lowcountry may include any variety of Native American settlements and canoes, colonial ferries, plantation wharves, revolutionary gunboats, antebellum rice flats and post-Civil War phosphate barges. Approximately 2,200 sites have been surveyed within Berkeley County to determine the presence of potential archaeological resources. Many such sites are ultimately deemed not to contain important archeological resources. The Keller Site has particular archaeological significance and is the only site in Berkeley County listed in the NR. Exact archaeological locations are not publicly available due to the sensitive nature of these sites. Buried and submerged archaeological resources are best protected through the restriction of land disturbance activities within their proximity.
Pineville Chapel, constructed circa 1810. (Photo/S.C. Dept. of Archives and History)
Isaac Porcher House, Pinopolis Historic District North. (Photo/S.C. Dept. of Archives and History)
LEGACY SETTLEMENTS
Berkeley County’s history in agriculture and transportation led to the formation of several rural settlements throughout the County. These legacy settlements evolved from agricultural clusters or crossroad shops into small population centers. Furthermore, some legacy settlements were historically African American settlements. Map 16 shows the legacy settlements and their relationship to major roadways and waterbodies.
Like most early settlements, the foundations of these communities were often centered around churches or religious institutions, central markets, transportation hubs, local industry (like mining or milling), or access to water. Many of these communities are characterized by their rural lifestyles, the abundance of agricultural or forested land, and until recently, their isolation from urban and suburban development.
Community pride can play an important role in the lifestyles and local identity of residents in these areas with some having resided in these areas for generations, making them legacy residents. Therefore, additional considerations should be given to how development of land adjacent to or surrounding these communities will impact the unique community character. Communities such as Wando, Whitesville, and Pringletown are currently under pressure and at risk of being engulfed by the surrounding suburban development. The recent unparalleled growth in the region, particularly along I-26, US 176 and US 52, now threatens to infringe on the sense of place that these communities have and wish to maintain.
MAP 16: RURAL/LEGACY COMMUNITIES

UNIQUE NATURAL AND SCENIC RESOURCES
Fresh water swamps, rivers, tidal marshes and rural agricultural lands are some of the many natural and scenic features that define Berkeley County’s landscape. The bulk of these features generally involve the same natural resources described in the Natural Resources element of this Plan. As a major contributor to the local identity and quality of life for most residents, natural resources provide scenic value as well as cultural and recreational opportunities. Several smaller municipal and community park and recreation facilities in the county capitalize on the abundant natural and scenic resources, incorporating these valuable features into park programming and activities. Public boat ramps, private fishing camps, and numerous golf courses also create varying ways to experience Lowcountry culture. Some of these natural and scenic resources (also identified as community facilities) are as follows:
FRANCIS MARION NATIONAL FOREST
The Francis Marion National Forest was the site of multiple Revolutionary battles. Spanning nearly 259,000 acres, this area contains a range of ecosystems from pine forests and swamps to special geological features and wilderness areas. While most of these features are common among the Lowcountry, the sheer size of the forest, abundance of rare plants and endangered wildlife species, and an extensive network of trails sets Francis Marion apart from other conserved natural areas in the Lowcountry.
In addition to the scenic landscape, there are a wide range of recreational opportunities such as hiking, biking, canoe trails, shooting sports, and several boat launches, that enhances the unique experience. The National Forest Service strives to manage the forest resources in such a way that visitation will not change or impact the natural environment. The National Forest Office is located at 2967 Steed Creek Road in Huger.
CYPRESS GARDENS
Formerly one of the area’s largest rice plantations, Cypress Gardens is a 170-acre preserve located on the west side of the Cooper River, near the Cooper River Historic District, Strawberry Chapel & Childsbury Town Site, and Bonneau Ferry WMA Lake. Throughout the park’s history, natural disasters, particularly Hurricane Hugo in 1989 and the historic flooding in 2015, have greatly impacted the natural environment of the park.
The 80-acre Blackwater Swamp offers scenic views of the bald cypress and tupelo trees as well as countless other plants all of which provide habitat for numerous wildlife species. The Blackwater Swamp has served as a scenic location for several major motion pictures, including the Patriot and The Notebook. Cypress Gardens is a regional cultural resource not only for its scenery, but for its educational initiatives as well. The park offers several educational programs for schools and private groups, particularly hands-on-learning both indoors and outdoors in the swamp. In addition to the swamp, other major amenities offered include a swamparium, aviary, butterfly house, and nature trails (walking and boating).

Cypress Gardens, Moncks Corners
LAKES MARION AND MOULTRIE
Lakes Marion and Moultrie are major manmade hydrological features within South Carolina. A portion of Lake Marion and all of Lake Moultrie are within Berkeley County. These manmade lakes continue to provide transportation, recreation, and power to the state, as intended when constructed in the early 20th century. Additionally, these lakes provide habitats for numerous species of fish and plants. The dam, lock, and levee system that upholds these lakes also provide a unique landscape. The Palmetto Trail and other local trail systems allow for people to experience the unique scenery that these lakes provide to Berkeley County.
SANTEE, COOPER, AND WANDO RIVERS
The historical impact that rivers have had in Berkeley County cannot be understated, the Cooper River in particular. The land surrounding each river provides important ecological functions as well as provide habitats for plants and wildlife. Certain sections of the rivers are available for motorized and/or non-motorized boating. Many of the previously mentioned unique natural and scenic resources utilize the hydrology. The abundance of low-lying areas, wide and flat floodplains, and swamps or marshes that accompany these rivers define the Berkeley County and Lowcountry landscape.
OLD SANTEE CANAL STATE PARK
Since its establishment in 1989, Old Santee Canal Park has been another important park facility in Berkeley County that well represents the unique natural landscape of the Lowcountry. Located at 900 Stony Landing Road in Moncks Corner, the 195-acre park preserves the historical and natural resources along the Old Santee Canal and Biggin

Creek. This park allows visitors to witness the unique interaction between an old manmade structure (i.e., Santee Canal) and the natural environment as most of the canal way has been obscured by vegetation. Other cultural facilities located on-site include the Berkeley County Museum and Heritage Center, Stony Landing House, a learning center, and an interpretive center.
SC PALMETTO TRAIL
The Palmetto Trail is a planned 500-mile-long (380 miles currently constructed) trail system that traverses through over a dozen different counties in the state of South Carolina. Connecting the Blue Ridge Mountains to the Coastal Plains, this trail allows users to experience four different ecosystems and associated plants and animals. In Berkeley County, the Palmetto Trail travels through the Francis Marion National Forest and around Lakes Marion and Moultrie.
GOOSE CREEK RESERVOIR
The Goose Creek Reservoir is a scenic, 600acre drainage basin that provides locals and visitors with opportunities for fishing, boating, and birdwatching. Due to the reservoir being manmade, there is a lack of large and/or tall vegetation such as trees along the periphery but rather an abundance of plants and animals that thrive in wet, marsh-like environments.
FRANCIS MARION WILDERNESS AREAS
Hellhole Bay Wilderness and Swamp are located entirely within the Francis Marion National Forest. Hellhole Bay Wilderness is approximately 2,125 acres in size and offers camping, hiking, canoeing, birdwatching, and hunting. This area is a prime example of the Lowcountry landscape and scenery.
BONNEAU FERRY WMA
There are four lakes, totaling about 100 acres, that make up the Bonneau Ferry Wildlife Management Area. The primary intention for this unique WMA is for adult/youth fishing and hunting.
Lake Moultrie. (Photo/BCDCOG)
GULLAH GEECHEE CULTURAL HERITAGE CORRIDOR
Established through the National Heritage Areas Act of 2006, the Gullah Geechee Cultural Heritage Corridor and Commission are intended to highlight the Gullah Geechee people and their descendants. This corridor spans from Wilmington, NC to Daytona Beach, FL. The southern portions of Berkeley County, including Hanahan, parts of Goose Creek, and Daniel Island, are located within this federally designated cultural corridor.
According to the National Park Service:
“The Gullah Geechee Cultural Heritage Corridor Commission is charged with helping to achieve the goals of the Corridor designation: to recognize, sustain, and celebrate the important contributions made to the American culture and history by the Gullah Geechee; to assist state and local governments and public and private entities in South Carolina, Georgia, North Carolina, and Florida in interpreting the story of the Gullah Geechee and preserving Gullah Geechee folklore, arts, crafts, and music; and to assist in identifying and preserving sites, historical data, artifacts, and objects associated with Gullah Geechee people and culture for the benefit and education of the public.”


RELIGIOUS INSTITUTIONS
Places of worship represent perhaps the oldest cultural resource within the nation and Berkeley County. Many early church structures that are still in existence are listed on the National Register. St. James Church, St. Stephen’s Episcopal Church and Pompion Hill Chapel have also been designated as National Historic Landmarks.
Places of worship have often been the cornerstone of a community, particularly in more rural communities. They provide a variety of social services, leadership and support, community identity, in addition to opportunity for spiritual and cultural growth for residents. There are over 200 places of worship within Berkeley County.
One religious institution of particular significance is Mepkin Abbey, a Trappist Monastery near Cordesville. Established in 1949 on the site of the historic Mepkin Plantation, Mepkin Abbey meets its everyday living expenses through commercial agricultural operations. Open to the public, the Abbey provides a religious, cultural, and historical resource for residents and visitors. Concerts, lectures, religious services and open tours of the grounds allow members of the public to experience this resource.
The grounds at Mepkin Abbey. (Photo/BCDCOG)
Photo/File
MUSEUMS, ART, AND EDUCATIONAL INSTITUTIONS
When discussing cultural resources, people quickly think of museums, art galleries, or the theater, however, cultural resources can include any institution that contributes to the overall cultural output of a community. Museums, art, and educational institutions, whether public or private, can be considered cultural resources as well as community facilities. These institutions can provide entertainment, educational, and/or recreational opportunity for residents and visitors.
BERKELEY COUNTY MUSEUM
The Berkeley County Museum and Heritage Center, located at Old Santee Canal Park in Moncks Corner, is a significant cultural resource that provides public access to exhibits of the County’s history and its ties to natural resources. The 5,600 square foot state-of-the-art exhibit building traces the region’s history back 12,000 years. Other buildings on-site that are connected to the museum include the learning center and the interpretative center.
EDUCATION AND INFORMATION
The education system in Berkeley County is not only highly influential in the quality of life for residents, but greatly contributes to the cultural output of the County. Public school facilities, particularly structures constructed prior to 1940 and those originally constructed for the county’s African American communities, demonstrate the county’s history of providing educational opportunities for all residents. The county’s public school system provides a number of special

programs related to cultural enrichment and/ or personal development for students.
The Berkeley County Library System (BCLS) also offers an array of special services and programs for residents that want to learn and engage in the cultural and historic significance of Berkeley County. The BCLS’s main office is located at Berkeley County Administration Building in Moncks Corner. The Moncks Corner library houses the South Carolina Collection of history and genealogy resources, including books, pamphlets, and government documents.
Berkeley County Museum and Heritage Center.
nAtURAl RESOURCES
Berkeley County is home to an abundance of natural resources, including several hydrologic features, unique wildlife and habitats, wetlands, and soils, that all play a vital role in supporting the regional ecosystem. These resources provide habitats and refuge for plant and animal species, improve water quality, store and filter stormwater, and create a wide range of recreational opportunities for residents and visitors. However, development and growth pressures can jeopardize the integrity of the natural ecosystem by introducing adverse impacts such as nonpoint source pollution, nutrient enrichment, habitat loss, land conversion, and resource depletion or overuse. It is important for a community to understand the interaction between the natural and built environments. Oftentimes, natural resources contribute greatly to the community character and local identity of a community. Therefore, the preservation, conservation, and restoration of natural resources is essential in maintaining a high quality of life for residents. This chapter will detail the natural resources found in Berkeley County and elaborate on the ecological and societal importance each resource has on the County.
WEATHER AND CLIMATE
The climate of the Lowcountry has been an important factor throughout the history of the region, influencing agriculture, migration, health, and settlement patterns. The climate of an area is influenced by several factors, including but not limited to elevation or topography, latitude, land cover, proximity to oceans or large waterbodies, and the gulf streams. According to the Köppen Climate Classification, the climate in Berkeley County is considered humid subtropical.

Weather patterns are also greatly influenced by these factors, the gulf stream in particular which brings warm and moist air conditions from the Caribbean year-round. This causes Berkeley County to experience maritime tropical weather patterns, which are characterized by hot and humid summers, and cool to mild winters. According to data reported by the Berkeley County Airport, the ‘hot season’ or summer months in Berkeley County are from June to September whereas the ‘cool season’ or winter months fall between December and February.
During these summer months, the average daily high is above 85° F. The month of July is reported to be the warmest month of the year with an average high of 91° F and low of 75° F. July is also the muggiest month of the year, averaging 29.4 days as having a comfort level of muggy, oppressive, or miserable.
According to the Climate Mapping for Resilience and Adaptation (CMRA), between 1976 and 2005, Berkeley County averaged about 52.5 days with a high temperature greater than 90° F. As seen in Figure 79, this was much lower than many inland counties in South Carolina.

Photo/File
The ‘wet season’ in Berkeley County also occurs in the June to September time period. CMRA also reports that between 1976 and 2005, Berkeley County averaged 182.7 days of the year with precipitation or wet days, averaging 48.5 inches of precipitation annually. The number of consecutive wet days in Berkeley County averaged at 15.1 days during that 1976-2005 time period. July is reported to be the wettest month of the year averaging about 15 ‘wet days’ of the month. In contrast, February averages only about 6 wet days of the month making it the driest month of the year.
In addition to the gulf streams consistently bringing warm air from the Caribbean, the Appalachian Mountains in the western part of the state tend to block continental cold fronts from the north. This allows for Berkeley County to experience fairly mild winters with an average daily low below 65° F. January is reported to be the coolest month of the year with an average low of 39° F and high of 59° F. The mild winters in South Carolina are one of several reasons why the state has become a destination for retirees and draws tens of thousands of snowbirds annually.
One of the major drawbacks of a maritime tropical climate are tropical cyclones. Tropical cyclones, which are classified as either a tropical depression, tropical storm, or hurricane depending on wind speeds, are one of the most common natural disasters that can occur in Berkeley County. These large weather systems bring strong winds, heavy rainfall, and high storm surges to coastal and inland communities. In the South Atlantic, hurricane season typically begins in June and lasts until the end of November, however, trends suggest the August through October are the most common months for a tropical
cyclone to occur. The SC State Climate Office has recorded numerous severe weather events in Berkeley County, including tropical cyclones, damaging tornadoes, thunderstorm, and flash flood events. A summary of those events is detailed on the Climatology Offices website.
HYDROLOGIC FEATURES
Berkeley County has an extensive network of hydrologic features ranging from freshwater rivers, creeks, tributaries and lakes to tidal and brackish rivers, salt marshes and coastal wetlands. These features weave through the natural and built environments countywide, collecting and channeling rainfall. This geographic area, known as a watershed, captures and directs water into a common low point or outlet. These outlets can range from lakes and reservoirs to streams and rivers. Watershed boundaries typically extend along the surrounding topographic ridges and contain the land that drains into one of these outlets. In the Tri-County region, the Ashley, Cooper, Edisto, Santee, and Wando Rivers are all major outlets eventually leading to the Atlantic Ocean. These river systems provide several benefits to the adjacent areas such as irrigation, recreation, transportation, protection/shelter, and potable water.
Water and rainfall that flow through a watershed is part of the larger hydrologic cycle, which is one of the most influential naturally occurring cycles that can impact the natural and built environments. Common hydrologic features in a watershed include streams, rivers, lakes, floodplains,
and wetlands, however, other features such as stream buffers, forested lands, and different soil types can also be found within, and contribute to, the functionality of a watershed. Furthermore, the hydrologic cycle and different features are not surface-bound as different atmospheric and underground features and processes also contribute to the overall hydrologic cycle of the region.
Smaller watersheds combine together to form larger watersheds, each with a unique hydrologic unit code. Hydrologic Unit Codes (HUC) are assigned by the United States Geologic Survey (USGS) and serve as a cataloging system that arranges watersheds from largest to smallest area or region. Berkeley County lies within both the Santee and Edisto River Basins. As seen on Map 17, only the northern and eastern edges of the

county are within the Santee River Basin and by extension, the Santee River Subbasin and Lake Marion Subbasin. Most of the remaining portion of the County lies within the Cooper River Subbasin, which is part of the larger Edisto River Basin. Approximately 75% of the County lies within the Edisto River Basin and of this area, over 90% lies within the Cooper River Subbasin, as seen on Map 16.
A watershed can be adversely impacted by the removal of natural vegetation and ground cover, dredging of wetlands and marshes, realignment of streams and tributaries, and the removal of floodplains. Development of once natural areas or greenfields, such as forests and grasslands, can be detrimental to the hydrologic network, especially when developments contain large amounts of impervious surface coverage, such as roads, buildings, houses, and parking lots. Converting greenfields to impervious surfaces can increase the risk of flooding by altering the speed and volume of stormwater runoff and removes the natural filtration function therefore impacting water quality. These impacts are not limited to adjacent areas but can have a ripple effect downstream.
Thus, watershed protection is a critical component of water quality management. Healthy watersheds not only help to protect and improve water quality, but also provide ecological, societal, and recreational benefits for people and wildlife. Both the SC Department of Health and Environmental Control (DHEC) and the US Environmental Protection Agency (EPA) allow citizens to access information about the condition of their local watersheds and waterways by visiting the DHEC’s Watershed Atlas and EPA’s How’s My Waterway?
MAP 17: RIVER BASINS, SUBBASINS, AND WATERSHEDS

SOURCE WATERS AND WATER QUALITY
Potable water or drinking water, can be found either above ground (i.e., surface water) or below ground (i.e., groundwater). These sources of water, while different in location and extraction, are both susceptible to contamination. This section will identify the different sources of water for Berkeley County and the potential environmental impacts that these hydrologic features face.
SURFACE WATER
Surface waters are hydrologic features that flow aboveground, and include the waters in lakes, streams, rivers, and oceans. There are hundreds of miles of surface waterways in Berkeley County, accounting for about 10% of the county’s total area. Additionally, Berkeley and adjacent counties rely on surface water as a physical delineation of the political boundaries, most notably being the Cooper, Wando, and Santee Rivers. The abundance of waterways in Berkeley County also offers countless opportunities for recreation in the form of fishing, swimming, boating, and kayaking. They also serve as important tourism and economic drivers as residents and visitors alike spend both quality time and money on activities and experiences that center on exploring and enjoying the water throughout the County.
It is apparent that surface waters provide numerous benefits to the surrounding areas, however, perhaps the most vital of uses is being a source of potable water. As seen in Map 18, there are currently three water supply intakes in the Tri-County region, two of which are located in Berkeley County. The Edisto River and Bushy Park Reservoir (Back
River) water intakes provide potable water to the Charleston Water System (CWS). Santee Cooper operates two regional water systems through the Lake Marion Regional Water System, whose water intake is located in Orangeburg County along Lake Marion, and the Santee Cooper Regional Water System, whose water intake is located outside of Moncks Corner along Lake Moultrie.
Santee Cooper is also a major user of surface water for hydroelectricity. According to the 2021 Annual Water Use Report by DHEC, hydroelectric accounted for over 90% of the total surface water usage in Berkeley County in 2021. When excluding power-related usage, public water supply accounted for about twothirds of surface water usage and industry accounted for about 32%. Based on this report, Berkeley County was one of the top users of surface water in the state, however, when excluding power-related usage, the county drops into the middle of the ranks.
SOURCE WATER PROTECTION AREAS
The headwaters of the Ashley, Cooper, and Edisto Rivers all originate in Berkeley County. The headwaters and small tributaries of these major river systems converge and flow downstream to form the main river channels. Surface waters capture nearly everything that drains into it – not just rainfall – but also stormwater runoff, sediment, and contaminants. Therefore, to protect these important headwaters, which rural and urban areas often depend on for clean drinking water, these areas require special considerations. Source Water Protection Areas (SWPA) are designated as environmentally sensitive areas relating to the source water of a particular waterbody, which is typically a river, lake or reservoir. These areas often limit development or in some cases, prohibit
it all together. The intention is to preserve the hydrologic and natural features in these undeveloped areas which provide essential functions like reducing the speed and volume of flood waters and stormwater runoff, filter the water to remove pollution and contaminants, and extend the rate of infiltration for surface water to permeate into the ground, all of which enhances the health of the watershed.
Map 18, on the following page, shows the location of the SWPAs in the Tri-County region while Table 11 lists the major surface water features in Berkeley County along with some of the primary uses of the waterbody. Conserving and protecting these natural resources through carefully managed growth and development measures is critical for the health and quality of life of residents and visitors of Berkeley County.
GROUND WATERS AND AQUIFERS
Groundwater is a source of water found beneath the water table in areas known as aquifers. These areas are filled with permeable rock and other loose materials such as gravel or sand which allows for water to flow at various rates depending on the porosity of the materials. The most common way to access groundwater is through a manmade well or a natural spring. Nearly all of the urban area in Berkeley County relies upon a service provider, however, hundreds of homes in rural Berkeley County own private wells and rely on groundwater. In addition to the private extraction of groundwater, it is also used for municipal, industrial, and agricultural needs.
Both DHEC and the SC Department of Natural Resources (SCDNR) are tasked with monitoring groundwater levels and conditions to support the protection of groundwater
Table 11: List of Major Surface Waters and their Primary Uses
Major Surface Waters Primary Uses
Lake Marion (lower portion) Recreation, Water Source, Critical Habitat
Lake Moultrie Recreation, Water Source, Critical Habitat
Tailrace Canal Transportation
Back River and Bushy Park Reservoir Water Source, Industrial
Cooper River Recreation, Water Source, Transportation
East Branch Cooper River Recreation
Wando River Transportation
Goose Creek and Goose Creek Reservoir Water Source
Santee River Hydroelectricity, Critical Habitat
MAP 18: SOURCE, SURFACE AND GROUNDWATER RESOURCES
resources across the state. DHEC established Groundwater Protection Zones (GPZ) around permitted public water supply wells. Map 18 shows the location of the GPZ within the region. In 2001, DHEC designated Charleston, Berkeley, and Dorchester Counties as the Trident Capacity Use Area per the Groundwater Use and Reporting Act. This designation was made after investigations by the SCDNR found significant groundwater declines, saltwater intrusion, and large cones of depression. As a designated capacity use area, anyone who withdraws three million gallons or more in any one month must receive a permit from DHEC. The amounts of groundwater withdrawn are annually reported to DHEC so the usage can be monitored.

According to the 2022 Trident Capacity Use Area Groundwater Evaluation Report, in 2021, approximately 95% of the used groundwater in Berkeley County was reportedly for industrial purposes, Nucor Steel being the largest user. However, in the region as a whole, public water supply was the top reported use of groundwater in 2021 at 42%, followed closely by industry at 35%. About two-thirds of the Trident areas total reported used groundwater was from the Charleston Aquifer, which is one of six aquifers under the Lowcountry.
Water is constantly moving through the hydrologic cycle, both above and below ground. Much like surface waters, groundwater and aquifers are susceptible to contamination and pollution from sources such as bacteria, excess nutrients, chemicals, fertilizers, and other substances as they get carried by stormwater runoff and infiltrate through the ground. Groundwater can also be at risk of depletion as demand grows (often from development), land cover becomes less permeable, and the recharge rate decreases.
STORMWATER
Stormwater is the runoff that occurs when precipitation flows over land or impervious surfaces and does not infiltrate into the ground. During the infiltration process, soils, minerals, and vegetation can filter out pollutants, excess nutrients, and bacteria from the stormwater and help replenish the aquifer. However, when stormwater is collected on impervious surfaces such as roofs and asphalt, sediments, pollutants, and other harmful contaminants are picked up along the way. The water collected often runs directly into storm drains, drainage ponds, and waterways, bypassing any type of natural or manmade stormwater infrastructure.

Polluted stormwater runoff can negatively impact plants, fish, animals and even people. This issue is more pervasive in areas where natural vegetation has been removed and replaced with impervious surfaces (i.e., greenfields to impervious surfaces). This conversion of land cover can increase the risk of flooding by altering the speed and volume of runoff, removes the natural filtration function, adds contaminants into the watershed, and decreases water quality. Additional threats from stormwater runoff include pollution from agricultural, commercial, industrial, and residential uses.
As mentioned previously, the impacts that pollutants and contaminants can have are not limited to the surrounding area, but can impact all downstream species of life that depend on clean water for survival.
STORMWATER MANAGEMENT
The EPA, DHEC and local jurisdictions operate regulatory programs related to stormwater discharge. The federal National Pollutant Discharge Elimination System (NPDES) is a permit-based regulatory stormwater program designed to prevent stormwater runoff from transporting harmful pollutants into local surface waters. The program is implemented at the State level and regulates stormwater discharges from three potential sources: municipal separate storm sewer systems (MS4s), construction activities, and industrial activities.
Berkeley County is a regulated small NPDES MS4 operator. The intention of the EPA’s MS4 program is to “improve the Nation’s waterways by reducing the quantity of pollutants that stormwater picks up and
carries in storm sewer systems during storm events.” MS4 entities are required to implement measures within their jurisdictions that prevent and control stormwater pollution from developed areas.
As a regulated jurisdiction, Berkeley County’s Stormwater Management Department operates a Stormwater Management Program that implements a Stormwater Management Plan (SWMP). The SWMP aims to reduce the amount of runoff pollution by educating the public about how they can reduce the risk of polluting rainwater, permitting and monitoring new construction sites’ activities, and monitoring potential discharge sources that drain directly to larger waterbodies. The County also manages the City of Goose Creek’s and City of Hanahan’s municipal MS4 permits through Intergovernmental Agreements.
Berkeley County has proactively contracted with Clemson University’s Cooperative Extension Service’s Carolina Clear program to educate citizens on issues associated with polluted stormwater runoff and to raise awareness regarding the protection of water resources. The county is also a member of the Ashley Cooper Stormwater Education Consortium (ACSEC) and participates as a member of the BCDCOG Stormwater Management Committee.
Uncontrolled growth and development are key contributors that affect not only the quality of runoff (in terms of pollution), but also the quantity (speed and volume) of runoff from impervious surfaces. Without proper management and mitigation techniques, these factors can affect the hydrologic environment, and can result in habitat degradation, decreased biological diversity, an increase in sedimentation and erosion, and flooding. The County encourages developers to employ Best Management Practices (BMPs), which are engineered solutions for treatment of stormwater runoff that helps manage and mitigate the impacts associated with stormwater. BMPs can include structural systems that are designed to address water quantity and/or water quality concerns by providing for stormwater detention and allowing for the treatment and reduction/ removal of nutrients or other pollutants before they reach surface waters.
However, developers are encouraged to employ solutions such as detention basins, construct stormwater wetlands, restore riparian buffers, create bioswales and bioretention areas that are more compatible with the natural environment and can be just as effective in mitigating the impacts of stormwater runoff.

FLOODPLAINS
Floodplains are another important natural resource that provides an essential function in the hydrologic cycle. A floodplain is an area that temporarily stores, filters, and process water within a watershed. They are located in low-lying areas, typically adjacent to other hydrologic features like streams, rivers, lakes, and the coast. The low topographic relief and relatively flat terrain of Berkeley County and the Lowcountry puts much of the region at an increased risk of flooding.
The Federal Emergency Management Agency’s (FEMA) National Flood Insurance Program (NFIP) has mapped areas subject to flooding and areas of flood hazard within the County. FEMA maintains these flood maps which detail the location and severity of the different flood zones, particularly the 100-year and 500-year floodplain. FEMA also designates areas as Special Flood Hazard Areas (SFHA) where the NFIP’s floodplain management regulations must be enforced. In Berkeley County, this includes SFHA Zones A, AE, and VE where zones A and AE are the more at-risk zones for damage from flooding. The area within Zone VE, most of which are adjacent to the Cooper and Wando Rivers like Daniel Island and the Cainhoy Peninsula, are subject to higher risks and potential hazards from storm waves and are therefore deemed a high-risk coastal area.
The proximity of Berkeley County to the coast and the abundance of waterways can make several areas vulnerable to flooding, both from heavy rains and/or storm surges. Map 19 shows the 100-year and 500-year flood zones in Berkeley County. Due to the dam and levee system around Lakes Moultrie and Marion, it
is expected that there are limited flood zones in the adjacent areas. However, areas along the Cooper, Wando and Santee Rivers appear to be the most affected by the 100-year flood zone (A, AE, and VE). However, there are several smaller creeks and tributaries that branch out causing these flood zones to impact more urbanized areas, such as the Goose Creek/Turkey Creek in Hanahan, Back River surrounding the southern developments in Moncks Corner, and Beresford/Nowell Creek around Daniel Island. The impacts of flooding will be discussed in greater detail in the Resiliency Element of this Plan as well as the Berkeley County Hazard Mitigation Plan (BCHMP).
For more information on flood zones, visit FEMA’s Flood Map Service Center. Berkeley County’s Floodplain Management website offers information regarding possible flood insurance and development/permitting requirements, based on property location.
Note: A 100-Year Flood is not a flood that happens every 100 years but rather a flood that has a one percent chance of occurring in a 100-year period. Several factors can impact the chance of a 100-year flood to occur such as soil saturation, size of the watershed, duration of rainfall, storm intensity, slopes/topography, and land cover.

MAP 19: FEMA’S FIRM FLOOD HAZARD ZONES

WETLANDS
Wetlands are areas of land where water covers the soil, or where water is present at or near the surface of the soil for extended periods of time during the year. These areas of land are often very flat and are common along rivers, streams, lakes, and coastal shores, however, are not limited to those locations. The US Fish and Wildlife Service uses the Cowardin Classification System to classify wetlands based on a number of characteristics, such as saturation levels, salinity, plant types, pH levels, and soil types. Map 20 shows the five different types of wetlands which include:
• Marine – areas exposed to the open ocean and waves
• Estuarine – areas exposed to a mixture of freshwater and saltwater that are partially enclosed by lands
• Riverine – areas within a flowing river channel
• Lacustrine – areas within freshwater lakes, reservoirs, or other freshwater bodies
• Palustrine – freshwater areas that are dominated by trees, shrubs and other similar vegetation that are not associated with rivers or lakes.
Due to its location, all but marine-type wetlands can be found in Berkeley county. As of 2020, there were nearly 260,000 acres of mapped wetlands within the county, comprising of about 36% of the total land area. Palustrine wetlands accounted for about 240,000 acres, or about 93% of the total wetlands mapped alone. With that being said, Palustrine wetlands were further classified based on the presence of specific vegetation.
MAP 20: WETLAND TYPES - NATIONAL WETLAND INVENTORY


The large band of palustrine forested/shrub wetlands along the Santee River is perhaps the most noticeable feature shown on Map 19. This area, and others like it, perform important functions in the hydrologic cycle as well as the ecological cycle. Some of these functions include protection from erosion and sedimentation, storage and filtration of stormwater, restoration of groundwater and aquifers, habitation for vegetation and
wildlife, and recreation for residents and visitors. Wetlands along coastal shores also act as a buffer from wave action, storm surges, and erosion. Most of the estuarine wetlands in Berkeley County are near the confluence of the Cooper and Wando Rivers, as seen on Map 20.
As part of the hydrologic cycle, the main function of a wetland is similar to a floodplain;
to store and filter excess water. This role becomes increasingly more important in more urbanized areas like Hanahan and Goose Creek. These areas are prime examples of how wetlands interact with and adapt to the surrounding environment, providing different functions based on the surrounding areas, whether that be mitigating stormwater or supporting a diverse ecosystem.
Numerous plants and animal species rely on wetlands as a source of food, water, shelter, and nesting grounds. In the Lowcountry, estuarine wetlands serve as a spawning habitat and nursery for many oceanic species like fish, blue crabs, shrimp, and other shellfish that are used for food sources. Furthermore, as part of the filtration and infiltration of stormwater process, wetlands remove and store excess nutrients leading to an abundance of nutrient rich soils and plants. The abundance of nutrients and a large food chain allows for wetlands to host some of the richest and diverse ecosystems. This diversity that wetlands provide to South Carolina also serves as an important economic and recreational resource as fishing and waterbased recreation is a major component of the local economy.
Despite the invaluable benefits that wetlands provide, they continue to be threatened by development pressures and activities. As the population grows throughout the region, the stress on the County’s wetlands will likely only increase as not only are wetlands being removed in favor of development but the increasing demand for recreational amenities such as fishing, swimming, kayaking, birdwatching, etc. can also put strain on the wetlands and its ecosystem.
An example of a Carolina Bay wetland area within Francis Marion National Forest. (Photo/USDA Forest Service)
COASTAL RESOURCES
Berkeley County’s location in coastal South Carolina brings about additional regulatory oversight of certain protected coastal resources such as tidal creeks and rivers and beaches. These regulations are administered by DHEC’s Office of Ocean and Coastal Resource Management (OCRM).
All of Berkeley County lies within OCRM’s Coastal Zone. This zone is defined as all coastal waters and submerged lands seaward to the State’s jurisdictional limits and all lands and waters in the counties of the State which contain any one or more of the critical areas. This includes Beaufort, Berkeley, Charleston, Colleton, Dorchester, Horry, Jasper and Georgetown counties. The Coastal Zone encompasses approximately 8,224 square miles of land and state waters, which is about 24% of the state’s total land and water area.
The southernmost portion of Berkeley county lies within the OCRM Critical Area. These areas are deemed critical due to the presence of any one or more of the following features: coastal waters, tidelands, dune systems and/or beaches. In Berkeley County, this includes areas such as Daniel Island and the Cainhoy Peninsula/ Wando area that border the tidal portions of the Cooper and Wando Rivers and their tributaries. The boundaries of OCRM’s Coastal Zone and Critical Area are illustrated in Map 21.
OCRM has direct permitting authority in the Critical Areas and state law mandates the regulation of proposed impacts to the coastal resources within these areas, which typically includes the building of docks, bulkheads, boat ramps and dredging and/or filling. They also hold indirect permitting authority over development activities in the Coastal Zone.
Upon review of development proposals, OCRM may issue a Coastal Zone Consistency Certification, when applicable, in conjunction with other necessary state and federal actions.

MAP 21: OCRM’S COASTAL ZONE & CRITICAL AREA
LAND RESOURCES
ECOREGIONS
Berkeley County is one of the largest counties in the state of South Carolina by size, having a land area of approximately 1,100 square miles. In addition to its large size, the location of Berkeley County provides numerous land resources available for utilization. Land resources often include the physical, geological, ecological, environmental, and socio-economic resources of an area. The EPA groups these areas or ecoregions based on similar types, quality, and quantity of these resources. Land resources of a region can be defined as a geographic area that is characterized by a particular pattern of soils, land uses, types of farming, various minerals, and other raw materials. As seen on Map 22, most of Berkeley County lies within the Middle Atlantic Coastal Plains Ecoregion with the area around Lake Marion within the Southeastern Plains Ecoregion and the area around the Cooper and Wando Rivers within the Southern Coastal Plain Ecoregion.
MAP 22: EPA ECOREGIONS

SOIL TYPES AND TEXTURES
Soil is a naturally occurring material that is comprised of biotic factors such as organic material, plants, and animals, and abiotic factors such as minerals, water, and air. Soil can be produced from rocks or any parent material through different processes like weathering, erosion, and decomposition. Other factors such as water wind, climate, gravity, topology, chemical interactions, living organisms, and pressure can help break down parent material. Soils are vital to sustain plant and animal life, regulate water flow, filter pollutants and nutrients, and provide stability for infrastructure.
While there are several ways to classify soils, this discussion focuses on soil type and texture. According to the United States Department of Agriculture, there are 12 major soil texture classifications ranging from sandy to silty to clay-like. Loam, however, is a balanced blend between sand, silt, and clay, and is typically the ideal soil composition for cultivation. Figure 80 shows how the composition of the soil (percent of sand, silt, and clay) determines the soil type and texture.
Due to the large particle size of sand versus the smaller particle size of silt and clay, sandy soils are ideal for air and water infiltration, however, are also the most susceptible to drought, struggles to retain nutrients, and has the greatest potential for stormwater runoff. The accelerated infiltration rate of sandy soils in Berkeley County and the Lowcountry help recharge the underground aquifers.
Clay and silty soils have much smaller particles which prolongs the infiltration process, therefore, creating ideal soil conditions for wetlands. Prime examples being the downstream areas of the Cooper River which has a siltier clay composition and the drainage basin for the Santee River which is mostly a clay loam soil type. While the infiltration rate is longer than sandy soils, this allows for the retention of more nutrients creating very fertile soils. Furthermore, clay and silty soil types are more resistant to erosion and weathering again due to the particle size and compactness of the soil.
FIGURE 80: SOIL COMPOSITION, TYPE, AND TEXTURE TRIANGLE


As seen on Map 23, most of the soils in Berkeley County have a sandy composition with over two-thirds being classified as either sandy loam or loamy sand. Figure 81 further illustrates the composition of soils in Berkeley County by type and texture.


MAP 23: SOIL TYPES AND TEXTURES

PRIME AND IMPORTANT FARMLANDS
Under the 1981 Farm Bill, the Farmland Protection Policy Act limits federal activities that unnecessarily convert farmlands to other uses. As part of the implementation of this act, the Natural Resource Conservation Services (NRCS), in cooperation with other interested federal, state, and local government entities, inventoried the land throughout the nation, identifying high quality agricultural soils as prime farmland, unique farmland, and land of statewide or local importance.
The US Department of Agriculture defines prime farmland as:
“land that as the best combination of physical and chemical characteristics for producing food, feed, forage, fiber, and oilseed crops and is available for these uses. It could be cultivated land, pastureland, forestland, and other lands, but is not urban or built-up land or water areas.”
As seen on Map 24, a fair amount of Berkeley County is classified as prime farmland while about half is classified as farmland of statewide importance. Soils with high concentrations of either sand, silt, or clay are not best suited for agriculture, however, as mentioned previously, still contribute to the functionality and sustainability of ecosystem.
In addition to these large areas being well-suited for agricultural operations, unsurprisingly, some of these areas are also well-suited for development, particularly in the urban fringes near Goose Creek, Moncks Corner, and Summerville.
MAP 24: PRIME AND IMPORTANT FARMLANDS

CONSERVATION LANDS
Conservation is the care and protection of natural resources for current and future generations, and includes not only the preservation of natural resources, but also supports the sustainable use of those resources by humans for activities such as hunting, forestry or recreation. Efforts related to natural resource protection in Berkeley County are currently led by public, private and non-profit organizations. These entities work to ensure that the County’s valuable natural resources are protected and available for enjoyment both for now and in the future.
OPEN SPACE & PROTECTED LANDS
Numerous parcels of land across the County are protected from future development and associated impacts by conservation easements. A conservation easement is a voluntary designation for land, bound by a legal document, that is used to protect significant historic, scenic, archeological, natural and cultural resources by restricting undesirable land uses from occurring on the property. Conservation easement holders in the county include the Lord Berkeley Conservation Trust, Lowcountry Land Trust, the South Carolina Department of Natural Resources, The Nature Conservancy, the National Audubon Society and Ducks Unlimited, Inc. Map 25 shows the protected lands within and around Berkeley County, which include those under federal, state, and county ownership, wildlife management areas, national wildlife refuges and national forests.
MAP 25: PROTECTED AND CONSERVED LANDS

FRANCIS MARION NATIONAL FOREST
The Francis Marion National Forest is one of several nationally protected forested lands in South Carolina. Located in eastern Berkeley County and portions of Charleston County, the US National Forest Service owns, maintains, and operates the forest lands and the various supporting facilities. Spanning nearly 259,000 acres, this area encompasses nearly all of eastern Berkeley County. Small rural communities such as Honey Hill, Shulerville, Huger, Macedonia, Alvin, and Cordesville are either surrounded or along the periphery of the National Forest. Besides these few rural communities and any roads or railroads, most of the Francis Marion remains undisturbed, allowing for numerous plants and wildlife to thrive in this vast ecosystem. There are currently four wilderness areas located within the National Forest, Hell Hole Bay, Wambaw Swamp, Little Wambaw Swamp, and Wambaw Creek. Furthermore, as discussed in the Community Facilities chapter, there are a wide range of recreational opportunities such as hiking, biking, canoeing, shooting sports, camping, and picnicking offered through the National Forest Service.
OTHER MAJOR CONSERVED LANDS
Besides the Francis Marion National Forest, there are several other significant areas that are protected.
FRANCIS BEIDLER FOREST
The Francis Beidler was initially established to protect an old growth forest (approximately 1,800 acres) but has evolved into a major habitat sanctuary for plants and wildlife. Owned and operated by the Audubon Society, the Francis Beidler now currently offers passive recreation opportunities through a trail and boardwalk network.

Marrington Plantation on Joint Base Charleston, Naval Weapons Station, S.C. (Photo/U.S. Air Force, Senior Airman Jared Trimarchi)
NAVAL WEAPONS STATION
The Naval Weapons Staton (NWS) is approximately 17,000 acres in size and is located along the western bank of the Cooper River. This military base is used by five different branches of the US armed forces. In addition to the military installations on site, about 10,000 acres are forested and wetland areas.
WILDLIFE MANAGEMENT AREAS & REFUGES
South Carolina is home to over 1.1 million acres of land that is available for public access as part of the State’s Wildlife Management Areas (WMA). These areas are typically leased longterm by state wildlife agencies from private
landowners or the forest industry, but some are under public ownership by Santee Cooper, the US Army Corps of Engineers or SCDNR. These protected areas play a critical role in the conservation of fish, wildlife, and other natural resources, however, many of the WMA also provide limited recreational opportunities such as hunting, fishing, kayaking, birdwatching, photography, and hiking as well as environmental education.
Berkeley County is home to several WMAs including the Bonneau Ferry WMA, Canal WMA, Hatchery WMA, Moultrie Hunt Unit WMA, and the Francis Marion National Forest (which includes four Wilderness Areas), all of which can be found on Map 24.
GREEN INFRASTRUCTURE
AND HABITAT CORES
Most of the natural resources identified in this chapter are part of a larger green infrastructure network. A green infrastructure (GI) network is the relationship and interconnectedness of all the natural resources within an area but can include economic, cultural, and recreational resources as well. Natural resources, including streams, wetlands, forested lands, agricultural soils, and parklands, provide habitat for dozens of plants and wildlife and improve the quality of life of residents and visitors. Large areas (100+ acres) with high concentrations of natural resources and/or undeveloped lands form habitat cores. According to the South Carolina Green Infrastructure Plan (SCGIP) Hub site, “Habitat cores are intact habitats not overly bisected by roads or other breaks. They support species that require undisturbed habitats to thrive.” As seen on Map 26, much of rural Berkeley County is considered a habitat core with major roadways, rural communities, suburbia, and active farmlands creating pockets of non-habitat core areas.

MAP 26: BCD REGIONAL HABITAT CORES
As seen in Figure 82, 69% of the BCD Region is considered a habitat core with about half (47%) of that area currently protected. Conserving green infrastructure and thus protecting these habitat cores, is crucial in maintaining a sustainable balance between the built environment and natural environment. The SCGIP identifies several risks to these habitat cores, including impaired streams, development, solar development, sea level rise, and storm surge. Figure 83, which is an excerpt from the SCGIP BCDCOG Report, indicates that solar development is the largest risk to the habitat cores in the region.
While identifying the habitat cores is an essential part when creating a GI network, identifying the habitat corridors is just as important. These corridors serve as the primary transportation route for wildlife between the different habitat cores. Steams and stream buffers are ideal corridors as they can provide numerous food, shelter and transportation for dozens of wildlife species. Figure 84 shows the intact habitat cores by connectivity importance in and surrounding Berkeley County. Areas around Lake Moultrie, the Santee River, and Wassamassaw Swamp were identified as top priority.
Successful GI networks can provide numerous environmental and societal benefits such as protecting historic, cultural, and natural resources, improve water and air quality, reduce the heat island effect, provide opportunity for scenic trails, blueway trails, and other recreational activities, and reduce the cost of stormwater management infrastructure by supplying natural stormwater management infrastructure. Using GI cores and corridors to connect different historic, cultural, natural, recreational, and economic sites through a trail system has proven economically beneficial for those involved.


Figure 83: BCD Risks Excerpt from SC Green Infrastructure Plan, BCDCOG Report
Figure 84: Esri’s Green Infrastructure Initiative Intact Habitats by Connectivity Importance
Map 27 illustrates the SCGIP priority cores in the BCD Region as well as the state and locally identified corridors. These habitat core areas were identified by the COGs during the SCGIP planning process as top priority. In the BCD Region, areas along major rivers, such as the Santee, Edisto, Cooper, Wando, Ashley, Stono, Kiawah, and Wadmalaw, are identified as high priority along with areas within the Francis Marion, Francis Beidler, and Cape Romain, and areas around Lakes Marion and Moultrie. These habitat cores, along with other environmentally sensitive resources, such as wetlands, streams and stream buffers, should be taken into consideration when developing future land use maps, action plan items, and policy recommendations. Although this does constrain the area for development around the region, the environmental and societal benefits will outweigh these limitations.
With the recent publication of the SC GIP and Esri’s Green Infrastructure Initiative, there is data readily available for communities to start proactively planning to establish a GI network within the County as new developments are designed.
Note: Esri’s Intact Habitats by Connectivity Importance uses a different methodology and classification system than the SCGIP when identifying priority cores.
MAP 27: BCD REGIONAL PRIORITY HABITAT CORES

RESOURCE SENSITIVE AREAS
As discussed throughout this Element, Berkeley County has an abundance of natural resources that should be taken into account before, during, and after a development is proposed. Map 28 illustrates just how much of Berkeley County is covered by its network of natural resources. This map overlays the county’s inventory of wetlands, flood zones, protected lands and intact habitat cores (scores 3-5).
Although most of the protected lands in the County are focused on the eastern side of the Cooper River, there are still large areas of land that have an abundance of natural resources that would be ideal targets for conservation and preservation efforts.
MAP 28: RESOURCE SENSITIVE AREAS

PROTECTED SPECIES AND HABITATS
THREATENED & ENDANGERED SPECIES
The Federal Endangered Species Act (ESA) of 1973 had two purposes: to protect certain plants, animals, fishes, and sensitive habitats from extinction and to plan for the recovery of these species to the point where this act no longer applies. This legislation enabled federal and state agencies to survey and designate these certain species on a multi-level scale that signifies the protection and recovery efforts needed for their survival. At the federal level, this list of species is administered by the US Fish and Wildlife Service (USFWS) and National Marine Fisheries Service (NMFS) whereas state wildlife agencies, such as SCDNR, administers the state listings.
There are numerous categories that the USFWS use to define a listed species, however, the most common categories are:
• Endangered (E) – which is any species in danger of extinction throughout all or a large portion of its range.
• Threatened (T) – which includes any species likely to become endangered within the foreseeable future.
• Candidate (C) – which is any species that the USFWS has sufficient information on its biological status and threats to propose it as endangered or threatened under the ESA. These species are not yet protected.

These categories are also used for state listings, however, some state agencies have other designations for species, such as SCDNR and their State Wildlife Action Plan.
In 2015, SCDNR published the State Wildlife Action Plan (SWAP) which identified the species of greatest conservation need in the state. The species listed in this Plan, which include terrestrial, freshwater, marine, and plant priority species, were given a priority ranking of moderate, high, and highest. In addition to the priority listings, the SWAP also provides protection guidelines for counties and municipalities to review and adapt to meet local conservation needs.


Species listed as either endangered or threatened at the federal (G Rank) or state (S
Rank) level were instantly given at least a high priority in the SWAP listing. According to a dashboard administered by SCDNR’s Natural Heritage Program (SCNHP), there were 224 tracked species in Berkeley County as of 2022, which included six federally listed endangered species, five federally listed threatened species, seven at-risk species, one candidate, one proposed to be federally endangered, and one protected through the Bald & Golden Eagle Protection Act.
Table 12 lists all of the SWAP species in Berkeley County along with any Federal and/or State designations. Specific locations of these species are not made public to further protect them from harm, however, the general location can be seen on Map 29.
Painted Bunting. (Photo/File)
MAP 29: STATE WILDLIFE ACTION PLAN IDENTIFIED SPECIES & HABITATS

Table 12: List of SWAP Identified Priority Botanical and Zoological Species (Page 1 of 6)
Botanical Species
Tiedemannia canbyi Canby's Cowbane
Schwalbea americana Chaffseed
Lindera melissifolia Southern Spicebush
Pondberry Narthecium americanum Yellow Asphodel
Rhexia aristosa Awned Meadow-beauty
Bristly Meadow-beauty
Lobelia boykinii Boykin’s Lobelia
Macbridea caroliniana Carolina Birds-in-a-nest
Carolina Macbridea
Sporobolus pinetorum Carolina Dropseed
Savanna Dropseed
Carex chapmanii Chapman's Sedge
Coreopsis integrifolia Chipola Dye-flower
Cileate-leaf Tickseed
Rhynchospora pleiantha Coastal Beaksedge
Sporobolus curtissii Curtiss’s Dropseed
Ludwigia lanceolata Lanceleaf Seedbox
Myriophyllum laxum Loose Water-milfoil
Calopogon multiflorus Many-flowered Grass-pink
Agrimonia incisa Pineland Agrimony
Plantago sparsiflora Pineland Plantain
Litsea aestivalis Pondspice
Chasmanthium nitidum Shiny Spanglegrass
Thalictrum macrostylum Small-leaved Meadowrue
Orthochilus ecristatus Spiked Medusa
Smooth-lipped Eulophia
Iris hexagona Anglepod Blue Flag
Asplenium resiliens Blackstem Spleenwort
Lachnocaulon minus Brown Bogbutton
Trillium pusillum var. pusillum
Table 12: List of SWAP Identified Priority Botanical and Zoological Species (Page 2 of 6)
Botanical Species
Carolina Least Trillium
Carolina Dwarf Trillium
Lilaeopsis carolinensis Carolina Lilaeopsis
Tridens carolinianus
Carolina Triodia
Carolina Fluffgrass
Agrimonia pubescens Downy Agrimony
Carex elliottii Elliott’s Sedge
Platanthera integra
Golden Fringeless Orchid
Yellow Fringeless Orchid
Utricularia macrorhiza Greater Bladderwort
Rhynchospora harperi Harper's Beaksedge
Spiranthes laciniata Lace-lip Ladies'-tresses
Ruellia strepens Limestone Wild-petunia
Rhynchospora scirpoides Long-beak Beaksedge
Rhynchospora scirpoides Long-beak Beaksedge
Ophioglossum petiolatum Long-stem Adder’s-tongue
Steironema hybridum Lowland Loosestrife
Marl Spleenwort
Carolina Spleenwort
Asplenium heteroresiliens
Wagner's Spleenwort
Morzenti's Spleenwort
Habenaria quinqueseta Michaux’s Orchid
Andropogon perangustatus Narrow-leaved Bluestem
Eryngium ravenelii Ravenel's Eryngo
Eupatorium recurvans Recurved Eupatorium
Xyris flabelliformis Savanna Yellow-eyed-grass
Agalinis aphylla Scale-leaf Agalinis
Rhynchospora galeana Short-bristle Beaksedge
Xyris brevifolia Shortleaf Yellow-eyed-grass G4G5
Liatris gracilis Slender Blazing-star
Rhynchospora cephalantha var. attenuata Small Bunched Beaksedge G5T3?
Not Applicable Not Applicable
Not Applicable Not Applicable
Not Applicable Not Applicable
Not Applicable Not Applicable
Not Applicable Not Applicable
Not Applicable Not Applicable
Not Applicable Not Applicable
Not Applicable Not Applicable
Not Applicable Not Applicable
Table 12: List of SWAP Identified Priority Botanical and Zoological Species (Page 3 of 6)
Botanical Species
Peltandra sagittifolia Spoonflower
White Arrow-arum
Quercus similis Swamp Post Oak
Delta Oak
Three Birds Orchid
Triphora trianthophoros var. trianthophoros
Nodding Pogonia
Nodding Ettercap Bacopa innominata Tropical Water-hyssop
Carex stricta Tussuck Sedge
Upright Sedge Cladium mariscoides Twig-rush
Fen-sedge Smooth Sawgrass
fulvius Eastern Coral Snake
borealis Eastern Red Bat
floridana Florida Green Watersnake
Anguilla rostrata
Table 12: List of SWAP Identified Priority Botanical and Zoological Species (Page 4 of 6)
Zoological Species
Trichechus manatus Florida Manatee
Ambystoma cingulatum Frosted Flatwoods Salamander
Centronyx henslowii Henslow's Sparrow
mediocris Hickory Shad
cinereus Hoary Bat
Sternula antillarum Least Tern
Egretta caerulea Little Blue Heron
mimicus Mimic Glass Lizard
plexippus Monarch Butterfly
septentrionalis Northern Long-eared Bat
intermedius Northern Yellow Bat
Passerina ciris Painted Bunting
Pituophis melanoleucus Pinesnake
Corynorhinus rafinesquii Rafinesque's Big-eared Bat
borealis Red-cockaded Woodpecker
Lasiurus seminolus Seminole Bat
Acipenser brevirostrum Shortnose Sturgeon
austroriparius Southeastern Bat
simus Southern Hog-nosed Snake
Elanoides forficatus Swallow-tailed Kite
Ambystoma tigrinum Tiger Salamander
Perimyotis subflavus Tricolored Bat
Not Applicable Not Applicable
Not Applicable Not Applicable
Federally Endangered (Proposed) Not Applicable
Table 12: List of SWAP Identified Priority Botanical and Zoological Species (Page 5 of 6)
Eudocimus albus White Ibis
Mycteria americana Wood Stork
Lampsilis cariosa Yellow Lampmussel
leucocephalus Bald Eagle
Icterus galbula Baltimore Oriole
Enneacanthus chaetodon Blackbanded Sunfish
Malaclemys terrapin Diamond-backed Terrapin
Crotalus adamanteus Eastern Diamond-backed Rattlesnake
Lampsilis radiata
Ligumia nasuta
Somatogyrus virginicus Panhandle Pebblesnail
Rhadinaea flavilata Pine Woods Littersnake
Lampsilis splendida Rayed Pink Fatmucket
Elliptio roanokensis Roanoke Slabshell
Clemmys guttata Spotted Turtle
Limnothlypis swainsonii Swainson's Warbler
Atlanticoncha ochracea Tidewater Mucket
Egretta tricolor Tricolored Heron
Trachemys scripta Yellow-bellied Slider
Anhinga anhinga Anhinga
Enneacanthus obesus Banded Sunfish
Procambarus enoplosternum Black Mottled Crayfish
Elliptio angustata Carolina Lance
Elliptio congaraea Carolina Slabshell
Procambarus chacei Cedar Creek Crayfish
Migratory Bird Treaty Act Not Applicable
Not Applicable Not Applicable
Not Applicable Not Applicable
Not Applicable Not Applicable
Table 12: List of SWAP Identified Priority Botanical and Zoological Species (Page 6 of 6)
Zoological Species
Deirochelys reticularia Chicken Turtle
Procambarus ancylus Coastal Plain Crayfish
Terrapene carolina Eastern Box Turtle
Villosa delumbis Eastern Creekshell
Elliptio complanata Eastern Elliptio
Sciurus niger Eastern Fox Squirrel
Elassoma evergladei Everglades Pygmy Sunfish
Ameiurus platycephalus Flat Bullhead
Ardea herodias Great Blue Heron
Notropis chalybaeus Ironcolor Shiner
Ammospiza maritima macgillivraii Macgillivray's Seaside Sparrow
Macrobrachium ohione Ohio Shrimp
Procambarus lepidodactylus Pee Dee Lotic Crayfish
Protonotaria citrea Prothonotary Warbler
Procambarus blandingii Santee Crayfish
Etheostoma serrifer Sawcheek Darter
Ophisaurus attenuatus Slender Glass Lizard
Chelydra serpentina Snapping Turtle
Egretta thula Snowy Egret
Apalone spinifera Spiny Softshell
Morone saxatilis Striped Bass
Kinosternon baurii Striped Mud Turtle
Chologaster cornuta Swampfish
Crotalus horridus (pop. 2) Timber Rattlesnake - Coastal Plain Population
Ameiurus catus White Catfish
S4
Not Applicable Not Applicable
Not Applicable Not Applicable
Migratory Bird Treaty Act Not Applicable
Not Applicable R: Regulated
Not Applicable Not Applicable
Not Applicable Not Applicable
Not Applicable Not Applicable
MIGRATORY & NON-MIGRATORY BIRDS
Certain birds are protected under the Migratory Bird Treaty Act (MBTA) and the Bald and Golden Eagle Protection Act (BEPA). As of 2022, there were 16 birds protected under the MBTA and 1 under the BEPA that can be found in Berkeley County, which are listed in Table 11. Furthermore, the USFWS administers the Birds of Conservation Concern (BCC) which lists the bird species of highest conservation priority, beyond the birds already designated as federally endangered or threatened under the ESA. As seen in Figure 85, Berkeley County falls within the Southeastern Coastal Plain (27) Bird Conservation Region, which ranges from Norfolk, VA to Jacksonville, FL to the Mississippi River. According to the 2021 BCC Report, there were 39 birds listed in the Southern Coastal Plains region, which are also listed in Table 11. Some of these birds are also listed under the aforementioned acts or are identified on federal or state lists.

Figure 85: Terrestrial Bird Conservation Regions
Photo Source: North American Bird Conservation Initiative (NABCI)
IMPORTANT BIRD AREAS
The Audubon’s Francis Beidler Forest and the Francis Marion National Forest have both been designated as Important Bird Areas (IBA) by the Audubon Society. This designation means that these forests provide essential habitat for one or more species of bird, including sites for breeding, wintering, or migrating birds. An IBA is designated on the basis that it supports endangered and threatened species as well as species that are deemed vulnerable due to habitat loss, diminished biodiversity and the inclination to congregate at high densities, such as waterfowl or shorebirds.
The Francis Beidler Forest contains extensive bottomland hardwood forest and is home to documented colonies and nests of Prothonotary Warblers, Red-headed Woodpeckers, Hooded Warbler, Swainson’s Warbler, Kentucky Warbler, Worm-eating Warbler, and Wood Thrush.
The Francis Marion National Forest is comprised of large tracts of firemaintained longleaf and loblolly pine forests and open woodlands are interspersed with forested wetlands, Carolina bays, pocosins, cypress swamp and open wet savannahs. Some of the most significant birdrelated features of the forest include:
• It holds the northern-most concentration (50 pairs) of breeding Swallow-tailed Kites.
• One of the largest populations in the world, approximately 350 breeding groups, of federallyendangered Red-cockaded Woodpecker live here.
• Several pairs of Bald Eagles use the forest for nests.
• Approximately 100 pairs of state-listed Southeastern Kestrels nest in the forest.
• Federally-endangered Wood Storks forage here.
• Brown-headed Nuthatch and Bachman’s Sparrow are abundant here.
• Breeding ground for Painted Buntings and Swainson’s Warblers.


Wood Storks. (Photo/SC Wildlife Federation)
Red Headed Woodpecker. (Photo/USFWS)
Bald Eagle. (Photo/USFWS)
Swallow-tailed Kites. (Photo/SC Federation)Wildlife
MINERAL RESOURCES
The land of Berkeley County contains several mineral resources, including sand, gravel, limestone, clay, and phosphate. Mining mineral resources and the industries and manufacturers that use them contribute to the County’s economic base. Sand and gravel mines provide a source of materials for road construction in the region while clay deposits have historically been used for brick production and limestone has been mined for limestone building blocks. Phosphate is no longer mined in the Tri-County region, yet radon hazards may still occur near phosphate deposits. Map 30 shows all of the active mines located in Berkeley County and the region.
Mining not only involves the physical removal of the resource from the ground, but the mining process can also create other secondary impacts to the environment, land value, and public safety. Some of these impacts include an increase in susceptibility of sinkholes, additional flooding due to poor drainage, an increase in water pollution from runoff, a decrease in adjacent land value, and the disruption of plant and wildlife habitats. To help mitigate these impacts, some level of review by either local and/or state agencies, such as DHEC’s Bureau of Water, DHEC’s Bureau of Air Quality, Army Core of Engineers (USACE), and DHEC’s OCRM, is almost always required. Furthermore, DHEC’s Bureau of Land Management regulates the active mines within the State and publishes the location of all active mines on their interactive Action Mines Viewer page for public consumption.
MAP 30: BCD REGION’S ACTIVE MINES

AIR QUALITY
Air Quality is monitored and regulated by both the EPA and the DHEC Bureau of Air Quality (BAQ). The Clean Air Act, which was last amended in 1990, requires EPA to set National Ambient Air Quality Standards (NAAQS) for wide-spread pollutants from numerous and diverse sources that are considered harmful to public health and the environment. Berkeley County is currently in attainment with the EPA NAAQS. Since 2016, the BCD region has remained in attainment with all air quality standards included in the federal Clean Air Act and its amendments.

RESIlIEnCY
In September 2020, South Carolina State Legislature passed the South Carolina Resilience Revolving Fund Act (RRFA), or Disaster Relief and Resilience Act to expand the state’s planning efforts for resilience to natural disasters and flooding events. One of the four primary components of the RRFA requires local governments to include is a Resiliency Element in local comprehensive plans. This requirement is intended to enable communities to identify the hazards and disasters that they are most susceptible to and assess the potential impacts on the health, safety, and general welfare of the community, all at the local level as opposed to a regional or state level. This empowers local and county government agencies to adopt policies, pursue funding, and implement projects that strengthens the resiliency of the community.
The RRFA also implements three other components at the State level:
1. Establishes a Chief Resilience Officer and the South Carolina Office of Resilience to coordinate disaster recovery and resilience efforts;
2. Creates the Disaster Relief and Resilience Reserve Fund to finance disaster recovery efforts and hazard mitigation projects; and
3. Creates the Resilience Revolving Fund to provide low interest loans to local governments to perform floodplain buyouts and restoration.
Due to the geographic and environmental characteristics of Berkeley County outlined in

the Natural Resources Element, such as the low elevation, vast network of streams, and abundance of wetlands, makes properties miles inland susceptible to flooding and tidal events. As hazards are rarely confined to jurisdictional boundaries, local and regional coordination is essential in enhancing the overall resiliency of the County. Using the identification and assessment of the different hazards and disasters prone in Berkeley County, this Element will lay the framework for the goals and recommendations outlined in the Action Plan.
EXISTING PLANS AND PROTECTIVE MEASURES
Berkeley County has several different plans, policies, and practices in place that help guide local decisionmakers and private developers in creating a sustainable and resilient community. Many of these serve as regulatory documents, such as Zoning and Stormwater
Ordinances, while others serve more as policy documents, such as a Hazard Mitigation or Comprehensive Plan. Overall, the plans and protective measures listed below work in consort with one another to address the need for resiliency towards the various hazards and disasters that can occur in Berkeley County.
BERKELEY COUNTY HAZARD MITIGATION PLAN
Recently updated in 2019, the Berkeley County Hazard Mitigation Plan (BCHMP) is the primary policy document for implementing resiliency-related projects and programs throughout Berkeley County. This Plan includes a number of steps to improve community resilience over a five-year period (2021-2026) via proactive planning, preparation and mitigation efforts.
Similar to this Element, the BCHMP identified the hazards and disasters that threatened Berkeley County, assessed the relative
risks, and proposed strategies to meet the mitigation goals and objectives. However, the BCHMP provides a much more detailed analysis on the potential risks and proposed strategies than what this Element provides. In close coordination with local municipalities, steering committees, and regional and state agencies, the BCHMP identified local and regional projects and programs at various jurisdictional levels that will work to reduce hazard vulnerabilities and increase recovery resources. These projects and programs form to create the ‘Mitigation Action Plans’ which can be used by each jurisdiction for implementation as resources become available.
Each element in the Mitigation Action Plans fall under one or more activities that work to achieve the goals and recommendations of the BCHMP. These activity classifications include:
• Preventative Activities (PA) – intended to reduce a community’s vulnerability to future hazards and disasters.
• Property Protection (PP) – intended to protect existing property by retrofitting, relocation, or modifying the structure to withstand an event.
• Natural Resource Protection (NR) – reduces the effect that a hazard or disaster can have on natural resources and within the region by preserving and/or restoring natural and other areas that provide a beneficial function along with mitigation functions.
• Structural Projects (SP) – intended to reduce the impacts of a hazard or disaster by modifying the physical environment to withstand an event.
• Emergency Services (ES) – intended to minimize the impact of an event by preparing local and regional first responders and other services to respond efficiently and rapidly during and after a hazard or disaster.
• Public Information and Awareness (PI) – advises residents, potential buyers, and visitors about the different hazards and disasters, potentially hazardous or dangerous sites, and proper mitigation techniques.
For more information on any hazard or disaster, please refer to the BCHMP for greater detail.
FEMA TOOLS
There are several tools and resources that FEMA provides, the National Flood Insurance Rate Map (FIRM) and the National Flood Insurance Program (NFIP) in particular. As mentioned in the Natural Resources Element, FEMA produces the FIRM which details the location and severity of potential floods by designating areas as Flood Zones and Special Flood Hazard Areas (SFHA). These maps are updated periodically due to changing conditions, such as sea level rise, new development, environmental changes or updated information or policies.
When FIRMs are updated by FEMA, residents must be given the opportunity to review and appeal the new maps. When all appeals are settled, FEMA will issue a Letter of Final Determination and a jurisdiction is required to adopt the new FIRM(s) within six months in order to participate in the NFIP. Flood insurance is a separate insurance policy that homeowners, property owners, business owners, etc. can purchase through the NFIP to protect your home, business, and other possessions. According to the FEMA website,
flood insurance is available to anyone living in one of the 23,000 jurisdictions participating in the NFIP. For more information, visit FEMA’s Flood Insurance website.
(https://www.fema.gov/flood-insurance)
A map of the current FIRM can be found later in the Flooding section of this chapter.
FLOOD DAMAGE PREVENTION AND PROTECTION ORDINANCE
The Berkeley County Flood Damage Prevention and Protection Ordinance was adopted in 2008 and amended in 2015 and 2018 as information and technology was updated and released. The Ordinance establishes the general standards, definitions, and provisions for flood prevention and community protection from flooding hazards. In addition, this ordinance serves to adopt the Letter of Map Revisions (LOMR) from FEMA, which allows the County to provide residents with the most up-to-date floodrelated data for their properties. Most importantly, the ordinance defines the certification requirements for new building permits to ensure that community resilience is incorporated into future development.
INTERNATIONAL BUILDING CODE SERIES
South Carolina requires local governments to adopt the most recent version of the International Building Code (IBC) series (currently the 2018 IBC and 2009 Energy Code). The IBC establishes minimum requirements to protect the public health, safety, and general welfare by regulating and controlling the design, construction, quality of materials, use and occupancy, location and maintenance of all buildings and structures. In Berkeley County, all plans are reviewed for IBC compliance prior to issuing permits.
HAZARDS AND DISASTERS
A hazard or natural disaster may impact residents of a community at any time, and potentially, without warning. Hazards and disasters are broad terms used to describe weather-related, geological, and manmade events that can adversely impact a community. Many of these events have the potential for evacuation, confine residents to their homes, disrupt basic municipal services, or cause loss of life and/or property. For this reason, identifying the different hazards and disasters, assessing the potential impacts, and providing recommendations for mitigating these impacts is key in reducing the risk of damage during and after an event. Local hazard mitigation planning can aid in protecting a community from the loss of physical, societal, financial, and natural resources; however, county and regional agencies should facilitate these efforts to ensure all jurisdictions are working towards the same goal.
RISK LEVEL ASSESSMENT
Identifying the risk level of each hazard or disaster can help local officials and decisionmakers prioritize the implementation of projects and strategies. The RRFA specifically calls out flooding as a top priority and given the numerous flood prone areas along the Cooper and Wando Rivers, this warrants an immediate priority level. As seen in Table 13, other hazards and disasters, such as hurricanes, dam failures, and tornadoes, have a higher priority despite being more infrequent due to the costliness if an event were to occur. Other factors that contribute to this ranking include area of impact, suddenness of the event, frequency, and level of physical and environmental impacts.
Table 13: Risk Level Assessment
Hazard Type Priority Level
Flooding
Tropical Storms and Hurricanes
Dam Failure
Earthquake
Hazardous Materials and Waste
Tornadoes
Sea Level Rise
Tropical Depressions
Wildfires
Drought
Winter Storm
FLOODING
Flooding is a naturally occurring process when a river or stream overflows its banks onto its floodplains during or after heavy rainfall, high tides, or storm surges. FEMA defines a flood as a general or temporary condition of partial or complete inundation of two or more acres of normally dry land area or of two or more properties. According to the recently released Climate Mapping for Resilience and Adaptation (CMRA), between 1976 and 2005, Berkeley County averaged 182.7 days of the year with precipitation or “wet days,” averaging 48.5 inches of precipitation annually. With half of the year considered a “wet day,” the natural resources responsible for channeling, storing, and filtering rainwater are consistently working to maintain an efficient hydrologic cycle.
The geographic composition of the Lowcountry further increases the vulnerability of Berkeley County to flooding, however, the impact of a flood is often correlated to the type of land use or land cover of the individual watershed. Berkeley County has experienced unprecedented growth since
2000, particularly in low-lying areas such as Clements Ferry/Daniel Island, Goose Creek, Moncks Corner and along I-26. Urbanization and the conversion of greenfields to impervious surfaces such as roads, parking lots, and buildings can greatly impact the flow and absorption rate during and after a flood. Furthermore, the abundance of wetlands, wide and flat floodplains, and poorly drained soil types (all discussed in the Natural Resources Element) create ideal conditions for the storage and filtration of stormwater but do little for the movement of stormwater.
Similar to the Floodplain Map in the Natural Resources Element, Map 31 illustrates the flood zones and highlights certain areas in Berkeley County that are either within a flood zone or are in close proximity to one. Based on the FIRM mapping, the smaller tributaries, such as Goose Creek, Back River, Foster Creek, and Wassamassaw Swamp create more flooding issues than the major rivers themselves. The insets on Map 31 also show buildings that are within the flood zones, which includes nearly all of Daniel Island.
MAP 31: FEMA’S FIRM FLOOD HAZARD ZONES INCLUDING INSETS OF PARTICULARLY VULNERABLE AREAS


TYPES OF FLOODING
Flooding can be the result of multiple sources. Most common causes in the Lowcountry are from thunderstorms, tropical depressions, storms, or hurricanes, and high tides. There are three different types of flooding: Urban, Riverine, and Tidal (described below). The causation and location are often the determining factors that indicate the type of flood; however, a flood event is not strictly classified as one type or another but can occur simultaneously, such as during a tropical storm or hurricane. A lack of capacity, whether that be manmade or “gray infrastructure” (i.e., pipes, ditches, culverts, and retention ponds) or natural or “green infrastructure” (i.e., rain gardens, green roofs, permeable paving, bioswales, and infiltration basins), is typically a reoccurring factor in areas prone to flooding.
URBAN FLOODING
High intensity rainfall causes urban flooding when an area’s grey or green infrastructure lacks the necessary capacity to drain away the volume of stormwater. Urban flooding is not limited to urban areas, but rather areas with large concentrations of impervious surfaces (i.e., a small town or industrial complex can
experience urban flooding). Impervious surfaces block the infiltration of rainfall into the ground and can oftentimes increase the volume and velocity of runoff as well as pollution levels.
According to a stormwater runoff modeling system (SWARM) from the National Centers for Coastal Ocean Science, the model “consistently shows higher runoff volume, higher peak rate, and shorter runoff duration with increasing urbanization in three of our study sites representing undeveloped, residential, and urban watersheds. For modeling runoff from a two-year storm event (4.5 inches over a period of 24 hours), peak runoff rate is three to five times greater in the developed watersheds than in the undeveloped watershed, runoff volume is twice as great in the developed watersheds, and total runoff time in the developed watersheds is less than half that of the undeveloped watershed.”
Berkeley County communities most susceptible to urban flooding would be Daniel Island (City of Charleston), Goose Creek, Hanahan, Moncks Corner, and St. Stephen. As discussed in the Community Facilities Element, Berkeley County owns and maintains all stormwater infrastructure within Hanahan, Moncks Corner, Bonneau, Jamestown, and St. Stephen through intergovernmental agreements. While each municipality has adopted stormwater policies, ordinances and guidelines, Berkeley County is the primary entity responsible for stormwater mitigation strategies.
RIVERINE FLOODING
Not limited to urban or rural areas, riverine flooding occurs when the stream or river overflows onto the adjacent floodplains. This may occur seasonally or during/after a heavy rainfall event. This type of flood can impact multiple parts of the watershed besides the immediate area. Most of Berkeley County lies within the Cooper River watershed, therefore, while intense rainfall may impact inland communities for a short period of time, portions of the County downstream and along the Cooper River may experience riverine flooding for several days. As seen in Table 14, NOAA and the River Forecast Centers categorizes the severity of a flood using three stages: Minor, Moderate, and Major.
Table 14: River Forecast Centers Stages of a Flood
Flood Severity (Stages of a Flood)
Minor Flooding
Moderate Flooding
Description
Minimal or no property damage, but possibly some public threat or inconvenience
Some inundation of structures and roads near streams. Some evacuations or people and/ or transfer of property to high elevations are necessary.
Major Flooding
Extensive inundation of structures and roads.
Significant evacuations of people and/or transfer of property to higher elevations.
Photo/File
FLASH FLOODING
Flash flooding, an additional hazard of riverine flooding, can occur due to heavy rainfall that causes a rapid surge in water levels. This potentially fatal hazard generally occurs within six hours of the immediate cause. Although flash floods typically occur along streams and rivers, in the Lowcountry, they can also be caused by high tides in low-lying coastal areas. As seen in Table 15, the NWS uses three warning classes: Base, Considerable, and Catastrophic, when assessing the impacts of a flash flood. Urban areas are particularly prone to flash flooding because the high impervious surface coverage. Besides the environmental impacts that most flooding can cause, which will be discussed later in this section, flash flooding on roadways can create dangerous conditions such as hydroplaning, compromising the structural integrity of bridges, fast-moving water over the road/ bridge, and can obstruct first responders and emergency service vehicles.
TIDAL FLOODING
Tidal flooding occurs mainly due to abnormally large high tides and/or heavy rainfall in lowlying coastal areas. While this type of flooding does not impact as many people or as large of an area as the other types of flooding, tidal flooding has become increasingly more common due to rising sea levels. Areas that experience tidal flooding are not limited to ocean coastlines but can occur along any waterbody that is connected to the ocean, such as the Cooper River and its tributaries. For that reason, communities within Berkeley County that are most susceptible to tidal flooding are areas along the Cooper River, including Daniel Island/Clements Ferry and Hanahan.
POTENTIAL IMPACTS
Flash Flooding Warning Classifications
Warning Class Description
Base Used most of the time, when flash flood impact is possible
Considerable Used rarely, when there are indications flash flooding is capable of unusual severity or impact is imminent or ongoing and urgent action is needed to protect lives or property.
Catastrophic Used exceedingly rarely, when a flash flood threat to life and catastrophic damage is occurring or is imminent, and floodwaters have risen or will rise to levels rarely if ever seen.
The causation and location of a flood are also important factors when assessing the potential impacts that a flood event could cause. For example, urban flooding can have more physical and societal impacts while riverine flooding can have more environmental impacts. However, flooding in general commonly causes building, property, and/or infrastructure damage, disruptions to supply chains, alterations in habitats and ecosystems, and financial stress. Specific systems and networks within Berkeley County, such as the transportation system, utility infrastructure, parks and recreation amenities, and property values, are vulnerable to flooding events. While damage from flooding is often reported as a monetary value, certain impacts, particularly within the environment, can be difficult to rectify or even be permanent Here are common environmental impacts that flooding can cause:
• Water Pollution - The quality of the surface and groundwater can be negatively affected by runoff transporting pollutants such as sediments, debris, minerals, oils, trash,
excess nutrients, industrial chemicals, etc. into streams, rivers, reservoirs, lakes and aquifers.
• Erosion - The velocity and volume of water can erode streambanks and alter the natural channel of a stream or river over time, potentially impacting adjacent habitats, roads, or buildings.
• Debris - Large fast-moving volumes of water have the capability to pick up and transport larger, heavier debris, such as trash, rubber from tires, nails and other metals, lawn clippings or dead leaves, animal waste, and plastics, and deposit them in streams and rivers. After these foreign, and possibly harmful objects, are introduced into the natural environment they can negatively impact and alter the natural ecosystem.
• Wildlife Habitat and Ecosystems - Common wildlife ecosystems like riparian buffers, wetlands, and floodplains are some of the most impacted areas during and after flood events. They can damage food sources, shelters, and vegetation and displace wildlife.
• Aquifer Recharge - Due to the slow rate of absorption for water to infiltrate the ground, runoff is not given the opportunity and time to filtrate and absorb into the ground. This reduces the amount of water that is able to recharge the aquifers.
While the potential impacts are similar between the three types of floods, there are different mitigation strategies that work to address the physical and environmental concerns that flooding poses to Berkeley County.
Table 15: National Weather Service (NWS)
TROPICAL CYCLONES
Tropical cyclones are one of the most common natural disasters that can occur within Berkeley County. These large, intense, and oftentimes, costly events can span the entire Lowcountry, bringing high wind speeds and heavy rainfall to the region. The National Hurricane Center (NHC), a branch of NOAA, has designated the dates of Hurricane Season in the South Atlantic and Gulf States as June 1 – Nov. 30. Trends show the most common time period for a tropical cyclone to occur is from mid-August through October. There are several different classifications of tropical cyclones based on the system’s maximum sustained surface wind speeds. The different classifications are described in the legend on Map 32
MAP 32: TROPICAL CYCLONE PATHWAYS


According to the 2023 SC DNR Hurricanes Comprehensive Summary Report, South Carolina has an 80% chance annually of being impacted in some way by a tropical depression, storm or hurricane. As reported by NOAA, from 2000 to 2021, 20 tropical cyclones were within 50 miles of Berkeley County. As seen on Map 32, most of these systems were classified as tropical storms with only a handful being classified as a hurricane when reaching the Lowcountry.
Due to tropical cyclones absorbing energy from warm ocean water, making landfall often
Central Coast - Charleston, Berkeley, and Dorchester Hurricane Evacuation Zones

Tropical cyclones, most notably hurricanes, can cause a wide range of impacts to a community before, during, and after a storm event. Damage and disruption to the transportation and utility networks are common causalities of hurricanes. Other common impacts, besides those from flooding, that could occur in Berkeley County include fallen trees, downed powerlines, power outages, and the temporary closure of schools, services, and businesses . As seen in Figure 86, Berkeley, Charleston, and Dorchester Counties are within the Central Hurricane Region. Local officials and emergency services should provide these evacuation routes to residents through social media and governmental sites. Berkeley County should continuously collaborate with local jurisdictions and state and federal agencies to prevent as much damage as possible.

STORM SURGE
removes the systems vital energy source, causing it to quickly drop in wind speed. This, however, does little to impact rainfall. These intense weather-related events can span tens of miles and can create conditions for a number of additional hazards and disasters, most commonly flooding and storm surges. Tornadoes, while uncommon, can form along the fringes (typically northern fringes) of the system. Despite the high wind speeds and chance for tornadoes, the heavy rainfall and in turn flooding during a tropical cyclone are typically regarded as the most immediate threat to Berkeley County.
According to NOAA, storm surge is “the abnormal rise in seawater level during a storm, measured as the height of the water above the normal predicted astronomical tide.” A storm surge is typically caused by the winds of a tropical cyclone pushing water onshore. The effects of this can be exacerbated by high tides. Typically, the areas that are susceptible to storm surges are also the ones that are most vulnerable to tidal flooding.
Figure 86: SCEMD Central Coast Hurricane Evacuation Zones
SEA LEVEL RISE
Sea level is measured and recorded as an average level of the surface of a waterbody in reference to a specific point of elevation, known as the mean sea level (MSL). The rise in sea level has emerged as one of the most discussed topic areas in resiliency planning. This phenomenon impacts coastal communities around the world at various rates. As seen in Figure 87, NOAA’s Relative Sea Level Trend for Charleston used data from 1901 to 2021 to estimate the current annual sea level rise at about 3.4 millimeters (about 0.13 inches) which is equivalent to a change of 1.11 feet in one hundred years. Many don’t realize, the largest contributor to sea level rise in South Carolina is actually the land sinking or subsidence.
As seen on Map 33, low-lying, frequently saturated, coastal and riverine areas, such as Daniel Island and along the Cooper River, Goose Creek, and Back Creek, are particularly vulnerable to rising sea levels. In a one-, two-, and three-foot sea level rise scenario, wetlands and floodplains around the Cooper and Wando Rivers are some of the most impacted areas in the County.
DAM AND LEVEE FAILURE
Dam failures is the collapse or failure of an impoundment. This could occur due to upstream or localized flooding, erosion of the surrounding land, or damage from other hazards or disasters, most notably an earthquake. There have been no historical incidents of dam or levee failure in Berkeley County, even during major flood events such as those that occurred in 2015. While extremely rare, dam failures have the potential to be one of the most catastrophic events discussed in this Element. According to the National Inventory of Dams (NID), there

are 11 dams within Berkeley County that are designated as high-hazard, seven of which are around Lake Moultrie. There are three Dam Hazard Potential classifications: High, Significant, and Low.
• High hazard – where failure will likely cause loss of life or serious damage to infrastructure.
• Significant hazard – where failure will not likely cause loss of life but may damage infrastructure.
• Low hazard – where failure may cause limited property damage.
Lake Moultrie, one of the largest lakes in South Carolina, is served by five separate high hazard dams or levees; the Pinopolis Dam (primary structure) and the East, West, and North levees (associated structures) and the St. Stephen Powerhouse Dam. The Pinopolis and St. Stephen dams are the primary outlets for Lake Moultrie and generate large amounts
of hydroelectricity. The Pinopolis Dam and its associated structures were last inspected in September 2020 and the St. Stephen Dam was last inspected in 2018. All five structures have recently had an emergency action plan updated in the event of a failure.
The location and size of the dam determines the severity of the potential impacts that a failure could cause. Communities most susceptible to a dam failure are any downstream areas, however, the relative flatness of the Lowcountry could cause the water to spread far and wide before being channeled into the streams and rivers. The primary danger associated with a dam failure is the swift and unpredictable flooding that would occur. In the event of a dam failure, mass evacuations of downstream areas will need to take place. Due to the relative unexpected nature of this event, significant loss of life, building, property, and infrastructure damage, and unprecedented flash flooding would occur.
Figure 87: NOAA’s Relative Sea Level Trend, 1901 to 2021
MAP 33: AREAS IMPACTED BY SEA LEVEL RISE (SLR)

TORNADOES
The National Severe Storms Laboratory (NSSL), a branch of NOAA, defines a tornado as a narrow, violently rotating column of air that extends from a thunderstorm to the ground. A tornado can cause immense damage in the generally short period of time that they are in contact with the ground surface. They are also regarded as one of the most violent atmospheric storms. As seen on Map 34, between 2000 and 2020, there have been over a dozen tornado events with varying intensities touching down across Berkeley County. As mentioned previously, tornadoes can form along the fringes of a tropical cyclone, typically in the northeastern part of the system, by utilizing the already circular motion and high wind speeds of the tropical system. The Enhanced Fujita Scale is used to rank the intensity and threat level of a tornado, ranging from an F0 to F5.
The potential impacts of a tornado are similar to a hurricane due to the similarity in high wind speeds. Tornadoes impact a much smaller geographic area than hurricanes but can still cause immense damage. Trees, powerlines, mobile homes, automobiles, and other less secure objects or buildings are most vulnerable to tornadoes. Although tornadoes are more prevalent in rural areas of Berkeley County, local officials should make use of social media, government websites, and other means of communication to inform and alert residents of a tornado warning or watch.
MAP 34: LOCATION & PATHS OF OTHER NATURAL HAZARDS & DISASTERS
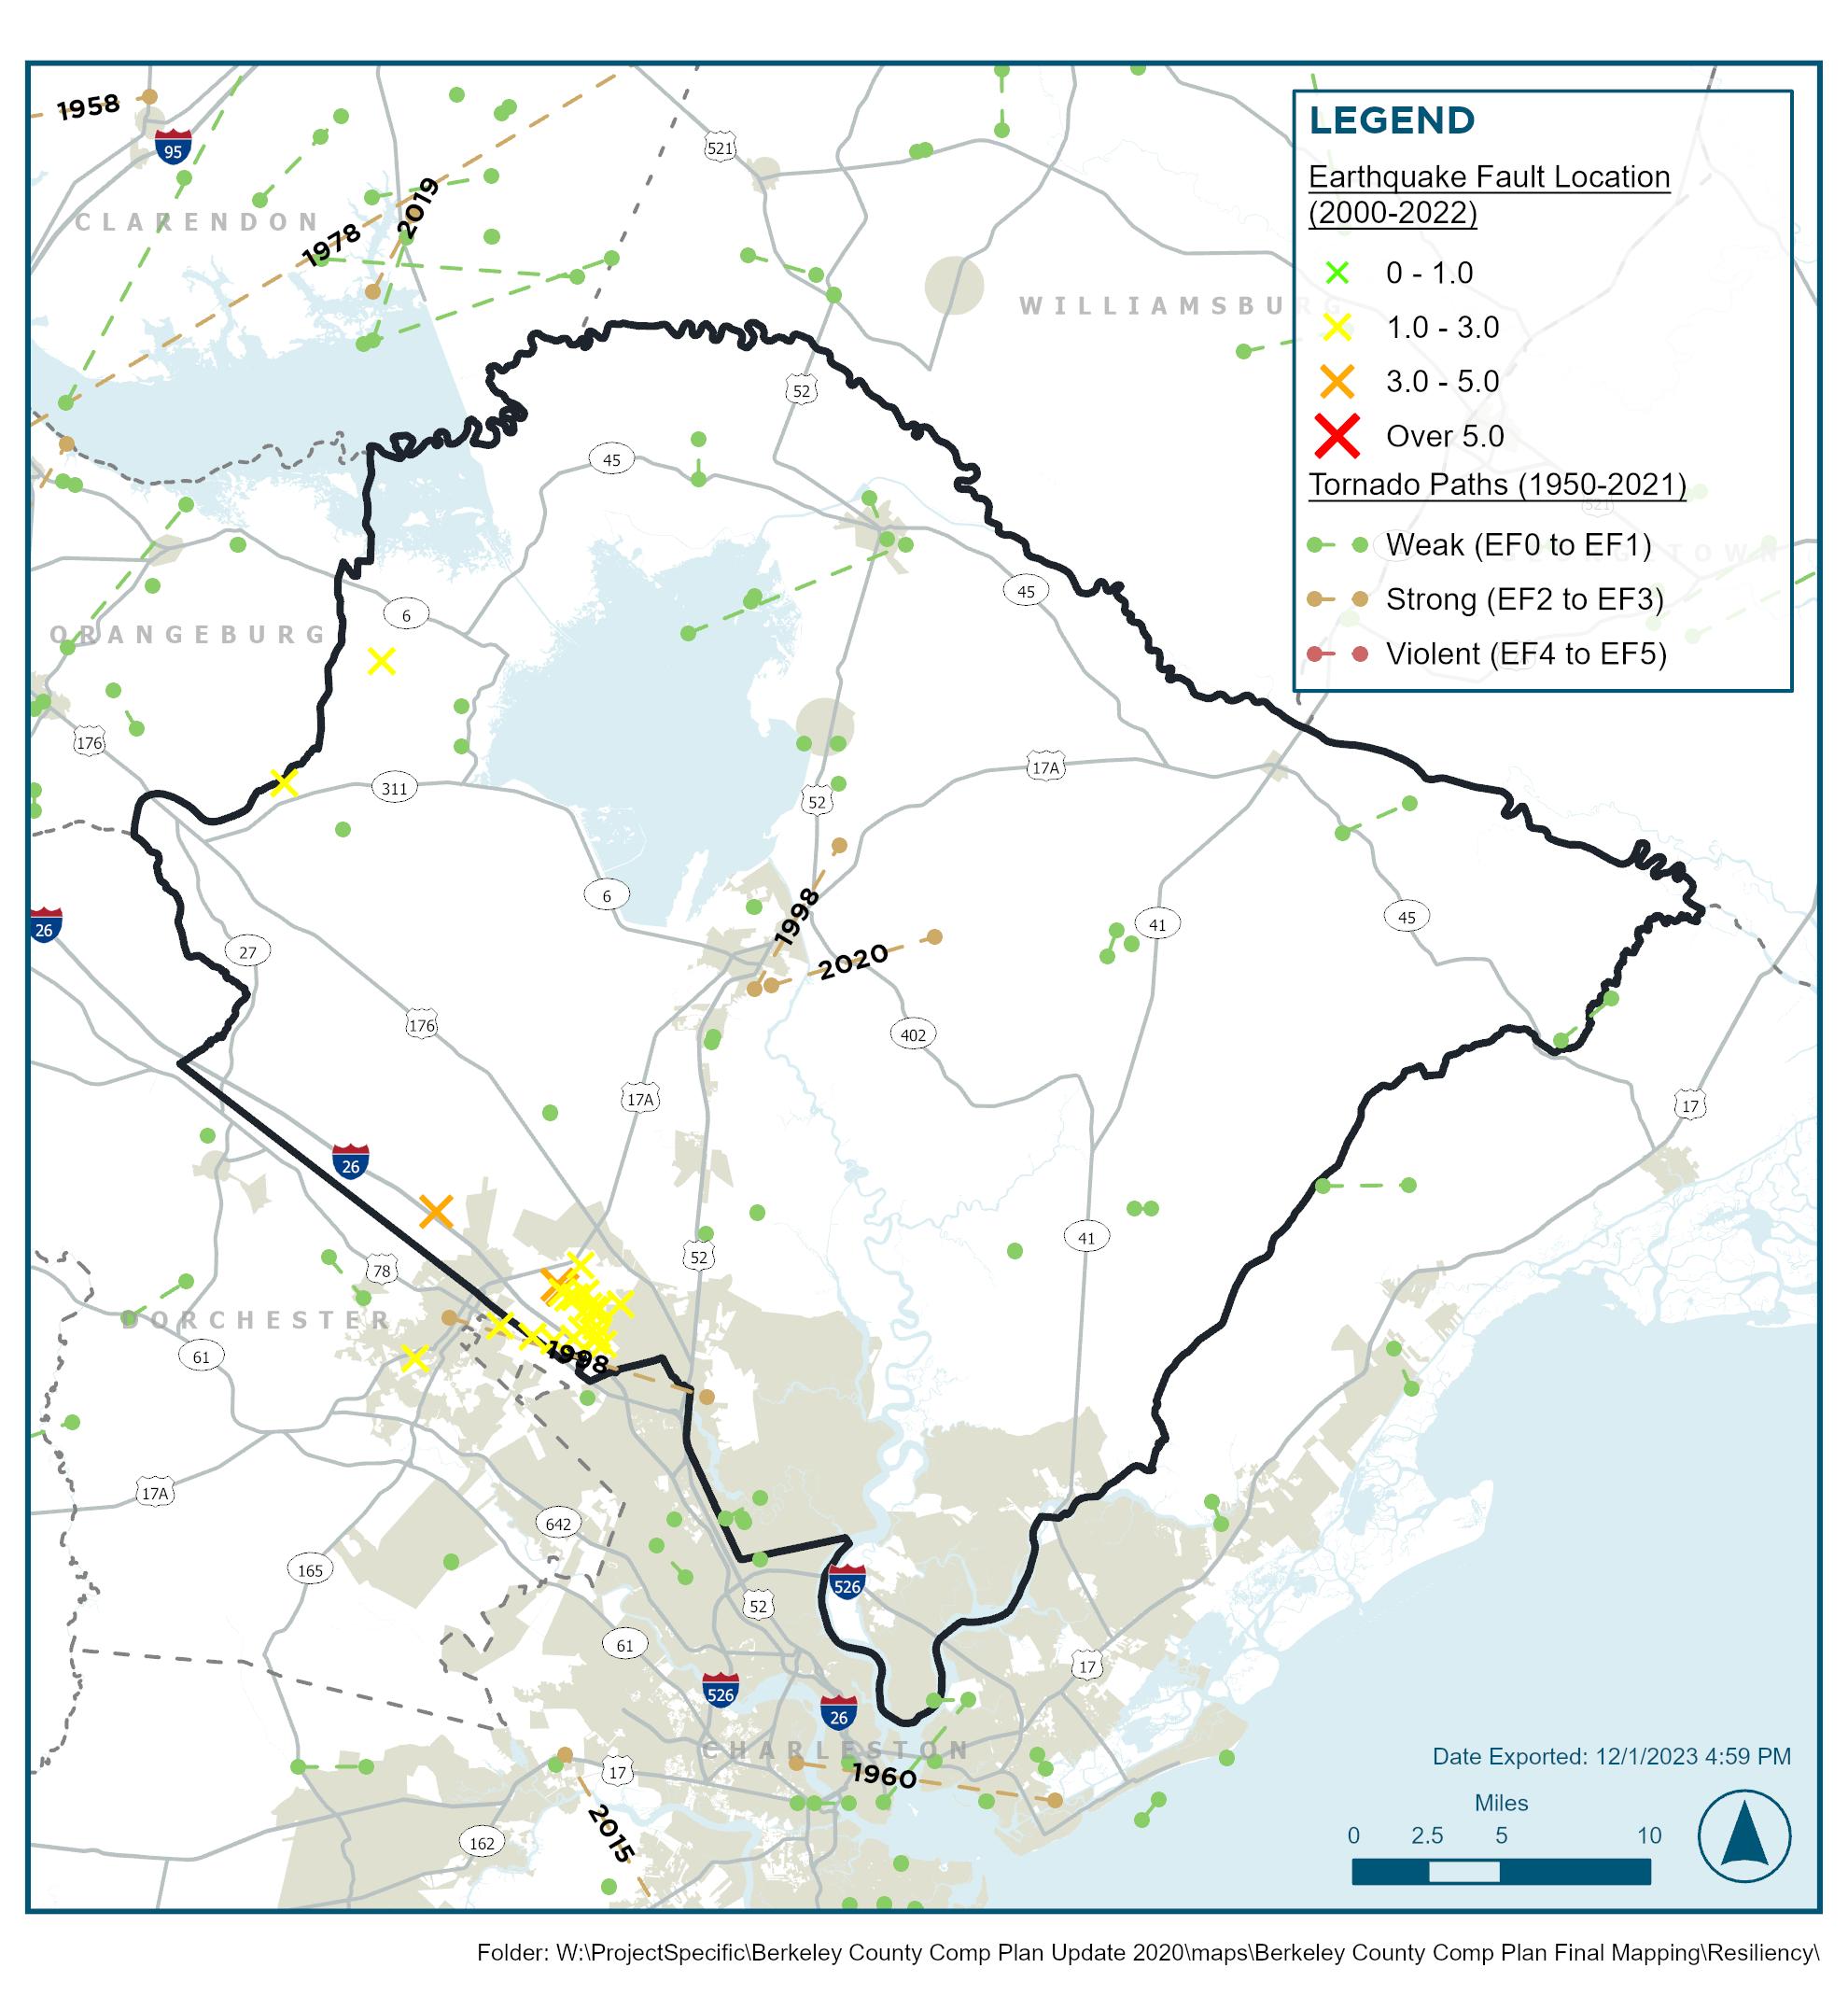
EARTHQUAKES
The only geologic-related event discussed in this Element, earthquakes are the sudden slip of rock along a fault line, which transfers energy from the focus point to the surface as seismic waves. The Berkeley-CharlestonDorchester Region experiences earthquakes more frequently than most other areas along the East Coast. In 2018, the USGS designation the region as having the highest seismic hazard risk. As seen on Map 34, since 2000, there have been 33 recorded earthquakes in the region, most of which were centered around Summerville. According to SCDNR,
“In South Carolina, approximately 70 percent of the earthquakes occur in the Coastal Plain and most are clustered around three areas west and north of Charleston: Ravenel-Adams Run-Hollywood, Middleton Place-Summerville, and Bowman.“
Despite the small impact that earthquakes have had on Berkeley County in recent years, the Charleston Earthquake of 1886 sets the precedent that a major geologic event has the potential to occur in Berkeley County. Due to earthquakes being relatively unexpected,

Corner of East Bay and Cumberland Streets after earthquake of 1886. (Photo/University of South Carolina, South Caroliniana Library)


Note: A .pdf version can be found here
the focus of first responders and emergency personnel should be containing the aftermath damage which could include fallen trees, downed powerlines, pipe bursts, fires, etc. Requiring earthquake resilient infrastructure can help mitigate any potential damage.
LIQUEFICATION
Liquefaction is a phenomenon in which loosely packed, water-logged sediments at or near the ground surface lose their strength in response to the intense ground shaking.


With the stability of the ground compromised, buildings, bridges, tunnels, and other permanent structures or surfaces that rely on that stability are at significant risk of damage or collapse. Liquefaction occurs primarily in sand, saturated soft soils that are common in low-lying areas. In 2012, SCDNR and SCEMD created a wide-ranging map identifying the geologic hazards within the state. As seen in Figure 88, most of Berkeley County is either of high potential for liquefaction or potential for collapse.
Figure 88: SCDNR and SCEMD 2012 Geologic Hazards Map
HAZARDOUS WASTE AND MATERIALS
The Environmental Protection Agency (EPA) defines hazardous waste and materials as having properties that make it dangerous or capable of having harmful effect on human health or the environment. For this reason, the EPA requires all facilities that generate hazardous waste or materials (Generators) to register with the EPA as a safety monitor mechanism. Generators are then categorized by the EPA based on the quantity (tons) generated daily. The three categories are as follows:
• Very Small Quantity Generators (VSQG) – generates less than 100 kilograms per month;
• Small Quantity Generators (SQG) –generates between 100 to 1,000 kilograms per month; and
• Large quantity Generators (LQG) –generates 1,000 or more kilograms per month.
As seen on Map 35, most of the LQG’s within Berkeley County are located along the Cooper River.
MAP 35: HAZARDOUS WASTE & MATERIAL GENERATORS
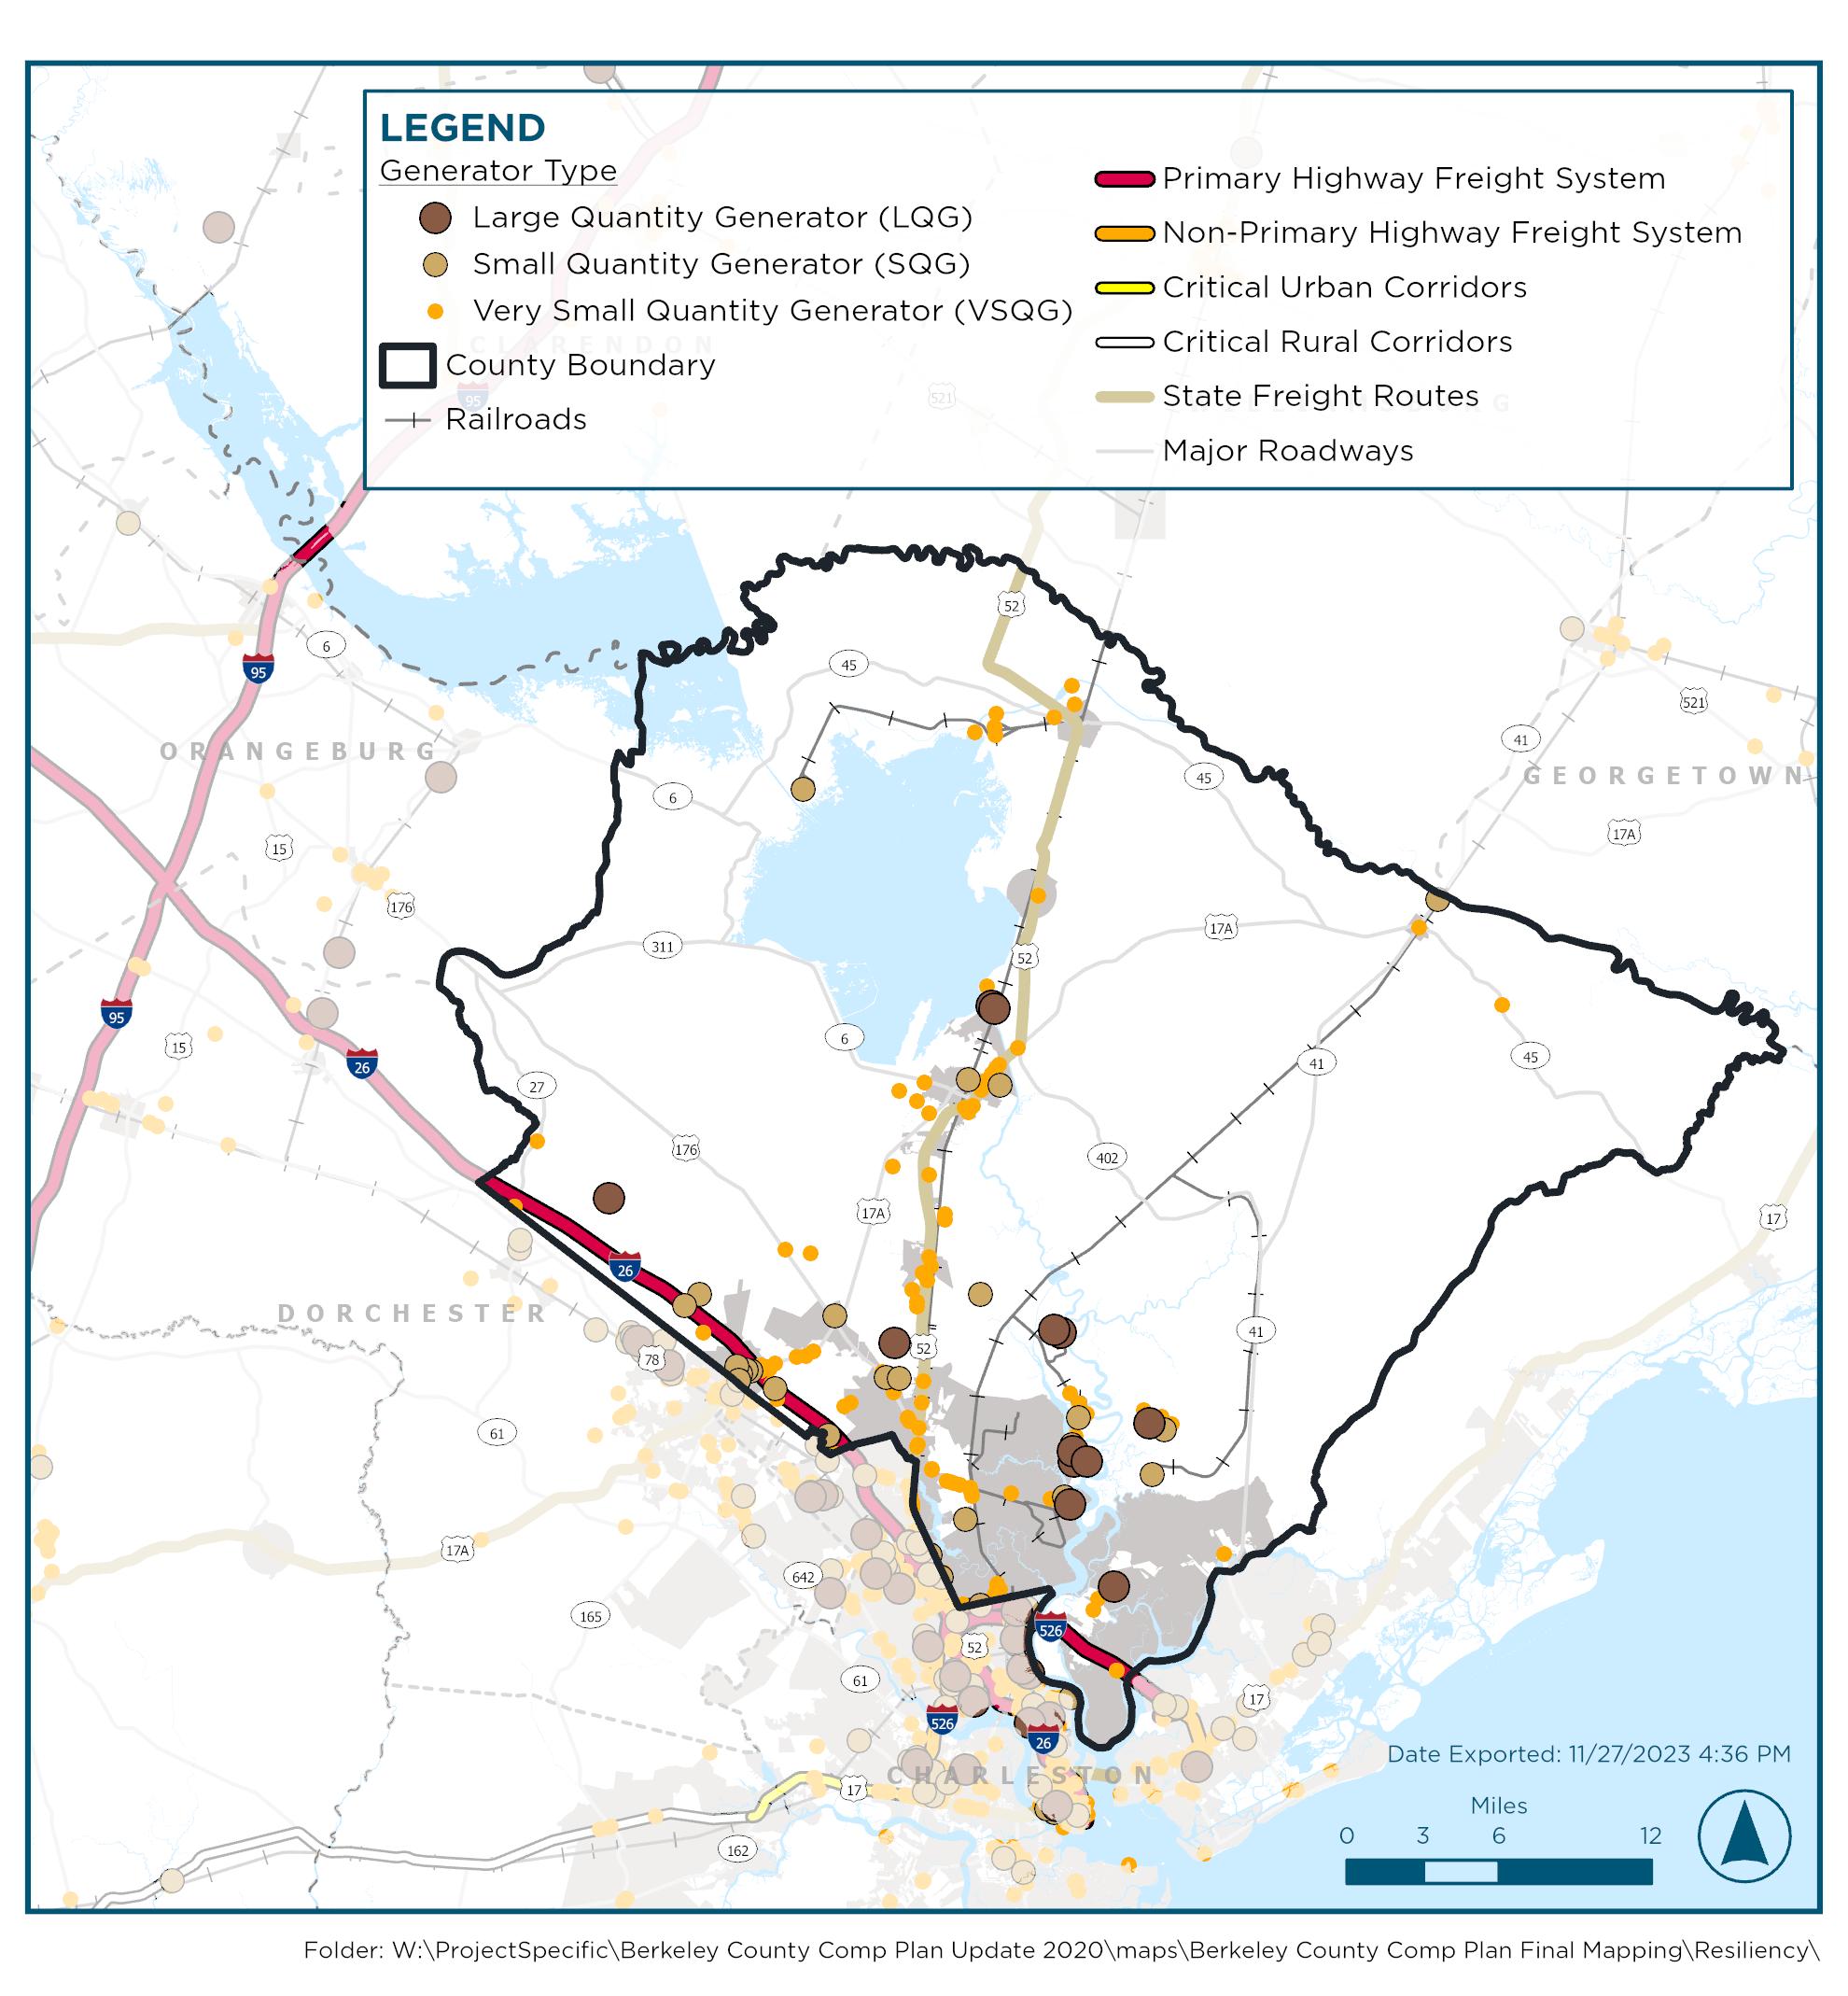
Generators are more common than people think as they are not limited to industrial or manufacturing sites. Common hazardous waste or materials generated by everyday businesses can include aerosols, batteries, dry cleaners, electronics, motor oil, paint, ink, printer cartridges, pesticides, sharps/syringes, and pharmaceutical waste.
In the event of a spill, leak, or mismanagement of hazardous waste or materials, most businesses have a plan and mitigation strategies already in place to follow to help limit the potential impacts. However, it is areas along the different transportation routes that are most vulnerable. Major highways, roadways, and railroads endangers otherwise safe communities to the numerous health and environmental impacts. State and Federal transportation and emergency management agencies typically have containment and mitigation plans in place in the event of a spill, leak, or mismanagement for along these heavily traveled corridors.
Unlike most other hazard or disasters in this Element, human error is the primary cause for an incident like this to occur. With transportation routes being some of the most vulnerable places, in the event of a spill, leak, or mismanagement of hazardous waste or materials, local officials, first responders, emergency services personnel, and utility departments should coordinate with the appropriate state and federal agencies to contain the damage and steer the populace away from the impact area.
The impacts of an incident such as a spill or leak, are largely dependent on the state of matter (i.e., solid liquid or gas) of the waste or material. Solid materials like batteries or electronics can be more manageable to

contain as opposed to liquids or gases which can contaminate larges areas within minutes, prime examples being the recent oil spills and gas leaks around the globe. The stability or extent of danger that the waste or material poses (i.e., explosive, combustible, radioactive, etc.) is another important factor, especially during transportation. The US Department of Transportation (USDOT) provides a classification based on the type of emergency response that an incident would require.
The potential impacts that an incident such as this could have on the health and environment of a community cannot be understated. Some common health related impacts that could occur include: burning, blindness, cancer, lung and heart damage, and severe irritation of the skin. Potential environmental impacts are a bit more widespread due to the difficulty of containing the contamination to an area and/or the swiftness to identify that an incident has occurred. Common

environmental impacts that could occur include: habitat damage, water contamination, loss of vegetation, threatening and death of wildlife, and long-term damage to the ground and soils. Due to the numerous sites, different types of waste and materials, and the numerous transportation routes, the severity and magnitude of an incident cannot be clearly or easily calculated.
SEASONAL WEATHER EXTREMES
There are two types of seasonal weatherrelated extremes: winter cold and storms and the summer heat. The response to these events are similar in that emergency personnel should regularly check on the elderly, homeless, and medically or economically disadvantaged residents. The size of Berkeley County would potentially present a challenge to this task, however, in coordination with local municipalities, local non-profits, and neighborhood groups, this area becomes more manageable.
WINTER COLD AND STORMS
Winter weather-related events, such as snow storms, freezing temperatures, and sleet/ ice storms are uncommon in the Lowcountry. Due to this infrequency, there is a lack of adequate equipment and resources to safely and efficiently mitigate the impacts of a snow or winter storm. The transportation and utility networks in particular are vulnerable to these winter weather-related events as freezing temperatures can cause an increase in energy demand as well as create dangerous roadway conditions.
SUMMER HEAT
Summer heat combined with high humidity is a South Carolina staple. The typical summer months in Berkeley County, June, July, and August, can experience reoccurring days of high temperatures and high humidity. As discussed in the Natural Resources Element, during these summer months, the average daily high in Berkeley County is above 85° F. Figure 89 depicts the humidity comfort levels throughout the year. Without the proper infrastructure in place, residents can experience severe heat exhaustion and even heat strokes. Similar to winter weather-related events, summer heat and humidity can cause an increase in energy demand as well.
DROUGHT
Drought is a common hazard that is caused by a lack of precipitation over an extended period of time and often results in a water shortage. What makes droughts different from other hazards or disasters is the timeframe in which a drought can occur, potentially lasting weeks or even months. For that reason, a drought is typically the second most costly weather-related event that can occur, behind tropical systems. Berkeley County can experience a drought anytime of the year and

can be influenced by other factors such as extreme heat, wind, high water consumption, and low humidity levels.
According Climate Mapping for Resilience and Adaptation (CMRA), between 1976 and 2005, Berkeley County averaged 182.4 days per year with no precipitation (or less than 0.1 inches). Since droughts develop slowly over an extended period of time, it can be difficult to determine when an area is in a drought. These conditions can lead to inadequate public water supplies, diminished air and water quality, increased public safety risks, and extensive loss of crops, forests, fisheries, ecosystems, wildlife, and livestock.
South Carolina has had a drought management plan in effect since 1985 that is consistently updated. The South Carolina State Climate Office (SCSCO) maintains
the South Carolina Drought website which provides periodic drought status updates, educational and informational resources, potential impacts, and planning and policy documents that can be used to assist in local resiliency planning efforts.
SCSCO uses several indicators to determine the current drought status for each County, one of which is the US Drought Monitor. This monitoring system uses many of the same indicators as SCSCO, however, uses a different classification system than SCSCO. The five drought classifications used by the US Drought Monitor are D0 (Abnormally Dry), D1 (Moderate Drought), D2 (Severe Drought), D3 (Extreme Drought), and D4 (Exceptional Drought). The D0 (Abnormally dry) classification is used to indicate an area is not yet in drought or for areas recovering from drought. This can provide residents, farmers,
Figure 89: Humidity Comfort Levels in Berkeley County
Source: WeatherSpark.com - Humidity
local officials, and utility providers some insight that a drought could be imminent, allowing them to make the appropriate preparations and mitigation efforts. In the event of drought, Berkeley County residents, businesses, farmers, and officials should follow state guidelines which could include decreasing water and energy usage or restricting burning of materials. Historical data from the US Drought Monitor reveals that Berkeley County experienced 42 weeks of Severe Drought and 35 weeks of Extreme Drought between 2000 and 2022.
WILDFIRES
The term wildfire is used to broadly describe any forest, brush, or grass fire that is not controlled or supervised. Wildfires have recently become a widely known term due to the massive wildfires in the western states like California, Wyoming, Idaho, and Oregon. A wildfire can cause immense damage to forests, wildlife habitats, water quality, and air quality, not to mention property and building damage. Some of the major contributing factors that can strengthen the intensity of a wildfire include a lack of precipitation or drought, wind currents, forest density, and proximity to sources of water to name a few. Forest fire danger is usually the greatest in drier months of late winter and early spring. The most common cause of wildfires is negligent human behavior, but lightning strikes can also be a causation.
According to the National Park Service (NPS), there are three types of fire spread:
• Ground fires burn organic matter in the soil beneath surface litter and are sustained by growing combustion

• Surface fires spread with a flaming front and burn leaf litter, fallen branches, and other fuels located at ground level; and
• Crown fires burn through the top layer of foliage on a tree, known as the canopy. Crown fires, the most intense type of fire and often the most difficult to contain, need strong winds, steep slopes, and a heavy fuel load to continue burning.
The South Carolina Forestry Commission tracks wildfires across the state, assessing the impacts, and tracking the number of acres affected. Between 2000 and 2020, there were over 2,600 wildfires reported in Berkeley County, affecting over 24,000 acres of land. Overall, this averages to about 9.3
acres impacted per wildfire. As seen in Figure 90, in the early 2000’s, Berkeley County experienced over one hundred wildfires annually fairly consistently. In recent years, the County has experienced far fewer wildfires with less than 40 wildfires taking place in 2019-20.
In 2018, the US Forest Service (USFS) was directed by Congress to create an interactive website that provides education, maps, charts, tools, and resources about the risk of wildfires to communities. According to the Wildfire Risk to Communities site, there are four primary elements of wildfire risk: likelihood, intensity, susceptibility, and exposure. These elements determine the overall potential risk that a wildfire has in an area. Based on data
from Wildfire Risk to Communities, Berkeley County ranks the following:
Wildfire Likelihood (Map 36A) is the annual probability of wildfire burning in a specific location. Populated areas in Berkeley County have, on average, greater wildfire likelihood than 93% of counties in South Carolina. Rural Berkeley County, particularly in heavily wooded or vegetated areas, have a higher likelihood than the more urban areas such as Hanahan and Goose Creek.
Exposure Type (Map 36B) delineates whether a structure at that location would be either directly exposed to wildfire from adjacent wildland vegetation, indirectly exposed to wildfire from indirect sources such as embers and home-to-home ignition, or not exposed to wildfires due to adequate distance from direct and indirect ignition sources. 57% of Berkeley County structures would be directly exposed to a wildfire while 43% would be indirectly exposed.
Risk to Homes (Map 36C) is a measure that integrates the wildfire likelihood with the intensity to generalize the consequences a wildfire has on a home. Populated areas in Berkeley County have, on average, greater risk than 93% of counties in South Carolina.
As mentioned previously, wildfires can cause a wide range of environmental, physical, and health-related issues, such as smoke inhalation, burns, property damage, air

MAP 36A: LIKELIHOOD
MAP 36B: EXPOSURE TYPE
MAP 36C: RISK TO HOMES
and water pollution, habitat devastation, loss of human and/or animal life, crop loss, and property and building damage. As seen on Map 37, most of Berkeley County is designated as having moderate to high Wildfire Hazard Potential, which according to the Wildfire Risk to Communities, is an index that quantifies the relative potential for wildfire that may be difficult to control. While all wildfires are dangerous and can be devastating to communities, it is the hard to control wildfires that pose the greatest risk to communities and are capable of doing the most damage. Proper education and awareness are key in preventing wildfires from occurring in Berkeley County, something that Wildfire Risk to Communities can provide. In the event of a wildfire, local officials, first responders, and emergency service personnel across all jurisdictions should coordinate to contain the wildfire and mitigate the damage.
MAP 37: WILDLIFE HAZARD POTENTIAL

lAnD USE
The history of Berkeley County has played an immeasurable role in shaping the current land use patterns throughout the County. Beginning as a primarily agricultural community, Berkeley County was home to several large tracts of farms and plantations. As technology and transportation evolved, so did the land use patterns. Major infrastructure projects such as the construction of the Santee Canal in the late 1790’s followed by the construction of Lake Marion, Lake Moultrie, and the Tailrace Canal during the Great Depression, the development of the Port of Charleston, the expansion of the railroad network, and the construction of the US Highway system, each changed the way people, goods, and services were transported throughout the County. Furthermore, major private and public conservation efforts, like the creation of the Francis Marion National Forest in 1936 and the Audubon Society creating the Francis Beidler Forest in the 1920’s, preserved thousands of acres of natural resources as well as provided active and passive recreation opportunities for generations. These are just a few examples of how all other Elements in this Plan have helped in shaping land use patterns.
Today, Berkeley County remains largely rural with most development concentrated in the central and southern areas of the county, aka the “urban core.” Major population centers, including Goose Creek, Hanahan, Moncks Corner, Ladson, and portions of Charleston and Summerville form this urban core and account for nearly two-thirds of the County’s total population while accounting for only 20% of the total land area. Berkeley County spans approximately 1,100 square miles, about

60% of which is forested. Despite agriculture being a crucial piece of Berkeley County’s history, there were only about 100,000 acres (157 sq. mi) of active farmland in Berkeley County in 2017.
In recent years, development has been concentrated in central Berkeley County, particularly residential development. Master planned communities such as Cane Bay, Nexton, Carnes Crossroads, and Foxbank/ Cypress Reserves bring the impacts of suburbia well into what was historically considered “rural” Berkeley County. Some municipalities, like Moncks Corner and Summerville, are capitalizing on the high demand for residential development by annexing large tracts of land ripe for development to increase their local tax base.
Naturally, with the increase in residential development, commercial, industrial and employment centers are in high demand as well. Most of Berkeley County’s industrial and employment centers are located along major
roadways such as I-26 and US 52 or in one of several industrial parks located throughout the County like Camp Hall, Bushy Park, the Google Complex, and the Jamestown Industrial Park. Furthermore, the Cooper River and some of its tributaries provide a vital function for some of Berkeley County’s top manufacturers, like Nucor Steel, W International, and Dupont.
Overall, Berkeley County has a fairly diverse composition of land uses, consisting of a mixture between conservation, residential, commercial, industrial, and military uses among others. This Element will identify these different existing land use categories and provide a general description as well as detail any other important background information. These details can then be used to support any future land use-related policies or decisions made in the County. This Element will also serve as an important reality check for residents and public officials as it reviews the changes and impacts that development and policies have had on the community.
Photo/BCED
GENERAL DESCRIPTIONS OF EXISTING LAND USE
The land within Berkeley County is broken down into twelve separate and distinct land use categories. These categories capture a wide range of land use purposes including environmental uses, recreational uses, residential uses, non-residential uses, and institutional uses. Map 38 shows the location of the five planning areas and the distribution of land uses throughout the County.
MAP 38: BERKELEY COUNTY EXISTING LAND USE, 2020
Existing Land Uses

EXISTING LAND USE DESCRIPTIONS
CONSERVATION (CN)
The Conservation land use category includes areas that are specifically designated and managed for the protection of natural resources, wildlife habitats, and cultural and/ or historic resources. It is not uncommon for other activities, particularly recreation, to occur in these areas as well.
AGRICULTURE (AG)
This land use category is intended to capture both agricultural and rural land uses and aims to protect the rural character of Berkeley County whether that be actual active farms, timberlands, or rural residential.
PARKS AND RECREATION (PR)
The Parks and Recreation land use category refers to areas intended for active or passive recreational activities, such as golf courses, ballfields, playgrounds, picnic areas, and other public open spaces. While the primary intention is for recreation, many areas also protect natural, cultural, or historic resources and may contain other community facilities such as trails, boat launches, community centers, or pavilions. Most of these areas are located within a municipality or are within close proximity to the urban core of Berkeley County.
SINGLE FAMILY RESIDENTIAL (SFR)
The first of three different residential land use categories, Single-Family Residential areas can range from urban neighborhoods to suburban subdivisions to rural communities. Generally, these areas consist of individual lots or parcels with an existing single-family home or is slated to become a neighborhood of single-family homes.
MOBILE HOME RESIDENTIAL (MHR)
Similar to Single-Family Residential, Mobile Home Residential areas generally consist of individual lots or parcels with a single mobile home unit on site, however, may also include small or large mobile home parks. Nearly all Mobile Home Residential areas are located within unincorporated Berkeley County as opposed to a municipality.
MULTI-FAMILY (MFR)
The final residential land use category, MultiFamily Residential, contains the most intense residential development in Berkeley County, including apartments, condominiums, and townhomes. Multi-Family Residential units typically consist of multiple housing units within a single building, row, or complex. These higher density residential land uses may vary in size from small apartment complexes to large mixed-use developments. Based on recent housing trends and a growing demand for residential units, the Multi-Family Residential land use category may be best suited to meet this housing demand.
COMMERCIAL (C)
The Commercial land use category is intended to capture a wide range of commercial activities, including retail, offices, serviceoriented businesses, large and small corporations, etc. Commercial areas in Berkeley County can range in size from small corner stores to strip malls to large shopping centers. This category is a key component of the County’s overall tax base as they are vital for the County in generating tax revenue to fund and adequately maintain quality public services, update infrastructure, and invest
in future projects. Major Commercial areas in Berkeley County include the I-26/US 17A interchange in Summerville, the US 52/US 17A corridor in Moncks Corner, the US 52/US 176 intersection in Goose Creek, and the Clements Ferry corridor in the City of Charleston.
INDUSTRIAL (IND)
The Industrial land use category includes areas used for a wide range of industrial activities including offices, light and heavy manufacturing, research and development, warehousing, distribution centers, and other transportation-related operations. Similar to the Commercial land use category, Industrial is a key component of Berkeley County’s tax base. Due to the intensity of certain industrial activities, most of the large Industrial areas were strategically placed to minimize the impacts on the environment and quality of life. Major Industrial areas in Berkeley County include Camp Hall, the Google/Century Aluminum Complex, Bushy Park Industrial Corridor, and Cross Generation Station.
UTILITY (U)
The Utility land use category refers to areas that either directly provide utility service, contribute to a functionality of a utility service, or are owned by a utility service. Some activities include power stations and transformer sites, landfills, recycle centers, and water and sewer treatment plants. Major Utility areas include Santee Cooper (and land owned by them), the Berkeley County Landfill, and the Dominion Williams Power Station.
INSTITUTIONAL (IN)
Institutional activities, including educational, religious, health, governmental, and cultural, makeup the majority of land categorized as Institutional. The most notable area being Mepkin Abbey located along the Cooper River. While this land use category includes activities vital to a functioning and sustainable society, there is limited potential for expansion.
MILITARY (M)
The Military land use category consists solely of the lands belonging to the Naval Weapons Station. Similar to Institutional, this land use category has limited potential for expansion due to the land use activity and ownership.
VACANT (V)
The Vacant land use category acts as sort of a catch all category, consisting of areas not currently developed, areas not able to be developed (i.e., wetlands or floodplains), vacant islands, or areas with existing infrastructure like the levee system and rediversion canal. Vacant areas in the urban core of Berkeley County should be given top priority for redevelopment and infill development.
SPECIAL CONCERNS
As discussed in the Natural Resources Element, there are several natural areas that require special considerations when it comes to land use and growth management policies and discussions. Some of the top environmental concerns in Berkeley County include wetland areas, forest lands, intact habitat cores, and protected lands (public and private). These environmentally sensitive resources do not follow parcel or political boundaries; therefore, policies should not be limited to any one particular zone or parcel but rather across all areas with large swaths of resources. Continuing to require developers to identify, and ideally plan around, these sensitive areas will help protect them from destruction and mitigate the impacts that development often has on the environment.
PLANNING AREAS
The distribution of the existing land uses was one of the primary factors during future land use discussions and helped shape several land use-related recommendations. Therefore, highlighting the importance of protecting the rural character of Berkeley County while simultaneously encouraging growth and prosperity in the urban cores will be a focus of this Element. Because of this diversity, the large size, and complex history of Berkeley County, five planning areas, Northern (N), Eastern (E), Southern (S), Central (C), and Western (W), were used to better capture the land use patterns throughout the different parts of the County. Maps 39 (N), (E), (S), (C), & (W) zooms in on each of the planning areas to show the breakdown of existing land uses in greater detail.
MAP 39 (N) - NORTHERN PLANNING AREA
St. Stephen-Bonneau-Bonneau Beach-Cross
The Northern Planning Area is predominantly rural with few incorporated and unincorporated communities located throughout, most notably being St. Stephen, Bonneau, Bonneau Beach, and Cross. Just over half (53%) of this planning area is categorized as Agriculture, followed by Conservation which accounts for about 20% of the total land area. Most of the other land use categories are in close proximity to a major roadway such as US 52, SC 45, and SC 6. The northern two-thirds of Lake Moultrie is located within this planning area, which played an important role in the formation of some of the smaller rural communities such as Pineville and Eadytown. The Cross Generation Station, located between Lakes Marion and Moultrie, is one of several major industrial areas in Berkeley County.
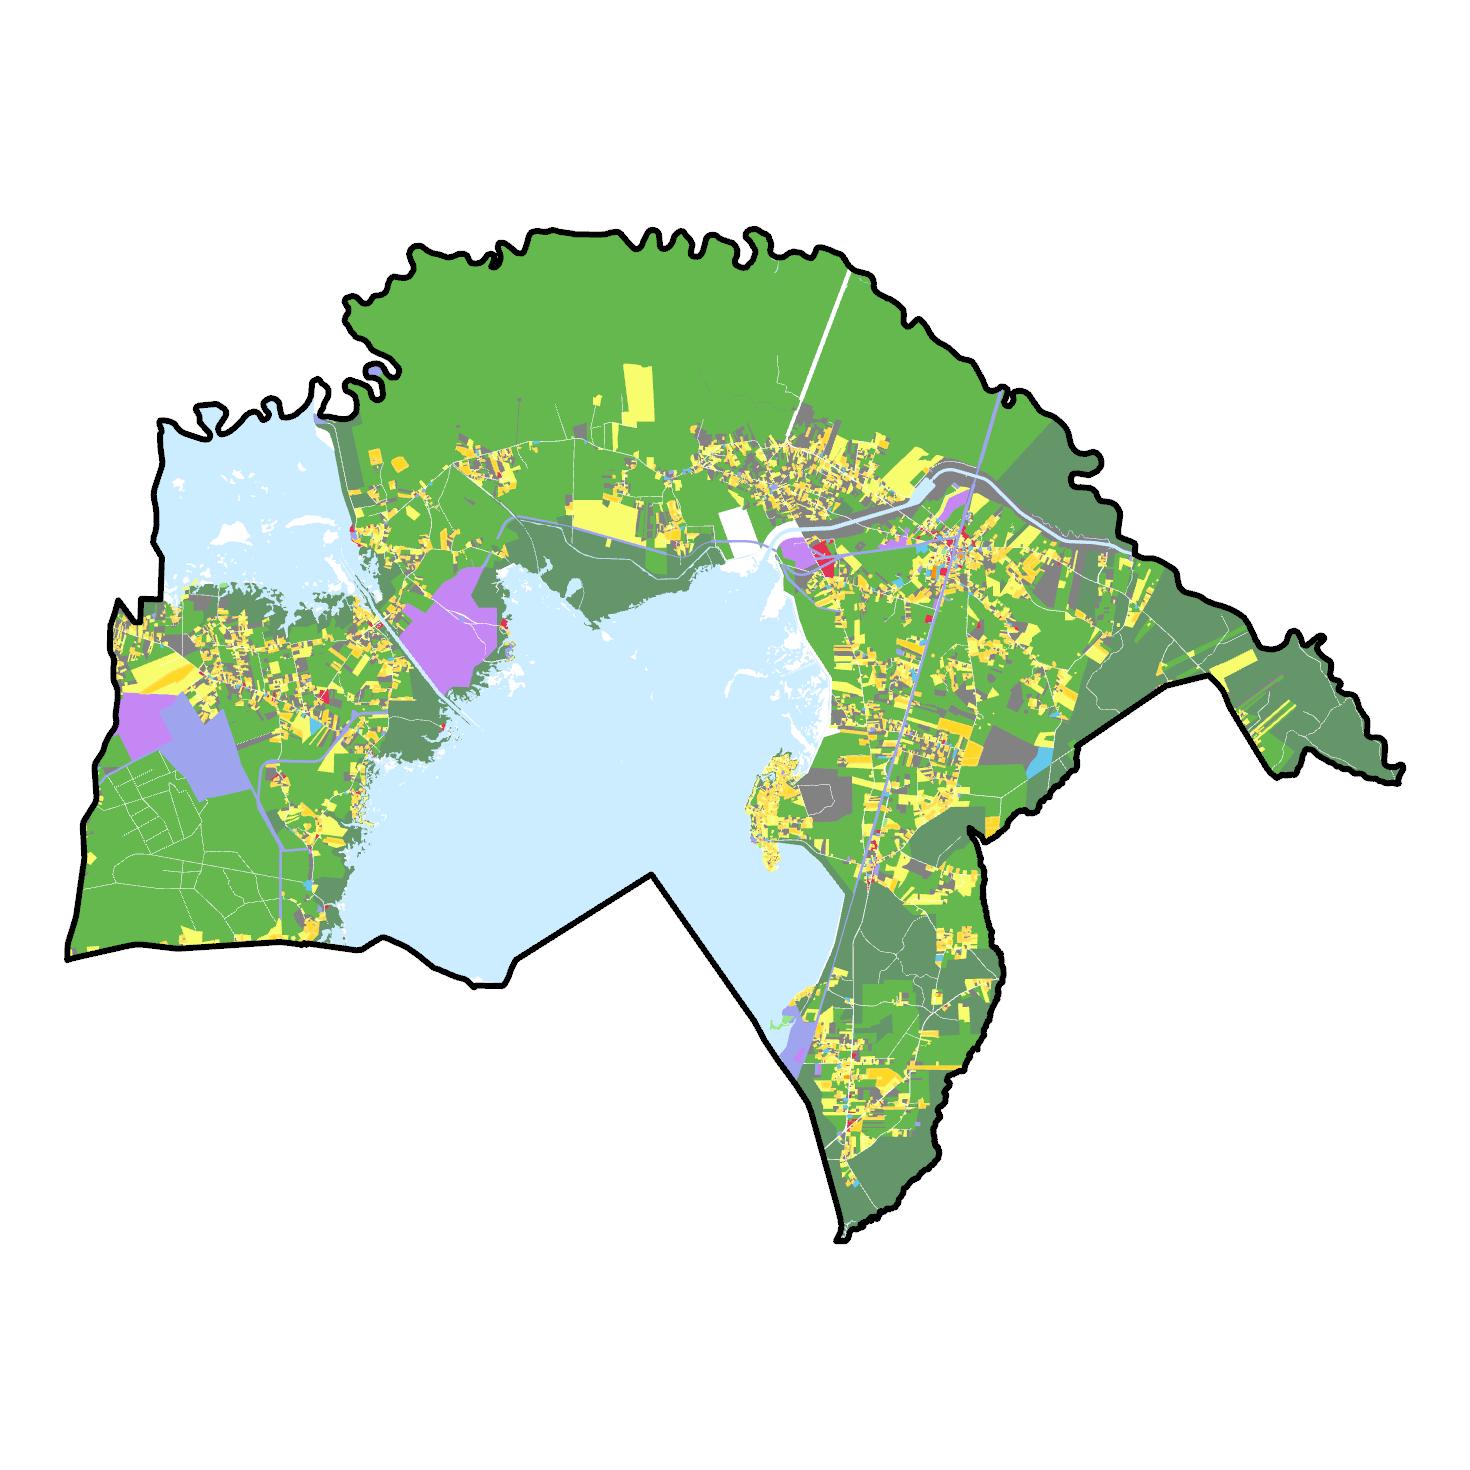
MAP 39 (E) - EASTERN PLANNING AREA
Jamestown-Huger-Macedonia-Francis Marion National Forest
The Eastern Planning Area is the largest planning area by size but is also one of the more sparsely populated areas. The Conservation land use category accounts for about 71% of the planning areas total land area while Agriculture accounts for an additional 14%. The Francis Marion National Forest is a major contributor to the large areas of Conservation with the Bonneau Ferry Wildlife Management Area being the only other notable contributor. Jamestown, the only incorporated municipality, along with Huger, Macedonia, and Honey Hill/ Shulerville, are the major population centers within this planning area and are located on the periphery of the national forest. Other smaller but notable land use areas include Mepkin Abbey (Institutional), Nucor Steel (Industrial), and the Jamestown Industrial Park (Industrial).
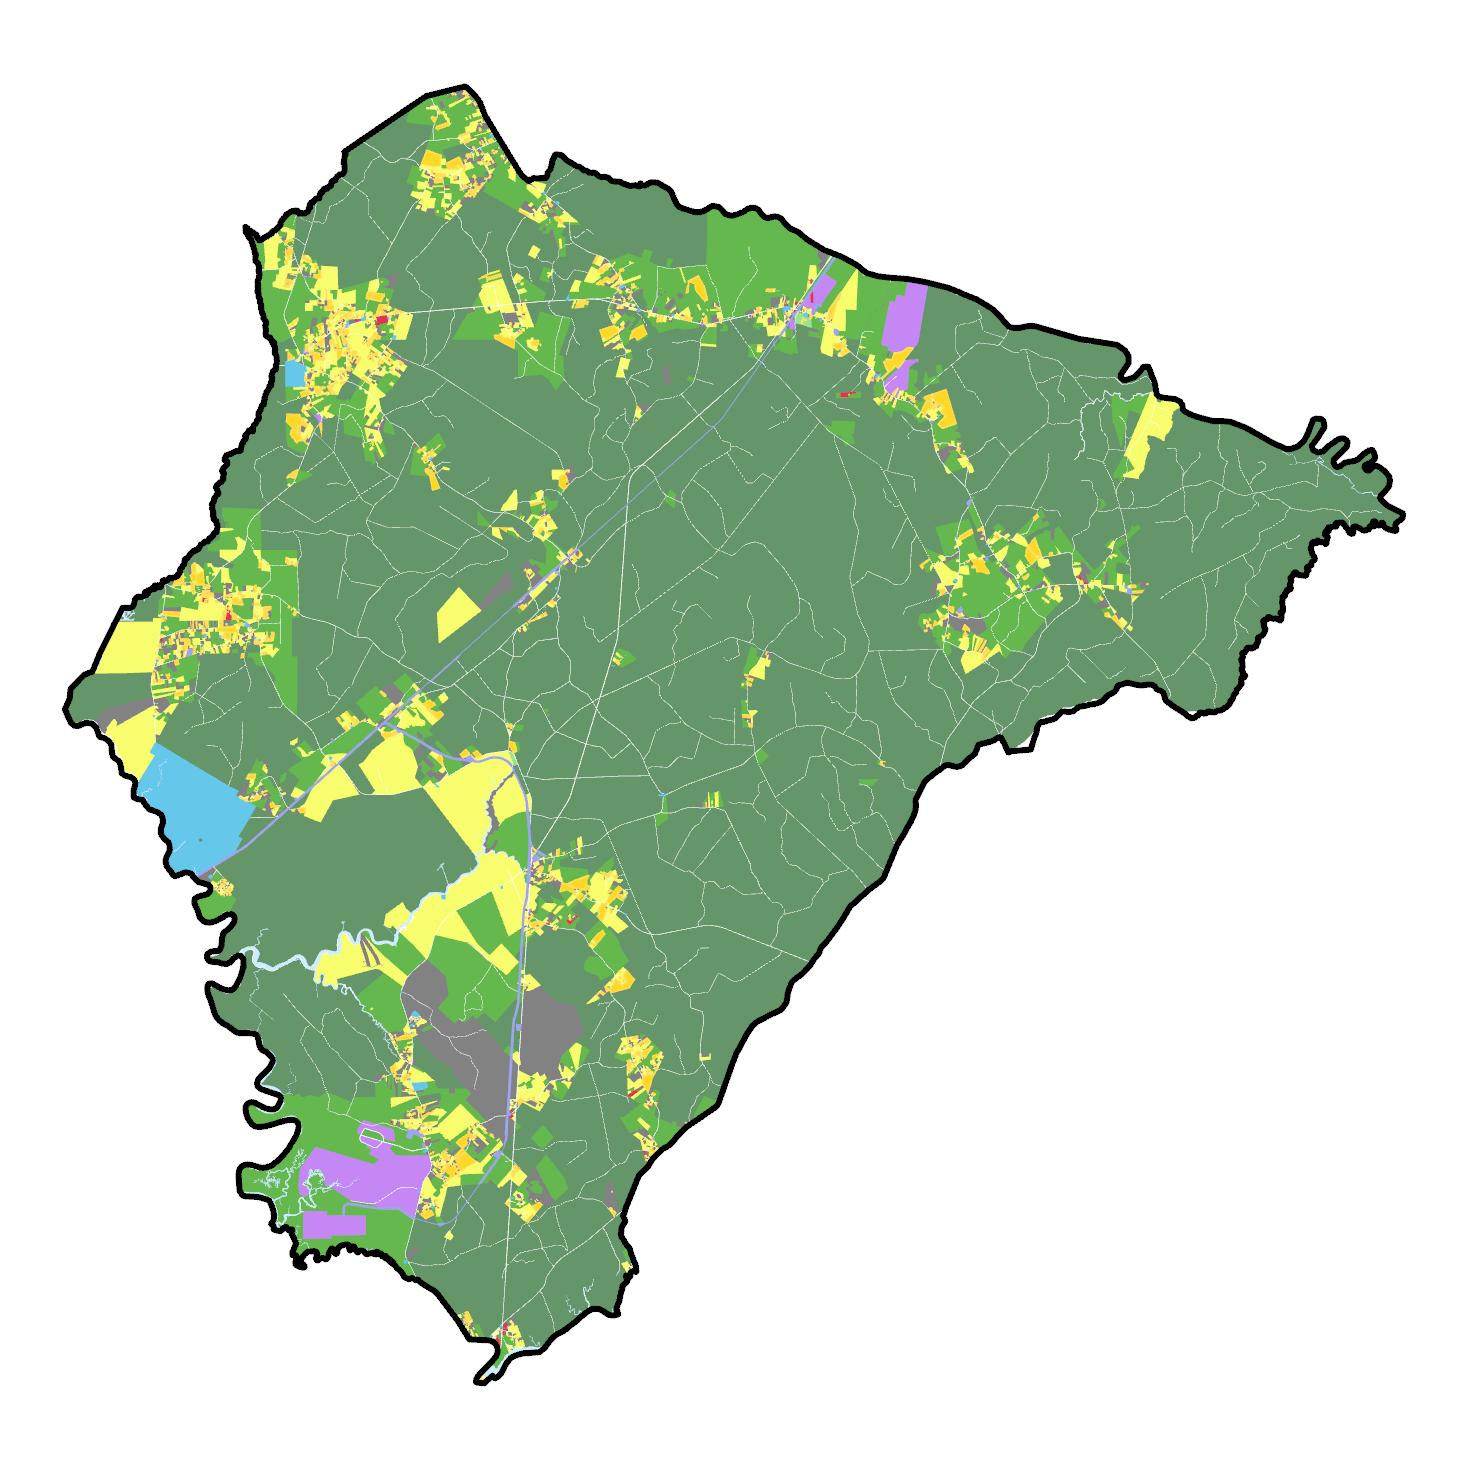
MAP 39 (S) - SOUTHERN PLANNING AREA
Hanahan-Daniel Island-Cainhoy Peninsula-Naval Weapons Station
The composition of the Southern Planning Area is unlike the other planning areas in that the Military land use category accounts for nearly 50% of the total land area. The Naval Weapons Station, located along the Cooper River, is over 17,000 acres in size and is within the cities of Goose Creek and Hanahan. Municipalities within this planning area include Hanahan, the City of Charleston (Daniel Island and the Cainhoy Peninsula), and portions of Goose Creek. With recent development on the Cainhoy Peninsula, the amount of Agriculture will likely decrease over the next few years, converting into Single-Family Residential, Multi-Family Residential, and Commercial. Despite Multi-Family Residential accounting for only 0.5% of the total Southern Planning Area’s total area, this is equivalent to about 40% of the County’s total Multi-Family Residential area.

MAP 39 (C) - CENTRAL PLANNING AREA
Goose Creek-Summerville-Moncks Corner-Ladson-Whitesville-Bushy Park Corridor
Due to most of the larger incorporated municipalities in Berkeley County being located within this planning area, the Central Planning Area is the most densely populated and developed planning area. Some of the urban, suburban, and rural communities include Moncks Corner, portions of Goose Creek and Summerville, Ladson, and Whitesville. The Bushy Park Industrial Corridor, located directly adjacent to the Naval Weapons Station and along the Cooper and Back Rivers, provide a substantial amount of Industrial and Utility land use areas. This is the only planning area where residential land uses, specifically Single-Family Residential, is the largest land use category.
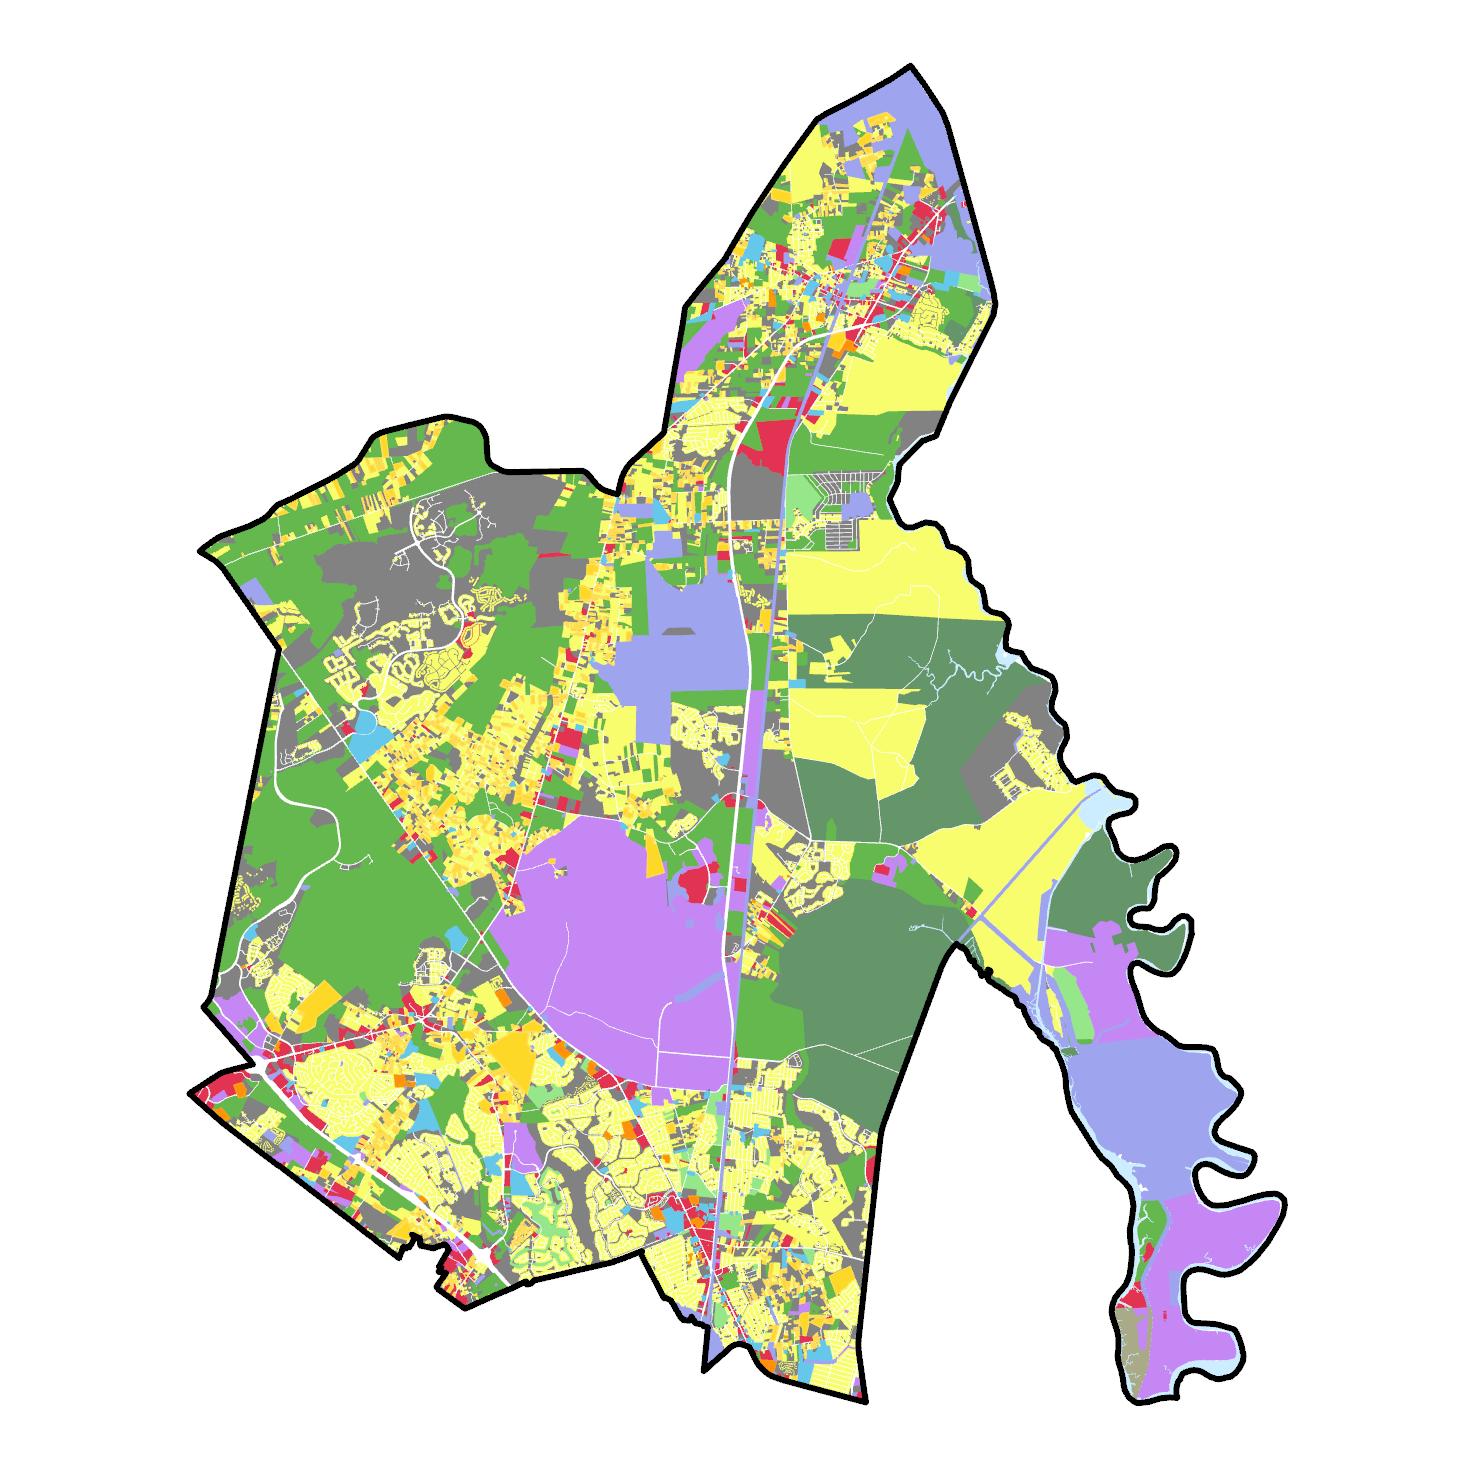
MAP 39 (W) - WESTERN PLANNING AREA
Rural Berkeley-Pinopolis-Camp Hall
The Western Planning Area is perhaps the most rural of the five-planning area, with no incorporated communities and very few rural communities, such as Lebanon, Pinopolis, and Poplar Hill. While about two-thirds of the planning areas total land area is categorized as Agriculture, the most notable land use area would be the Camp Hall Industrial Park, located off of I-26 at Volvo Car Drive. Due to this major center of employment, other land uses, specifically residential and commercial, are expected to grow in the future. While currently mostly rural, the Western Planning Area has some of the most potential for future growth due to the numerous access points to I-26, the large tracts of unprotected land, and the lack of environmental constraints such as floodplains and wetlands.

GENERIC EUCLIDEAN ZONING
Euclidean Zoning, also known as conventional zoning, is a land use planning tool that has been in use in the United States since the early 20th century. It involves dividing an area, typically a town, city, or county, into distinct zones, each with its own set of regulations governing the types of uses, building sizes, and other aspects of development permitted in that zone. However, in recent years, there has been a growing trend away from Euclidean Zoning, as people have expressed an increase interest in more mixed-use communities, allowing for people and families to “Live, Work, Play.” Furthermore, as cities continue to expand, planners and policymakers look for more flexible and responsive ways to meet an increasing population while continuing to manage land uses and development.
Here are some of the key trends and approaches that are moving away from Euclidean Zoning:
• Form-based Zoning: This approach focuses on the physical form of buildings and their relationship to the surrounding context, rather than just their use. It aims to create walkable, mixed-use neighborhoods with a range of building types and sizes that are aesthetically consistent and harmonious. Form-based zoning regulations often allow for more flexibility and adaptability in land uses, favoring the more consistent design. This can lead to more creative and diverse communities and development patterns than typically what traditional Euclidean zoning would produce.
• Performance-based Zoning: This approach focuses on achieving a specific outcome, such as reduced traffic congestion, improved air quality, or increased access to affordable housing. It sets performance standards that must be met and allows developers and property owners to find their own ways of meeting those standards. Performance-based zoning can lead to some very innovative buildings and designs while providing essential uses and services to a community.
• Inclusionary zoning: This approach seeks to address the affordable housing crisis by requiring developers to include a certain percentage of affordable housing units in new developments, or pay into a fund that supports the creation of affordable housing elsewhere in a community. This can help ensure that people of all income levels have access to high-quality housing in desirable locations.
• Mixed-Use Developments: Serving as a middle ground between Euclidean zoning and some of the aforementioned approaches, Mixed-Use Developments promotes the integration of different land uses, such as low, medium, and high density residential, commercial, industrial, and institutional, within the same development or neighborhood. While these types of developments still tend to separate land uses (i.e., single-family neighborhoods from multi-family neighborhoods) rather than create mixed-use buildings, the close proximity and walkability between the different land uses make this a worthwhile approach.
• Transit-Oriented Development: Similar to Mixed-Use Development, Transit-Oriented Development, or TOD, is an approach that focuses on creating compact, mixed-use developments around public transit stations or corridors, however, TODs encourage more mixed-use buildings rather than mixed-use developments. Integrating different land uses categories in a more compact setting can create vibrant and social community spaces, generating a 24/7 clientele. Using transit stations as the focal point, a TOD is intended to encourage more residents to use public transportation and reduce the dependency on cars.

Overall, these trends reflect a growing recognition that land use planning must be more flexible and responsive to accommodate the shifting societal needs of a community. Creating sustainable, equitable, and livable spaces can prove to be a challenge, however, adapting existing land use policies and practices, like Euclidean Zoning, into more innovative and integrated approaches can provide planners and policymakers the flexibility to protect community character while encourage quality growth.
BUILDING PERMITS
In 2022, Berkeley County issued nearly 6,000 building permits, nearly doubling that of 2021, as seen in Figure 91. Analyzing building permit trends can provide useful information on the health and perception of the local and national economy. Residents and developers investing in building, expanding or renovating homes can indicate a strong (or perception of a strong) economy as people are willing and have the funds to invest. Map 40 shows a heat map of the issued building permits in Berkeley County in 2022. The major hot spots appear to be around Carnes Crossroads, Cane Bay, Nexton, Foxbank/Cypress Reserve, and Hanahan. Naturally, as these developments finish up over the next couple of years, the hot spots will shift to new and upcoming projects expected to break ground.

MAP 40: BERKELEY COUNTY 2022 BUILDING PERMITS
