Welcome to the Houston Residential Housing Market’s 2024 mid-year report. Whether you’re a buyer, seller, investor or seeking local market insights, this report caters to your needs.
Exploring 38 local market areas within Harris County along with County level insights, the report provides both macro and micro analyses. After reading, you’ll grasp the essence of the Houston market.
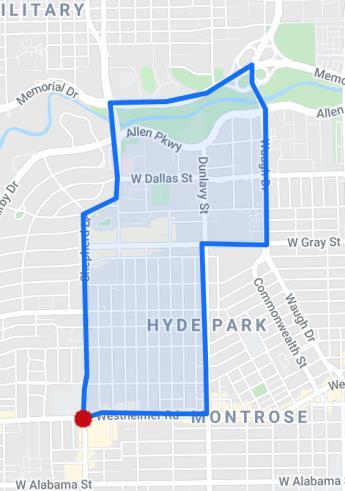
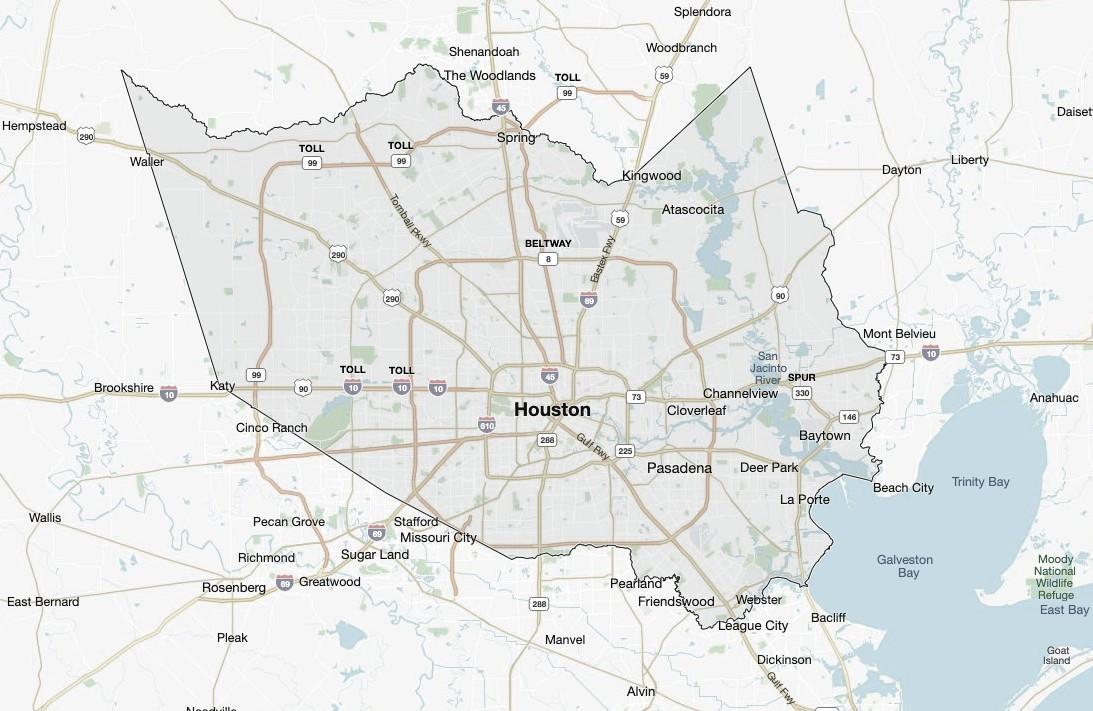
Given Houston’s diverse geography and housing styles, prudent decisions demand deeper dives. If your market area isn’t covered, custom dashboards can be created upon request.
Thank you for your time. Feel free to call or email for further market exploration.
SECTIONS OF THE REPORT
1. Harris County Highlights
Understand the market at the macro level: Harris County. Includes period-over-period comparisons, price segment distributions as well as other historical data trends.
2. Market Area Comparison
This section will show you how each area stacks up: 1) Top 10 Markets based on Med. Sales Price per property type; 2) Presenting the Market Health Check (buyer’s, seller’s or even market).
3. Market Area Details
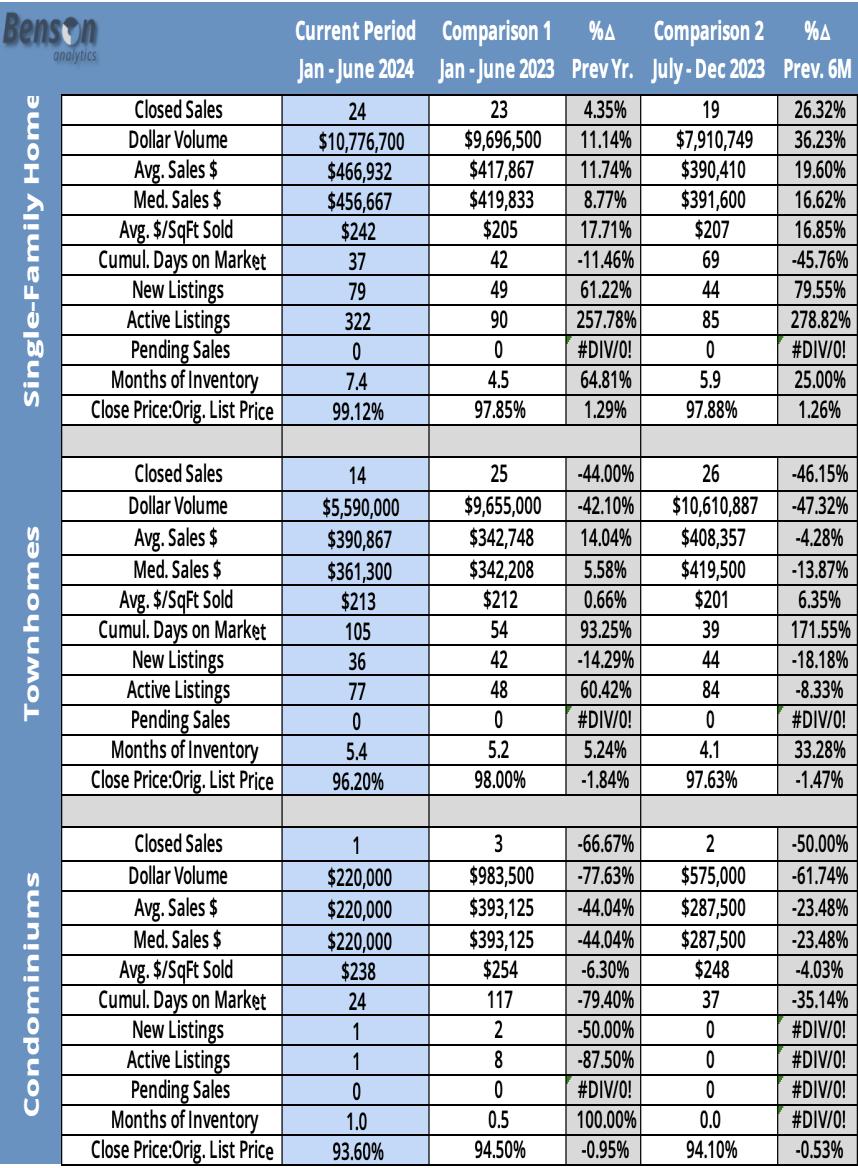
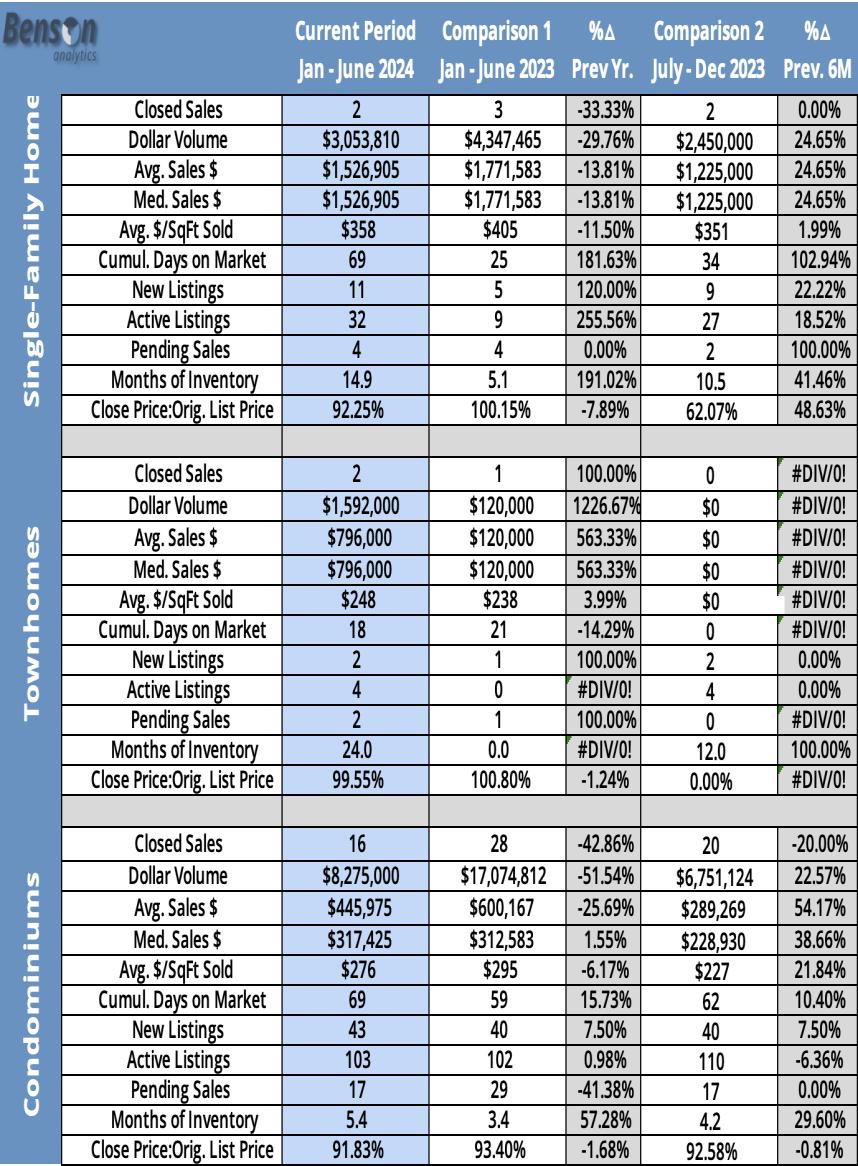
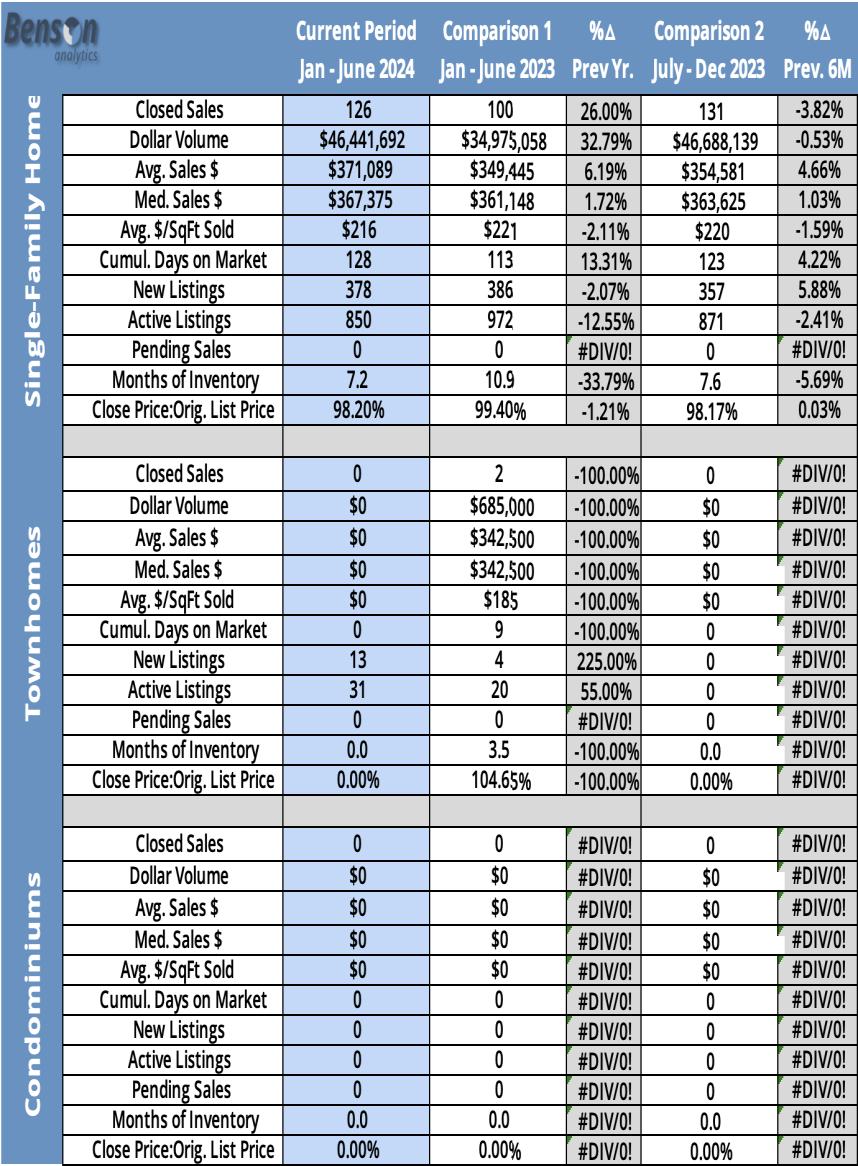
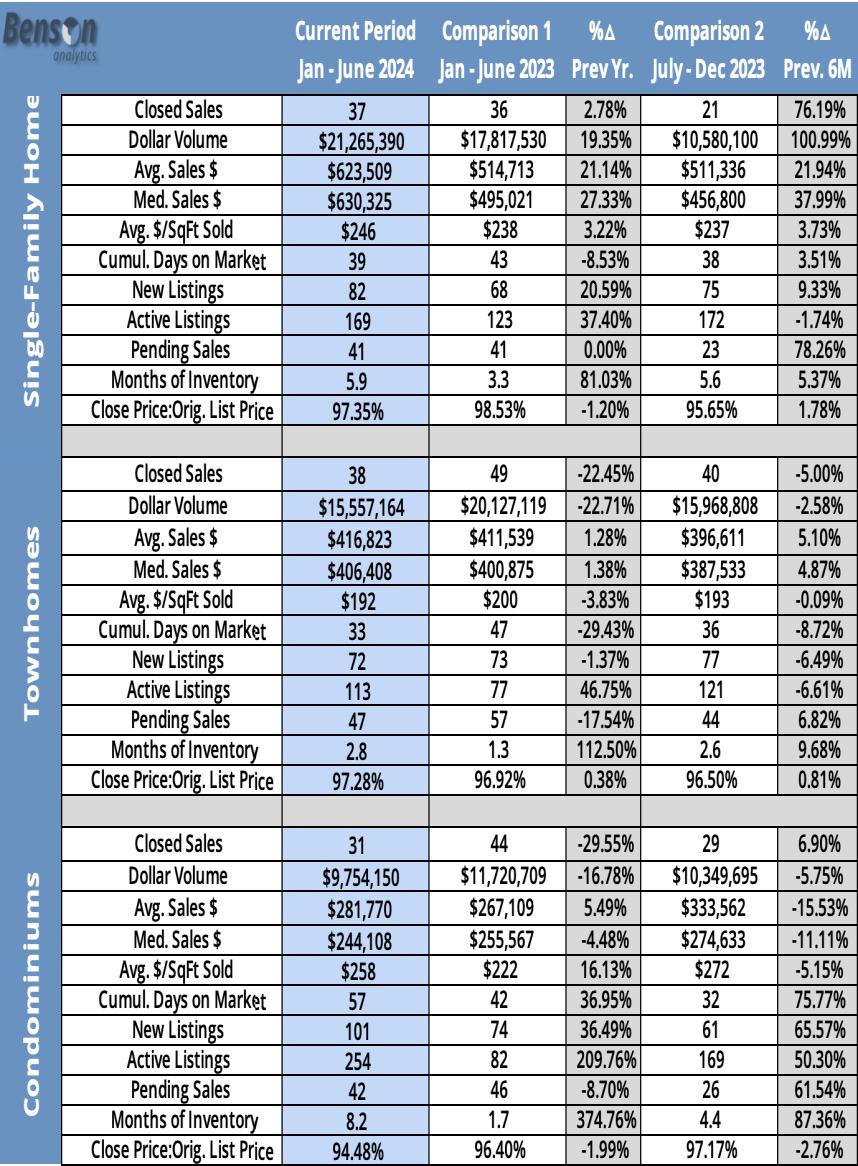
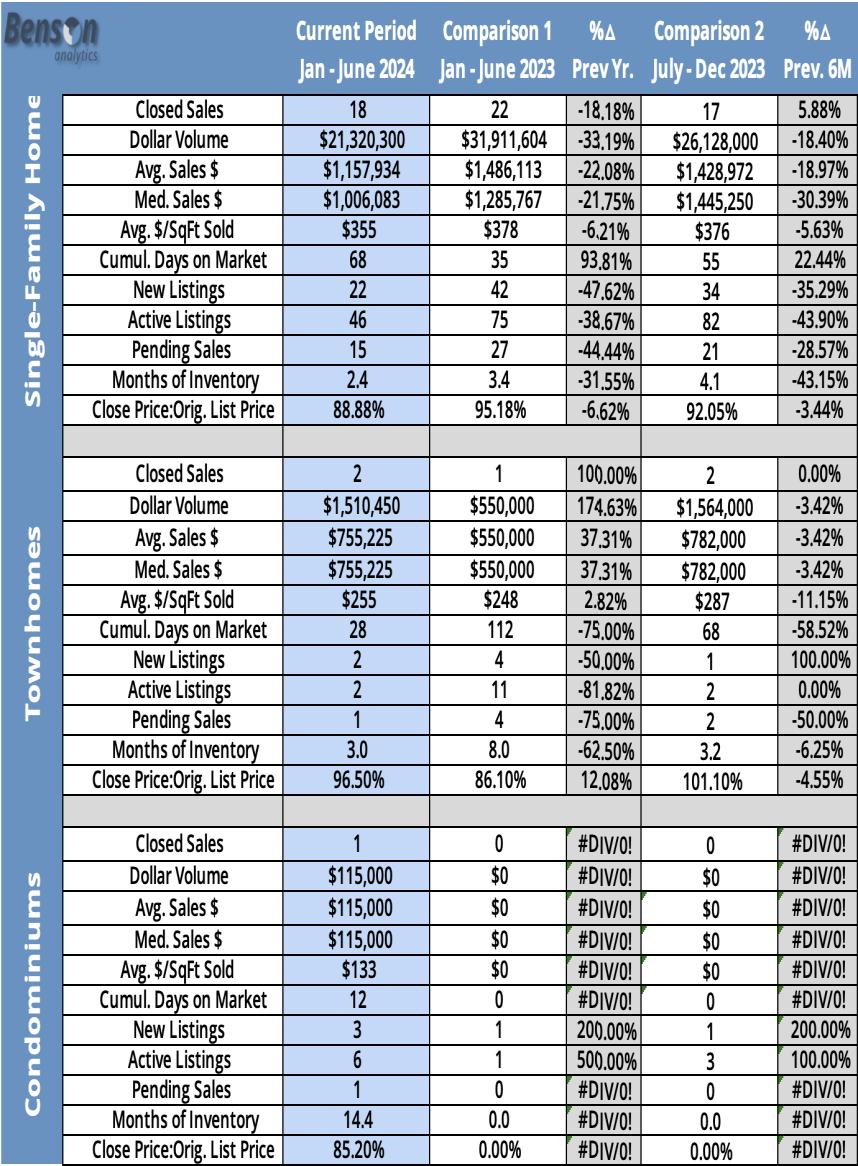
Get a detailed breakdown of 38 local market areas tracked with period-over-period changes included.
HOUSTON
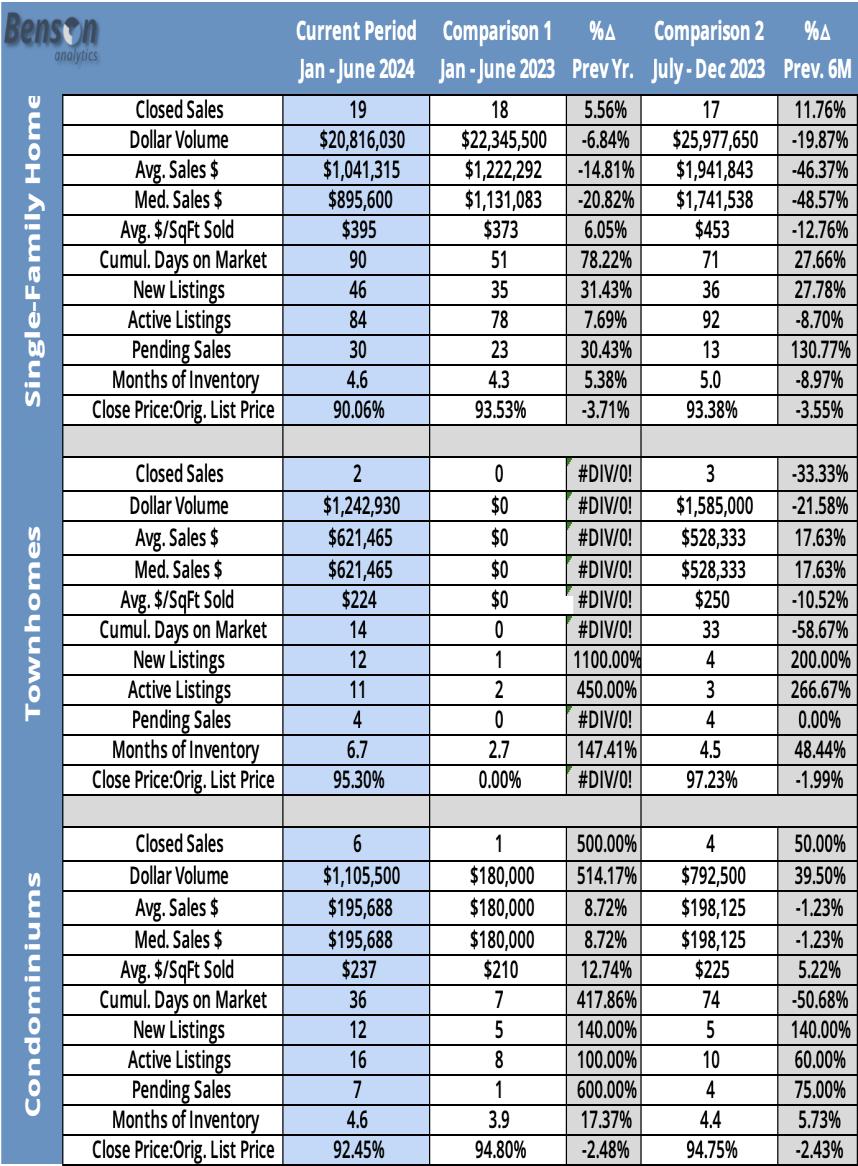
Harris County Highlights
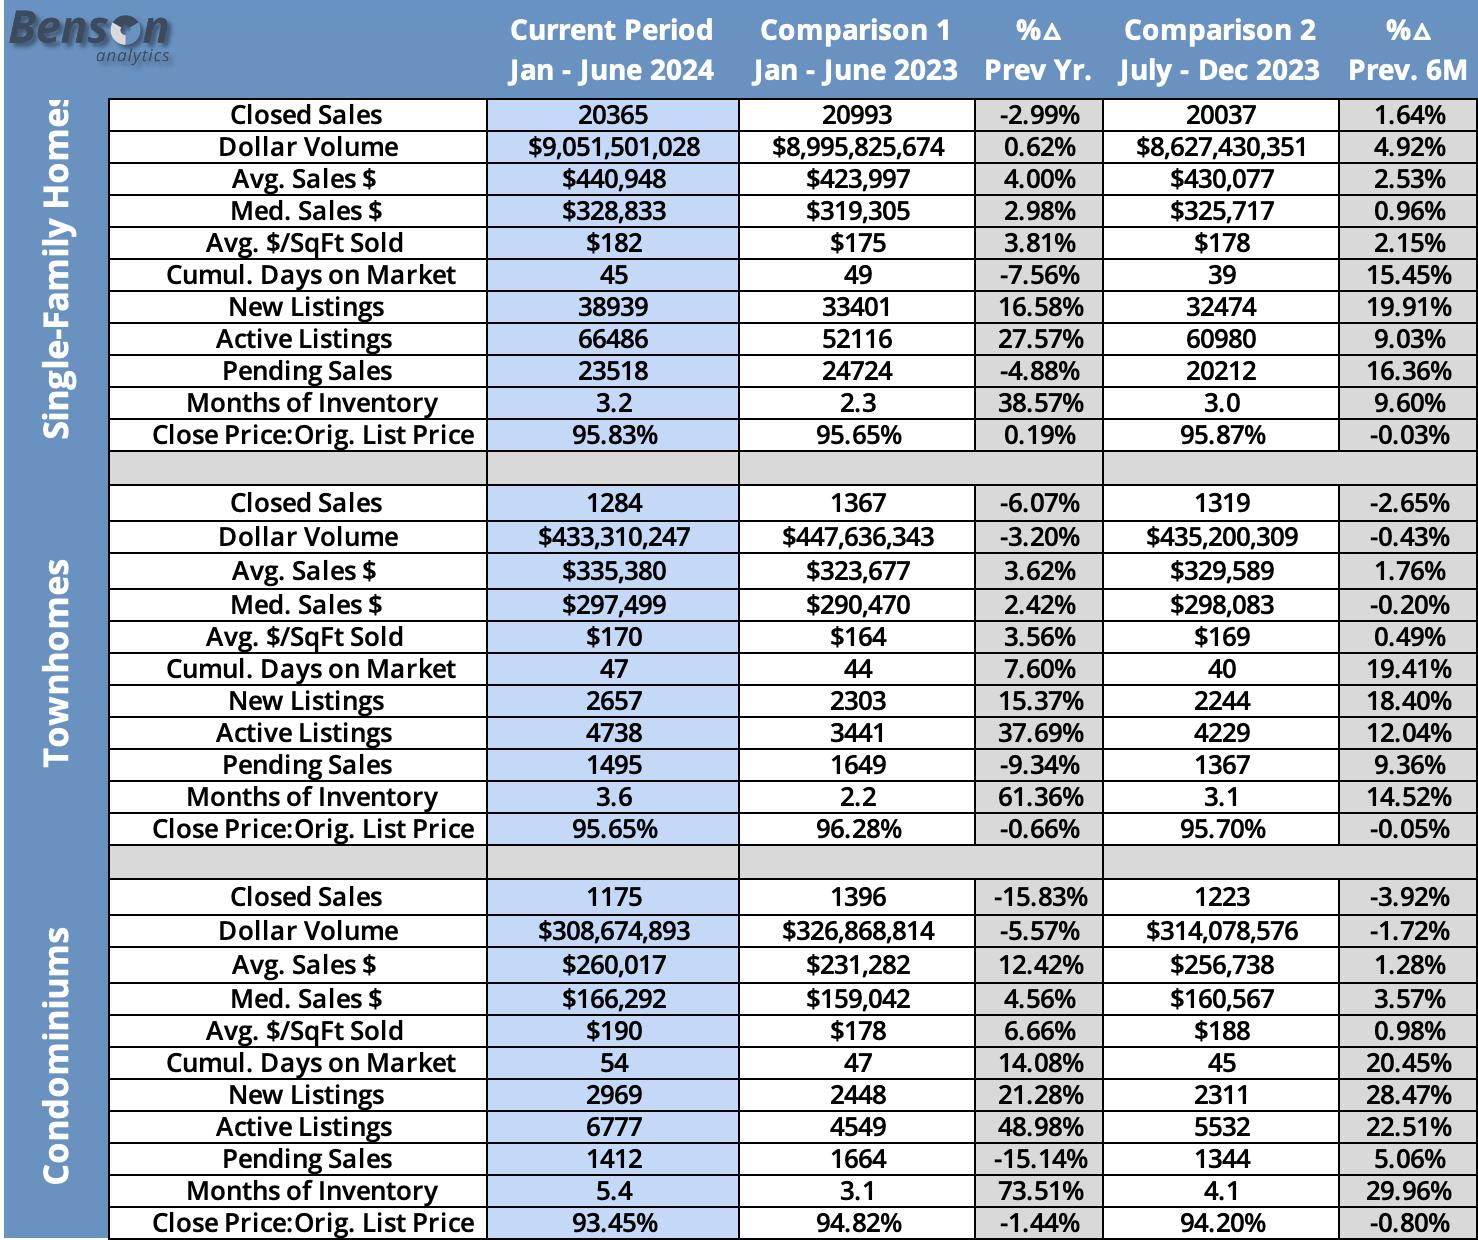
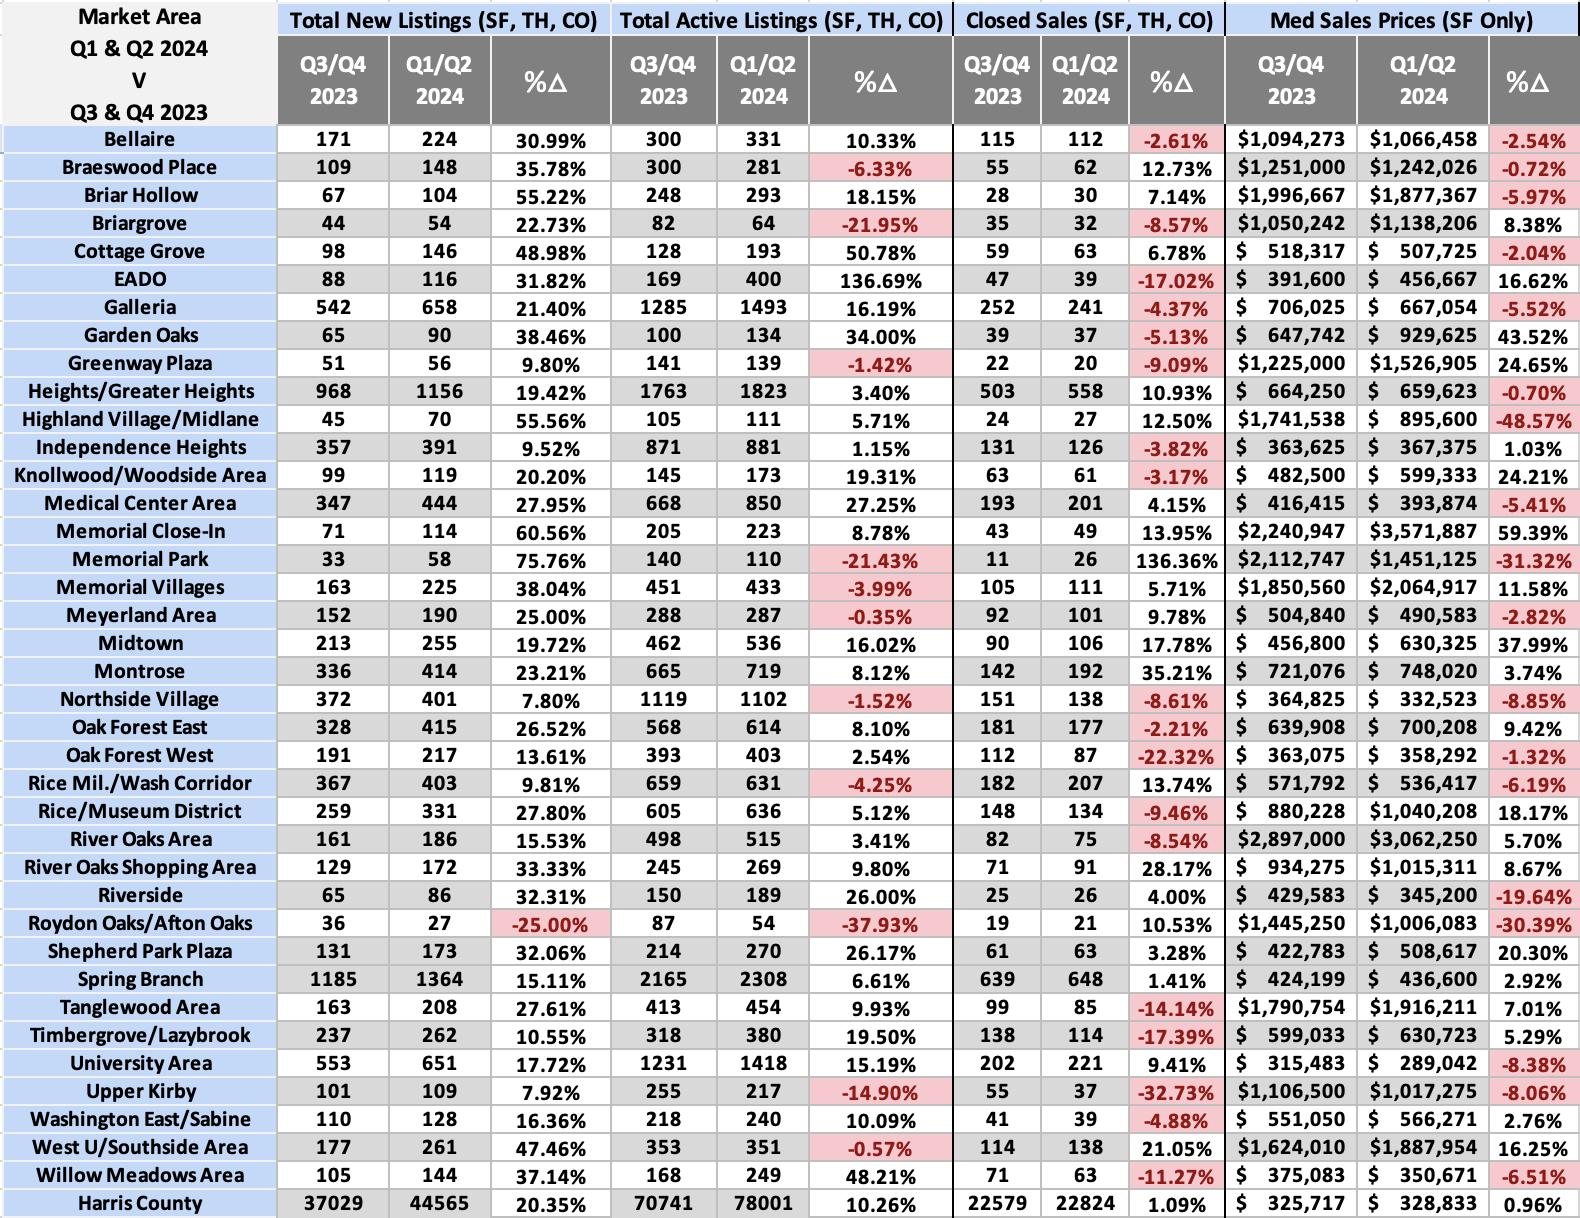
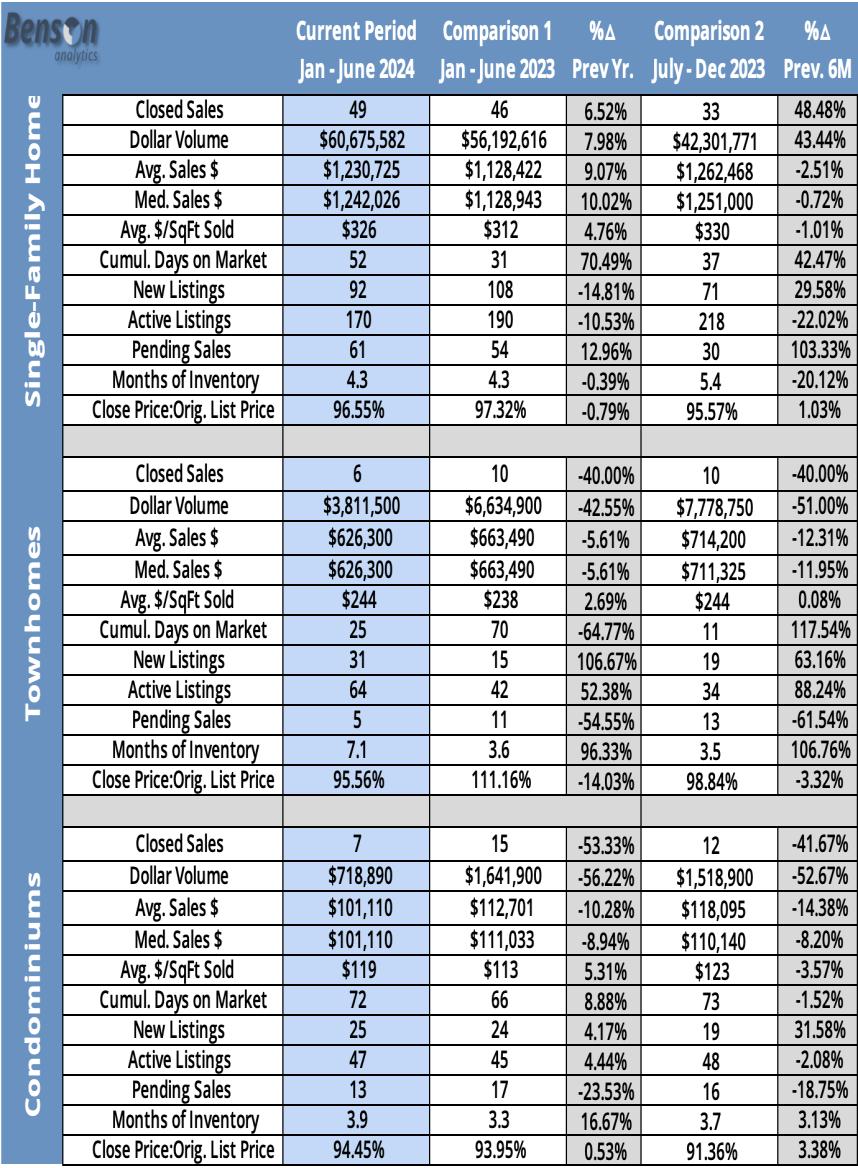
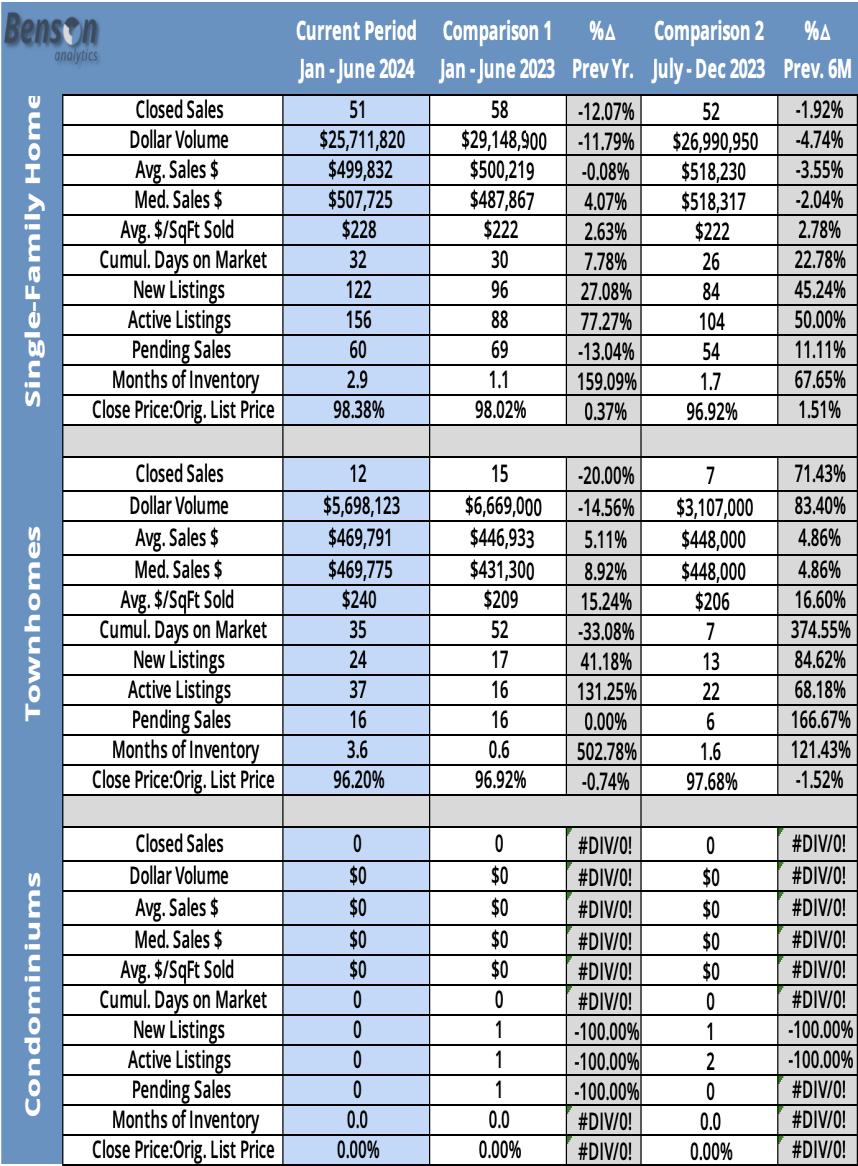
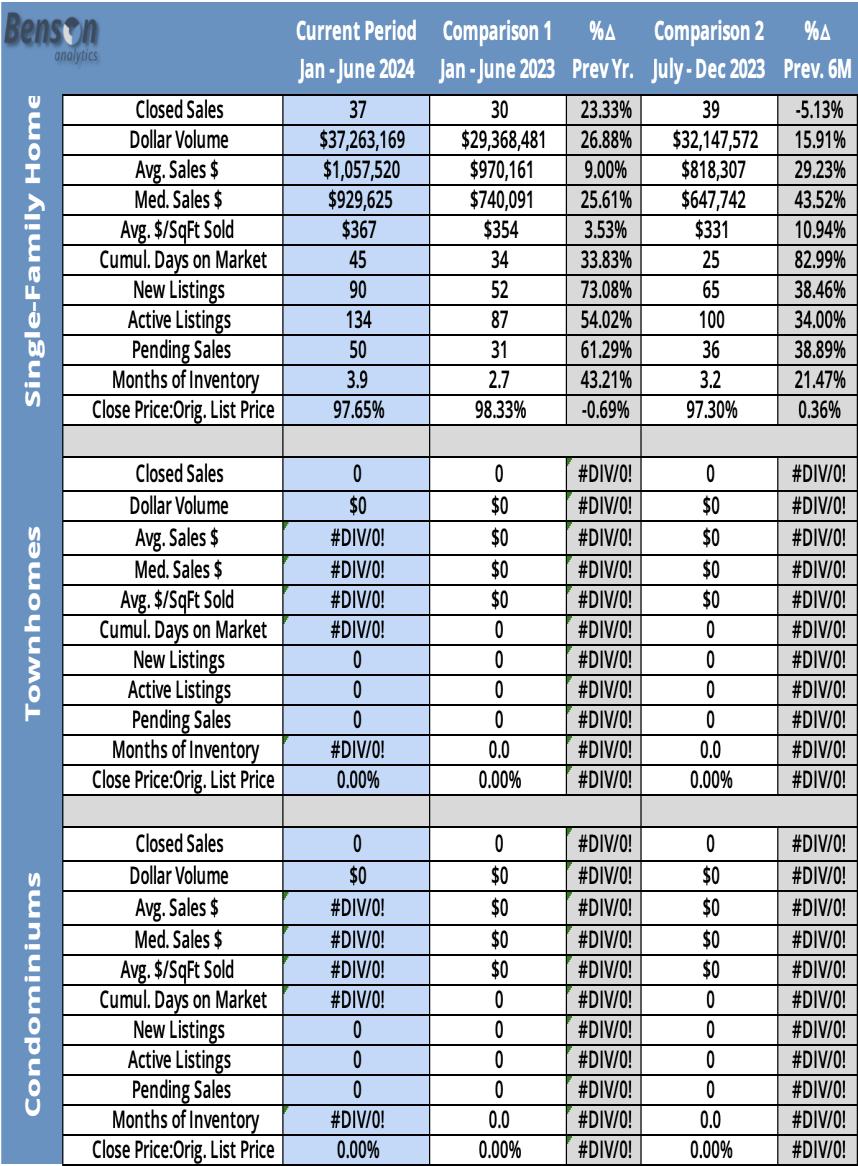
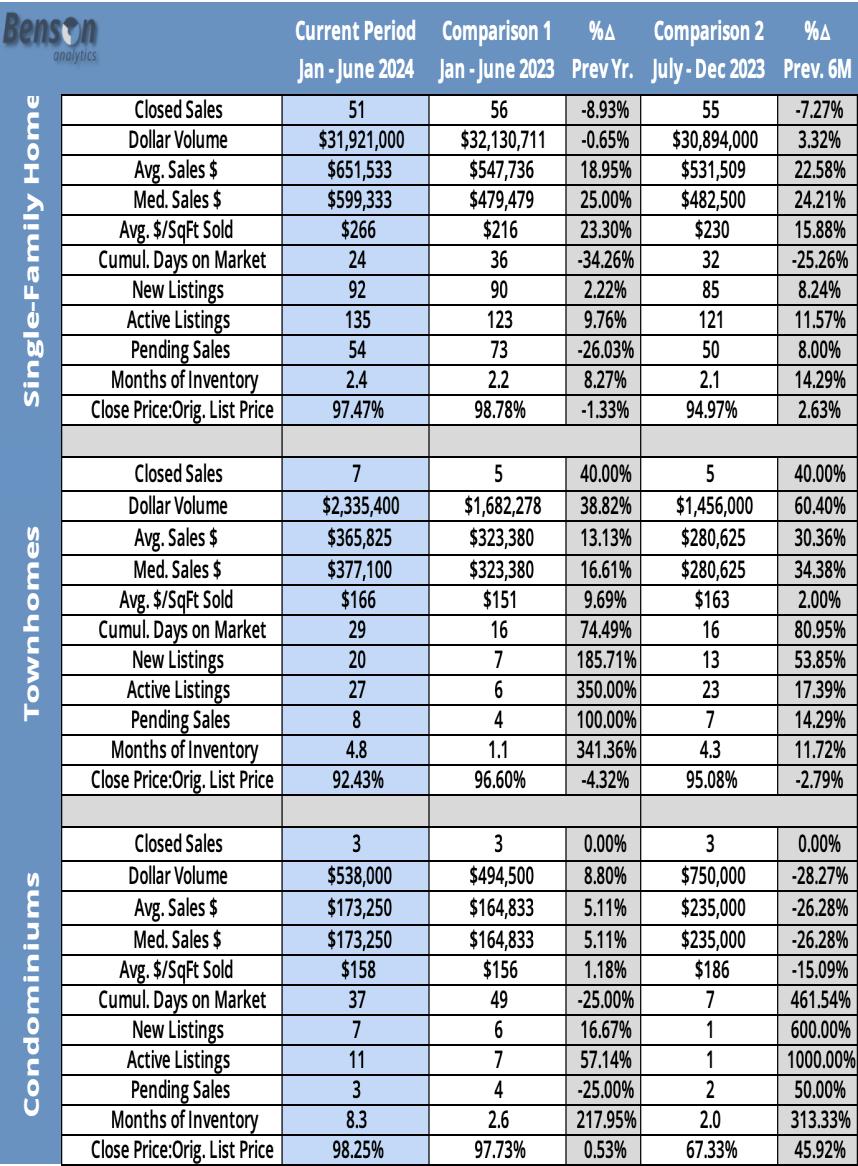
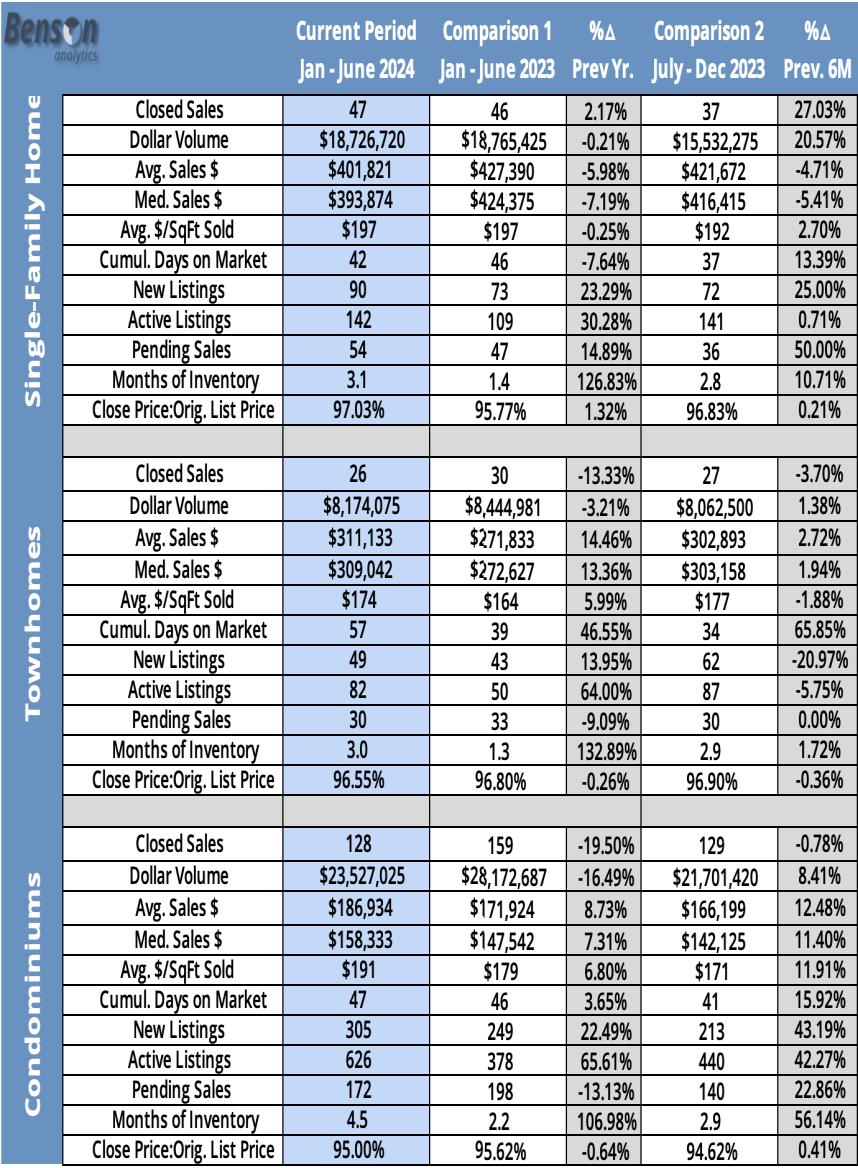
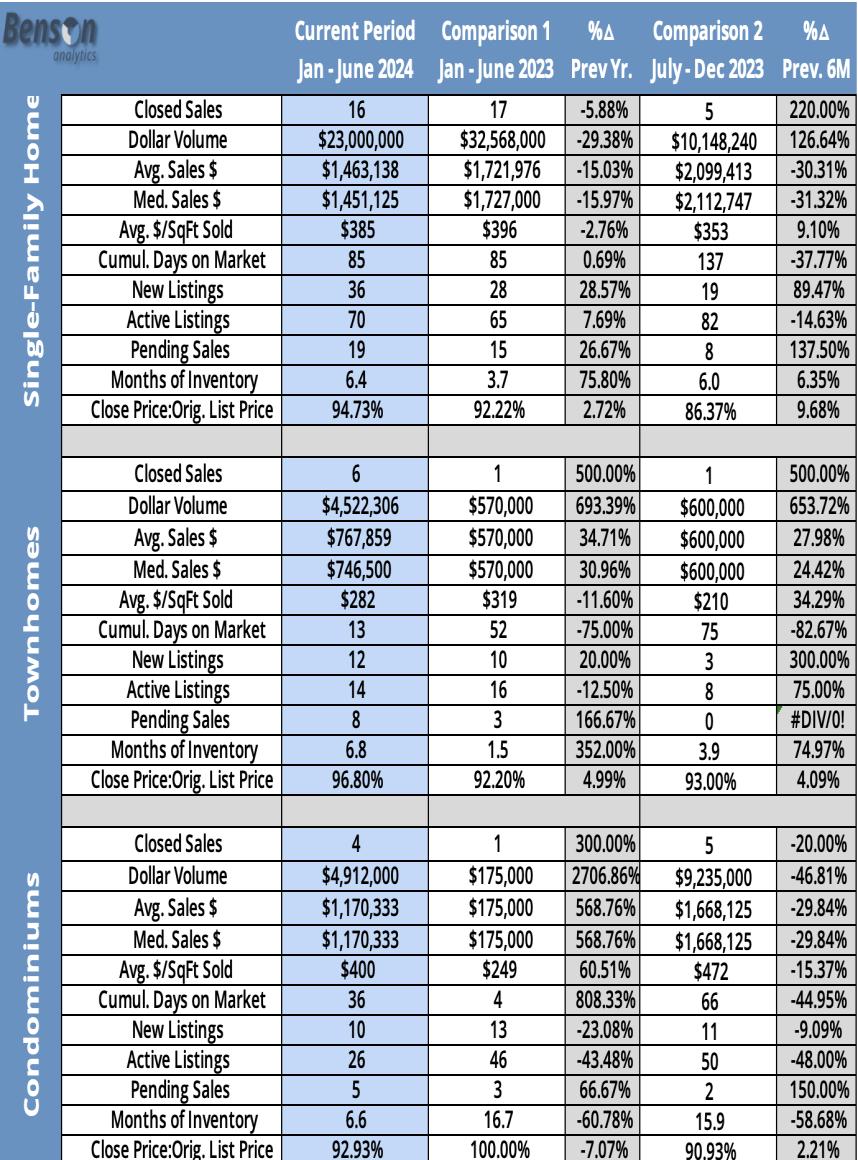
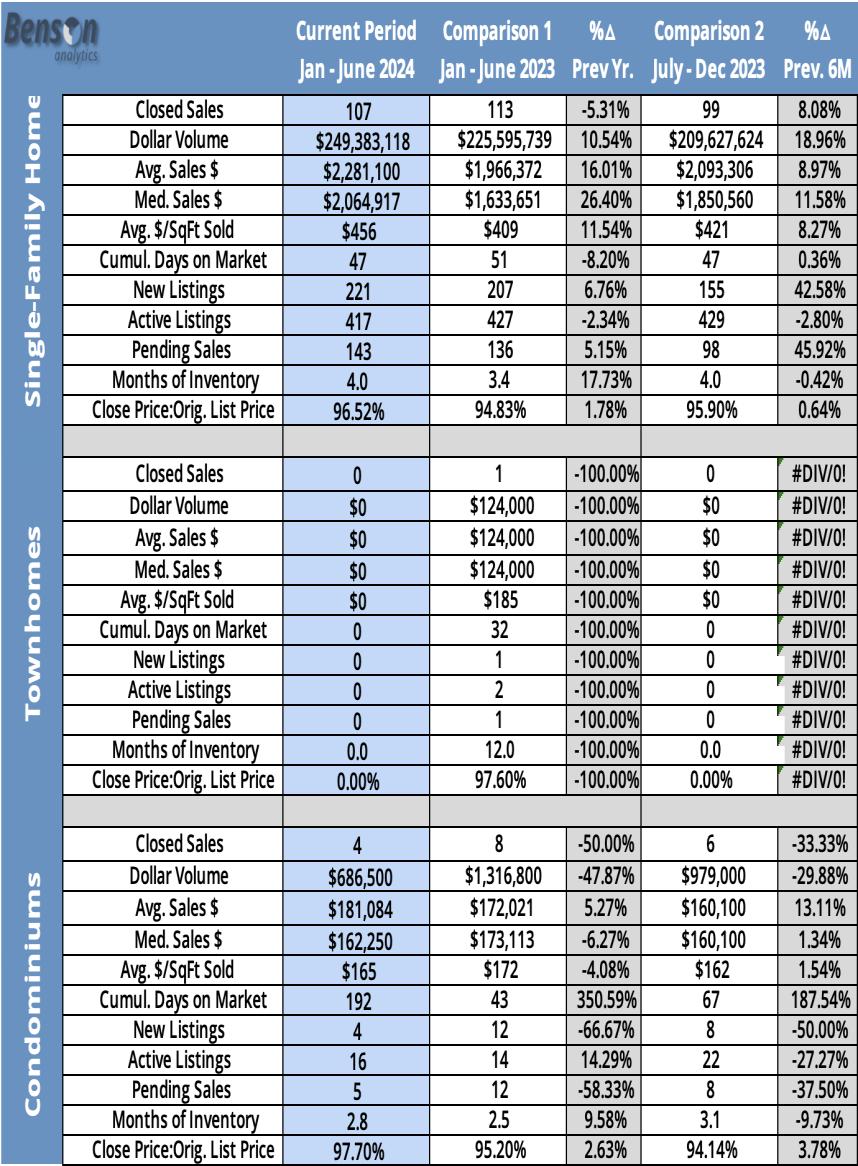
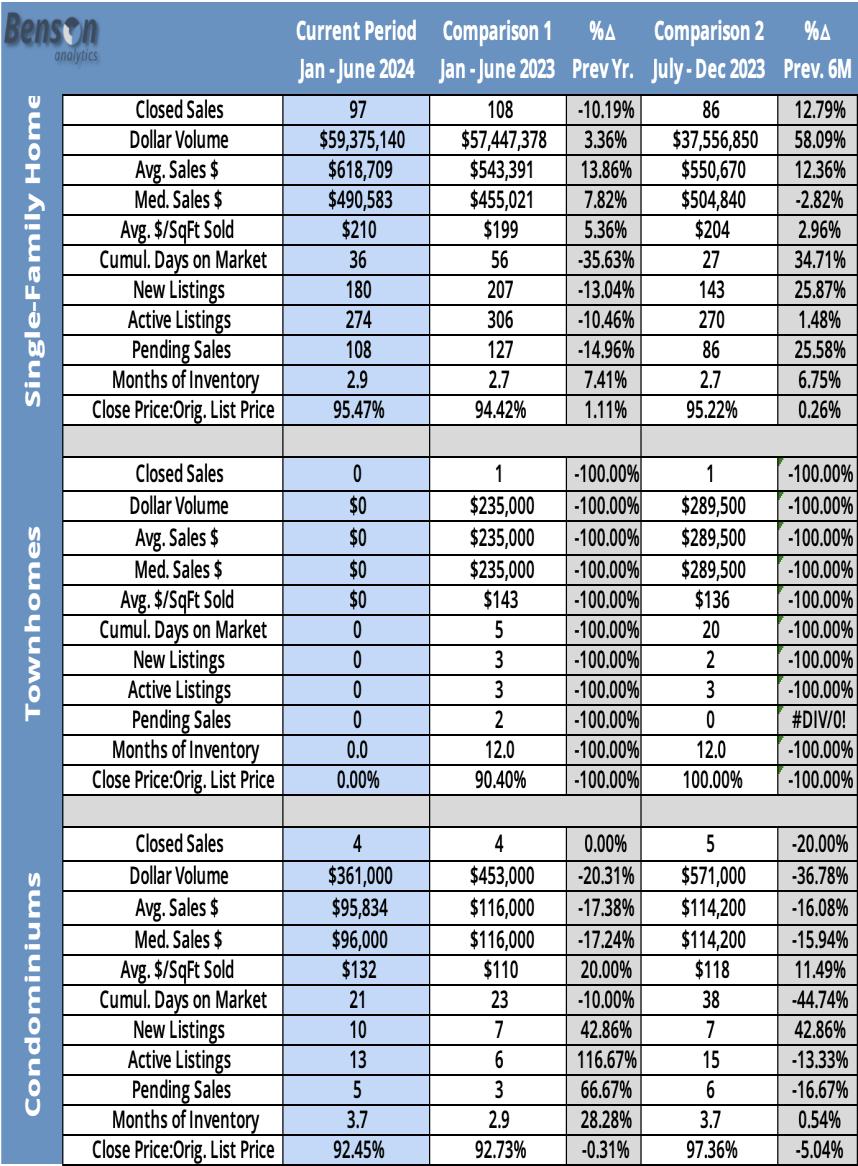
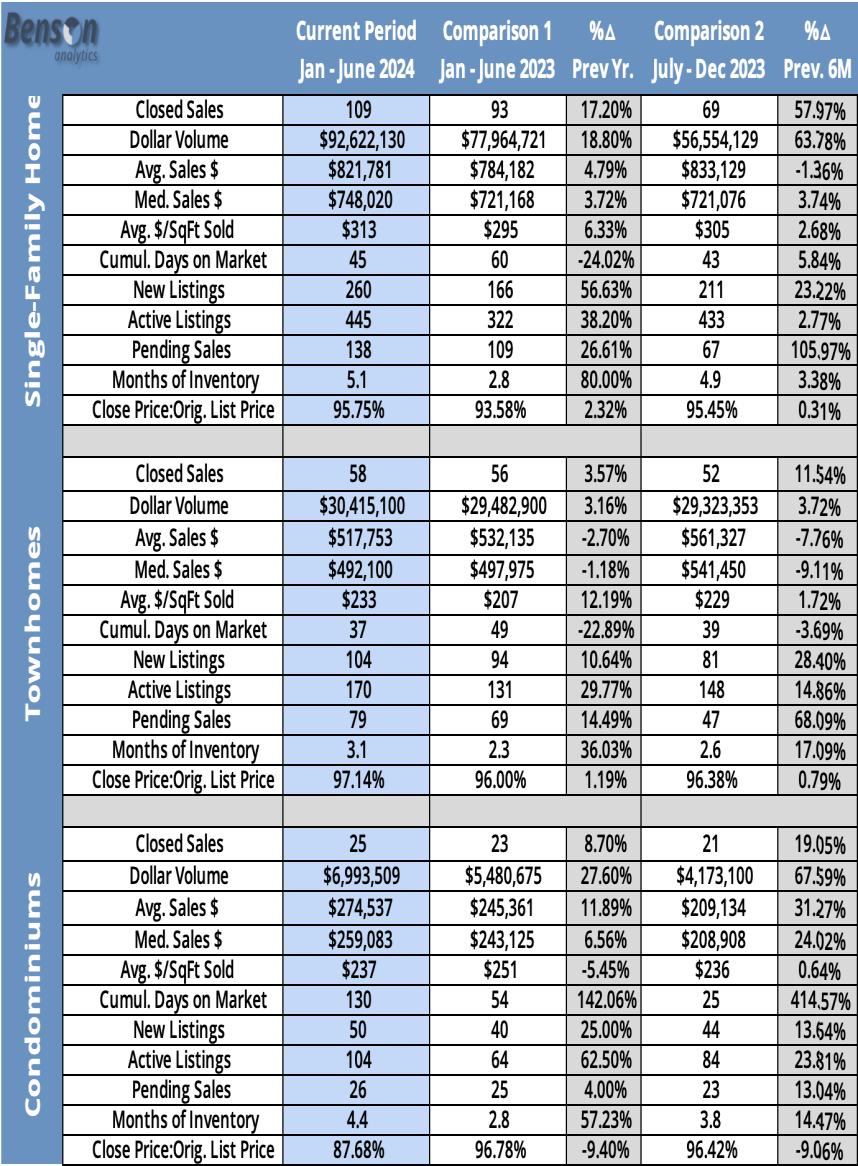
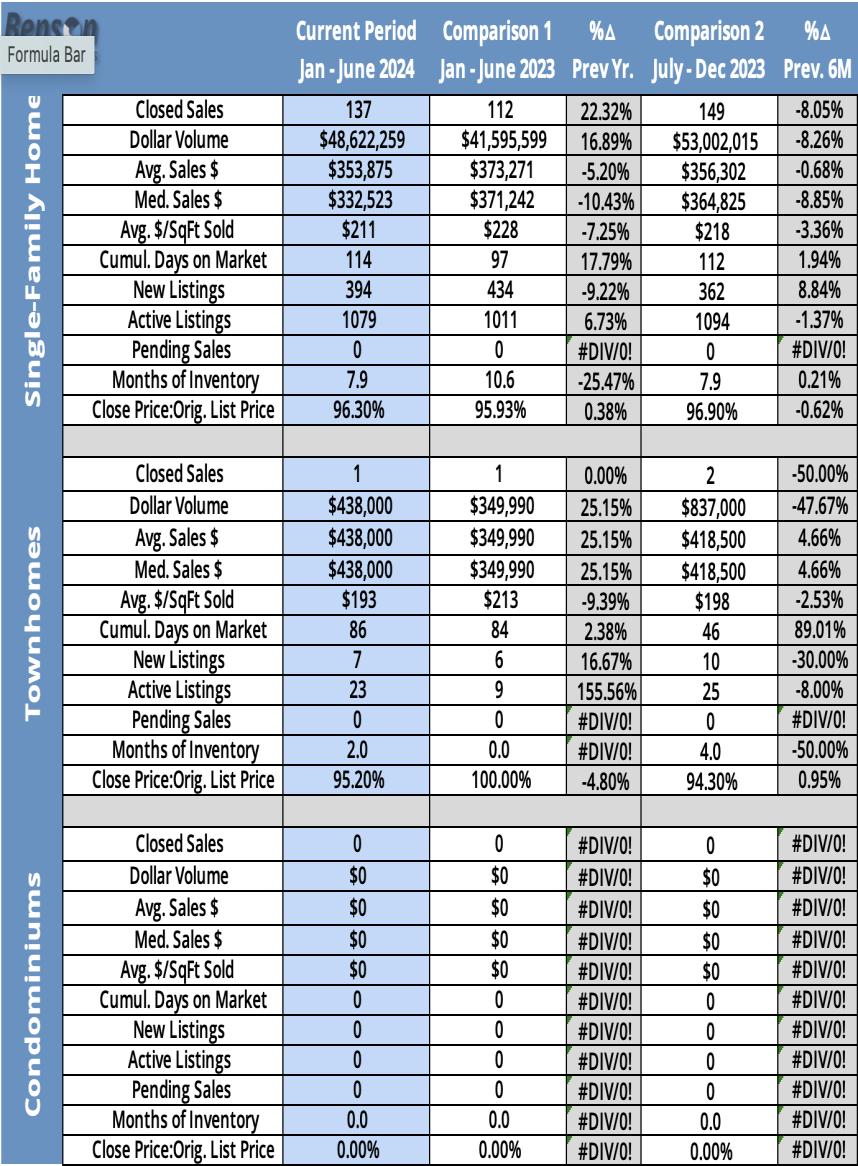
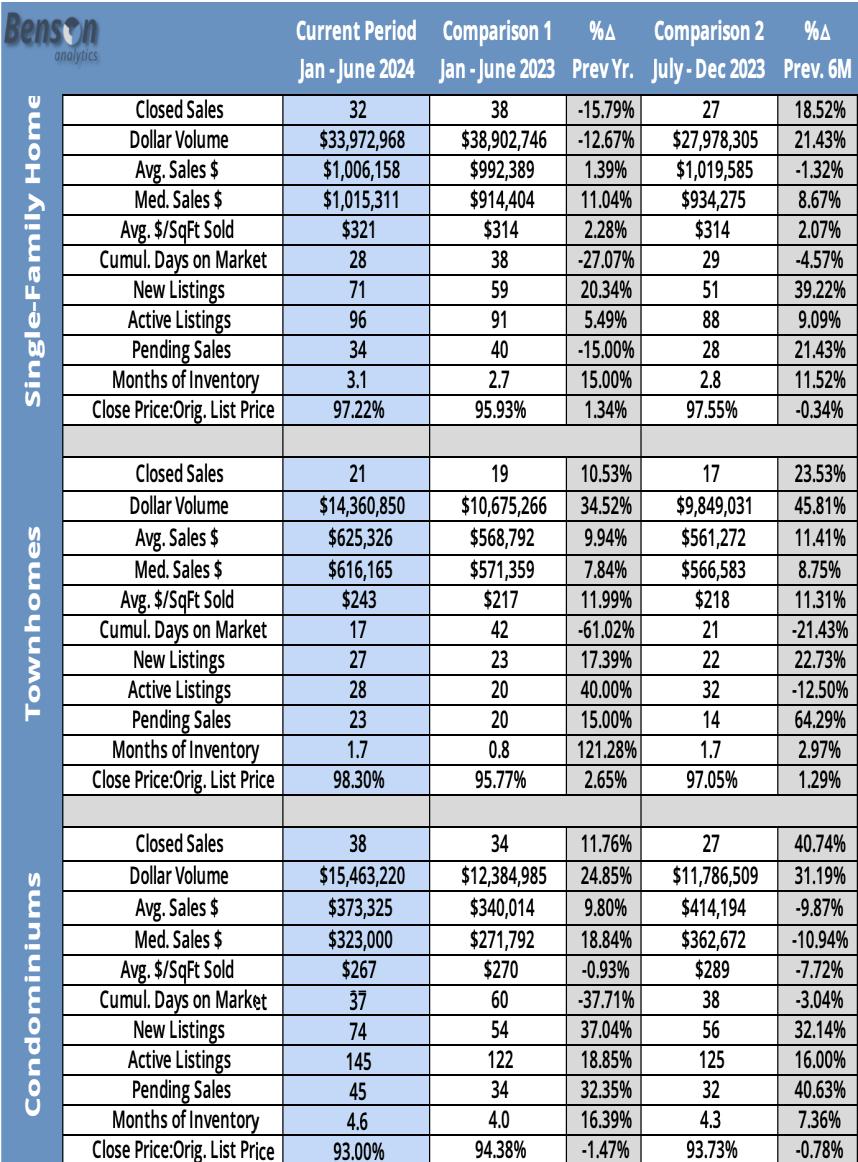
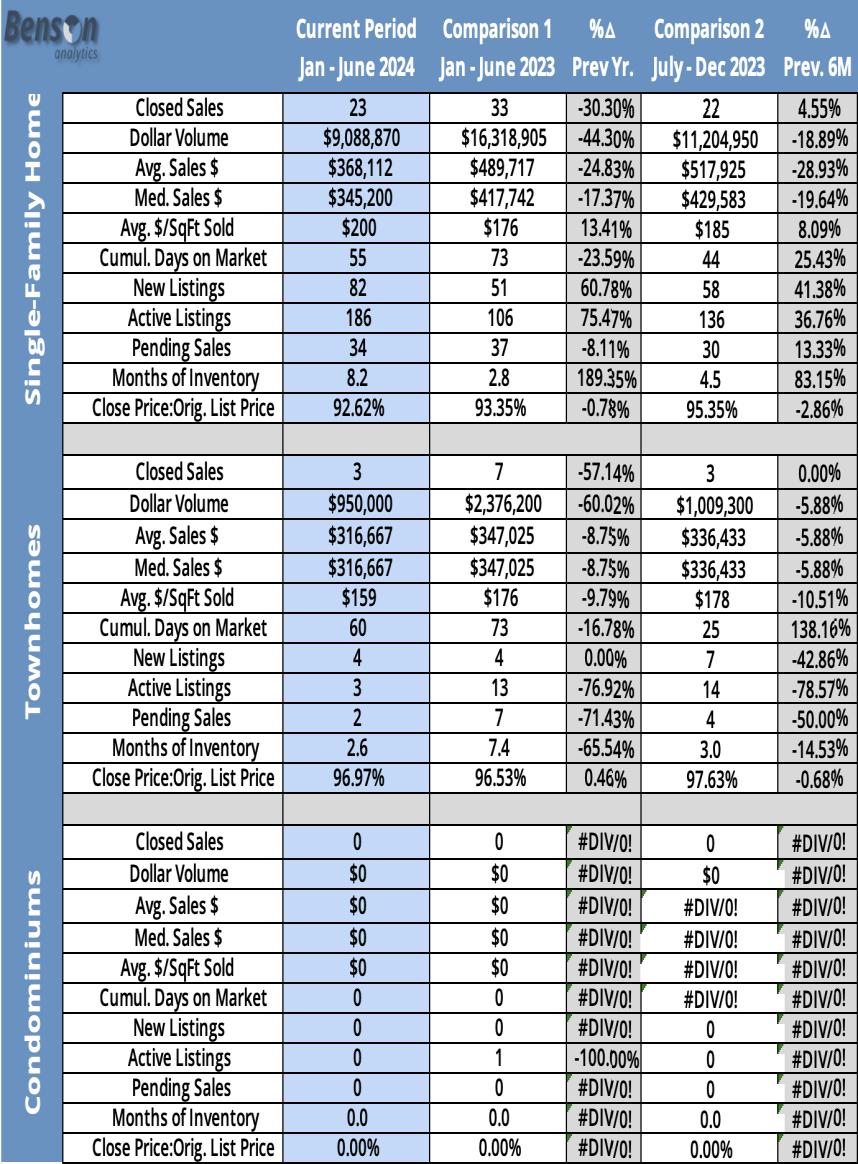
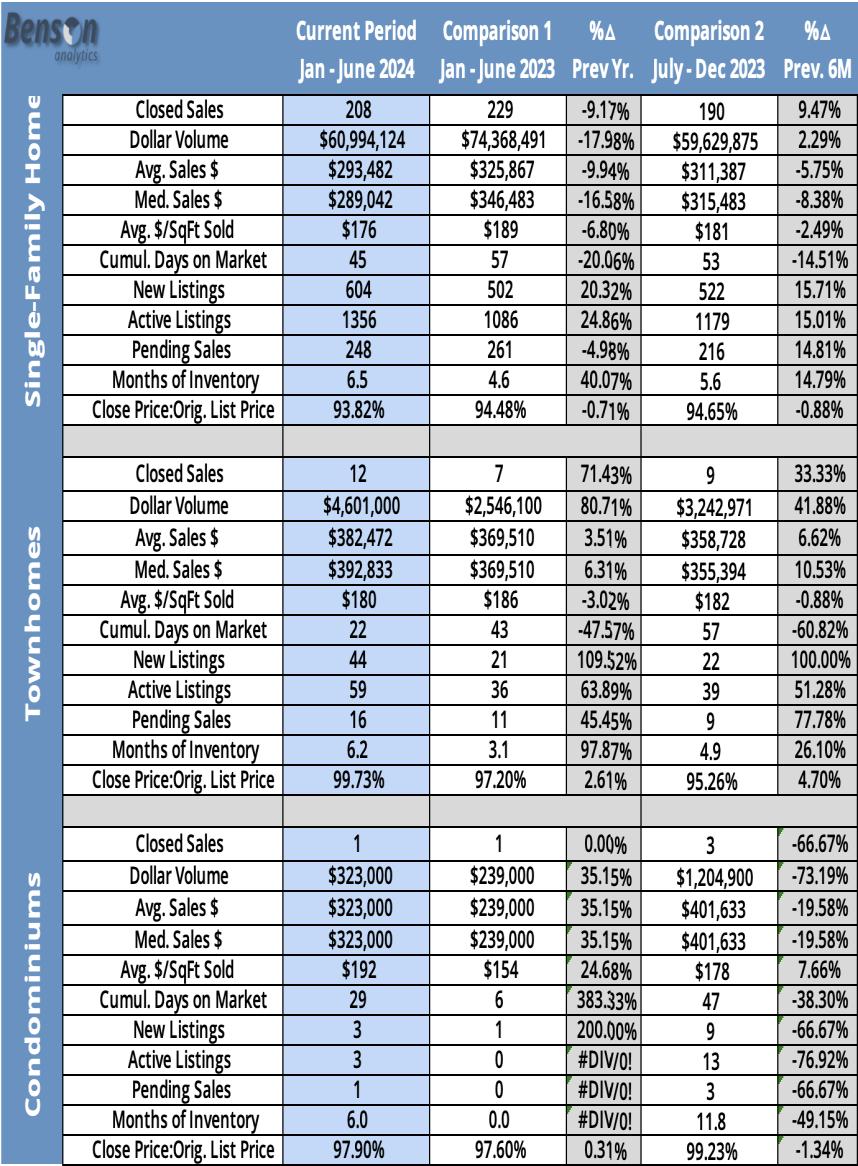
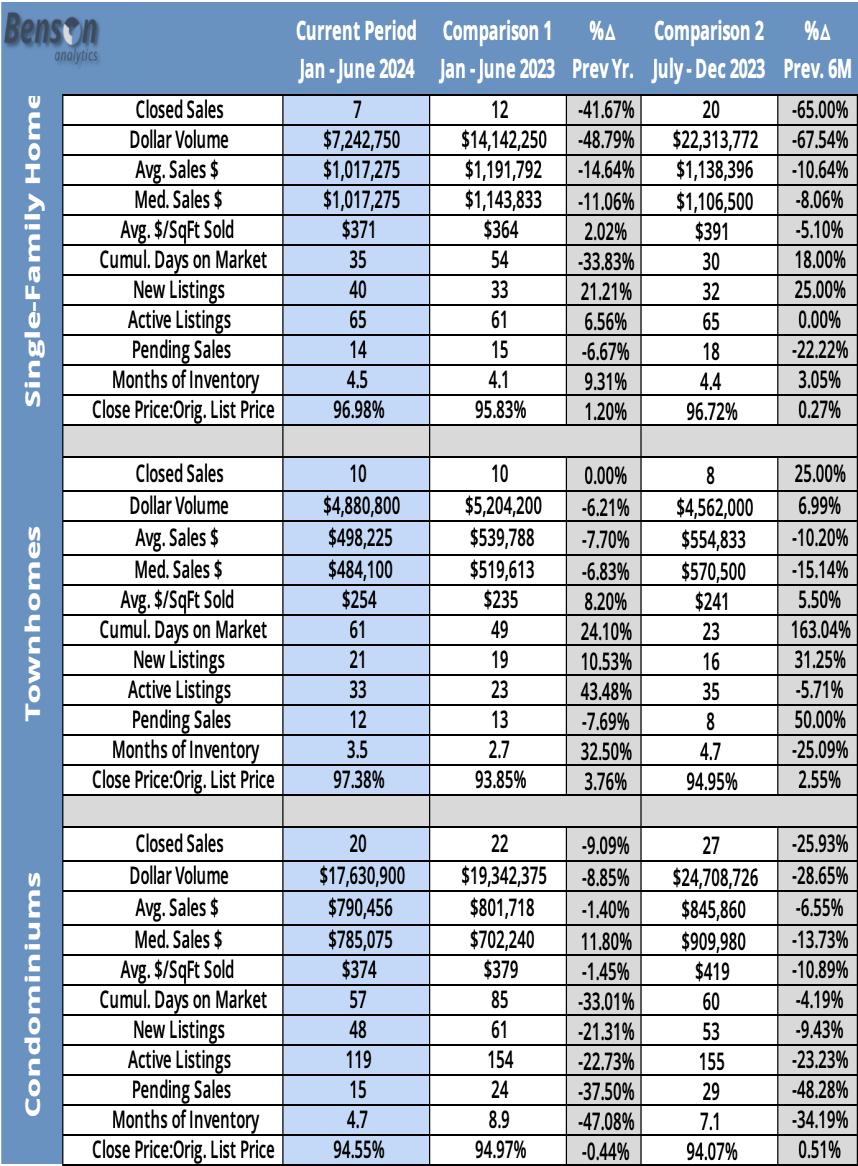
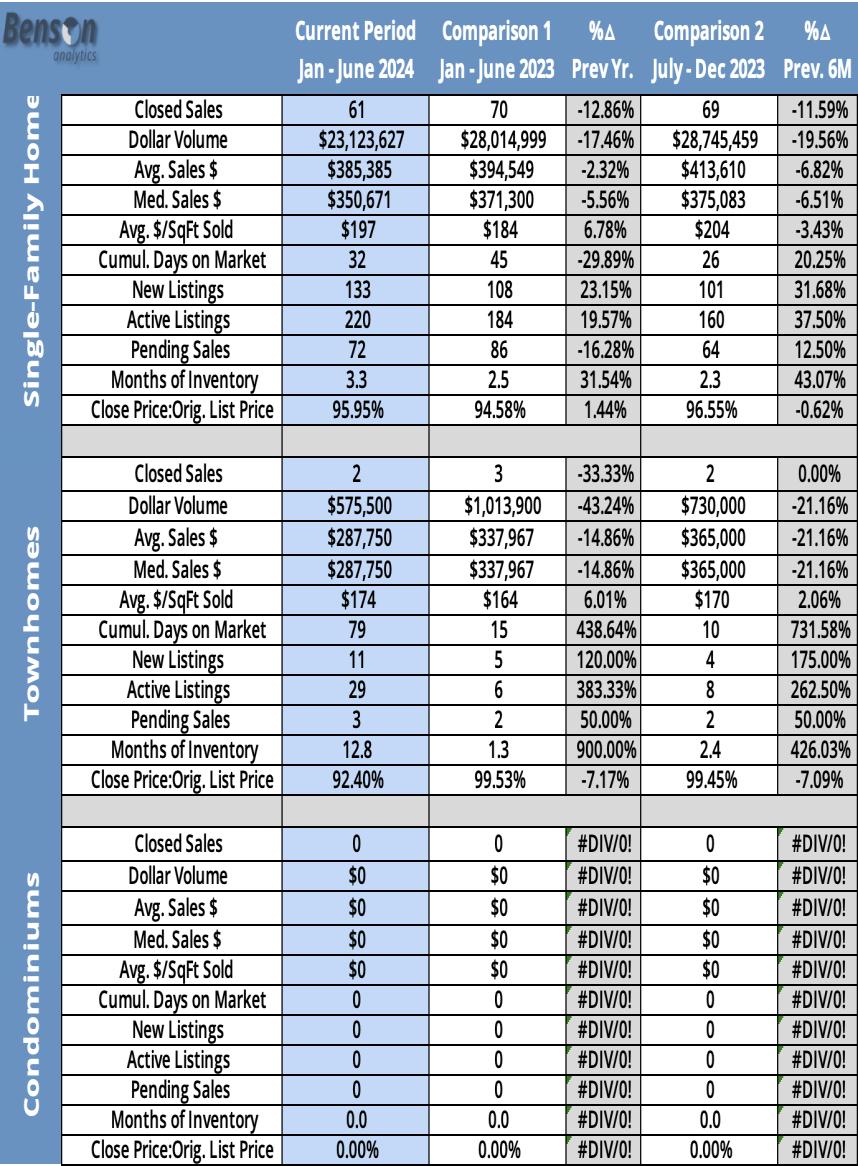
The matrix to the left delves into the housing market dynamics from a macro perspective, encompassing comparisons of year-over-year data (Q1/Q2 2024 v 2023) as well as the trends over the last 12 months (Q3/Q4 2023 v Q1/Q2 2024), all within Harris County.
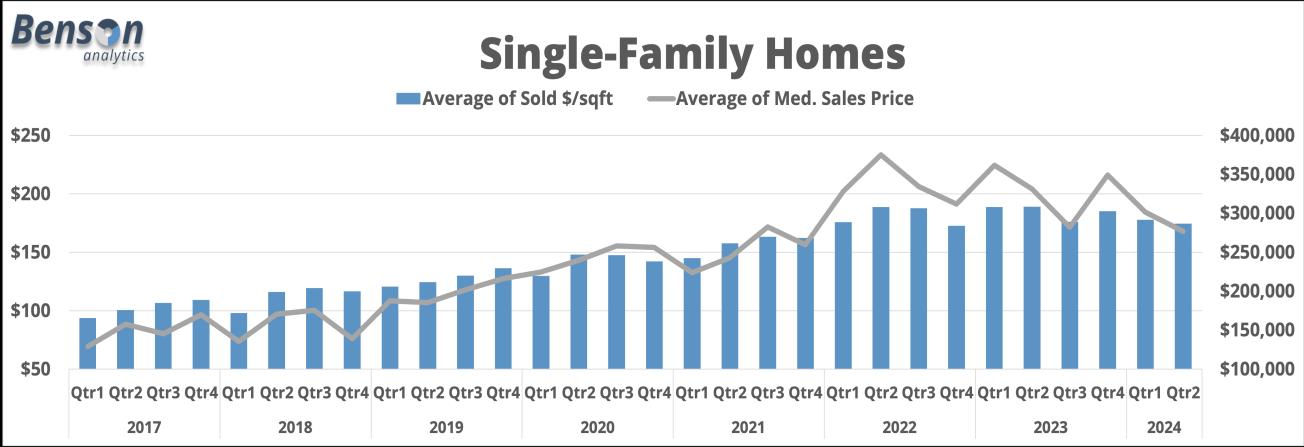
Although some local market areas don’t follow suit, the predominant housing type in Harris County are Single-Family (SF) homes. Looking at the performance of Q1/Q2 2024 compared with the same period a year ago, you can see that:
• Closed sales saw a decline of 3%
• Median sales prices are up 3%
• 16% more new listings and 27% more active listings overall
• Inventory levels rose to 3.2 months
• Better price negotiability for buyers
Looking at the current period (Q1/Q2 2024) compared to Q3/Q4 2023, you’ll notice some interesting results:
• Only moderate increase in closed sales
• Prices held firm
• 20% more new listings and 9% more active listings overall
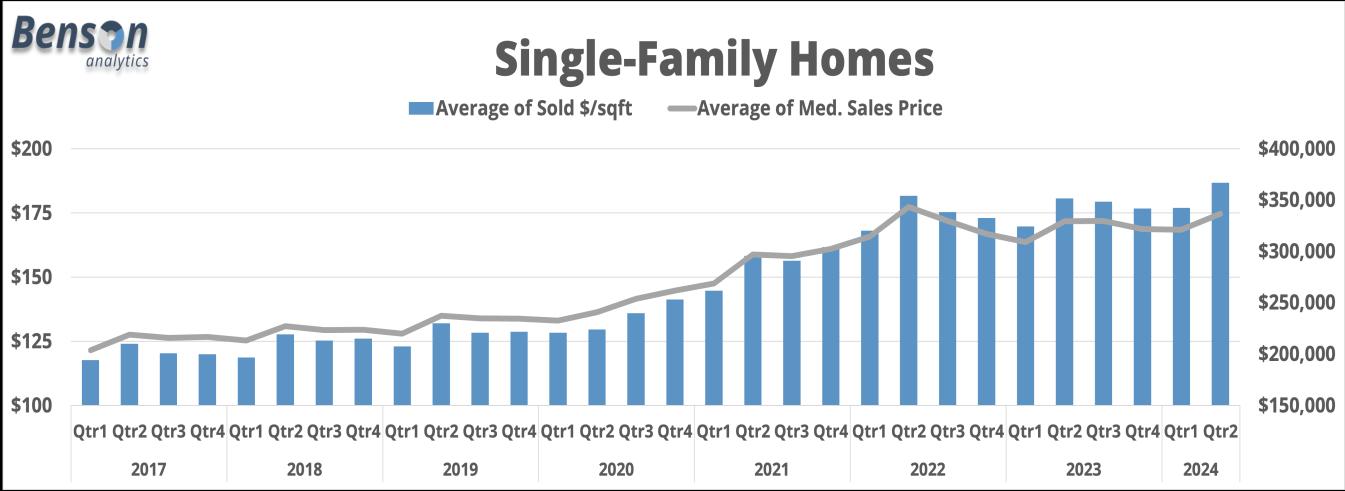
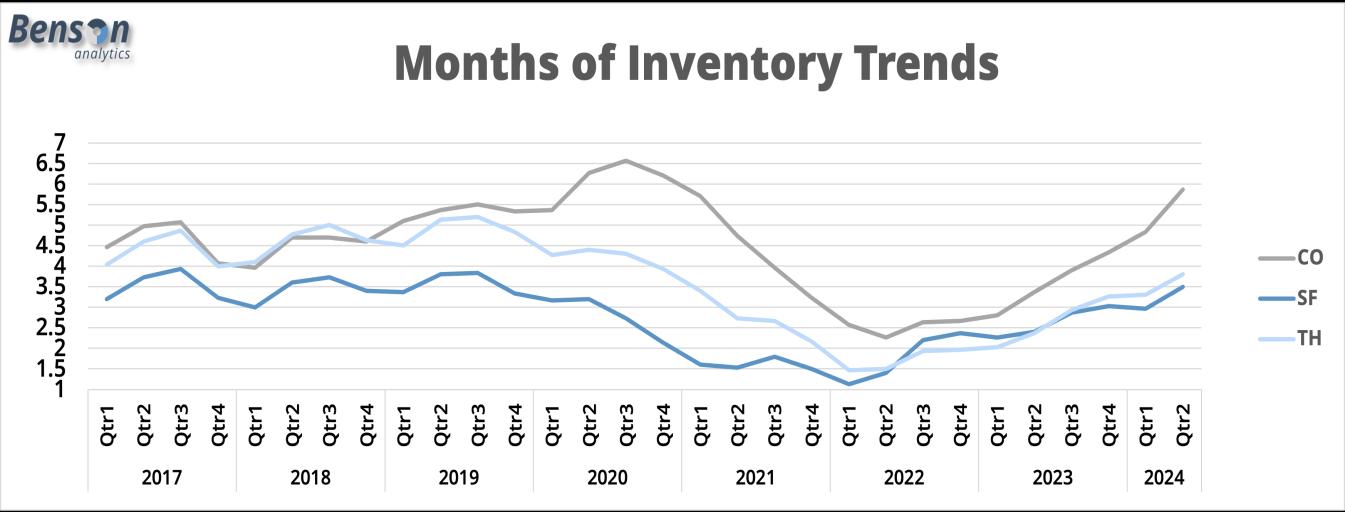
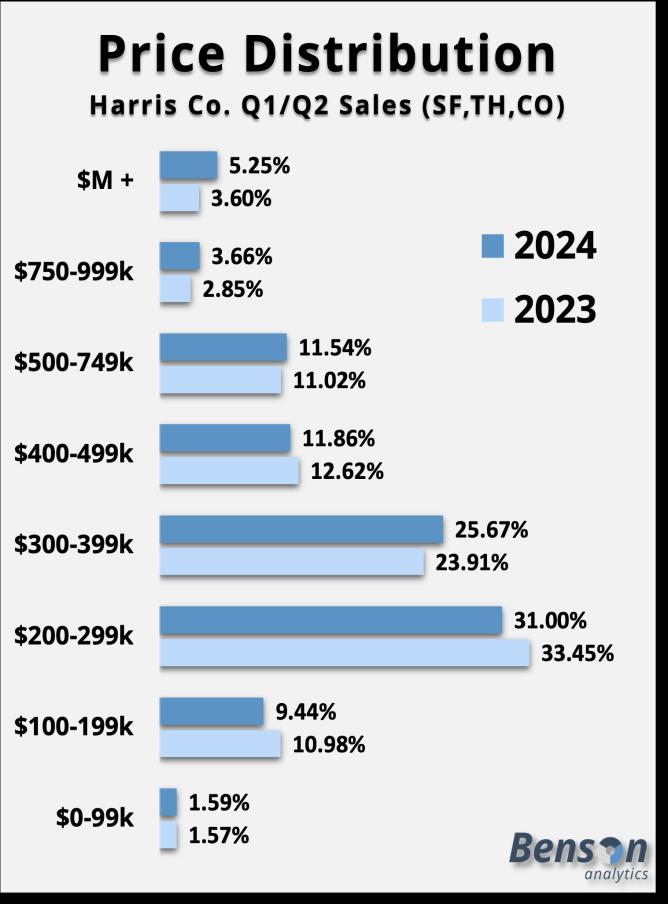
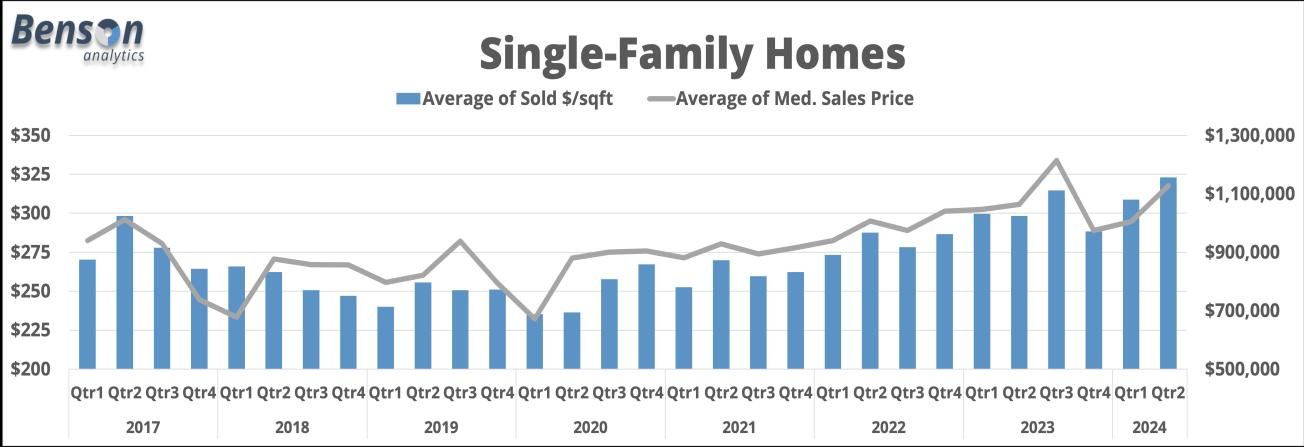
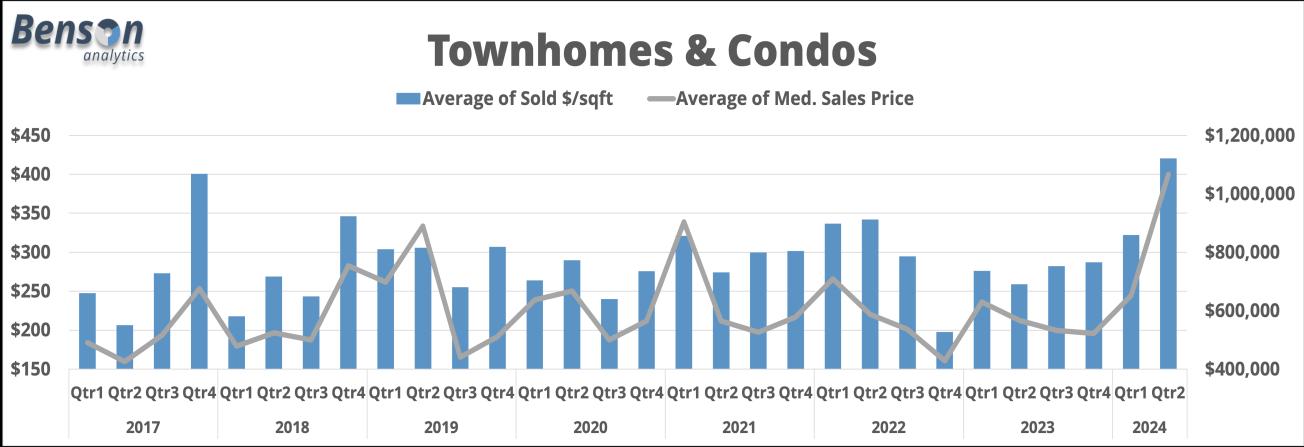
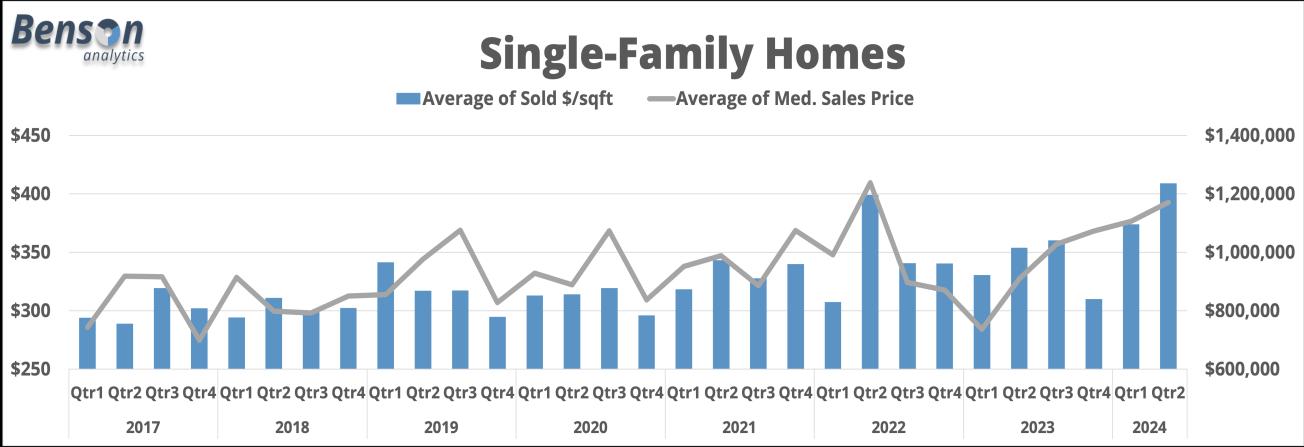
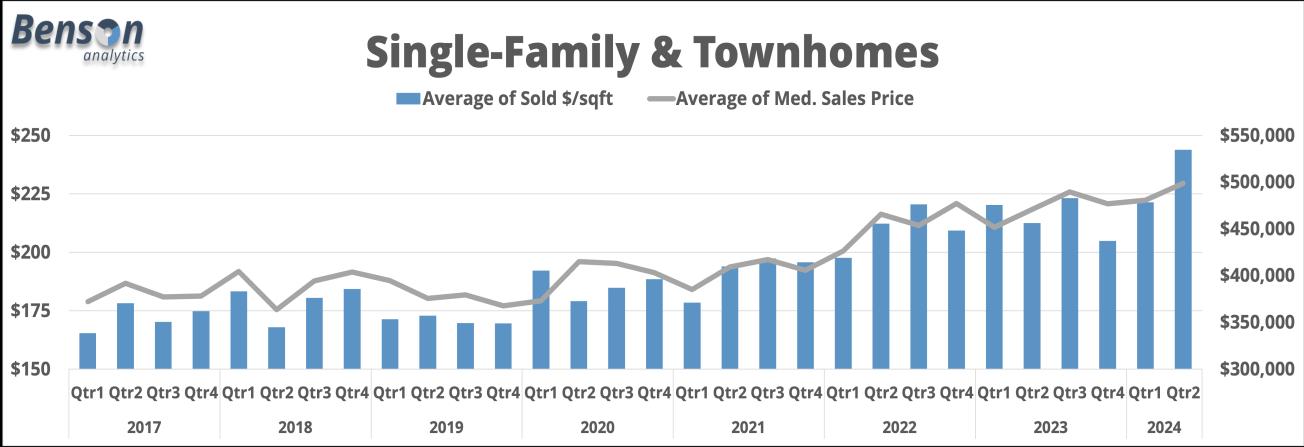
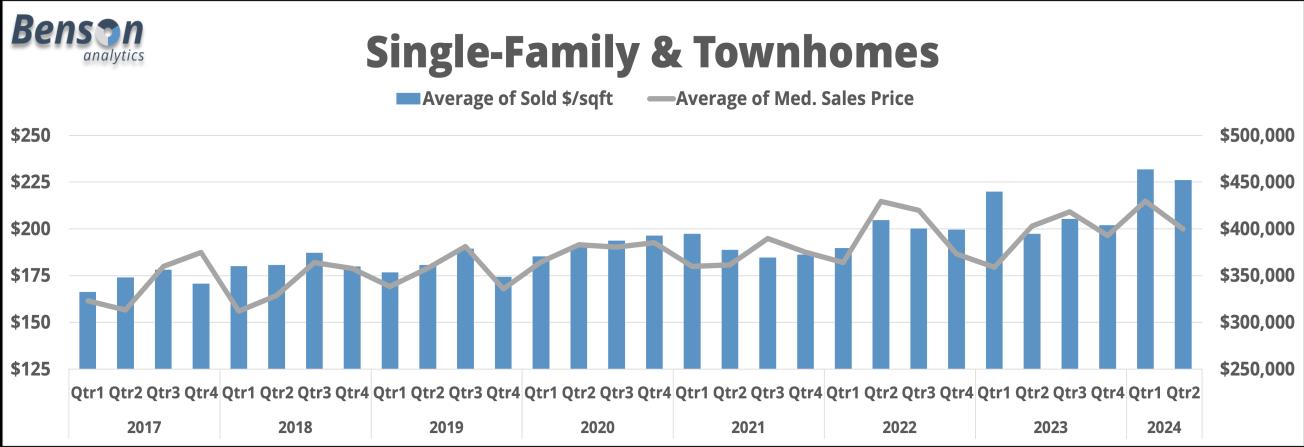
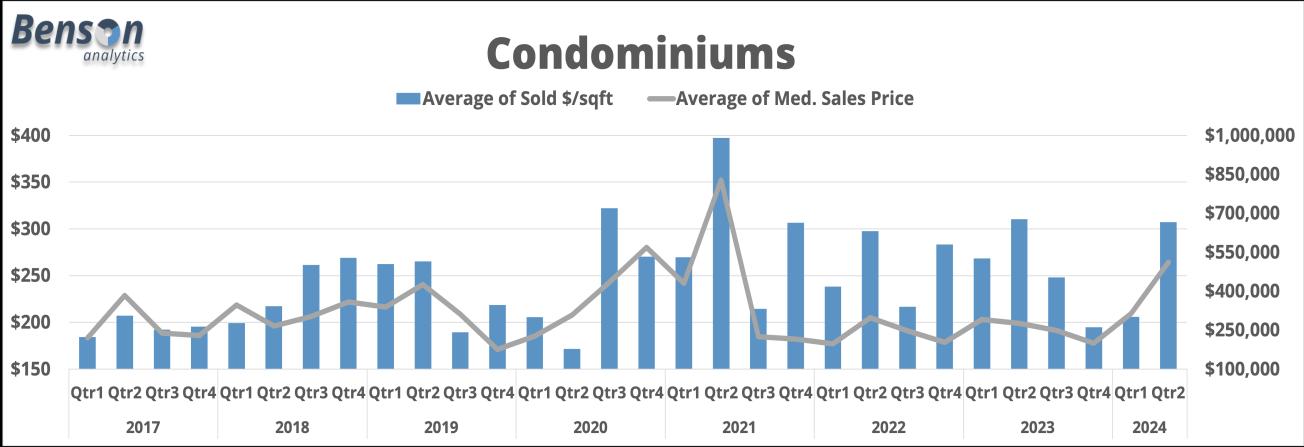
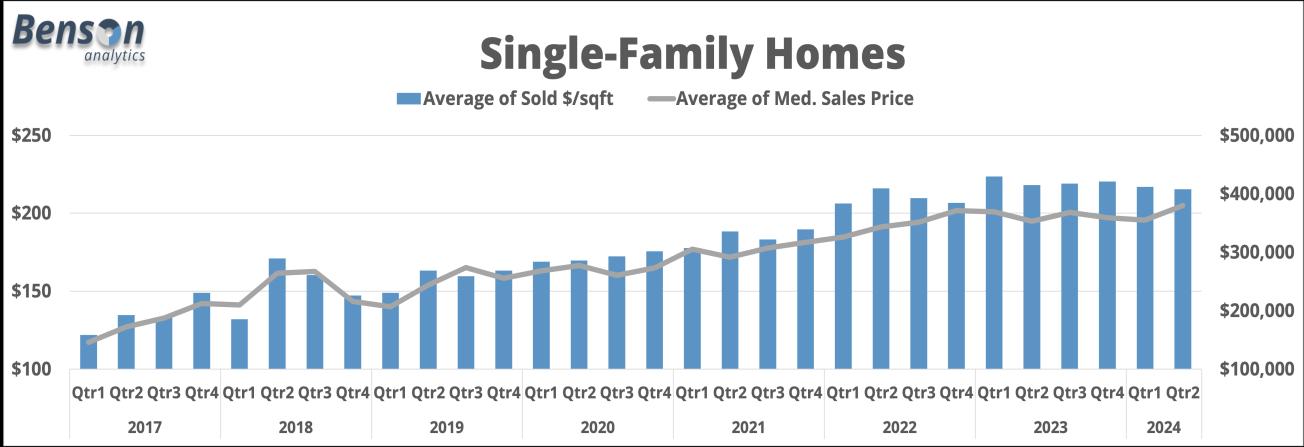
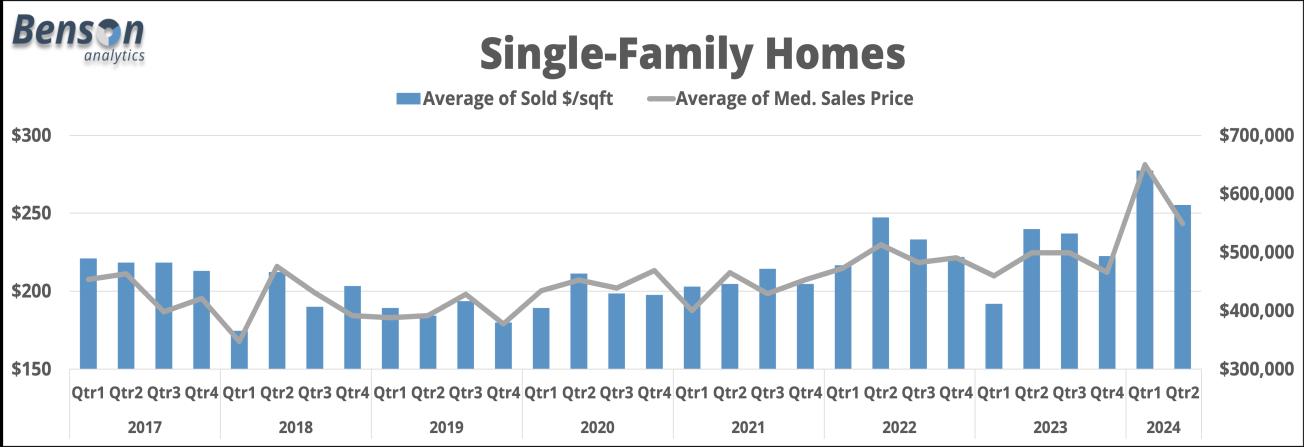
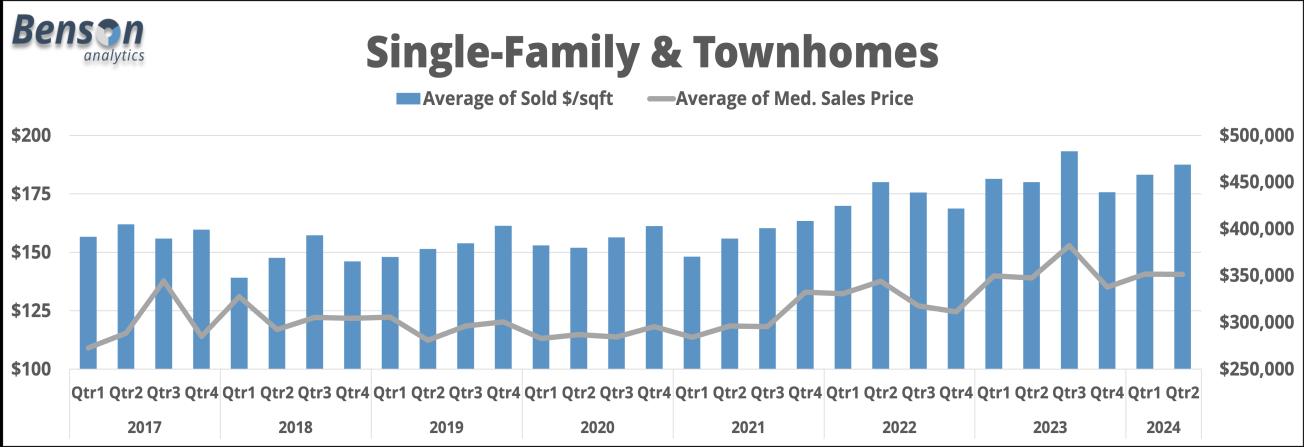
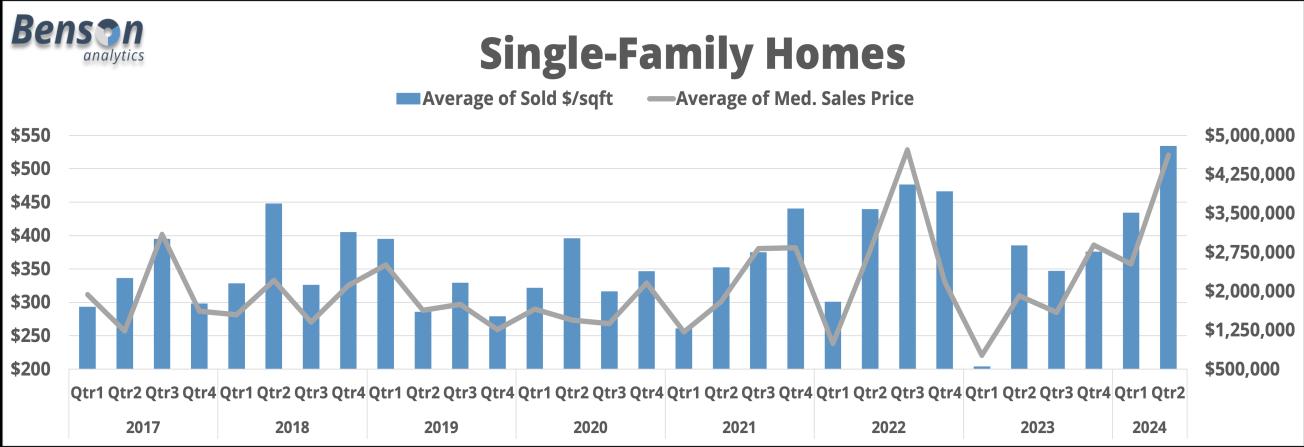
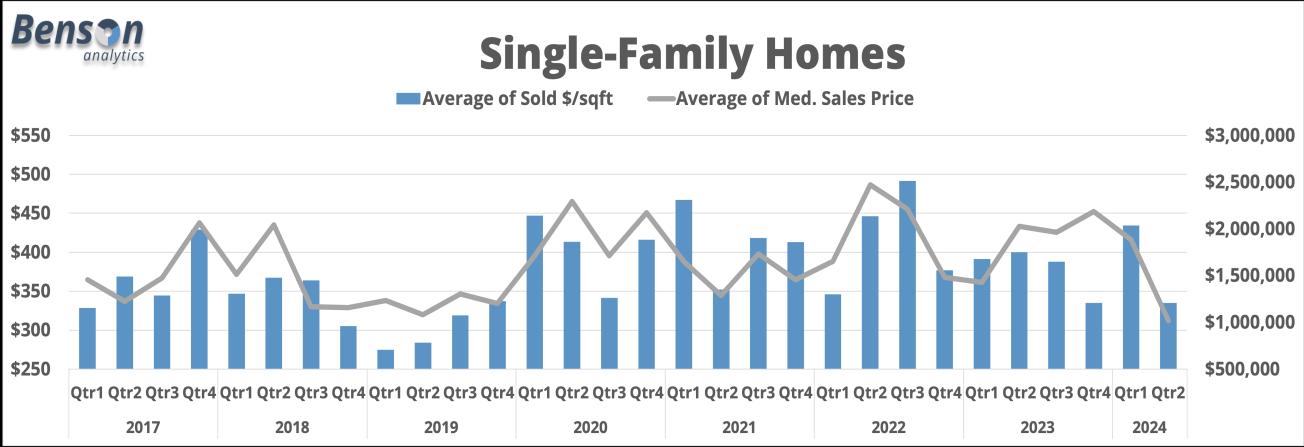
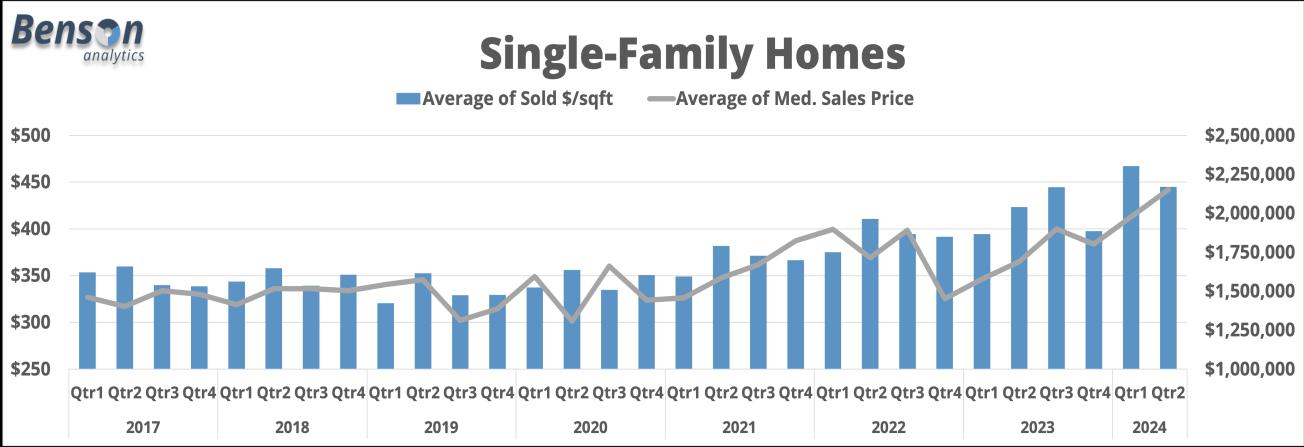
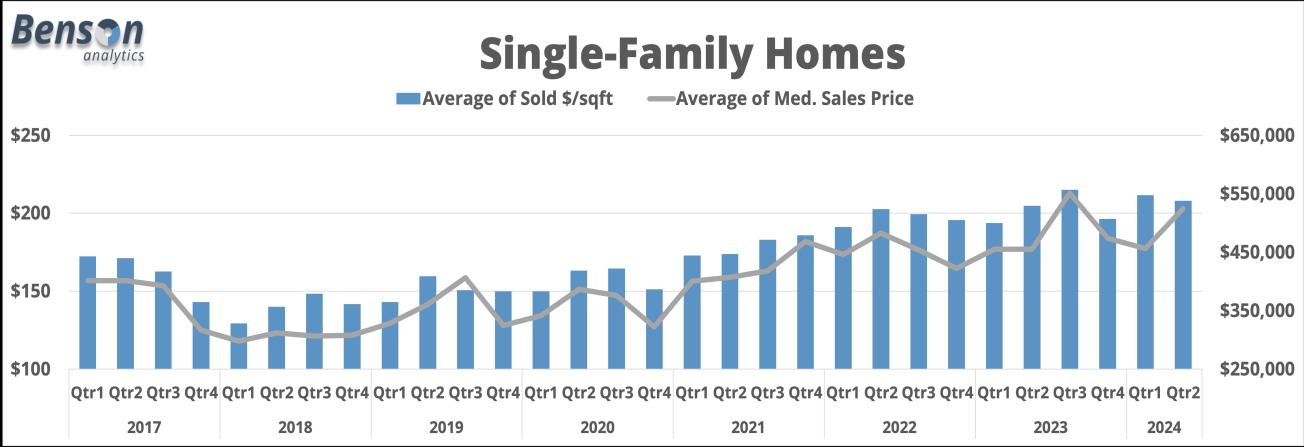
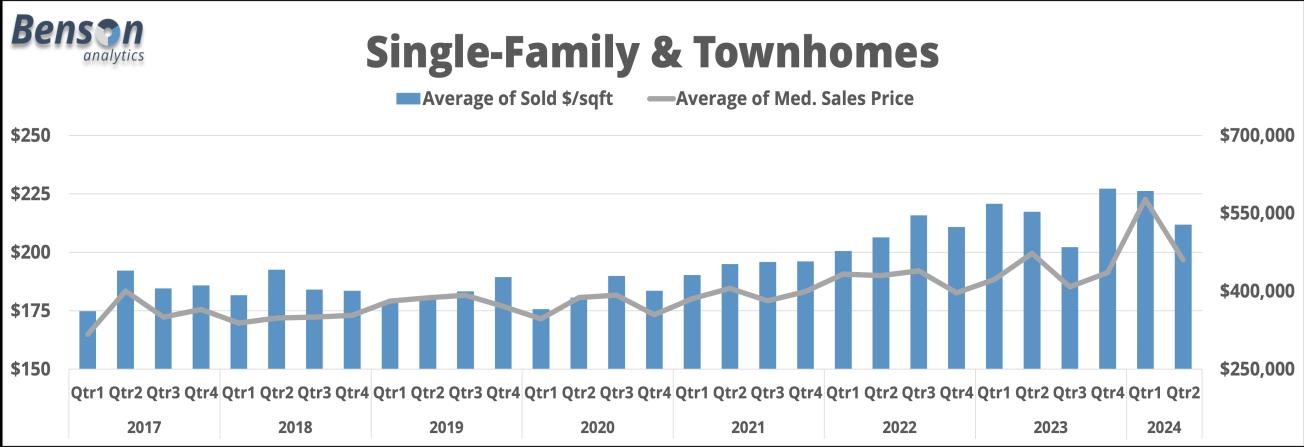
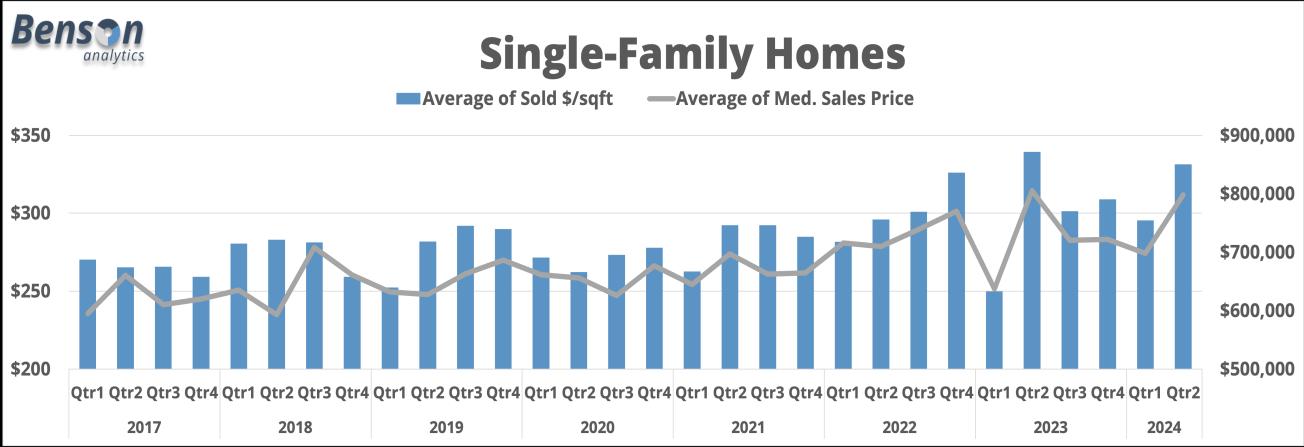
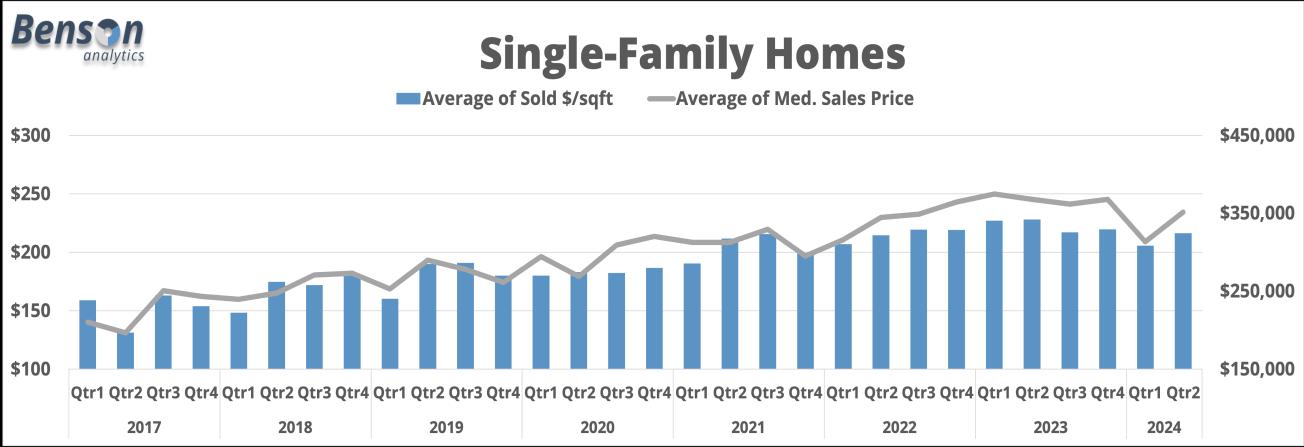
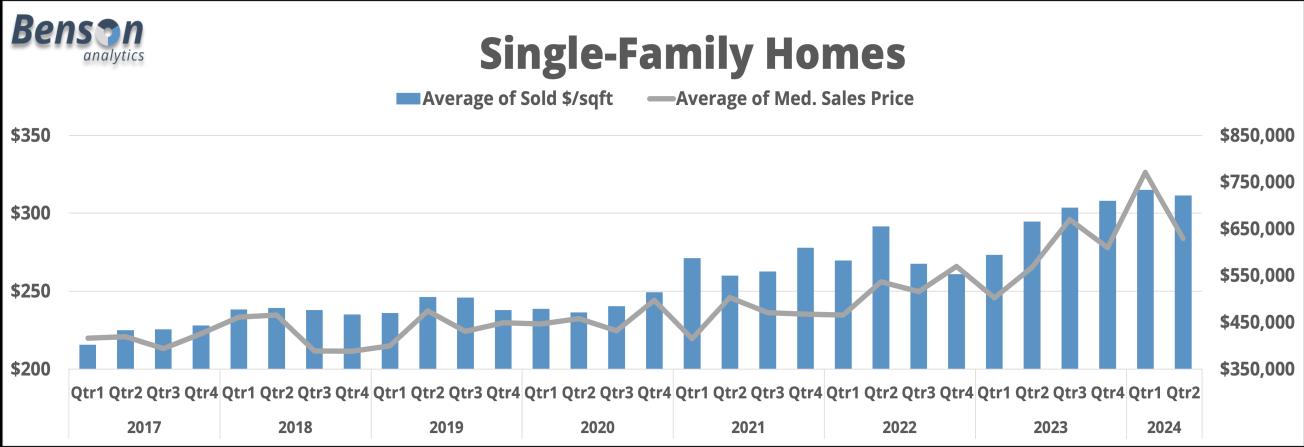
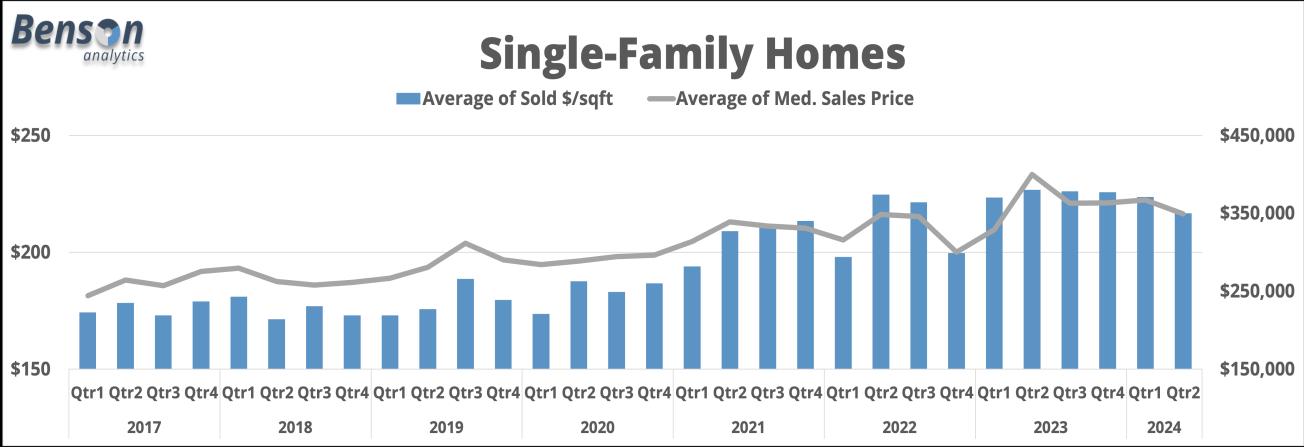
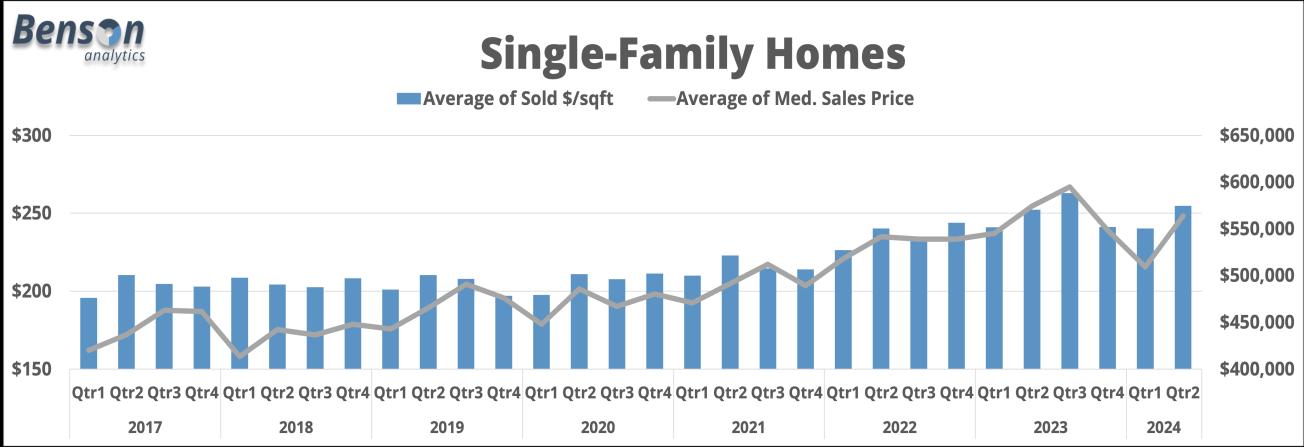
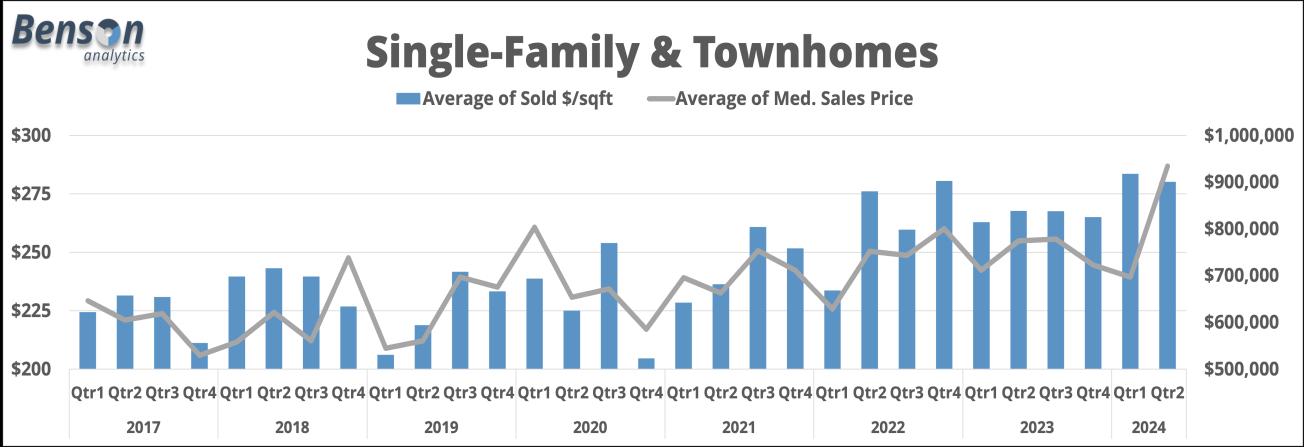
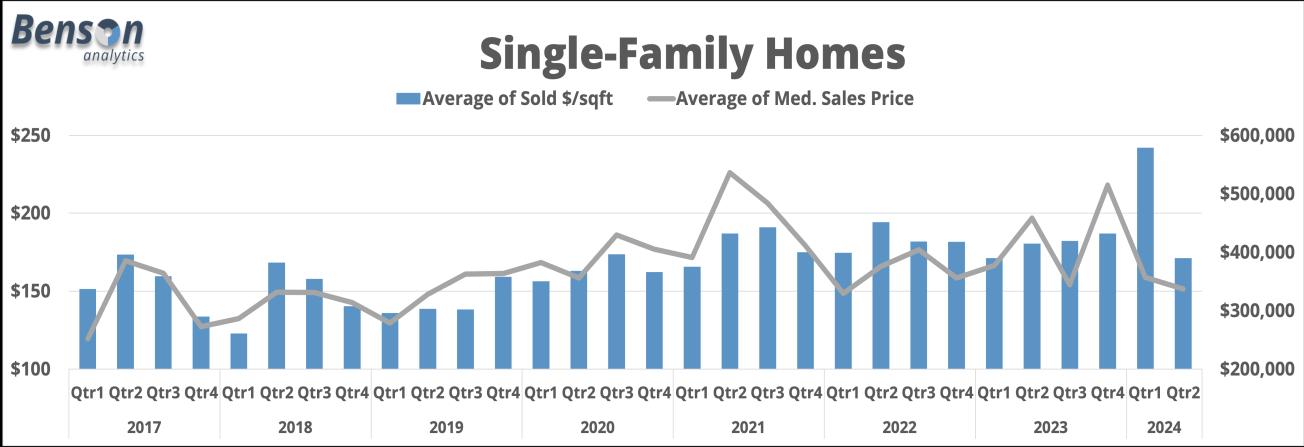
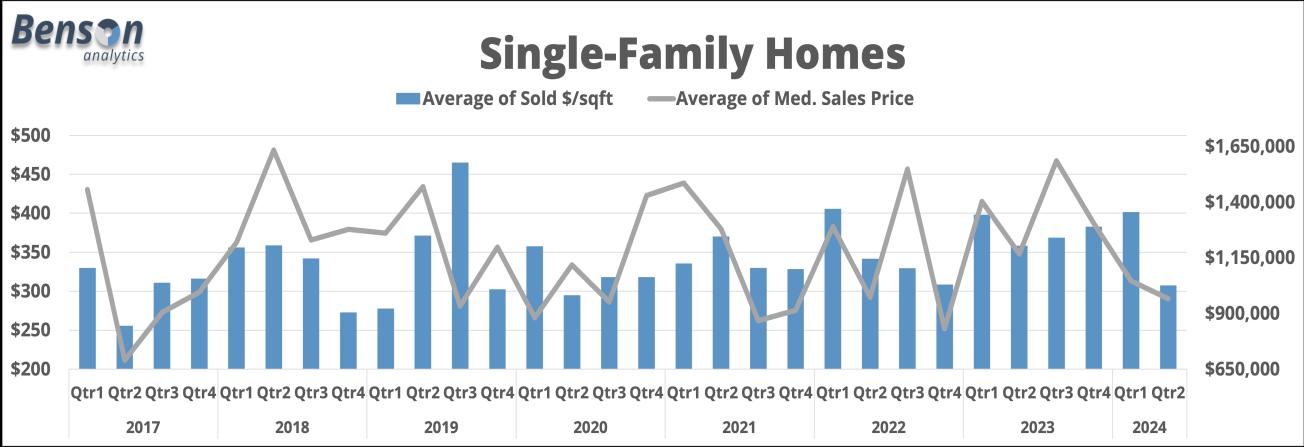
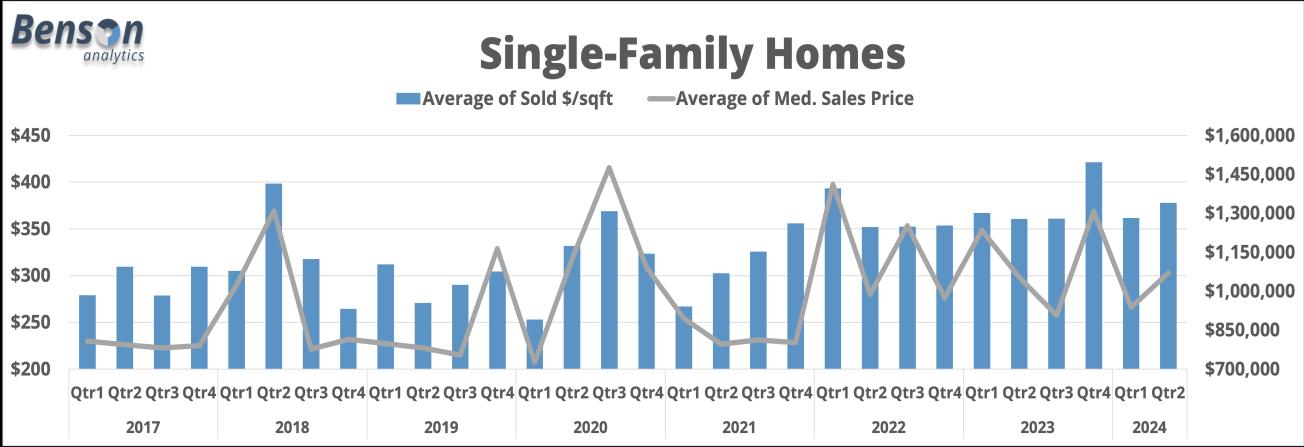
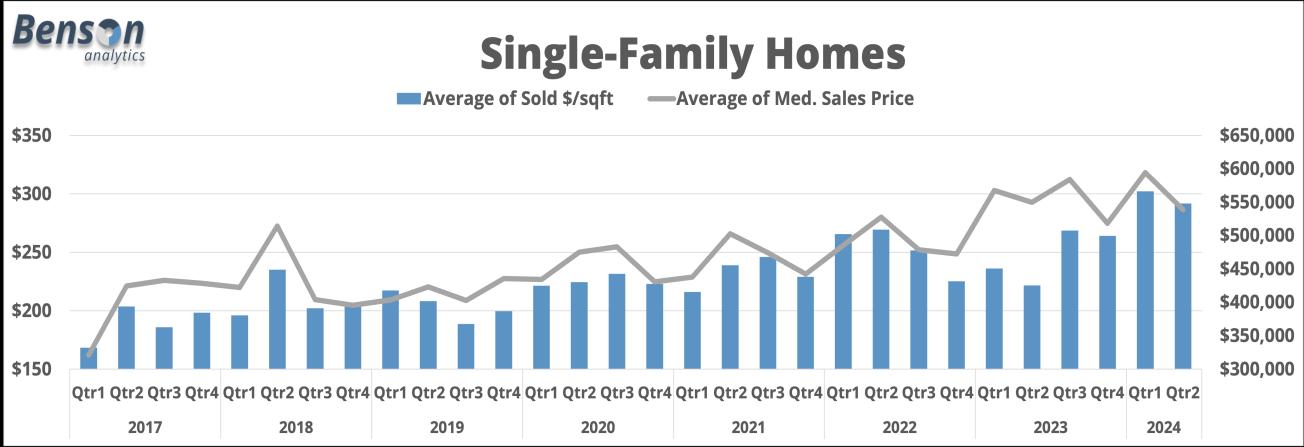
Continuing the Harris County highlights, the featured data visualizations offer insights into pricing, $/sqft, inventory trends, and price distributions for local housing. A notable trend is the upswing in months of inventory, which is a result of fewer sales and more listings hitting the market. Pointing to the Price Distribution table, it’s interesting to see the uptick in homes selling above $1M year over year. Moving forward, the anticipation that I have is that we are going back to a more stable market with gradual appreciation seen in the years before 2020/2021.
Harris County Highlights
Market Area Comparison Section
Market Area Comparison
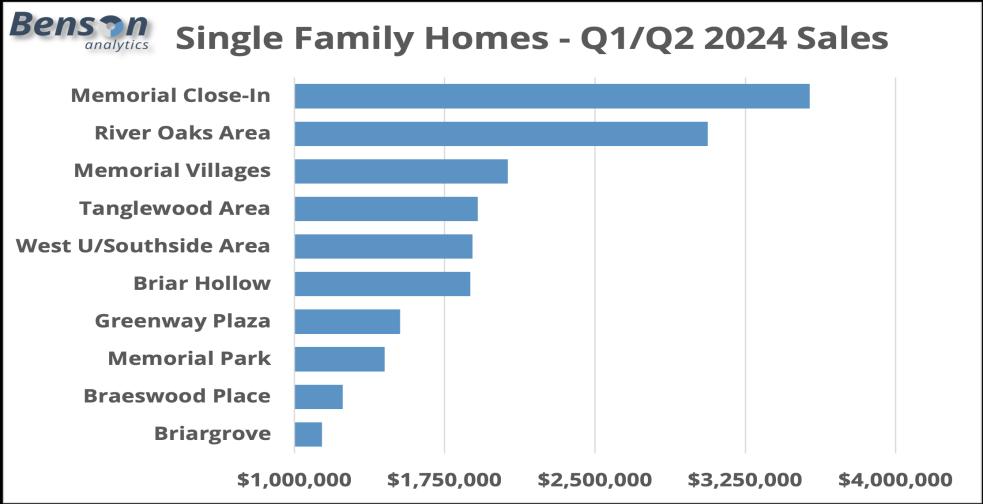
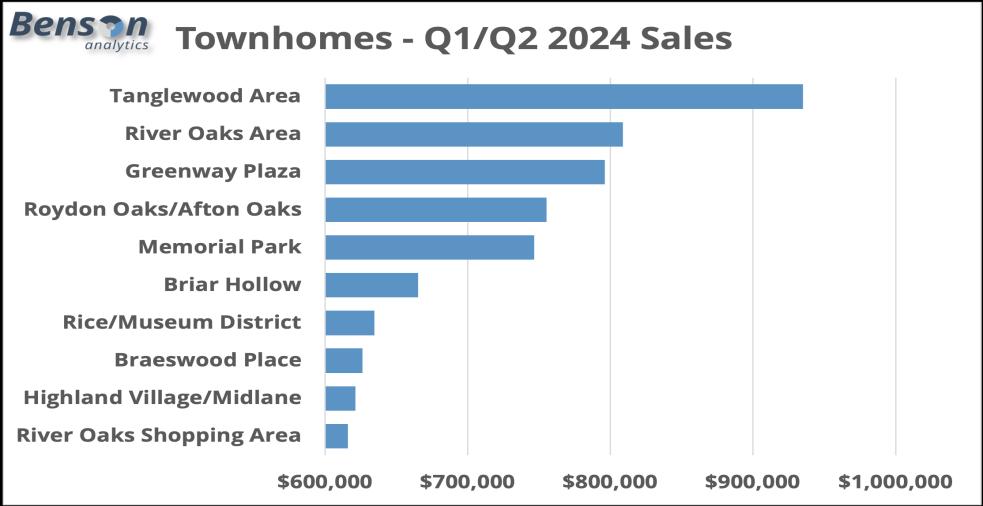
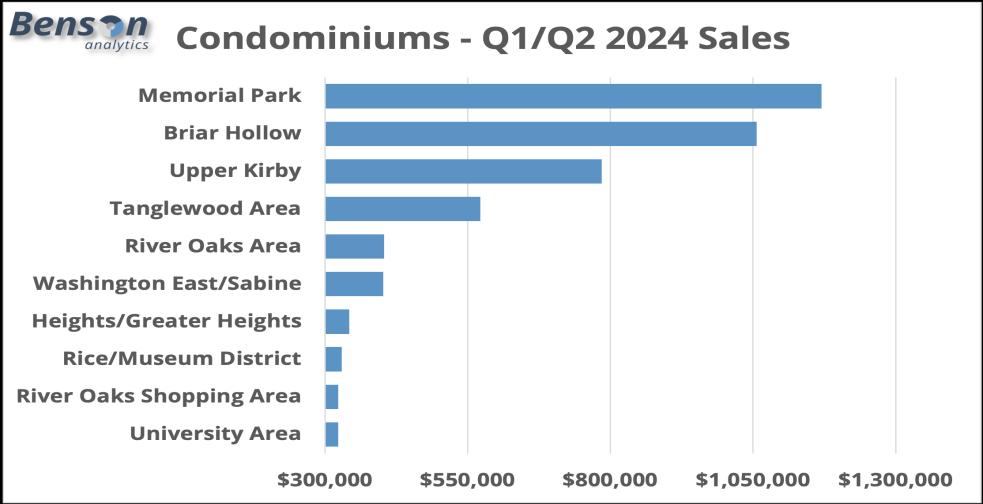
Top 10 Markets
Median Sales Price
Categorizing the data by property type, the bar charts presented show the Top 10 areas by sales price, drawing from the dataset from Q1 & Q2 2023. Markets considered include 38 different local market areas found throughout Harris County.
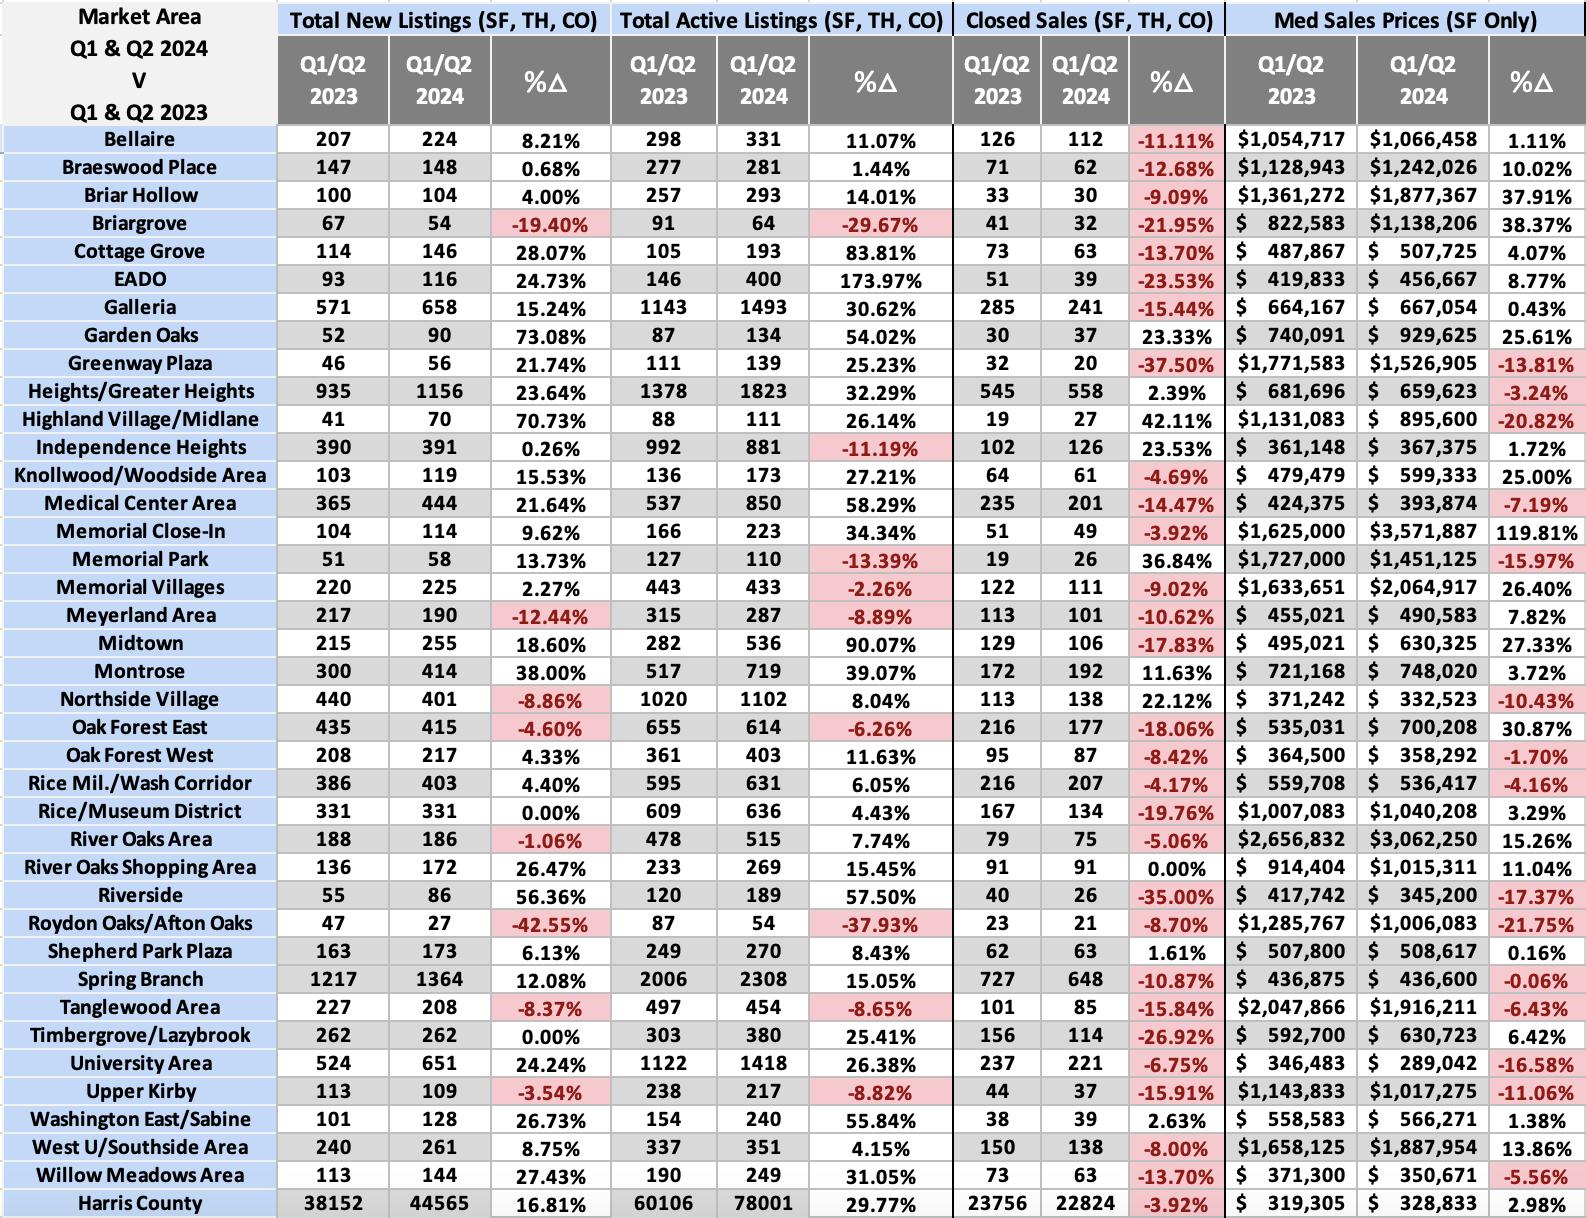
The next two pages compare Harris County along with the 38 local market areas: New Listings, Total Active Listings, Closed Sales and Median Sales Price. The 1st compares Q1/Q2 2024 v Q1/Q2 2023 with the 2nd comparing with Q3/Q4 2023.
Market Area Comparison
Market Area Comparison
Market Health Check Inventory Levels (SF Only)
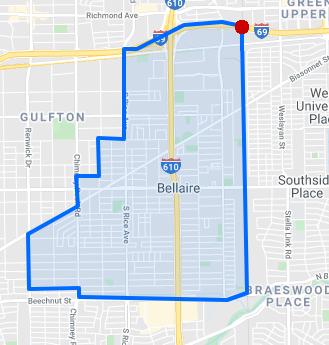
Bellaire Bellaire
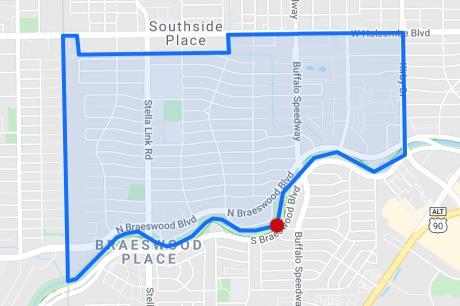
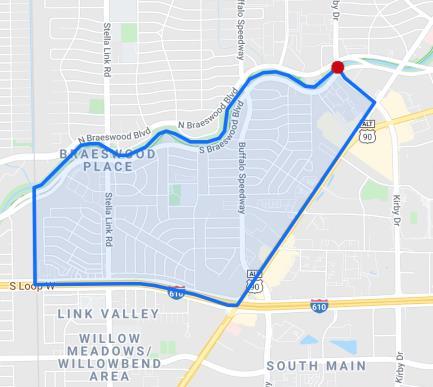
Braeswood Place Braeswood Place
Briar Hollow Briar Hollow Briargrove Briargrove
Cottage Grove Cottage Grove EADO EADO Galleria Galleria Garden Oaks Garden Oaks
Knollwood/Woodside Knollwood/Woodside Medical Center Area
Center Area Memorial Close-In Memorial Close In Memorial Park Memorial Park Memorial Villages Memorial Villages Meyerland Area Meyerland Area
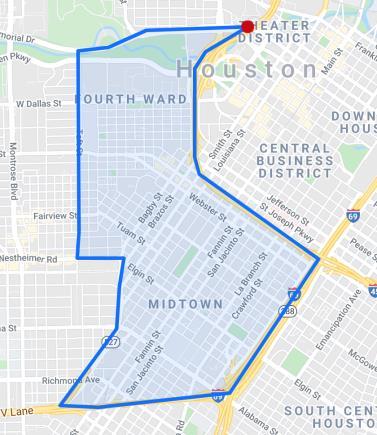
Midtown Midtown Montrose Montrose
Village Northside Village
Forest East Oak Forest East
Forest West Oak Forest West Rice Mil./Wash. Corridor Rice Mil./Wash. Corridor
Oaks Area River Oaks Area
River Oaks Shopping Area River Oaks Shopping Area Riverside Riverside Roydon Oaks/Afton Oaks Roydon Oaks/Afton Oaks
Shepherd Park Plaza Shepherd Park Plaza
Spring Branch Spring Branch
Tanglewood Area Tanglewood Area
Timbergrove/Lazybrook Timbergrove/Lazybrook University Area University Area
Kirby Upper Kirby Washington East/Sabine Washington East/Sabine West U./Southside Place West U./Southside Place Willow Meadows Area Willow Meadows Area Rice/Museum District Rice/Museum District
Market
Months of Inventory Even Market 5-7 Months of Inventory Buyer’s Market 7+ Months of Inventory
Months of Inventory = absorption rate. This figure measures how long (in terms of months) it will take for the current inventory of homes on the market to sell based on the pace of sales from the last 12 months, assuming no new homes come to the market.
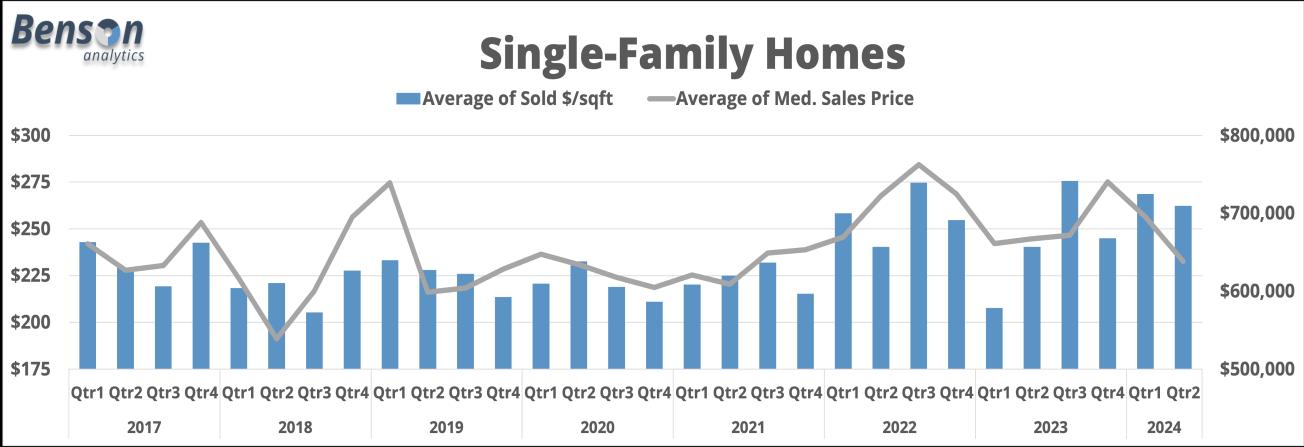
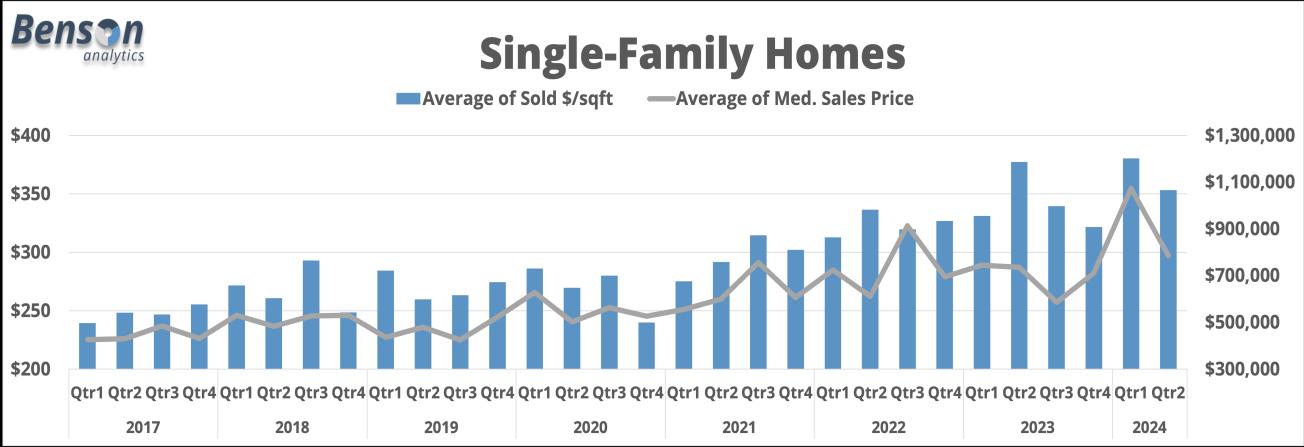
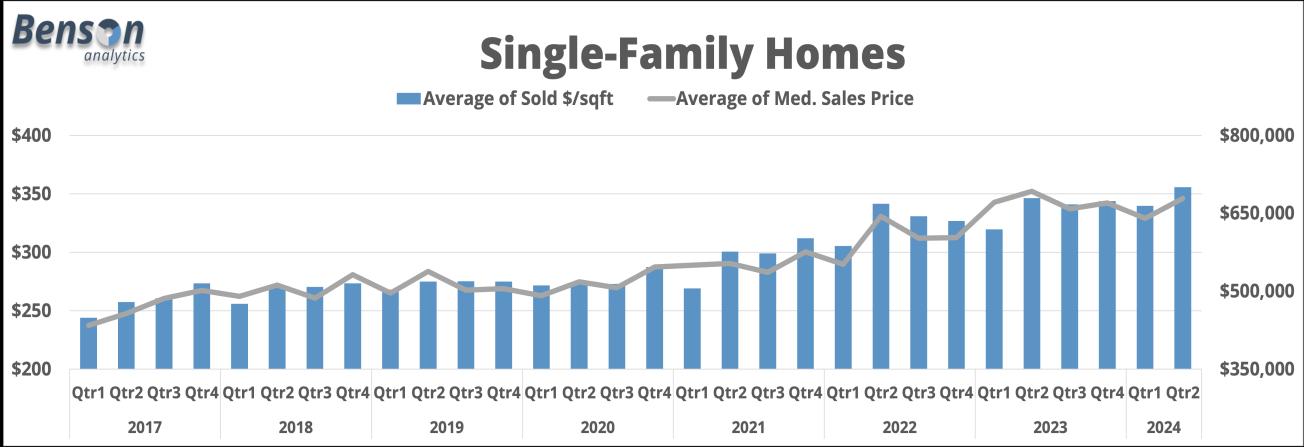
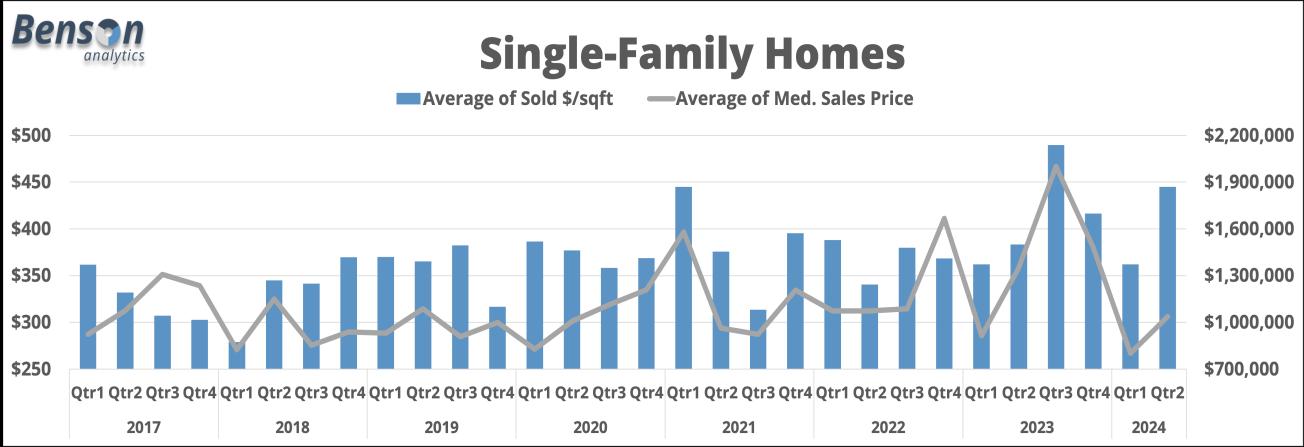
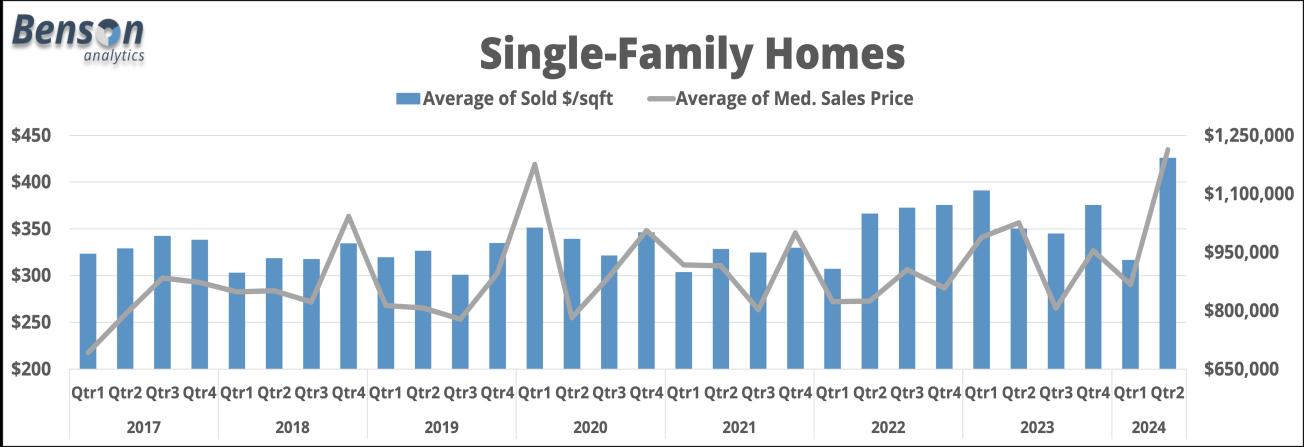
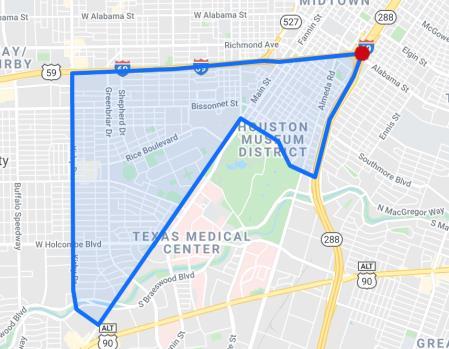
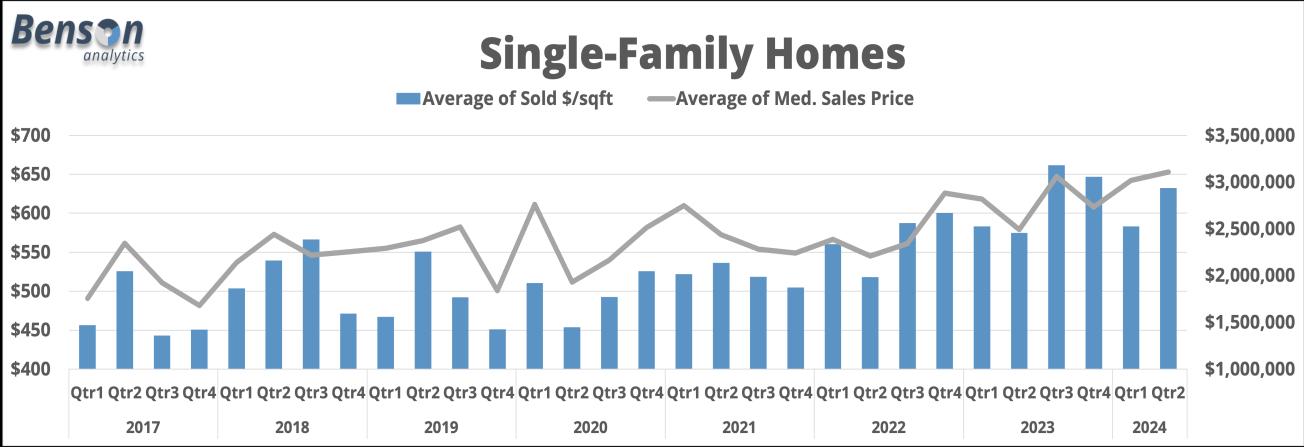
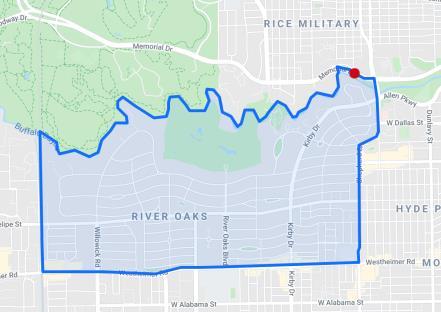
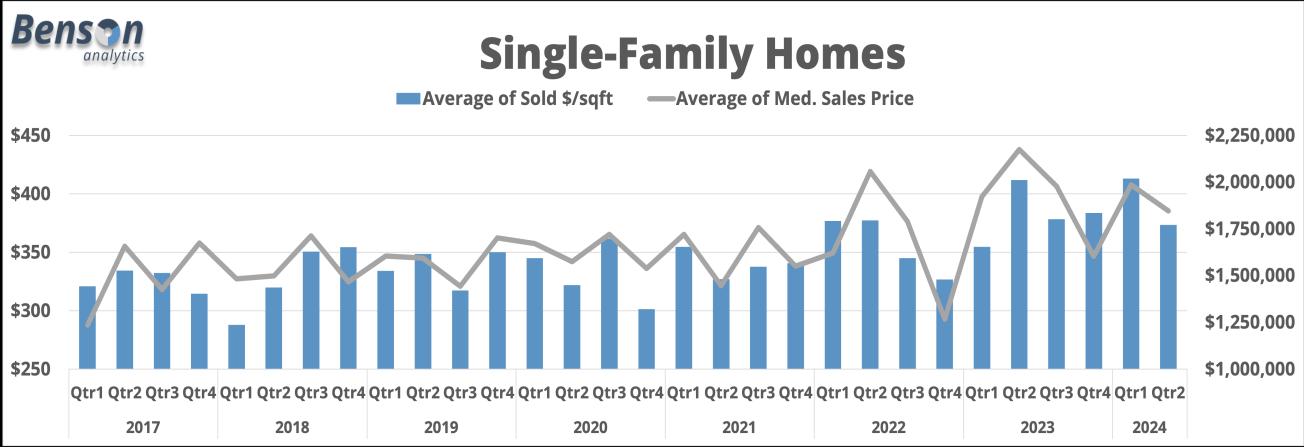
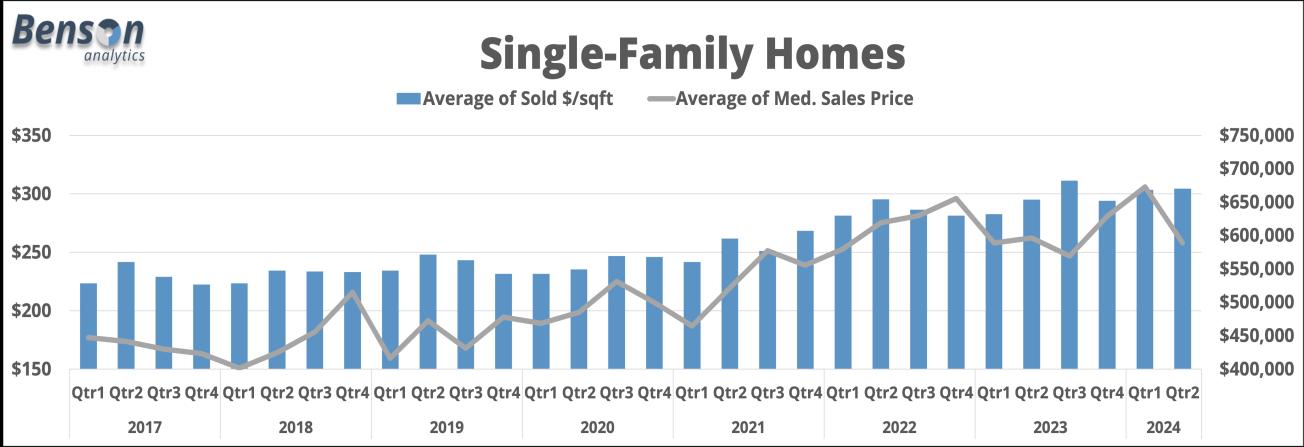
Market Area Details
Market Area Details
Click Section Title To Navigate
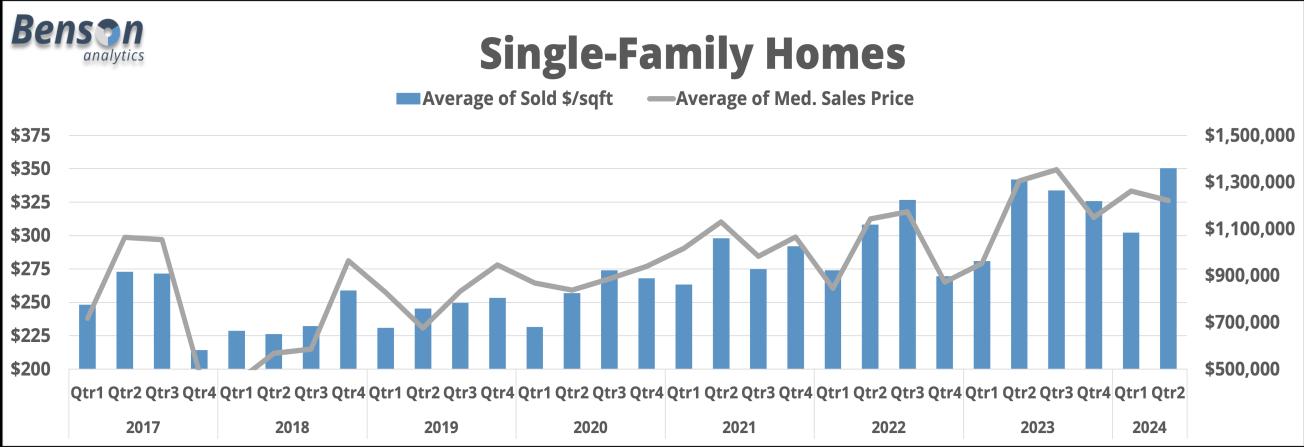
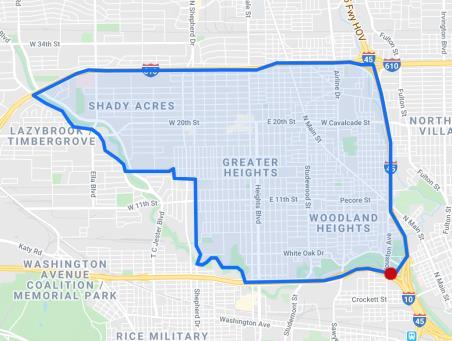
Bellaire
Braeswood Place
Medical Center Area
Briar Hollow
River Oaks Shopping Area
Briargrove
Cottage Grove
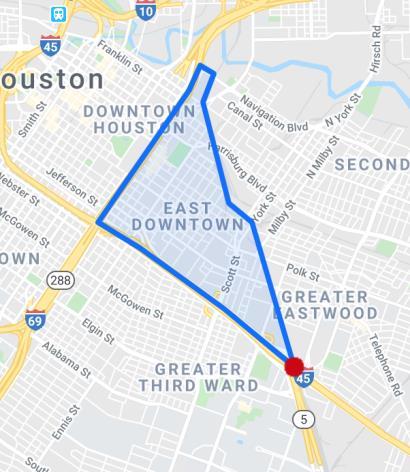
EADO
Galleria
Garden Oaks
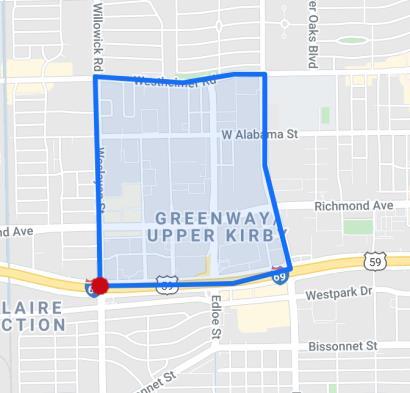
Greenway Plaza
Heights/Greater Heights
Highland Village/Midlane
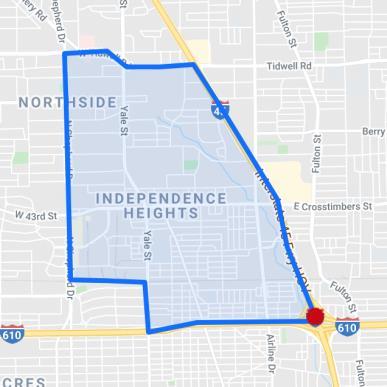
Independence Heights
Knollwood/Woodside
Memorial Close In
Memorial Park
Riverside
Memorial Villages
Meyerland Area
Midtown
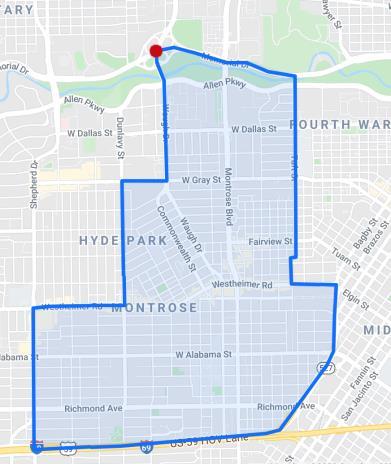
Montrose
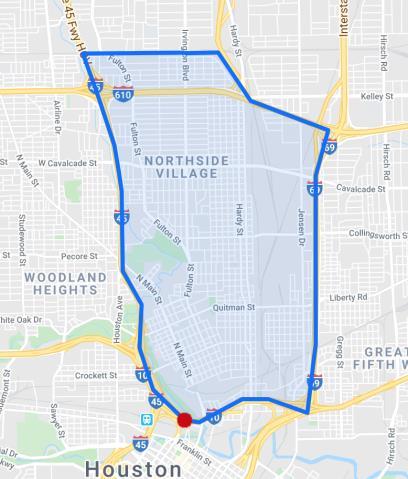
Northside Village
Oak Forest East
Oak Forest West
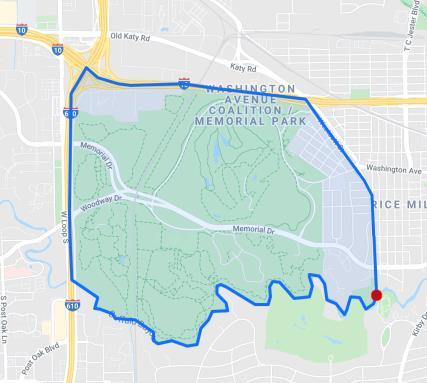
Rice Mil./Wash. Corridor
Rice/Museum District
River Oaks Area
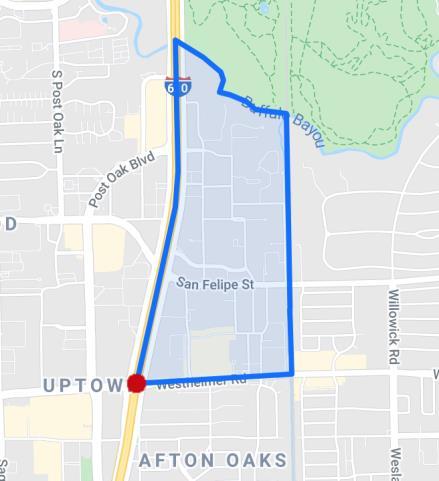
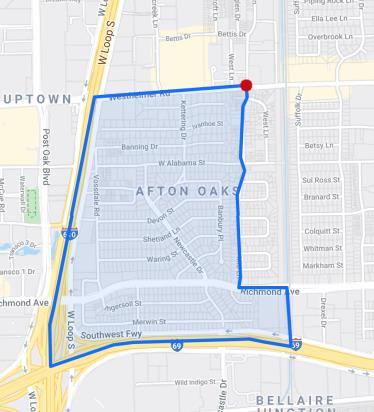
Roydon Oaks/Afton Oaks
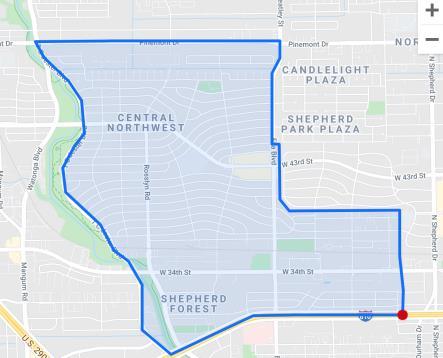
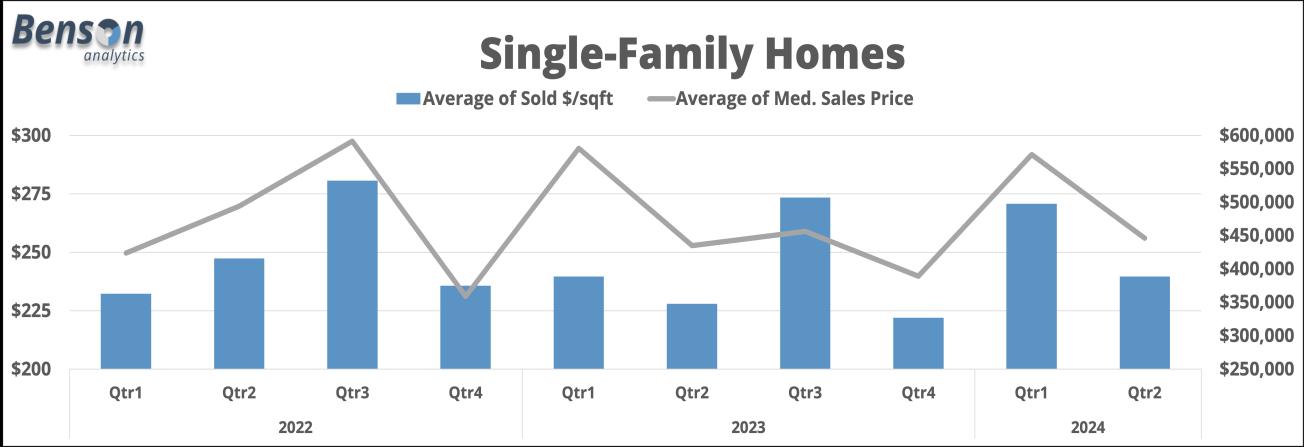
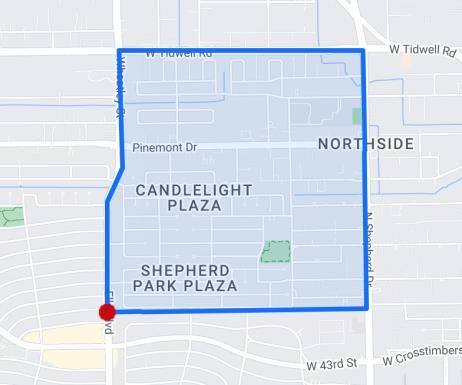
Shepherd Park Plaza
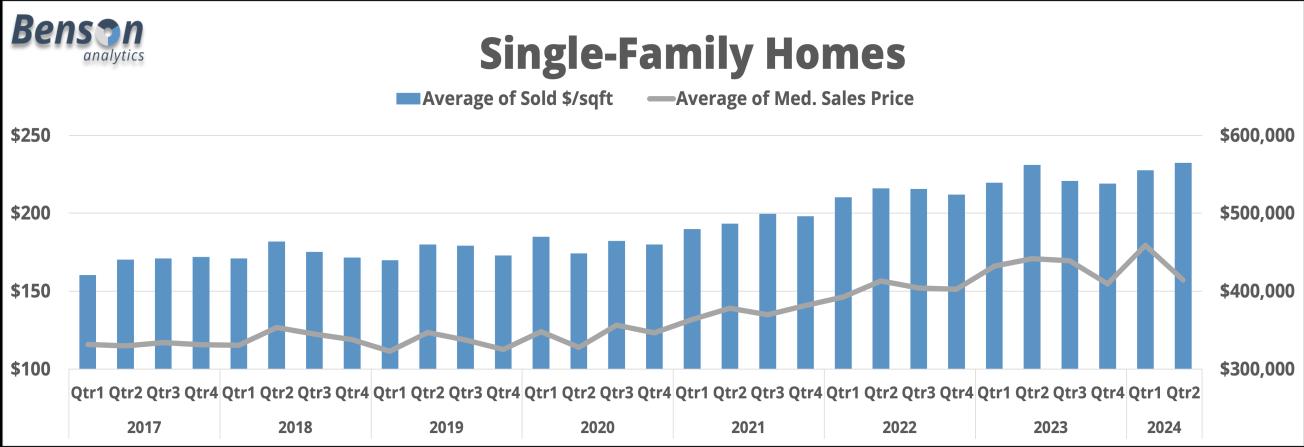
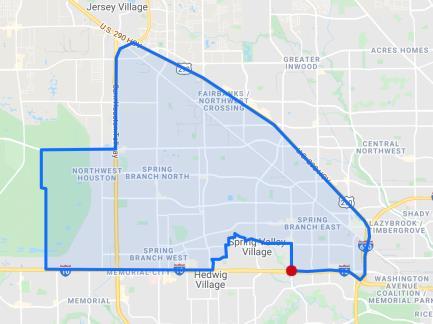
Spring Branch
Tanglewood Area
Timbergrove/Lazybrook
University Area
Upper Kirby
Washington East/Sabine
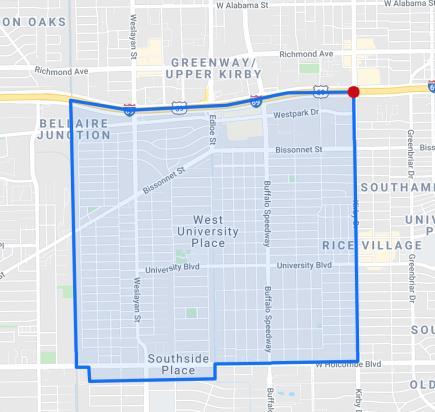
West U./Southside Place
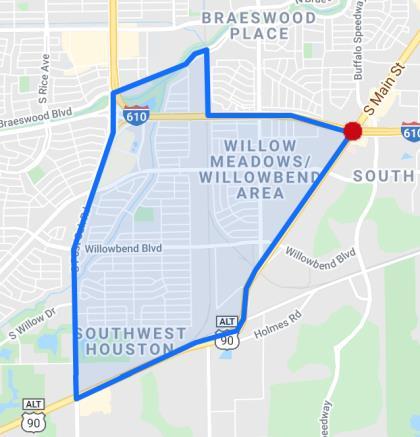
Willow Meadows Area
HOUSTON TEXAS RESIDENTIAL|Q1
ABOUT BENSON ANALYTICS
Officially formed in 2020, Benson Analytics, LLC is solely focused on providing the consumer with accurate, reliable and relevant information. Data integrity is at the forefront and every reasonable effort is made to ensure its accuracy, although it cannot be guaranteed due to the ebbs and flows of the market.
RESEARCH METHODOLOGY
The information within this report is the result of a compilation of information on residential real estate located in the Houston Metropolitan Area. Properties sold outside of the public marketplace are excluded from this report and any analysis included. All information included has been sourced from outlets deemed reliable and every effort has been made to ensure its accuracy. Data used is sourced from the Texas REALTOR® Data Relevance Project, a partnership among Texas REALTOR® associations throughout the state. Analysis provided through a research agreement with the Real Estate Center at Texas A&M University. Data is also sourced directly from HAR/MLS.
The information contained herein has been obtained from sources deemed reliable. While every reasonable effort has been made to ensure its accuracy, we cannot guarantee it. No responsibility is assumed for any inaccuracies and readers are encouraged to consult their professional advisors prior to acting on any of the material contained in this report. If your home is presently offered for sale, this is not a solicitation of the listing. Benson Analytics is not affiliated with Douglas Elliman Real Estate.