Chapter2LiteratureReview
Theaimofthisliteraturereviewistodelvedeeperintoimmersiveexperiences,in particularfocusingonhowdifferentsensoryfactorsinfluenceuserresponsesin differentagegroups.Whetherinvirtualreality,augmentedreality,orotherdigitally augmentedenvironments,immersiveexperiencesarebecomingincreasingly importantinacademicresearchandpracticalapplications.Weaimtoprovideinsights intotwocoreareas:age-relatedchangesinsensoryprocessingandtheirimpacton multisensoryintegration,andtheroleofpersonalizationinshapingimmersive responses.
Thecoreresearchquestionguidingthisreviewis:howdomultisensorystimuliin immersiveenvironmentsinfluenceresponsesacrossagegroups.Thisliteraturereview willbeginwithchangesinsensoryprocessingacrossages,layingthefoundationfor understandingthedifferencesinphysiologicalresponsesinimmersiveexperiences acrossagegroupsNext,theresearchdirectionofhowtocustomizepersonalized immersiveexperiencetoanswerthe"sensoryprescription"proposedbyexternal partnerswillbeinvestigatedWiththisstructure,thereviewwillintegrateexisting researchandidentifyfutureresearchdirectionsoftheproject
2.2Age-relatedchangesinsensoryprocessingandtheirimpactonmultisensory integration
Physiologicalagingaffectstheauditoryandvisualpathwaysfromthesensory peripherytothecortex(GroseandMamo,2010)Brooksetal(2018)furthernoted
thatolderadultsgenerallybenefitfromcomplementaryauditoryandvisualcues,but thisbenefitislowercomparedtoyoungeradults(Brooksetal.,2018).Atthesame time,thepaperpointsoutthatage-relatedmono-sensorychanges(suchasauditoryor visualdecline)mayaffecttheperformanceofmultisensoryintegration,andsuch changesmaybecloselyrelatedtotheoutcomeofperceptualtasks.Thestudyshowed differencesinsensoryprocessingacrossagegroups.Atthesametime,itshowsthat differentperceptionmechanismswillaffectthetestperson'saudio-visualintegration abilityThisprovidesatheoreticalbasisforstudyingthevisualandauditorystimulus responsesofpeopleofdifferentagesinimmersiveexperiencesHowever,thesample isunderrepresentative,nospecialpeopleofallagegroupswererecruited,andall participantswerenativeEnglishspeakers,whichlimitsthegeneralizationofthe resultsacrossdifferentculturalbackgrounds
Alainetal(2022)measuredneurocomputeractivitybetweenyoungandoldadults whenreceivingauditory,visual,andsomatosensorystimuli,andfoundsignificant differencesintheamplitude,latency,functionalconnectivity,andadaptive mechanismsofsensoryresponsesbetweenthetwoagegroups(Alainetal.,2022).
Thissuggeststhatage-relatedchangesinsensoryprocessingareinterconnected.
Germanakos(2022)usedthen-backworkingmemorytask,whichwasusedtotest participants'cognitiveloadandattentionalcontrolunderdifferentdistractor conditions,assessingtheroleofsensorymodalitiesinage-relateddistraction (Germanakosetal.,2022).Weshowhowolderadultsdisplaydifferentpatternsof distractionindifferentsensorytasks,andhowthisdifferenceaffectsdailyfunctioning
andcognitiveperformance.Thiscontrolledexperimentsuccessfullyrevealed significantdifferencesinvisionandhearingamongdifferentagegroups,which guidedthefutureresearchmethodsofthisproject.Alain(2022)andGuerreiro(2022) bothuseavarietyofmethodologiestoconductexperimentsandconductdata-driven analysis,whichmakestheconclusionsoftheresearchmoreextensiveandin-depth.
However,similarly,thecrowddoesnottakeintoaccountthemulti-cultural perspective,andpeoplewithdifferentculturalbackgroundsmayproducedifferent resultsontheexperimentalcontent 2.3Howimportantispersonalizationinimmersiveexperiencesandhowisit measured
PersonalizationisimportantinimmersiveexperiencesFactorstoconsiderwhen designingandoptimizingimmersiveexperiencesincludethesystem,content,context, individualfactors,andtheinteractionbetweentheindividualandtheexperience (Agrawaletal,2019)AsAgrawaletalpointedoutintheirstudy,immersionis understoodfromtwomainmodes:thepsychologicalstateoftheindividualandthe objectivepropertiesofthetechnologyorsystemthatcancontributetothisexperience
Thiswayofdividingimmersionintosubjectiveandobjectivecomponentsprovidesan importanttheoreticalfoundationforstudyinghowtoquantifyimmersion.Twomain measuresofimmersionhavebeenhighlightedintheliterature:post-experience questionnairesandphysiologicalandbehavioralmeasures(Agrawaletal.,2019).The post-experiencequestionnairecandirectlyreflectthesubjectivefeelingsof
participantsandissuitableforevaluatingvariousmediaandcontent.However,this approachalsointroducessignificantsubjectivityissues,whichmayaffectthe objectivityandreliabilityofthedata.Onthecontrary,physiologicalandbehavioral measures,suchaseye-trackingtechnology,providemoreobjectiveevaluation indicators,butcurrentstudiesstillhavetheproblemofinsufficientdatasampleswhen usingthesemethods.Insummary,thestudyhighlightstheneedtodynamicallyadapt contentandinteractionprocessestothepersonalizedneedsofusers
TheimportanceofpersonalizedUXinimmersiveexperiencesisfurther demonstratedinthestudyofGermanakosetal(2022)Itispointedoutthatrelated applicationsandsystemscanmakepredictionsordynamicadjustmentsbyexploiting individualdifferences(eg,cognitiveandemotionalfeaturesininformation processing,intelligence,personality,motivation,perceptualfeatures,behaviorand attitude,metacognism,socialdifferences)incoremodels,andtrackingandanalyzing userbehaviors,preferences,feed-back,andcharacteristics(Germanakosetal,2022)
Inthisway,dynamicone-to-onetouchpointscanbeeasilyprovidedtocreateuniquely personalizedexperiencesintermsofcontentpresentationandnavigation,thus significantlyincreasinguserengagement,effectiveness,andefficiencyintask execution.Theresearchalsoshowsthattraditionalmethodsthatignoreuser personalizedexperiencemayleadtouserconfusionorfrustration,whilepersonalized experiencedesigncaneffectivelyreducecognitiveloadandavoidpossibleexperience problemsduringuse.Inaddition,personalizedexperiencesrequiretheuseof persuasivestrategiesandtechniquestoautomaticallyadaptcontentandinteraction
processestotheuser'sgoalsandtasksinordertoenhancetheexperience'sappeal. Anotherarticlealsomentionsthatpersonalityorientationdesignhasbeenstudiedin human-computerinteraction(HCI)asanimportantfactorforusermodelinginawide rangeofapplications(Katifori,LougiakisandRoussou,2022).InKatifori's(2022) study,itwasmentionedthatpersonalitytraitsareimportantfactorsaffectinguser experienceinvirtualenvironment(VE),andspecificpersonalitytraitswillaffectthe senseofpresenceinvirtualenvironmentTheuser'sage,personality,physical functionandotherpersonalitycharacteristicsareimportantfactorsaffectingthe qualityofimmersiveexperienceHowever,thispaperonlytestedpersonalitytraits andtookempathyasthemainjudgmentcriterion,sotooobjectivejudgmentcriteria wouldaffectthesubjectivityandaccuracyoftheresults
Similarly,Rozsapointsoutthatimmersiveexperiencesaremulti-dimensionaland havesignificantindividualdifferences(Rozsaetal.,2022).InRozsa's(2022)study,a varietyofmeasurementtoolswereusedtoassessanindividual'simmersionleveland immersionpropensity,Itincludescomputerself-efficacyscale,SenseofPresence Questionnaire,ImmersiveTendenciesQuestionnaire,SenseofSpatialPresence, ExperienceandConsequences,UsabilityscaleandAchievementEmotion Questionnaire.Thesemethodsareusedtocomprehensivelymeasureanindividual's immersionabilityinamediaenvironment,whichnotonlydependsonindividual traitsandbehavioralhabits,butalsoindicatesthattheabilitytopersonalizeandadjust
theimmersionexperienceiscrucial,andfutureresearchshouldfocusonexploring howtooptimizetheseaspects.However,therearelimitationsinthestructureand applicabilityofthequestionnaire.Inparticular,thestudypointedoutthattheoriginal three-factormodeloftheITQquestionnairewasstatisticallyunstable,andinaddition, thestudyreliedmainlyonself-reporteddata,whichcouldleadtosubjectivebias.
SomefactorstructuresoftheITQquestionnairehaveonlylimitedvalidationin internationalstudies,especiallyinconsistenciesintheassociationbetweenadaptive andmaladaptivepersonalitytraitsMoreover,thesampleofthestudywasmainly focusedonthestudentpopulation,whichmaylimitthegeneralizationofits conclusionsInadequaterepresentationofbroaderdemographiccharacteristics, especiallyindiverseculturalandsocialcontexts
Inconclusion,thestudyshowsthatinordertooptimizethepersonalizationof immersiveexperiences,multiplemeasuresmustbeconsideredtogetherandthe experiencecontentandinteractionprocessmustbedynamicallyadjustedaccordingto theneedsandpreferencesofdifferentusers(Rozsaetal.,2022).Futureresearch shouldfurtherexplorehowtoimprovetheoverallqualityofimmersiveexperience throughmulti-dimensionalmeasurementandpersonalizedcustomization.
2.4Conclusion
Inshort,immersiveexperiencesarebecomingincreasinglycommoninvirtualreality, augmentedreality,andotherdigitalenvironments.Itsdesignandoptimizationneedto
takeintoaccountbothage-relatedsensoryprocessingandtheeffectsof personalization.Thestudyshowsthattherearesignificantdifferencesinsensory processingabilitybetweenagegroups,whichprovidesatheoreticalbasisfor understandinghowtooptimizeimmersiveexperiencesforusersofdifferentage groups.Atthesametime,personalizedcustomdesignplaysanimportantrolein improvinguserimmersionandsatisfaction.Throughmultidimensionalmeasuressuch aspost-experiencequestionnaires,physiologicalandbehavioralmeasures,and emotionalmonitoring,researchcanmorefullyquantifyimmersiveexperiences Futureresearchshouldexplorehowtomaximizeimmersiveuserexperiences throughpersonalizedcontentanddynamicchangesintheinteractionprocessacross culturesandcontextsOnlyinthiswaycanhigh-qualityimmersionbeachieved accordingtotheneedsofusersandprovideasolidscientificfoundationforthe developmentofrelatedtechnologiesandapplications
3.1Survey
3.1.1Objective
Thesensorycharacteristicsandimmersiveexperienceneedsofthethreeagegroups of18-35yearsold,35-55yearsoldand55yearsoldandabovewereinvestigated.To understandthedifferencesofdifferentagegroupsinthefaceofspecificsensory cognitiveproblemsandimmersiveexperience
3.1.2Whyusethesurvey
Theaimistocollectmoreinsightsthroughquestionnairesandquantifytheresults forstatisticalanalysis.Thiswillguideourresearchinamoreprecisedirectionfor subsequentin-depthresearch.
3.1.3Targetparticipants
Peopleinthethreeagegroups18-35yearsoldand35-55yearsoldand55yearsold andaboveParticipantswhohadconductedimmersiveexperienceswerepreferred, butifnot,theycouldalsobestudiedasasampleforstudyingsensoryfactors
3.1.4Content
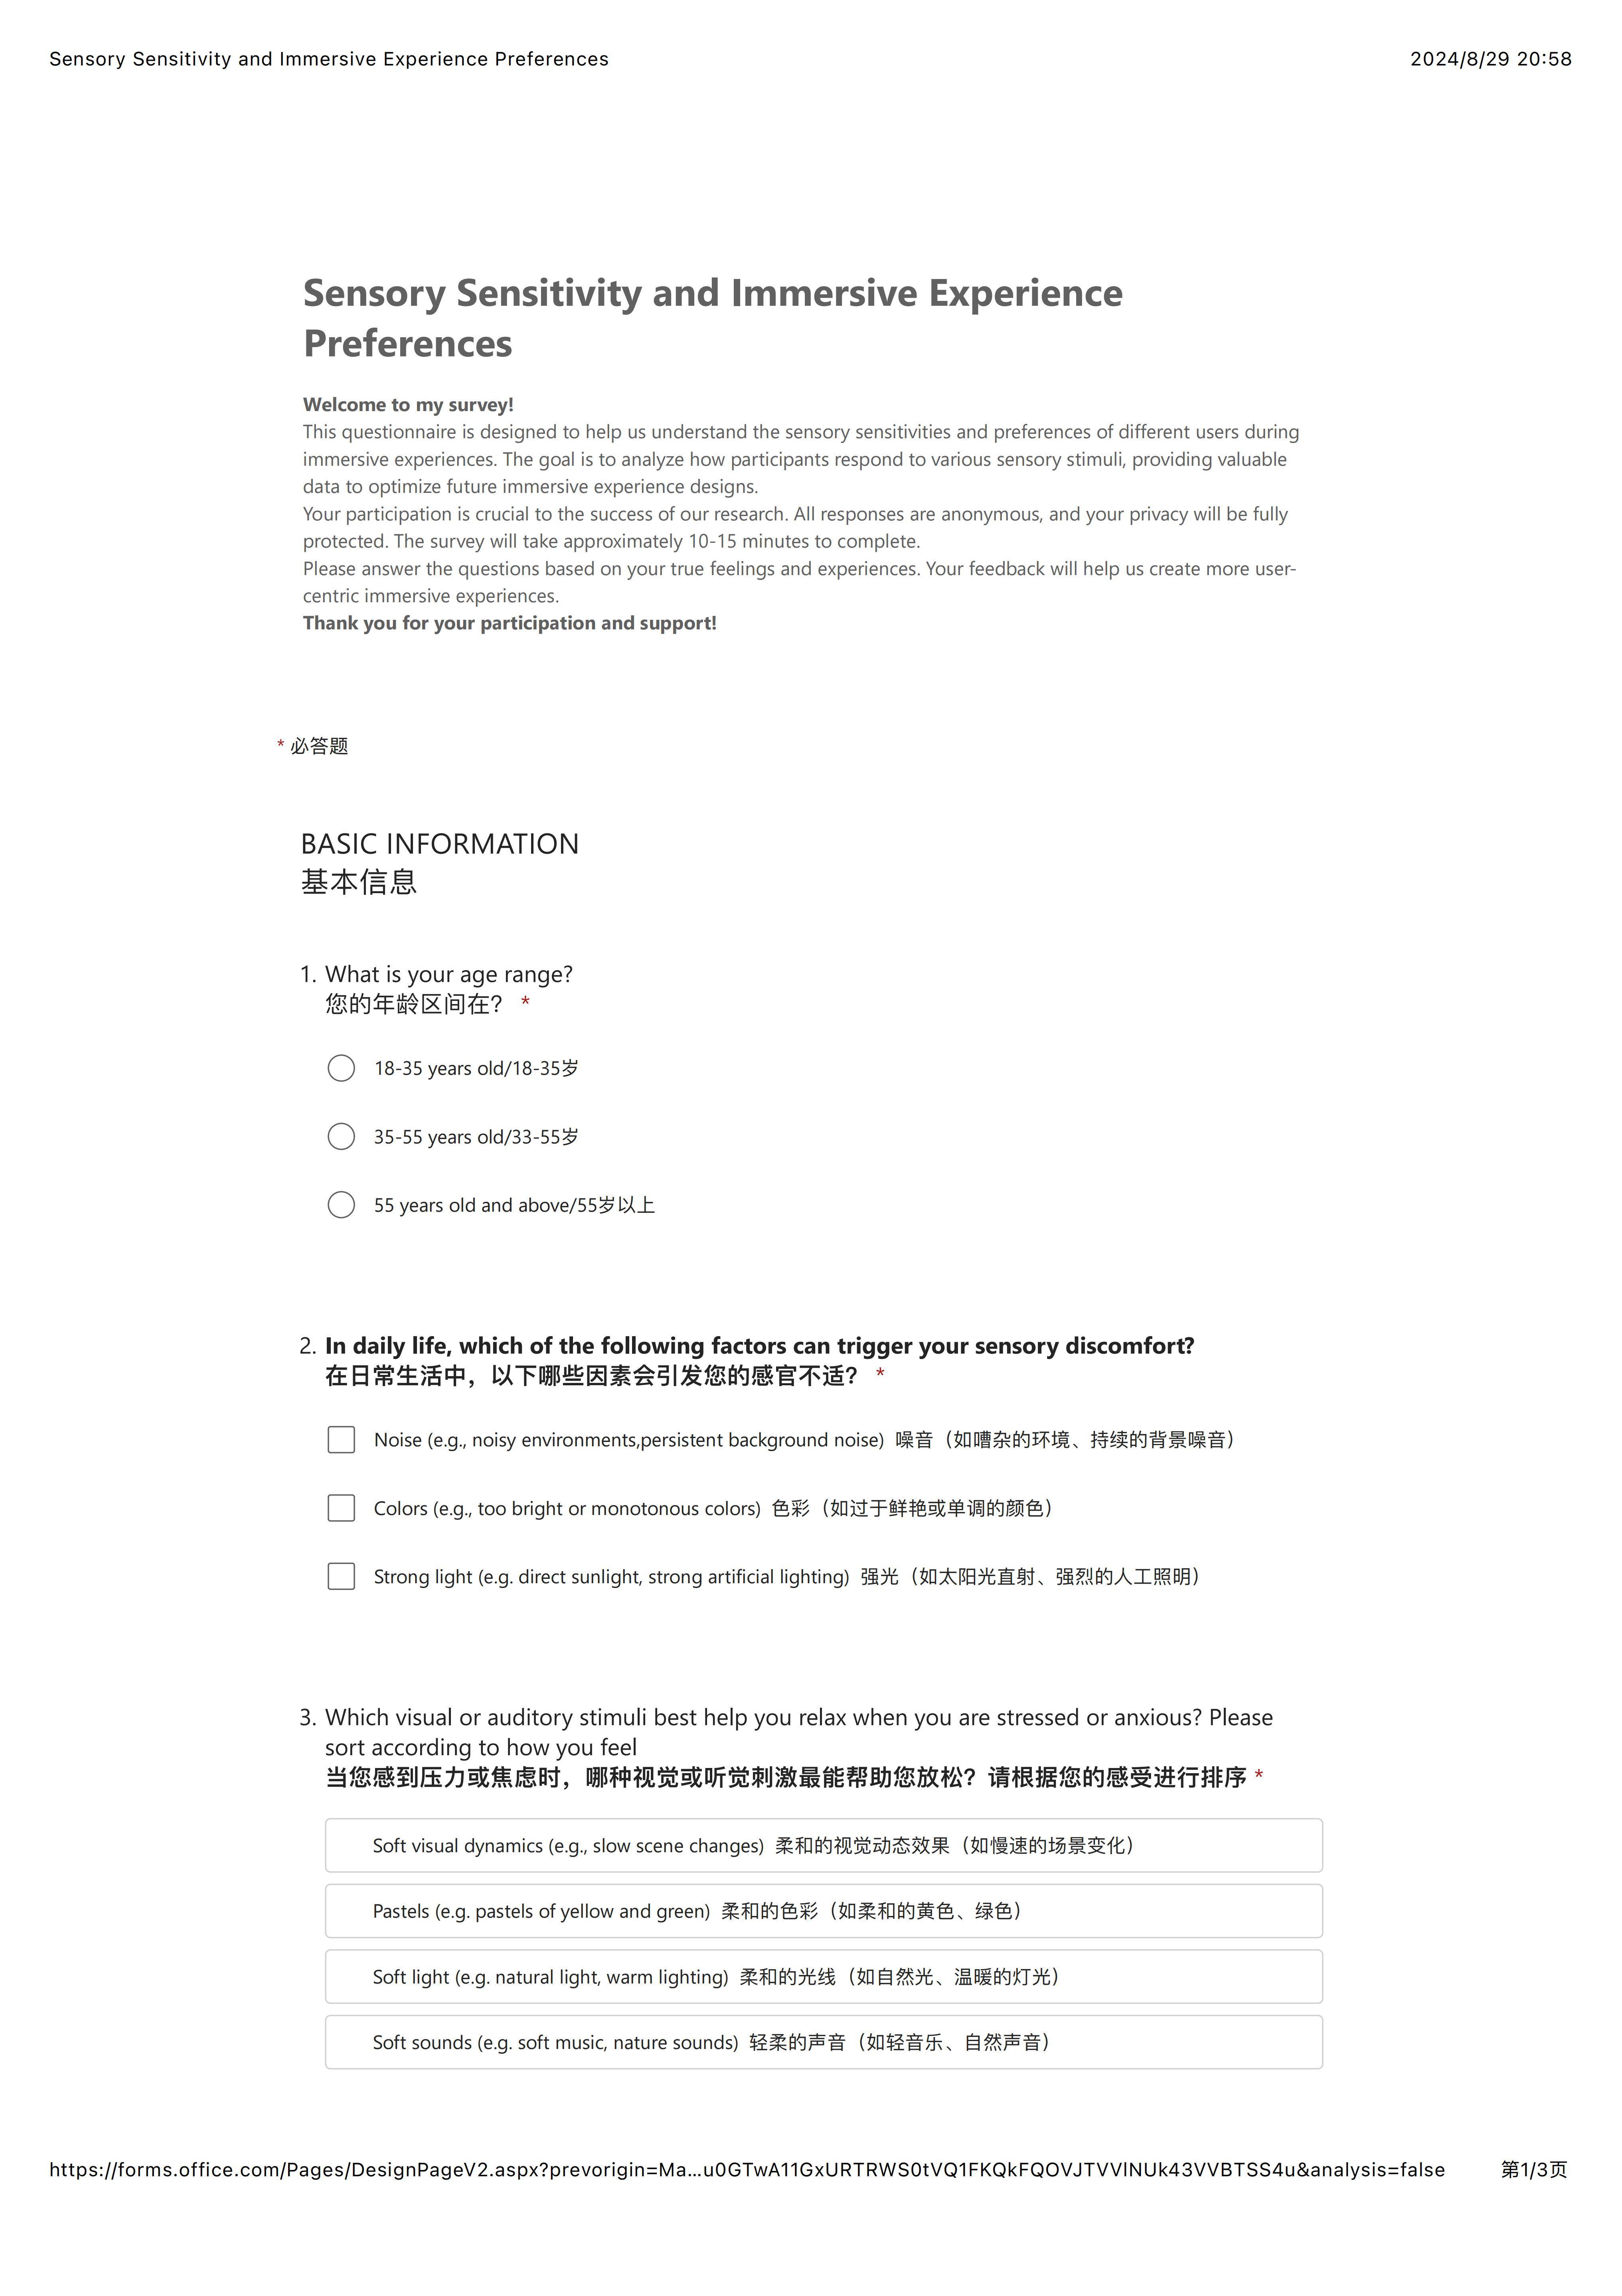
Beforestartingthequestionnaire,weexplicitlyinformedrespondentsthatthis questionnairewascompletelyanonymousandthatallinformationwasonlyfor academicresearch,ensuringthattheyunderstoodandhadconfidenceinproviding authenticanswersThequestionnairewasdesignedtounderstandthesensitivityand preferencesofrespondentstodifferentsensorystimuliduringimmersiveexperiences toprovidedatasupportforoptimizingfutureimmersiveexperiencedesigns
Agerange(18-35yearsold,35-55yearsold,andover55yearsold).
Triggersforsensorydiscomfort.
Askrespondentswhatfactors(e.g.,noise,brightlight,color)triggersensory discomfortintheirdailylife.
Relaxpreferredvisualorauditorystimuli.
Respondentswereaskedtorankthevisualorauditorystimuli(eg,softvisual dynamics,softcolors,softlight,softsounds)thatmosthelpedthemrelaxwhenthey feltstressedoranxious
Sensitivitytospecificvisualorauditoryinput.
Respondentswereaskedtorankwhichvisualorauditoryinputs(eg,sound,light, color,viewpointchanges)theyfeltmostsensitiveto Frequencyofresponsetosensorystimuli.
Respondentswereaskedhowoftentheyrespondedtonoise,brightlight,andcolorin theirdailylives.Respondentswereaskedhowtheyperceivedtheimpactofdifferent visualandauditoryfactorssuchasvisualeffects,soundeffects,emotionalresonance, interactivity,andengagementonimmersion.
SeeAppendixfordetails.
3.2Experiment
Theexperimentshouldfirstguidethedirectionoftheexperimentbasedonthe analysisoftheresearchresultsTolearnmoreaboutsensoryresponsestoimmersion experimentsindifferentagegroups.
3.2.1Purpose
Thisexperimentaimstorevealphysiologicalandcognitivedifferencesinthefaceof visualandauditorystimulibyanalyzingthesensoryresponsesofdifferentagegroups duringimmersiveexperiencesSpecifically,wewillevaluatewhethervisualand auditoryelementsareindependentandinteractinanimmersiveexperience,andhow theseelementsaffectaffectiveresponsesandimmersionindifferentagegroups.In addition,wewantedtodeterminethedifferenteffectsofdifferenttypesofvideo content(eg,fantasy,healing)onsubjectsofdifferentagegroupsFinally,weprovide customdesignsuggestionsbasedonlayereddatatoprovidedatasupportandoptimize scenariosfordesigningfutureimmersiveexperiences.
3.2.2Experimentalprocedure
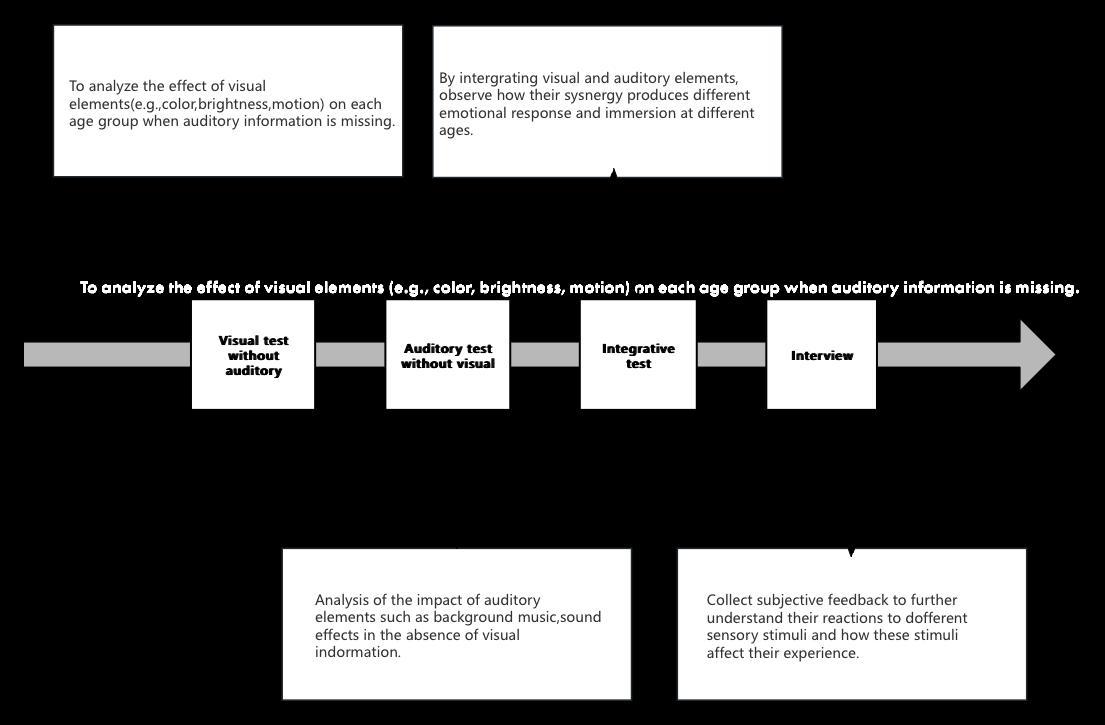
Theexperimentalprocessisdividedintothefollowingstages: Visualtest(lackofauditoryinformation).
First,a"visualtest"isperformedwheresubjectsexperiencetheeffectofvisual elementssuchascolor,brightness,motionwithoutanyauditoryinformationTheaim wastoanalysehowthesevisualelementsaffectedaffectiveresponsesandimmersion acrossagegroupswhenauditoryinformationwasmissing.
Auditorytest(lackofvisualinformation).
Next,an"auditorytest"wasperformed,wheresubjectsexperiencedtheeffectsof auditoryelements(suchasbackgroundmusic,soundeffects)withoutanyvisual information.Theaimofthisstageistoanalyzehowtheseauditoryelementsaffect affectiveresponsesandimmersionforeachagegroupwhenvisualinformationis missing Integratedtesting.
Thethirdstageisthe"integrationtest",whichcombinesvisualandauditoryelements toseehowtheirsynergyproducesdifferentemotionalresponsesandimmersionin differentagegroups
Fig1Experimentalprocedure
4.1Survey
4.1.1Multiplechoiceanalysis
Originaltitle:Indailylife,whichofthefollowingfactorscantriggeryour sensorydiscomfort?
Accordingtothetable,theresponsesofrespondentsindifferentagegroupstothe threefactors(noise,brightlightandcolor)areshown,andthenumberdistributionand proportionofeachfactorindifferentagegroupsarelisted.
Thenoiseresultsshowedthat67peopleinthe18-35agegroupconsiderednoiseto beanimportantfactor,representing37.2%ofthisagegroup.Inthe35-55agegroup, 71peopleweresensitivetonoise,accountingfor39.4percentofthisagegroup.Inthe 55andolderagegroup,13peopleweresensitivetonoise,accountingfor7.2%ofthe agegroup.Intotal,151people,or83.9%ofallrespondents,respondedtonoise, indicatingthatnoisewasthemostcommonfactorcausingresponses.
Brightlightresultsshowedthat54peopleinthe18-35agegroupweresensitiveto brightlight,accountingfor30.0%oftheagegroup.Inthe35-55agegroup,51people weresensitivetobrightlight,accountingfor283percentoftheagegroupNine peopleaged55andoverweresensitivetobrightlight,accountingfor50%oftheage groupIntotal,114people(633%ofallrespondents)respondedtobrightlight, indicatingthatbrightlightisalsoarelativelycommonirritant
Thecolorresultsshowedthat14peopleinthe18-35agegroupconsideredcolorto beanimportantfactor,representing78%ofthisagegroupEightpeopleinthe35-55
agegroup,or4.4percentoftheagegroup,weresensitivetocolor.Threepeopleaged 55andoverweresensitivetocolor,representing1.7%oftheagegroup.Intotal,25 people,or13.9%ofallrespondents,respondedtocolor,indicatingthatcolorwasthe
leastinfluentialofthethreefactors.(table1)
4.1.2Crossanalysis
Originaltitle:Whichvisualorauditorystimulibesthelpyourelaxwhenyou arestressedoranxious?Pleasesortaccordingtohowyoufeel.
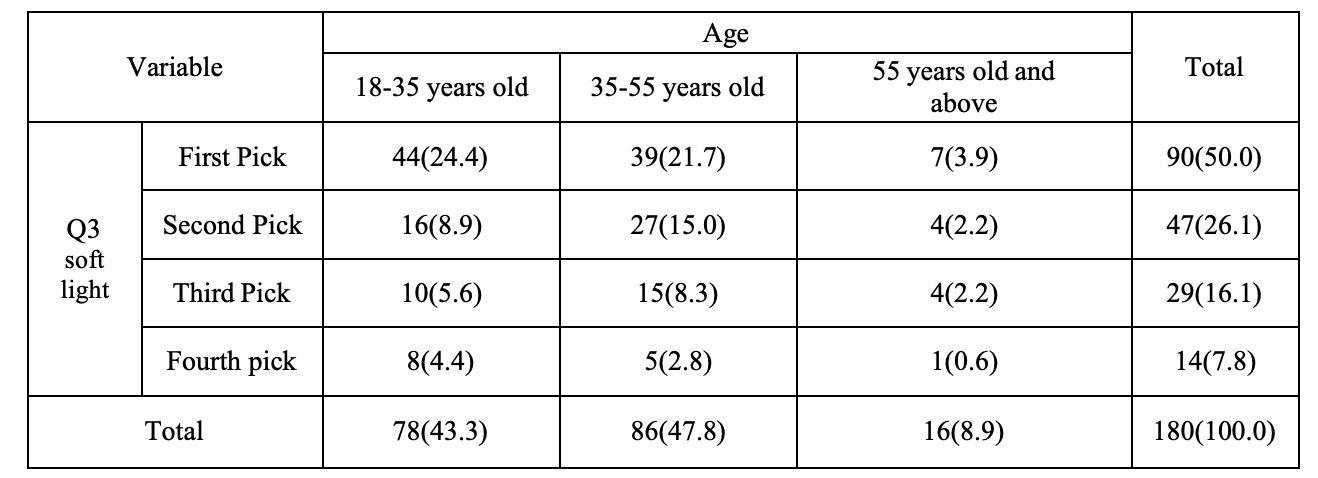
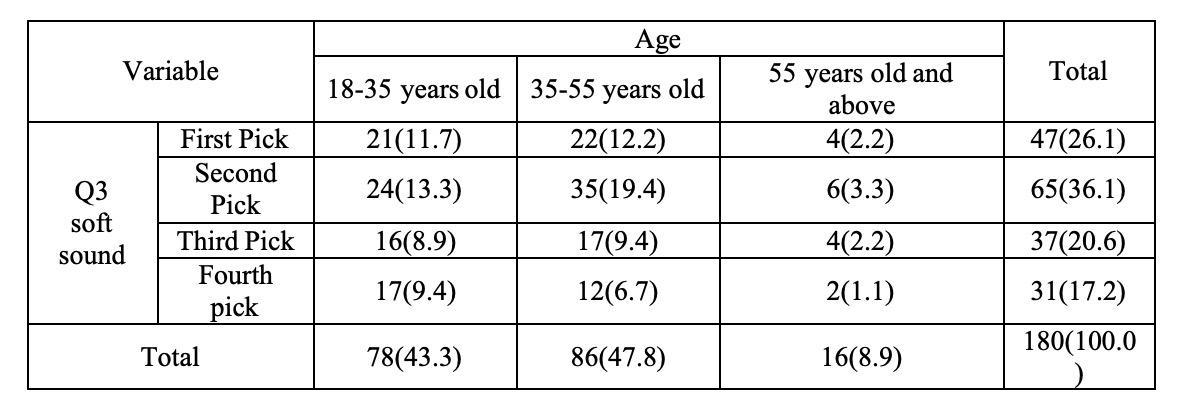
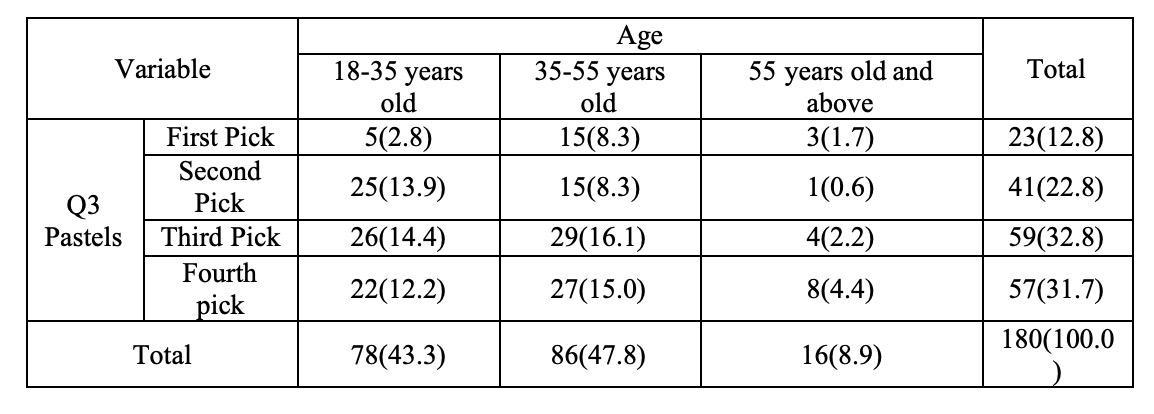
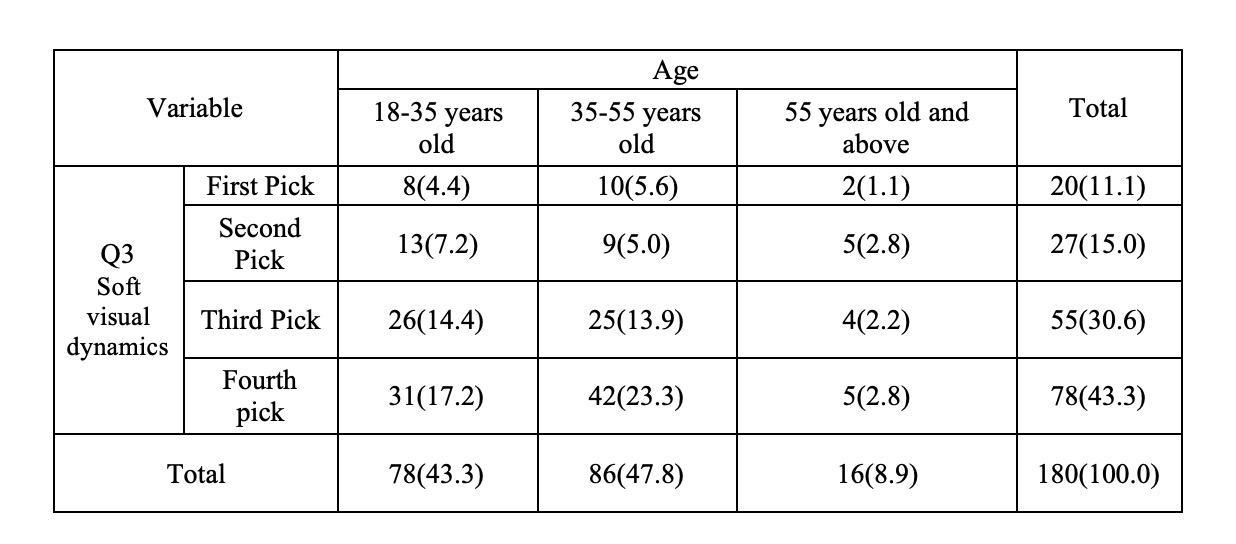
Thefirstoption,softlight,hasachi-squarevalueof5.496andap-valueof0.482. Thisp-valueisgreaterthantheusualsignificancelevelof,say,005(table2)The secondoption,softvoice,hasachi-squarevalueof3030andap-valueof0805 basedonthechi-squaretestThisp-valueismuchhigherthan005(table3)It indicatesthattherearesignificantstatisticaldifferencesinthepreferenceofchoosing softlightandrsoftsoundasrelaxationmethodsamongdifferentagegroups,and respondentshaverelativelyconsistentpreferencesforsoftlightandsoundinallage groupsInotherwords,therewasnosignificantagedifferenceinthepreferred preferenceofrespondentsofdifferentagegroupsforsoftlightandsoundwhenthey feltstressedoranxious.Thechi-squaretestforthethirdoption,"Pastels",hadachisquarevalueof12.646andap-valueof0.049(table4),indicatingthattherewere
Table1FrequencyAnalysis
statisticallysignificantdifferencesbetweenagegroupsinthepreferenceforchoosing Pastelsstimuliasarelaxationmethod.Thisimpliesthatagehassomeinfluenceonthe preferenceofrespondentstochoose“Pastels”stimuli.Theresultofchi-squaretestfor thefourthoption"Softvisualdynamics"showsthatthechi-squarevalueis6.033and thep-valueis0.42(table5)Sincethep-valueismuchlargerthan0.05,thisindicates thatthereisnostatisticallysignificantdifferenceinpreferencebetweenagegroups whenchoosingSoftvisualdynamicsasarelaxationmodality
Table2chi-squareanalysisofsoftlight
Table3chi-squareanalysisofsoftsound
Table4chi-squareanalysisofPastels
Table5chi-squareanalysisofsoftvisualdynamics
4.1.3One-wayAnova-FrequencyanalysisofQ5noise/Q6brightlight/Q7color Originaltitle:Howoftendoyoureacttonoise/brightlight/colorinyourdaily life?
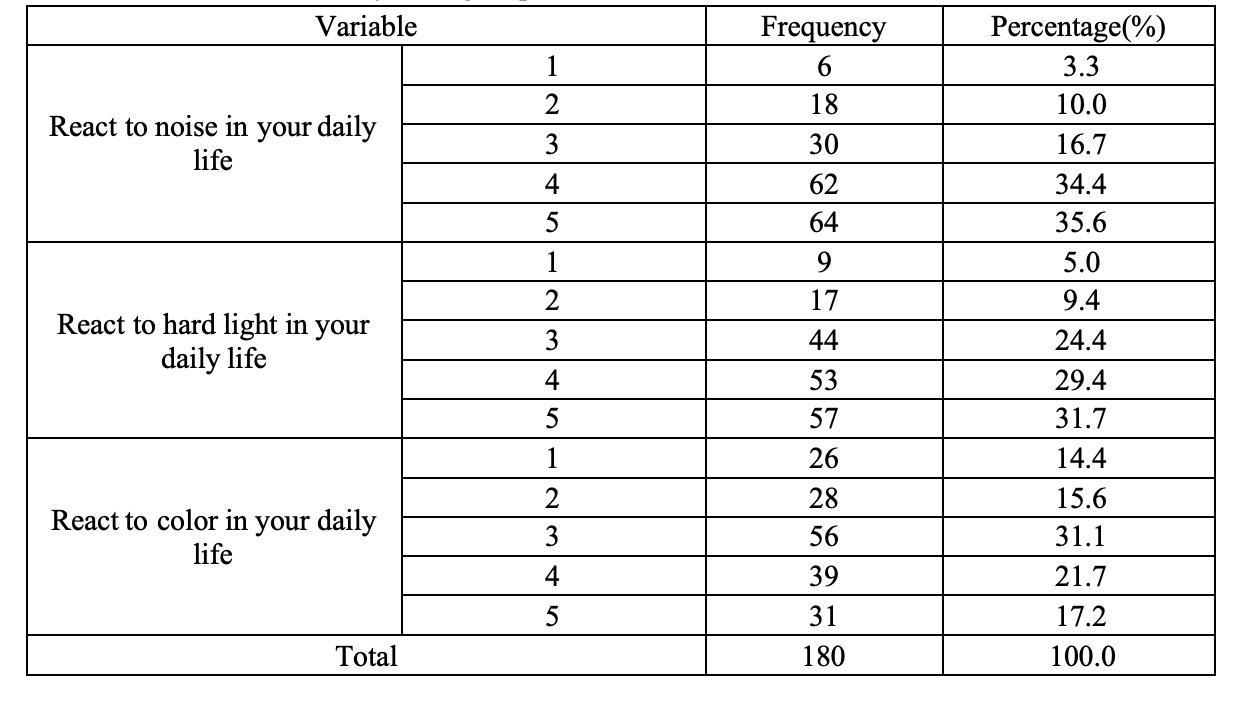
Indailylife,theresponsesoftherespondentstonoiseshowedlargedifferences.Six people(3.3%)indicatedthattheyhadtheweakestreactiontonoise(rating1),and18 people(10.0%)gaveadegreeofreactionratingof2.Amoderateresponseratingof3 was30(16.7percent).Thestrongestresponse(rating4)wasreportedby62(34.4%),
whilethehighestresponse(rating5)wasreportedby64(35.6%).Overall,mostofthe respondents'responsestonoisewereconcentratedinthehigh-responseareasrated4 and5,indicatingthatnoisehasalargeimpactonmostpeopleindailylife.
Therespondentsalsoshowedsignificantdifferencesintheirresponsetobrightlight. Ninepeople(5.0%)hadtheweakestresponsetobrightlight(rating1),and17people (9.4%)indicatedthattheyhadaresponselevelof2.Therewere44(24.4%)moderate responseswitharatingof3Thestrongdegreeofresponse(aratingof4)wasfound in53(294%),whilethehighestresponse(aratingof5)wasfoundin57(317%)
Overall,therespondents'responsestobrightlightwerealsomainlyconcentratedin high-scoringareas,indicatingthatbrightlightcausesanoticeableimpactonmany peopleintheirdailylives
Incontrast,respondentsshowedamoreuniformdistributionofresponsestocolor
Theweakestresponsewasrated1in26people(144%)and2in28people(156%) Therewere56respondents(311%)withamoderateresponse(rating3),while39 (21.7%)withastrongresponse(rating4)and31(17.2%)withthehighestresponse (rating5).Fromthedata,therespondents'responsestocolorwerescattered,withthe highestproportionofmoderateresponses,indicatingthatcolorhasamoderateimpact onmostpeople.
Overall,theresponsesoftherespondentstonoiseandbrightlightweremainly concentratedinthehigherscoringareas,indicatingthatthesetwotypesofstimulihad astronginfluenceontheirdailylife.However,theresponsestocolorweremore dispersed,showinglargedifferencesincolorsensitivityamongrespondents.
AgeandQ5noise/Q6brightlight/Q7colordifference.
BecauseQ5-Q7arecategoricalvariables,theycannotbedirectlyusedinaoneway
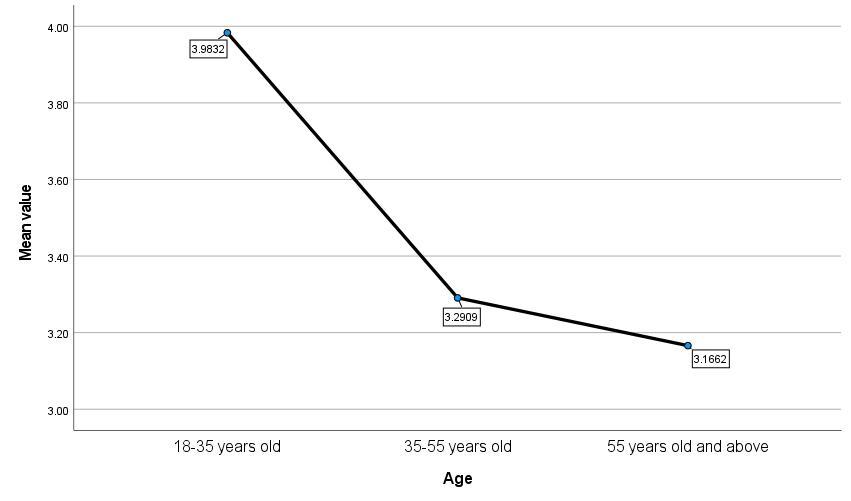
ANOVAanalysiswithage,sotheyneedtobecombinedandanalyzedusingthe populationvaluesandageAccordingtotheresults,inthe18-35agegroup,themean valueoftotalnoiseperceptionis3.983,thestandarddeviationis0.763,andthe standarderroris0.086.Thisindicatesthatrespondentsinthisagegrouphaveahigher levelofnoiseperceptionandthedataismoreconcentrated.
Respondentsinthe35-55agegrouphadameanof3.291withastandarddeviation of0.870andastandarderrorof0.094ontotalnoiseperception.Thisgrouphasa lowermeannoiseperceptionthanthe18-35agegroup,indicatingthatthisagegroup islesssensitivetonoise,andthedataisslightlymorewidelydistributed.
Intheagegroup55andolder,themeanvaluefurtherdecreasedto3.166,the
standarddeviationwas1.311,andthestandarderrorwas0.328.Noiseperception fluctuatesmoreinthisagegroup,showinglargeinter-individualdifferencesin perception.
Consideringallagegroups,themeanvalueoftheoveralltotalnoiseperceptionis 3.580,thestandarddeviationis0.938,andthestandarderroris0.070.TheF-measure ofANOVAwas14.822andthep-valuewas0.000,indicatingthatthedifferencesin noiseperceptionamongdifferentagegroupswerestatisticallysignificantThis impliesthatagemaybeanimportantfactoraffectinganindividual'sperceptionof noise,withyoungerpeoplebeingmoresensitivetonoiseandgraduallydecreasing withage
Table7Differencesintotalnoiseindifferentagegroups
4.1.4Q9-Q12(Visualandauditoryfactorsaffect)frequencyanalysis
Originaltitle:Howdothefollowingvisualandauditoryfactorsaffectyour immersioninanimmersiveexperience?
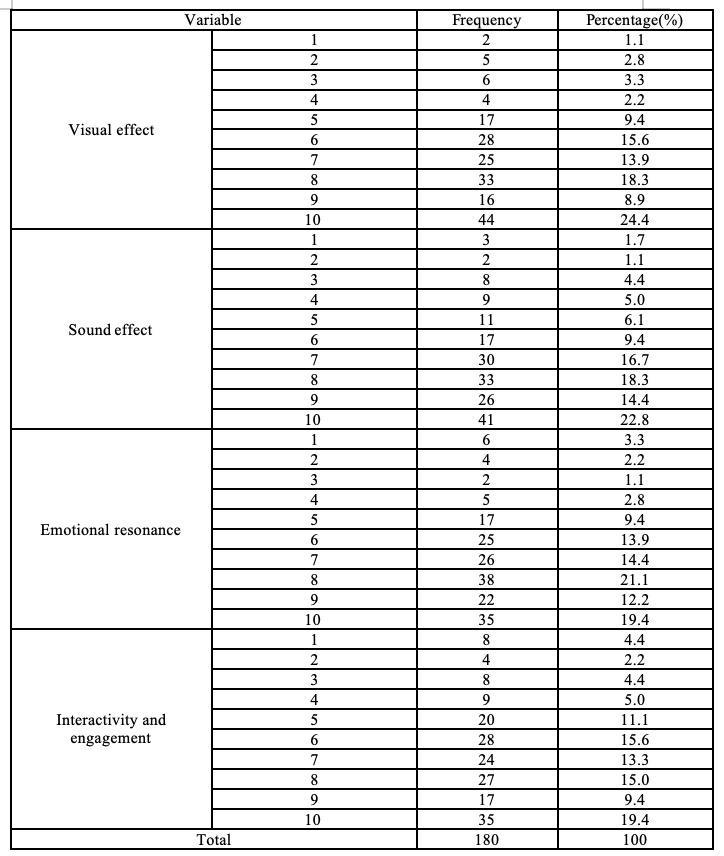
Accordingtotheresultsofthetable,intheVisualeffects,thereare1respondents whoscored1(thatis,theleastinfluence),accountingfor11%ofthetotal5people scored2,accountingfor28%;Theratingof3wasgivenby6people,accountingfor 33%Asthescoregraduallyincreases,sodoesthedegreeofinfluenceThenumber ofmoderateinfluencerswithascoreof6to8waslarger,with28(15.6%),25(13.9%) and33(18.3%),respectively.Thescoreof10meansthatthereare44respondents withthemostinfluence,accountingfor24.4%,showingthatthisgroupoffactorshas asignificantinfluenceonsomerespondents.
Inthesoundeffects,threeandtworespondentsrated1and2,accountingfor1.7% and1.1%,respectively.Thenumberofrespondentswhoratedbetween3and5 increasedgradually,accountingfor4.4%,5.0%and6.1%respectively.Themost
respondentswitharatingof7to8formediumimpactwere30(16.7percent)and33 (18.3percent),respectively.Therewerealsoalargenumberofrespondentswho scored10,41people,accountingfor22.8%,indicatingthatthisgroupoffactorshada significantimpactonsomerespondents.
Intheemotionalresonance,asmallernumberofrespondentsrated1to4,accounting for33%,22%,11%and28%,respectivelyThenumberofrespondentswhorated between5and8increasedsignificantly,especiallythenumberofrespondentswho rated8wasthelargest,with38respondents,accountingfor211%Thereare35 respondentswitharatingof10,accountingfor194%,indicatingthatthisgroupof factorshasaprofoundimpactonsomerespondents
IntheInteractivity,asmallernumberofrespondentsrated1to4,accountingfor 44%,22%,44%and50%,respectivelyThenumberofrespondentswhorated between5and8graduallyincreased,especiallythenumberofrespondentswhorated between6and8,accountingfor15.6%,13.3%and15.0%respectively.Therewere alsoalargenumberofrespondentswhorated10,35,or19.4%,whichshowedthat thisgroupoffactorshadastronginfluenceonsomerespondents(table8).
Intotal,theratingsofthe180respondentswerewidelydistributed,butwithineach groupoffactors,thehigherratedcategories(e.g.,7to10)accountedforalarge proportion,indicatingthatthevisualandauditoryfactorshadaclearinfluenceon mostrespondents,especiallyataratingof10,wheretheinfluenceofeachgroup peaked.
Table8Frequencyanalysisresult
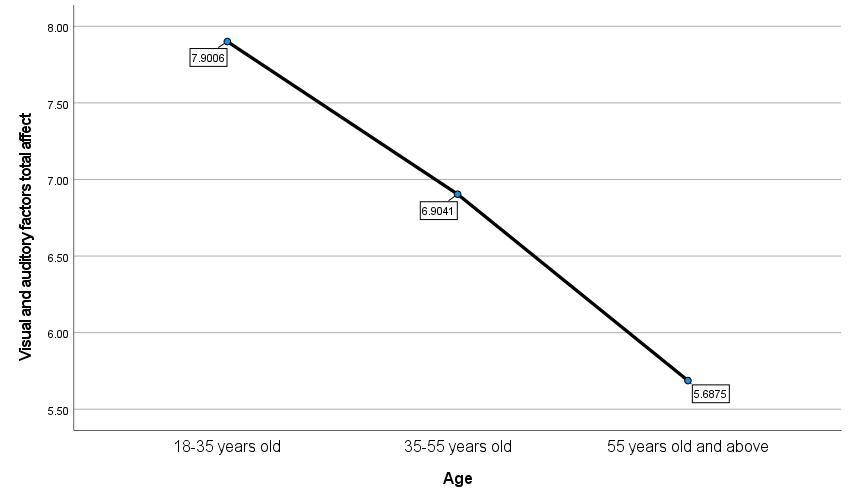
Accordingtothetableresults,intheagegroupof18-35,theaveragescoreof respondentsis7901,thestandarddeviationis1935,andthestandarderroris0219
Thisindicatesthatrespondentsinthisagegrouphaveastrongperceptionofthe influenceofvisualandauditoryfactors,withhighscores,andthedifferencesbetween
individualsaremoreuniform.
Inthe35-55agegroup,themeanscoreofrespondentswas6.904withastandard deviationof1.867andastandarderrorof0.201.Theaveragescoreforthisgroup decreasedslightlycomparedtothe18-35agegroup,indicatingthatthisagegroupis lesssensitivetovisualandauditoryfactors.
Intheagegroup55andolder,themeanscoreofrespondentswas5.688,thestandard deviationwas1944,andthestandarderrorwas0486Thisgrouphadthelowest meanscore,indicatingthatthesensitivityoftherespondentstovisualandauditory factorswasfurtherreducedwithincreasingageInaddition,thestandarderrorsare large,indicatingthattheindividualdifferencesinthisgrouparesignificant
Consideringallagegroups,theaveragescoreofvisualandauditoryfactorswas 7228,thestandarddeviationwas2011,andthestandarderrorwas0150TheF valueofvarianceanalysiswas11352,andthepvaluewas0000,whichshowedthat thedifferenceofvisualandauditoryfactorsbetweendifferentageswasstatistically significant.Thisindicatesthatageisanimportantfactoraffectingthesensitivityof individualstovisualandauditoryfactors,andsuchfactorsareperceivedmoreclearly byyoungergroups(table9).
Table9DifferencesinVisualandauditoryfactorstotalaffectamongdifferentage groups
4.2Experiment
4.2.118-35yearsold Trendanalysis.
Heartrateincreasedsignificantlyinthisagegroupinresponsetovisualstimulation. Especiallywithdynamiccontentandstrongsoundeffects,heartratefluctuationsare moredrastic.
Conditioncomparison.
Subjectsinthisagegroupweremostsensitivetofastswitchingframesandstrong visualcontrast,andthewaveformsshowedhighamplitudefluctuations. Situationalanalysis.
Physiologicalstressresponsesareveryevidentunderhigh-intensitymultimedia content,suchasactionclipsandintenselyrhythmicmusic
4.2.235-55yearsold Trendanalysis.
Inthisagegroup,subjectsshowedrelativelymildphysiologicalresponsestovisual
andauditorystimuli,withsmoothECGwaveformchangesandnoobvioussharp fluctuations.
Conditioncomparison.
Auditorystimulationhadamoderateeffectonthisagegroup,andtheheartratedid notchangemuchHowever,althoughvisualstimulicauseanincreaseinheartrate,the overallfluctuationislimited,andsubjectsarelesssensitivetocomplexordynamic visualscenes.
Situationalanalysis.
Complexanddynamicvisualelementstendtotriggermildphysiologicalresponses, butthemagnitudeoftheresponsesisrelativelysmall
4.2.355yearsoldandabove
Trendanalysis.
ThisagegrouphasthemoststablephysiologicalresponseECGdatashowedsmall andstableheartratechanges.Inthepresenceofstrongvisualorauditorystimuli,the amplitudeofheartratefluctuationsisstilllimited.
Conditioncomparison.
Auditorystimulihadlesseffectonthisagegroup,andvisualstimulialsocaused heartratechanges,butnottoalargeextent.
Situationalanalysis.
Visualinformationoverloadincomplexscenesmaycauseabriefincreaseinheart rate,buttheoverallresponseissmooth
4.3Conclusion
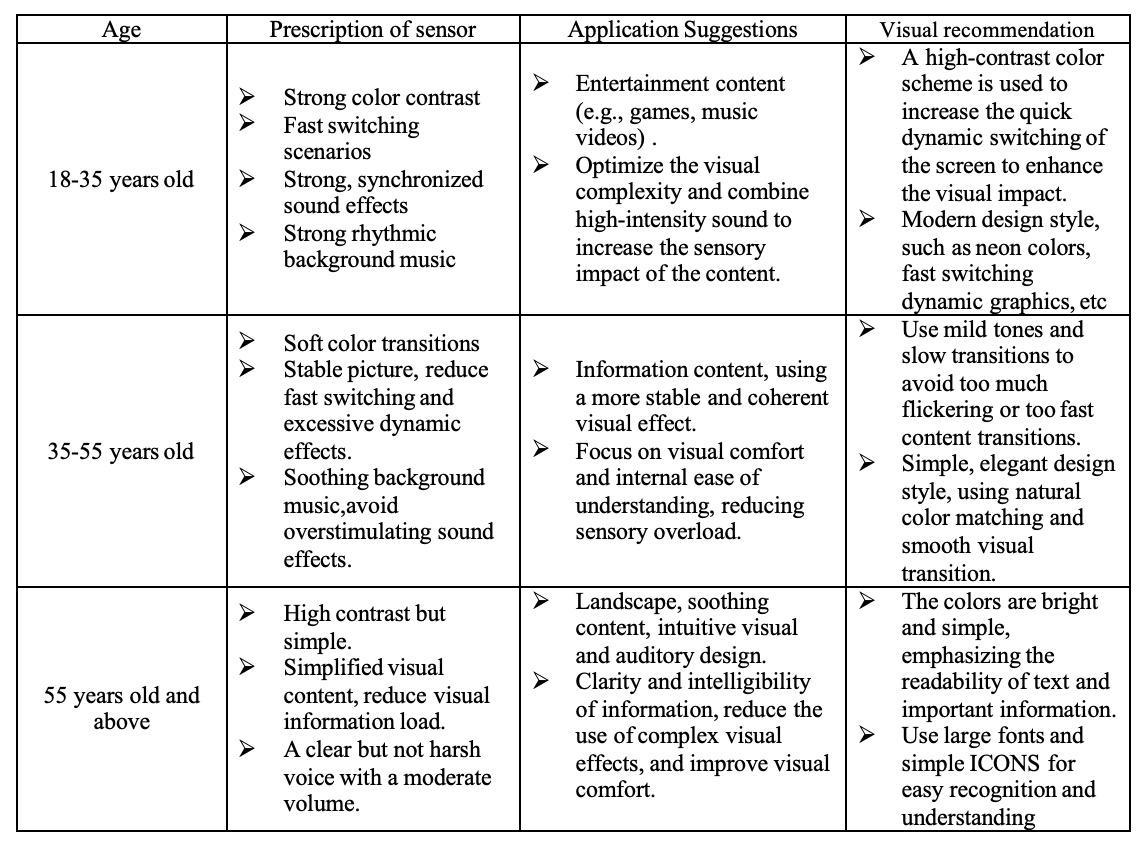
Table10Summaryofdataanalysis
Chapter5Conclusion
Thisstudyexploreddifferencesinresponsestoimmersiveexperiencesacrossage groups,revealingimportanteffectsofageintermsofperceptionandpreference.The youngergroup(18to35years)showedgreatersensitivityanddistinctphysiological responsestovisualandauditorystimuli,whilethissensitivitydiminishedandthe responseleveledoffwithage(35to55yearsandover).Theresultshighlightthe importanceofconsideringage-relateddifferencesinsensoryprocessingand personalizationinthedesignofimmersiveexperiences.
Throughmulti-dimensionalmeasurements,suchasquestionnaires,physiologicaland behavioralassessments,theimmersiveexperiencecanbemorecomprehensively quantified,answeringthequestionof"sensoryprescription"ofpartners.Future researchshouldfurtherexplorehowtomaximizetheuser'simmersionexperiencein differentculturesandcontextsthroughthedynamicadjustmentofpersonalized contentandinteractionprocessInthisway,high-qualityimmersiveexperiencescan beachievedaccordingtouserrequirementsandprovideasolidscientificfoundation forthedevelopmentofrelatedtechnologiesandapplications
Reference
GroseJ.H.andMamoS.K.(2010)‘ProcessingofTemporalFineStructureasa FunctionofAge’,EarandHearing,31(6),p.755.Availableat: https://doi.org/10.1097/AUD.0b013e3181e627e7.
Brooks,CJetal(2018)‘AudiovisualTemporalPerceptioninAging:TheRole ofMultisensoryIntegrationandAge-RelatedSensoryLoss’,Frontiersin HumanNeuroscience,12Availableat:
https://doiorg/103389/fnhum201800192
Alain,C.etal.(2022)‘AgingEnhancesNeuralActivityinAuditory,Visual, andSomatosensoryCortices:TheCommonCauseRevisited’,TheJournalof Neuroscience,42(2),pp.264–275.Availableat:
https://doiorg/101523/JNEUROSCI0864-212021
Agrawal,S.R.andBech,S.(2023)‘ImmersioninAudiovisualExperiences’ , inM.GeronazzoandS.Serafin(eds)SonicInteractionsinVirtualEnvironments. Cham:SpringerInternationalPublishing,pp.319–351.Availableat: https://doi.org/10.1007/978-3-031-04021-411.
Germanakos,P.etal.(2022)‘Editorial:Immersiverealityandpersonalizeduser experiences’,FrontiersinVirtualReality,3Availableat: https://doi.org/10.3389/frvir.2022.1015155.
Katifori,A,Lougiakis,CandRoussou,M(2022)‘ExploringtheEffectof PersonalityTraitsinVRInteraction:TheEmergentRoleofPerspective-Takingin
TaskPerformance’,FrontiersinVirtualReality,3.Availableat:
https://doiorg/103389/frvir2022860916Rózsa,Setal(2022)‘Measuring Immersion,Involvement,andAttentionFocusingTendenciesintheMediated Environment:TheApplicabilityoftheImmersiveTendenciesQuestionnaire’ , FrontiersinPsychology,13.Availableat: https://doi.org/10.3389/fpsyg.2022.931955.
Appendices


