N E W Y O R K
C I T Y
M A R K E T R E P O R T

Q 4 2 0 2 4


M A R K E T R E P O R T
Q 4 2 0 2 4
The Manhattan market closed the fourth quarter on a positive note, with deal activity picking up after a multi-year slowdown, notably against the backdrop of elevated mortgage rates for much of the period. With the natural three-month lag between real-time market activity and quarterly reports, the current pipeline of pending sales is likely to drive a more positive Q1 report in April, reflecting the growth momentum seeded over the past two quarters.
Median and average sales price trends diverged in the fourth quarter. The median sale price declined 5.1% from the previous quarter and 3.0% year-over-year, settling at $1.15M. In contrast, the average sale price rose to $2.14M, showing a 7.7% increase quarter-over-quarter and a 6.7% gain year-overyear. Sellers received 95.4% of their asking price, while the time to secure a buyer improved to 88 days, down 7.4% from the previous quarter but six days longer than the same period last year.
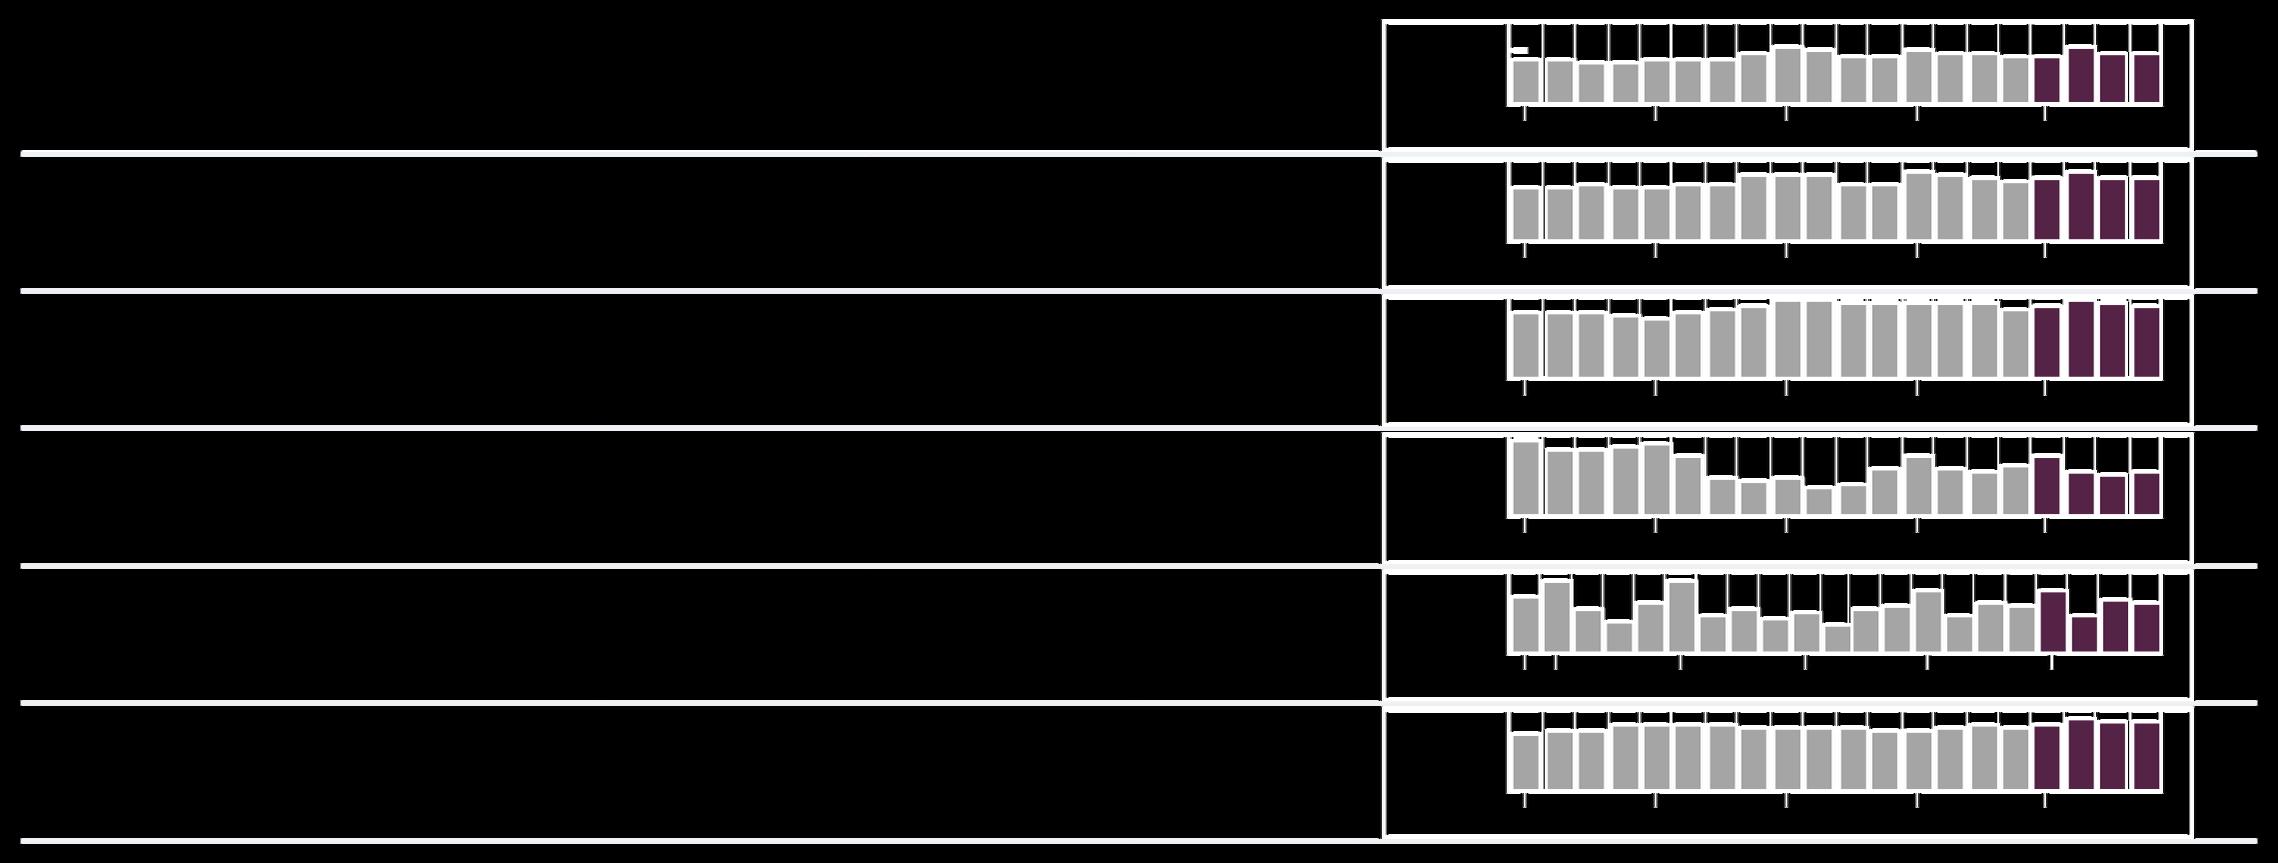
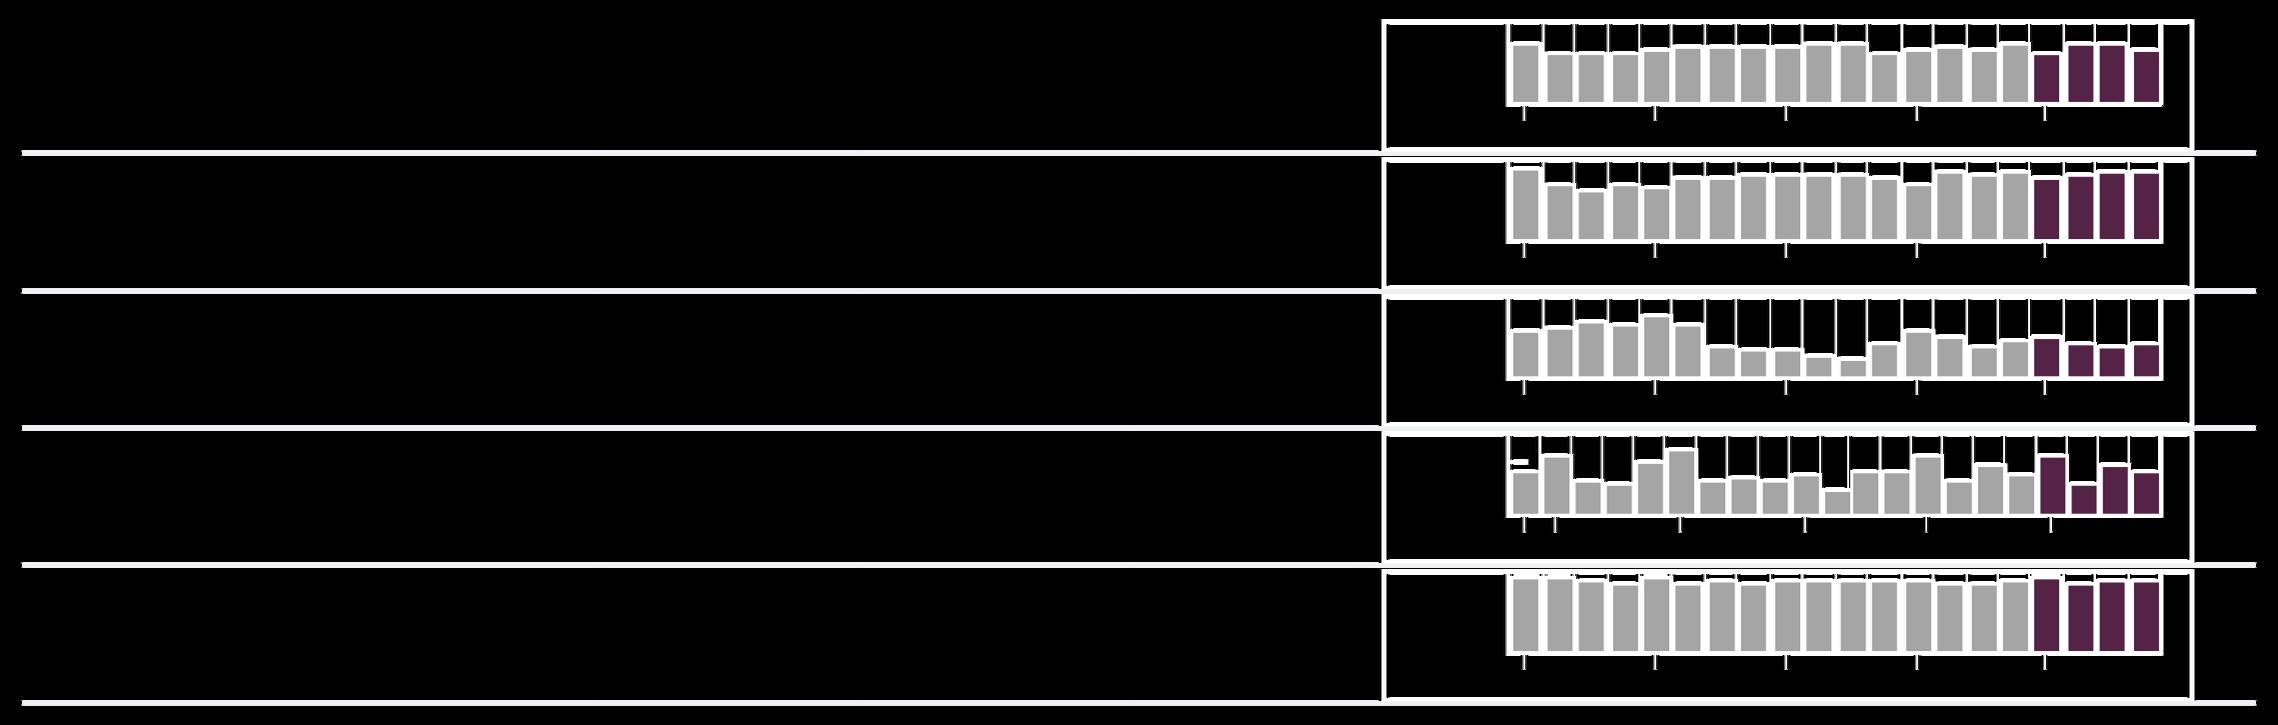
The resale market showed typical fluctuations between the co-op and condo segments, with notable differences in performance. Resale condos led in price action, achieving a median sales price of $1.4M, up 5.2% year-over-year. In contrast, co-ops recorded a median sales price of $785K, down 6% from last year. Condos took slightly longer to sell, averaging 93 days on market, compared to 82 days for co-ops. The listing discount for condos was 5.4%, a significant reduction from last year, while co-ops had a 4.4% discount, reflecting a modest improvement year-over-year.
Looking ahead to 2025, the current market momentum is expected to persist, with tight supply conditions likely driving increased buyer competition. Prices are poised to hold steady or rise in the near term, supported by a strong rental market that continues to underpin the sales market The key wild cards remain interest rates and recessionary concerns So far, only higher rates have materialized, and the market has absorbed them surprisingly well If this resilience continues, Manhattan could be on track for its most active spring market in years

Steven James, President and Chief Executive Officer
Prepared by: Steven James, President and Chief Executive


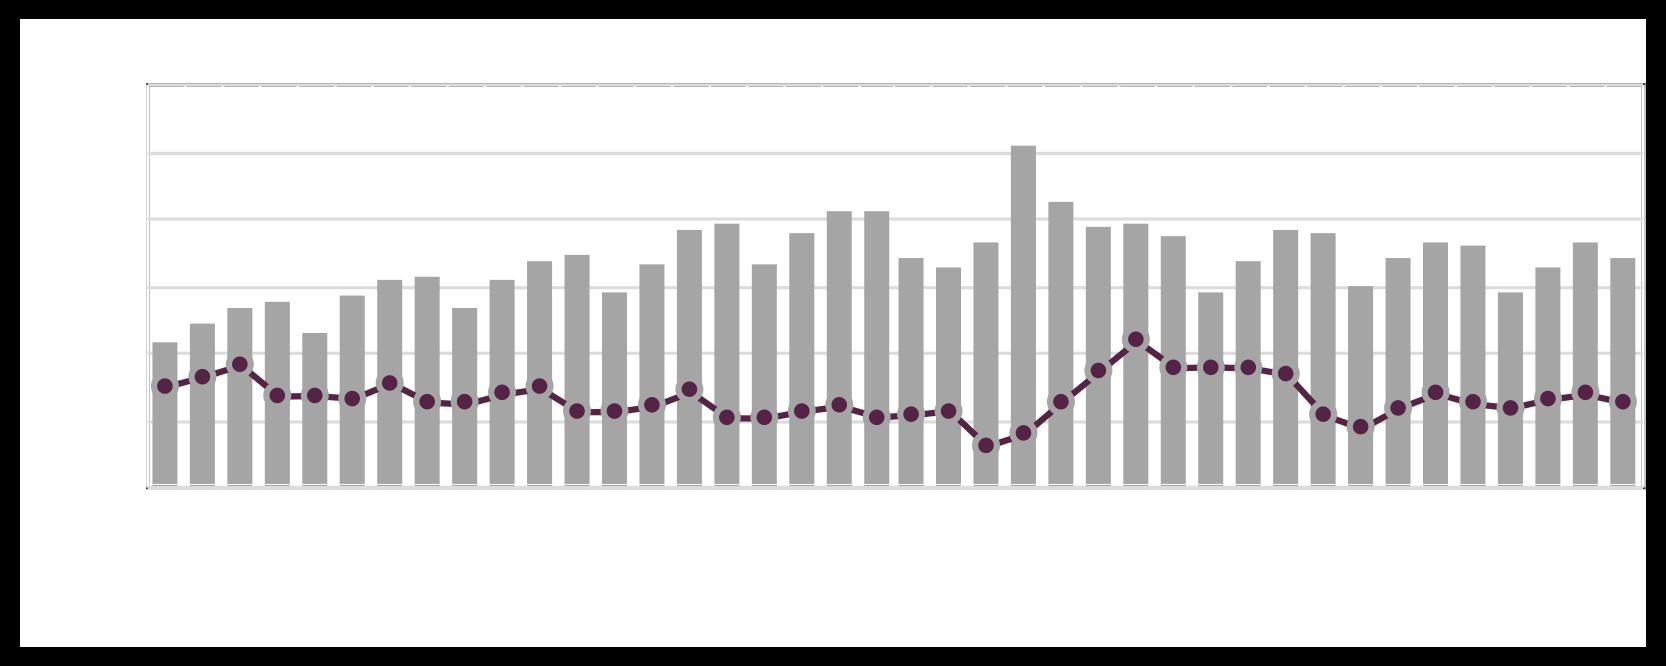
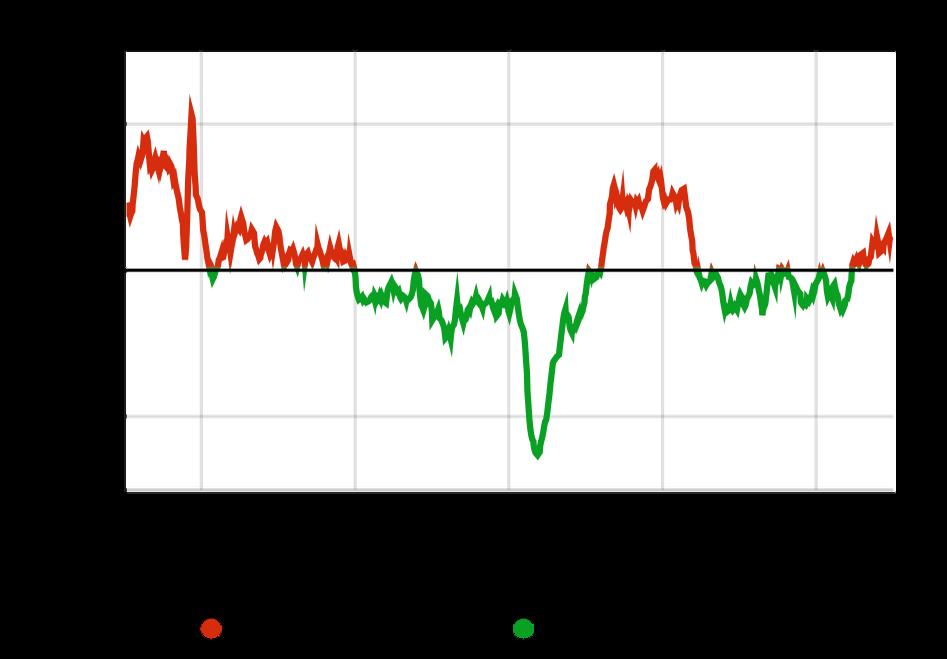
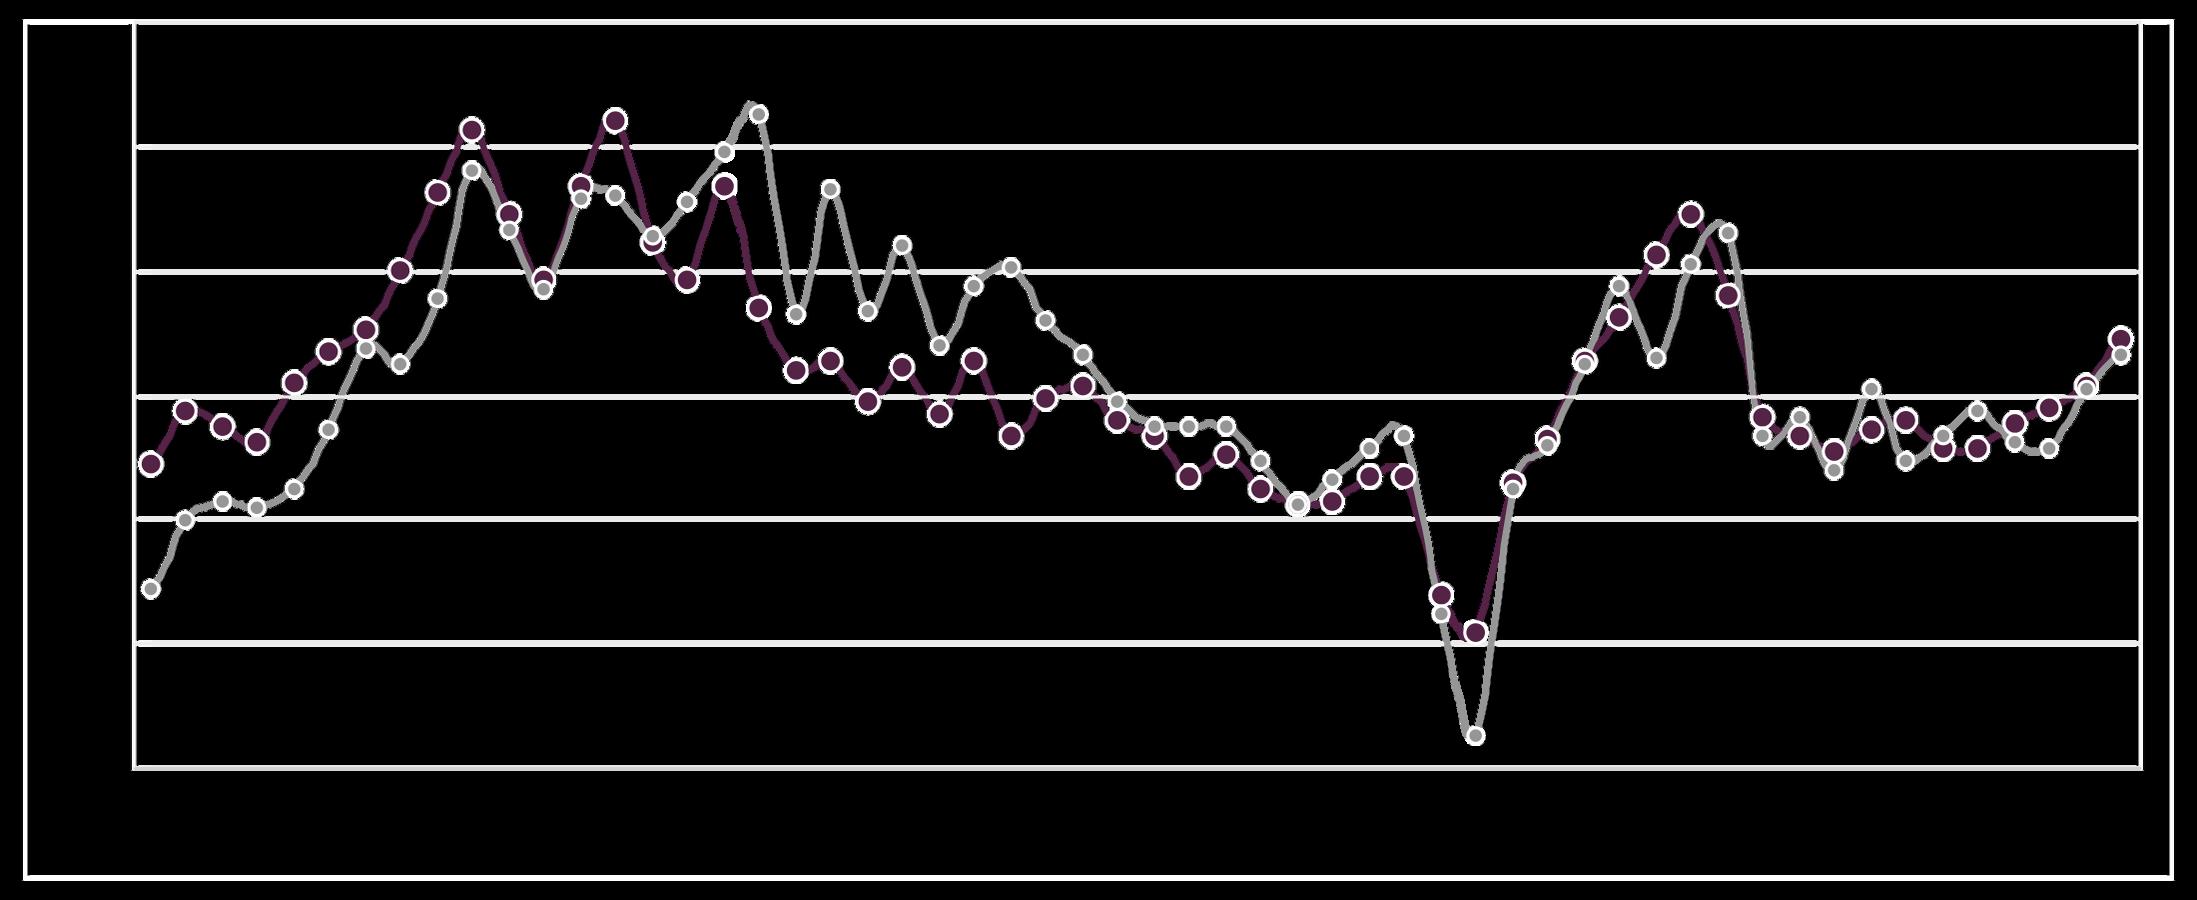
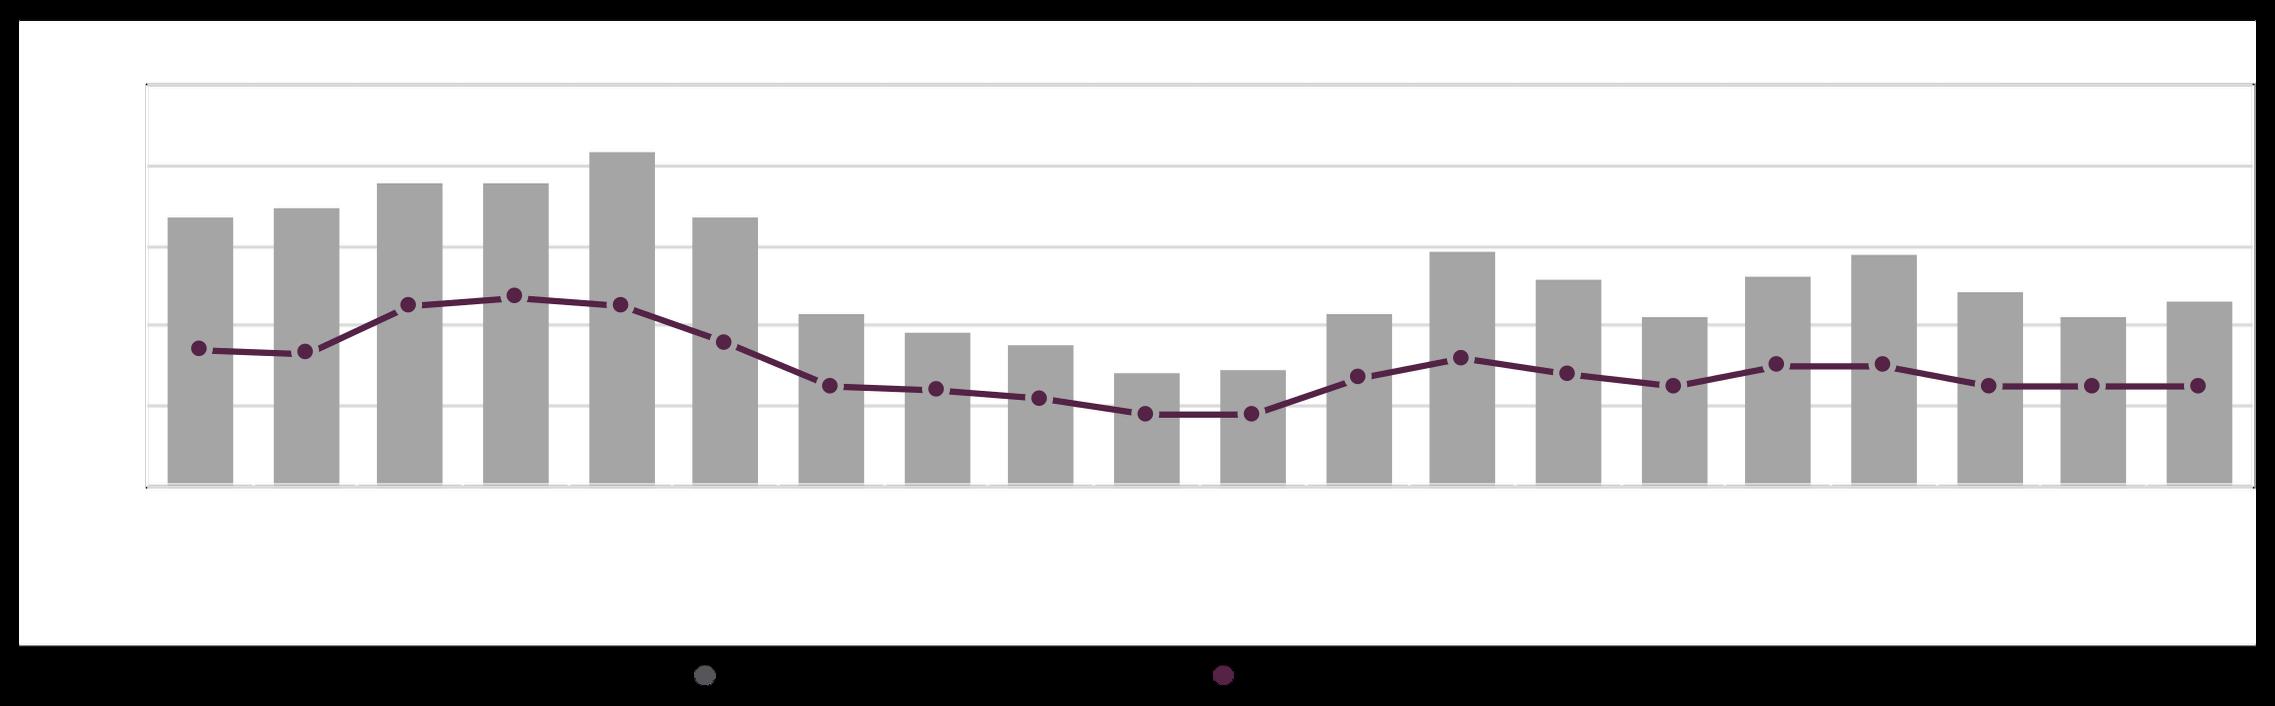
The Market Pulse, a seasonally adjusted ratio of demand to supply, measures market leverage and sentiment changes. A rising Pulse indicates a strengthening market, while a falling Pulse indicates a weakening market.
The current Market Pulse registers at 2 4, 3 9% higher than last year and 1 4% higher than last quarter, and is on an uptrend as tighter inventory combined with relatively stronger deal activity pushes this metric higher Since the center line represents a neutral, balanced market, the pulse suggests that real-time conditions are seeing leverage forces shift away from buyers and toward sellers as we close out the year The Manhattan markets are entering 2025 on an upswing

2,854 New listings in Q4
2,664 New Contracts in Q4

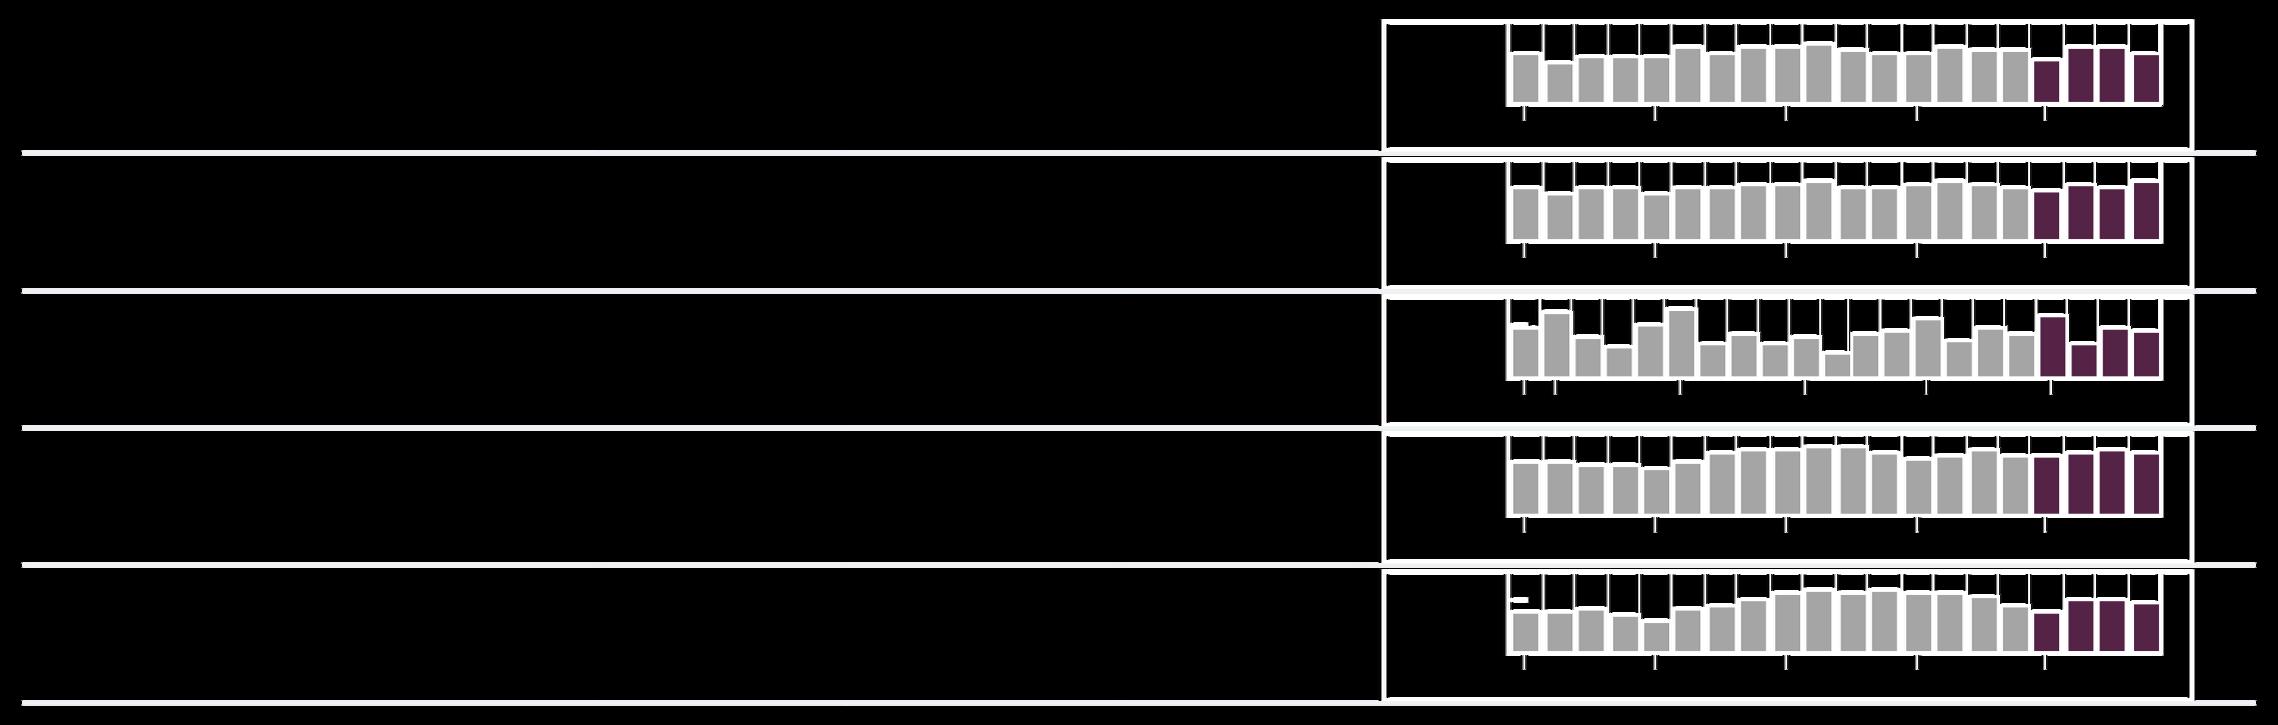

Median Sale Price Average Sales Price Median PPSF Median List Discount
on Market Market Share Median Sale Price Average Sales Price Median List Discount Days on Market Market Share

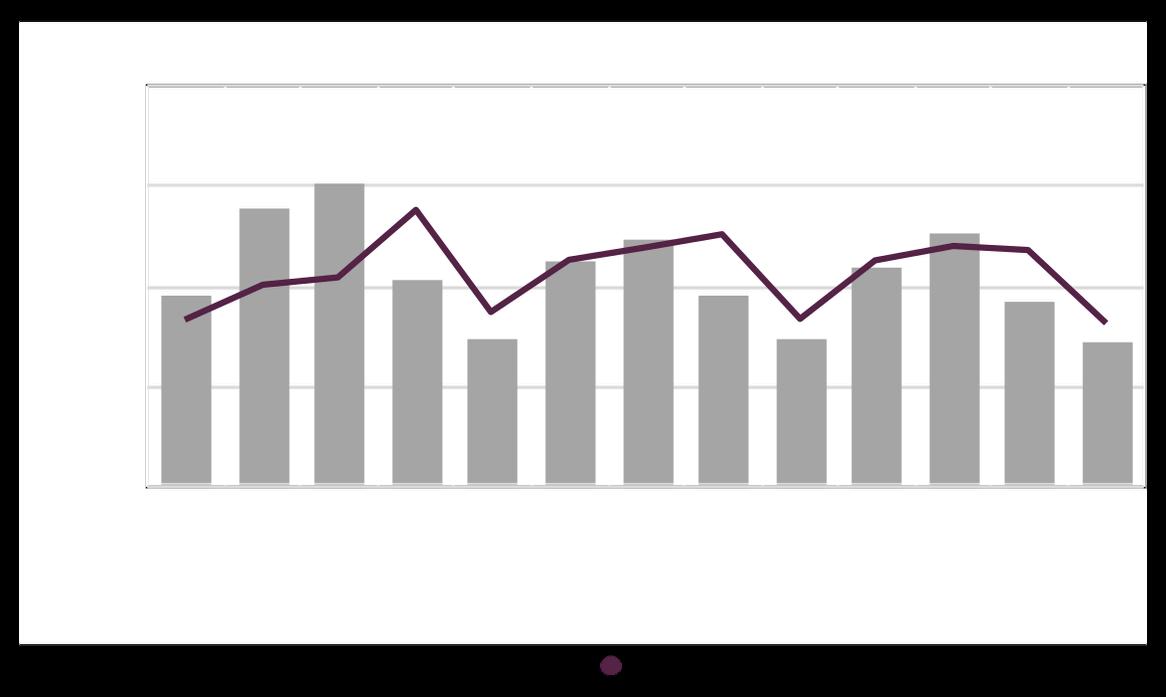
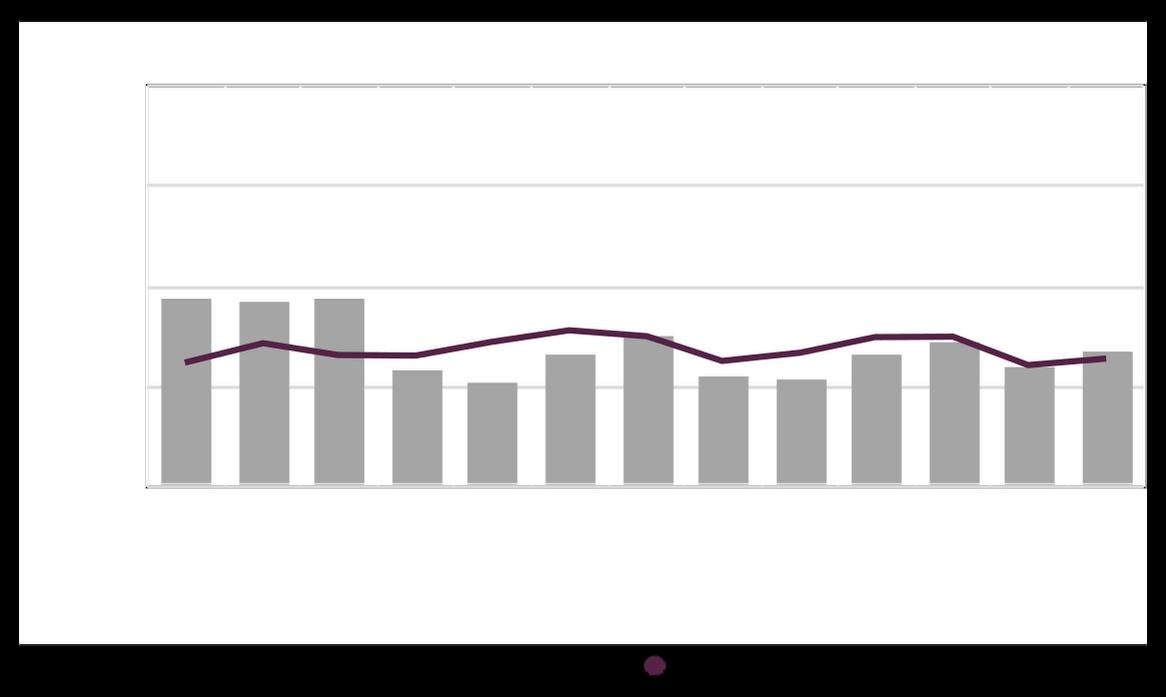
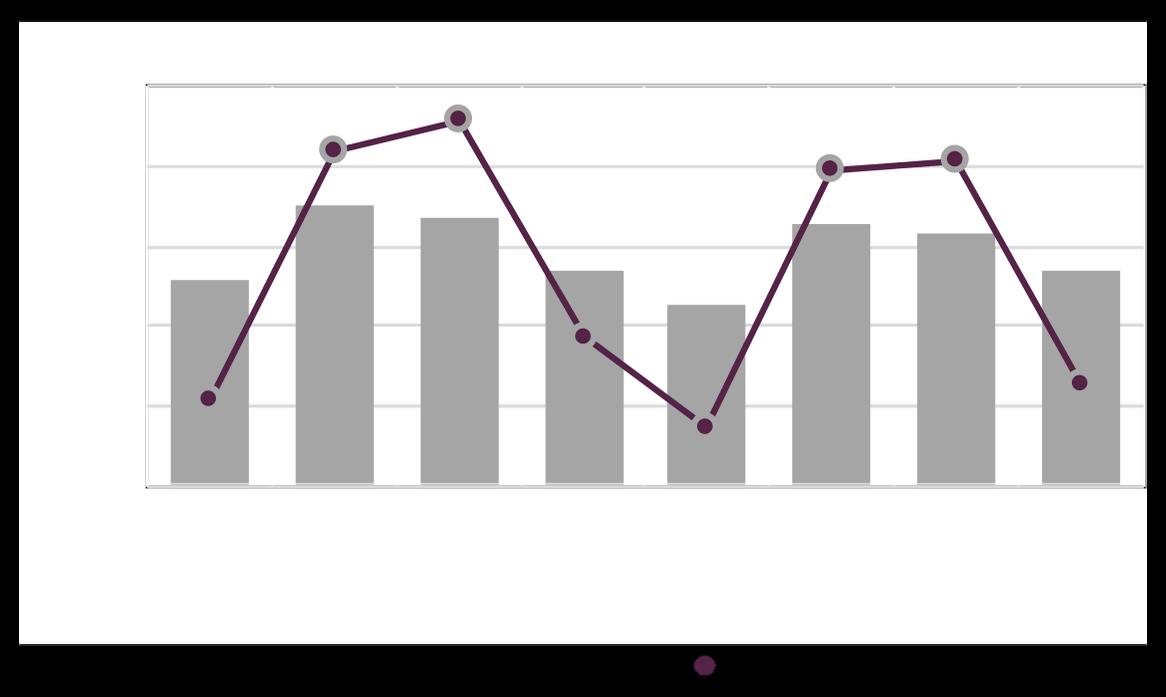
Breaking down the Market Pulse by property type, condos rose to 2.15, gaining 1.8 on the quarter and 4.3 over the year. This underscores the growing momentum in the condo market, which continues to lead the broader recovery. Co- ops also showed progress, rising to 1.6, up 1.5 from last quarter and 2.3 from last year.
This convergence suggests that both segments are strengthening, though condos remain at the forefront of the market's rebound. It also hints that the increasing buyer engagement seen in 2024 may be sustainable as the market transitions into 2025.

+4.3 year to date
+1 8 from last quarter +4 3 from last year

+2.3 year to date
+1 5 from last quarter +2 3 from last year


MEDIAN SALES PRICE
Calculated by taking the middle value of the subset that includes all relevant sales prices.
MEDIAN SALES PRICE PER SFT
Only calculated when size is available, this is the middle value of the subset that includes all relevant price per sft sales data
AVERAGE SALES PRICE
Calculated by adding all final sales prices and dividing the sum by the total number of properties
Calculated for sales that have listing information entered by the agent; more specifically, the contract date. This metric counts the number of days from first listing to contract signing. This report uses the median value of the subset that includes all relevant data.
Average of all previous values for the same point in time. Only goes back one extra year to what is visible in the chart
DISCOUNT FROM ORIGINAL ASK
The median percentage difference between the original asking price and the closed sales price
DISCOUNT FROM LAST ASK
The median percentage difference between the asking price at the time of signing and the closed sales price
MARKET PULSE
A ratio of pending sales to active inventory, rises when leverage is shifting to sellers. Falls when leverage is shifting to buyers.
This report was produced and authored by Berkshire Hathaway HomeServices New York Properties in partnership with UrbanDigs For questions please contact the Berkshire Hathaway HomeServices New York Properties Marketing Department at Contact@bhhsnyp.com or (212) 710-1900.
590
