8 minute read
Active versus passive


Arguments are being continually made as to whether active investing produces better returns than passive investing. S&P Dow Jones Indices director and Asia-Pacific head of index investment strategy Sue Lee, managing director and global head of index investment strategy Tim Edwards and index investment strategy director Davide Di Gioia provide quantified performance analysis.
The SPIVA Australia Scorecard measures the performance of actively managed funds relative to benchmarks over various time horizons, covering equity, real estate and bond funds, and provides statistics on outperformance rates, survivorship rates and fund performance dispersion. In the year-end 2023 edition, domestic equity funds in New Zealand are included for the first time.
2023 highlights
It was among the best of times and the worst of times for actively managed funds in 2023. In the Australian equity general category, more than three-quarters of active managers failed to keep up with the S&P/ASX 200, and a similar story was seen in the international equity general category. Meanwhile, active bond managers had an exceptional year, with almost three-quarters of Australian bond funds beating the S&P/ASX Australian Fixed Interest 0+ Index. Exhibit 1 summarises the results across all our reported categories.

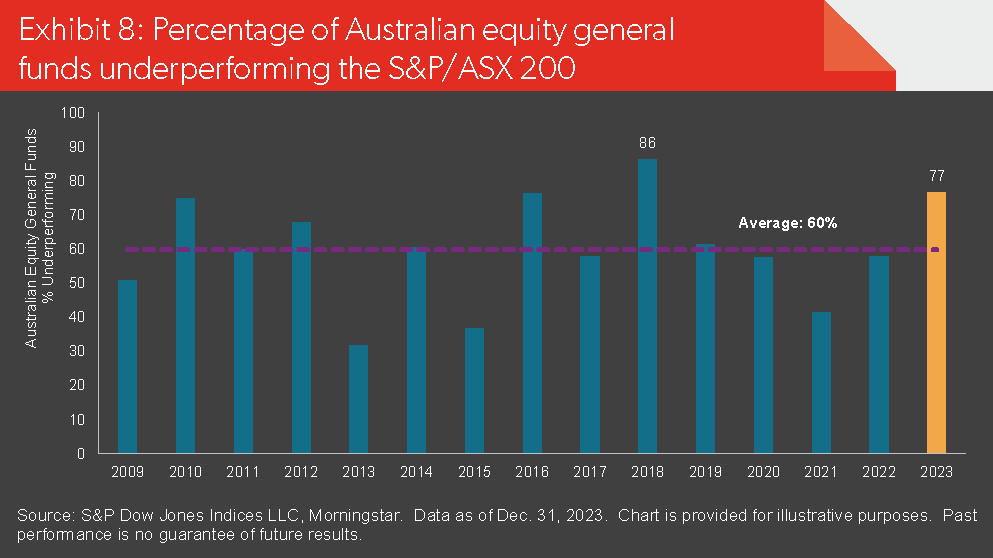
Australian equity general funds: The S&P/ ASX 200 ended the year up 12.4 per cent and Australian equity general funds struggled to keep up; the one-year underperformance rate of 77 per cent was the second highest in our records (see Exhibit 8). Longer term, underperformance rates were even higher, rising to 85 per cent of funds underperforming the benchmark over 15 years.
Australian equity mid and small-cap funds: The S&P/ASX Mid-Small Index gained 7.8 per cent in 2023 and a firm majority (64 per cent) of actively managed Australian equity mid and small-cap funds managed to beat it. Funds in the category gained 10.8 per cent and 13.0 per cent on an equal and asset-weighted average basis, respectively. More such years will be required to change the longer-term statistics, however, with 77 per cent of funds currently lagging over 10 years.
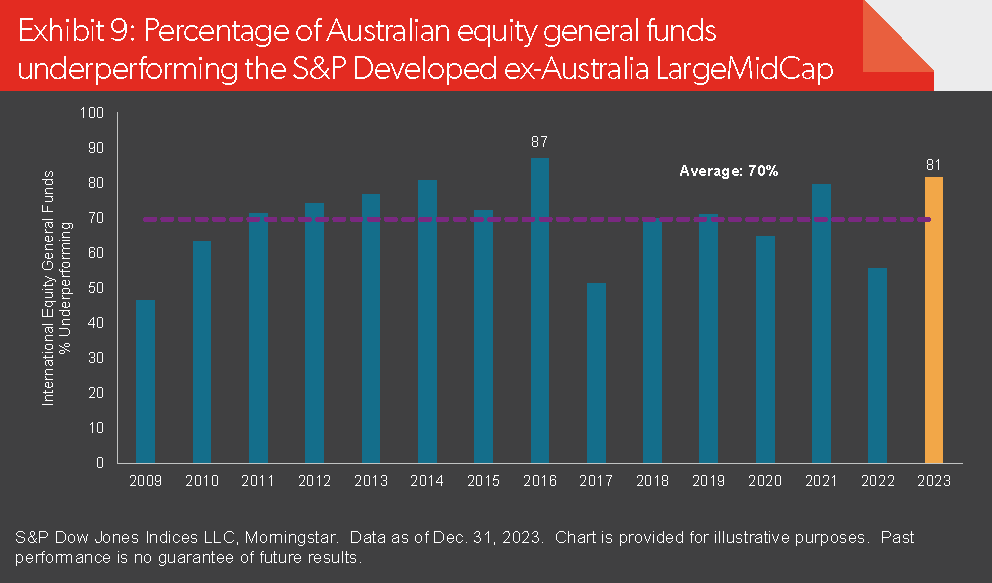
International equity general funds: International equity funds posted average 2023 returns of 20.3 per cent and 19.2 per cent on an equal and asset-weighted basis, respectively, with 81 per cent of funds trailing the S&P Developed ExAustralia LargeMidCap’s total return of 24.1 per cent. Over the 10 and 15-year horizons, around 94 per cent of funds underperformed.
Australian bonds funds: Active managers in the Australian bonds category posted their lowest one-year underperformance rate since the 2015 launch of the S&P/ASX Australian Fixed Interest 0+ Index, with just 26 per cent of funds lagging the index. The longer-term record was also better relative to other categories, with 56 per cent and 46 per cent underperforming over the three and five-year periods, respectively.
Australian equity AREIT funds: After a challenging start to the year, active managers in the Australian equity Australian real estate investment trust (AREIT) category improved their underperformance rate to 69 per cent over the full year. Over the 15-year period, 80 per cent of active funds underperformed.
New Zealand domestic equity funds: Over the one-year period, actively managed funds in the New Zealand domestic equity category gained 4.8 per cent and 5.1 per cent on an equal and asset-weighted basis, compared to a 3.5 per cent gross return with imputation for the S&P/NZX 50 Index. Within this category, 54 per cent of active funds outperformed over one year, but just 23 per cent outperformed over the 15-year period.
Fund survivorship: Liquidation rates for most active fund categories were moderate in 2023. International equity general funds recorded the highest liquidation rate at 7.7 per cent. In contrast, none of the New Zealand domestic equity funds were liquidated, while only 1.3 per cent of Australian equity mid and smallcap funds failed to survive. The attrition rate increased over longer time horizons, with 57 per cent of funds across all categories merged or liquidated over the 15-year period.
Market context
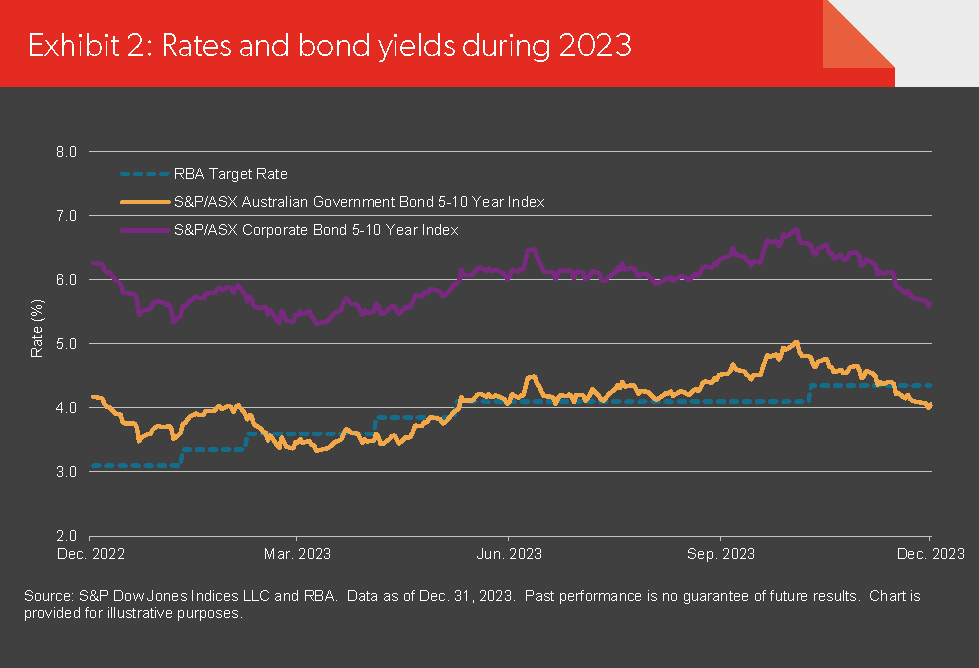
In 2023, as in many previous years, central bank policy decisions domestically and abroad dictated much of the market sentiment. The Reserve Bank of Australia increased its target rate five times during the year, while fluctuating long-term inflation and economic expectations sent longer-dated government bond yields lower, then higher, before they ended the year close to where they began. Credit spreads moved mildly lower, with the spread between the S&P/ASX Australian Government Bond 5 to 10 Year Index and S&P/ASX Corporate Bond 5 to 10 Year Index falling from 209 basis points to 159 basis points over the year (see Exhibit 2).
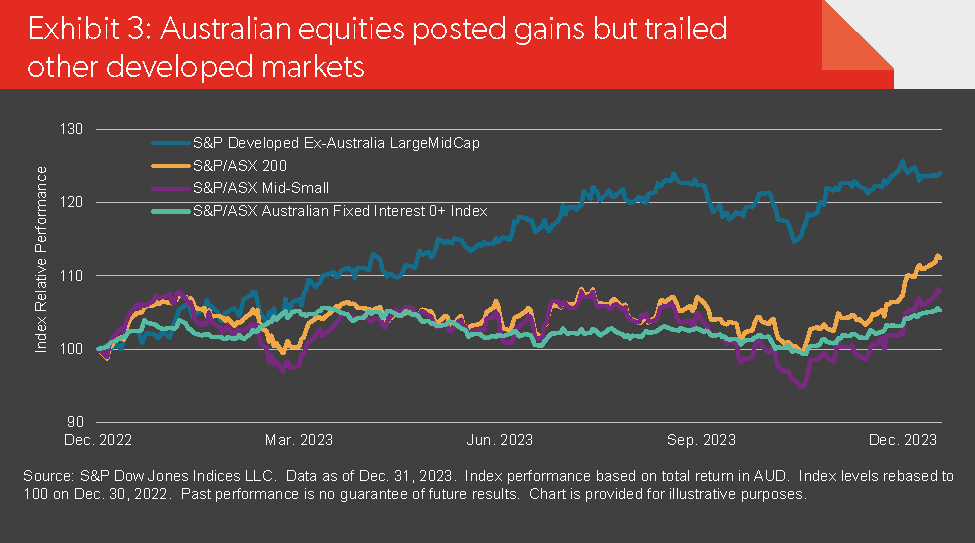
Australian equities see-sawed over the year. Despite having a flat return as late as October, the fall in longer-dated bond yields in the final two months of the year accompanied a ‘risk on’ dynamic that drove Australian equities into doubledigit gains; the S&P/ASX 200 finished the year with a total return of 12.4 per cent. Global equities had more consistent gains through the year, with the S&P Developed Ex-Australia LargeMidCap posting a total return of 24.1 per cent (in A$) (see Exhibit 3).
Sectors played an important role in driving performance, with information technology contributing almost half of the developed benchmark’s gains. In Australia, equities experienced noticeable rotations among sectors from the prior year: information technology and consumer discretionary were the bestperforming sectors, with gains of 31 per cent and 22 per cent in 2023 contrasting with losses of 34 per cent and 20 per cent in 2022, respectively. Meanwhile, energy and utilities, which had strong gains of 49 per cent and 30 per cent in 2022, respectively, barely remained in positive territory in 2023 (see Exhibit 4).

Dispersion, which measures the opportunity set for active outperformance via stock, sector or country selection, fell in the second half of 2023 in both domestic and international equity markets. The 12-month trailing S&P/ASX 200 sector and stock-level dispersion fell to levels unseen since December 2018, while there was a notable decline in country-level dispersion within the S&P Developed ExAustralia LargeMidCap (see Exhibit 5).
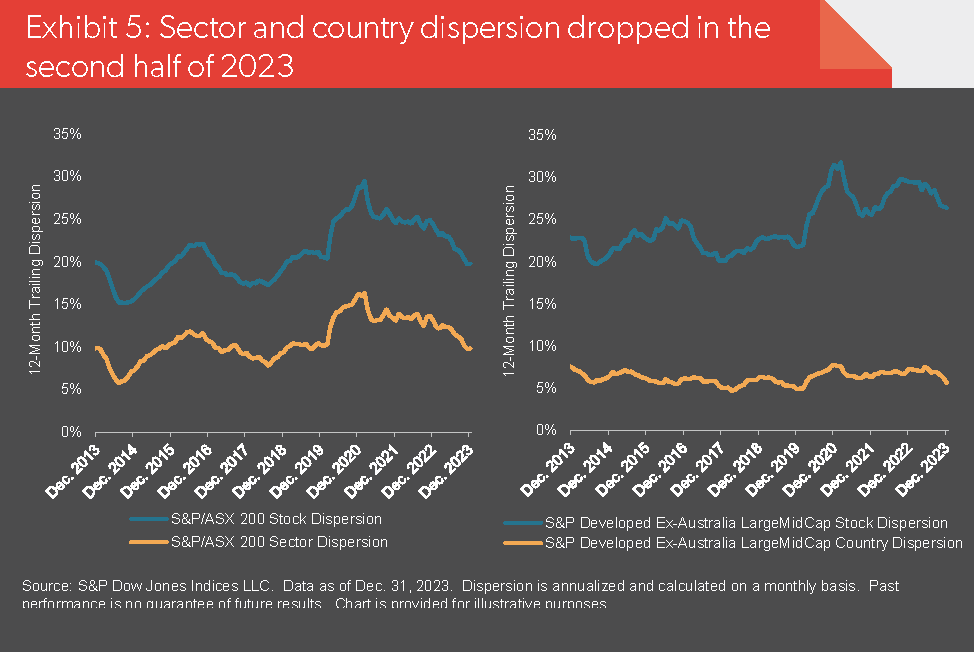
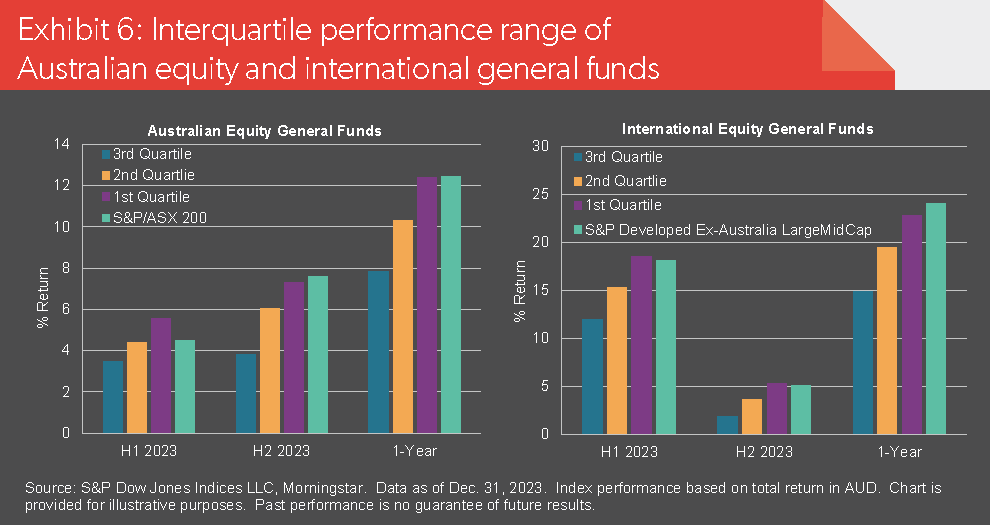
Exhibit 6 illustrates a narrowing of active fund performance that occurred in the Australian equity general category in 2023 and, during the second half of the year, in the international equity general category, via the interquartile performance within each category. In both categories, over the full year, even top-quartile performance was not necessarily sufficient to match the benchmark’s return.
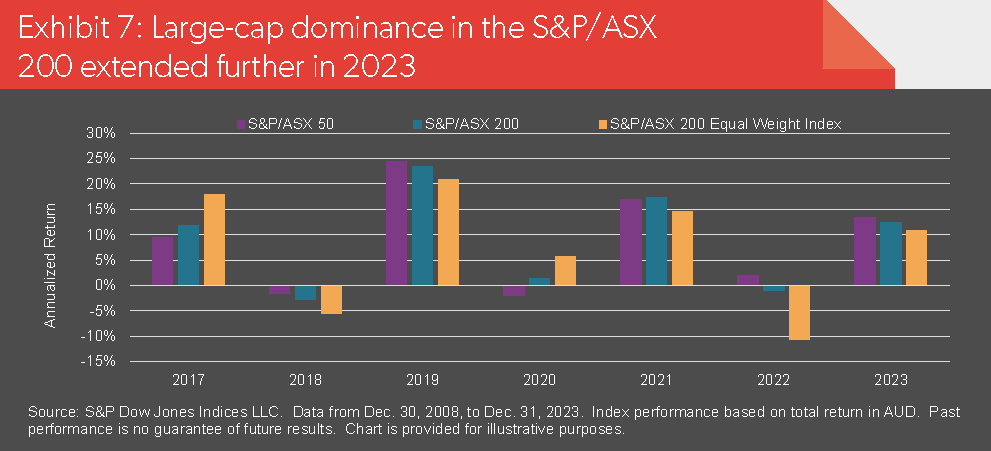
Another notable trend was the outperformance of the very largest Australian stocks. In 2023, the mega-cap S&P/ASX 50 outperformed the S&P/ ASX Mid-Small by 7.0 per cent, while concurrently the S&P/ASX 200 Equal Weight Index, which has a small-cap tilt relative to the S&P/ASX 200, extended its underperformance to a third consecutive year (see Exhibit 7). This indicates challenges for the Australian large-cap active equity managers that sought opportunities outside of the stocks most heavily weighted in the capitalisationweighted S&P/ASX 200.
Against this challenging backdrop, Australian large-cap equity active managers suffered their second-worst underperformance rate since 2009, much worse than their long-term average of 60 per cent (see Exhibit 8). Similarly, 81 per cent of active managers in the international equity general category underperformed the benchmark, also the second-worst result since 2009 and compared to a long-term average of 70 per cent (see Exhibit 9).
In the fixed income markets, the winds appear to have been more favourable for active managers, particularly those taking on a little more duration or a little more credit risk than their category benchmark. Credit spreads narrowed over the year, while longer-dated bonds generally outperformed shorter-dated bonds. Active fund managers appear to have been well positioned for these trends, with nearly three-quarters (74 per cent) of funds in the Australian bonds category outperforming the S&P/ASX Australian Fixed Interest 0+ Index in 2023. Offering a historical perspective on the impact of credit trends on the fixed income active fund performance rates reported in our Australia scorecard, Exhibit 10 shows that over the past nine years, the annual underperformance rate was generally lower in years with narrowing credit spreads.