17 minute read
The Effects of Aging on Inflation, Andrew Stone


The Effect of Aging Populations on Inflation
Andrew Stone*
Abstract:
This research uses panel data of 66 high and middle income countries to examine the inflation effects of demographics. The primary objective of this research is to show that consumer prices change based on the amount of retired persons in a nation. The double log model used in this paper also includes interest rates and uses data from 1991-2007 in order to demonstrate the most recent demographic shifts. The results showing inflationary pressure coming from young retirees compliment the Modigliani life-cycle hypothesis that this age group consists of net consumers, while the deflationary pressures provided by the working aged population justifies their placement in the category of net savers.
JEL Classification: E31, J10 Keywords: Inflation, Age, Demography
* Bachelor of Science in Business Administration: Economics, Bryant University, 1150 Douglas Pike, Smithfield, RI 02917. Phone: (413) 230-4456 Email: astone1@bryant.edu
The author thanks The World Bank and United States Census Bureau for providing data and gratefully acknowledges the encouragement and guidance from Dr. Ramesh Mohan, Professor of Economics, Bryant University.
1.0 INTRODUCTION
As the baby boomer generation begins to age, the United States and other governments
across the globe have begun worrying about the impact of the population being largely elderly.
Social programs are usually the first cause of concern; these programs increase government
spending by billions as the elderly population increases just slightly. This research aims to ask
the question, should central banks also worry about the aging population as they try to implement
monetary policy? After all, the wealth we acquire as humans can only take us so far, and must be
either spent or inherited at death. In addition, there comes a time when working becomes
impossible, but spending is still necessary, causing the elderly to be net consumers. These two
realizations lead to the conclusion that inflation should increase as the elderly share of the
population increase.
This study looks into this issue through an ordinary least squares regression analysis for
66 high and middle income nations. The regression compares the inflation as measured by
consumer prices over time with the age groups present in their populations. The aim of the
research is to show that inflation rates are correlated to the amount of the population that is made
up of net consumers, and that this group is primarily individuals older than 65. Unlike previous
studies, this research will also include interest rates and their affects on inflation into the analysis.
This inclusion may allow researchers to find that the age of a population does not matter, but
instead that fluctuation in interest rates cause inflation.
The organization of this paper seeks to point out the theoretical background of
demographic effects on macroeconomic variables and then explain the recent literature relating
to these demographic effects on inflation. The empirical model is then outlined and the results
from the data analysis are presented to show how age has affected inflation over the past two
decades. Finally, the implications of this study as it relates to future monetary policy for
developed nations are explored.
2.0 TRENDS
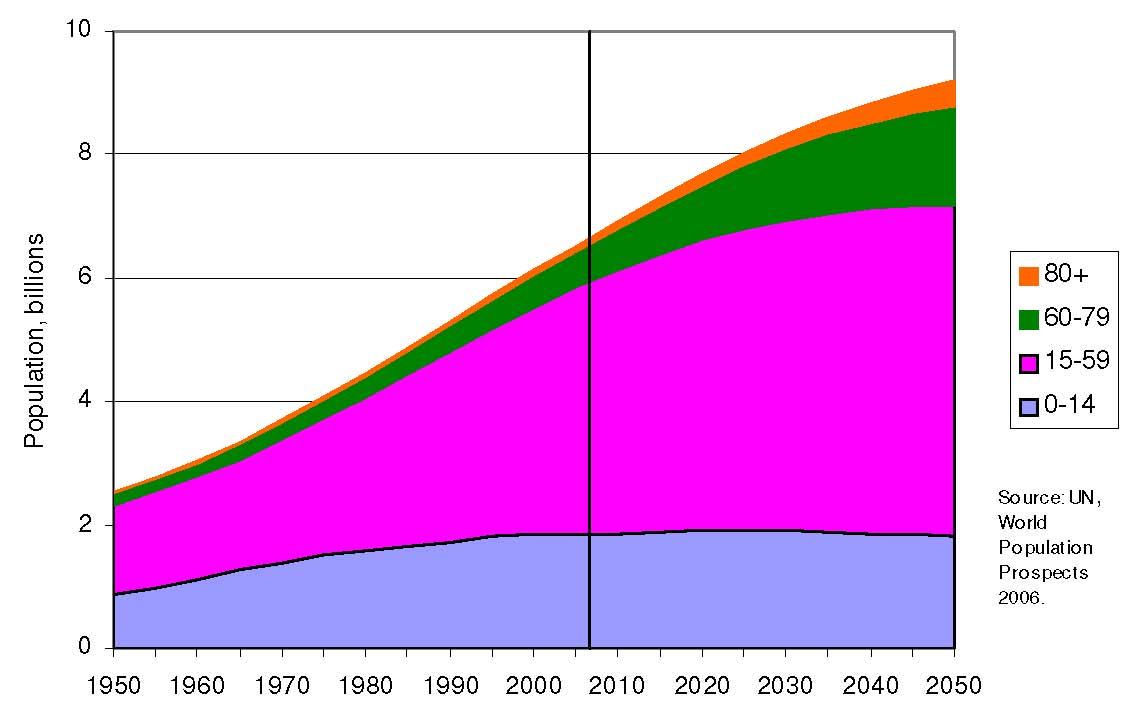
Figure 1: World Population by Age Shares
Demographic shifts play a very large role in economic vitality due to the different impact
each age group has on the market. A shift from a large middle age population to a large elderly
population will create a much different economy resulting from varying behaviors and
production capabilities. The world is currently undergoing an increase in elderly population as
evidence by Figure 1. This figure also shows that this shift will continue into the future as life
expectancies increase due to better medical technologies. The effects of this shift are two-fold.
First, the shift has large demand-side effects because of the changes in consumption behavior
that occur when an individual hits retirement age. Second, the supply-side of the market is
affected as retirement signals the end of productive life that begins when an individual decides to
retire.
Modigliani and Brumberg’s (1954) life-cycle hypothesis states that an individual’s
consumption and savings needs to be carried out over a lifetime and will therefore influence that
individual’s actions. Based on this principle, we should expect to see working aged people (those
aged 24-65) become net savers in order to prepare for their necessary consumption in retirement.
Using demand-side analysis of this issue, the economy should then see downward price pressure
from an increase in savings when the group of working age citizens is largest. Using the life-
cycle hypothesis we can see that the spike in working aged citizens has suppressed inflationary
pressures in the economy. As the population ages, as we will see in the future, and the percentage
of net savers in an economy begins to fall, inflationary pressures are expected to return and begin
pushing prices up.
The supply side effects of demography shifts involve the assumptions of the productivity
of the working aged population. Here, it is assumed that older working aged individuals (those
aged 45-64) have gained valuable experience and are able to produce more with the same
amount of inputs. Therefore, an increase in this population should lead to more supply in an
economy, which allows the economy to meet the demand for goods at a lower price. Once again,
inflationary pressures have disappeared with the appearance of a large working population.
However, once this population moves into retirement their productivity disappears and the
supply diminishes, reinstating the inflationary pressures. Both of these theoretical frameworks
indicate that inflationary pressures will occur in an economy with a large non-working
population. However, because non-workers are typically defined to be anyone under the age of
24 or over 65, it should be specified that non-workers under 24 typically consume much less than
the elderly due to lower health care costs and the absence of life savings. Thus, inflationary
pressures are much greater from those aged 65 or older.
3.0 LITERATURE REVIEW
Many studies have been done on demography shifts with respect to macroeconomic
indicators in recent years as economists have come to realize the significance of the baby boomer
generation. Bloom et al. (2008) predict that the shift in age structure that will occur over the next
half century will not lower GDP growth per capita. Their research attempts to replace the
misconceptions on age structure and labor force participation rate and show that aging
populations will not decrease this rate enough to cause structural shifts in productivity growth.
Faruqee (2002) analyzes the large aging populations of the U.S and Japan and claims that this
demographic shift will have large macroeconomic implications, most notably a current account
deficit stemming from social security outlays. Additionally, Faruqee predicts a decrease in per
capita income as effective labor decreases due to this large elderly population. Navaneetham
(2002) uses a study of South Asian nations to view the effect of age on GDP per capita growth
rates and finds mixed results for the age shares under 50. However, the age share of the
population 50-64 years shows a significant positive result with respect to GDP per capita growth
rate. He indicates that these results likely come from the experience and productivity of workers
in this age group. He finds in Singapore that the age group 65 years and older has a negative
effect on GDP per capita growth, but has a positive effect in the Philippines. These mixed results
may indicate that elderly age groups are more productive in some economies than in others.
The specific research in the inflation category has been less common, but influential
nonetheless. Bruer (2002) finds that Swedish inflation is closely related to that country’s age
structure, placing a large pressure on Swedish economic policies in the coming years. Farvaque
et al. (2006) also find results in OECD countries indicating that populations aged 64-75 have a
significantly inflationary pressure on an economy. Additionally, due to the large share of
working age populations in these nations, these researchers also find that central bank
independence has not been the primary factor in keeping inflation rates low, but instead find this
effect comes from the deflationary pressures of large working age populations. Lindh and
Malmberg (2000) find that the age structure in OECD countries has a significant impact on
inflation. Precisely, that net savers aged 64 and younger reduce inflationary pressures on an
economy, while those aged 65-74 increase the inflationary pressures in an economy. The study
discussed in this paper closely follows the Lindh and Malmberg model.
4.0 EMPIRICAL METHODOLOGY
4.1 Regression Model
The regression model used here is based largely off that of Lindh and Malmberg (2000)
where age structure is broken up into categories resembling the consumption trends of the life-
cycle hypothesis. These structures are able to model the effects on inflation of youth
consumption (ages 0-14), young adult consumption (ages 15-29), working age consumption
(ages 30-44), experienced worker consumption (ages 45-64), young retiree consumption (ages
65-74) and elderly consumption (ages 75 +). The double log model used is able to smooth out
business cycle trends in inflation that are not pertinent to the analysis and provide an accurate
estimation of demographic changes on inflation. Additionally, inflation (lnCPI) is measured by a
consumer price index where prices for the year 2000 is the base value in each case. The panel
data provides 1207 observations for 66 countries from the years 1991-2007.
The regression model is as follows:
lnCPI = β0+β1lnCPIt-1 + β2IntRate +
β3Age1 + β4Age2 + β5Age3 + β6Age4 + β7Age5 + β8Age6+ε
where the Age variables (1-6) are the natural logs of the amount of the population in that age
division. Age1 consists of ages 0-14, Age2 ages 15-29, Age3 ages 30-44, Age 4 ages 45-64,
Age5 ages 65-74 and Age6 ages 75 and above. The independent variable lnCPIt-1 is a lagged
variable of inflation that uses the natural log of the price index from the previous year. Some past
research (Gali and Gertler, 1999) has indicated that lagged inflation may not be effective past
one quarter, however the data available for this research is in annual increments and captures the
inflation rates for each quarter in aggregate. In this manner, inflation for the previous period
continues to be a relevant variable for the current period’s inflation according to the sticky price
model of the New-Keynesian Phillips Curve.
All variables use a log form of their respective values with the exception of interest rates
(IntRate) which fluctuate largely in response to perceived business cycles of an economy and are
therefore a large cause of inflation in the short term. By estimating the model in this way, the
short term variables affecting inflation have been fully represented in interest rates or eliminated
in the natural log values of the additional independent values.
There is some evidence that this model may contain a large amount of multicollinearity
between the age groups inside a nation’s population (Lindh and Malmberg, 2000), specifically
resulting from the dependency of the consumption of the youth population on that of the older
populations. The tests used by previous research proves the logical reasoning that youth
populations have no income stream and are therefore dependent on their working parents to fund
their consumption behavior. The exclusion of Age1 from the model helps to strengthen this
regression, leaving the model to appear as so:
lnCPI = β0+β1lnCPIt-1 + β2IntRate + β4Age2 + β5Age3 + β6Age4 + β7Age5 + β8Age6+ε
4.2 Data
The data attained for consumer prices and interest rates is from the World Banks’ World
Development Indicators (WDI) data set and includes data for the time period 1991-2007. The
population data that has been split into the corresponding age groups by the researcher comes
from the U.S. Census Bureau’s International Data Base (IDB).
5.0 EMPIRICAL RESULTS
Table 1: Expected Sign
Independent VariableExpected Sign
lnCPIt-1 +
IntRate -
Age2 +/-
Age3 +/-
Age4 -
Age5 +
Age6 +
The expected signs from this regression have been already been briefly mentioned and
are shown in Table 1 but should be emphasized here as their estimates are provided. The
independent variable lnCPIt-1 is expected to provide a positive sign as the rise in price from
consumer goods in one year carry over to raise the prices of other consumer goods in the
following period. In order to battle this inflation central banks use their control over monetary
policy and attempt to maintain consumer prices. One tool at their disposal is the interest rate,
which the banks raise to attract savings rather than consumption in an economy. Thus, we expect
inflation to fall as interest rates rise, providing a negative sign for the coefficients of interest rates.
Demographic shifts within a nation have been shown to affect inflation rates with respect
to the consumption patterns of individuals. This research is especially concerned with the
inflationary trends expected from retirees. Therefore, the expectation is that working age
populations (Age4 in this model) will have negative relationships with inflation, while retired
age populations (Age5 and Age6) will have positive coefficients. Lindh and Malmberg (2000)
and Farvaque et al. (2006) recognized the effect of younger citizens (Age1, Age2, Age3) on
inflation as being relatively insignificant, with no consistent sign.
Table 2: Regression Results
Independent Variable Coefficient (Standard Error)
lnCPIt-1 .8055*** (.0058)
IntRate -.0017*** (.00016)
Age2
Age3 -.0158 (.0240) -.0431 (.0394)
Age4
Age5
-.0039 (.0465) .1681*** (.0417)
Age6 -.1021*** (.0245)
Β0 .4206*** (.0262)
Adjusted R-squared: .9583 ***, ** and * denote significance at the 1, 5 and 10% level respectively
The results of this research are provided in Table 2 and offer very little departure from
previous research. This is able to show that time and country specific variables have very little
effect on inflation and it is instead demographic composition within a nation that affects its
inflationary pressures. Because of this, the results hardly differ from previous research even
though two different decades and a large set of countries are used. The expected signs are found
for both the interest rate variables and lagged inflation variables, granting further evidence to
their contributions to inflation levels in a country. The expected sign is also found for the young
retiree variable (Age5) which demonstrates that young retirees are participating as net consumers
following their exit from the workforce. One deviation from expectation is the coefficient value
for the elderly population (Age6), which appeared negative. This was somewhat unexpected,
however not an isolated incident in research of this type. Studies from both Lindh and Malmberg,
(2000) and Farvaque et al. (2006) found the same effects from this segment of the population.
This coefficient seems to contend that consumption is low from this part of the population and
that this group is creating deflationary pressures on the economy. Reasons for this sign change
have been explored in terms of the retirement-consumption puzzle (Smith, 2004) indicating that
retirees do not plan accordingly for the significant decrease in income upon retirement and are
therefore forced to scale back their consumption patterns. However, that theory provides an
explanation for decreased consumption upon retirement, which this study rejects based on
inflationary pressures coming from the newly retired age group. Therefore, the retirement
consumption puzzle may actually affect those aged beyond retirement who have expended much
of their private retirement savings. This depletion of funds subsequently causes older retirees
aged beyond 75 to cut back on consumption in order to maintain financial safety. Additionally,
elderly persons often find themselves unable to take care of themselves or enjoy a consumption-
friendly lifestyle, resulting in excessive payments to health care providers. This would indicate
that the basket of goods used for CPI in this regression would not best represent retirees over the
age of 75 who purchase a much different basket of goods, including nursing care, medical
supplies and prescriptions.
The coefficients of the middle aged populations were ambiguous and showed no
significance to the effects of inflation in this model. Explanations for this may include large
differences in consumption patterns displayed by each individual within these groups. After all,
these segments are the largest percentage of the population and are comprised of many different
types of individuals. Some individuals within this group earn high incomes and save
proportionally large amounts while some earn high incomes and spend large amounts. The same
holds true for those earning low incomes. Thus, the net effects of all of these combined seem to
be insignificant within the inflation framework. Still, the regression model has been able to
explain 95% of the data as measured by its adjusted R-squared value, indicating that inflation’s
computation may come largely from demographic effects and government monetary policy.
6.0 POLICY IMPLICATIONS
This research has pointed out that the monetary policy from these governments, as measured
by the interest rate, has a significant impact on the amount of inflation in an economy. For this
reason, inflation targeting policies have been introduced by many central banks as the key
indication of their success. However, the research has also shown that demographics can upset
the inflation rates in an economy through a population reaching retirement age. So, if the health
of the elderly population increases and we see consumption patterns begin changing due to a
continuation of active lifestyles, inflationary pressures may arise from a larger segment of the
population. For example, the group aged 75+ is currently helping bring deflation, but with the
advent of new medical technology this group may be reduced to only those aged 80+. Therefore
central banks need to be aware of demographic trends as they relate to inflation if these banks
wish to remain in control of their inflation targeting policies.
Viewing this research through a social lens, one sees a disparity in the inflation pressures
of the age groups separated in the research. As previously mentioned, we should observe
deflationary pressures from the experienced working age group as they increase their savings to
prepare for retirement. However, we see their effect on inflation as insignificant, a possible
problem due to economic inefficiencies in the economy, where this age group is being enticed to
spend rather than save. Much of this could be due to social programs (such as Social Security
and Medicare in the United States) which supplement income and benefits for the retired.
Therefore, rather than save on their own, retired persons are able to count on taxpayers to pay for
their retirement living. Does Social Security contribute to inflation? This fundamental question is
not the goal of this research, but directly relates to the policy decisions stemming from this
research and should be asked by policy makers.
7.0 CONCLUSION
The goal of this study was to show the impact of demography on inflation among high
and middle income countries through a time frame that had not previously been studied. The
results of this research found very similar inflationary effects as the past studies, namely that
those recently entering into retirement (aged 65-74) create great inflationary pressures into the
economy as their consumption stream outweighs their earned income potential during that time.
Also, the very elderly (aged 75+) contribute deflationary effects into the economy from inactive
lifestyles and lower consumption streams. However, the largest effects on inflation come from
interest rates and the inflation of the period prior as consumer prices rise to meet an equilibrium
demand. These results indicate that the economic forces led by the baby boomer generation
currently reaching retirement may be very different than anything previously seen.
BIBLIOGRAPHY
Bloom, D., Canning, D. and Fink, G. (2008) “Population Aging and Economic Growth” Program on the Global Demography of Aging, Available at: http://www.hsph.harvard.edu/pgda/Working%20Papers/2008/PGDA_WP_31.pdf
Bruer, M. (2002) “Can Demography Improve inflation Forecasts? The Case of Sweden” Uppsala University Working Papers, Available at: http://www.nek.uu.se/pdf/wp2002_4.pdf
Faruqee, H. (2002) “Population Aging and Its Macroeconomic Implications: A Framework for Analysis” International Monetary Fund, Available at: http://www.imf.org/external/pubs/ft/wp/2002/wp0216.pdf
Farvaque, E., Hericourt, J., and Lagadec, G. (2006) “You Have To Be Old To Be Wise: Inflation, Demographic Trends and Central Bank Independence” Available at: http://mpra.ub.uni-muenchen.de/13076/
Lindh, T. and Malmberg, B., (2000) “Can Age Structure Forecast Inflation?” Journal of Economics and Business 52: 31-49.
Modigliani and Brumberg, (1954) "Utility Analysis and the Consumption Function: An Interpretation of Cross-Section Data," Post-Keynesian Economics. 383—436.
Navaneetham, K., (2002) “Age Structural transition and Economic Growth: Evidence from South and Southeast Asia” Centre for Development Studies, Available at: http://www.cds.edu/download_files/337.pdf
Smith, Sarah (2004) “Can the Retirement Consumption Puzzle Be Resolved? Evidence From UK Panel Data” The Institute for Fiscal Studies, Available at http://www.ifs.org.uk/wps/wp0407.pdf


