22 minute read
The Relationship Between Housing Prices and Macroeconomic Factors in Spain, Garret Fitzgerald


The Relationship between Housing Prices and Macroeconomic Factors in Spain
Garrett Fitzgerald1
This paper examines the effects of certain macroeconomic variables (i.e mortgages, inflation, and employment) on the price of houses in Spain. An error correction vector autoregressive (ECVAR) model is used to model the impact of the macroeconomic variables on real housing prices. Variance decompositions will be analyzed to determine the extent to which these variables have an effect on housing prices in Spain.
JEL classification: E32; R20; G00; G11
Keywords: housing, Spain, inflation, employment, mortgages
1 Bryant University, 1150 Douglas Pike, Smithfield, RI 02917. Phone (413) 586-2529, Email: gfitzger@bryant.edu
The author would like to thank Dr. Ramesh Mohan, Department of Economics, Bryant University, for aiding in the development of this paper.
1.0 INTRODUCTION
The aim of this paper is to take several macroeconomic variables (interest rates, employment, and inflation) and model the impact of these variables on real housing prices in
Spain. The goal is to examine the relationship between these variables and analyze any interesting indications, to use empirical tests to support basic economy theory surrounding the relationships between the variables and provide policy implications. This subject is important because the entire world is now in the throes of recession due to the burst of a global asset bubble. With many financial institutions reeling from losses due to risky loans to home borrowers, it may be helpful to analyze the world’s most extreme housing scenario: the Spanish housing bubble. The Spanish housing bubble is different in many regards from the United States housing bubble. In Spain, housing is the dominant and most widely held asset, and is a substantial portion of the country’s GDP. Spanish housing data has been criticized for being unreliable and biased, so this analysis will discover whether the data can hold up to a series of tests and produce results that make sense. Readers will learn of the various events leading up to and after the bust of the Spanish property bubble and may be able to draw important implications from such analysis. The remainder of the paper is organized as follows: Section 2 will present a review of literature, Section 3 presents the empirical analysis and results, and Section 4 will provide a conclusion and policy implications.
2.0 TREND
The Spanish economy has experienced robust growth since the mid-1990s which has mainly attributed to the housing sector. From 1995 to 2008, Spanish housing prices have risen 190%, making the U.S housing market pale in comparison (Desmond, 2008). From 1999 to 2005, prices for apartments and houses accelerated at an annual rate of 15% in Spain. The housing market has been integral component of the Spanish economy. Housing related industries compose 20% of the economy in Spain, as opposed to 10% in the U.S (Wharton, 2007).
Spain has one of the highest rates of homeownership in the world at approximately 80%, higher than the estimated 67.8% homeownership rate in the United States. 1 Adding to this, the
1 2005 Spanish Survey of Housing Finances. http://www.bde.es/informes/be/ocasional/do0810e.pdf
Spanish tax and legal system favor homeownership. Eviction is often an expensive and slow process for owners.
Much of the lending done in Spain is related to the housing sector. According to Martinez (2008), 60 percent of the credit granted to the private sector residents is related to the activity in the real estate sector. Housing is the most important asset held by households, representing 66.1% of the total value of households’ real assets and 58.9% of the total value of all their assets.
There are several unique characteristics of the Spanish housing bubble which are important to note. Robust housing price appreciation was coincidental with equally robust increases in housing supply; between 2000 and 2007, homes built averaged 600,000 annually, a number which exceeded the annual figures for Germany, France, the U.K and Italy combined. Also, adjustable (i.e, variable) rate mortgages (ARM) account for nearly all of the stock of mortgages (approximately 98%). This may be due to the expectations of low interest rates for the future due to the primary objective of the European Central Bank to fight inflation and bank’s credibility for doing so. Also to note, home equity withdrawals are a rare occurrences in Spain. In contrast to the United States, Spain was relatively secure from the wake of the sub-prime crisis, as the regulation of securitized assets in Spain was conservative. As opposed to the situation in the United States, where securitization of mortgages was performed to transfer risk, in Spain securitization was related mainly to funding purposes.
Causes for the Spanish Housing Bubble
In 1999, members of the European Union formally introduced the euro and subsequently the monetary policy of all members was under the control of the European Central Bank. Spain’s membership in this monetary union implied a sharp reduction in real interest rates. The reduction in real interest rates substantially decreased the cost of capital for investment, and lowered the discount factor for any expected future payoffs which should increase asset prices as a result (Ayuso et al., 2006). The reduction in real interest rates bolstered borrowing and heightened expectations for nominal stability of interest rates which allowed for the lengthening of maturities for mortgage borrowing from 10 to 28 years between 1990 and 2007 (De Lis et al., 2008).
Demographic factors were also a significant factor. A generation of baby-boomers composed the majority of the population, who, with their accumulated savings, were able to take advantage of the ongoing housing bubble. Also, an explosion of immigration that took place in the last ten years provided an abundance of cheap, unskilled labor for the construction sector and an increased demand for housing. As of 2005, foreigners accounted for 7% of the population, a statistic which has by estimates reached approximately 10% as of 2008 (Ayuso et al., 2006). Additionally, speculation was fueled by an extraordinary influx of foreign-investors (those seeking to speculate, purchase vacation or second homes, or both).
Credit expansion among households increased substantially in time with declines in the household saving ratio. In 2005 the household saving ratio was around four percentage points lower than the average over the first half of the previous decade, net financial saving (∆ in financial assets minus ∆ in financial liabilities) has fallen dramatically, and private, non-financial sector debt had risen to 160% of GDP, more than twice the 1995 ratio (Ayuso et al., 2006).
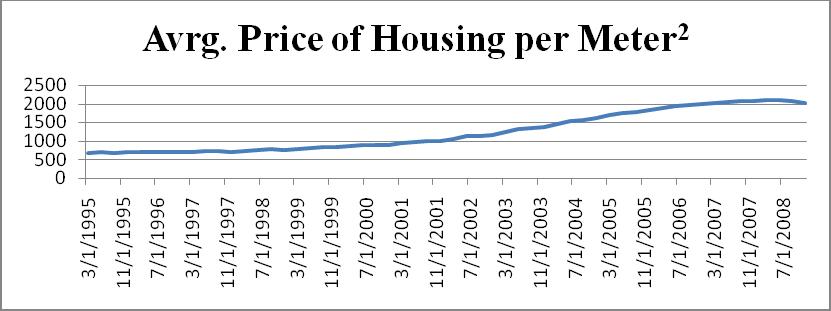
In Figure 1, average house prices have risen higher than historical norms in the past 10 years, and have only just begun to decline. The author would like to point out it has been widely assumed that official figures from the Ministry of Housing underestimate the true extent of the current Spanish housing correction. The data used by this paper, published by the Ministry of Housing (MiV), is provided by the Association of Official Appraisal Agencies in Spain (ATASA). The fact that estimates are based on home appraisals presents a serious bias in the data; appraisal agencies are pressured to overvalue homes when banks wish to lend out more money, and pressured to undervalue homes during economic hard times. Adding to this problem, a Bloomberg article investigated the fact that many banks have ownership equity stakes in homevaluation agencies (Sills et al., 2008). Thus, it is highly likely that the housing data may not be the best representation of housing price evolution, though it does capture the trend.
Figure 1: The Average Price of Housing per Meter Squared, 1995-2008
Source: Ministerio De Vivienda
Martinez (2008) argues that over the past two years the rise in interest rates was a major cause of the bursting of the housing bubble, along with the over-valuation of house prices, the excess housing supply and the growing debt levels of Spanish families. The EURIBOR interest rate, which is commonly used for as the base interest rate for mortgage lending, remained very low during the 2003-2005 period. The ensuing housing price appreciation, along with a rise in stock markets, bolstered household and corporate net wealth. At the onset of the financial crisis, the EURIBOR is shown to begin a sharp downward trajectory as the European Central Bank responded to the financial turmoil. Figure 2 is graph of the EURIBOR, which provides the base rate for mortgage rates, implies a negative correlation with the price of housing.
Figure 2: EURIBOR 12-month Interest Rate: 1999-2009
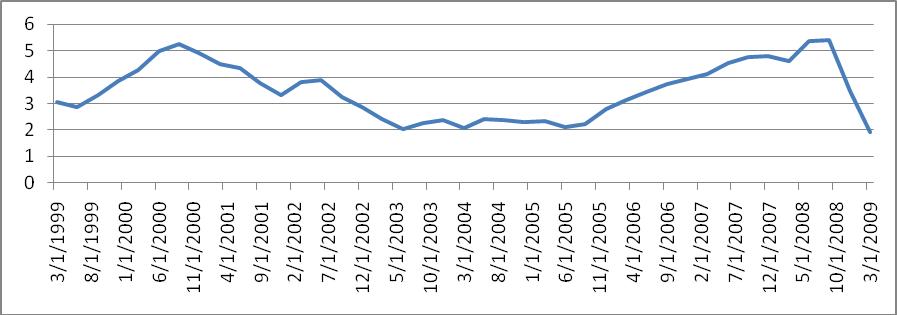
Source: Banco de Espana
Figure 3 shows the movements of the Spanish Consumer Price Index from 1995 to 2008. In the beginning of the series, we see the decline of inflation. At that time, Spain had its own central bank, and was implementing monetary policies in order to begin the transition into a European Monetary Union. Upon formation of the EMU in 1999, inflation begins an upward trajectory and stays within the range of 3.50%-2.50%, until peaking at 4.50% in early 2008. The movements of inflation show a modest correlation with the upward trending housing data, though it is expected the initial downward trend of CPI may prove to be a source of problems in our results.
Figure 3: Consumer Price Index from 1995‐2008
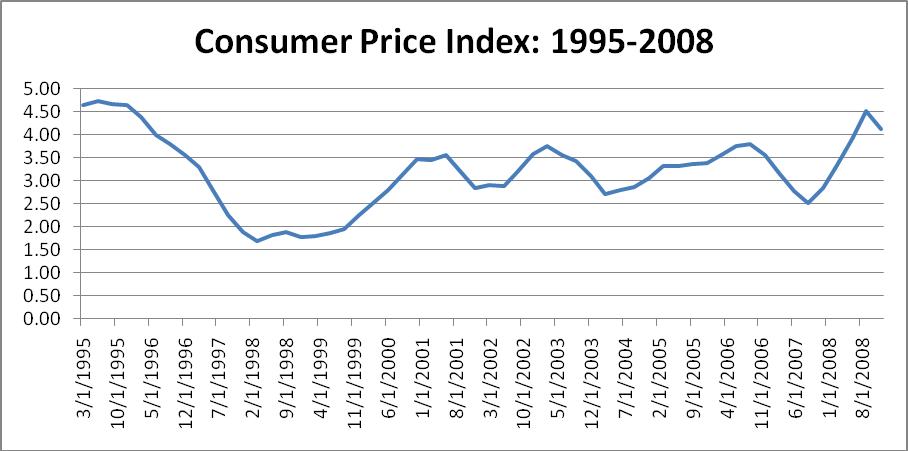
Source: Banco de Espana
Figure 4 shows the trend in employment by millions from 1995 to 2008. Graph 5 shows the registered number of unemployed, in millions, by branch of activity from 2006 to the current quarter. Despite a large increase in the labor supply which stemmed from significant flows of immigration and an increase in female participation rates, the average national unemployment decreased from 22.9% in 1995 to a low of 8.26% in 2007, before climbing to 9.50% in early 2008.
In January 2009, the number of unemployed people rose by nearly 200,000, a 6.4% increase over December and a 47% increase since January 2008 (Burnett, 2009). An article for the New York Times described how Spain suffers more than other European countries in terms of employment because of the vast oversupply of low-skilled jobs and the lack of investment in retooling the country’s rigid labor market. The government intends to pressure banks to free up liquidity as well as introduce a $13 billion public works program. Recent projections of the national average unemployment rate by the end of 2009 are approximately 16%.
Figure 4: Employment in millions from 1995-2008
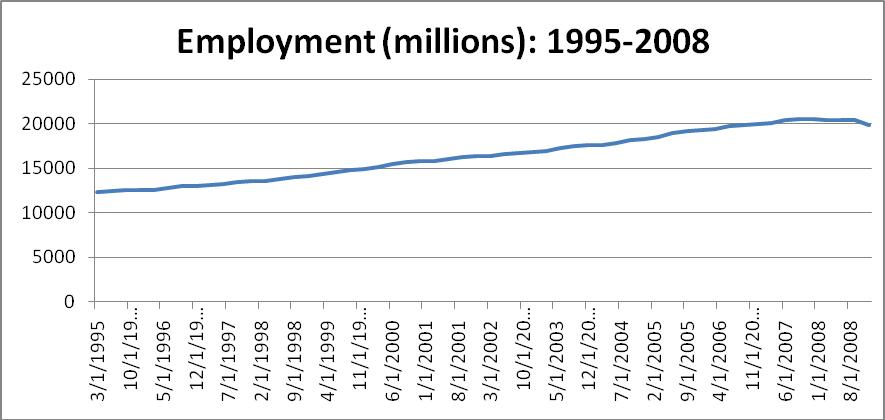
Source: Banco de Espana
Figure 5: Registered Number of Unemployed (in millions) by Branch of Activity, 20062009
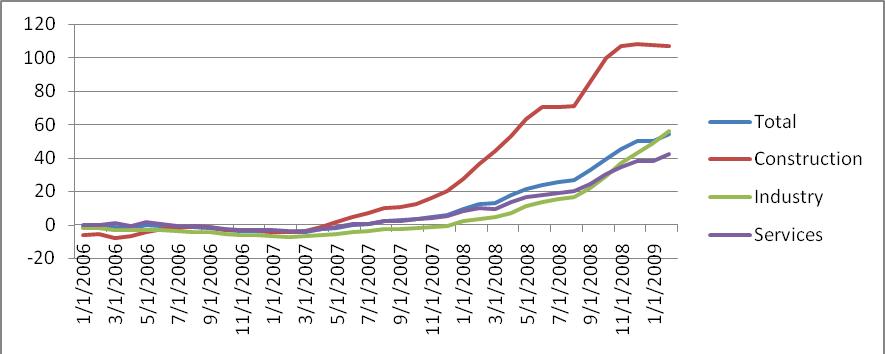
Source: Banco de Espana
3.0 LITERATURE REVIEW
The workings of this paper will take example and guidance from several others. Apergis (2003) provides this paper with a blueprint for empirical analysis. The paper by Apergis analyzes the dynamic effects of macroeconomic variables on the price of new houses sold in Greece. The empirical methodology utilizes unit root tests, cointegration analysis, an error correction model, variance decompositions, and impulse responses which will all be utilized later.
A paper by Ayuso, Blanco, and Restoy (2006) provides analysis of house prices and real interest rates in Spain. The paper analyzes the contribution of interest rates to the recent course of housing prices in Spain. Ayuso, Blanco and Retory create a refined asset pricing model that shows that changes in the discount factor cannot fully explain the trend of house prices in Spain, providing support for the inclusion of other macroeconomic variables.
A paper by Kearl (1979) examines the influences of inflation on housing, mortgages and construction by constructing a model. Though this model cannot quantify unspecified uncertainties in economic conditions, the model supports evidence that inflation distortions have significant effect on the housing prices and thus the demand for housing.
Katja (2006) tests for the existence of real estate bubbles using traditional unit root tests under the assumption that the dividend yield ratio in stock markets is comparable to the rentprice ratio in the housing market. The paper provided valuable insight into recent developments in housing markets and unit root based testing.
4.0 EMPIRICAL RESULTS AND ANALYSIS
The empirical analysis was carried out using quarterly data from 1995 to 2008. The variables used in the empirical analysis are housing price (HP) obtained from the Ministry of Housing in Spain, the mortgage interest rate (calculated as the weighted average of 3-year mortgage loans) obtained from the Bank of Spain website (INT), prices measured by the consumer price index from the National Institute of Statistics (CPI), and employment measured in millions (EMP). The housing price data is the average price per meter squared of appraised housing in Spain, deflated by dividing it by CPI. The empirical analysis was performed using Eviews 6.0.
Unit Root Testing
The variables were tested for unit root non-stationarity by using unit root tests proposed by Phillips and Perron (1987). If a time series has a unit root, then the time series is said to be non-stationary. Stationarity is a stochastic (in other words, random) process whose characteristics such as mean and variance do not change over time or position. A unit-root would imply that the variance of a time series would increase to infinity over time. The Philips-Perron test was chosen because the test is nonparametric with respect to nuisance parameters, allowing for a wider class of time series models in which there is a unit root. The method also has
advantages when there are moving average components in the time series. The results are reported in Table 1. When second differences were used, unit root non-stationary could be rejected at the 1% significance level, suggesting that the variables HP, INT, and CPI are I(2) variables or integrated in the first order, which means that it takes one first difference of the series to make it stationary.
Table 1: Unit-Roots (Philips- Perron)
Without trend
With Trend Variable Levels First Second Levels First Second DifferencesDifferences Differences Differences HP -0.76 -2.29 -7.15*** -1.1 -2.36 -10.02*** INT -1.16 -3.32** -6.02*** -0.98 -3.18 -5.83*** EMP -2.04 -2.29 -5.37*** 1.24 -2.52 -5.56*** CPI -2.06 -3.35** -4.69*** -2.19 -3.33* -4.56*** Figures in under first differences denote t-statistics. Note: *,**,*** depict each variable as a 10%, 5%, and 1% confidence level.
Cointegration Analysis
The possibility of cointegration among these variables was examined next. Cointegration is property of time series variables; if two or more series are non-stationary, but a linear combination of them is stationary, the series are said to be cointegrated. We can test that there is a statistically significant connection between all the macroeconomic variables by testing for a cointegrating vector. The results are presented in Table 2. Allowing for linear deterministic trend in the data, and an intercept and trend in the cointegrating equation, both the trace eigenvalue test statistic and max eigenvalue test statistic indicate the presence of two cointegrating vectors. The following is the vector autoregression estimate. There appears to be evidence in favor of the existence of a common cointegrating vector among the variables under examination.
Table 2: Unrestricted Cointegration Rank Test (Trace and Maximum Eigenvalue)
Hypothesized Trace 0.05Max-Eigen 0.05
No. of CE(s) Statistic Critical Value Statistic Critical Value
None * 115.7173 63.8761 49.98748 32.11832 At most 1 * 65.72986 42.91525 31.01759 25.82321 At most 2 * 34.71227 25.87211 24.18815 19.38704 At most 3 10.52413 12.51798 10.52413 12.51798 Trace test indicates 3 cointegrating eqn(s) at the 0.05 level Max-eigenvalue test indicates 3 cointegrating eqn(s) at the 0.05 level * denotes rejection of the hypothesis at the 0.05 level
An Error Correction Model
As cointegration is confirmed, we go ahead and estimate an error correction vector autoregressive (ECVAR) model. A vector error correction model is a restricted VAR designed for use with non-stationary series that are known to be cointegrated. The model is specified so that it restricts the long-run behavior of the endogenous variables to converge to their cointegrating relationships while allowing for short-run adjustment dynamics. The cointegration term, known as the error correction (EC) term, gradually corrects deviation from the long-run equilibrium through a series of partial short-run adjustments. Our ECVAR model will involve four variables (real housing prices, mortgage interest rates, CPI, and change in unemployment) along with a 2-lag specification. Interest rates are expected to have a negative sign, CPI is
expected to have a positive sign, and employment is expected to have a positive sign. The ECVAR estimations provided the following results:
∆HP = 0.782∆HP(-1) - 0.317∆HP(-2) - 14.69∆INT(-1) - 0.384∆INT(-2) - 0.07∆EMP(-1)
[ 4.40448] [-1.38186] [-122552] [ -0.03194] [ -1.69010]
+ 0.131∆EMP(-2) - 11.59∆CPI(-1) - 13.22∆CPI(-2) + 0.045∆EC
[ 4.37221] [-0.80215] [-0.58731] [1.79170] R-squared 0.774241 Adj. R-squared 0.698989
EC is the error correction term. Figures in brackets denote t-statistics.
The results received are somewhat disappointing at first glance. The variable of interest rates, when lagged once, was shown to have a negative effect on housing prices, as basic economy theory suggests. When INT is lagged twice, the variable changes into a positive sign. The variable of employment achieves the expected sign at the second lag. The variable of inflation does not have the expected sign at first or second lags. The negative and statistically significant coefficient of the EC term implies a significant adjustment to disequilibrium deviations of housing prices from their optimal level determined by the long-run (cointegrated) housing price equation.
There are several reasons the results might not have met expectations. If one carefully examines the trends of our variables in the previous section, we can see how some problems may arise. Inflation, as well, was volatile and experienced several steep declines over the length of the time series, which may have affected its relationship with housing prices. Interest rates on the other hand have our expected signs and are negatively related to housing prices.The employment time series looks extremely positively correlated with housing prices, yet a first lag returns a negative sign.
Variance Decompositions
A variance decomposition shows how much variation is produced in an endogenous variable by a shock to a specific variable. In other words, variance decompositions provide information about the relative importance of each random innovation in affecting the variables in the VAR. Each column gives the percentage of the forecast variance due to each innovation, with each row adding up to 100.
Table 5: Variance Decompositions
Variance Decomposition of HP: Period S.E. HP INT CPI EMP
1 15.94554 100 0 0 0 4 53.59956 68.08932 28.38433 1.263682.262673 8 124.4781 56.11677 25.39279 15.987662.502779 12 225.9642 70.68651 19.10614 9.2711560.936191 16 348.9765 76.53153 16.51407 6.4082090.546191 20 503.1644 80.09069 14.2412 5.1731490.494962
The results from Table 5 suggest that, up to 4 quarters, shocks to the housing mortgage rate account for more variation in real housing prices than variation produced by shocks to employment or inflation. Over a longer period, up to 20 quarters, shocks to both the housing mortgage rate and inflation account for more variation in real housing prices. The variable with the highest explanatory power over the variation in real housing prices is the housing mortgage rate, the second being inflation, and third being employment.
Impulse Responses
Figure
200
150
100
50
0 Response of HP to Cholesky One S.D. Innovations
-50
-100
2 4 6 8 10 12 14 16 18 20
HP INT CPI EMP
6
An impulse response traces the effect of a one-time shock to one of the innovations (variables) on the current and future values of the endogenous variables. In other words, it shows the dynamic behavior of a variable due to random shocks in other variables. Table 6 shows the response of housing prices to shocks in the mortgage interest rate, CPI, and unemployment. The impulse response functions are based on 500 Monte Carlo replications. These impulse responses are sensitive to the ordering of the variables, so different ordering might be in order to provide support, if any, to the results.
In Table 6, as basic economic theory would suggest, a positive (higher) shock to the mortgage interest rate indicates that as the cost of financing a house purchase increases, the
demand, and thus the price for housing falls. In response to a shock in mortgage interest rates, housing prices reach their steady state level at around 6 quarters. A positive (increase) shock to inflation leads to higher housing prices; the impulse response does not show housing prices reaching their steady state level within 20 quarters. Finally, a positive shock in unemployment initially shows a decrease in housing prices (and thus demand for homes), while by 7 or 8 quarters housing prices continue to rise.
5.0 CONCLUSION AND POLICY IMPLICATIONS
The main objective of this paper was to analyze the dynamic effects of certain macroeconomic variables (the mortgage interest rate, inflation and employment) on real housing prices. The results suggest that real housing prices do respond to specific economic variables. Variance decompositions show that the mortgage interest rate is the variable with the highest explanatory power over the variation in real housing prices, followed by inflation, then employment. Impulse responses show that a positive shock in the mortgage interest rate depresses real housing prices and will eventually lead to higher housing demand, while a positive shock in inflation and employment will increase real housing prices and will lead to lower housing demand.
After analyzing the results of our empirical tests, it is apparent that the most important factor for determining policies relating to housing are mortgage interest rates. It has been argued that low inflation environments will cause people to overvalue long-duration assets, i.e, a money “illusion” (Brunnermeir and Julliard, 2007), which would tend to lead to asset bubbles and busts. Due to the focus of the European Central Bank on maintaining a low inflation environment, such an argument might imply that Spain must find a solution to the natural tendency to overvalue long-duration assets.
Economists have discussed the susceptibility of the Spanish economy to economic cycles. The integration of Spain into the European Monetary Union (EMU) and the ensuing reduction in real interest rates and increased expectations for monetary stability can be cited as one significant source of the housing bubble. The Bank of Spain, with its monetary defenses taken away, had no defense against the easing of interest rates by the EMU.
It may important to note the conflicts of interest faced by political officeholders that may have resulted in failures to recognize or act against the housing bubble. The fact that housing is the biggest asset of the voting base, and that the construction sector produces a large amount of employment will be on the mind of any political incumbent when making policy decisions, or running for a second term.
Policy Implications
Policy implications would have to take into consideration that Spain no longer has control over interest rates. Without the control over interest rates, Spain could concentrate on collecting more reliable data on housing, tax incentives, reducing economic dependency on low skill labor and increasing regulation.
Spain could improve the integrity of their data. One of the problems encountered during the creation of this paper was accessing even marginally reliable data on housing prices. An official Spanish Housing Price Index that is derived from actual housing transaction prices is published by the Institute for National Statistics yet only has data from 2007. The housing prices used in the time series were taken from the Ministry of Housing in Spain, whose housing data has been criticized due to the fact that it is based off of appraisals. In Spain, home appraisal agencies are often owned by banks! The potential for bias is obvious. Spain needs to provide adequate, reliable data in order to better understand and prevent housing bubbles.
Spain could remove tax incentives which promoted house ownership, such as, the income tax deduction for owning a house. The tax deduction makes housing more valuable in comparison to other investment decisions, and to renting. This tax incentive without question aided in the creating one of the highest home ownership rates in the world ( approximately 81.0% in 2005).
Spain must reduce its economy dependence of low skill labor and increase regulatory oversight over immigration and abuse of illegal labor. The existence of cheap, illegal immigrant labor had aided in overdevelopment of real estate projects, has expanded the black market, and has cut legal residents out of work. Also, the predominance of low skill labor in Spain’s economy makes the economy more susceptible to volatility. When times are good, low skill employment will be in high demand, and when times are bad, low skill workers will quickly find
themselves out of work. Spain has been noted for its rigid labor market; this needs to be remedied.
Spain must clamp down on the current state of appraisals/valuations. As mentioned earlier, there is an unmistakable conflict of interest, as banks have been known to own ownership stakes in the home-valuation agencies they use. It is only recently, in December 2007, that a law was instituted that limited the amount of business appraisers can take from clients with ownership stakes (such as banks).
BIBLIOGRAPHY
Anonymous, (2007), “Real Estate Collapses, and Spain Trembles”, Universia Knowledge@Wharton, http://www.wharton.universia.net/index.cfm?fa=viewfeature&id=1341&language=english
Apergis, Nicholas, (2003), “Housing Prices and Macroeconomic Factors: Prospects within the European Monetary Union”, International Real Estate Review, Vol. 6 No. 1: pp 63-74.
Arellano, Manuel and Bentolila, Samuel, (2009), “Quien es responsible de la burbuja inmobililaria?” El Pais.com,http://www.elpais.com/articulo/semana/Quien/responsable/burbuja/inmobiliaria/elpepu
econeg/20090222elpneglse_2/Tes, Translated into English: http://www.creditwritedowns.com/2009/02/spain-who-is-responsible-for-the-propertybubble.html
Ayuso, J. and Blanco, R. and Restoy, F.,(2006), “House prices and real interest rates in Spain”, Banco de Espana Ocassional Papers, 0608.
Brunnermeir, Markus K. and Julliard, Christian, (2006), “Money Illusion and Housing Frenzies”, C.E.P.R Discussion Papers, 6183.
Burnett, Victoria, (2009), “Spain’s Unemployment Rose Sharply in January”, The New York Times, < http://www.nytimes.com/2009/02/04/business/worldbusiness/04specon.html?_r=1>
De Lis, Santiago Fern and Herrero, Alicia Garcia, (2008), “The Housing Boom andButs in Spain: Impact of the Securitisation Model and Dynamic Provisioning” < http://www.allbusiness.com/economy-economic-indicators/economic-policy/11760429-1.html>
Katja, Taipalus, (2006), “A global house price bubble? Evaluation based on a new rent-price approach”, Bank of Finland Research Discussion Papers, 29/2006.
Kearl, J.H ,(1979), “Inflation, mortgages, and housing”, Journal of Political Economy, 87, 1-29.
Lachman, Desmond, (2008), “The Housing Pain in Spain”, New York Sun. Accessed 03/17/09. http://www.nysun.com/opinion/housing-pain-in-spain/72501/
Martinez, Maria Teresa Sanchez, (2008), “The Spanish Financial System: Facing up to the Real Estate Crisis and Credit Crunch”, European Journal of Housing Policy, 8, 181-196.
Peter C.B. Phillips & Pierre Perron, (1986), “Testing for a Unit Root in Time Series Regression”, Cowles Foundation Discussion Papers, 795R.
Sills, Ben and Duarte, Esteban, (2008), “Spain’s Inflated Home Values Infect Mortgage Bonds”, Bloomberg.com < http://www.bloomberg.com/apps/news?pid=20601170&refer=home&sid=avLtlLCD0wcQ>
Spain Real Estate Index, [source for housing price data]
< http://www.spainrei.com/Spain-Property-Prices.shtml>


