


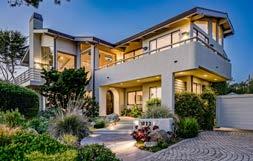

Affected by numerous external drivers, the Monterey Peninsula Real Estate market experienced a 5.5% reduction in transactions from Q4 of 2022 and a 36% reduction from the same quarter last year. This means the market performed comparably to national figures, which is impressive considering the region experienced extremely difficult weather during much of the quarter. The storms in Q1 delivered excessive rain, wind, flooding, and power outages throughout much of the area which made it very difficult to even show property. Combined with macro-economic pressures across the real estate market, high interest rates and geopolitical uncertainty, buyers transacted at very low levels compared to previous quarters. Looking even closer, these factors specifically affected the number of high-priced discretionary sales throughout Carmel and Pebble Beach, dropping total dollar volume and average sales price much more than usual. On a positive note, with extremely tight inventory, values have held up well across the Peninsula and continue to outperform the national market.
Across the markets we track on the Monterey Peninsula, the number of units sold during Q1 2023 was down 5.5% versus an already low Q4 of 2022, and down 36% from Q1 of last year. Average sales price held in stronger, down just over 10% quarter over quarter and down 22% against Q1 2022. Total sales dollar volume in the quarter was 50% lower than Q1 2022. This percentage is skewed by eight homes selling over $10M in Q1 of 2022 (compared to two in Q1 2023), with four of those coming in over $25M. These six additional high-priced sales made up almost 40% of the total sales volume difference between Q1 2023 and Q1 2022.
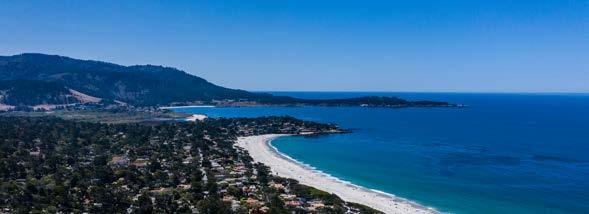
Moving forward, we are beginning to see the typical rise in inventory levels that come with the late spring season as we transition into summer. As of the end of March, our brokerage has seen a spike of internal listings and the market as a whole has 17% more active listings than the same time last year. With summer weather on the way, banking and financial concerns subsiding and the potential for interest rate easing, we have already seen more homes come on the market and buyers start to return as well. We expect the second quarter to outperform Q1 and hopefully build for a stronger second half of the year.
With so much pressure and volatility affecting our market right now, it is essential to work with an experienced and informed agent. Our agents have extensive hands-on local knowledge about every market and are truly market-leading experts across the Peninsula. Moreover, they are supported by a dedicated marketing and analytics team that allows for clients to make informed decisions and to maximize value when buying or selling.
The following report breaks out five of the markets we track with additional performance detail. We hope you will find this report informative. As always, please be sure to contact us if there is anything we can do to help you, or your friends and family, with real estate plans in our marketplace.
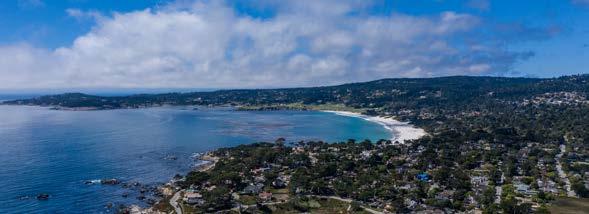

Although the average sales price in Carmel-by-the-Sea during Q1 2023 was shown to be down over 28% versus Q4 2022, it was right on par with Q1 2022 and 2021 as a whole, meaning prices are holding strong in the area. Just 16 sales during the quarter is the lowest we’ve seen in years, with the area typically showing over 30 sales per quarter. There was also just one sale over $5M in the quarter with 56% of the sales coming in the $3M-5M range. This lack of high-priced homes was a trend we saw in Q1 2023. Number of active listings to end the quarter rose to 27, the most since June 2022, showing promise for more sales moving forward.
$3,289,252
1.3% vs Q1 2022
$52.6M
32 22% vs Q4 2022
3.2% vs Q1 2022

16 15.8% vs Q4 2022
vs Q1 2022
GREATER CARMEL
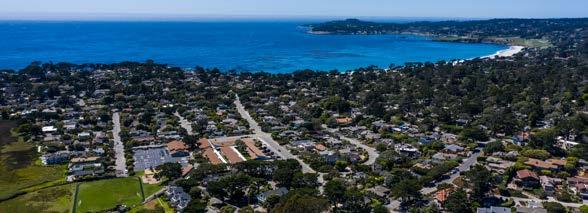
LikeCarmel-by-the-Sea, the Greater Carmel area showed prices holding strong at $1.8M. This number was consistent with three of the four quarters during 2022. Just 12 sales during the quarter is about half of typical sales numbers, but actually up from just 10 sales in Q4 2022. Eight out of 12 sales in the quarter came in the $1M-2M dollar segment.
$1,867,542 6.1% vs Q4 2022 0.1% vs Q1 2022
$22.4M 27.3% vs Q4 2022 45.5% vs Q1 2022
54
8.5% vs Q4 2022
170% vs Q1 2022
12
20% vs Q4 2022
45.5% vs Q1 2022
Carmel Valley had a very difficult quarter, especially on the high-end side of the market. Q1 2023 was very similar to Q4 2022 in many ways, with median sales price coming in at $1.3M in both quarters and number of sales tallying 39 this quarter versus 34 last quarter. The difference came in the lack of sales over $3M. There were zero sales over $3M in Q1 2023. During 2022, 15% of sales topped this number. As a result, average sales price dipped to $1.38M for the quarter and total sales volume fell 26% quarter over quarter.
$1,378,151
26.2% vs Q4 2022
24.4% vs Q1 2022
$53.7M
15.4% vs Q4 2022
37.3% vs Q1 2022
53
29.3% vs Q4 2022
65.6% vs Q1 2022
39
14.7% vs Q4 2022
17% vs Q1 2022
Thelack of high-priced sales also affected the Pebble Beach market. With only four homes topping the $5M mark in Q1 2023, average sales price in the area saw its lowest number ($3.59M) over the past five quarters. In comparison, Q1 of 2022 saw eight sales over $10M, with four of those topping $25M, leading to the outlier in average sales price over $8.6M. 25 Sales in Q1 2023 is similar to what we have seen over the last year, but still down about 33% from years prior to 2022. Under $90M in total sales volume for the quarter is trending toward 2018 and 2019 sales dollar volume levels, but we expect this to pick up with the return of high-priced sales later this year.

$3,593,600
29.1% vs Q4 2022 58.3% vs Q1 2022
$89.8M
19.4% vs Q4 2022
58.3% vs Q1 2022
34
43.3% vs Q4 2022
24.4% vs Q1 2022
25
13.6% vs Q4 2022 no change vs Q1 2022
CARMEL HIGHLANDS
InCarmel Highlands and Big Sur, Q1 of 2023 was like that of the previous quarter, showing just 5 sales (versus 4) and sales dollar volume totaling just over $14.6M (versus $14.3M). No homes over $5M sold in the quarter, when last year 32% of the homes sold were in this category. This brought average sales price for Q1 2023 down below $3M for the first time since Q1 2021. Median sales price ($2.97M) actually topped average sales price, again showing the lack of high-priced sales in the area.

$2,920,000
18.6% vs Q4 2022 49.7% vs Q1 2022
$14.6M
vs
vs Q1 2022
107 43.4% vs Q4 2022
224.2% vs Q1 2022
5

25% vs Q4 2022
58.3% vs Q1 2022
Courtney Adamski
Geoff Arnold
Rebecca Wolf Arnold
Chris Babalis
Jeremy Barrett
Carrie Baumgart
Chris Baumgart
Mary Bell
Sarah Bouchier
Paul Brocchini
Aviana Bushnell
Peter Butler
Kimberly Burgess
Christine Chin
Susan Clark
Lisa Talley Dean
Mark Duchesne
Bobbie Ehrenpreis
Bill Faber
Maria Finkle
Susan Freeland
Christine Handel
Malone Hodges
Dave Howarth
Julia Humason
Courtney Jones
Karen Katz
David Kent
Lynn Knoop
Greg Kraft
Steve LaVaute
Kean Matthams
Sharon Matthams
Kris McAulay
Linda Miller
Bill Mitchell
Vicki Mitchell
Shelly Mitchell Lynch
Jamal Noorzoy
Amanda English Oliver
Judie Profeta
Chris Pryor
Mel Rosen
Mark Ryan
Connie Snowdon
Jim Somerville
Ed Stellingsma
Judy Tollner
Carla White
Brett Wilbur
Rhonda Williams